Abstract
This study investigates the use of a custom-built 10 GHz continuous wave micro-Doppler radar system to analyze external vibrations of idling vehicles under various conditions. Scenarios included different gear engagements with one occupant and parked gear with up to four occupants. Motivated by security concerns, such as the threat posed by idling vehicles with multiple occupants, the research explores how micro-Doppler signatures can indicate vehicle readiness to move. Experiments focused on a mid-size SUV, with similar trends seen in other vehicles. Radar data were compared to in situ accelerometer measurements, confirming that the radar system can detect subtle frequency changes, especially during gear shifts. The system’s sensitivity enables it to distinguish variations tied to gear state and passenger load. Extracted features like frequency and magnitude show strong potential for use in machine learning models, offering a non-invasive, remote sensing method for reliably identifying vehicle operational states and occupancy levels in security or monitoring contexts. Spectrogram and PSD analyses reveal consistent tonal vibrations around 30 Hz, tied to engine activity, with harmonics at 60 Hz and 90 Hz. Gear shifts produce impulse signatures primarily below 20 Hz, and transient data show distinct peaks at 50, 80, and 100 Hz. Key features at 23 Hz and 45 Hz effectively indicate engine and gear states. Radar and accelerometer data align well, supporting the potential for remote sensing and machine learning-based classification.
1. Introduction
We first provide the motivation and need for detecting vehicle vibrations, then offer the radar micro-Doppler technique as a viable solution. We present the uniqueness of our approach and its advantages over traditional methods of vibrometry measurements, ending with the structure of our article.
1.1. Motivation
Vehicle idling refers to when a vehicle’s engine is running at a minimal steady state rotations per minute (rpm) and no external torque demand (e.g., while the vehicle is stationary). It happens for various reasons, which can be unintentional or intentional. Some common benign reasons for vehicle idling include traffic stops, engine warmup in cold weather, loading/unloading passengers or cargo, use of vehicle accessories, stop-and-go situations, mechanical issues, and safety situations [1,2]. Idling for long periods is generally discouraged due to the environmental and financial impact (wasting fuel and emitting pollutants) as well as potential wear on engine components.
However, idling vehicles can also potentially pose a security or terrorist risk, al-though this is relatively rare and typically depends on the specific context, location, and the intentions of the individuals involved. There are several ways in which idling vehicles could be exploited for malicious purposes, such as delivery of explosives [3], creation of a security breach, covert surveillance or reconnaissance of restricted areas, thwarting access by creating roadblocks, disruption of traffic, triggering devices for igniting their fuel tanks, and ramming attacks [4].
An idling vehicle might be used for a quick getaway after committing a crime or carrying out surveillance. For example, criminals might leave a vehicle running in a location and use it to flee the scene of a robbery, theft, or a violent attack [5]. The fact that the vehicle is already idling means that it is ready to go at a moment’s notice, which is a potential risk in areas of high crime or terrorism concerns.
In some cases, an idling vehicle could be used as part of a distraction or diversionary tactic. Criminals or terrorists may leave the vehicle running in a specific area to draw attention away from another location where they plan to carry out an attack, such as a bombing or hostage situation. The presence of an idling vehicle could mislead law enforcement or security personnel into focusing on the wrong threat while a different security breach takes place elsewhere.
In high-security environments like airports, government buildings, or military installations, an idling vehicle can potentially interfere with security measures such as license plate readers, surveillance cameras, or sensors. The vehicle may be used to block observance of other suspicious activities or to act as a shield for illicit activities happening nearby.
An idling vehicle can also indicate pre-crime planning. If the vehicle is parked near the location of a planned crime and running, it suggests that the criminals are preparing to engage in the crime. After crime execution, the idling vehicle can be used to escape quickly, reducing the chance of being caught in the act. If the crime is part of a larger operation (e.g., organized crime, gang activities), multiple idling vehicles could be involved, with some acting as lookouts while others are used for the actual getaway. The idling vehicle serves as a point of escape for the criminal group or gang, ensuring that the criminals have access to a fast exit once they have completed their criminal activity.
If a vehicle has been idling for a while and then suddenly changes operating state, it could signal that the occupants inside the vehicle are preparing to leave or move—a potentially suspicious act. In a security-sensitive area, this could be interpreted as a change in intent, raising alarms. In high-security areas, vehicles often need to be pre-approved to enter or to park. If a vehicle starts up unexpectedly without visible signage or clear permission, it could suggest that the vehicle or driver is attempting to evade security measures or is unauthorized to be in the area.
More persons inside a vehicle can increase the threats in several ways, especially when considering factors such as security risks, traffic safety, public perception, and potential for criminal or terrorist activities. The presence of multiple individuals in a vehicle can heighten various threats, depending on the context. A vehicle with multiple occupants can serve as a mobile base for criminal activities, such as drug trafficking, gang-related operations, or even human trafficking. The vehicle may be used for transporting illicit goods, coordinating criminal acts, or as a place for planning and executing crimes.
Distinguishing between gear shifts in idling vehicles can also help law enforcement predict what action the vehicle is going to take. If the car is idling in park, it probably will not be moving anytime soon. If the car’s gear shifts to drive, that car has potential to move at any moment. Also, detecting gear shifts can alert law enforcement that the car is now in a different state and may start moving.
From a developmental perspective, idling vehicles provide valuable stationary data that can be used to improve object detection and environmental mapping algorithms in autonomous vehicle systems. Additionally, they create real-world traffic scenarios that help train self-driving cars to navigate around stationary obstacles safely and efficiently.
1.2. Radar Micro-Doppler as a Potential Solution
Micro-Doppler radar is a technology which revolutionizes the perception and analysis of motion on a minuscule scale while benefiting from radar’s inherent ability to operate continuously in all weather conditions. By leveraging the principles of radar technology and the Doppler effect, this advanced system uniquely detects, isolates, and interprets micro-motions within larger objects. This capability enables an unparalleled level of detail in analyzing complex moving targets. By concentrating on these subtle movements, micro-Doppler radar unlocks vast potential across diverse applications, including military and defense, biomedical research, and autonomous systems.
Radar vibrometry is a rapidly growing field, particularly in infrastructure monitoring, automotive systems, and defense applications, as it enables stand-off, non-contact assessment of object vibrations. When an object vibrates back and forth, its velocity follows a sinusoidal pattern relative to the radar’s line of sight, reaching zero at the extremes of its trajectory and peaking when moving directly toward or away from the radar. Since an object’s linear velocity correlates with its vibration frequency and amplitude, analyzing micro-Doppler signatures reveals critical information about its vibrational characteristics and potential causes. High-frequency radars, which operate at shorter wavelengths, offer enhanced sensitivity due to the inverse relationship between Doppler frequency and wavelength. These frequencies also produce narrower beamwidths, minimizing the need for large antenna apertures and allowing for compact, precise radar systems. This combination of sensitivity and efficiency positions radar vibrometry as a powerful tool for analyzing dynamic systems across a range of applications.
Early experiments in remote observation and measurement of mechanical vibrations were conducted using lasers [6,7]. While laser sensing is highly effective at close range and under ideal conditions, its performance diminishes in long-range applications where barriers or atmospheric turbulence are present. In such scenarios, radar vibrometry offers a compelling alternative, combining advantages such as low cost, eye safety, barrier penetration, and portability, making it a practical solution for diverse and challenging environments.
Mechanical vibrations or rotations of targets, or structural components on a target, introduce additional frequency modulations into the reflected radar signal. These modulations create sidebands around the target’s primary Doppler frequency, which corresponds to its overall linear motion [8]. This phenomenon, known as the micro-Doppler effect, becomes particularly prominent when the target is stationary, as the absence of a main Doppler frequency leaves only the micro-Doppler modulations for analysis. Radar vibrometry at microwave frequencies has primarily been used to monitor the structural integrity of assets such as bridges and overhead cables, by analyzing their vibration responses to wind and traffic loads [9,10].
Bridges are subject to continuous dynamic loads from traffic, wind, and thermal fluctuations. Traditional contact-based sensors (e.g., accelerometers and strain gauges) require maintenance and may degrade over time. Micro-Doppler radar offers a remote, non-invasive alternative. The use of synthetic aperture radar to measure vertical vibrations of a suspension bridge has been demonstrated [11].
Wind turbine blades are exposed to complex aerodynamic loads, making their structural integrity crucial. Micro-Doppler radar systems can remotely capture blade vibrations without the need for instrumenting rotating parts and characterize the vibrational modes of wind turbine blades during operation [12].
Preserving historical structures requires non-destructive, reversible techniques. Micro-Doppler radar is ideal for monitoring subtle oscillations in walls, columns, or domes without direct contact. Ground-based radar interferometry has been used to monitor the structural oscillations of the Leaning Tower of Pisa [13].
Micro-Doppler radar is applied in laboratory settings to analyze vibrations in aerospace components such as satellite panels or aircraft wings during modal testing, which often contain lightweight, flexible structures. Radar sensors have been developed for high-frequency mechanical vibration measurements in aerospace applications, showing feasibility for vibration mode identification without contact [14].
Clearly, micro-Doppler radar represents a powerful tool for structural vibration analysis across a spectrum of applications. Its non-contact nature, capability for remote monitoring, and high sensitivity make it a valuable complement—or alternative—to conventional sensor-based structural health monitoring systems.
More recently, these applications have expanded to include the detection of transmission shifts in parked cars [15]. In this study, we compare radar micro-Doppler characteristics from various vehicles with vibration measurements obtained from accelerometers attached to their bodies, focusing on transmission shifts and multi-passenger occupancy.
1.3. Novelty of Our Work
Studying micro-Doppler measurements of vehicle vibrations introduces a hitherto unexplored and novel approach to remotely sensing and characterizing the micro-motions of vehicles, such as engine vibrations and structural oscillations. This technique leverages the micro-Doppler effect, where slight movements within a target induce frequency modulations in the reflected radar signal, providing unique signatures that can be analyzed to extract detailed information about the target’s dynamics. Traditionally, vehicle vibrations have been measured using contact methods like accelerometers or non-contact optical techniques such as Laser Doppler Vibrometry (LDV). However, these methods often require proximity to the target without obscurants such as rain, fog, or intervening vegetation, and thus may not be practical for operational applications.
Micro-Doppler radar is a unique technology that enables the detection and analysis of vehicle vibrations from a distance, enhancing safety and operational efficiency in various scenarios. Very limited work has been done by other researchers and sparsely reported as a side note in micro-Doppler papers on other focused applications, such as human gait and helicopter blades. There is no specific body of work reported in the open literature that specifically explores micro-Doppler radar features of vehicle vibrations. We believe that our work, reported in detail herein, is the first wherein micro-Doppler radar characteristics of vehicle vibrations have been systematically explored and discussed. Its ability to remotely and non-invasively analyze vehicle dynamics offers promising applications in areas such as surveillance, traffic monitoring, and automotive diagnostics.
1.4. Structure of the Article
This article is organized as follows:
Section 2 addresses how the vehicle body vibrates while idling, discussing fundamental vibrating modes with some results, ending with a discussion on the effects of gear engagement and occupancy on vehicle vibration.
Section 3 analyzes radar micro-Doppler features of vibrating structures, extending the analysis to vibrating idling vehicles under vehicle starts, gear shifts, and occupancy. It ends with a discussion of a theoretical model for radar micro-Doppler and how these can be mapped back to structural vibrations.
Section 4 provides a detailed description of the design and operation of the 10 GHz radar system used for data collection, the experimental test scenario, and the vehicles used in the study, and a description of the radar and the accelerometer measurements on the vehicles.
Section 5 analyzes the data and discusses the results for the spectrograms, the power spectral densities, and the signal processing approach used in the study.
Section 6 is the heart of this article which analyzes the radar micro-Doppler and accelerometer data for various test scenarios (gear shifts and person occupancy), provides a statistical analysis and histogram comparison of the micro-Doppler and the accelerometer data, and makes inferences on remote determination of vehicle state using micro-Doppler data. It ends with some challenges in the use of such data under various environmental scenarios.
Finally, Section 7 provides the conclusions and path forward for the research presented in this article.
2. Vibration Characteristics of Idling Vehicles
In this section, we discuss how an engine’s fundamental vibration frequency is determined, followed by a summary of results obtained by several research groups. Then, we offer insights into how the idling vehicle’s vibration frequency depends on which gear is engaged as well as the number of occupants when the vehicle is idling in the PARK mode.
2.1. Fundamental Vibration Frequency Determination
Modern internal combustion engines, both gasoline and diesel fueled, used in automotive applications are four-stroke engines. A complete cycle for a single cylinder comprises four phases or ‘strokes’ which occur over two compete revolutions of the engine crank. These are explained below.
- (1)
- Intake—The piston retracts towards bottom dead center (BDC) while the intake valves are open, allowing oxygenated atmospheric air into the piston’s swept volume.
- (2)
- Compression—The intake valve(s) close as the piston returns to top dead center (TDC), compressing the trapped air. Fuel is injected into the cylinder during the compression phase—the exact quantity and timing dependent on multivariate engine operating parameters.
- (3)
- Combustion—The compressed air and fuel is ignited via spark or compression. The exothermic combustion drastically increases internal cylinder pressure, propelling the piston back toward BDC. This is also known as the ‘power stroke.’
- (4)
- Exhaust—Following the combustion stroke, the piston again travels towards TDC, this time with exhaust valve(s) open, allowing the combustion gases to exit the cylinder into the vehicle’s exhaust system. This resets the cylinder for the beginning of the next intake stroke.
The combustion stroke of a cylinder is a significant contributor to overall engine vibration and occurs once every other revolution of the engine crank. Engine designs and operation vary, but common multi-cylinder arrangements uniformly shift cylinder combustion. An inline four-cylinder engine would then have one cylinder combustion stroke every 180 degrees of crank rotation. A generalized formula for an engine’s fundamental combustion driven vibration frequency is
where represents the engine rotations per minute (rpm) and is the number of engine cylinders.
2.2. Summary of Relevant Results and Analysis
Engine vibrations can be transmitted to the vehicle body through three primary paths: the engine mount, the drivetrain, and the tailpipe. Among these, the engine mount pathway has the most significant impact and was the focus of a study [16]. The engine block vibrations are primarily attributed to the reaction forces generated by the movement of the piston and crankshaft. By dividing the vehicle into four main components—body, frame, powertrain, and suspension—it was observed that the body and frame of the target vehicle exhibit a natural frequency of approximately 24 Hz during idling vibrations.
For engine-induced vibrations transmitted to the chassis through the powertrain mounts, the disturbances primarily occur in the low-frequency range. These vibrations originate from two main sources: the combustion of fuel in the cylinder and the rotational motion of various engine components [17].
Idle vibrations in automotive systems originate primarily from the powertrain. Combustion plays a significant role in influencing engine vibrations, particularly at low speeds. At higher engine speeds, inertial forces and fluctuating torque generation cause piston slap and bearing impact forces, which manifest as noise or vibrations transmitted through various engine components [18]. For a vehicle with a two-cylinder power train, the fundamental frequency of the idle vibrations under no load conditions (850 rpm) and full-load conditions (950 rpm) peaked at 14.2 Hz and 15.8 Hz, respectively.
During idling, low-frequency vibrations were observed in the floor, seats, and steering wheel. Up-and-down trembling vibrations typically occur in the frequency ranges of 20–35 Hz for four-cylinder vehicles and 30–50 Hz for six-cylinder vehicles. Additionally, swaying up-and-down vibrations, caused by uneven combustion, were observed at 5–10 Hz. The primary source of these swaying vibrations was postulated to be engine roll vibration [19].
The feasibility of using micro-electromechanical system (MEMS) accelerometers to measure vibration parameters in a sedan was explored, focusing on automotive dynamic functions. Accelerometers were installed at various locations, including the hood above the engine, the hood above the radiator fan, the exhaust pipe, and the dashboard. During vehicle idling, the vibration frequencies recorded on the hood above the engine and the radiator fan were approximately 44 Hz and 38 Hz, respectively [20].
Vibration measurements were conducted on a small passenger car with a monocoque body structure powered by a diesel engine. In this type of structure, individual body components are welded together to form a unified shell. Diesel engines are known to generate higher vibrations compared to other engine types due to the nature of diesel combustion. Using a vibrometer with a connected probe, the vibration spectrum at 800 rpm during idling revealed a peak at 26.25 Hz. Additionally, the vibration spectrum during free vibration excitation, triggered by slamming the car door while the vehicle was off, showed the highest response at 3.75 Hz [21].
2.3. Dependence on Gear Engagement
Chassis vibrations when idling can sometimes indicate what gear is engaged in a vehicle, though this is not always an exact science and can depend on several factors, such as the type of transmission, engine condition, and vehicle design. When a vehicle is idling, the chassis experiences vibrations that can vary depending on the gear engaged in the transmission. The vibrations arise from the engine’s operation and the interaction of various components, including the transmission, drivetrain, and suspension system. These vibrations are typically subtle but can be influenced by whether the vehicle is placed in neutral, drive, reverse, or another gear.
When the vehicle is in neutral, the engine is still running and idling, but it is not connected to the wheels. The drivetrain components, such as the clutch (in manual transmission) or torque converter (in automatic transmission), are not engaged, meaning the power from the engine is not being transferred to the wheels. The chassis will experience engine vibrations that are primarily due to the engine idling. These vibrations can be transmitted to the chassis through the engine mounts. Since the drivetrain is disconnected, there is no load on the drivetrain components, so the vibrations tend to be relatively uniform and may feel softer compared to when the car is in gear. The engine operates at idle speed (usually 600–1000 rpm), so the vibration frequency is relatively low and constant, without added stress from the drivetrain.
When the vehicle is in drive (automatic transmission) or in first gear (manual transmission), the engine is connected to the wheels through the transmission and torque converter (in automatic vehicles). The drivetrain components are under load, which can change the way the chassis vibrates. In automatic vehicles, when the car is in drive, the torque converter connects the engine to the wheels, transmitting power from the engine to the drivetrain. This connection can cause a slight increase in vibrations, particularly if the vehicle is idling with the transmission engaged and not moving. In a manual transmission, when the vehicle is in first gear, the engine is connected to the wheels via the clutch. At idle, the clutch may still be disengaged if the pedal is pressed, so there will not be a significant increase in vibrations. However, if the clutch is partially engaged, it can cause vibrations that feel more pronounced than when in neutral due to the partial load on the engine.
When the vehicle is in reverse, the engine is connected to the drivetrain via the transmission and the torque converter (in automatics) or the clutch (in manuals), and the car is in the process of reversing (though not yet moving). The transmission in reverse gear works similarly to the drive gear but may cause slightly different vibration characteristics due to the way the power is being transferred through the reverse gear set. The reverse gearset can cause a slightly different vibration frequency and pattern because it works by reversing the direction of power flow. This may cause slightly higher frequency vibrations when compared to the drive gear, due to the changes in the way the gears mesh. If the car is idling in reverse, and the engine load increases, the vibrations can feel different from when the car is idling in drive or neutral. The engine mounts and suspension may transmit these vibrations to the chassis more noticeably.
In automatic vehicles, when the car is in park gear, the transmission locks the drivetrain so that the wheels are not free to rotate. The engine is still idling, but the power is not being transmitted to the wheels, much like when in neutral. The vibrations at idle in park are like those in neutral, with the engine still running and generating vibrations. However, in park gear, the vehicle is stationary, and no load is transmitted through the transmission to the wheels. The vibrations will primarily come from the engine, which can be transmitted through the engine mounts to the chassis.
Table 1 lists typical vibration frequencies for different vehicle models to provide an intuitive comparison.

Table 1.
Typical vibration frequencies for vehicle types.
Small three-cylinder cars (e.g., Peugeot 108) tend to vibrate more noticeably at idle, with roughness around 15 Hz due to inherent balance issues in three-cylinder cars. Four-cylinder hatchbacks and sedans such as Honda Civic and Mazda 3 exhibit lower-frequency shudders (~8–11 Hz), particularly at low RPM (500–650). Compact and large SUVs (RAV4, Wrangler, Ridgeline) using four-cylinder or V6 engines produce idling frequencies in the 10–15 Hz range, noticeable in the steering wheel, seat, or cabin. Heavy vehicles (passenger vans, buses, trucks) with four-cylinder or diesel engines also show idling vibrations from 8–20 Hz, consistent with multi-cylinder and heavy-duty trucks.
2.4. Dependence on Number of Occupants
The chassis of a vehicle can experience different vibrations when idling depending on the number of people inside, though the effect is generally subtle.
Chassis vibrations are primarily influenced by the engine, transmission, and drivetrain while the vehicle is idling. However, the mass of the vehicle, including the number of occupants, can affect how those vibrations are transmitted through the car. As more people enter the car, the total mass of the vehicle increases. The suspension system (which is responsible for absorbing vibrations from the road) has greater moving mass and a subsequent decrease in sprung-mass natural frequency. This can result in slightly altered vibration characteristics, though the changes are usually not large unless there is a significant difference in vehicle mass with increasing number of occupants.
Additional passengers change the mass distribution of the vehicle. If people are sitting in the front seats, they might add mass to the front suspension and chassis, while passengers sitting in the back seats will affect the rear suspension. This altered distribution can cause vibrations to be transmitted more noticeably through the vehicle’s structure.
More people in the vehicle could also increase the flexing of the vehicle’s frame, especially if the car has a lighter chassis or is built with less rigidity. This could cause the chassis to resonate slightly differently, but again, this effect would generally be quite subtle unless the number of occupants is significantly large.
While idling, the engine speed is low. Idle vibrations tend to be more noticeable at the low-frequency end of the spectrum (~1–2 Hz for typical passenger vehicles), and the presence of additional passengers can slightly change the way those vibrations travel through the chassis and suspension.
In general, while more passengers will likely have a small effect on the chassis vibrations of a vehicle while idling, this effect is usually minor. The primary sources of vibration (engine, drivetrain, and suspension) still dominate the vehicle’s overall vibration profile when idling and changes due to the number of passengers are typically less noticeable compared to those caused by changes in the engine load or road conditions.
3. Radar Micro-Doppler Analysis of Vibrating Structures
This section first lays the groundwork for discussing the radar micro-Doppler characteristics of an idling vehicle by exploring its simple mechanical model. This is followed by a discussion on the radar micro-Doppler features arising from idling vehicles, vehicle starts, gear shifts, and occupancy. We end with the presentation of a theoretical model for micro-Doppler characterization.
3.1. Mechanical Model of a Vehicle
A basic mechanical model of how a vehicle moves is shown in Figure 1 [22,23]. In this model, the main parts that add weight are the chassis (vehicle frame) and the engine. The suspension system is treated like a combination of springs and shock absorbers. The wheels also add weight, and the tires act like additional springs because of their rubber structure.
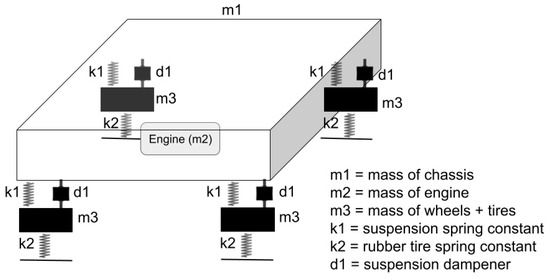
Figure 1.
Basic mechanical state space model of a vehicle.
In this setup, the small shifts in Doppler frequency and strength that are measured may come from the suspension and tires softening or slightly reducing the vibration frequencies. The materials of the car frame and other shock-absorbing parts also help reduce these frequencies. It is important to understand that the natural frequency of a system (how it vibrates on its own) is lower when damping (resistance) is involved. This matters especially when the system is hit with quick, sudden forces.
However, when the engine is running steadily at a certain speed (RPM), its vibrations match that speed rather than the natural vibration frequency of the car’s structure. Also, engine vibrations are not just simple, steady tones—they include a range of frequencies. That is why tools like accelerometers or radar sensors often do not pick up the engine’s exact RPM. Instead, they detect how the vehicle’s parts—like the doors or windows—vibrate when the engine is running.
The weight of passengers also affects the car’s vibration, changing both how strong the vibrations are and how fast they happen. Engine vibrations do not directly shake parts like the windows or body panels—they spread through the entire car in complex ways. Still, machine learning algorithms can learn these patterns without needing to understand all the detailed paths the vibrations travel.
When the transmission shifts gears, the engine load changes temporarily. This causes brief changes in engine speed (usually between 500 and 1000 RPM) as the system adjusts for changes in power loss from the drivetrain. Gear shifts can also create sudden jolts as the parts inside the drivetrain connect more tightly. These jolts depend on the specific type of drivetrain but happen in predictable ways within similar vehicles. They show up as broad vibrations that people often feel as the car shifts gears.
3.2. Radar Micro-Doppler from Idling Vehicles
Radar micro-Doppler refers to the small, time-varying frequency shifts detected by radar as it interacts with a moving object or component. Radar micro-Doppler can capture vibrations from various parts of an idling car, such as the front, back, and left and right doors. These vibrations are a result of the engine, suspension, and the vehicle structure as they transmit forces from the running engine through the chassis, affecting different regions of the vehicle. The specific relationship between radar micro-Doppler and these vibrations depends on the components of the vehicle that are vibrating and how these vibrations are transmitted through the car’s structure. For a stationary vehicle (such as an idling car), radar can typically detect vibrations caused by the engine’s operation, chassis flexing, suspension dynamics, and passenger and load shifts. The micro-Doppler spectrum reflects these vibrations by showing periodic shifts in frequency corresponding to the oscillations or small movements of the vehicle’s parts.
At the front of the vehicle, the radar micro-Doppler signature will capture the vibrations related to engine-induced vibrations: The front engine block and related components (like the alternator, crankshaft, and pistons) produce cyclic low-frequency vibrations that propagate throughout the vehicle. The front suspension system (e.g., coil springs or shock absorbers) also causes low-frequency vibrations that may be detected, especially when the engine is running. Radar micro-Doppler signature characteristics will show low-frequency cyclic components from the engine as well as high-frequency oscillations resulting from bodywork panel vibration modes.
At the rear of the vehicle, the radar micro-Doppler spectrum will reflect vibrations from the rear suspension system and the drivetrain. The rear suspension transmits vibrations caused by the engine’s power being transferred through the vehicle’s chassis, which can cause flexing and oscillations, especially if the vehicle is heavily loaded in the rear. In vehicles with rear-wheel drive, the drivetrain (including axles and differential) can generate low-frequency vibrations that are transmitted through the vehicle’s frame to the rear. Radar micro-Doppler signatures will be characterized by low-frequency vibrations from the drivetrain or rear axle and high-frequency components from the engine.
Radar can also detect the vibrations transmitted through the chassis, including the left and right doors of the vehicle. These vibrations can be caused by chassis flex and passenger-induced vibrations. The vehicle’s frame and bodywork (including the left and right doors) transmit vibrations from the engine and suspension systems. These vibrations are typically of low frequency, spreading throughout the vehicle’s body and detectable at various positions. The presence of passengers in the front or rear seats will affect the distribution of weight and load, which can alter the vibration characteristics in the vehicle. This can cause additional, often higher-frequency, vibrations in the doors and surrounding areas. Radar micro-Doppler signature characteristics therefore show low-frequency chassis flexing signals and higher-frequency passenger-related vibrations, which can be detected in the doors and the sides of the vehicle.
Using a 94 GHz radar, the vibration frequency spectrum of a truck was measured at the front bumper and on the roof with the engine idling. The peak frequency for both measurements was close to 32 Hz with a second harmonic at 64 Hz at a level of 20 dB lower [24].
3.3. Radar Micro-Doppler from Vehicle Starts
Radar micro-Doppler has the potential to detect a vehicle being started by capturing the distinct vibrations associated with the engine’s startup process, including the activation of the starter motor, the engine coming to life, and the changes in mechanical components as the car stabilizes at idle. When a vehicle starts, the above changes in the vehicle’s behavior produce detectable vibration signatures that can be captured by radar, even if the vehicle is stationary.
Upon starting, an engine typically idles at an elevated RPM as the vehicle drivetrain and exhaust components warm up to steady state conditions. These startup transients cause a distinct transient vibration profile that radar micro-Doppler can pick up. The transition from engine-off to engine-on can be detected by changes in the intensity and frequency of micro-vibrations from the engine block, exhaust system, and engine mounts.
If the vehicle is started while in gear (e.g., in Drive or Reverse), the radar might also detect the slight vibrations as the transmission system engages and begins to transfer power. However, this is more noticeable in vehicles with manual transmissions or in automatic transmissions when the vehicle is under load. The engagement of the torque converter or clutch (in manual transmissions) as the vehicle starts could also create detectable micro-Doppler signatures.
Starting the vehicle can also lead to small movements or shifts in the vehicle, especially if the vehicle is in gear or on a slope. The suspension system can compress slightly when the vehicle starts, which may also be detected by radar. This is especially true in the case of vehicles with automatic transmissions that might produce minor vibrations when the vehicle is in Drive or Reverse.
Even in the case of idling or non-moving vehicles, the act of starting the vehicle can cause a sudden change in the vibration profile. Before starting, the vehicle is in a stationary state with minimal engine-induced vibrations (engine off). After starting, the vehicle produces more mechanical vibrations from the engine, creating an easily detectable shift in the radar’s micro-Doppler signature.
The radar will detect the initial activation of the engine (starter motor) and the transition to normal engine operation. The Doppler effect from the engine’s turning parts (e.g., pistons, crankshaft, fan belt) will produce distinct shifts in the radar’s frequency.
The effectiveness of radar micro-Doppler can depend on the vehicle type. For example, a hybrid vehicle or an electric vehicle (EV) may produce different vibration profiles compared to a traditional internal combustion engine (ICE) vehicle. The radar might struggle to detect engine start in EVs, which have no traditional engine start process, as they rely on electric motors that may not produce the same vibrations during startup. Gross vehicle motion from release of parking brakes is likely to be applicable to both ICE and electric vehicles.
3.4. Radar Micro-Doppler from Gear Shifts
Radar micro-Doppler can potentially indicate gear shifts in an idling vehicle, but with some limitations and specific conditions. When the gear is changed in an idling vehicle, especially in automatic transmissions, it often results in small, but measurable changes in the vibrations and mechanical movements of the drivetrain. These changes might be detectable using radar micro-Doppler in the manner below.
When the vehicle is in Neutral, the engine is running, but the transmission is disengaged from the wheels, which results in relatively mild vibrations transmitted to the chassis. When the vehicle shifts into Drive or Reverse, the transmission becomes engaged and begins to transfer power to the wheels, even if the vehicle is not moving. This introduces additional vibrations from the drivetrain, which may be picked up by radar.
Each gear (Neutral, Drive, Reverse) places a different load on the engine and drivetrain. Neutral typically produces lower vibration frequencies because the drivetrain is disengaged, allowing low idle rpm to persist, while Drive or Reverse creates higher frequencies due to mechanical engagement creating greater load on the drivetrain which is compensated by a slightly high idle RPM. When the vehicle shifts from Neutral to Drive, for example, radar micro-Doppler may detect a sudden increase in vibration frequency due to the load on the transmission components as they engage. A shift from Drive to Reverse would similarly cause a change in vibration patterns because the engine and drivetrain must reverse their rotational direction.
In automatic transmissions, shifting gears can cause subtle changes in the torque converter’s operation, which might be detected by radar. A similar effect can happen when the clutch is engaged or disengaged in a manual transmission. These changes would manifest as different micro-Doppler signatures that correspond to the moment the car shifts gears, providing insight into what gear is engaged, or even the transition between gears.
The idle speed of the engine may also change slightly when shifting gears, especially in automatic vehicles. While Neutral might have a steady idle, the engine speed might fluctuate a bit when shifting into Drive or Reverse, as the load on the engine changes. Radar could potentially detect these subtle speed or vibration fluctuations.
While radar micro-Doppler has potential in detecting gear shifts, there are several challenges. The changes in vibrations due to gear shifts are often small. The drivetrain components engage and disengage with relatively small amounts of motion, so distinguishing these from background noise and other vibrations (such as road noise or engine vibrations) can be challenging. The frequency shift caused by gear engagement might be subtle, making it harder to differentiate from other factors affecting vibrations, like engine idling characteristics. To detect gear shifts reliably, the radar system would need to be highly sensitive to detect small frequency shifts and changes in vibration patterns. In most everyday scenarios, standard radar systems may not have the required resolution to capture the minute differences caused by shifting gears, especially when the vehicle is stationary and idling. Vibrations caused by factors unrelated to gear changes (such as road imperfections, engine misfires, or suspension issues) could make it more difficult to isolate the signal coming from the transmission changes.
In an automatic transmission, gear shifts are smooth and subtle, and the transition between gears might not involve large mechanical changes that would cause easy-to-detect vibrations. Unlike manual transmissions, where shifting gears involves more direct engagement, automatic shifts can occur with relatively small mechanical motions, making them harder to detect using radar. Manual transmissions, where gear shifts are more deliberate and involve more direct mechanical movement (clutch, gearbox engagement), might produce more noticeable vibrations during gear shifts, but even here, the vibrations may still be subtle.
While radar micro-Doppler could theoretically indicate gear shifts in an idling vehicle by detecting changes in vibrations and mechanical movements associated with gear engagement, it would likely require advanced radar technology and high-resolution sensors to accurately identify these shifts. The vibrations produced by gear changes are typically subtle, especially in modern vehicles with automatic transmissions, making it difficult for basic radar systems to consistently detect them.
For practical applications, radar micro-Doppler might be able to detect general shifts in the drivetrain’s behavior (e.g., from Neutral to Drive), but it would not necessarily offer precise or reliable information about every gear shift in a typical idling vehicle. However, with the right technology, it could be an additional tool for monitoring vehicle behavior and diagnosing issues related to the transmission or engine performance.
3.5. Radar Micro-Doppler Related to Vehicle Occupancy
Radar micro-Doppler typically probably cannot reliably indicate the exact number of individuals inside an idling vehicle, but it might offer some clues about the presence of passengers and the overall mass distribution in the vehicle, depending on certain factors.
As stated earlier, radar micro-Doppler detects small movements and vibrations caused by various sources. This can include vibrations from moving parts in the vehicle (like the engine, wheels, or drivetrain) as well as subtle movements caused by people or objects inside the car.
The weight distribution inside the vehicle, influenced by the number of passengers, can cause small changes in how the suspension works and how vibrations are transmitted through the chassis. More passengers inside the car will increase the mass on the suspension and may result in slightly greater or different vibration patterns that could potentially be detectable by radar micro-Doppler. A heavier load may cause more compression of the suspension system, which can alter the vibrations that pass through the vehicle’s body. More passengers might cause slightly more pronounced vibrations as their movement can be detected as subtle changes in the vehicle’s suspension or the overall structural flex of the vehicle.
Human bodies generate micro-vibrations that might be detectable by radar sensors. The movement of passengers (even subtle shifts in position, such as adjusting seating or even slight movements) could create small Doppler shifts that radar might pick up. While these movements are typically small and difficult to isolate from other sources of vibration (like engine, road conditions, or transmission vibrations), the presence of multiple passengers could increase the overall amount of detectable vibration. However, the number of passengers and their specific positions inside the car would be hard to isolate precisely because of the small size and randomness of these micro-vibrations.
As the number of passengers increases, the load on the suspension changes, and this can affect how the car responds to engine vibrations. If radar micro-Doppler can detect load-induced vibrations from the suspension, it might indicate that the vehicle is under higher load. This change might be interpreted as an increase in mass or load, though this would not necessarily provide an exact number of passengers but could indicate more weight inside the vehicle.
The body movements of passengers inside the vehicle, such as shifting or adjusting, could cause small vehicle body motions such as roll and pitch as the mass distribution changes.
While radar micro-Doppler might not be able to directly reveal the number of people inside a car, it could potentially offer some indications of occupancy or changes in load based on the effects of passengers on the vehicle’s overall vibration pattern. Increased load might be detectable as a subtle increase in the overall vibration levels from the suspension or other components. While multiple passengers might cause more complex or amplified vibration patterns from seat movement, shifting, or distribution of weight, it would still be difficult to pinpoint the exact number.
3.6. Radar Micro-Doppler Modeling
Mathematical expressions have been developed to describe the micro-Doppler shifts caused by various types of micro-motions [25]. In the case of vibrational motion of a target, the micro-Doppler frequency is given by [25]
where is the radar transmit frequency, is the target vibration frequency, is the amplitude of the target displacement, and are the azimuth and elevation angle of the target center with respect to the radar boresight axis, respectively, and and are the azimuth and elevation angle of the target vibration feature with respect to its center, respectively. When the target as well its vibration features are directly along the line-of-sight of the radar boresight, the angles , , , and are all zero, and the micro-Doppler frequency can be simplified as
From Equation (3), it is evident that the micro-Doppler shift is proportional to the carrier frequency. Therefore, operating at millimeter or sub-millimeter wave frequencies enhances the ability to resolve fine Doppler features, particularly for slower-moving targets such as humans.
Coherent Doppler radars can detect extremely small displacements in a target’s position, often to a fraction of a wavelength. This sensitivity can be leveraged to uncover characteristic signatures of targets, such as those arising from internal vibrations or modulations, including engine vibrations, breathing, heartbeat, and speech [26]. The displacement error is related to the phase error of the measurement and the wavelength as
The phase error, in turn, is related to the signal-to-noise ratio as [26]
In realistic operational scenarios, there are numerous factors that cause or affect the radar micro-Doppler characteristics of stationary engine-running vehicles. Some of the more important factors are depicted in the fishbone diagram in Figure 2.
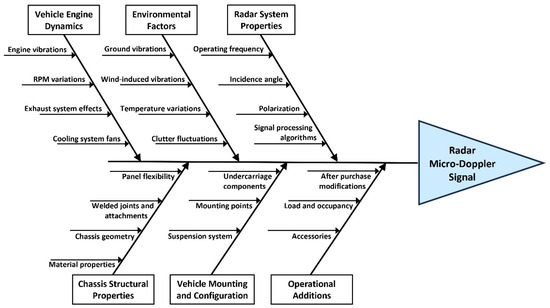
Figure 2.
Fishbone diagram for radar micro-Doppler signals from stationary engine-running vehicles.
4. Test Setup for Experimental Measurements
Herein, we present the design details and specifications of the radar system used for the radar micro-Doppler measurements followed by the procedure adopted for various test scenarios. Also included is a summary of accelerometer measurements and their comparison to the radar measurements.
4.1. Radar System Specifications
A portable briefcase-sized 10 GHz continuous wave (CW) microwave radar system was used in the measurements reported in this paper. The use of 10 GHz is a good compromise between sensitivity on the one hand and reliability and cost on the other hand. The wavelength is 3 cm. This frequency is high enough to capture fluctuations of about one-eighth of the wavelength (0.375 cm) compared to lower frequencies. The frequency is also low enough to avoid scattering or propagation losses in an operational environment and has less expensive components compared to higher frequencies.
Separate antennas were used for transmit and receive functions. Radar system control and data acquisition were achieved using a laptop computer. Details about the system block diagram, relevant component specifications, and photographs of the system are provided below [27].
The experimental micro-Doppler radar system is a continuous wave (CW) device operating at a frequency of 10 GHz. Figure 3 shows the system’s block diagram, while Figure 4 and Figure 5 show photographs of the overall system and a zoomed in view indicating the microwave components, respectively.

Figure 3.
Block diagram of the 10 GHz micro-Doppler radar system.
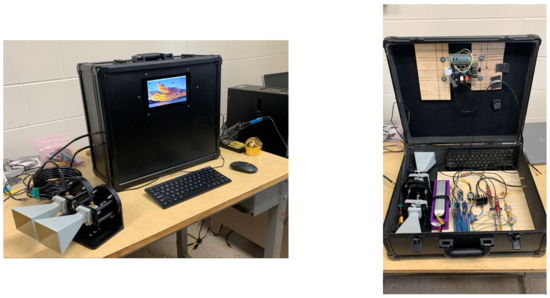
Figure 4.
Photographs of the micro-Doppler radar system highlighting its portability.
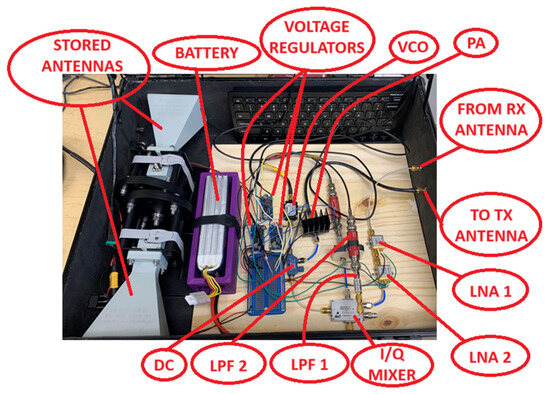
Figure 5.
Zoomed-in photograph showing various microwave components.
At the core of the system is a voltage-controlled oscillator (VCO) that delivers a nominal output power of +10 dBm at a center frequency near 10 GHz, depending on the applied tuning voltage. The VCO operates on a 12 V supply and draws 150 mA of current. Its tuning voltage is set at 5 V with negligible current draw.
The VCO output is directed to the input of a directional coupler (DC), which has an insertion loss of 0.5 dB and a coupling factor of 10 dB. The signal at the through port, reduced to 9.5 dBm (10 dBm − 0.5 dB), is routed to the local oscillator (LO) port of an I/Q mixer—sufficient to meet the mixer’s minimum LO drive requirement of +10 dBm. Meanwhile, the coupled port output, at 0 dBm (10 dBm − 10 dB), is sent to a power amplifier.
The power amplifier offers a gain of 26 dB and has a 1 dB output compression point at +24 dBm. Given a 0 dBm power input, the amplifier is expected to produce an output near +25 dBm, likely operating in the compression region. It is equipped with a heat sink and powered by a 12 V supply drawing 400 mA.
The output from the power amplifier is directed to the transmit antenna, which has a minimum gain of 15 dB and comes equipped with a mounting bracket. The receive antenna is identical to the transmit antenna, offering the same 15 dB gain and mounting hardware.
The signal received by the antenna is routed to the first low-noise amplifier (LNA 1). This amplifier provides a gain of 20 dB and has a noise figure of 1.7 dB. Its 1 dB output compression point is +13 dBm, which is sufficiently high to prevent saturation, as the incoming signal power is relatively low. The LNA operates on a 5 V supply and draws 50 mA of current.
The output from the first low-noise amplifier (LNA 1) is routed to a second low-noise amplifier (LNA 2), which provides an additional gain of 26 dB with a noise figure of 2 dB. LNA 2 has a 1 dB output compression point of +12 dBm, which is sufficiently high to avoid saturation, even after the signal has been amplified by LNA 1, due to the inherently low received power. LNA 2 operates on a 5 V supply and draws 75 mA of current.
The amplified signal from LNA 2 is fed into one of the RF input ports (either RF1 or RF2) of the I/Q mixer, while the unused RF port is terminated with a 50 ohm load. The mixer introduces a conversion loss of 7 dB. The resulting in-phase (I) and quadrature (Q) outputs are passed through the first stage of low-pass filtering (LPF 1), followed by a second stage (LPF 2).
LPF 1 has a cutoff frequency of 3.4 GHz and serves primarily to suppress any residual high-frequency signals near 10 GHz that may leak through. At baseband frequencies associated with micro-Doppler signals, its insertion loss is minimal—less than 0.01 dB. LPF 2 has a much lower cutoff frequency of 100 kHz and is designed to suppress unwanted noise components. It also maintains a low insertion loss of less than 0.3 dB within the micro-Doppler baseband range.
The filtered I and Q signals are then captured using an Analog-to-Digital Converter (ADC) via a two-channel TRS AUX cable. These baseband radar signals are recorded using the Audacity software on a Raspberry Pi for further processing.
The system can be powered either by a 12 V battery or a wall adapter. The down-converted and filtered in-phase (I) and quadrature (Q) signals are captured and processed through an Analog-to-Digital Converter (ADC) by a two-channel TRS AUX cable for recording the baseband radar signals through Audacity® (version 3.1) audio editor and recording program in a Raspberry Pi computer. Relevant overall specifications of the system are provided in Table 2.

Table 2.
Radar system specifications.
Audacity® is a free, open-source audio recording and editing software. The software takes up a very small amount of CPU, which was deemed perfectly suited for the Raspberry Pi’s computing power. Audacity® allows for two-channel recording. Since the I/Q radar signal was recorded through a two-channel AUX cable after filtering and the ADC, Audacity® was able to record the frequency information successfully.
The vehicles tested are listed in Table 3. All experiments were conducted in an outdoor parking lot on a clear summer day. Measurements were made on a day with minimal wind and in a parking lot clearly away from other vehicles and other objects such as trees. Moreover, we ensured that the radar beam spot was fully contained on the chassis of the vehicle. The radar system was positioned 1.52 m (5 ft) away from each vehicle and at a height of 0.91 m (3 ft), remaining stationary throughout each recording. Both antennas were aligned with zero degrees elevation and azimuth. A photograph of the experimental setup is shown in Figure 6.

Table 3.
List of vehicles tested.
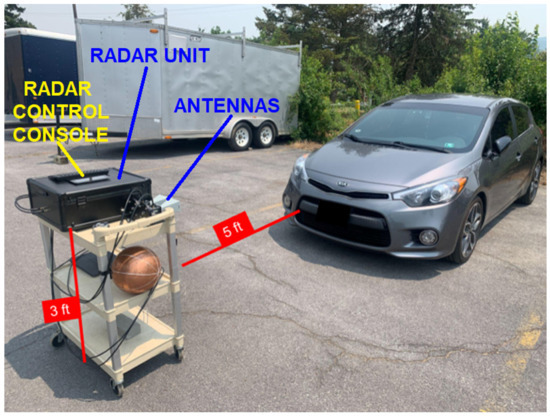
Figure 6.
Experimental setup.
Measurements were performed under clear sky conditions. Although the temperature and relative humidity (RH) were not recorded during the measurements, these were obtained for the two measurement days (26 and 27 July 2023) from National Weather Service weather reports at the experiment starting times. These values were as follows:
- 26 July: 30 °C and 46.5% RH
- 27 July: 31 °C and 53.1% RH
4.2. Multi-Passenger Test
This research involved two types of experiments. The first experiment was the “Multi-Passenger Test”. For each stationary vehicle with the engine running, radar measurements were recorded for one minute under different conditions: first with one person sitting in the car, then two people, followed by three, and finally four people, each remaining as still as possible. Participants were required to remain stationary during the test. These scenarios were conducted on each side of the vehicle: the front, back, driver side, and passenger side. The top flowchart in Figure 7 shows the measurement methodology.
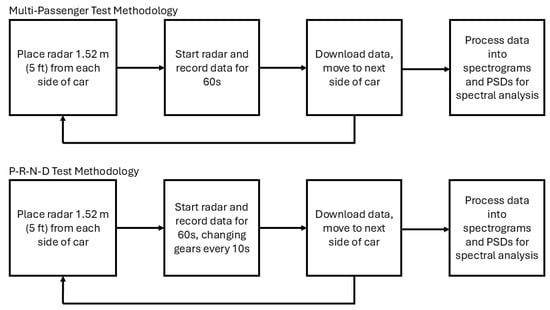
Figure 7.
Flowchart of measurement methodology.
4.3. Park-Reverse-Neutral-Drive (PRND) Test
The second experiment, referred to as the “PRND Test”, involved recording radar data for one minute with only the driver inside and the vehicle initially turned off. For each vehicle and on each side, at ten-second intervals, the driver was instructed to switch gears in the following sequence: OFF → ON & PARK (P) → REVERSE (R) → NEUTRAL (N) → DRIVE (D) → OFF. The vehicles remained stationary during each measurement, with the driver holding the brake if necessary. A summary of these experiments is provided in Table 4.

Table 4.
Testing summary.
The driver was ready, attentive, and watching a cue giver standing in front of the car. The cue giver shouted each gear name and also raised an arm to visibly signify engine start and gear change for both the accelerometer measurement operator and the vehicle driver. All participants had earlier practiced this technique to ensure consistency when performing the actual measurements. The bottom flowchart in Figure 7 shows the measurement methodology.
4.4. Accelerometer vs. Doppler Measurements
In addition to radar measurements, panel vibration data were also collected using piezoelectric accelerometers. These devices were positioned at specific locations around the vehicle and used during the same experiments. The purpose of this setup was to use the accelerometer data as a ground truth for validating the radar system’s performance. If a strong correlation is found between the radar and accelerometer data, as will be demonstrated in the following sections, micro-Doppler radar could be considered a reliable and versatile method for vibration detection. Based on the cues provided by the cue giver as described above, we ensured that the accelerometer and radar data were synchronized.
However, it is important to note the key differences between accelerometer and Doppler measurements. The radar antenna’s beamwidth was large enough to cover a broad area of the vehicle, meaning it captured reflections from a wide region. In contrast, accelerometers must be mounted on a specific surface to provide accurate readings, yielding only point measurements. This meant that the accelerometers measured vibrations from the surface they were mounted on, without capturing data from the entire area illuminated by the radar. As noted in Section 3.6, micro-Doppler shifts induced by vibration are functions of angles , , , and , which are non-zero for surfaces away from the radar boresight. Consequently, the frequency spectrum magnitudes from vibrations captured by the radar will likely be lower than those measured by the accelerometers. Table 5 outlines the positions where the accelerometers were placed for both the Multi-Passenger Test and the PRND Test. It is important to note that the accelerometers were repositioned after completing measurements for one side or when switching vehicles. Additionally, some accelerometers were placed in different locations for different vehicles due to mounting challenges.

Table 5.
Acoustic accelerometer placement on vehicle surfaces.
During the experiments, vibration data were collected using two separate data acquisition systems (DAQs). The micro-Doppler radar data were collected as detailed in this paper while a second DAQ was used to collect vibration data from vehicle-mounted accelerometers. The secondary DAQ was a stand-alone system from a major manufacturer of data acquisition equipment. While all data were time-stamped using the local clocks of the respective DAQ, there was no absolute time synchronization between DAQs. During the data analysis, distinct vibration events, such as those caused by shifting gears, were used to correlate the micro-Doppler- and accelerometer-based vibration data. For the averaged power spectral densities and spectrograms in this work using data spanning many seconds of vehicle vibration, we believe that the cross-correlation-based synchronization provides sufficient temporal resolution.
It should be noted that the micro-Doppler radar signal is an average of displacement/velocity/acceleration over the two-dimensional projected beam area based on the range to the target and the antenna beamwidths. The projected radar beam area on the vehicle chassis is almost circular and 72 cm (28 in) in diameter. The accelerometers, however, return the vibration at a fixed location on the panel. Because of this difference, the lowest order panel mode vibration should correlate well as the entire panel moves. We expect micro-Doppler and accelerometer vibration at higher order modes (higher frequency vibration) to deviate. Frequencies with flexural bending wavelength much greater than beamwidth should correlate. Higher frequency vibration measurements, with wavelengths much less than the micro-Doppler beamwidth, will have differences between the micro-Doppler and single-point accelerometer.
5. Data Analysis Method
Provided herein are details of spectrograms, power spectral densities, and the signal processing approach used for data analysis.
5.1. Spectrograms
In past studies on the micro-Doppler effect, the most common way to analyze the data has been by creating spectrograms and power spectral densities (PSDs) [28,29,30,31,32]. Spectrograms are especially useful because they show how the frequency content of a signal changes over time. A short explanation of how a spectrogram is made helps explain the data processing methods used in this study.
To create a spectrogram, the Short-Time Fourier Transform (STFT) is applied to complex radar in-phase and quadrature (I/Q) data. This process involves dividing the signal into short time segments using a chosen window, then converting each segment into the frequency domain. The result is a linear spectrum (LSP) that shows the frequency content at that moment in time. These results are then visualized over time by mapping the amplitude of each frequency to a color scale.
This method works well for showing motion, like the spinning of helicopter blades [33,34], sounds from loudspeakers [35,36], how people walk [37,38], and the flight of drones or birds [39]. In our study, we used radar to detect vibrations from different parts of a vehicle’s chassis.
5.2. Averaged Power Spectral Densities
To make the spectrogram data more useful, a closer look at the frequency content of each signal can help improve future machine learning classification and also confirm how well the radar data matches with the accelerometer measurements. This is where power spectral density (PSD) becomes helpful.
For tests involving multiple passengers—where there were few sudden changes during recording—an average PSD was used to highlight the main frequency components in the signal. In contrast, the PRND (PARK, REVERSE, NEUTRAL, DRIVE) tests had more frequent changes, since the gear shifted every 10 s. So, the recording was split into sections based on each gear mode, leaving out the short periods during the actual shifts. An average PSD was calculated for each gear mode segment to highlight the frequency patterns linked to PARK, REVERSE, NEUTRAL, and DRIVE. This method could help machine learning models learn the differences in frequency content between these modes.
Because vibration-related micro-Doppler effects are generally symmetrical, and accelerometer signals are completely symmetrical around positive and negative frequency components, focusing only on the positive frequencies of the Doppler data can make comparison easier. Similar to how the Short-Time Fourier Transform (STFT) or Fast Fourier Transform (FFT) can give both double-sided and single-sided spectral densities, the single-sided spectral density is shown in Figure 8 and is defined as
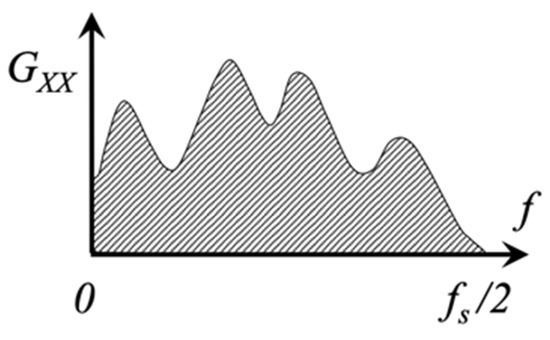
Figure 8.
Single-sided averaged spectral density. The sampling frequency is .
In equation (6), is the signal’s time duration and is the linear spectrum. The linear spectrum is found by applying FFT to the windowed time series and multiplying it by the frequency resolution .
In MATLAB (R2023b), the FFT function calculates the linear spectrum by multiplying the FFT result by the sampling period. However, this process may vary in different software tools. For the averaged PSD, the signal is divided into overlapping segments. The spectral density is calculated for each segment. Then, all the values are added together and divided by the number of segments to get the final “averaged” spectral density.
Even though short-lived changes (transients) are not averaged in this part of the analysis, they are still important. These quick events may contain features useful for identifying gear shifts or detecting unusual behavior, as shown in later figures. Averaging is avoided in these cases because it would smooth out the rapid frequency changes, making it harder to detect important details in the spectrum during these brief moments.
5.3. Signal Processing Approach
All results presented in the following sections were processed using MATLAB. To ensure compatibility between the frequency ranges of both vibration and Doppler data, a common sampling frequency was selected. The recommended sampling frequency for the accelerometers is 20 kHz. Since the Doppler data were saved as a WAV file at Audacity’s sampling rate of 44.1 kHz, the Doppler data had to be resampled to 20 kHz. With this sampling rate, a one-second record size (20,000 samples) and 50% overlap, the Doppler and acoustic data could be used for PSD and spectrogram analysis.
The focus for this research was to ensure the radar data were matched as best as possible to the acoustic accelerometer data. This meant using the same sampling frequency as the accelerometers. It was recommended that a sampling rate of 20 kHz should be used for the accelerometer data to yield a frequency resolution of 1 Hz. Therefore, the same sampling rate was used for the radar data. MATLAB’s spectrogram function was used for convenient processing for taking the STFT and matching the recommended parameters of the accelerometers. MATLAB’s spectrogram function took inputs for the number of FFTs (NFFTs), number of overlapped samples, sampling rate, and a specified cyclical frequency vector. NFFT was set to 20 k, as well as the sampling rate to ensure a 1 Hz frequency resolution. The number of overlapped samples was chosen to be 10 k to achieve 50% overlap, which is typically a good practice to ensure that every part of the signal contributes equally to the spectrogram. Since the accelerometer data only recorded positive acoustic frequencies, a single-sided frequency vector was chosen for the radar micro-Doppler data as well. As mentioned previously, since this type of vibration was assumed to be inherently symmetrical motion, the negative Doppler frequency components were ignored for comparison with the acoustic data. Although a Hanning window is generally recommended to minimize spectral leakage, a rectangular window was used because there was concern that any other windowing scheme would lose important spectral information.
6. Presentation and Analysis of Results
The results presented in this section pertain to the GMC Acadia vehicle at rest, where the Doppler shift is zero. Results from the other vehicles were qualitatively similar, details of which can be found in [40]. Detailed statistical analysis is presented to show the possibility of remote detection of gear conditions and occupancy based on the power histograms at specific frequencies. We also present a discussion on the use of this technology in inclement weather.
6.1. Micro-Doppler Spectrograms for Multi-Passenger Scenario Tests
We begin by comparing the spectrograms from the Multi-Passenger Test, specifically focusing on scenarios with two versus four passengers. The corresponding micro-Doppler spectrograms for both the front and back sides are presented in Figure 9.
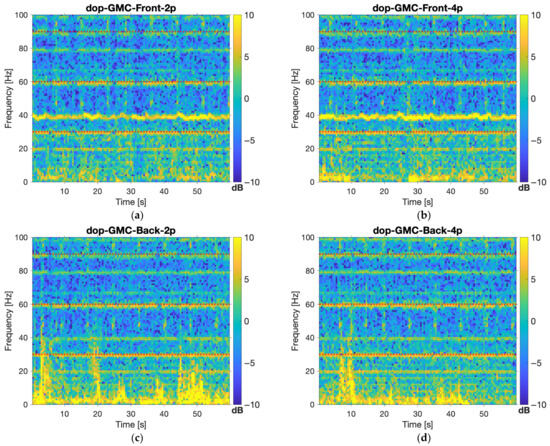
Figure 9.
Two- and four-person multi-passenger micro-Doppler spectrograms for GMC Acadia: (a) Front side, 2 persons; (b) Front side, 4 persons; (c) Back side, 2 persons; (d) Back side, 4 persons. The horizontal red lines at 30 Hz and 60 Hz represent the fundamental tone from a typical 6-cylinder 4-stroke engine.
Several key observations can be made from the spectrograms. On the front side of the GMC, there are 3–5 relatively straight lines that represent tonal vibrations, which are more prominent than others. These lines likely correspond to vibrations from the internal combustion engine, which typically exhibit a fundamental tone matching the combustion frequency. In a four-stroke, six-cylinder engine, there is one combustion event per cylinder for every two revolutions. For instance, if the engine operates at 600 rpm (equivalent to 10 revolutions per second), and each cylinder fires five times per second, the fundamental tone would be 30 Hz. Some low-frequency cyclic vibrations up to ~5 Hz are noted possibly from the engine block vibration transmitted through engine mounts. Data from the rear side also shows the strong tones observed from the front side. We note the presence of higher amplitude low-frequency (compared to the front side) components, owing to the fact that the vehicle side and rear are larger flat surfaces where the front view radar beamwidth covers vehicle grill, hood, and windshield ‘smearing’ low-frequency components.
A comparison of radar and accelerometer spectrograms is presented in Figure 10 when viewed from the back. As observed in Figure 10, spectral lines at 30 Hz also appear in the accelerometer spectrogram, which aligns with the engine running at 600 rpm. Additional spectral lines are seen at 60 Hz and 90 Hz, suggesting harmonic behavior. In some cases, a dominant line at 40 Hz (with a harmonic at 80 Hz) appears, the cause for which is unknown at this point. These spectral lines, visible in both radar and accelerometer spectrograms, align with the frequencies expected from an idling engine.
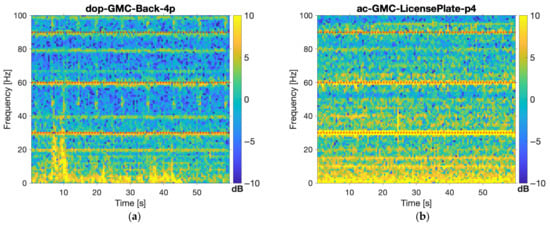
Figure 10.
Micro-Doppler (dop) vs. acoustic accelerometer (ac) spectrogram comparison for GMC Acadia: (a) Back side, 4 persons, Doppler; (b) Rear license plate, 4 persons. The horizontal red lines at 30 Hz and 60 Hz represent the fundamental tone from a typical 6-cylinder 4-stroke engine.
Occasionally, additional frequencies between 0 and 20 Hz briefly emerge. Depending on the vehicle’s year and model, modern engines often include features like idle control. Even when idling, the engine periodically adjusts to stabilize. This behavior is likely caused by factors such as damping effects in the gearbox, the AC compressor, and the electronic speed control system.
The path through which vibrations transfer across the vehicle structure is minimally influenced by passenger occupancy. This is likely due to the much larger mass of the vehicle itself. Consequently, the number of passengers inside the vehicle has little effect on the overall mass, and the change in vibration amplitude observed is minimal between two and four persons.
6.2. Micro-Doppler Spectrograms for PRND Gear Shift Tests
Spectrograms for the PRND Test of the GMC are shown in Figure 11 and Figure 12. The vertical red lines indicate the gear shifts: ON in PARK, REVERSE, NEUTRAL, and DRIVE. During the recording, the driver was verbally and gesturally prompted to switch transmission modes, which means some impulses may appear slightly earlier or later at each 10 s interval.
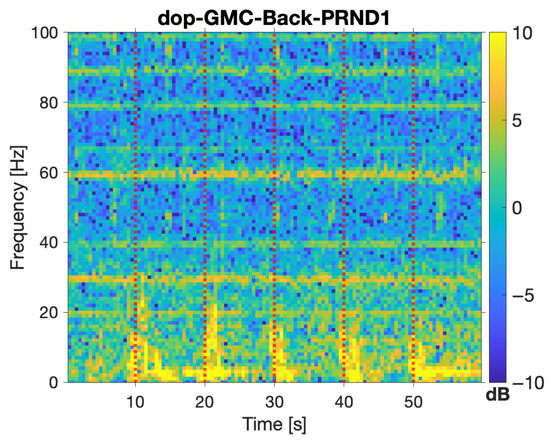
Figure 11.
PRND micro-Doppler spectrograms for GMC Acadia from the back side. Vertical red lines represent the timing between transmission gear shifts: ON/Park (10 s), Reverse (20 s), Neutral (30 s), Drive (40 s), OFF (50 s).
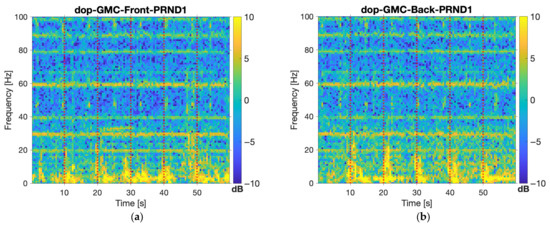
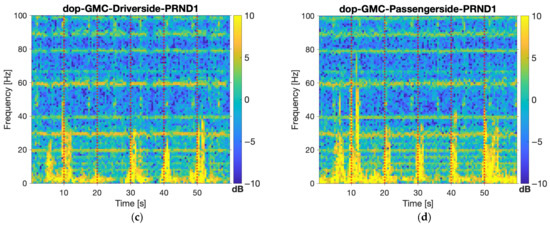
Figure 12.
GMC Acadia PRND micro-Doppler spectrograms per side: (a) Front side; (b) Back side; (c) Driver side; (d) Passenger side. Vertical red lines represent the timing between transmission gear shifts: ON/Park (10 s), Reverse (20 s), Neutral (30 s), Drive (40 s), OFF (50 s).
In Figure 11, high-intensity, impulse-like activity is visible at low frequencies at each 10 s mark. This pattern suggests the gearbox physically shifting to a different position, resulting in the observed transients. This phenomenon was also noted by other researchers, who observed a similar impulse when shifting from ‘Park’ to ‘Drive’ [6]. Spectral lines around 30 Hz and 60 Hz remain visible, and like the Multi-Passenger Tests, the lines are not perfectly straight, with amplitude variations throughout the recording. As observed during the recording process, the engine’s RPM slightly fluctuates when changing gears, which likely explains the behavior seen in these spectrograms.
Figure 12 displays the spectrograms for the PRND Tests on each side of the vehicle. The gear shifts can be detected from each side of the vehicle. It is important to note that only one PRND Test per side is shown. In the experiment, five PRND Tests were conducted for each side, and the results varied despite consistent test conditions. This variability may be due to an insufficient number of recordings to capture a more accurate profile of each side’s behavior. However, the spectrograms provide detailed frequency content over time, suggesting that this method holds promise for creating a detailed profile of the vehicle’s behavior. This information could potentially be used to train a machine learning model to recognize the impulse and spectral line characteristics associated with each transmission mode.
We note that PRND gear shift impulses preferentially excite low-frequency structural vibration in the 0–10 Hz range. Low-frequency vibration is underdamped and is measurable for periods of greater than 5 s after gear shift. Frequencies extending up to 20 Hz are also measured immediately following gear shift, but experience more rapid decay over the first 1–2 s.
6.3. Power Spectral Density (PSD) Plots
As discussed in previous sections, averaged Power Spectral Densities (PSDs) are useful for identifying significant frequencies over the entire duration of a longer signal, especially when few transient events occur. Figure 13, Figure 14, Figure 15 and Figure 16 compare radar and accelerometer measurement results for both the Multi-Passenger Test and PRND Test, demonstrating the similarities between micro-Doppler radar data and accelerometer data. This comparison helps identify which frequencies are most important for further analysis. Figure 17 and Figure 18, on the other hand, display radar data alone for each test case on each side.
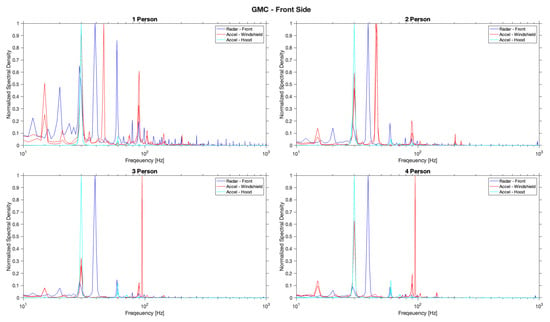
Figure 13.
PSD comparisons between micro-Doppler radar and accelerometer data for the GMC Acadia from the front side for multi-passenger case for 1 to 4 persons. Accelerometer data were collected on the windshield and the hood.
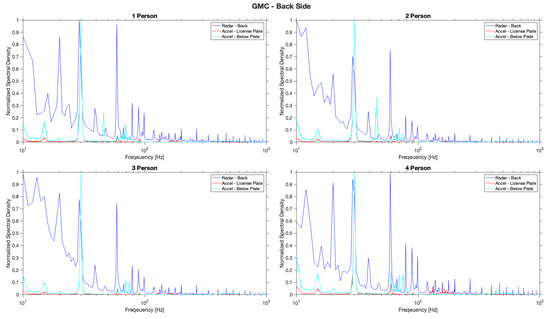
Figure 14.
PSD comparisons between micro-Doppler radar and accelerometer data for the GMC Acadia from the back side for multi-passenger case for 1 to 4 persons. Accelerometer data were collected on the windshield and the hood.
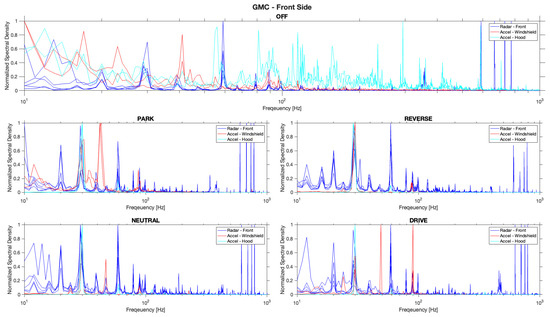
Figure 15.
PSD comparisons between micro-Doppler radar and accelerometer data for the GMC Acadia from the front side for OPRND case. Accelerometer data were collected on the windshield and the hood.
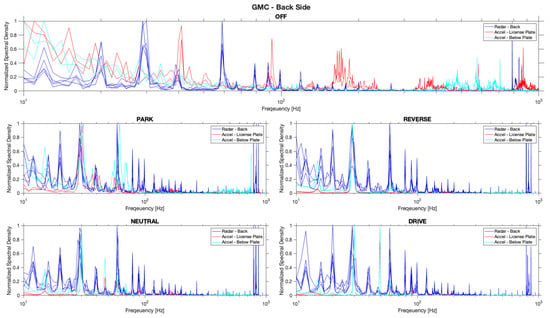
Figure 16.
PSD comparisons between micro-Doppler radar and accelerometer data for the GMC Acadia from the back side for OPRND case. Accelerometer data were collected on the windshield and the hood.
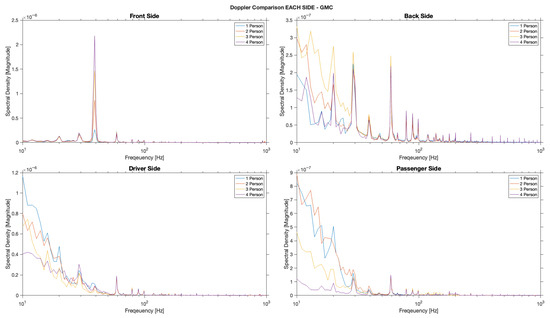
Figure 17.
PSD comparisons between the number of persons for multi-passenger case for the GMC Acadia from all four sides.
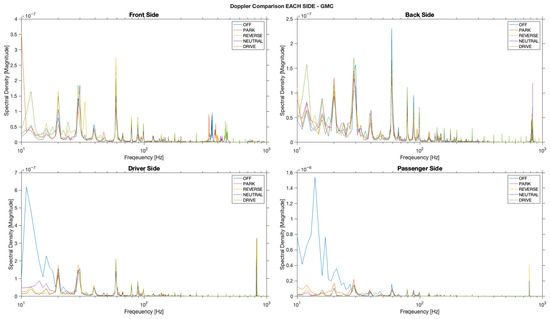
Figure 18.
PSD comparisons between gear shifts for PRND case for the GMC Acadia from all four sides.
The normalization method used was Max Normalization (i.e., Peak Scaling), computed as
This method is used when one is only interested in relative peaks and not absolute power levels. This method highlights dominant frequency components and displays the PSD values on the range of 0 to 1, with the peak scaled to 1.
To facilitate a proper comparison of the micro-Doppler and accelerometer data, normalization was necessary due to the large difference in magnitudes between the two datasets. The analysis reveals several tonal components that are common to both sensor modalities, suggesting that certain regions of the vehicle are prone to vibration. For instance, data collected from the front hood shows a dominant return near ~30 Hz in both Doppler and vibration measurements, likely due to the proximity of the hood to the engine, which is the primary source of vibration.
For each PSD shown in Figure 13, Figure 14, Figure 15, Figure 16, Figure 17 and Figure 18, the 1 min signal was divided into five 5 s segments, each corresponding to a specific transmission mode. The choice of 5 s intervals, rather than using the entire 10 s signal, was made to avoid transient effects at the beginning of the transmission. The goal was to focus on the frequency content within the transmission mode itself. Upon review, there are only slight amplitude changes at certain frequencies (such as between 30–60 Hz), but these differences may not be substantial enough to be used for classification purposes via machine learning.
Figure 19 and Figure 20 show spectral densities representing only the transient component of each gear shift. Unlike the previous plots, these data were not averaged to provide a more detailed frequency spectrum, as they focus on the short-lived transient events. The signals are trimmed to one-second durations to capture the full transient response from each gear shift. Upon inspection, additional frequencies appear for different gear shifts, including 50, 80, and 100 Hz. Additionally, new peaks emerge below 30 Hz. This suggests that analyzing these transient responses could be a useful method for distinguishing between different gear shifts based on their unique frequency characteristics.
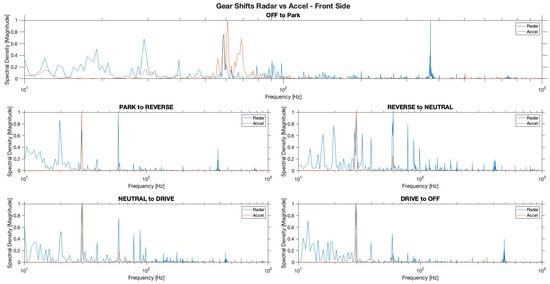
Figure 19.
PSD comparisons for transient components between gear shifts for micro-Doppler radar and accelerometer data for OPRND case for the GMC Acadia from the front side. The accelerometer used to represent the front side is on the hood.
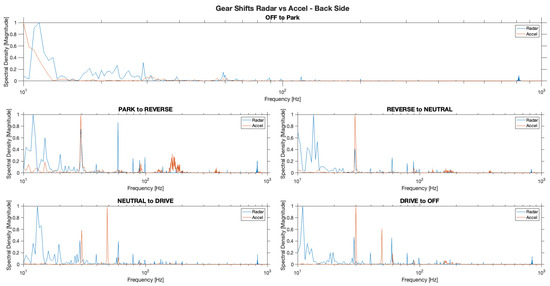
Figure 20.
PSD comparisons for transient components between gear shifts for micro-Doppler radar and accelerometer data for OPRND case for the GMC Acadia from the back side. The accelerometer used to represent the back side is on the license plate.
6.4. Statistical Analysis
While recognizing that the magnitudes for the 30 and 60 Hz spectral lines can help characterize vehicle mode or occupancy, additional features should be considered for reliable classification of gear engagements and number of occupants. As an example, for the GMC Acadia, significant vibration frequency features seem to fall mostly below 20 Hz, as noted in Figure 9, Figure 10, Figure 11 and Figure 12. We present below some initial results of statistical analysis on the Kia Forte5 data to support these observations on feature extraction throughout the frequency spectrum.
Figure 21, displaying STFT data for the front side of a smaller vehicle (2015 Kia Forte5 hatchback), shows two distinct features for the gear shifting analysis. One feature is at 23 Hz and another is at 45 Hz. During the first 10 s of data, the vehicle is off, and both of these features are practically non-existent in this region. At 10 s, the vehicle is turned on, which creates a wideband pulse for a short duration, following which a 23 Hz signal appears. The second feature at 45 Hz only appears when the vehicle is in “Reverse” or “Drive” gears.
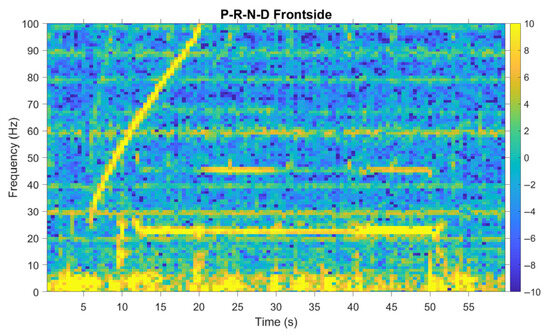
Figure 21.
Spectrogram of a PRND recording on the front side of a small compact hatchback vehicle (2015 Kia Forte5).
The Figure 22 histogram confirms that when the vehicle is off, the received power seen at 23 Hz is distributed between 0 and −5 dB. Whereas when the vehicle is turned on, the received power at 23 Hz is reaching about 10 dB on average. Therefore, for this specific vehicle, 23 Hz is a good indicator for confirming if the car is on or off.
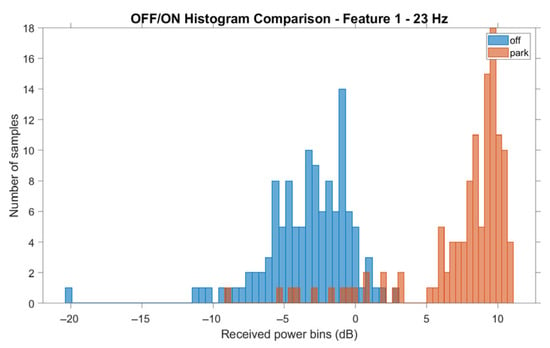
Figure 22.
Received power histogram for the Kia Forte5 in the ON and OFF states at 23 Hz.
Figure 23 illustrates the power distribution of the 23 Hz feature for all various gear modes. When the vehicle is off, most of the power stays below 0 dB. When the vehicle is turned on and shifted to any of the other gear modes, the 23 Hz feature stays above 0 dB. Notice that when the vehicle is in “Drive”, the received power is at a maximum. Whereas when the vehicle is in “Neutral”, the received power is at a minimum.
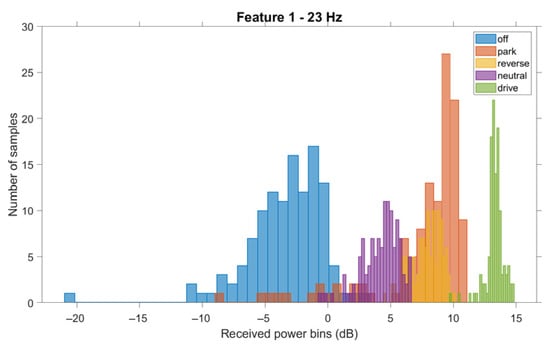
Figure 23.
Received power histogram for the Kia Forte5 gear modes at 23 Hz.
Figure 24 illustrates that the 45 Hz feature reaches between 2 and 4 dB, while the other vehicle modes stay mostly below 0 dB. Therefore, for this specific vehicle, 45 Hz can act as a good indicator for detecting whether the vehicle is in reverse or drive (i.e., ready to move) or in park or neutral (i.e., stationary).
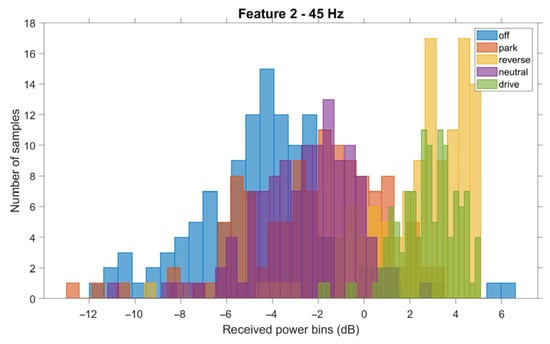
Figure 24.
Received power histogram for the Kia Forte5 gear modes at 45 Hz.
A comparison of the histograms of the received powers in dB between the acoustic and the radar data provides some insights. Figure 25 and Figure 26 show these comparisons for features at 23 Hz and 46 Hz, respectively.
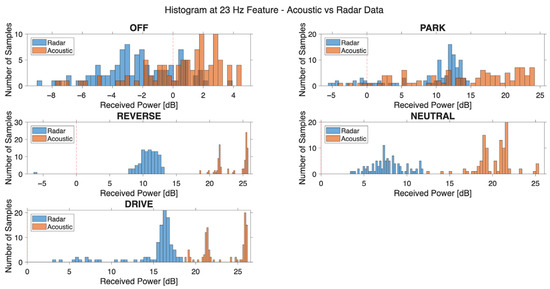
Figure 25.
Spectrogram histogram comparison between acoustic and radar data at 23 Hz.
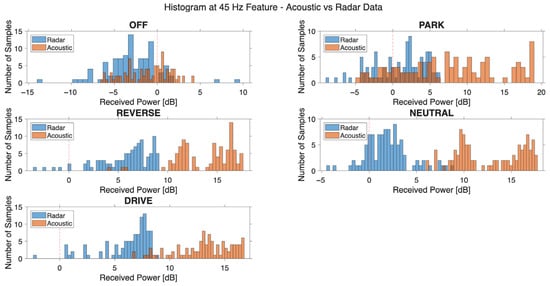
Figure 26.
Spectrogram histogram comparison between acoustic and radar data at 45 Hz.
Figure 25 illustrates the power distribution for each gear mode (OFF, PARK REVERSE, NEUTRAL, and DRIVE) on the front side of the Kia vehicle at the frequency of 23 Hz, since it has been inferred from the corresponding spectrogram as an important feature. The blue bins represent the radar Doppler samples and the red bins represent the acoustic samples. When the vehicle is OFF, the samples for the acoustic data hover around −4 to 4 dB. Most of the samples in the radar data hover between −8 to 0 dB. On the contrary, when the vehicle is ON and in DRIVE, the acoustic and radar samples are mostly above 15 dB. Acoustic samples mostly fall above 20 dB in DRIVE, which is most certainly because the accelerometers are physically attached to the vehicle, whereas the radar is stand-off at about 1.5 m, exhibiting radar path loss. However, the power distribution patterns remain the same. When the car is ON, the radar is recording high-powered vibration responses as opposed to when the car is OFF.
Similar patterns, shown in Figure 26, also apply to the power distribution for each gear mode (off, park reverse, neutral, and drive) on the front side of the Kia vehicle at the frequency of 45 Hz since it has also been deduced from the corresponding spectrogram as an important feature. When the vehicle is OFF, the samples for the acoustic data hover around −5 to 5 dB. Most of the samples in the radar data hover between −6 and 2 dB. On the contrary, when the vehicle is ON and in DRIVE, the acoustic and radar samples are mostly above 5 dB. Again, this shows good evidence that when the car is ON, the radar is recording high-powered vibration responses as opposed to when the car is OFF.
Another interesting observation is when comparing NEUTRAL to DRIVE and REVERSE. NEUTRAL tends to have more samples at a slightly lower power level than DRIVE and REVERSE. NEUTRAL for acoustic data has samples less than 20 dB for the 23 Hz feature and 10 dB for the 45 Hz feature. When looking at the REVERSE and DRIVE samples, they tend to be mostly above 20 dB for 23 Hz and 10 dB for 45 Hz. Radar samples in NEUTRAL have samples less than 10 dB for the 23 Hz feature and less than 5 dB for the 45 Hz feature. Just as in the acoustic data, the opposite occurs in the radar data for REVERSE and DRIVE where most of the samples are above 10 dB at 23 Hz and 5 dB at 45 Hz. This further supports the claim that using a combination of power monitoring and feature extraction (23 Hz and 45 Hz feature), we can characterize which gear the vehicle is in and whether the vehicle is ON or OFF.
Figure 27 shows the same data as in Figure 25 and Figure 26 but as a different depiction. It shows radar and acoustic histograms separately for 23 Hz and 45 Hz.
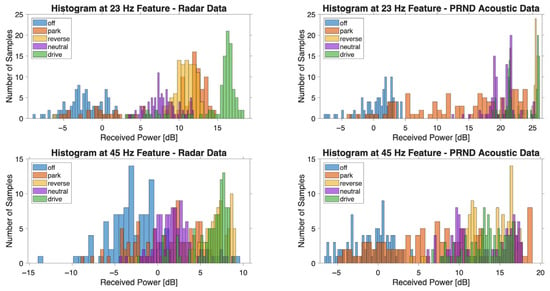
Figure 27.
Spectrogram histograms for radar and acoustic data at 23 Hz and 45 Hz.
Figure 27 is a direct comparison of the radar and acoustic power distributions for each gear mode at these two specific frequency features (23 Hz and 45 Hz). In the radar perspective, the histogram shows clear separation in gear modes based on returned power. When the car is OFF, most of the radar samples are low power (closer to 0 dB). When the car is ON, radar samples are higher power (>0–5 dB). This is most obvious when looking at the 23 Hz feature. When the vehicle is in DRIVE, we see the highest returned power (~15 dB for radar and ~25 dB for acoustic) in both radar and acoustic samples. The 45 Hz feature also shows higher power when the car is in DRIVE (~8 dB). If both frequencies show high power, we can infer the car is ON and in DRIVE. Another example here is that if the car is showing a 23 Hz signal at about 10 dB and a 45 Hz signal at about 8 dB, we can infer the car is in PARK according to these histograms. Various combinations of the power at these frequencies can help characterize the current state of the vehicle. Of course, future research can extract additional significant features which can also help characterize vehicle states more accurately. However, in this case, by monitoring only 23 Hz and 45 Hz, we can see patterns in the radar’s returned power to decode the vehicle’s current gear mode.
6.5. Discussion
In the past, coherent laser radar-based vibration detection was developed to enable precise measurement of an object’s vibration characteristics owing to its high Doppler resolution. Vibration imagery holds significant potential for long-range target classification and identification, including detecting camouflaged or partially concealed targets. Sample vibration images have been captured using laser radars operating at wavelengths of 10.6 μm as well as 1.54 μm at distances of up to 3 km [41]. However, laser sensors are unable to operate under conditions of dust, fog, and rain, and are not eye-safe, suggesting the use of microwave radar approaches for detecting target vibrations. Unfortunately, there does not appear to be much published work on this topic to the knowledge of the authors.
Characterizing vehicle vibrations from afar using Doppler radar is important for several reasons. Doppler radar enables vibration analysis without requiring physical contact with the vehicle. A radar system can provide a holistic view of vibrations across the entire vehicle body rather than localized points where sensors are typically attached. Radar is effective across a wide range of conditions, including dust, fog, rain, and low-light or high-temperature environments, where traditional optical sensors might fail. Remote vibration characterization can help identify unique vibration “signatures” of specific vehicles, which may be useful in security, surveillance, or military applications for vehicle classification and monitoring.
Characterizing vehicle vibrations from afar using Doppler radar also presents several challenges. Adverse weather conditions, such as wind and heavy rain, may induce additional vibrations which can degrade measurement accuracy. Vibrations on vehicle surfaces may produce weak radar returns, making it difficult to isolate the stronger vibration signal from background fluctuations. Vehicles have multiple vibration sources, including the engine, drivetrain, tires, and suspension. Separating these overlapping signals to identify individual sources can be challenging. Accurately capturing high-frequency and low-frequency components simultaneously requires a radar system with high dynamic range and resolution.
The radar’s ability to detect vibrations depends on the reflectivity (radar cross-section) of the vehicle’s surface. Non-metallic or low-reflective surfaces, such as carbon fiber or composite materials, can result in poor signal quality. If the radar is not positioned optimally relative to the vehicle surface, the reflected signals may weaken, reducing measurement reliability.
As the distance between the radar and the vehicle increases, the signal weakens, making it harder to detect small vibration amplitudes. At greater distances, it becomes more challenging to focus the radar beam precisely on the vibrating components of interest.
The radar system must be carefully calibrated to ensure that measurements reflect true vibration amplitudes and frequencies. Results obtained from Doppler radar need to be validated against ground truth data from traditional sensors (e.g., accelerometers), which can be challenging to implement. Proper positioning and alignment of the radar relative to the vehicle can be time-consuming and require expertise.
Detecting vehicle vibrations behind foliage using micro-Doppler radar presents significant challenges due to signal attenuation and scattering caused by the foliage. While specific studies directly addressing this scenario are limited, related research provides insights into the feasibility of such detection. A study using a laser Doppler vibrometer (LDV) at a wavelength of 632.8 nm explored detecting vehicles concealed by foliage by measuring vibrations of tree leaves induced by vehicle engine noise [42]. The findings indicated that the vibrations of leaves, excited by vehicle-generated sound, were detectable using the LDV. This suggests that indirect detection methods, focusing on environmental interactions with vehicle emissions, can be effective. While low-frequency radar signals can penetrate foliage and appear to be promising, they will also observe wind-induced vibrations of leaves and branches, which may be difficult to suppress. Further research is necessary to enhance detection capabilities in such obstructed environments. Despite the above challenges, the potential of the radar micro-Doppler technology to characterize vehicle vibrations has great potential and advantages.
Table 6 compares the main contributions of our work with what has been already reported in the literature.

Table 6.
Comparison of similar reported research.
Adverse weather conditions—particularly rain and wind—can significantly impact the accuracy and clarity of vibration measurements of vehicles using a 10 GHz radar system, especially in environments with surrounding vegetation. Below is a breakdown of how these factors influence radar performance and signal interpretation.
6.5.1. Rain (At Different Rain Rates)
Radar at 10 GHz (X-band) is sensitive to precipitation scattering and attenuation, which affect both signal strength and clarity of vibration features. Light Rain (<2.5 mm/h) induces minor attenuation of the radar signal. Backscattering from raindrops may add low-level noise but usually does not obscure vehicle vibration signatures. Vegetation wetness can slightly increase radar reflectivity but typically has minimal impact. Moderate rain (2.5–7.6 mm/h) will cause noticeable attenuation and increased clutter from rain scatter and micro-Doppler signatures from small vibrations may be masked by returns from falling raindrops. In addition, water on the surface of vegetation increases reflectivity, possibly generating confusing returns if vegetation is moving in the wind. On the other hand, heavy rain (>7.6 mm/h) will cause severe attenuation of the radar signal wherein Doppler shifts from falling raindrops (~5–9 m/s fall speed) may overlap with low-frequency vehicle vibrations (~1–20 Hz), especially if converted to velocity domain. This significantly reduces the signal-to-noise ratio (SNR), potentially masking subtle vibration features like glass panel flexing or body shimmy.
6.5.2. Wind (At Different Speeds)
Wind itself does not directly interfere with radar, but it mobilizes vegetation, introducing motion clutter. Under low wind (0–5 m/s) conditions, tree branches and grass sway slowly, adding minor clutter. Vehicle vibrations (with typically higher frequency content) can still be isolated. Under moderate wind (5–10 m/s), vegetation sway becomes more dynamic. Leaves and branches moving at ~0.5–2 Hz produce Doppler returns that overlap with low-frequency vehicle modes, like body bounce (~1–3 Hz), which can lead to false positives or signal blending. In high wind (>10 m/s), strong and irregular movement of vegetation introduces broadband Doppler clutter. Micro-Doppler features from vehicle components (e.g., chassis panels, engine vibrations) may become indistinct, since wind-driven vegetation can mimic the spectral shape of a vibrating object, confusing classification algorithms or causing tracking errors.
7. Conclusions
Our article has provided the first-ever results of a systematic and comprehensive study of how radar micro-Doppler data can be used to infer the gear engagement and occupancy levels of four different types of vehicles. In addition to vehicle START, gear engagements included PARK, REVERSE, NEUTRAL, and DRIVE. Occupancy levels varied from one to four persons while in PARK. Vehicles investigated included a sedan, a hatchback, a compact SUV, and an SUV. Radar data were collected from all four sides of the vehicle contemporaneously with accelerometer data for comparison and validation.
Our results indicate that there are noticeable differences in the micro-Doppler spectrograms and statistics derived from the power spectral densities between gear engagements since these can be related to the engine functionality. However, the results for the occupancy levels were inconclusive since the weight of humans does not alter the overall weight of the occupied vehicle in a significant manner.
The spectrograms reveal distinct tonal vibrations, primarily around 30 Hz, originating from the engine’s combustion frequency during idling, with harmonics observed at 60 Hz and 90 Hz. Low-frequency vibrations up to ~5 Hz are also present, particularly on the vehicle’s rear side due to surface geometry and radar beam smearing. Both radar and accelerometer spectrograms consistently capture these frequency patterns, confirming their engine-based origin, though occasional unexplained tones like 40 Hz also appear. Passenger occupancy has minimal impact on vibration transmission, as the vehicle’s large mass dominates structural response regardless of load.
The PRND spectrograms show distinct low-frequency impulsive excitation patterns around each 10 s mark, corresponding to gear shifts, with most activity in the 0–10 Hz range and extending up to 20 Hz shortly after shifting. Spectral lines at 30 Hz and 60 Hz persist throughout, with amplitude variations likely caused by slight engine RPM fluctuations during gear changes. Despite consistent testing, results varied between sides of the vehicle, possibly due to a limited number of recordings, though gear shift signatures were still detectable from all sides. These findings suggest that spectrogram analysis could be useful for training machine learning models to identify transmission modes based on impulse and spectral features.
The comparison of averaged Power Spectral Densities (PSDs) from radar and accelerometer data shows strong agreement, especially around the 30 Hz range, highlighting consistent vehicle vibration patterns likely driven by engine activity. Normalization enabled meaningful comparison between the two sensor types, revealing shared tonal components across test conditions and confirming that certain vehicle regions, like the hood, are more vibration prone. While PSD analysis of steady-state gear modes showed only minor frequency amplitude differences, these may be insufficient for classification by machine learning. However, analysis of unaveraged transient data from gear shifts revealed distinct frequency peaks—including at 50, 80, and 100 Hz—suggesting that short-duration transients could provide clearer signatures for identifying specific gear transitions.
The analysis identifies 23 Hz and 45 Hz as key frequency features for characterizing vehicle states, such as whether the car is ON or OFF and which gear it is in. For the 2015 Kia Forte5, the 23 Hz feature appears only when the engine is on, with power increasing significantly across all gears and peaking in DRIVE mode. The 45 Hz feature, on the other hand, is primarily present when the vehicle is in REVERSE or DRIVE, indicating it can be used to detect motion-ready gear modes. Power distributions at these frequencies differ clearly between gear states in both radar and acoustic data, with DRIVE consistently showing the highest returned power levels. Radar data, though weaker than acoustic due to path loss, still mirrors the same trends and offers effective remote sensing capability. NEUTRAL gear modes consistently show lower power than DRIVE or REVERSE, further supporting the usefulness of these features for classification. Ultimately, combining radar power monitoring at 23 Hz and 45 Hz provides a reliable way to infer gear position and engine state, with potential for more refined classification through future feature extraction.
We believe that our results will spur further research on this topic by widening its scope and performing measurements under a variety of realistic environmental conditions, both benign and degraded.
Author Contributions
Conceptualization, R.M.N. and K.M.R.; methodology, K.A.G.; software, B.D.S.; validation, R.M.N., B.D.S., D.K.W. and K.M.R.; formal analysis, B.D.S., R.M.N. and K.M.R.; investigation, R.M.N., B.D.S., D.K.W., K.M.R. and K.A.G.; resources, R.M.N. and K.M.R.; data curation, B.D.S. and D.K.W.; writing—original draft preparation, R.M.N.; writing—review and editing, B.D.S., D.K.W., K.M.R. and K.A.G.; visualization, B.D.S. and D.K.W.; supervision, R.M.N. and K.M.R.; project administration, R.M.N.; funding acquisition, R.M.N. All authors have read and agreed to the published version of the manuscript.
Funding
This research received no external funding.
Data Availability Statement
Dataset available on request from the corresponding author.
Acknowledgments
The radar equipment used in these measurements was developed under U.S. Army Medical Research Acquisition Activity (USAMRAA) Grant Number W81XWH-22-1-0684.
Conflicts of Interest
The authors declare no conflicts of interest.
References
- Carrico, A.R.; Padgett, P.; Vandenbergh, M.P.; Gilligan, J.; Wallston, K.A. Costly myths: An analysis of idling beliefs and behavior in personal motor vehicles. Energy Policy 2009, 37, 2881–2888. [Google Scholar] [CrossRef]
- Everything You Need to Know About Idling. Available online: https://www.gsfleet.io/en/insight/everything-you-need-to-know-about-idling/#elementor-toc__heading-anchor-1 (accessed on 1 July 2025).
- Yokohama, H.; Sunde, J.; Ellis-Steinborner, S.T.; Ayubi, Z. Vehicle borne improvised explosive device (VBIED) characterisation and estimation of its effects in terms of human injury. Int. J. Prot. Struct. 2015, 6, 607–627. [Google Scholar] [CrossRef]
- Tsur, A.M.; Nadler, R.; Sorkin, A.; Lipkin, I.; Gelikas, S.; Chen, J.; Benov, A. Patterns in vehicle-ramming attacks. Isr. Med. Assoc. J. 2022, 24, 579–583. [Google Scholar] [PubMed]
- Keister, T. Thefts of and from Cars on Residential Streets and Driveways; US Department of Justice: Washington, DC, USA, 2007; p. 2.
- Jansson, E.; Molin, N.-E.; Sundin, H. Resonances of a violin body studied by hologram interferometry and acoustical methods. Phys. Scr. 1970, 2, 243–256. [Google Scholar] [CrossRef]
- Lesne, J.-L. Optical Heterodyning and Doppler Effect Applied to Laser Vibrometers and Anemometers. In Proceedings of the 2nd European Congress on Optics Applied to Metrology, Strasbourg, France, 26–30 November 1979. [Google Scholar] [CrossRef]
- Chen, V.C.; Li, F.; Ho, S.-S.; Wechsler, H. Analysis of micro-Doppler signatures. IEE Proc.–Radar Sonar Navig. 2003, 150, 271–276. [Google Scholar] [CrossRef]
- Gentile, C. Vibration Measurement by Radar Techniques. In Proceedings of the 8th International Conference on Structural Dynamics (EURODYN 2011), Leuven, Belgium, 4–6 July 2011; pp. 92–103. [Google Scholar]
- Moll, J.; Bechtel, K.; Hils, B.; Krozer, V. Mechanical Vibration Sensing for Structural Health Monitoring Using a Millimeter-Wave Doppler Radar Sensor. In Proceedings of the 7th European Workshop on Structural Health Monitoring (EWSHM), Nantes, France, 8–11 July 2014; pp. 1802–1808. [Google Scholar]
- Zhu, Y.; Xu, B.; Li, Z.; Hou, J.; Wang, Q. Monitoring bridge vibrations based on GBSAR and validation by high-rate GPS measurements. IEEE J. Sel. Top. Appl. Earth Obs. Remote Sens. 2021, 14, 5572–5580. [Google Scholar] [CrossRef]
- Munoz-Ferreras, J.M.; Peng, Z.; Tang, Y.; Gomez-Garcia, R.; Liang, D.; Li, C. Short-range Doppler-radar signatures from industrial wind turbines: Theory, simulations, and measurements. IEEE Trans. Instrum. Meas. 2016, 65, 2108–2119. [Google Scholar] [CrossRef]
- Nakamura, Y.; Gurler, E.D.; Saita, J. Dynamic characteristics of Leaning Tower of Pisa using microtremor preliminary results. Proc. JSCE Earthq. Eng. Symp. 1999, 25, 921–924. [Google Scholar] [CrossRef]
- Wilson, W.C.; Moore, J.P.; Brinker, K.R. The Use of a Reflectometer as a Monostatic Radar for Measuring Aircraft Structural Flutter. In Proceedings of the 2019 IEEE National Aerospace and Electronics Conference (NAECON), Dayton, OH, USA, 15–19 July 2019; pp. 702–706. [Google Scholar]
- Rodenbeck, C.T.; Beun, J.B. Identifying the operation of a parked car’s engine, transmission, and door using millimetre wave pulse Doppler radar. Electron. Lett. 2020, 56, 959–961. [Google Scholar] [CrossRef]
- Takata, H.; Iwahara, M.; Nagamatsu, A. An Analysis of Idling Vibration for a Frame Structured Vehicle; SAE International: Warrendale, PA, USA, 2003; Technical Paper No. 2003-01-1611. [Google Scholar] [CrossRef]
- Karimi, H.R. Vibration control of vehicle engine-body systems with time delay: An LMI approach. In Handbook of Vehicle Suspension Control Systems; Liu, H., Gao, H., Li, P., Eds.; Institution of Engineering and Technology: Stevenage, UK, 2013; p. 328. [Google Scholar]
- Iyer, G.; Prasanth, B.; Wagh, S.; Hudson, D. Idle Vibrations Refinement of a Passenger Car; SAE International: Warrendale, PA, USA, 2011; Technical Paper No. 2011-26-0069. [Google Scholar] [CrossRef]
- Izumi, J. Combined environmental testing for equipment used on automobiles—Overview and test approach. ESPEC Technol. Rep. 1998, 6, 9–17. Available online: https://espec.com/images/uploads/files/TechReports/tech_rep_06.pdf (accessed on 20 January 2025).
- Ahmed, H.E.; Sahandabadi, S.; Bhawya; Ahamed, M.J. Application of MEMS accelerometers in dynamic vibration monitoring of a vehicle. Micromachines 2023, 14, 923. [Google Scholar] [CrossRef] [PubMed]
- Reksoprodjo, M.R.; Nirbito, W. Characteristics of vibration propagation on passenger car monocoque body structure at static small turbocharged diesel engine speed variation. J. Phys. Conf. Ser. 2020, 1519, 012005. [Google Scholar] [CrossRef]
- Ikenaga, S.; Lewis, F.L.; Campos, J.; Davis, L. Active Suspension Control of Ground Vehicle Based on a Full-Vehicle Model. In Proceedings of the 2000 American Control Conference (ACC), Chicago, IL, USA, 28–30 June 2000; pp. 4019–4024. [Google Scholar] [CrossRef]
- Chamseddine, A.; Noura, H.; Raharijaona, T. Full vehicle active suspension: Sensor fault diagnosis and fault tolerance. IFAC Proc. Vol. 2006, 39, 468–473. [Google Scholar] [CrossRef]
- Rüegg, M.; Meier, E.; Nüesch, D. Vibration and rotation in millimeter-wave SAR. IEEE Trans. Geosci. Remote Sens. 2007, 45, 293–304. [Google Scholar] [CrossRef]
- Chen, V.C. Micro-Doppler Effect of Micro-Motion Dynamics: A Review. In Proceedings of the SPIE Conference on Independent Component Analyses, Wavelets, and Neural Networks, Orlando, FL, USA, 21–25 April 2003; pp. 240–249. [Google Scholar] [CrossRef]
- Robertson, D.A.; Cassidy, S.L. Micro-Doppler and Vibrometry at Millimeter and Sub-Millimeter Wavelengths. In Proceedings of the SPIE Conference on Radar Sensor Technology XVII, Baltimore, MD, USA, 29 April–1 May 2013; pp. 87141C-1–87141C-8. [Google Scholar] [CrossRef]
- Simone, B.D.; Narayanan, R.M.; Watson, D.K.; Reichard, K.M.; Gallagher, K.A. Micro-Doppler Radar Characterization of Vehicle Vibration. In Proceedings of the SPIE Conference on Radar Sensor Technology XXVIII, National Harbor, MD, USA, 22–24 April 2024; pp. 130480R-1–130480R-18. [Google Scholar] [CrossRef]
- Chen, V.C. The Micro-Doppler Effect in Radar, 2nd ed.; Artech House: Norwood, MA, USA, 2019; p. 23. [Google Scholar]
- Cole, T.D.; El-Dinary, A.S. Estimation of Target Vibration Spectra from Laser Radar Backscatter Using Time-Frequency Distributions. In Proceedings of the SPIE Conference on Applied Laser Radar Technology, Orlando, FL, USA, 15–16 April 1993; pp. 90–103. [Google Scholar] [CrossRef]
- Chen, V.C. Analysis of Radar Micro-Doppler with Time-Frequency Transform. In Proceedings of the Tenth IEEE Workshop on Statistical Signal and Array Processing, Pocono Manor, PA, USA, 14–16 August 2000; pp. 463–466. [Google Scholar] [CrossRef]
- Liu, L.; McLernon, D.; Ghogho, M.; Hu, W. Micro-Doppler Extraction from Ballistic Missile Radar Returns Using Time-Frequency Analysis. In Proceedings of the 7th International Symposium on Wireless Communication Systems, York, UK, 19–22 September 2010; pp. 780–784. [Google Scholar] [CrossRef]
- Herr, D.B.; Tahmoush, D. Data-Driven STFT for UAV Micro-Doppler Signature Analysis. In Proceedings of the 2020 IEEE International Radar Conference (RADAR), Washington, DC, USA, 28–30 April 2020; pp. 1023–1028. [Google Scholar] [CrossRef]
- Tahmoush, D. Review of micro-Doppler signatures. IET Radar Sonar Navig. 2015, 9, 1140–1146. [Google Scholar] [CrossRef]
- Herr, D.B.; Kramer, T.J.; Gannon, Z.; Tahmoush, D. UAV Micro-Doppler Signature Analysis. In Proceedings of the 2020 IEEE Radar Conference (RadarConf20), Florence, Italy, 21–25 September 2020. [Google Scholar] [CrossRef]
- Izzo, A.; Ausiello, L.; Clemente, C.; Soraghan, J.J. Loudspeaker analysis: A radar based approach. IEEE Sens. J. 2020, 20, 1223–1237. [Google Scholar] [CrossRef]
- Kennedy, J.; Green, D.; Castro, J.O.; Faust, A.A.; Ma, Y.; Ghasemigoudarzi, P.; Circelli, M.; Henschel, M.D. Measurements of micro-Doppler signals induced by acoustic stimulation. IEEE Instrum. Meas. Mag. 2022, 25, 37–41. [Google Scholar] [CrossRef]
- Yasuda, K.; Tsuyuhara, T.; Saho, K.; Masugi, M. Micro-Doppler radar-based gait classification of common pedestrians and smartphone zombies. IEEJ Trans. Electr. Electron. Eng. 2023, 18, 1547–1549. [Google Scholar] [CrossRef]
- Saho, K.; Shioiri, K.; Kudo, S.; Fujimoto, M. Estimation of gait parameters from trunk movement measured by Doppler radar. IEEE J. Electromagn. RF Microw. Med. Biol. 2022, 6, 461–469. [Google Scholar] [CrossRef]
- Narayanan, R.M.; Tsang, B.; Bharadwaj, R. Classification and discrimination of birds and small drones using radar micro-Doppler spectrogram images. Signals 2023, 4, 337–358. [Google Scholar] [CrossRef]
- Simone, B.D. Micro-Doppler Radar Characterization of Vehicle Vibrations. Master’s Thesis, The Pennsylvania State University, University Park, PA, USA, 10 August 2024. [Google Scholar]
- Lutzmann, P.; Frank, R.; Hebel, M.; Ebert, R. Potential of Remote Laser Vibration Sensing for Military Applications. In Proceedings of the NATO Research and Technology Organisation (RTO) Systems Concepts and Integration (SCI) Symposium, Brussels, Belgium, 19–20 April 2004; Available online: https://www.sto.nato.int/publications/STO%20Meeting%20Proceedings/RTO-MP-SCI-145/MP-SCI-145-24.pdf (accessed on 24 January 2025).
- Aranchuk, V.; Sabatier, J.; Ekimov, A.; Mack, R. Standoff Detection of Obscured Vehicle with Laser Doppler Vibrometer. In Proceedings of the SPIE Conference on Detection and Sensing of Mines, Explosive Objects, and Obscured Targets XIV, Orlando, FL, USA, 13–17 April 2009. [Google Scholar] [CrossRef]
- Ciattaglia, G.; Iadarola, G.; Minelli, L.; Pimpini, F.; Tridenti, N.; Senigagliesi, L.; Spinsante, S.; Gambi, E. Analysis of vehicle vibration through automotive radar signal. In Proceedings of the 2022 IEEE International Workshop on Metrology for Automotive (MetroAutomotive), Modena, Italy, 4–6 July 2022; pp. 105–110. [Google Scholar]
Disclaimer/Publisher’s Note: The statements, opinions and data contained in all publications are solely those of the individual author(s) and contributor(s) and not of MDPI and/or the editor(s). MDPI and/or the editor(s) disclaim responsibility for any injury to people or property resulting from any ideas, methods, instructions or products referred to in the content. |
© 2025 by the authors. Licensee MDPI, Basel, Switzerland. This article is an open access article distributed under the terms and conditions of the Creative Commons Attribution (CC BY) license (https://creativecommons.org/licenses/by/4.0/).