Article

Performance of G3-PLC Channel in the Presence of Spread Spectrum Modulated Electromagnetic Interference

1
Electronic Engineering & Applied Computer Science, Academy Life Science, Engineering & Design, Saxion University of Applied Sciences, 7513 AB Enschede, The Netherlands
2
Electrical Engineering, Mathematics and Computer Science (EEMCS), University of Twente, 7522 NB Enschede, The Netherlands
3
Institute of Automatics, Electronics and Electrical Engineering, University of Zielona Gora, 65-417 Zielona Góra, Poland
4
Department of Electronics and Telecommunications Torino, Politecnico di Torino, 10129 Torino, Italy
*
Author to whom correspondence should be addressed.
Signals 2025, 6(3), 33; https://doi.org/10.3390/signals6030033
Submission received: 30 May 2025 / Revised: 26 June 2025 / Accepted: 1 July 2025 / Published: 17 July 2025

Abstract

Power converters in the smart grid systems are essential to link renewable energy sources with all grid appliances and equipment. However, this raises the possibility of electromagnetic interference (EMI) between the smart grid elements. Hence, spread spectrum (SS) modulation techniques have been used to mitigate the EMI peaks generated from the power converters. Consequently, the performance of the nearby communication systems is affected under the presence of EMI, which is not covered in many situations. In this paper, the behavior of the G3 Power Line Communication (PLC) channel is evaluated in terms of the Shannon–Hartley equation in the presence of SS-modulated EMI from a buck converter. The SS-modulation technique used is the Random Carrier Frequency Modulation with Constant Duty cycle (RCFMFD). Moreover, The analysis is validated by experimental results obtained with a test setup reproducing the parasitic coupling between the PLC system and the power converter.

1. Introduction

After the Paris climate agreement, all the EU countries committed to strict yearly targets in terms of CO2 emissions reduction, energy conservation, and the adoption of clean energy sources. Aiming to meet such ambitious energy sustainability goals, smart grid solutions have become more and more frequently adopted to effectively manage energy generation, transfer, and storage systems. With the expansion of the smart grid, communications between the increasing number of smart devices connected to the grid are essential, and any interruption or transmission error could lead to significant losses. In this context, Power Line Communication (PLC) is one of the most commonly used approaches for communication networks, as it does not require extra infrastructure for data transfer.
Modern smart grid communication systems face several key challenges, primarily due to signal repetition, protocol incompatibility, and electromagnetic interference (EMI) [1]. Major contributors to EMI include switching-mode power converters [2,3], LED lighting [4], and energy storage systems (ESS) [5]. Among these, switching-mode power converters are particularly problematic, as they can significantly disrupt smart grid communication. Studies such as [6,7] highlighted how the conducted EMI from nearby equipment can impair Power Line Communication (PLC), sometimes causing smart meter malfunctions. This issue stems from the fact that both smart meters and switching-mode converters operate within the CISPR A narrowband frequency range (9–150 kHz), making them especially vulnerable to interference [8]. As a result, PLC system performance may degrade, leading to data transmission failures.
A number of researchers have been investigating techniques to reduce the emissions of switching-mode converters. Some researchers proposed the utilization of power filters. However, this can be costly and require additional space [9,10]. A different approach proposes to reduce emissions of switching-based devices by modulating the switching signals by Spread Spectrum (SS) modulation techniques [11,12,13]. This approach is particularly attractive since it comes almost for free, with no need for additional circuits. SS modulations vary the switching pattern of power converters by spreading the EMI power over a definite frequency range. Based on the literature, many variables can be controlled in SS modulations, namely the switching frequency [14], phase shift [15], duty cycle [16], or a combination of them [17,18].
While the advantage of SS reduction in the measured emission peaks is clear, their practical effectiveness in reducing the interfering potential of switching signals is a more controversial matter. In particular, the influence of SS-modulated EMI on communication systems has been studied in many research studies, giving contradicting results. In [19], it is shown that the SS modulation has no advantage over the conventional modulation, and both modulation techniques have the same effect on the performance of the serial communication system. Other research shows that it is important to tune the SS parameters properly to avoid the spreading of emissions to levels that cause more transmitted data losses as presented in [20,21]. The shape of the generated EMI depends mainly on parameters like the modulation switching frequency, the bandwidth of the used SS modulation, the rate of change between frequencies, or the phase shift. Consequently, the behavior of the victim channel changes extremely with the chosen SS parameters setting.
This paper investigates the effect of the buck converter while using SS modulation on G3-PLC performance. The Shannon capacity equation is used to evaluate the performance of the communication system under the SS-modulated EMI. The utilized SS in this paper is Random Carrier Frequency Modulation with Constant Duty cycle (RCFMFD), while controlling three variables (spreading factor, modulating signal profile, and modulating signal sampling frequency). In [22], the authors assessed the validity of the Shannon–Hartley equation when altering a single parameter—the spreading factor ( α )—and its impact on G3-PLC system performance. In contrast, this paper aims to investigate how variations in the modulating signal profile and the modulating signal sampling frequency affect the G3-PLC system performance using the same equation.
The paper is as follows: Section 2 illustrates the SS-modulation technique theory, the variable that can be controlled to create the randomized pattern. Section 3 explains the PLC system types, components, and operation. Section 4 and Section 5 provide the experimental setup and results, respectively, while Section 6 summarizes the work performed, concludes, and discusses the future work.

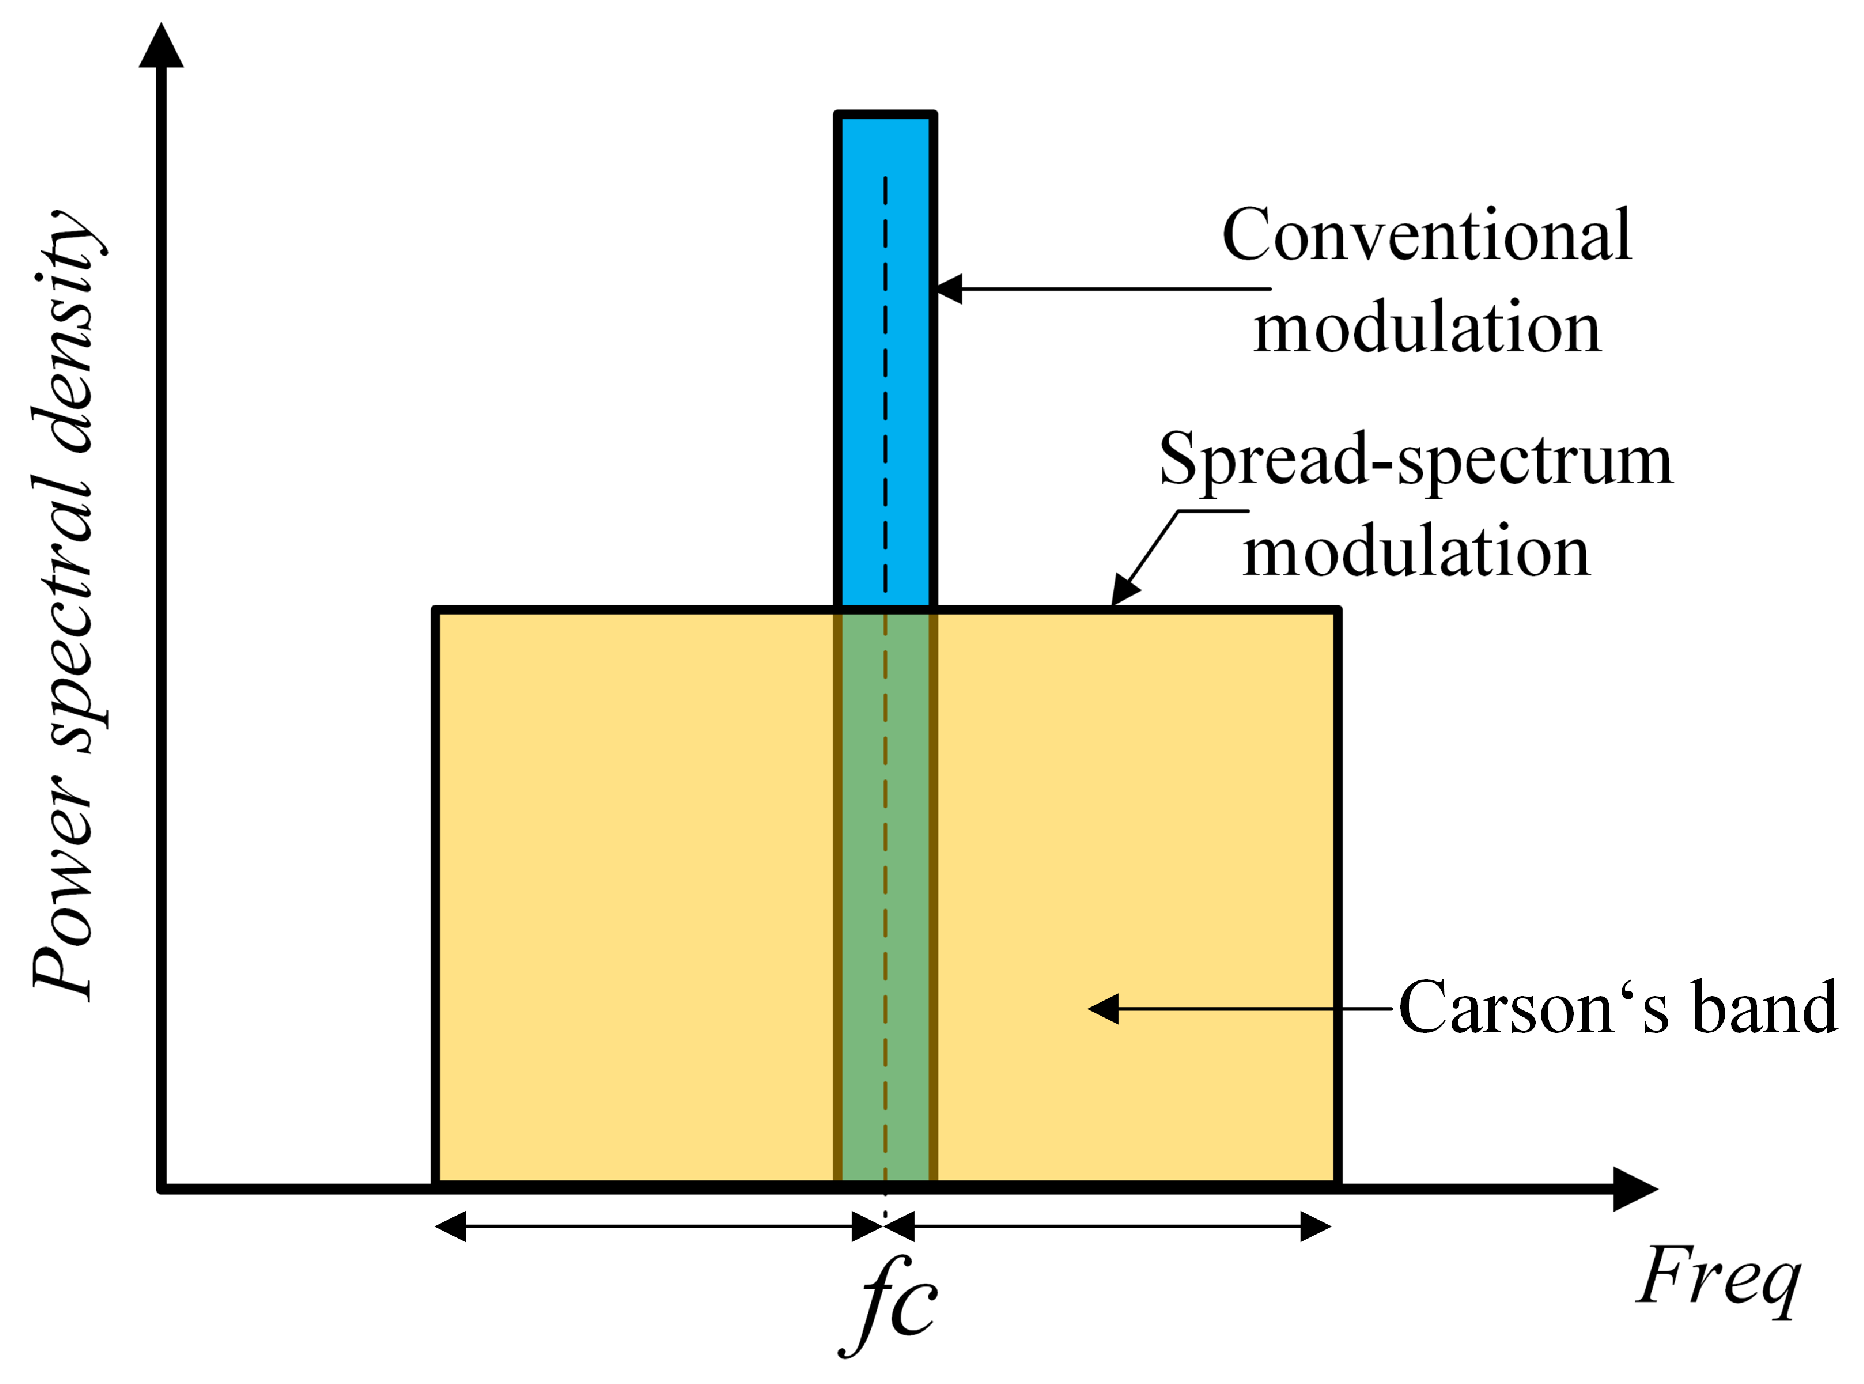
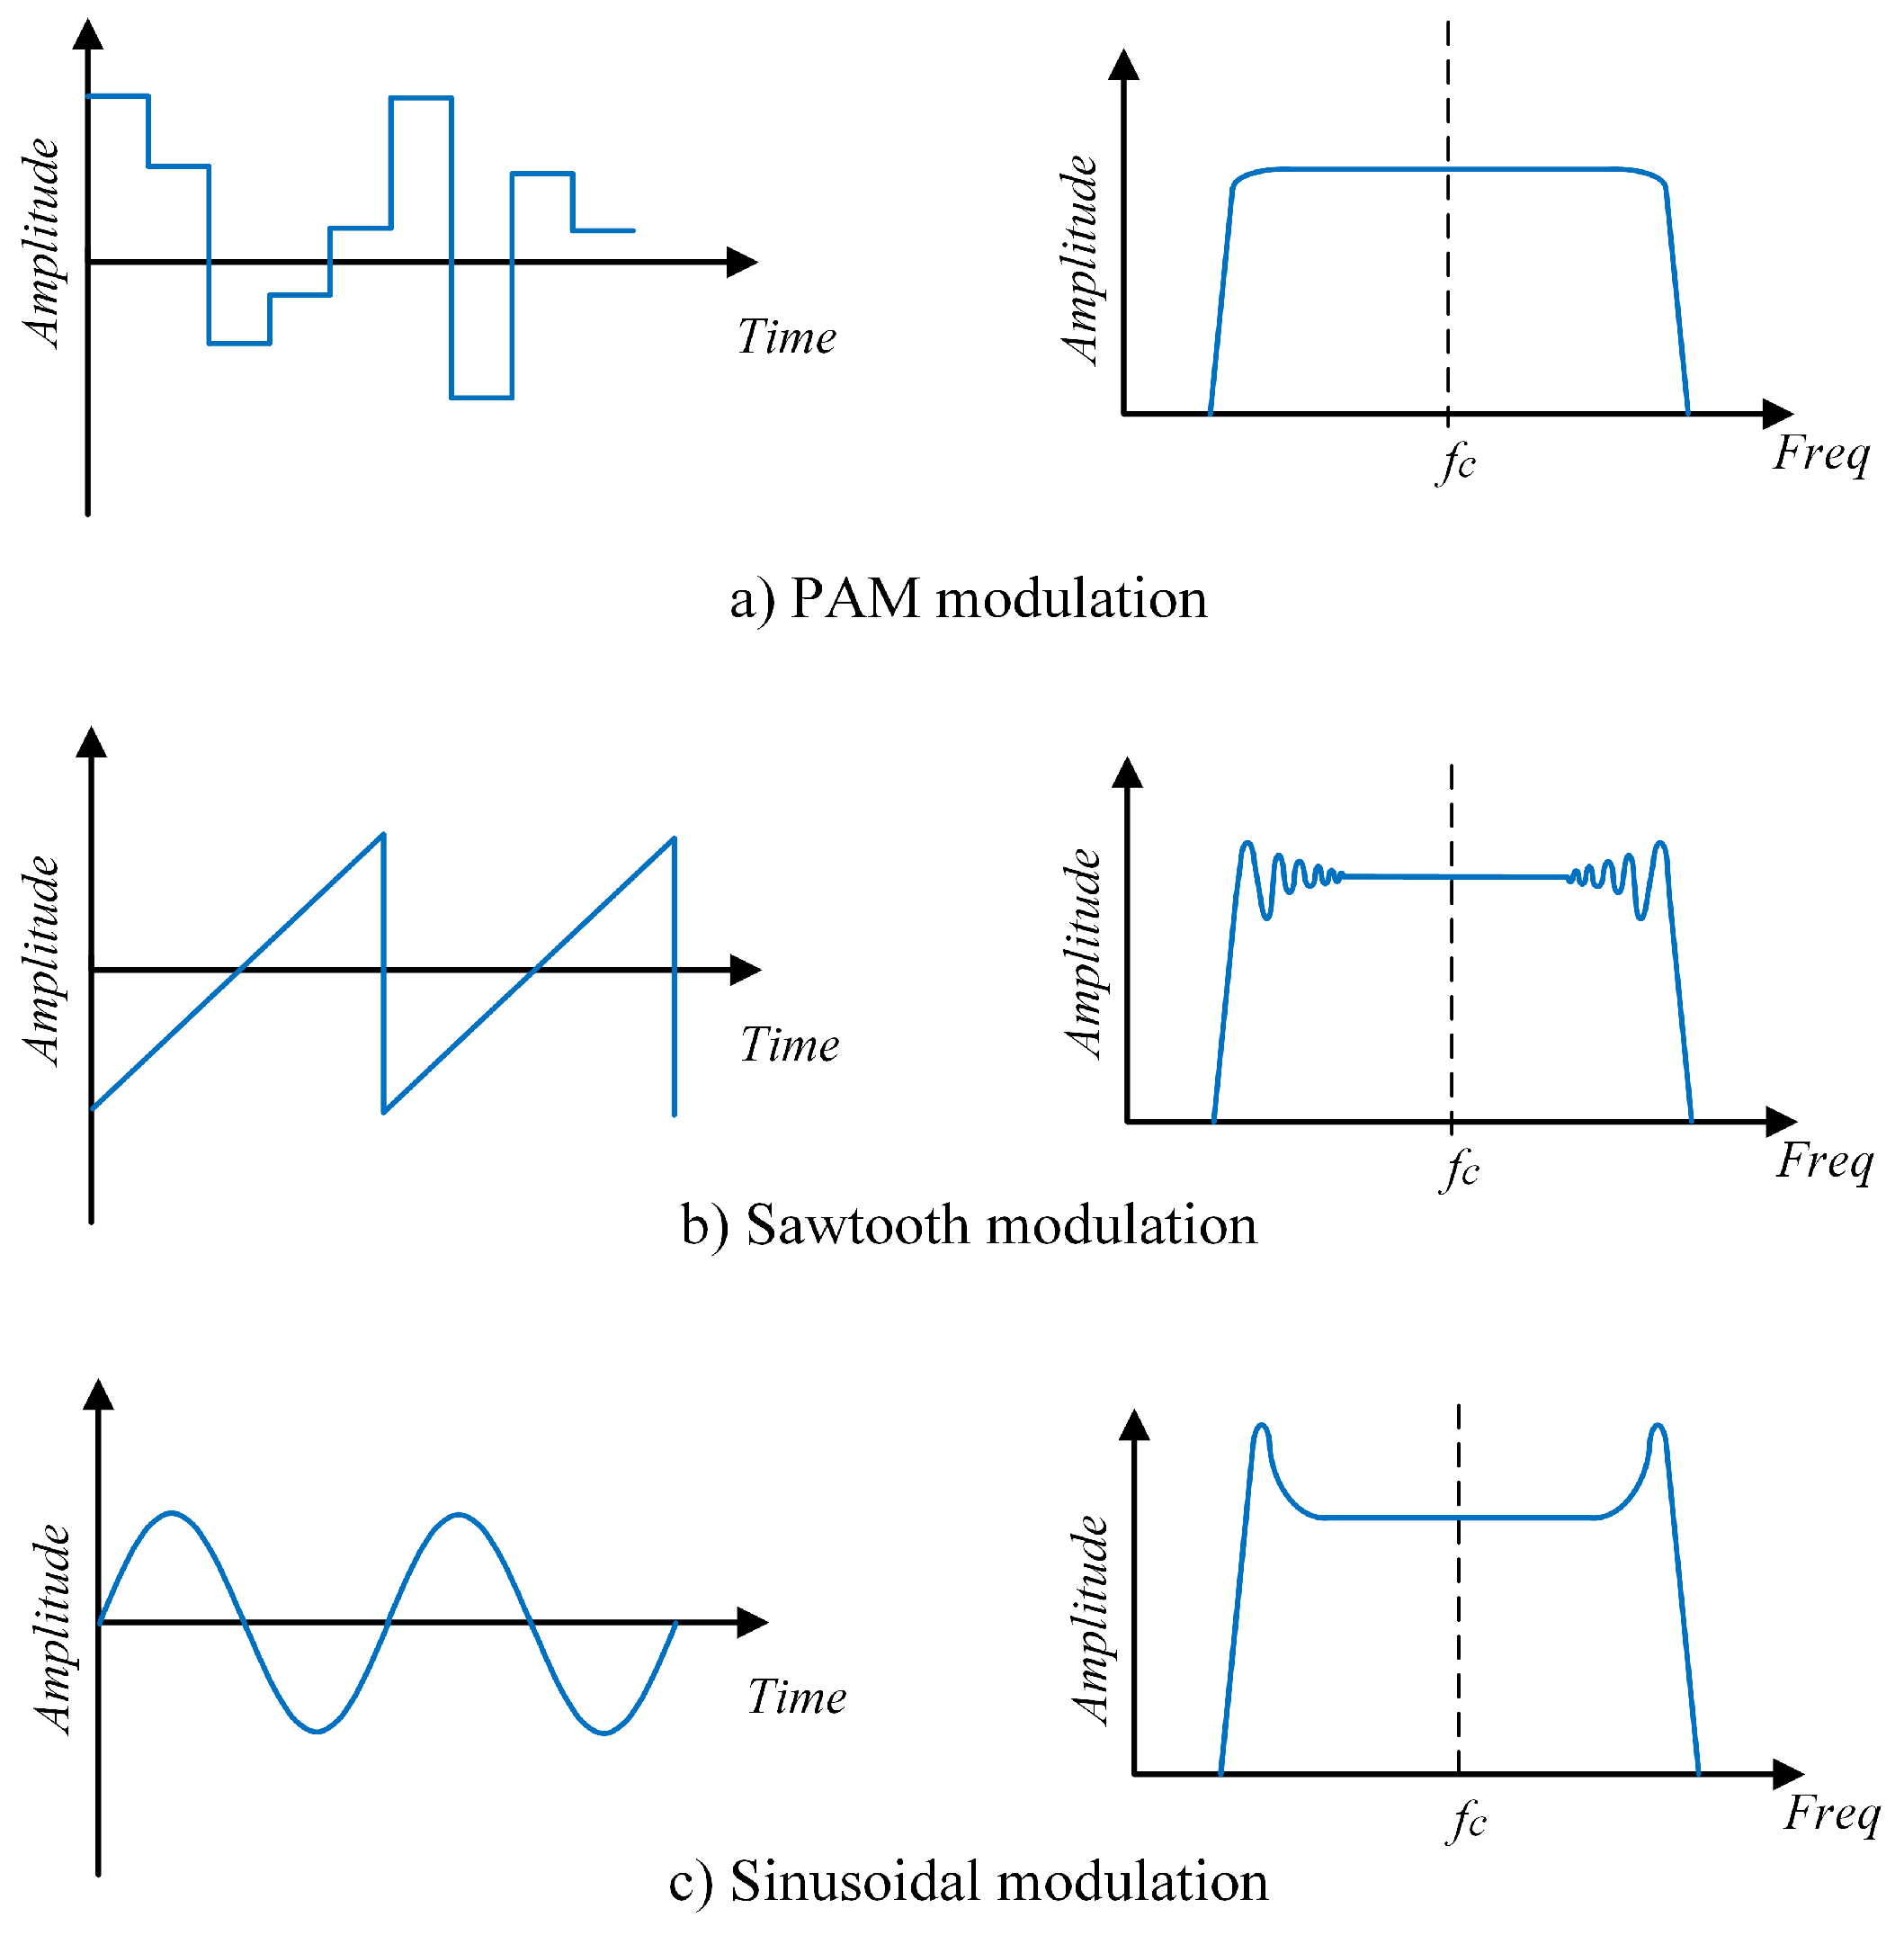
2. Converter Modulation

The converter Pulse Width Modulation (PWM) is categorized in most cases by a constant parameters like constant duty cycle and switching frequency, which leads to specific narrowband EMI at specific given frequency as shown in Figure 1. However, in the case of the spread spectrum (SS) modulation, one or more parameters could be changed in order to provide a mitigation in the generated EMI by distributing the power of the signal over a wide range of frequencies. Based on the literature [11], the SS-modulation techniques could be divided into four main types:
  • Random Carrier Frequency Modulation with Constant Duty cycle (RCFMFD) [21,22,23,24,25,26].
  • Random Carrier Frequency Modulation with Variable Duty cycle (RCFMVD) [18].
  • Randomized Pulse Width Modulation (RPWM) [20].
  • Randomized Pulse Position Modulation (RPPM) [16].
In this paper, the RCFMFD is chosen as the most common SS-modulation technique used in a lot of applications. This technique works by changing the switching frequency within a certain bandwidth, following a certain pattern as shown later in this paper. The carrier frequency f c varies for every nth impulse according to a modulating signal ε ( t ) . The signal of the carrier signal could be represented in the time domain as [13]
S t = A c cos ( 2 π f c t + 2 π Δ f t ε ( t ) d t )
Δ f = α f c
where A c is the amplitude of the carrier frequency, Δ f is the frequency deviation around the main switching frequency, α is the spreading factor used to set the required frequency bandwidth, i.e., the Carson bandwidth of the switching signal [ f c Δ f / 2 , f c + Δ f / 2 ] as shown in Figure 1. The increase in the α value increases signal bandwidth and decreases its spectral amplitude. The SSM signal can be expressed in terms of its Fourier series as
S s s t = k = A k e j ( 2 π k f c t + j 2 π k Δ f t ε ( t ) d t ) ,
Consequently, the power spectral density of the EMI of the signal S s s t will be expressed as [14]
S s s f = H ( f ) 2 k = | A k | 2 γ f k f c k Δ f ,
where H ( f ) is the transfer function of the EMI coupling, and γ ( x ) is the amplitude probability density function of the spread function. The power spectral density of the EMI in Equation (5) is limited by the EMI standards for CISPRA Range which is between 9 KHz and 150 KHz.
In the same context, as ε ( t ) is the modulating signal, ε ( t ) is changing by a certain sampling frequency f s , which sets the instantaneous frequency of the PWM signal. The function of the modulating signal ε ( t ) could be sinusoidal, triangular, or a RandomPAM signal [13]. Thus, the modulating signal profile is formed by a punch of points that form the required shape, which form the shape with a certain modulating signal frequency f m . The shape of the spectrum could be controlled in terms of the modulation index β , controlled by both Δ f and f m and equal to
β = Δ f f m ,
The resulting spectrum varies according to the modulating signal pattern is shown in Figure 2.

3. Power Line Communication Systems

Smart metering systems commonly utilize two types of communication protocols: G3-PLC and the PRIME protocol. Both systems use the Orthogonal Frequency Division Multiplexing (OFDM) scheme for sending the data. The procedure taken to achieve the OFDM technique for both PRIME and G3-PLC systems is the same despite the techniques settings being different [27].
As the PLC signal propagates, the signal attenuates with the increase in the line length. In addition, the presence of the noises interferes with the OFDM signal. There are several ways to evaluate the PLC channel performance. One way is to calculate the maximum allowable channel capacity data transmission rate in the presence of noises using the Shannon–Hartley equation. This method gives an accurate and similar rate as those achieved in practice by communication systems utilizing sophisticated channel codes such as the FEC codes adopted in G3-PLC and PRIME [28]. The capacity of the PLC channel is calculated from the Shannon–Hartley equation:
C G 3 = D min D max log 2 1 + S P L C f N f d f ,
In this context, D m i n and D m a x represent the frequency boundaries of the PLC bandwidth channel. The term S P L C ( f ) refers to the power spectral density (p.s.d) of the PLC signal, while N ( f ) denotes the total noise power spectral density. For this study, the total channel noise is defined as
N ( f ) = N 0 + S s s ,
N 0 represents the background noise p.s.d, modeled as Additive White Gaussian Noise (AWGN), and S s s corresponds to the power spectral density of the electromagnetic interference (EMI). Based on this, the percentage of channel capacity loss can be calculated as
C L o s s = C 0 C G 3 C 0 × 100 %
where C 0 represents the theoretical capacity of the PLC channel under ideal conditions where only AWGN is present. This value serves as the baseline for comparing the channel capacity when EMI is introduced under different spread spectrum (SS) parameter configurations.

4. Experimental Setup

This study examines how the shape of the modulation signal and the sampling frequency influence a G3-PLC transmission when the spreading factor is fixed. Building on the setup in [29], the communication link uses two Microchip PLC360 modems: one as the transmitter, and the other as the receiver joined by a 42 m single phase cable that forms a straightforward point-to-point channel. The signal’s bandwidth adheres to the G3-PLC specification, spanning 35 to 91 kHz (CENLEC A Standard), with a center (intermediate) frequency of 63 kHz . The G3-PLC settings are as follows: the modulation is DBPSK, and the use of DQPSK and D8PSK shows similar results to DBPSK. The total number of frames to send is 3000, the frame size is 65 byte, and the sub-carrier frequency is 1500 kHz.
Within the same test bed, a DC buck converter serves as the source of electromagnetic interference (EMI). Although such converters typically incorporate filters to suppress EMI, the filter is intentionally omitted here to explore how basic first-order oscillatory current mode impacts G3-PLC performance. Coupling between the converter and the communication circuit is introduced through a capacitance that mimics the parasitic capacitive link described in [29]. The capacitor value is 10 nF. The settings of the spread spectrum modulation are shown in Table 1.

5. Experimental Results

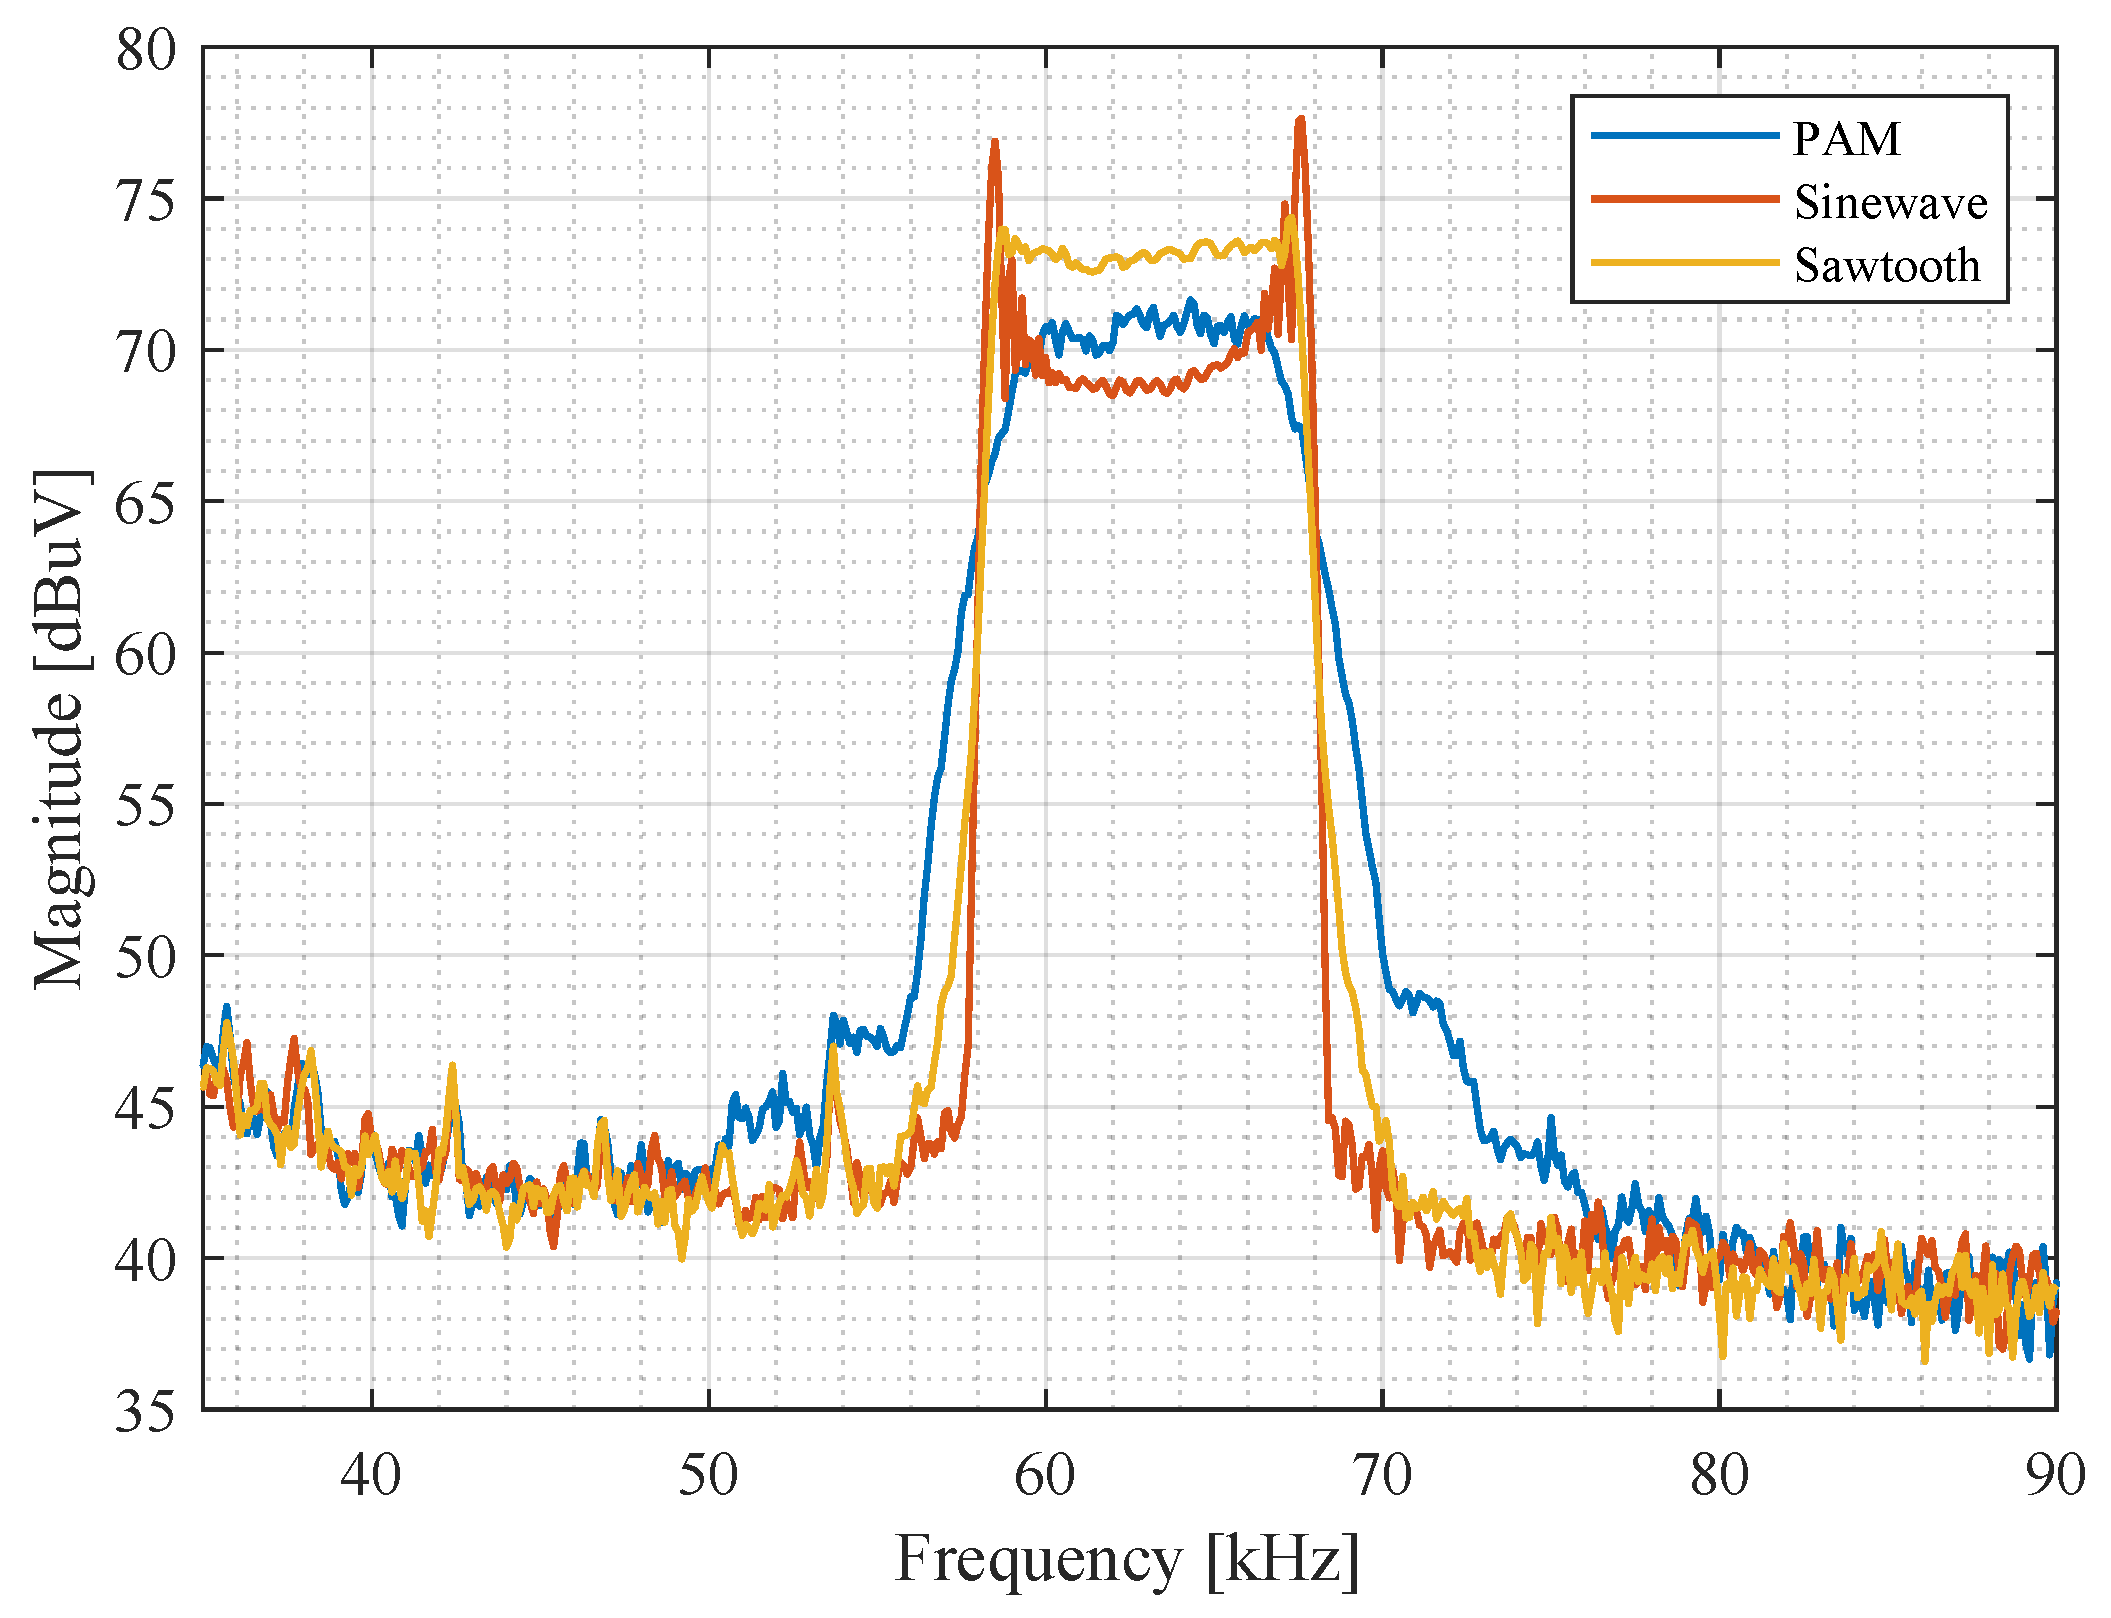
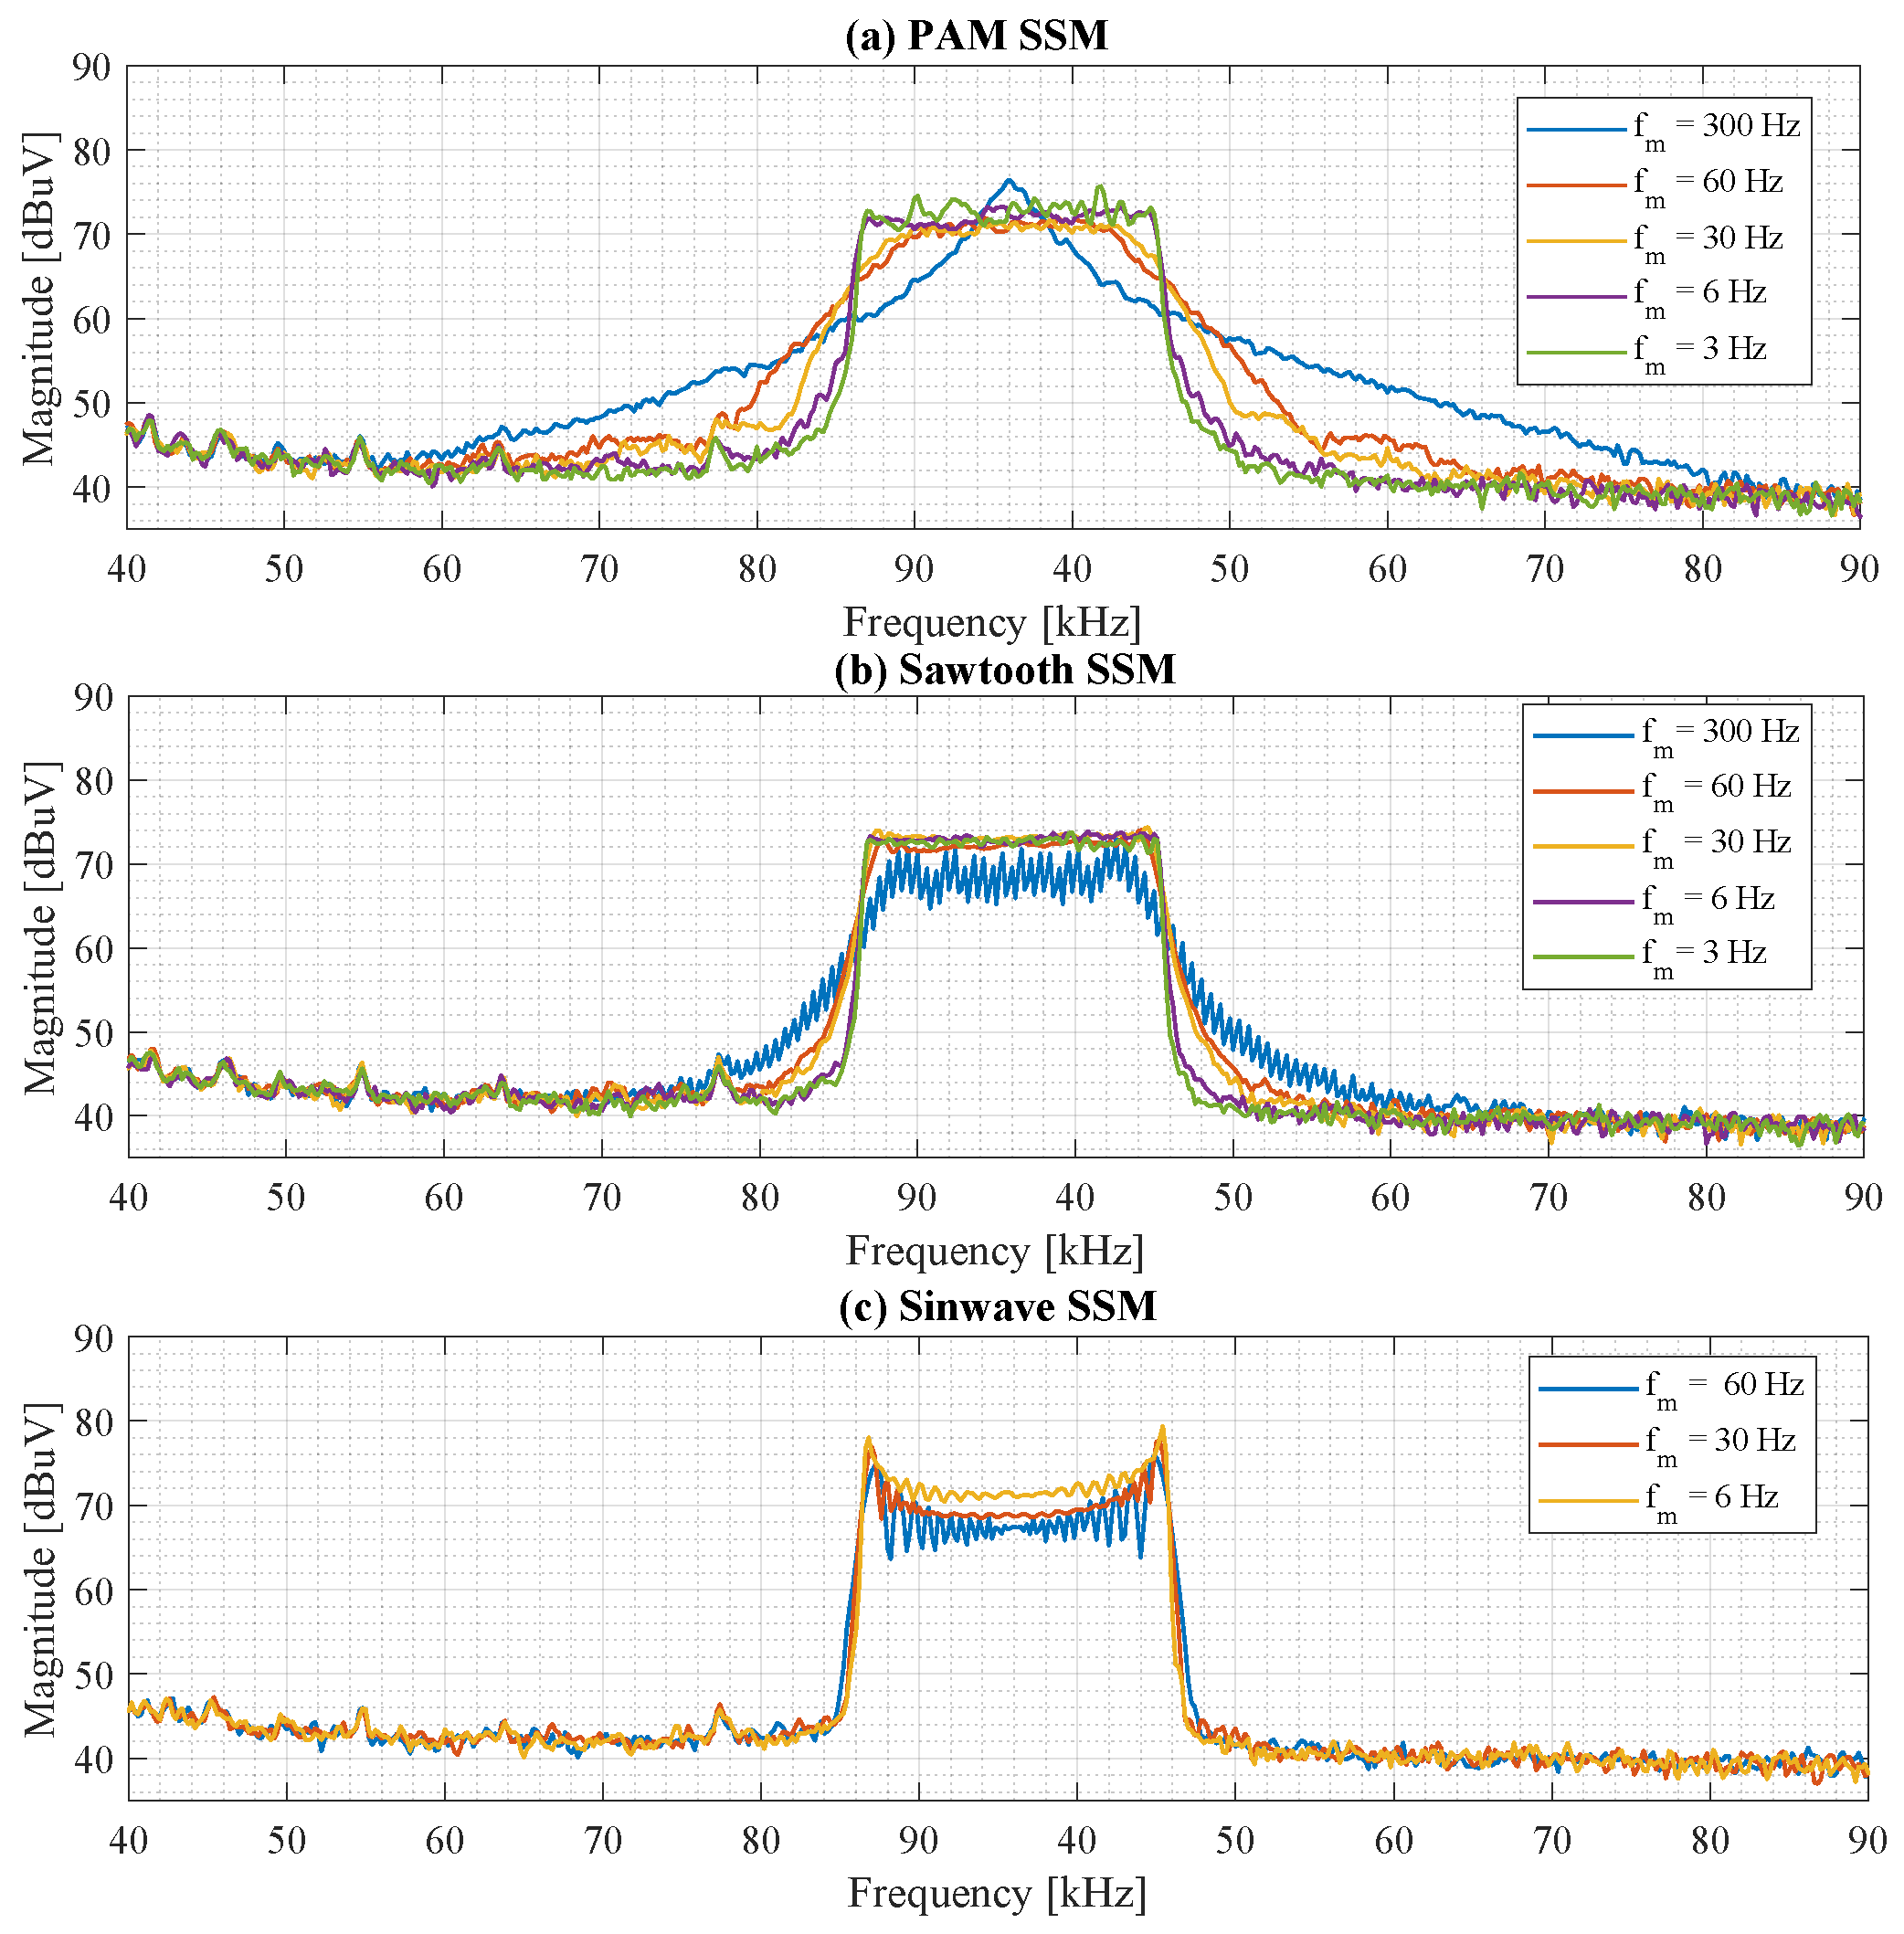
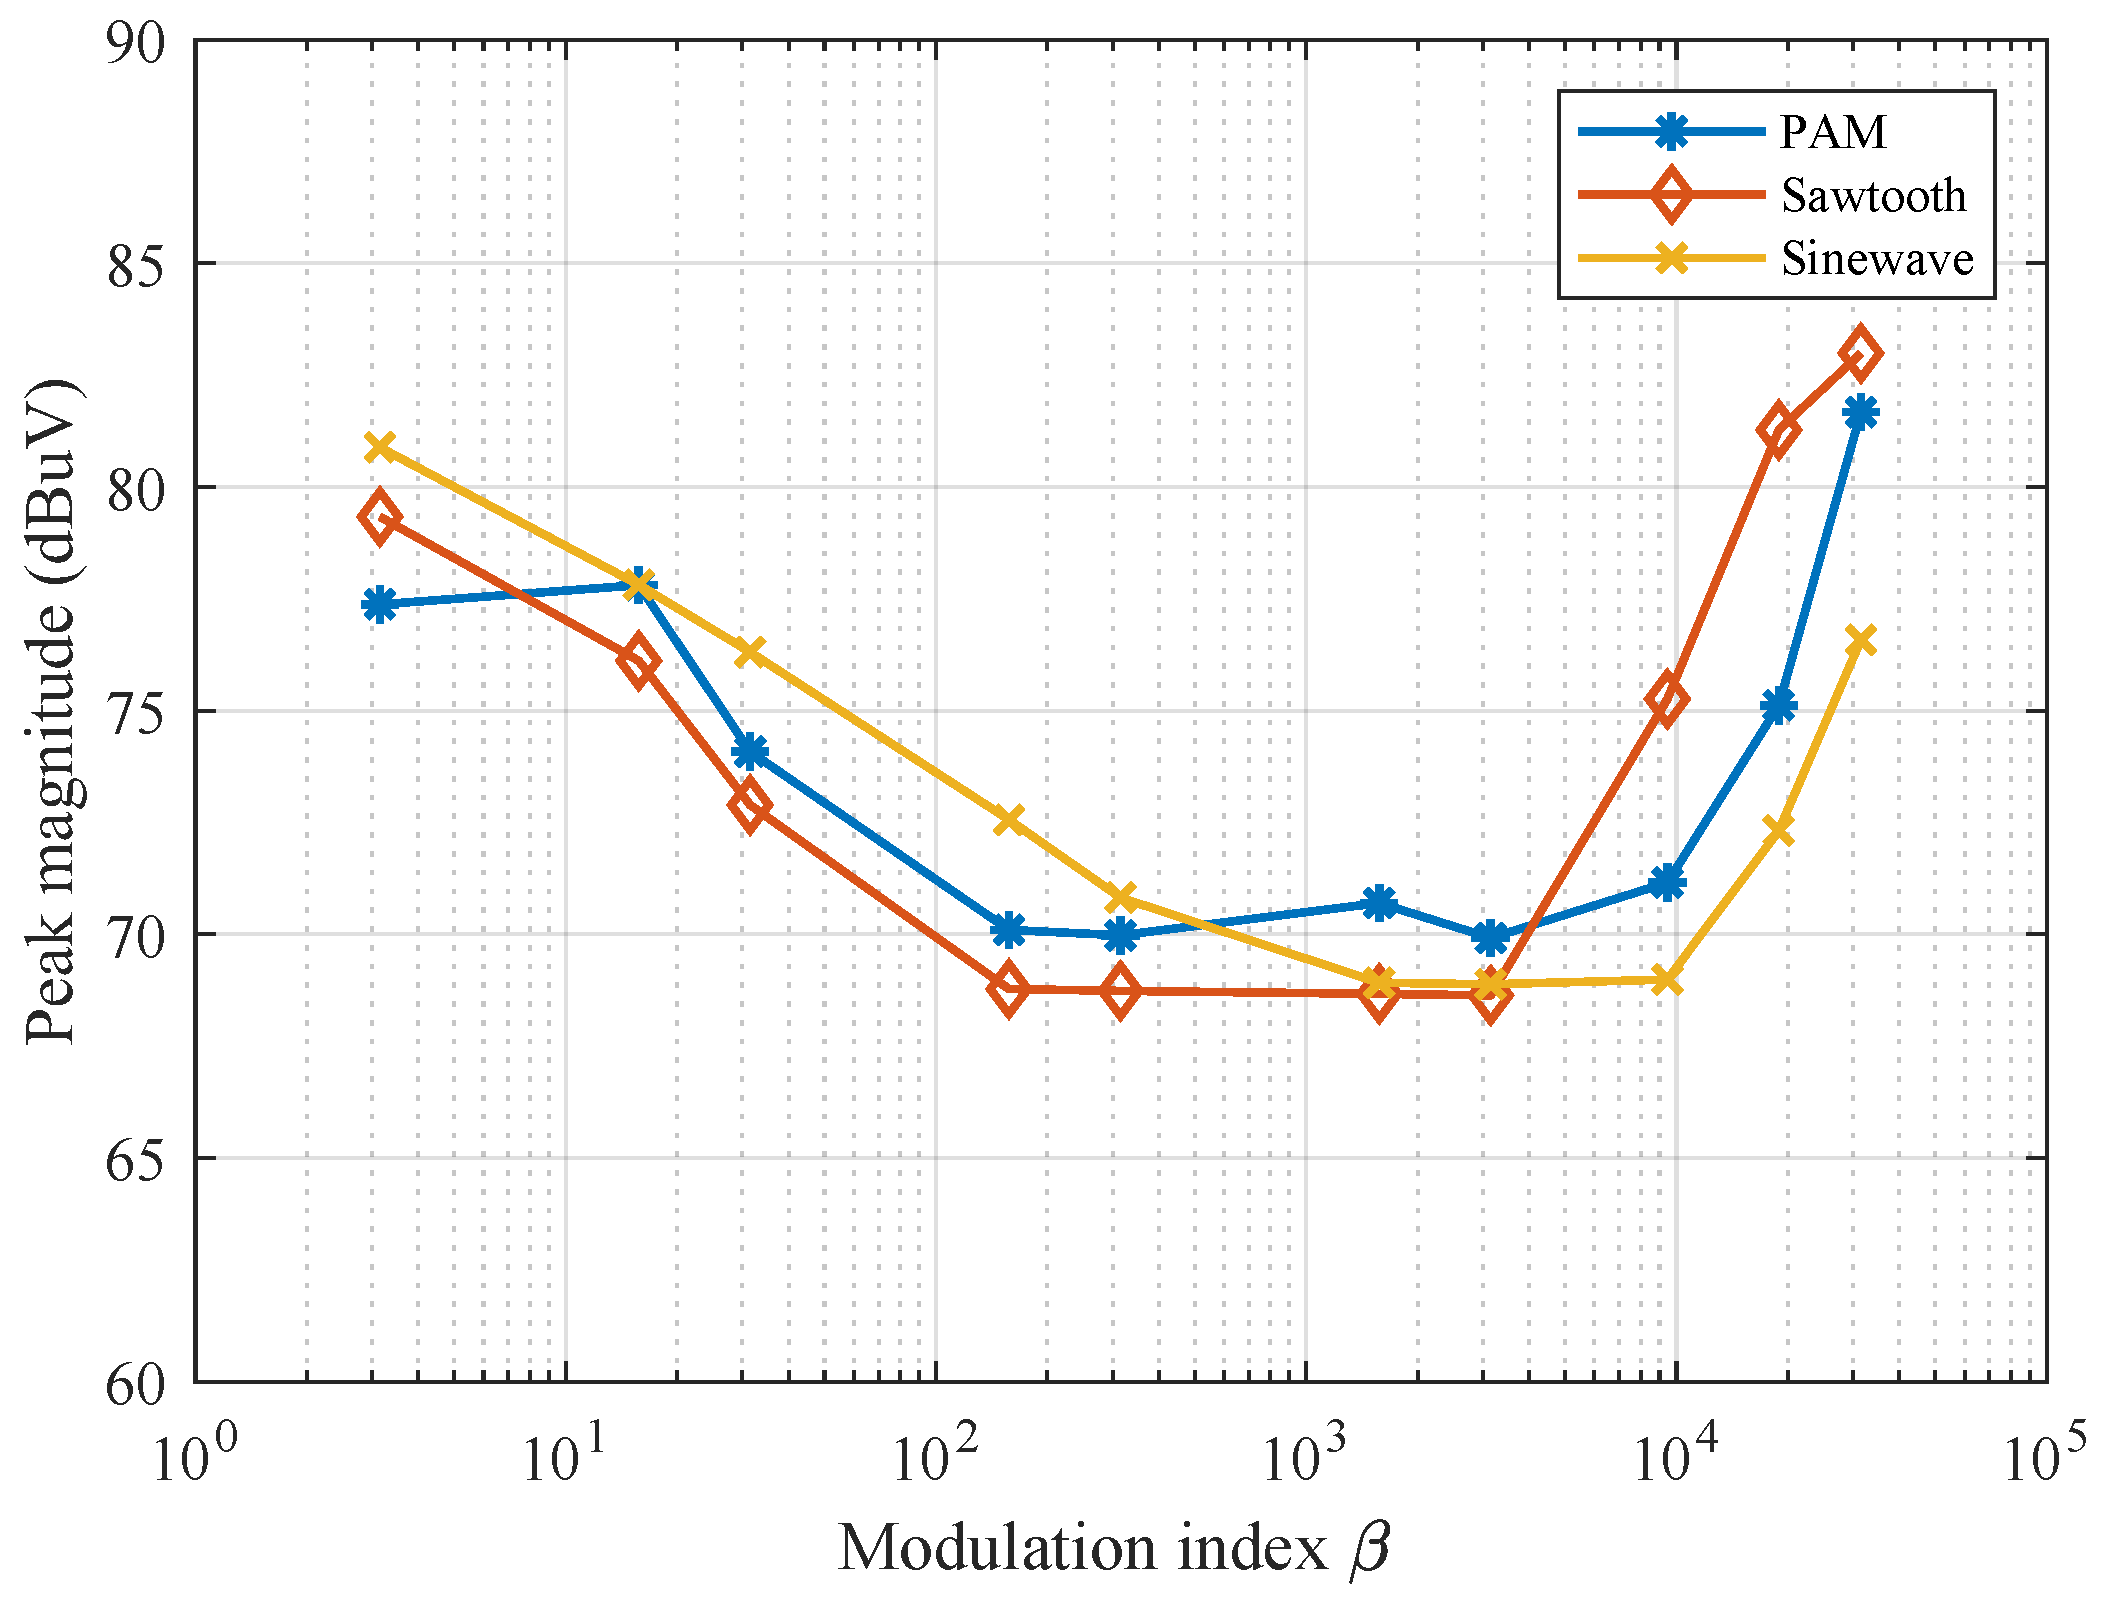
5.1. EMI Spectrum Measurements

All the EMI measurements are taken by the Gauss EMI receiver. The average detector (AV) was used with IFBW = 200 Hz (following the CISPR A standard value) and a dwell time of 100 ms.
In this work, we generate the modulating signal using 100 points distributed between −0.5 and 0.5, with a sampling interval T s between successive points. Figure 3 illustrates the voltage spectrum of the spread spectrum-modulated EMI measured on the PLC side when no PLC signal is transmitted. This measurement shows the EMI spectrum for three different modulating signal patterns, each applied at a modulating frequency f m of 30 Hz and with a fixed spreading factor of 15%. The bandwidth of the resulting EMI is regulated by adjusting the spreading factor α .
To demonstrate how the modulating frequency of the SS modulation works, a 2D spectrogram is presented in Figure 4, showing the three modulation patterns used in the experiment at a low modulating signal frequency of 0.3 Hz. As a result, the switching frequency varies very slowly in time, forming the used profile.
Figure 5 shows the output voltage spectrum of the SS-modulated EMI utilizing the RandomPAM, sawtooth, and sine wave modulating signals respectively while using different values of f m and constant α = 0.15 . The bandwidth of the SS modulation Δ f used is 63,000 × 0.15 = 9450 Hz.
Figure 6 shows the relation between the peak magnitude of the measured SS-modulated EMI in the case of using various values of β and α = 0.15. From the EMI standards point of view, the relation between the peak magnitude of the spectrum and the modulation index is not linear, and there is an optimum value of β for which maximum EMI reduction is achieved.

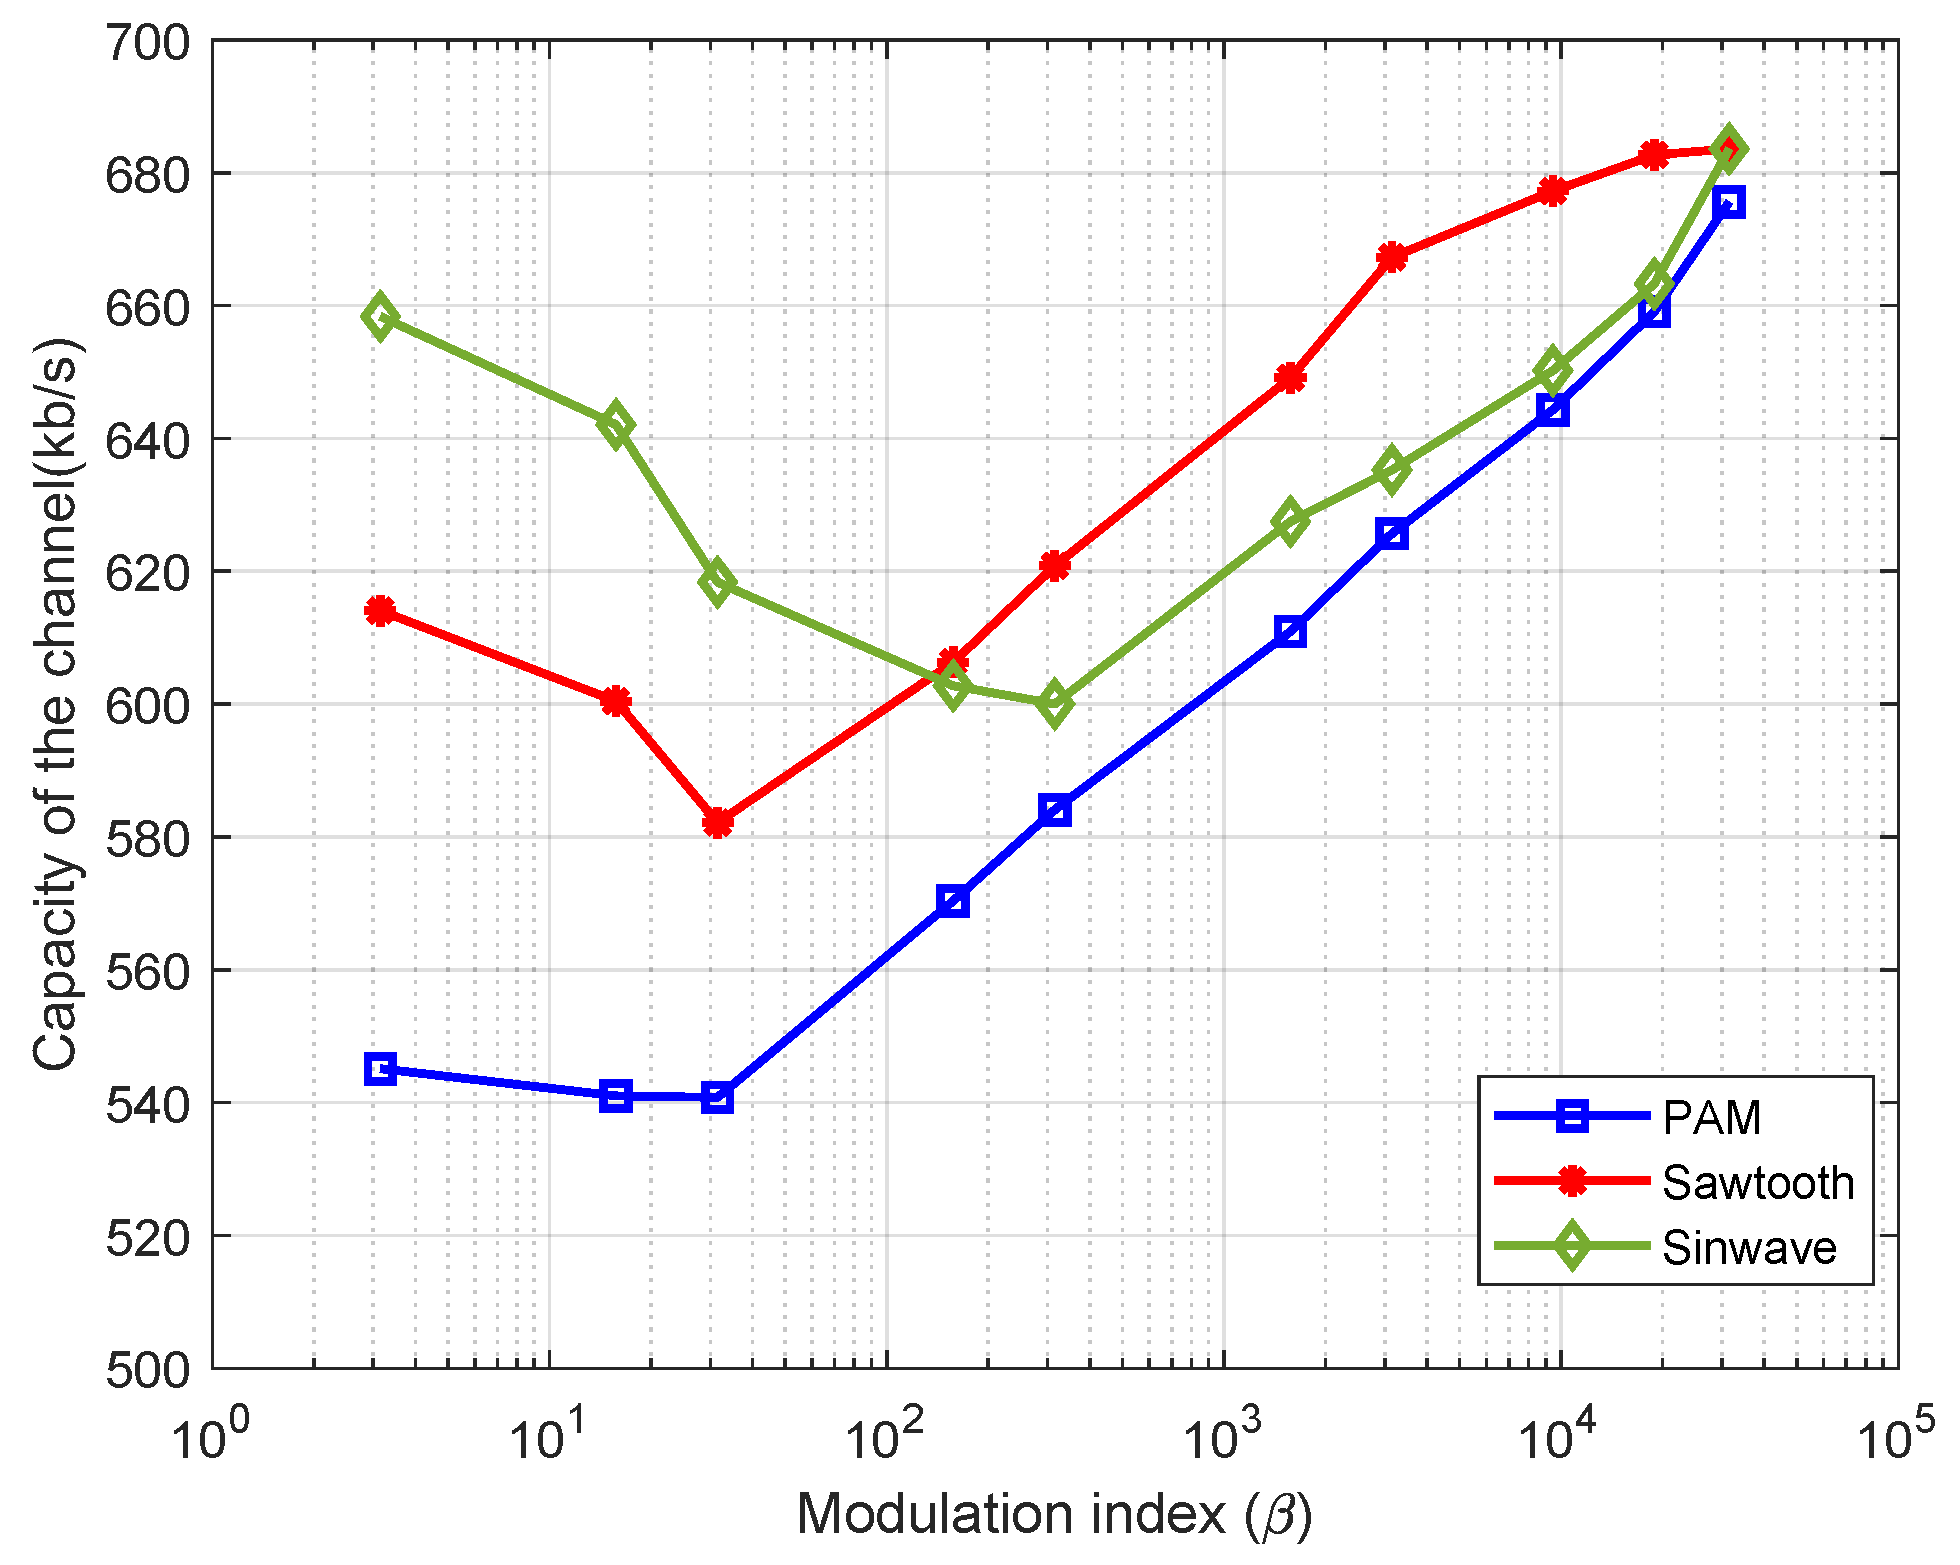
5.2. Channel Capacity Analysis

The results shown in Figure 5 are evaluated by the Shannon–Hartley equation, considering the PLC measured spectral density S P L C . Figure 7 illustrates how the channel capacity changes as the modulation index increases, while keeping the spreading factor constant at 15%. In the case of periodical signals (sawtooth and sine wave), it is noticed that the channel capacity decreases severely in the case of lower peaks of EMI, especially when the modulation index is between 30 and 3000. This occurs because, within this range, the sampling frequency of the modulating signal f s approaches the G3-PLC sub-carrier frequency ( f s u b = 1500 ). In contrast, for the non-periodic signal, the channel capacity loss decreases across the modulation index due to the random operation of the frequency change. Figure 8 shows the channel capacity loss percentage with the modulation index β .

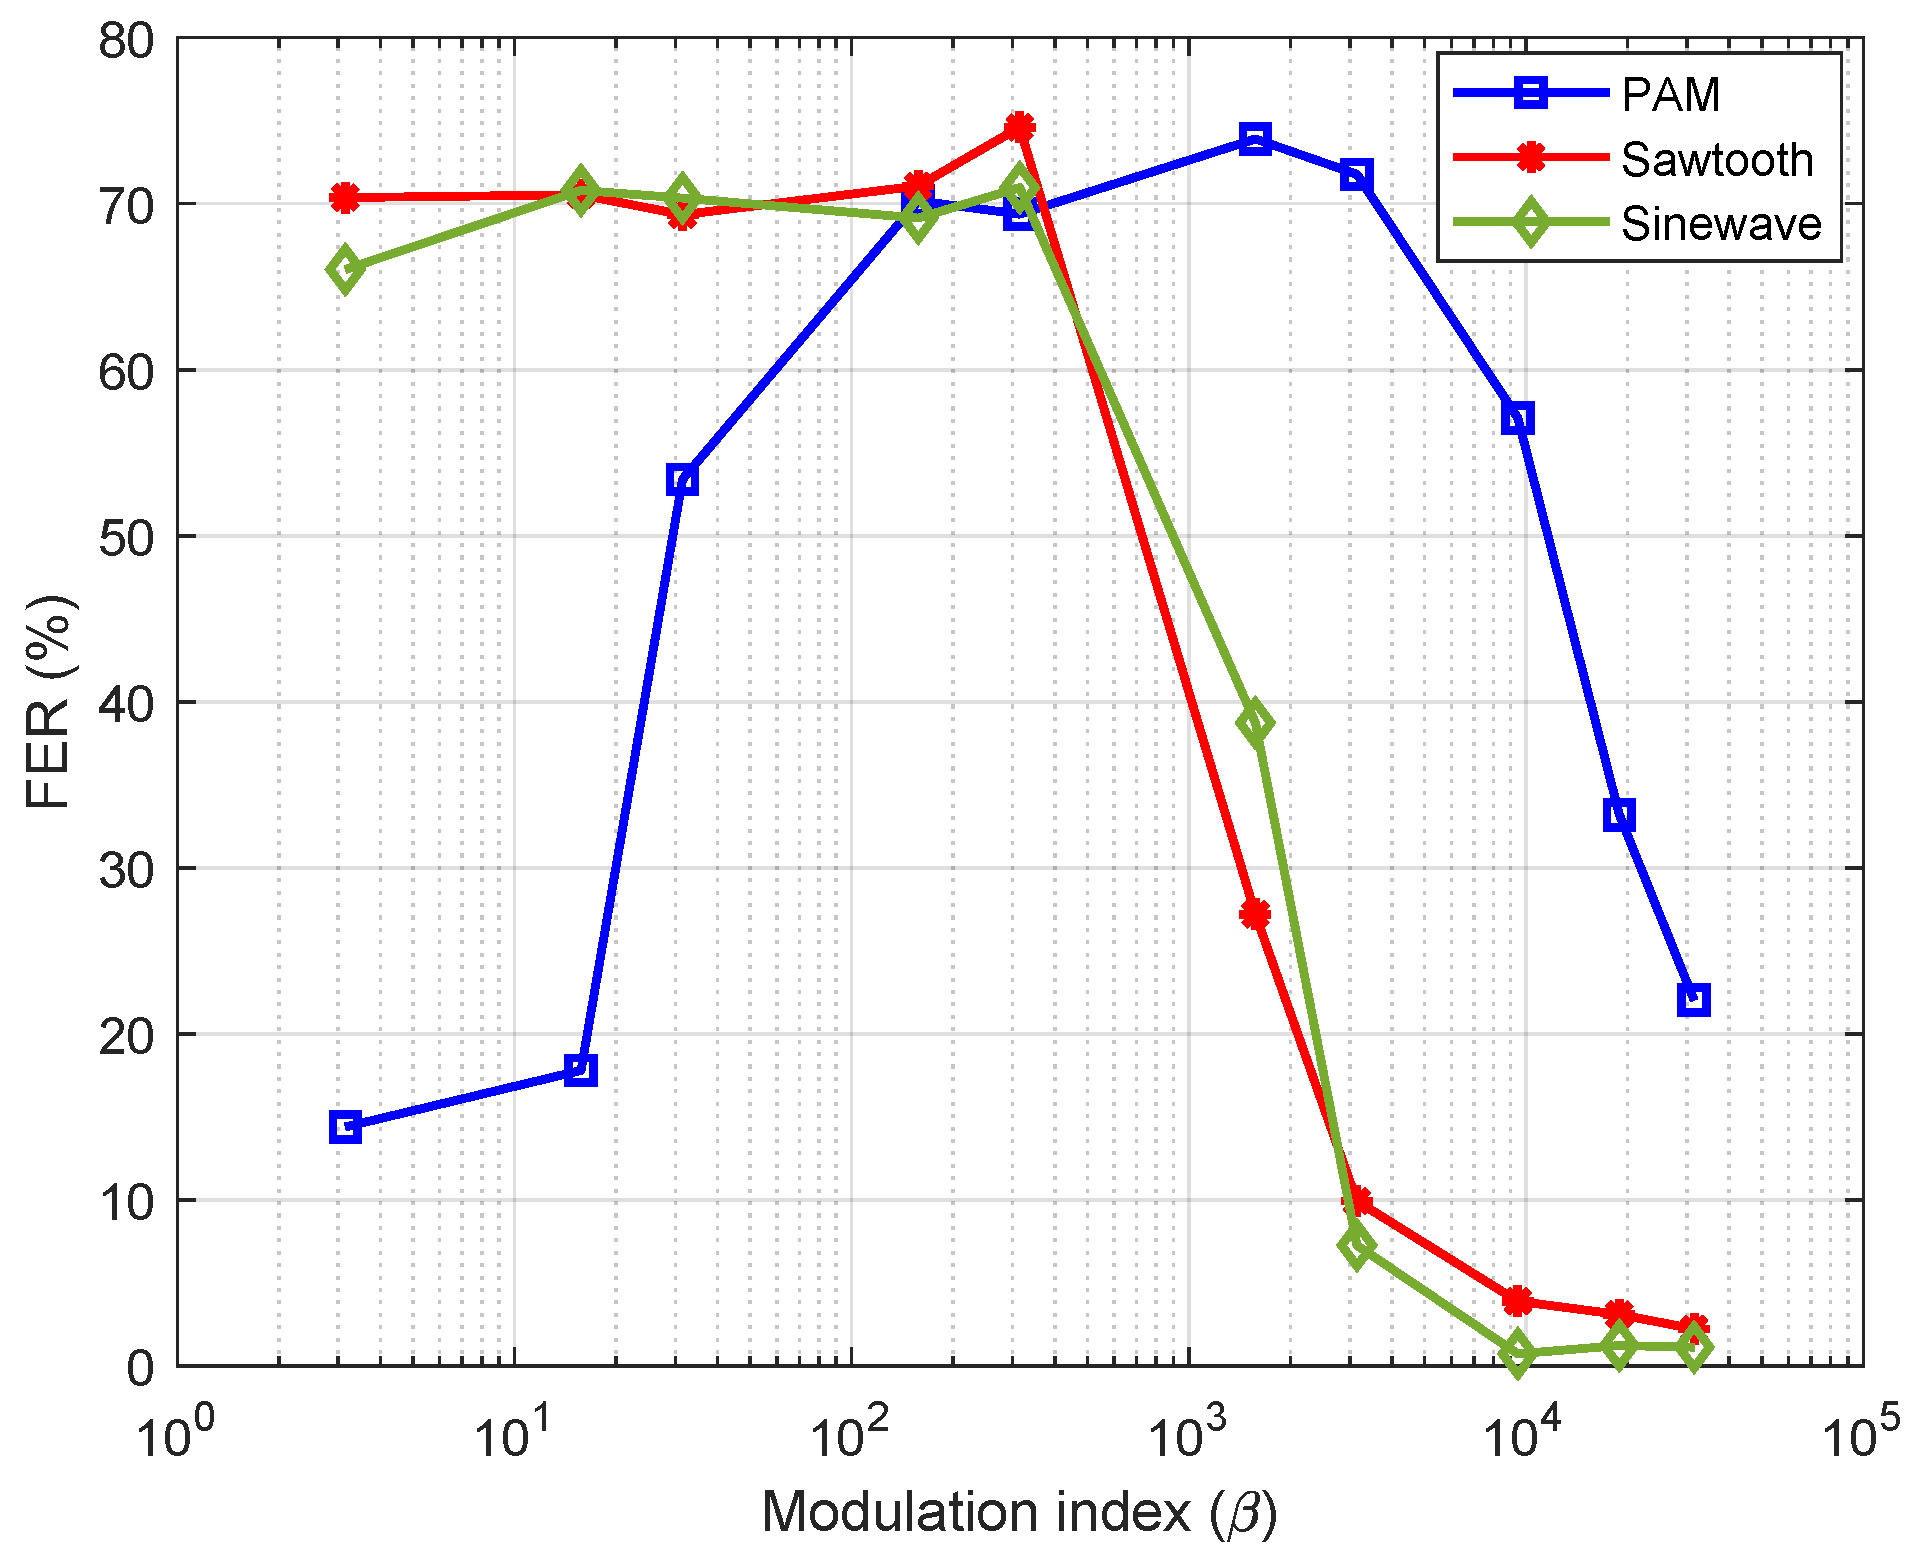
5.3. The PLC Performance in the Presence of EMI

Figure 9 show the Frame Error Rate (FER) percentage with the modulation index values in the case of using the utilized modulation signals in our setup, respectively. In case of using the periodical modulating signals sine wave, the FER performance confirms the results shown in Figure 7 and Figure 8, as both show high values of FER in the case of a low modulation index ( β < 315 ), as the sampling frequency of the modulating signal is higher than the sub-carrier frequency of the G3-PLC ( f s u b = 1500 ). Then, the FER decreases when the modulating signal sampling frequency becomes less than the sub-carrier frequency of the G3-PLC, at which the modulation index β becomes greater than 315.
In the case of a non-periodical signal like the RandomPAM one, the FER increases with the modulation index value until the sampling frequency of the modulating signal becomes near the sub-carrier frequency of the G3-PLC . Then, when the modulating signal sampling frequency decreases, the FER decreases as the frequency of the modulating signal becomes far away from the sub-carrier frequency of the G3-PLC.

5.4. Statistical Analysis

To validate the results from the Shannon–Hartley equation, a correlation factor is calculated between the calculated channel capacity and the measured FER percentage. The Pearson’s correlation coefficient is one of the common tool used to analyze the linearity between the parameters [31].
The correlation factor analysis results are presented in Table 2. The correlation factor is calculated for the data obtained using the three different modulating signal patterns. For the sawtooth signal, the correlation factor between the channel capacity and FER is −0.954, indicating a strong linear relationship—as the channel capacity increases, FER decreases accordingly. In the case of the sine wave signal, the correlation factor is −0.6551, which, although lower than that of the sawtooth, still reflects a significant negative linear correlation. On the other hand, for the PAM signal, the correlation factor is 0.07009, indicating that there is no meaningful relationship between the calculated channel capacity and FER in this case.

6. Conclusions

This paper investigated the impact of spread spectrum-modulated EMI from a buck converter on G3-PLC channel performance using the Shannon–Hartley equation. The EMI characteristics depend on the change of three parameters of the utilized SS technique: spreading factor, modulating signal profile, and sampling frequency. The study found that the channel capacity equation effectively predicts PLC performance for periodic modulation patterns but fails for non-periodic patterns like RandomPAM, especially at higher modulating frequencies. Both modulation types increase FER probability when the sampling frequency approaches the G3-PLC sub-carrier frequency. Future work will focus on optimizing SSM parameter selection for communication systems.

Author Contributions

Conceptualization, W.E., P.L., R.S., P.C. and A.M.; methodology, W.E., P.C. and R.S.; software, W.E. and A.M.; validation, W.E. and A.M.; investigation, W.E., P.L. and R.S.; resources, R.S. and P.L.; writing—original draft preparation, W.E. and A.M.; writing—review and editing, W.E., P.L., R.S., A.M. and P.C.; supervision, R.S. and P.L.; project administration, R.S.; funding acquisition, R.S. All authors have read and agreed to the published version of the manuscript.

Funding

This paper is part of two projects that have received funding from the European Union’s Horizon 2020 research and innovation program under the Marie Sklodowska-Curie grant agreements No. 812391-SCENT and No. 812753-ETOPIA.

Data Availability Statement

Data is contained within the article.

Conflicts of Interest

The authors declare no conflicts of interest.

Abbreviations

The following abbreviations are used in this manuscript:
AVAverage detector
AWGNAdditive White Gaussian Noise
EMCElectromagnetic Compatibility
EMIElectromagnetic Interference
ENEuropean Norm
FCCFederal Communications Commission
FECForward Error Correction
FERFrame Error Rate
GSMGlobal System for Mobile
IFIntermediate Frequency
IFBWIntermediate Frequency Band Width
LEDLight Emitted Diode
LISNLine Impedance Stabilization Network
OFDMOrthogonal Frequency Division Multiplexing
PAMPulse Amplitude Modulation
PLCPower Line Communication
PRIMEPower line Related Intelligent Metering Evolution
PWMPulse Width Modulation
QPQuasi Peak detector
RBWResolution Bandwidth
RCFMFDRandom Carrier Frequency Modulation with Fixed Duty cycle
RCFMVDRandom Carrier Frequency Modulation with Variable Duty cycle
RPPMRandom Pulse Position Modulation
RPWMRandom Pulse Width Modulation
SCENTSmart Cities EMC Network for Training
SSMSpread Spectrum Modulation
TITexas Instrument

References

  1. Chung, D.D.L. Materials for electromagnetic interference shielding. Mater. Chem. Phys. 2020, 255, 123587. [Google Scholar] [CrossRef]
  2. Musolino, F.; Crovetti, P.S. Interference of Spread-Spectrum Modulated Disturbances on Digital Communication Channels. IEEE Access 2019, 7, 158969–158980. [Google Scholar] [CrossRef]
  3. Wang, Y.; Wen, H.; Hou, X.; Tang, H.; Sun, H.; Zheng, K.; Li, S. Comparison of Differential-Mode and Mixed-Mode Conducted Emission for Household Appliances in Power-Line Communication System. IEEE Trans. Electromagn. Compat. 2017, 59, 2023–2028. [Google Scholar] [CrossRef]
  4. Wibisono, M.A.; Moonen, N.; Leferink, F. Interference of LED Lamps on Narrowband Power Line Communication. In Proceedings of the 2020 IEEE International Symposium on Electromagnetic Compatibility & Signal/Power Integrity (EMCSI), Reno, NV, USA, 27–31 July 2020; pp. 219–221. [Google Scholar] [CrossRef]
  5. Nia, M.S.S.; Shamsi, P.; Ferdowsi, M. EMC Modeling and Conducted EMI Analysis for a Pulsed Power Generator System including an AC-DC-DC Power Supply. IEEE Trans. Plasma Sci. 2020, 48, 4250–4261. [Google Scholar] [CrossRef]
  6. Tounquet, F.; Alaton, C. Benchmarking Smart Metering Deployment in EU-28; Europeon Commission: Brussels, Belgium, 2019; ISBN 978-92-76-17295-6. [Google Scholar] [CrossRef]
  7. Korki, M.; Hosseinzadeh, N.; Member, S.; Moazzeni, T. Performance Evaluation of a Narrowband Power Line Communication for Smart Grid with Noise Reduction Technique. IEEE Trans. Consum. Electron. 2011, 57, 1598–1606. [Google Scholar] [CrossRef]
  8. Hoch, M. Comparison of PLC G3 and PRIME. In Proceedings of the 2011 IEEE International Symposium on Power Line Communications and Its Applications, ISPLC 2011, Udine, Italy, 3–6 April 2011; pp. 165–169. [Google Scholar] [CrossRef]
  9. Cheng, C.H.; Wu, T.L. A Common-Mode Filter with Three Alterable and Designable Transmission Zeroes. In Proceedings of the IEEE International Symposium on Electromagnetic Compatibility, Singapore, 14–17 May 2018; IEEE: Piscataway, NJ, USA, 2018; pp. 429–432. [Google Scholar] [CrossRef]
  10. Shirai, R.; Wada, K.; Shimizu, T. Failure protection method for CAN communication against EMI noise generated by switched-mode power supplies. IEEE J. Emerg. Sel. Top Power Electron. 2021, 9, 6152–6160. [Google Scholar] [CrossRef]
  11. Lai, Y.-S.; Chang, Y.-T.; Chen, B.-Y. Novel Random-Switching PWM Technique with Constant Sampling Frequency and Constant Inductor Average Current for Digitally Controlled Converter. IEEE Trans. Ind. Electron. 2013, 60, 3126–3135. [Google Scholar] [CrossRef]
  12. Chen, J.; Jiang, D.; Sun, W.; Shen, Z.; Zhang, Y. A Family of Spread-Spectrum Modulation Schemes Based on Distribution Characteristics to Reduce Conducted EMI for Power Electronics Converters. IEEE Trans. Ind. Appl. 2020, 56, 5142–5157. [Google Scholar] [CrossRef]
  13. Pareschi, F.; Rovatti, R.; Setti, G. EMI reduction via spread spectrum in DC/DC converters: State of the art, optimization, and tradeoffs. IEEE Access 2015, 3, 2857–2874. [Google Scholar] [CrossRef]
  14. Pareschi, F.; Setti, G.; Rovatti, R.; Frattini, G. Practical optimization of EMI reduction in spread spectrum clock generators with application to switching DC/DC converters. IEEE Trans. Power Electron. 2014, 29, 4646–4657. [Google Scholar] [CrossRef]
  15. Park, H.; Kim, M.; Jung, J.-H. Spread-Spectrum Technique Employing Phase-Shift Modulation to Reduce EM Noise for Parallel–Series LLC Resonant Converter. IEEE Trans. Power Electron. 2019, 34, 1026–1031. [Google Scholar] [CrossRef]
  16. Yu, M.; Shi, M.; Hu, W.; Yi, L. FPGA-Based Dual-Pulse Anti-Interference Lidar System Using Digital Chaotic Pulse Position Modulation. IEEE Photonics Technol. Lett. 2021, 33, 757–760. [Google Scholar] [CrossRef]
  17. Peyghambari, A.; Dastfan, A.; Ahmadyfard, A. Selective Voltage Noise Cancellation in Three-Phase Inverter Using Random SVPWM. IEEE Trans. Power Electron. 2016, 31, 4604–4610. [Google Scholar] [CrossRef]
  18. Loschi, H.; Lezynski, P.; Smolenski, R.; Nascimento, D.; Sleszynski, W. FPGA-Based System for Electromagnetic Interference Evaluation in Random Modulated DC/DC Converters. Energies 2020, 13, 2389. [Google Scholar] [CrossRef]
  19. Bojarski, J.; Smolenski, R.; Lezynski, P.; Sadowski, Z. Diophantine equation based model of data transmission errors caused by interference generated by DC-DC converters with deterministic modulation. Bull. Pol. Acad. Sci. Tech. Sci. 2016, 64, 575–580. [Google Scholar] [CrossRef]
  20. Beshir, A.H.; Wan, L.; Grassi, F.; Crovetti, P.S.; Liu, X.; Wu, X.; El Sayed, W.; Spadacini, G.; Pignari, S.A. Electromagnetic Interference of Power Converter with Random Modulation on the Power Line Communication System. Electronics 2021, 10, 2979. [Google Scholar] [CrossRef]
  21. Auinger, B.; Deutschmann, B.; Winkler, G. Elimination of Electromagnetic Interference in Communication Channels by Using Spread Spectrum Techniques. In Proceedings of the 2017 International Symposium on Electromagnetic Compatibility—EMC EUROPE, Angers, France, 4–7 September 2017; pp. 1–6. [Google Scholar] [CrossRef]
  22. Sayed, W.E.; Crovetti, P.; Moonen, N.; Lezynski, P.; Smolenski, R.; Leferink, F. Electromagnetic Interference of Spread-Spectrum Modulated Power Converters in G3-PLC Power Line Communication Systems. IEEE Lett. Electromagn. Compat. Pract. Appl. 2021, 3, 118–122. [Google Scholar] [CrossRef]
  23. Bendicks, A.; Frei, S.; Hees, N.; Wiegand, M. Systematic Reduction of Peak and Average Emissions of Power Electronic Converters by the Application of Spread Spectrum. IEEE Trans. Electromagn. Compat. 2018, 60, 1571–1580. [Google Scholar] [CrossRef]
  24. Mukherjee, R.; Patra, A.; Banerjee, S. Impact of a frequency modulated pulsewidth modulation (PWM) switching converter on the input power system quality. IEEE Trans. Power Electron. 2010, 25, 1450–1459. [Google Scholar] [CrossRef]
  25. Li, H.G.; Cai, W.Y.; Gong, S.D. Chaotic spread spectrum for EMI reduction in DC-DC converter. In Proceedings of the 2017 IEEE 6th Asia-Pacific Conference on Antennas and Propagation, APCAP 2017—Proceeding, Xi’an, China, 16–19 October 2018; pp. 1–3. [Google Scholar]
  26. Callegari, S.; Rovatti, R.; Setti, G. Spectral properties of chaos-based FM signals: Theory and simulation results. IEEE Trans. Circuits Syst. I Fundam. Theory Appl. 2003, 50, 3–15. [Google Scholar] [CrossRef]
  27. Cano, C.; Pittolo, A.; Malone, D.; Lampe, L.; Tonello, A.M.; Dabak, A. State of the art in Power Line Communications: From the Applications to the Medium. IEEE J. Sel. Areas Commun. 2016, 34, 1935–1952. [Google Scholar] [CrossRef]
  28. Matanza, J.; Alexandres, S.; Rodriguez-Morcillo, C. Performance evaluation of two narrowband PLC systems: PRIME and G3. Comput. Stand Interfaces 2013, 36, 198–208. [Google Scholar] [CrossRef]
  29. Sayed, W.E.; Lezynski, P.; Smolenski, R.; Moonen, N.; Thomas, D.W.P. The Effect of EMI Generated from Spread-Spectrum-Modulated SiC-Based Buck Converter on the G3-PLC Channel. Electronics 2021, 10, 1416. [Google Scholar] [CrossRef]
  30. Elsayed, W.W.S. The Effect of Spread–Spectrum Modulated EMI on the Power Line Communication Systems. Ph.D. Thesis, University of Zielona Gora, Zielona Góra, Poland, 2024. [Google Scholar]
  31. Lambros, S.; Athanasiou, D.I.; Fotiadis, L.K. (Eds.) Michalis, Propagation of Segmentation and Imaging System Errors. In Michalis, Atherosclerotic Plaque Characterization Methods Based on Coronary Imaging; Academic Press: Cambridge, MA, USA, 2017; pp. 151–166. ISBN 9780128047347. [Google Scholar] [CrossRef]
Figure 1. Conventional (narrowband noise vs. spread spectrum modulation (wideband noise).
Signals 06 00033 g001
Figure 2. Sketch for the output spectrum in the case of using various modulating signal profiles: (a) Random PAM, (b) sawtooth, and (c) sine wave.
Signals 06 00033 g002
Figure 3. The voltage spectrum measured from the PLC circuit side in the case of using various profiles of ε ( t ) and constant α .
Signals 06 00033 g003
Figure 4. The voltage spectrum measured from the PLC circuit side in the case of using various profiles of ε ( t ) at f m = 0.3 and α = 0.15 .
Signals 06 00033 g004
Figure 5. The voltage spectrum measured from the PLC circuit side in the case of using various profile and frequencies f m of modulating signal ε ( t ) .
Signals 06 00033 g005
Figure 6. The spectrum peak amplitude vs. modulation index β values.
Signals 06 00033 g006
Figure 7. The calculated channel capacity vs. the modulating index at constant α = 15 % .
Signals 06 00033 g007
Figure 8. The channel capacity loss vs. the modulating index at constant α = 15 % .
Signals 06 00033 g008
Figure 9. The FER vs. the modulating signal frequency f m in the case of using different shapes.
Signals 06 00033 g009
Table 1. Spread spectrum modulation settings [30].
The central switching frequency63 kHz
Duty cycle50%
Modulating signal ε τ PAM, sawtooth, and sinusoidal
Modulating signal sampling frequency f s s Varies from 30 Hz to 60 kHz
Modulating signal frequency f m Varies from 0.3 to 600 Hz
Spreading factor ( α )15%
Table 2. Correlation factor between the calculated channel capacity and the measured FER.
Modulating SignalCorrelation Factor
Sawtooth−0.954
Sine wave−0.6551
RandomPAM0.07009
Disclaimer/Publisher’s Note: The statements, opinions and data contained in all publications are solely those of the individual author(s) and contributor(s) and not of MDPI and/or the editor(s). MDPI and/or the editor(s) disclaim responsibility for any injury to people or property resulting from any ideas, methods, instructions or products referred to in the content.

