
Speech Emotion Recognition: Comparative Analysis of CNN-LSTM and Attention-Enhanced CNN-LSTM Models


Abstract
1. Introduction
2. Literature Review
3. Methodology
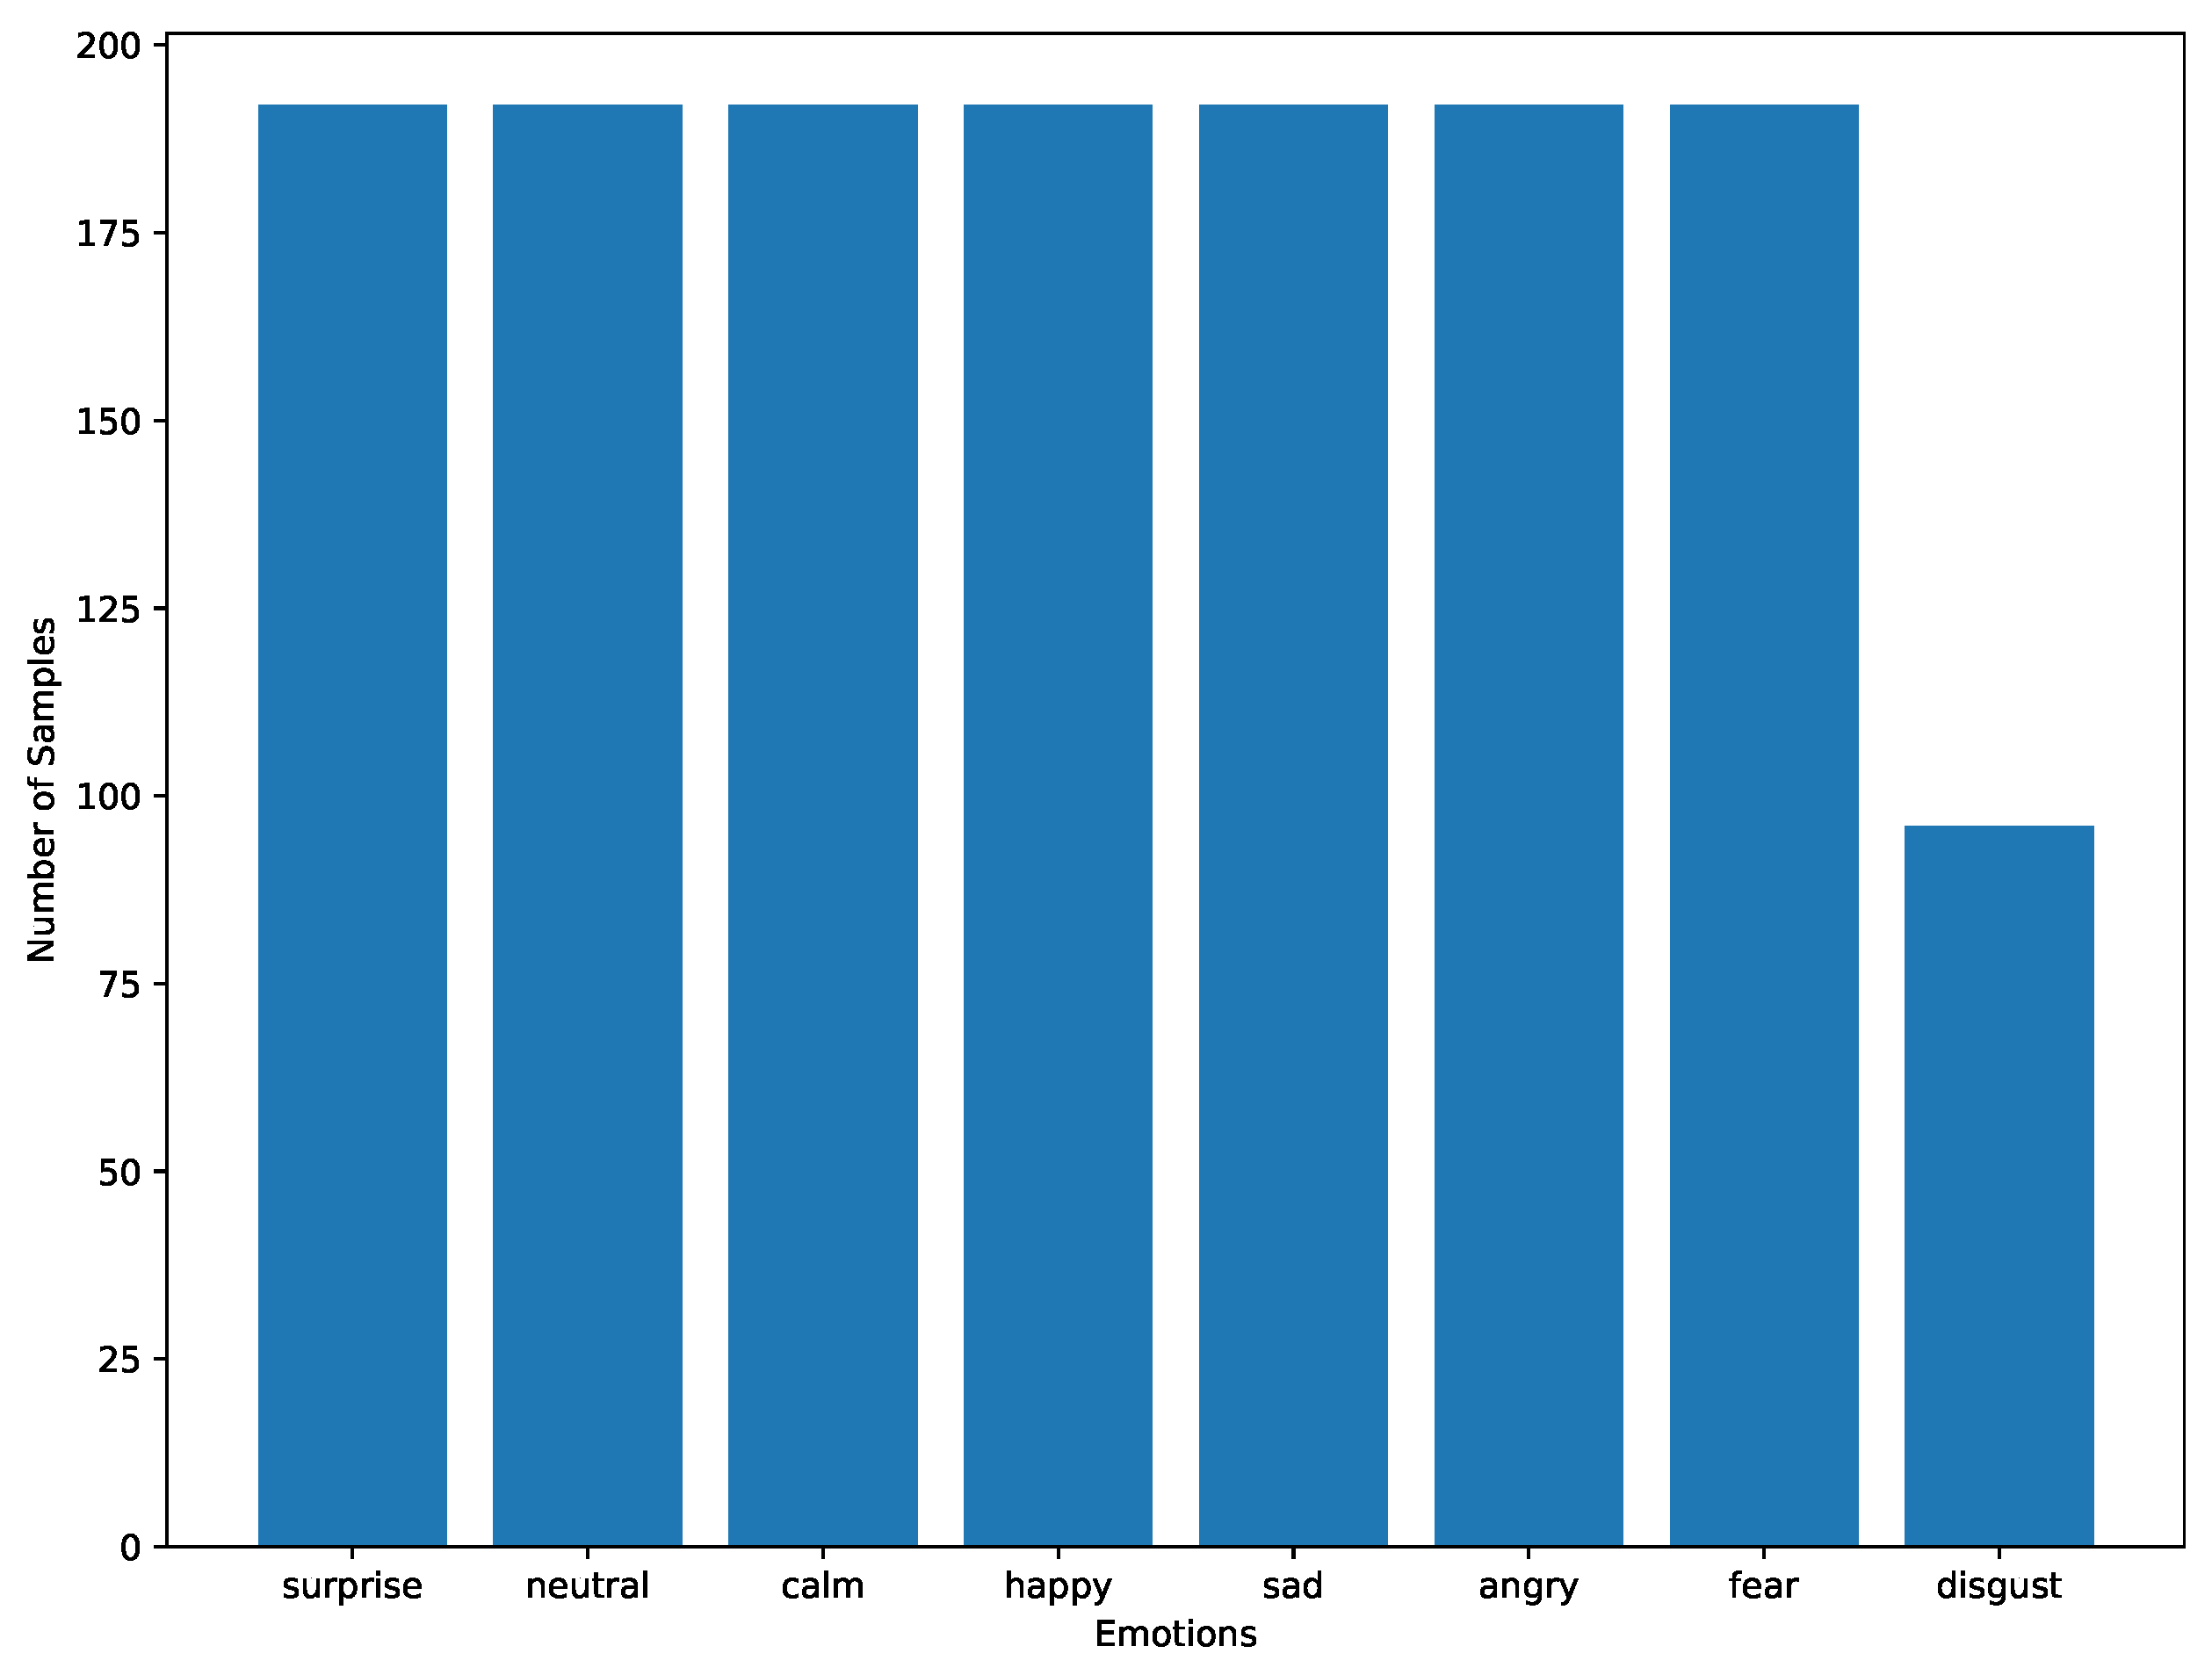
3.1. Dataset
3.2. Pre-Processing
3.3. Models Description
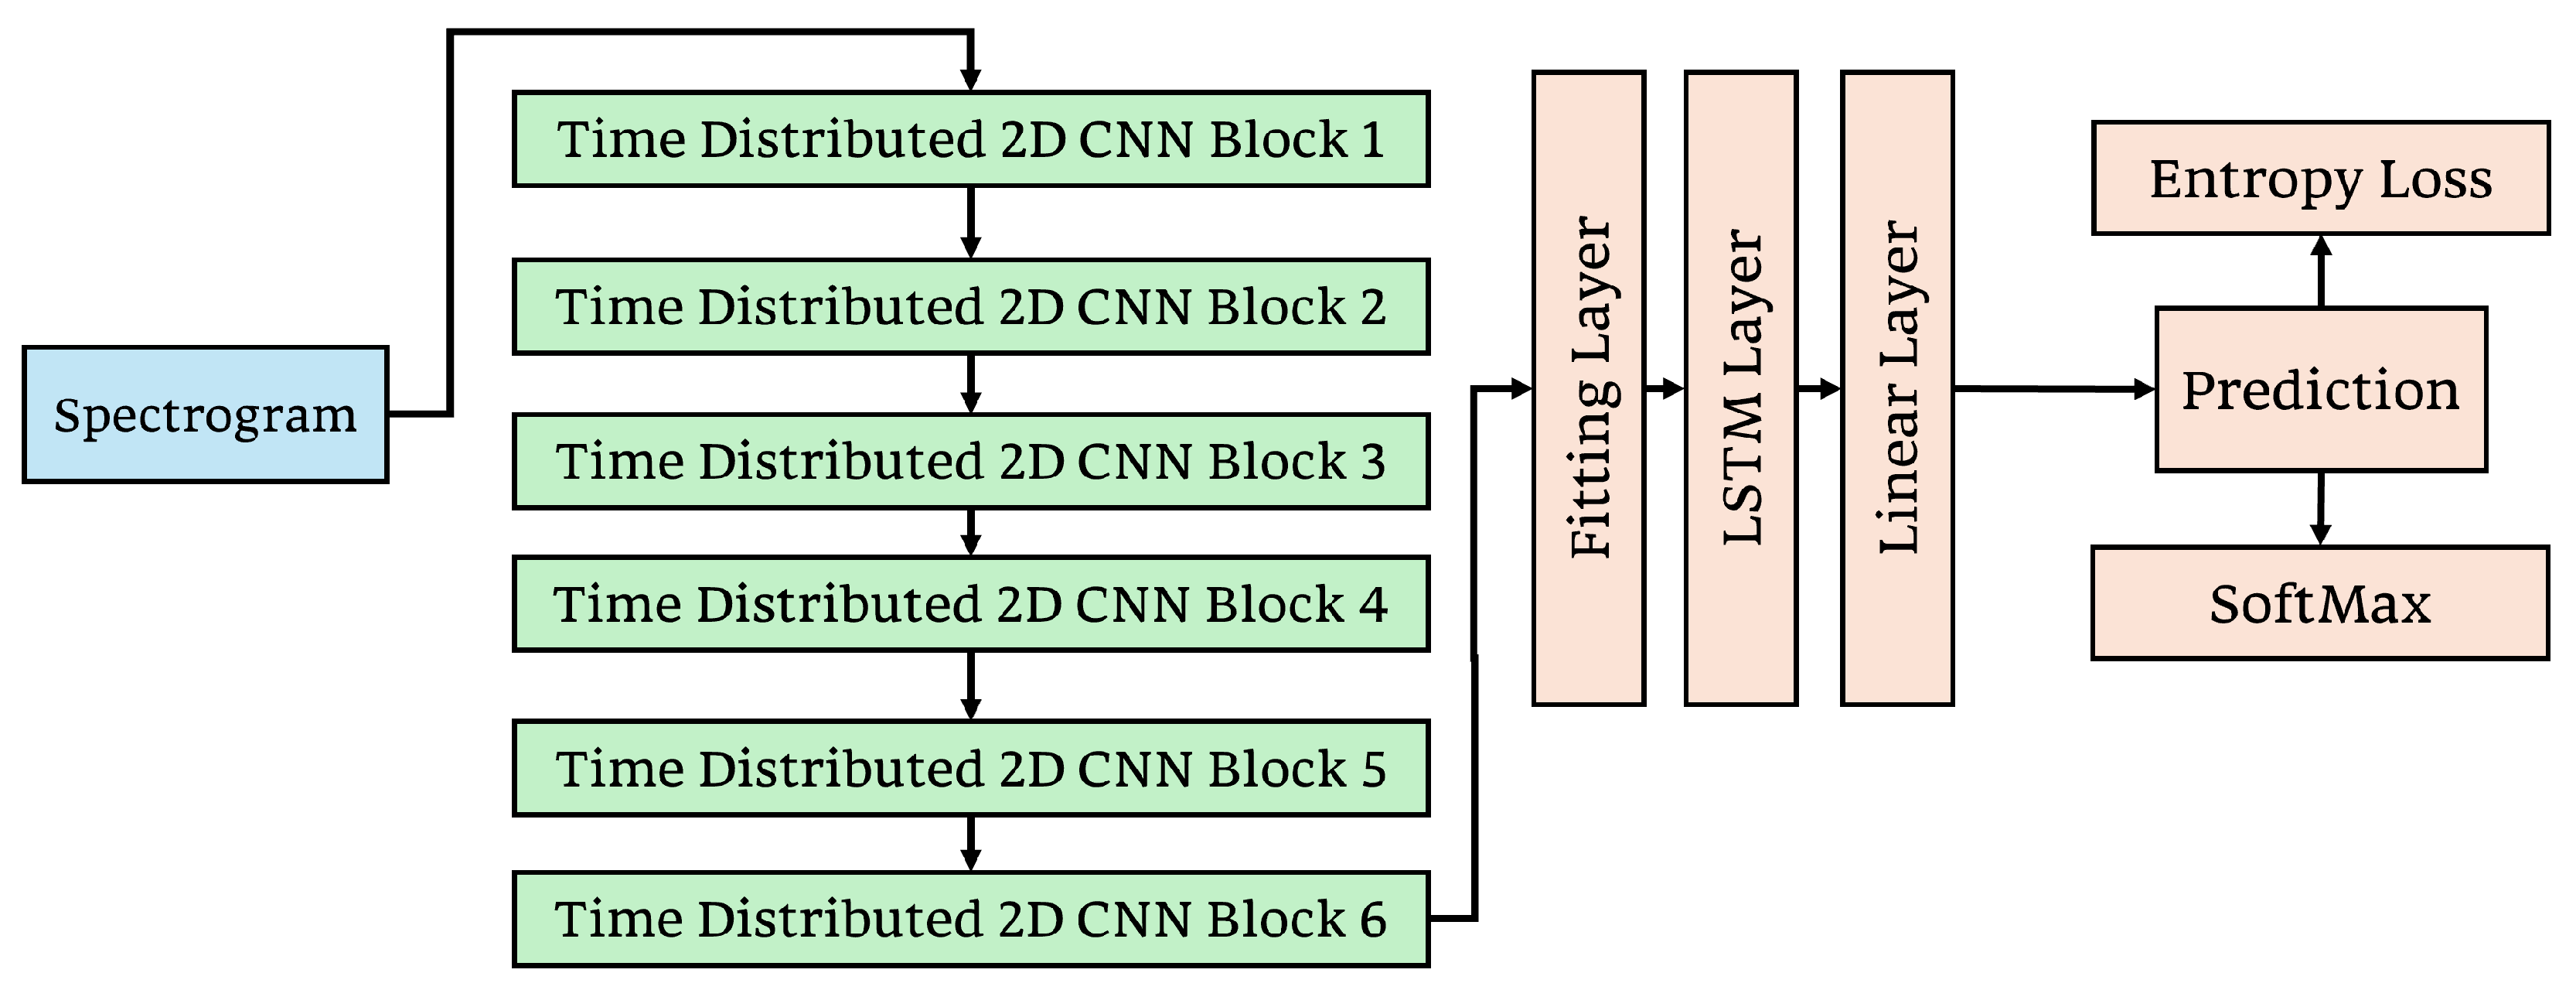
3.3.1. Time Distributed 2D CNN-LSTM Model
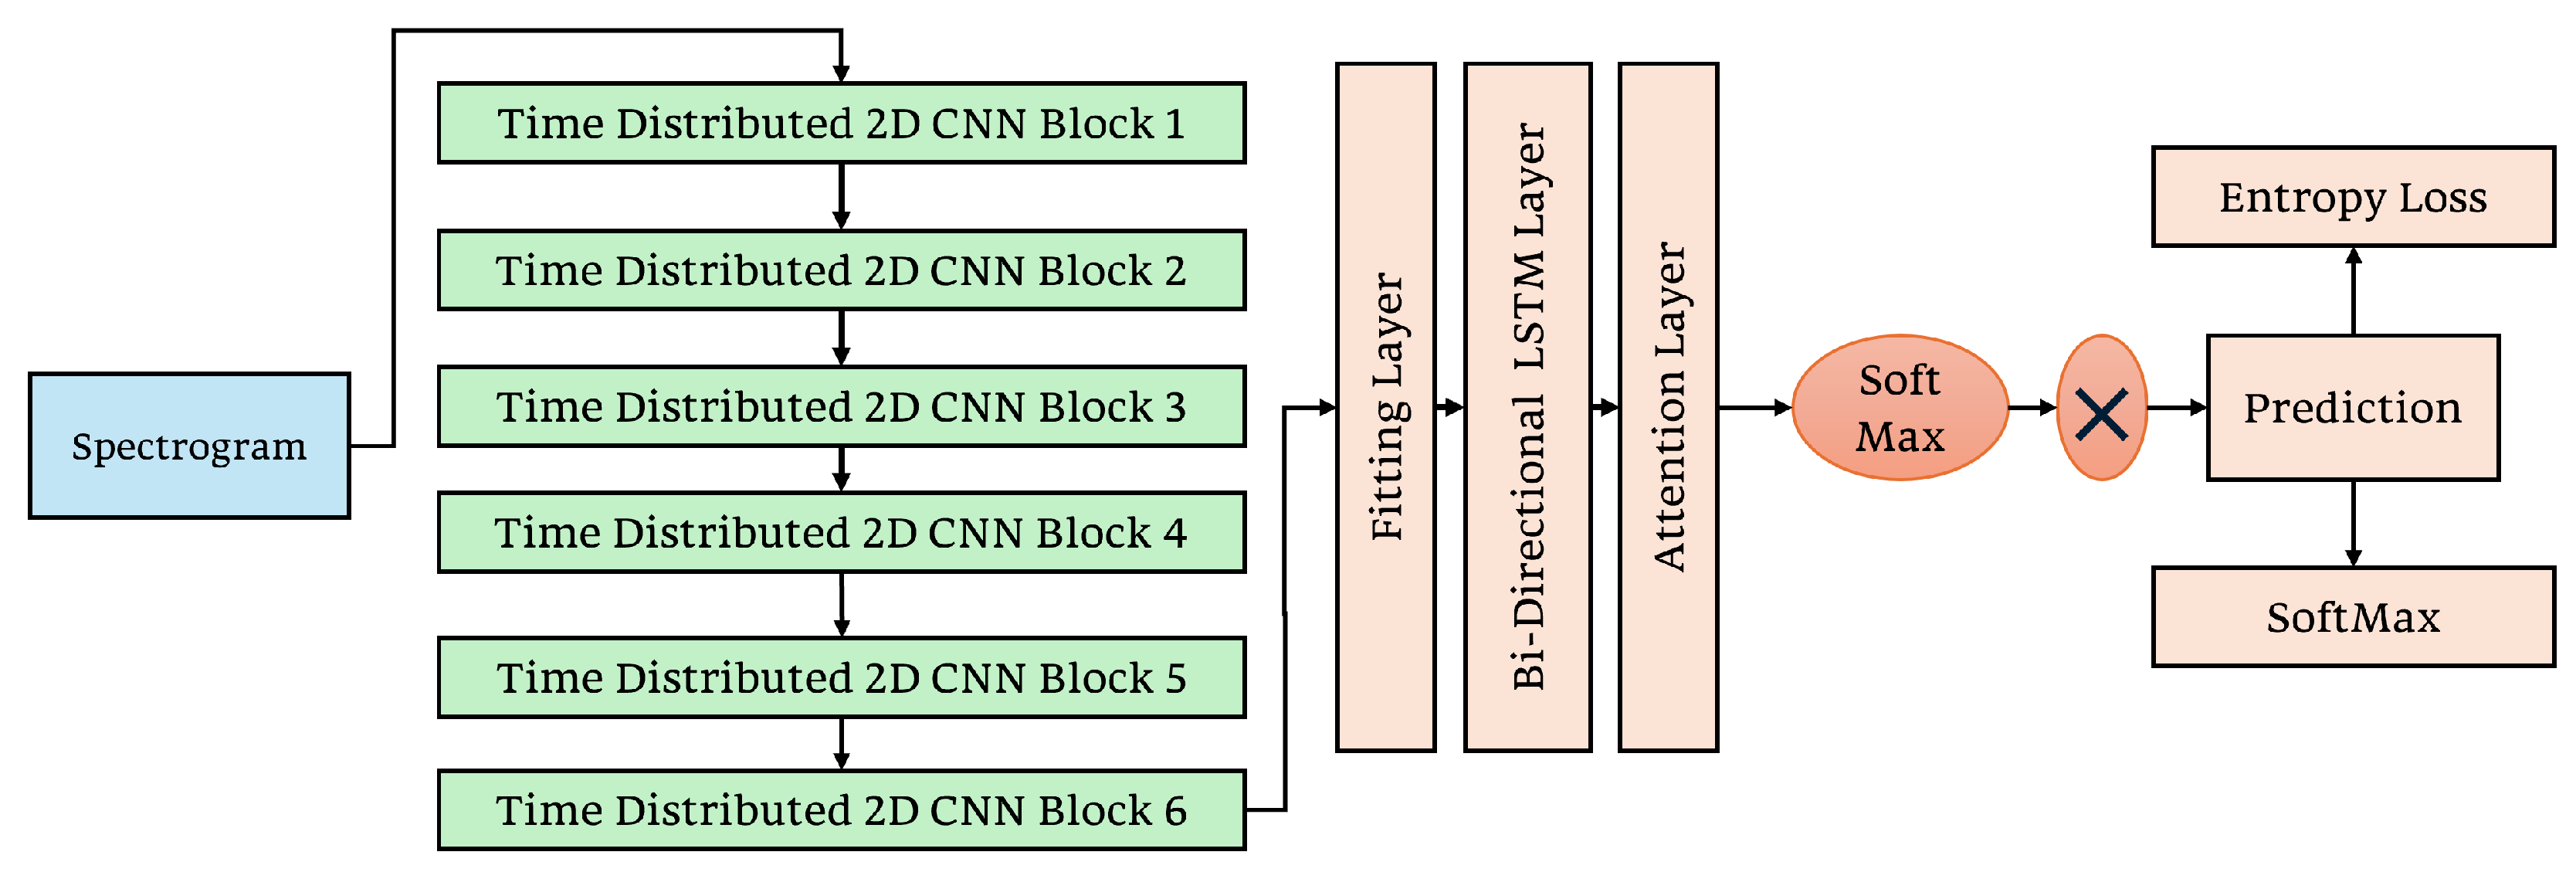
3.3.2. Stacked Time Distributed 2D CNN–Bidirectional LSTM with Attention
3.4. Ablation Study
4. Results and Discussion
5. Conclusions
Author Contributions
Funding
Data Availability Statement
Acknowledgments
Conflicts of Interest
References
- Kadiri, S.R.; Gangamohan, P.; Gangashetty, S.V.; Alku, P.; Yegnanarayana, B. Excitation Features of Speech for Emotion Recognition Using Neutral Speech as Reference. Circuits Syst. Signal Process. 2020, 39, 4459–4481. [Google Scholar] [CrossRef]
- Singh, Y.B.; Goel, S. Survey on Human Emotion Recognition: Speech Database, Features and Classification. In Proceedings of the 2018 International Conference on Advances in Computing, Communication Control and Networking (ICACCCN), Greater Noida, India, 12–13 October 2018; pp. 298–301. [Google Scholar]
- Livingstone, S.; Russo, F. The Ryerson Audio-Visual Database of Emotional Speech and Song (RAVDESS). PLoS ONE 2018, 13, e0196391. [Google Scholar] [CrossRef] [PubMed]
- El Ayadi, M.; Kamel, M.S.; Karray, F. Survey on Speech Emotion Recognition: Features, Classification Schemes, and Databases. Pattern Recognit. 2011, 44, 572–587. [Google Scholar] [CrossRef]
- Pratama, A.; Sihwi, S.W. Speech Emotion Recognition Model Using Support Vector Machine Through MFCC Audio Feature. In Proceedings of the 2022 14th International Conference on Information Technology and Electrical Engineering (ICITEE), Yogyakarta, Indonesia, 18–19 October 2022; pp. 303–307. [Google Scholar]
- Nancy, M.; Kumar, G.S.; Doshi, P.; Shaw, S. Audio Based Emotion Recognition Using Mel Frequency Cepstral Coefficient and Support Vector Machine. J. Comput. Theor. Nanosci. 2018, 15, 2255–2258. [Google Scholar] [CrossRef]
- Prabakaran, D.; Sriuppili, S. Speech Processing: MFCC Based Feature Extraction Techniques—An Investigation. J. Phys. Conf. Ser. 2021, 1717, 012009. [Google Scholar] [CrossRef]
- Nasim, A.S.; Chowdory, R.H.; Dey, A.; Das, A. Recognizing Speech Emotion Based on Acoustic Features Using Machine Learning. In Proceedings of the 2021 International Conference on Advanced Computer Science and Information Systems (ICACSIS), Depok, Indonesia, 23–25 October 2021; pp. 1–7. [Google Scholar]
- Gao, M.; Dong, J.; Zhou, D.; Zhang, Q.; Yang, D. End-to-End SER Based on a One-Dimensional Convolutional Neural Network. In Proceedings of the 2019 ACM International Conference on Intelligent Autonomous Systems (ICIAI), Guilin, China, 23–25 October 2019; pp. 78–82. [Google Scholar]
- Ma, X.; Wu, Z.; Jia, J.; Xu, M.; Meng, H.; Cai, L. Emotion Recognition from Variable-Length Speech Segments Using Deep Learning on Spectrograms. In Proceedings of the Interspeech 2018, Hyderabad, India, 2–6 September 2018; pp. 3683–3687. [Google Scholar]
- Neumann, M.; Vu, N.T. Improving Speech Emotion Recognition with Unsupervised Representation Learning on Unlabeled Speech. In Proceedings of the 2019 IEEE International Conference on Acoustics, Speech and Signal Processing (ICASSP), Brighton, UK, 12–17 May 2019; pp. 7390–7394. [Google Scholar]
- Zhan, Y.; Yuan, X. Audio Post-Processing Detection and Identification Based on Audio Features. In Proceedings of the 2017 International Conference on Wavelet Analysis and Pattern Recognition (ICWAPR), Ningbo, China, 9–12 July 2017; pp. 154–158. [Google Scholar]
- Mirsamadi, S.; Barsoum, E.; Zhang, C. Automatic speech emotion recognition using recurrent neural networks with local attention. In Proceedings of the 2017 IEEE International Conference on Acoustics, Speech and Signal Processing (ICASSP), New Orleans, LA, USA, 5–9 March 2017; pp. 2227–2231. [Google Scholar]
- Tocoglu, M.A.; Ozturkmenoglu, O.; Alpkocak, A. Emotion Analysis From Turkish Tweets Using Deep Neural Networks. IEEE Access 2019, 7, 183061–183069. [Google Scholar] [CrossRef]
- Kamyab, M.; Liu, G.; Adjeisah, M. Attention-Based CNN and Bi-LSTM Model Based on TF-IDF and GloVe Word Embedding for Sentiment Analysis. Appl. Sci. 2021, 11, 11255. [Google Scholar] [CrossRef]
- Alluhaidan, A.S.; Saidani, O.; Jahangir, R.; Nauman, M.A.; Neffati, O.S. Speech Emotion Recognition Through Hybrid Features and Convolutional Neural Network. Appl. Sci. 2023, 13, 4750. [Google Scholar] [CrossRef]
- Han, T.; Zhang, Z.; Ren, M.; Dong, C.; Jiang, X.; Zhuang, Q. Speech Emotion Recognition Based on Deep Residual Shrinkage Network. Electronics 2023, 12, 2512. [Google Scholar] [CrossRef]
- Nwe, T.L.; Foo, S.W.; De Silva, L.C. Speech Emotion Recognition Using Hidden Markov Models. Speech Commun. 2003, 41, 603–623. [Google Scholar] [CrossRef]
- Bhanbhro, J.; Talpur, S.; Memon, A.A. Speech Emotion Recognition Using Deep Learning Hybrid Models. In Proceedings of the 2022 International Conference on Emerging Technologies in Electronics, Computing and Communication (ICETECC), Jamshoro, Pakistan, 7–9 December 2022; pp. 1–5. [Google Scholar]
- Abas, A.R.; Elhenawy, I.; Zidan, M.; Othman, M. BERT-CNN: A Deep Learning Model for Detecting Emotions from Text. Comput. Mater. Contin. 2021, 71, 2943–2961. [Google Scholar]
- Li, Y.; Wang, Y.; Yang, X.; Im, S.-K. Speech Emotion Recognition Based on Graph-LSTM Neural Network. EURASIP J. Audio Speech Music Process. 2023, 2023, 40. [Google Scholar] [CrossRef]
- Mustaqeem; Kwon, S. Att-Net: Enhanced Emotion Recognition System Using Lightweight Self-Attention Module. Appl. Soft Comput. 2021, 102, 107101. [Google Scholar] [CrossRef]
- Chuang, Z.J.; Wu, C.H. Emotion recognition from text using neural networks. Neural Comput. 2003, 15, 2047–2085. [Google Scholar]
- Bourlard, H.; Morgan, N. A new approach for speech emotion recognition using HMM. IEEE Signal Process. Lett. 1996, 3, 89–91. [Google Scholar]
- Kipyatkova, I. LSTM-Based Language Models for Very Large Vocabulary Continuous Russian Speech Recognition System. In Speech and Computer; Springer International Publishing: Cham, Switzerland, 2019; pp. 219–226. [Google Scholar]
- Zhang, Y.; Du, J.; Wang, Z.-R.; Zhang, J. Attention Based Fully Convolutional Network for Speech Emotion Recognition. arXiv 2018, arXiv:1806.01506. [Google Scholar]
- Meher, S.S.; Ananthakrishna, T. Dynamic Spectral Subtraction on AWGN Speech. In Proceedings of the 2015 2nd International Conference on Signal Processing and Integrated Networks (SPIN), Noida, India, 19–20 February 2015; pp. 92–97. [Google Scholar]
- Mujaddidurrahman, A.; Ernawan, F.; Wibowo, A.; Sarwoko, E.A.; Sugiharto, A.; Wahyudi, M.D.R. Speech Emotion Recognition Using 2D-CNN with Data Augmentation. In Proceedings of the 2021 International Conference on Software Engineering & Computer Systems and 4th International Conference on Computational Science and Information Management (ICSECS-ICOCSIM), Pekan, Malaysia, 24–26 August 2021; pp. 685–689. [Google Scholar]
- Zhu, Z.; Dai, W.; Hu, Y.; Li, J. Speech Emotion Recognition Model Based on Bi-GRU and Focal Loss. Pattern Recognit. Lett. 2020, 140, 358–365. [Google Scholar] [CrossRef]
- Phan, H.; Hertel, L.; Maass, M.; Mertins, A. Robust Audio Event Recognition with 1-Max Pooling Convolutional Neural Networks. In Proceedings of the Interspeech 2016, San Francisco, CA, USA, 8–12 September 2016; pp. 3653–3657. [Google Scholar]
- Asiya, U.A.; Kiran, V.K. Speech Emotion Recognition—A Deep Learning Approach. In Proceedings of the 2021 Fifth International Conference on I-SMAC (IoT in Social, Mobile, Analytics and Cloud), Palladam, India, 11–13 November 2021; pp. 867–871. [Google Scholar]
- Pennebaker, J.W.; Francis, M.E.; Booth, R.J. Linguistic Inquiry and Word Count: LIWC 2001; Lawrence Erlbaum Associates: Mahwah, NJ, USA, 2001. [Google Scholar]
- Vaswani, A.; Shazeer, N.; Parmar, N.; Uszkoreit, J.; Jones, L.; Gomez, A.N.; Kaiser, Ł.; Polosukhin, I. Attention is All You Need. In Proceedings of the 31st Conference on Neural Information Processing Systems (NIPS 2017), Long Beach, CA, USA, 4–9 December 2017; pp. 5998–6008. [Google Scholar]
- Haq, S.; Jackson, P.J.B. Speaker-dependent audio-visual emotion recognition. In Proceedings of the International Conference on Auditory-Visual Speech Processing (AVSP’08), Norwich, UK, 10–13 September 2009. [Google Scholar]


| Study Ref. | Technique | Data Used | Key Findings | Accuracy |
|---|---|---|---|---|
| [9,10] | End-to-end SER | Various | Swift information extraction; no manual features | - |
| [11,12,13] | CNN-LSTM, others | Various | Enhanced SER performance | - |
| [14] | CNN | Turkish tweets | Excelling in text analysis | 87% |
| [15] | LSTM, CNN | Various | Improved sentiment analysis | 94% |
| [16] | CNN | Audio | Novel approach; modest success | 63% |
| [17] | ResNets | Various | Promising in SER tasks | 70+% |
| [19] | CNN-LSTM | RAVDESS | High accuracy in sentiment analysis | 90% |
| [20] | BERT | Text emotion | Excellent in text-based detection | 92+% |
| [21] | DNN, GNN | Audio, multimodal | Innovative in audio signal recognition | 70–88% |
| [22] | NN | RAVDESS | Real-time emotion recognition | 80% |
| Models | Epochs | Training Time (Minutes) | Accuracy |
|---|---|---|---|
| Model 1 | 60 | 20 | 60% |
| 130 | 43 | 80% | |
| 200 | 71 | 96.5% | |
| Model 2 | 60 | 31 | 67% |
| 130 | 68 | 85% | |
| 200 | 103 | 98.1% |
| Class | Precision | Recall | F1-Score | Accuracy (%) | |||
|---|---|---|---|---|---|---|---|
| Model 1 | Model 2 | Model 1 | Model 2 | Model 1 | Model 2 | ||
| Surprise | 1.00 | 1.00 | 1.00 | 0.95 | 1.00 | 0.97 | 96.5 (M1) 98.1 (M2) |
| Neutral | 1.00 | 1.00 | 1.00 | 1.00 | 1.00 | 1.00 | |
| Calm | 0.90 | 0.95 | 0.95 | 1.00 | 0.92 | 0.97 | |
| Happy | 0.95 | 1.00 | 0.95 | 1.00 | 0.95 | 1.00 | |
| Sad | 0.95 | 1.00 | 0.95 | 1.00 | 0.95 | 1.00 | |
| Angry | 0.90 | 0.95 | 0.95 | 1.00 | 0.92 | 0.97 | |
| Fear | 1.00 | 0.95 | 1.00 | 1.00 | 1.00 | 0.97 | |
| Disgust | 1.00 | 0.95 | 0.95 | 0.90 | 0.97 | 0.92 | |
Disclaimer/Publisher’s Note: The statements, opinions and data contained in all publications are solely those of the individual author(s) and contributor(s) and not of MDPI and/or the editor(s). MDPI and/or the editor(s) disclaim responsibility for any injury to people or property resulting from any ideas, methods, instructions or products referred to in the content. |
© 2025 by the authors. Licensee MDPI, Basel, Switzerland. This article is an open access article distributed under the terms and conditions of the Creative Commons Attribution (CC BY) license (https://creativecommons.org/licenses/by/4.0/).
Share and Cite
Bhanbhro, J.; Memon, A.A.; Lal, B.; Talpur, S.; Memon, M. Speech Emotion Recognition: Comparative Analysis of CNN-LSTM and Attention-Enhanced CNN-LSTM Models. Signals 2025, 6, 22. https://doi.org/10.3390/signals6020022
Bhanbhro J, Memon AA, Lal B, Talpur S, Memon M. Speech Emotion Recognition: Comparative Analysis of CNN-LSTM and Attention-Enhanced CNN-LSTM Models. Signals. 2025; 6(2):22. https://doi.org/10.3390/signals6020022
Chicago/Turabian StyleBhanbhro, Jamsher, Asif Aziz Memon, Bharat Lal, Shahnawaz Talpur, and Madeha Memon. 2025. "Speech Emotion Recognition: Comparative Analysis of CNN-LSTM and Attention-Enhanced CNN-LSTM Models" Signals 6, no. 2: 22. https://doi.org/10.3390/signals6020022
APA StyleBhanbhro, J., Memon, A. A., Lal, B., Talpur, S., & Memon, M. (2025). Speech Emotion Recognition: Comparative Analysis of CNN-LSTM and Attention-Enhanced CNN-LSTM Models. Signals, 6(2), 22. https://doi.org/10.3390/signals6020022