1. Introduction
Maritime transport, while not the most relevant type of passenger transport with a share of less than one percent in 2022 in the European Union [
1], is responsible for over 80% of the world’s merchandise trade by volume [
2], representing over 60% of European freight transport during the same year [
3]. This means that the smooth operation of ports and waterways is of utmost importance for global trade. On the other hand, bridges are a vital part of road transportation systems, being responsible for ensuring fast connections and connecting communities.
Due to their operating principle, drawbridges, also known as bascule bridges, have to interrupt road-based traffic to allow larger vessels to pass, and thus can have a significant influence over both water- and road-based transport systems. Therefore, their continuous and predictable operation is paramount, especially for drawbridges located in ports. However, due to the fact that this type of bridge may have to open and close a number of times per day, they are subjected to more strain and wear than a typical bridge.
Monitoring bridges is an essential and crucial activity in every type of bridge, but even more so in drawbridges, whose inoperability can severely impair trade and disconnect communities. Traditionally, this activity is performed manually and periodically, relying heavily on visual assessments to detect flaws that may already be at an advanced state of damage [
4,
5].
Gkoumas et al. [
6] performed a study on the research and innovation projects in new technologies for bridge inspection and monitoring in the European Union. This provides an overview of recent European policies aimed at promoting the implementation of innovative technologies in the inspection, monitoring, and maintenance of bridges. It highlights and evaluates Research and Innovation (R&I) projects pertinent to bridges, considering the financial allocations under the Horizon 2020 European Research Framework Programme, and concludes that, while research on this topic is substantial, data analysis should continue to be a relevant topic of research. The document also systematically examines the technologies and solutions produced by these projects, alongside assessing their level of technological maturity, and few of the analyzed projects reached the deployment phase.
Yu et al. [
7] present a review of applications that use wireless smart sensors and wireless smart sensor networks (WSSN) for Structural Health Monitoring (SHM). Most of the full-scale SHM applications in bridges that were reviewed for the paper focus on measuring acceleration, and a few additionally measure strain and displacement. Although wireless sensors are becoming more and more common, are easy to install, and have lower costs than traditional wired counterparts, they still have some drawbacks. Among these, limited power resources, insufficient computing capabilities, and environmental vulnerabilities were identified as some of the most relevant. This work also highlights that WSSNs still do not meet the requirements for monitoring complex structures, especially metallic ones.
Al-Ali et al. [
8] propose a wireless IoT-based bridge health status monitoring and warning system focused on inclination measurements. Its main goals are, similarly to most SHM systems, reducing bridge maintenance costs, the extension of lifespans, and the enhancement of transportation safety through an early warning system. While it was developed and tested in lab conditions, it has not yet been deployed.
Aktan et al. [
9] present the lessons learned on Bridge SHM after decades of experience, where they highlight that it has been a valuable tool in better understanding the reality of their environment. They also emphasize that a lack of measurements in the field is partly responsible for the limits on the understanding of many civil engineers regarding the operational behaviors of contemporary structures and highlight that the development of automated data-processing methods is of the utmost importance in the implementation of effective SHM strategies.
Similar principles have also been applied to bascule bridges [
10,
11,
12,
13], where the goals are often focused on monitoring their opening mechanism, but usually also include regular structural considerations, with the first reports of continuous remote monitoring systems for bascule bridges originating 25 years ago [
11].
Nyman et al. [
10] also performed a long-term monitoring campaign of a heel trunnion bascule bridge, where strain gauges, accelerometers, and inclinometers were employed with the goal of analyzing fatigue damage to the structure. This work also highlighted problems such as sensor faults, which are extremely important in real-world measurements but are often not approached in the academic literature. Finally, the work also discussed the difficulty of reaching a root cause for any changes, proposing the use of cameras to provide further context to the measurements. However, they did not monitor the bascule bridge’s control system, which could have provided further insights into those mechanical issues.
Yarnold et al. [
13] developed an SHM system for a bridge that combines a tied arch span, two continuous three-span truss units, and a rolling lift bascule span. The system monitored strain, tilt, and temperature and also included a video feed synchronized with the sensor data, enabling the long-term identification and tracking of structural performance. While they included process variable data in the monitoring, no data processing is described.
The same research group, Yarnold and Weidner [
12], also employed a similar approach to critical parts of a bridge’s life; in this case, its construction and rehabilitation. This work also highlights the importance of monitoring in these stages because the magnitude of forces in these processes is often larger than during regular service. However, since the work was mainly focused on the rehabilitation and construction stages, it does not represent a long-term continuous monitoring solution.
Lienhart et al. [
14] have employed robotic total stations, 3D terrestrial laser scanning, and distributed fiber optic sensing (DFOS) to perform measurements on a highway bridge. While this was not a permanent system, it enabled very-high-spatial-resolution measurements of deformation along the bridge span, highlighting the shape of the deflection curves, but with the significant drawback of generating a considerable amount of data. Additionally, this work highlighted that fiber optic sensing systems as a whole have the major advantage of a simplified cabling, in which a single fiber can contain multiple sensors [
15].
Rizzo and Enshaeian [
16] bring attention to the importance of temperature compensation in static and dynamic analyses of bridges and to the difficulties of implementing wireless systems in comparison to wired ones. Overall, there has been significant development in bridge SHM systems, but nonetheless, as Rizzo and Enshaeian [
16] mention in their work, it is difficult to design an SHM approach that is usable for all bridges due to the significant variations among them, as they often have little in common with each other.
The present work reports the development of a monitoring system for a drawbridge located in a port in northern Portugal ahead of its rehabilitation, as well as the signal-processing methods that were implemented for event detection, classification, and analysis. This is intended to be a permanent SHM system, which draws from fiber optics and conventional sensors, as well as process variables from the bascule bridge’s operation, unlike many of the works in the literature. Additionally, the main signal processing methods that were employed are also presented, which, combining structural and process information, allow for the classification and framing of different events, providing valuable information.
2. Monitoring System
As mentioned before, monitoring large critical infrastructures is a highly complex and costly task, albeit essential and crucial. Among those, bridges are vital structures for both road- and water-based transportation networks.
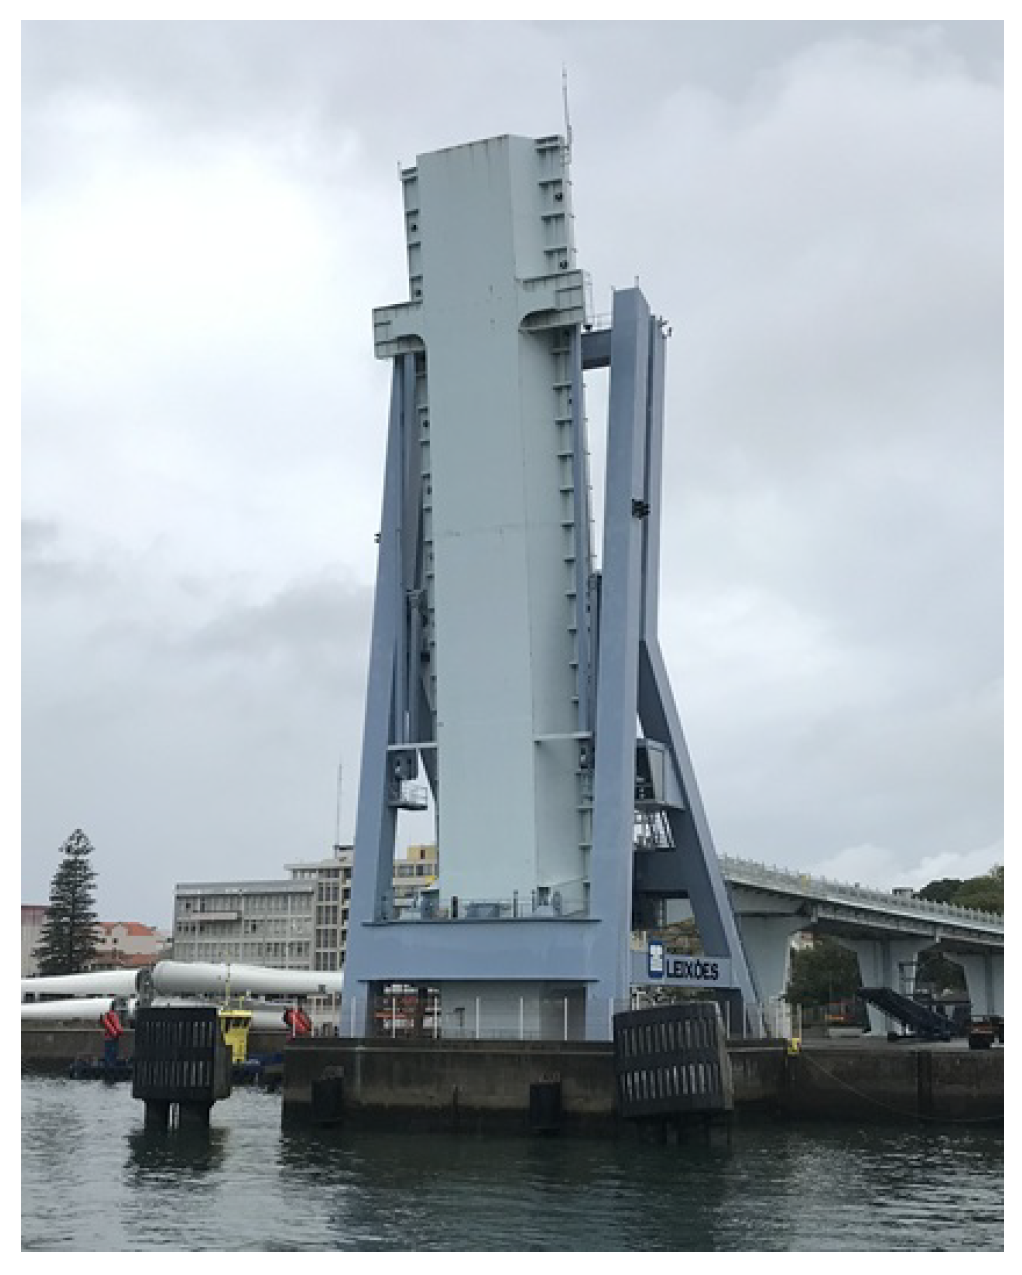
With this in mind, a monitoring system was designed and implemented with the goal of reducing bridge downtime and improving maintenance practices by monitoring the structural condition of a double-leaf bascule bridge, as shown in
Figure 1.
In addition, it provides the ability to analyze the evolution of key structural parameters, allowing the maintenance team to identify potential anomalies before they can lead to failure, at an early stage.
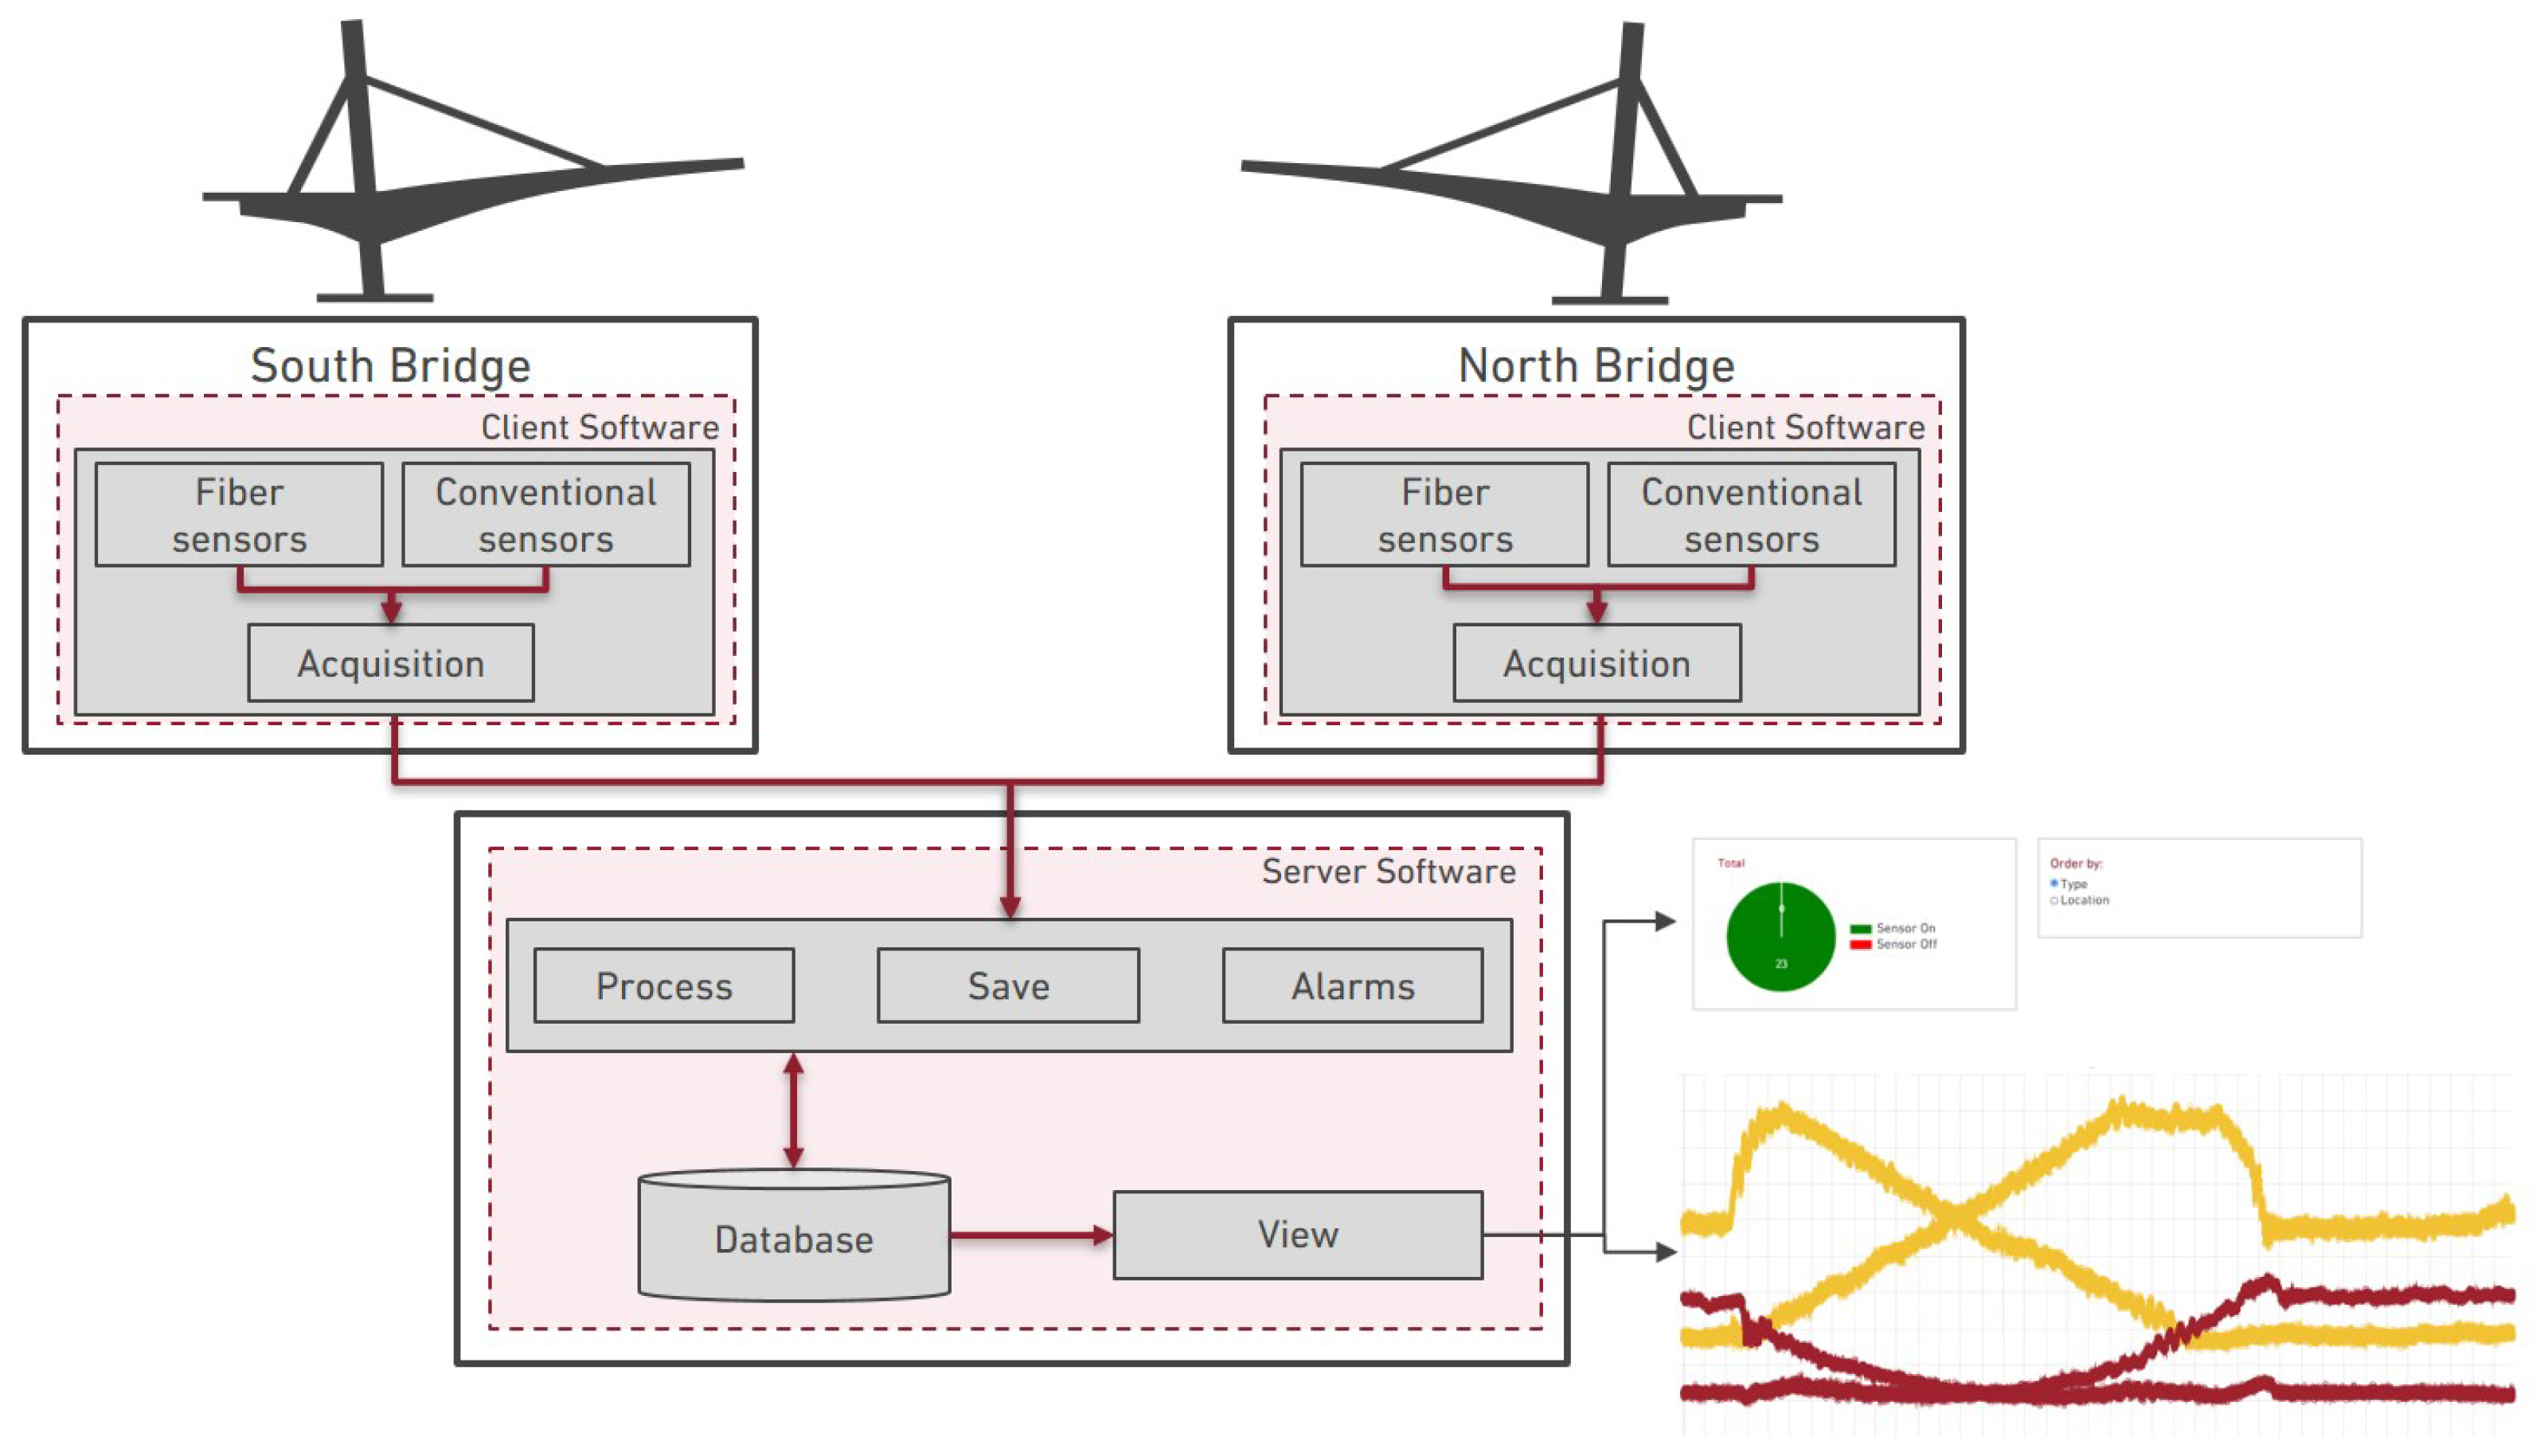
The monitoring system consists of a combination of fiber optics and traditional sensors, combined with the respective acquisition systems and computer software specifically developed for this purpose (
Figure 2).
Considering the structure type, its hydraulic actuation and its past behavior, the choice was made to monitor as many relevant parameters as possible with this system. Then, prior to installation, a study was performed to determine the ideal location and type of sensors, and the following were selected:
Strains/stresses;
Triaxial accelerations;
Temperatures;
Inclinations;
Displacements;
Hydraulic pressures.
The first four are fiber optics-based, using an interrogator from HBK FiberSensing, while the last two use current transmitters, using National Instruments’ USB-6008 board-only DAQs with custom conditioning electronics. The acquisition was managed using Linux-based computers and, as previously mentioned, custom software.
The system continuously monitors the sensors’ values, storing them in a ring buffer, and whenever an event is detected, all the sensor data related to that event are saved, including data from before the detection. Events, in this case, include any opening or closing of the bridge as well as any anomalous events. All the saved data can later be consulted and exported alongside the identification of the events to which they refer.
The software that was developed for the monitoring system of the bridge has two main objectives: acquiring and saving the data recorded by the installed sensors. Thus, two main software components were developed: an acquisition software, which is responsible for communicating with each sensor and collecting its data, and a processing software, with the main function of checking for operational or diagnostic anomalies, sending alarms if any are detected, and storing the acquired data. Data were stored on a NoSQL database, in binary form, to reduce storage requirements.
For maintenance purposes, it is also possible to check the state of any of the sensors, i.e., check if coherent data have been acquired from it recently, and to visualize the data from any events, plotting the sensors’ values in a graph.
The alarm logic includes two main categories: diagnostic and operational. The first type includes problems such as sensor failures, different types of communication issues, and database problems. Among the latter, one can find every other alarm type, such as, for example, excessive accelerations or strains. When the alarms are triggered, an email is sent to a configurable list of recipients, depending on its type.
3. Signal Processing
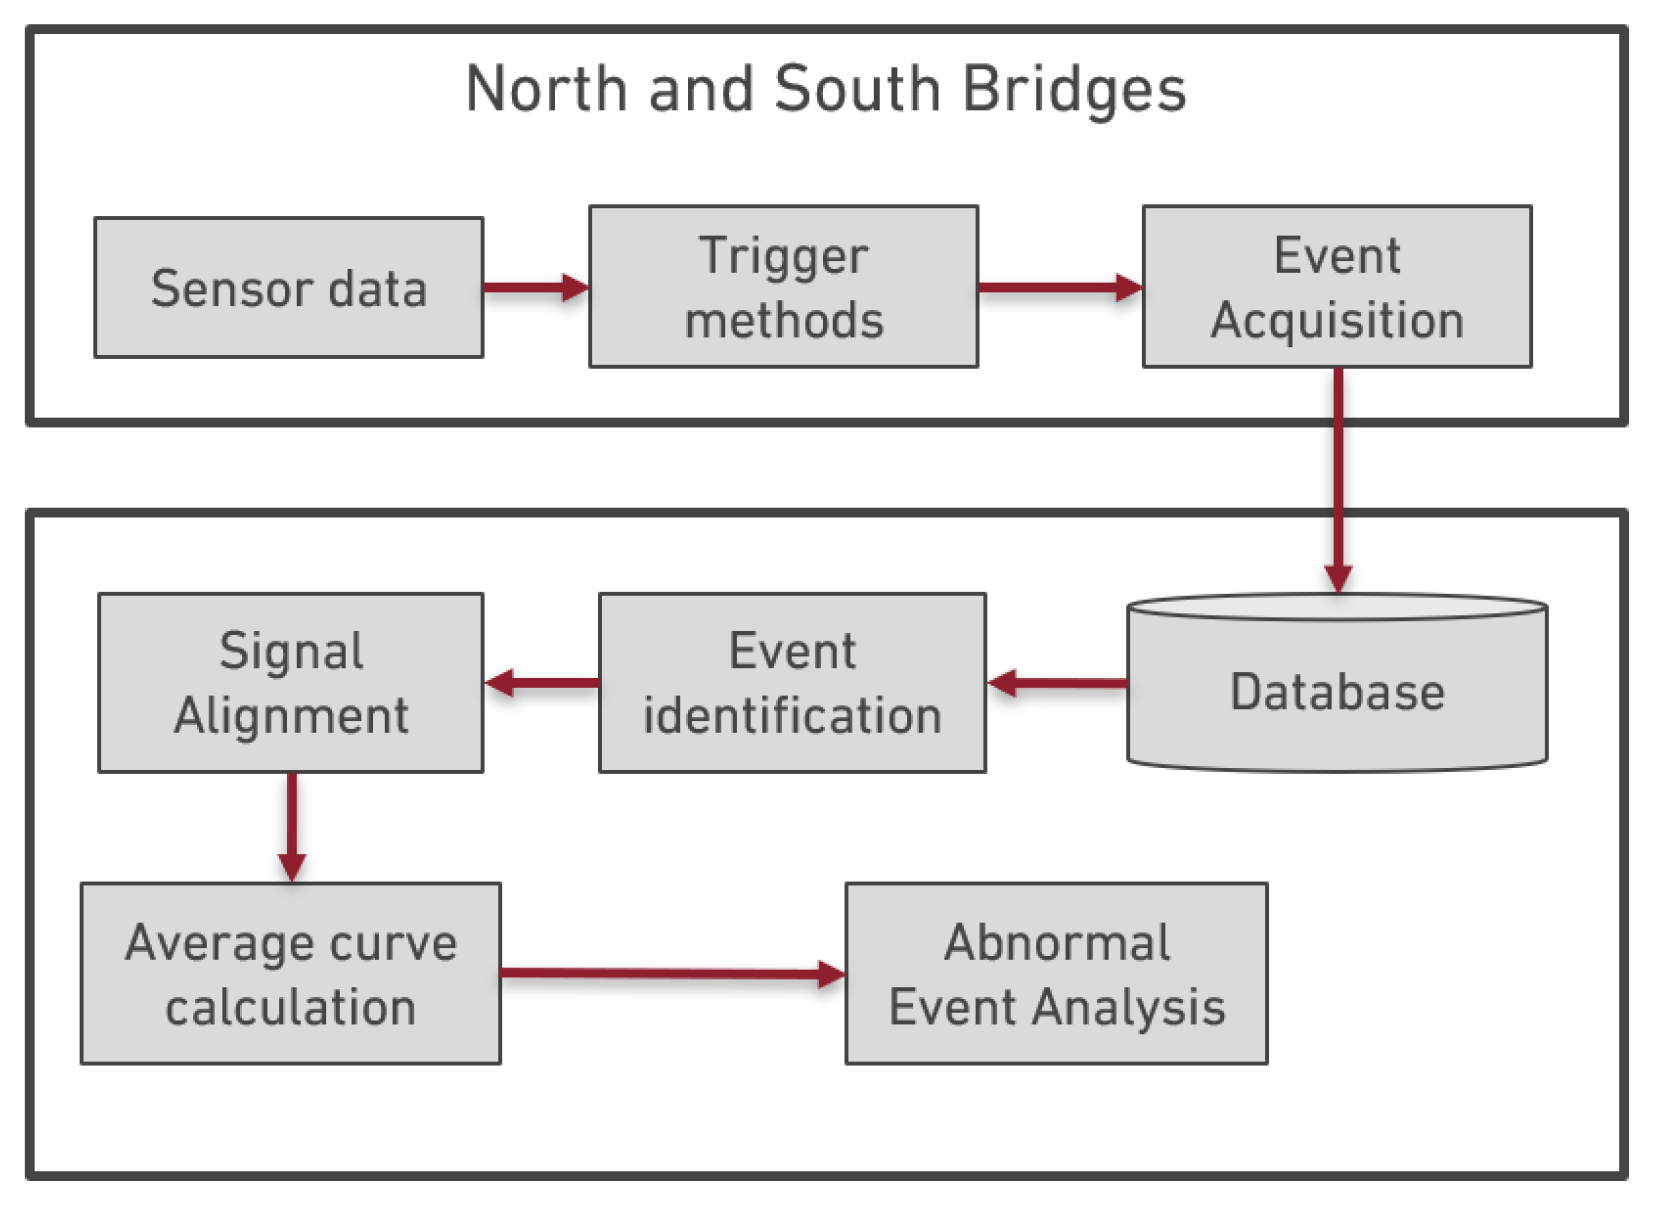
The signal analysis is currently focused mainly on signals related to the operation or the deformation of the structure, with the remaining sensors providing valuable information when necessary. As shown in
Figure 3, the processing method includes triggering methods, event identification, signal alignment, and average curve calculations.
3.1. Triggering and Event Acquisition
As previously mentioned, the developed system works on a ring-buffer basis, with the goal of only storing relevant data and thus limiting the storage requirements to a more reasonable level.
Thus, it is of the utmost importance that good and performant trigger conditions are defined. As these conditions are checked live on every single data point for multiple sensors, their simplicity is extremely important to avoid slowdowns and system instability. As with the final recorded signals, the application of the triggers require compensating for the temperature for the incoming data points, which further limits the complexity of the trigger checks.
Thus, four simple trigger conditions were defined:
- -
One ascending, where an event is triggered if a transition is detected from below a threshold to above it, while comparing the current point to the point 3 s before it in the ring buffer.
- -
One descending, where an event is triggered if a transition is detected from above a threshold to below it, under the same conditions.
- -
Two simple thresholds: larger than and smaller than, where an event is triggered if values above or below a threshold, respectively, are detected.
These were developed to be configurable, and some are more suited to a particular type of data. For example, acceleration data are well-suited to a simple threshold-type trigger.
After an event detection, the system acquires continuously all sensors for a predefined event duration, after which it returns to the ring-buffer procedure. During the first three seconds after this switch, the ascending and descending trigger conditions are compared with the first point in the buffer, as this is the oldest one available in the ring buffer at that point in time.
After acquisition, in order to better understand the behavior of the structure, the signals are post-processed as follows.
3.2. Event Identification
The first step of the signal processing procedure relates to the identification of the event type. Events are triggered by any of multiple trigger conditions and must be correctly identified for further analysis. As the object under study is a drawbridge, three main event types were defined: opening and closing maneuvers, and inconclusive events. The first two types are self-explanatory, with the third corresponding to any event that does not fit the two categories and must be analyzed individually.
For the first two categories, reference signals were acquired experimentally during an opening and a closing of the bridge in good structural health, with the goal of being used as a basis for comparison.
Event recognition was performed focusing on the sensors that were seen as the most representative ones for this identification, i.e., hydraulic pressure. The selection of these signals was made considering previous experience with the same structure. Nonetheless, since these are process variables, they should inherently be representative of the bridge operation. The pressure signals for the cylinders’ secondary or primary chambers can be used in this procedure, with some adjustments. Additionally, the analysis was performed knowing that a stable sampling rate of 100 Hz was used.
Signals under the expected event length were padded with a trailing constant value equal to the last sample. Two copies of the input signal were created,
and
, which will be modified to enable comparison with both event types, open or close, respectively. Any offset is then removed, such that
where
N is the signal length, in samples, and
and
correspond to a data point in the
and
signals, respectively.
Then, a rough alignment is performed by determining the time when the acquired signal crosses two reference levels,
and
, defined for the open and close events. Considering a constant sampling rate, these times are represented by the indices,
o and
c, such that
The same analysis is performed for the reference signals of that same sensor. This results in indices
and
, defined as
where
and
are the reference signals for the open and close events, respectively. In the real analyses,
was defined as 20 bar and
as 50 bar.
The
signal is then shifted by
, while the
signal is then shifted by
, which can be either positive or negative amounts. Then, cross-correlation peaks are calculated for the two as follows:
where ★ denotes the normalized cross-correlation and
and
limit the signal to its more consistent parts. The opposing pressure chamber can be analyzed with the opposite event’s procedure.
The signal is then classified as follows:
If, for some reason, this comparison fails, a simpler approach was used, where the dataset is fitted to a first-degree polynomial and its slope and were used for the detection. If the is too high (>0.8), this means that it represents the signal too well and that it does not represent either signal type. Otherwise, a negative slope will correspond to an opening event, and a positive slope to a closing one. These situations would, however, be flagged and later verified manually to analyze any issues that may have arisen and understand why the regular procedure failed.
3.3. Calculate Average Curve
After every event is classified, their signals are used to obtain an average curve for each sensor, relative to both the opening and closing event types. This enables an individual comparison of an event with the average. Inconclusive events are not used in the calculation of any of the averages, but can later be compared with both.
The first step in this process is to calculate a first and coarse average to be used as a basis to which the other curves are aligned, . This alignment process is required since the signal noise can cause the triggering to occur in slightly different parts of the signal.
This process is slightly different for opening and closing events, but both follow a similar approach, where a reference sensor is selected for alignment and the other signals are aligned based on that. This can be the same signal used for the previous step or not.
For the opening event type, considering
as the reference sensor, in this case pressure, the offset is first removed:
where
N is the signal length, in samples.
Afterwards, a rough alignment is once again performed by analyzing the signal crossings of two reference levels,
and
, which can be different values to before:
where
denotes the coarse average, calculated by
with
m being the number of events under analysis, and
the signal for the reference sensor of one of those events.
The
s signal is then shifted by
n, defined as
Then, the location of a cross-correlation peak between the resulting signal,
s, and the coarse average,
, is obtained:
Then, the final adjustment for this event is given by
which applies to all signals for this event, from their original form.
For the closing event type, the process follows a similar approach, where the offset is first removed from the reference sensor’s signal,
:
Then, a rough alignment is also performed considering two reference levels,
and
:
The
s signal is then shifted by
Finally, the cross-correlation peak between the resulting signal,
s, and the coarse average,
, is obtained:
The final adjustment for all signals of this event, from their original form, can be defined as
In both event types, a fine average can then be calculated for each sensor, following Equation (
7), after shifting the specified amount and filling any gaps with NaNs.
4. Results
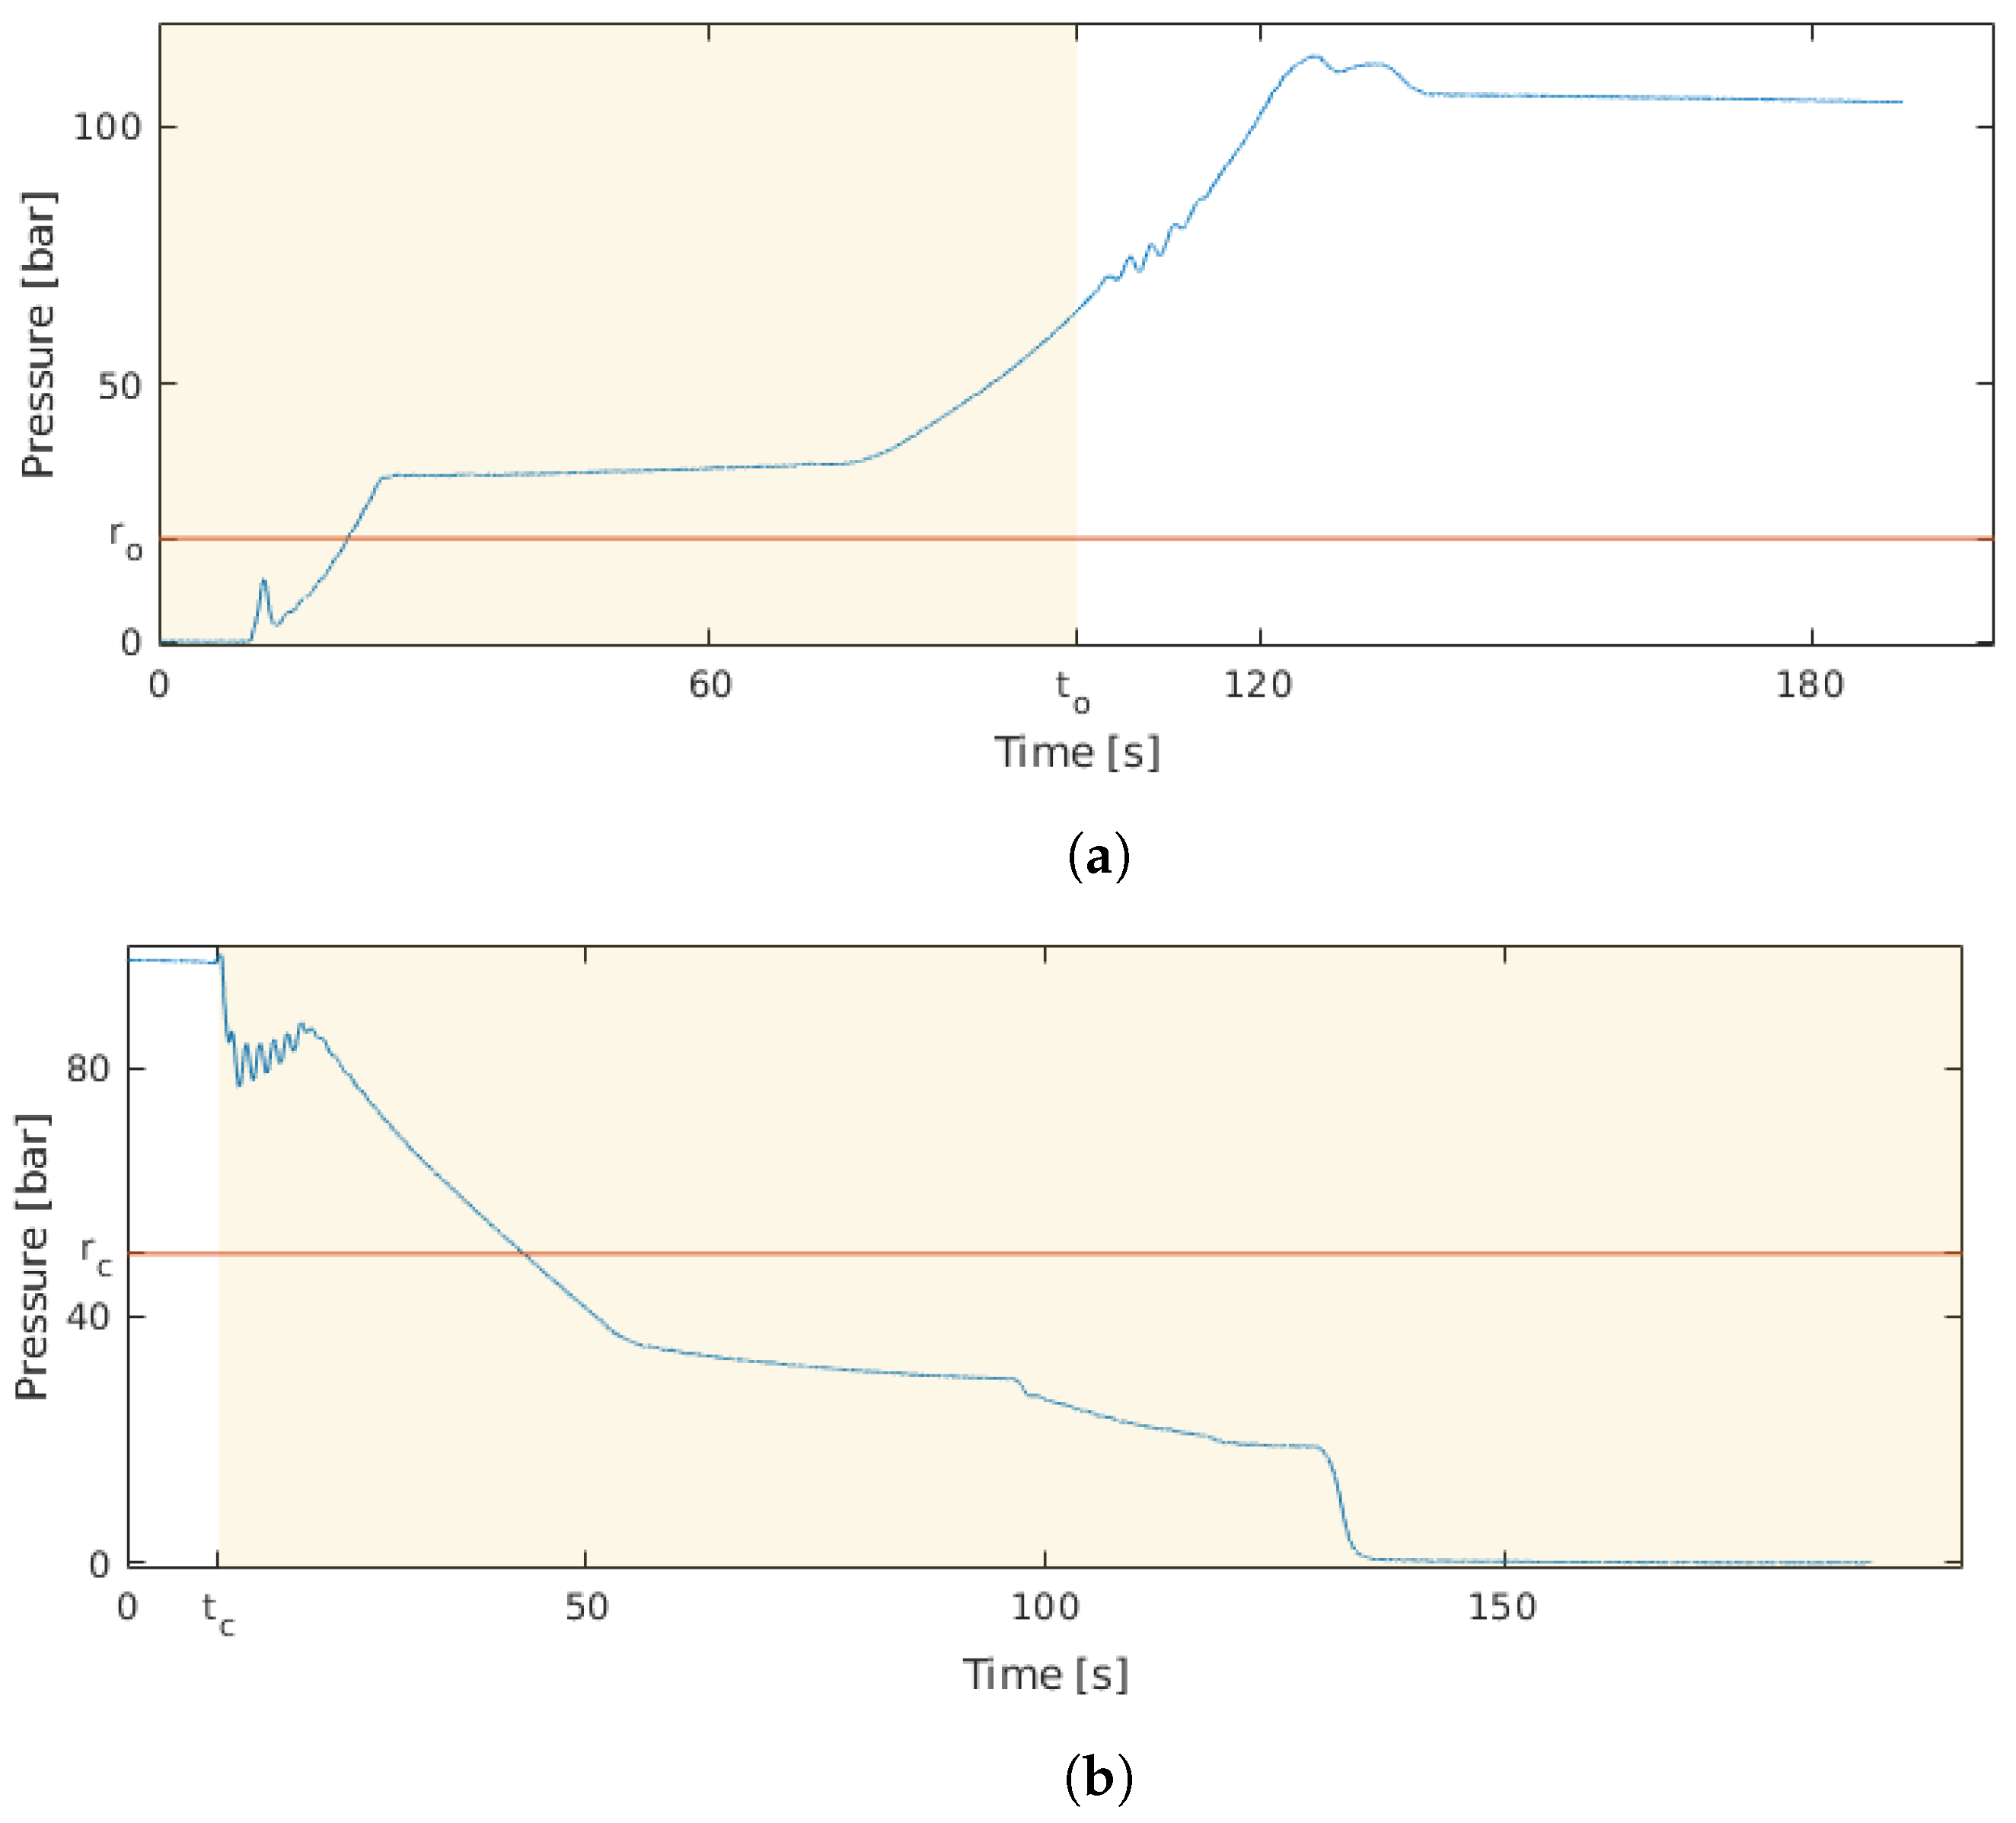
The event identification procedure takes two reference curves as templates, which are used to determine if a particular event is an opening or closing, and are shown in
Figure 4. The regions for cross-correlation analysis are highlighted on each plot in yellow (
,
), while the thresholds for the rough alignment procedure are shown as red lines (
,
).
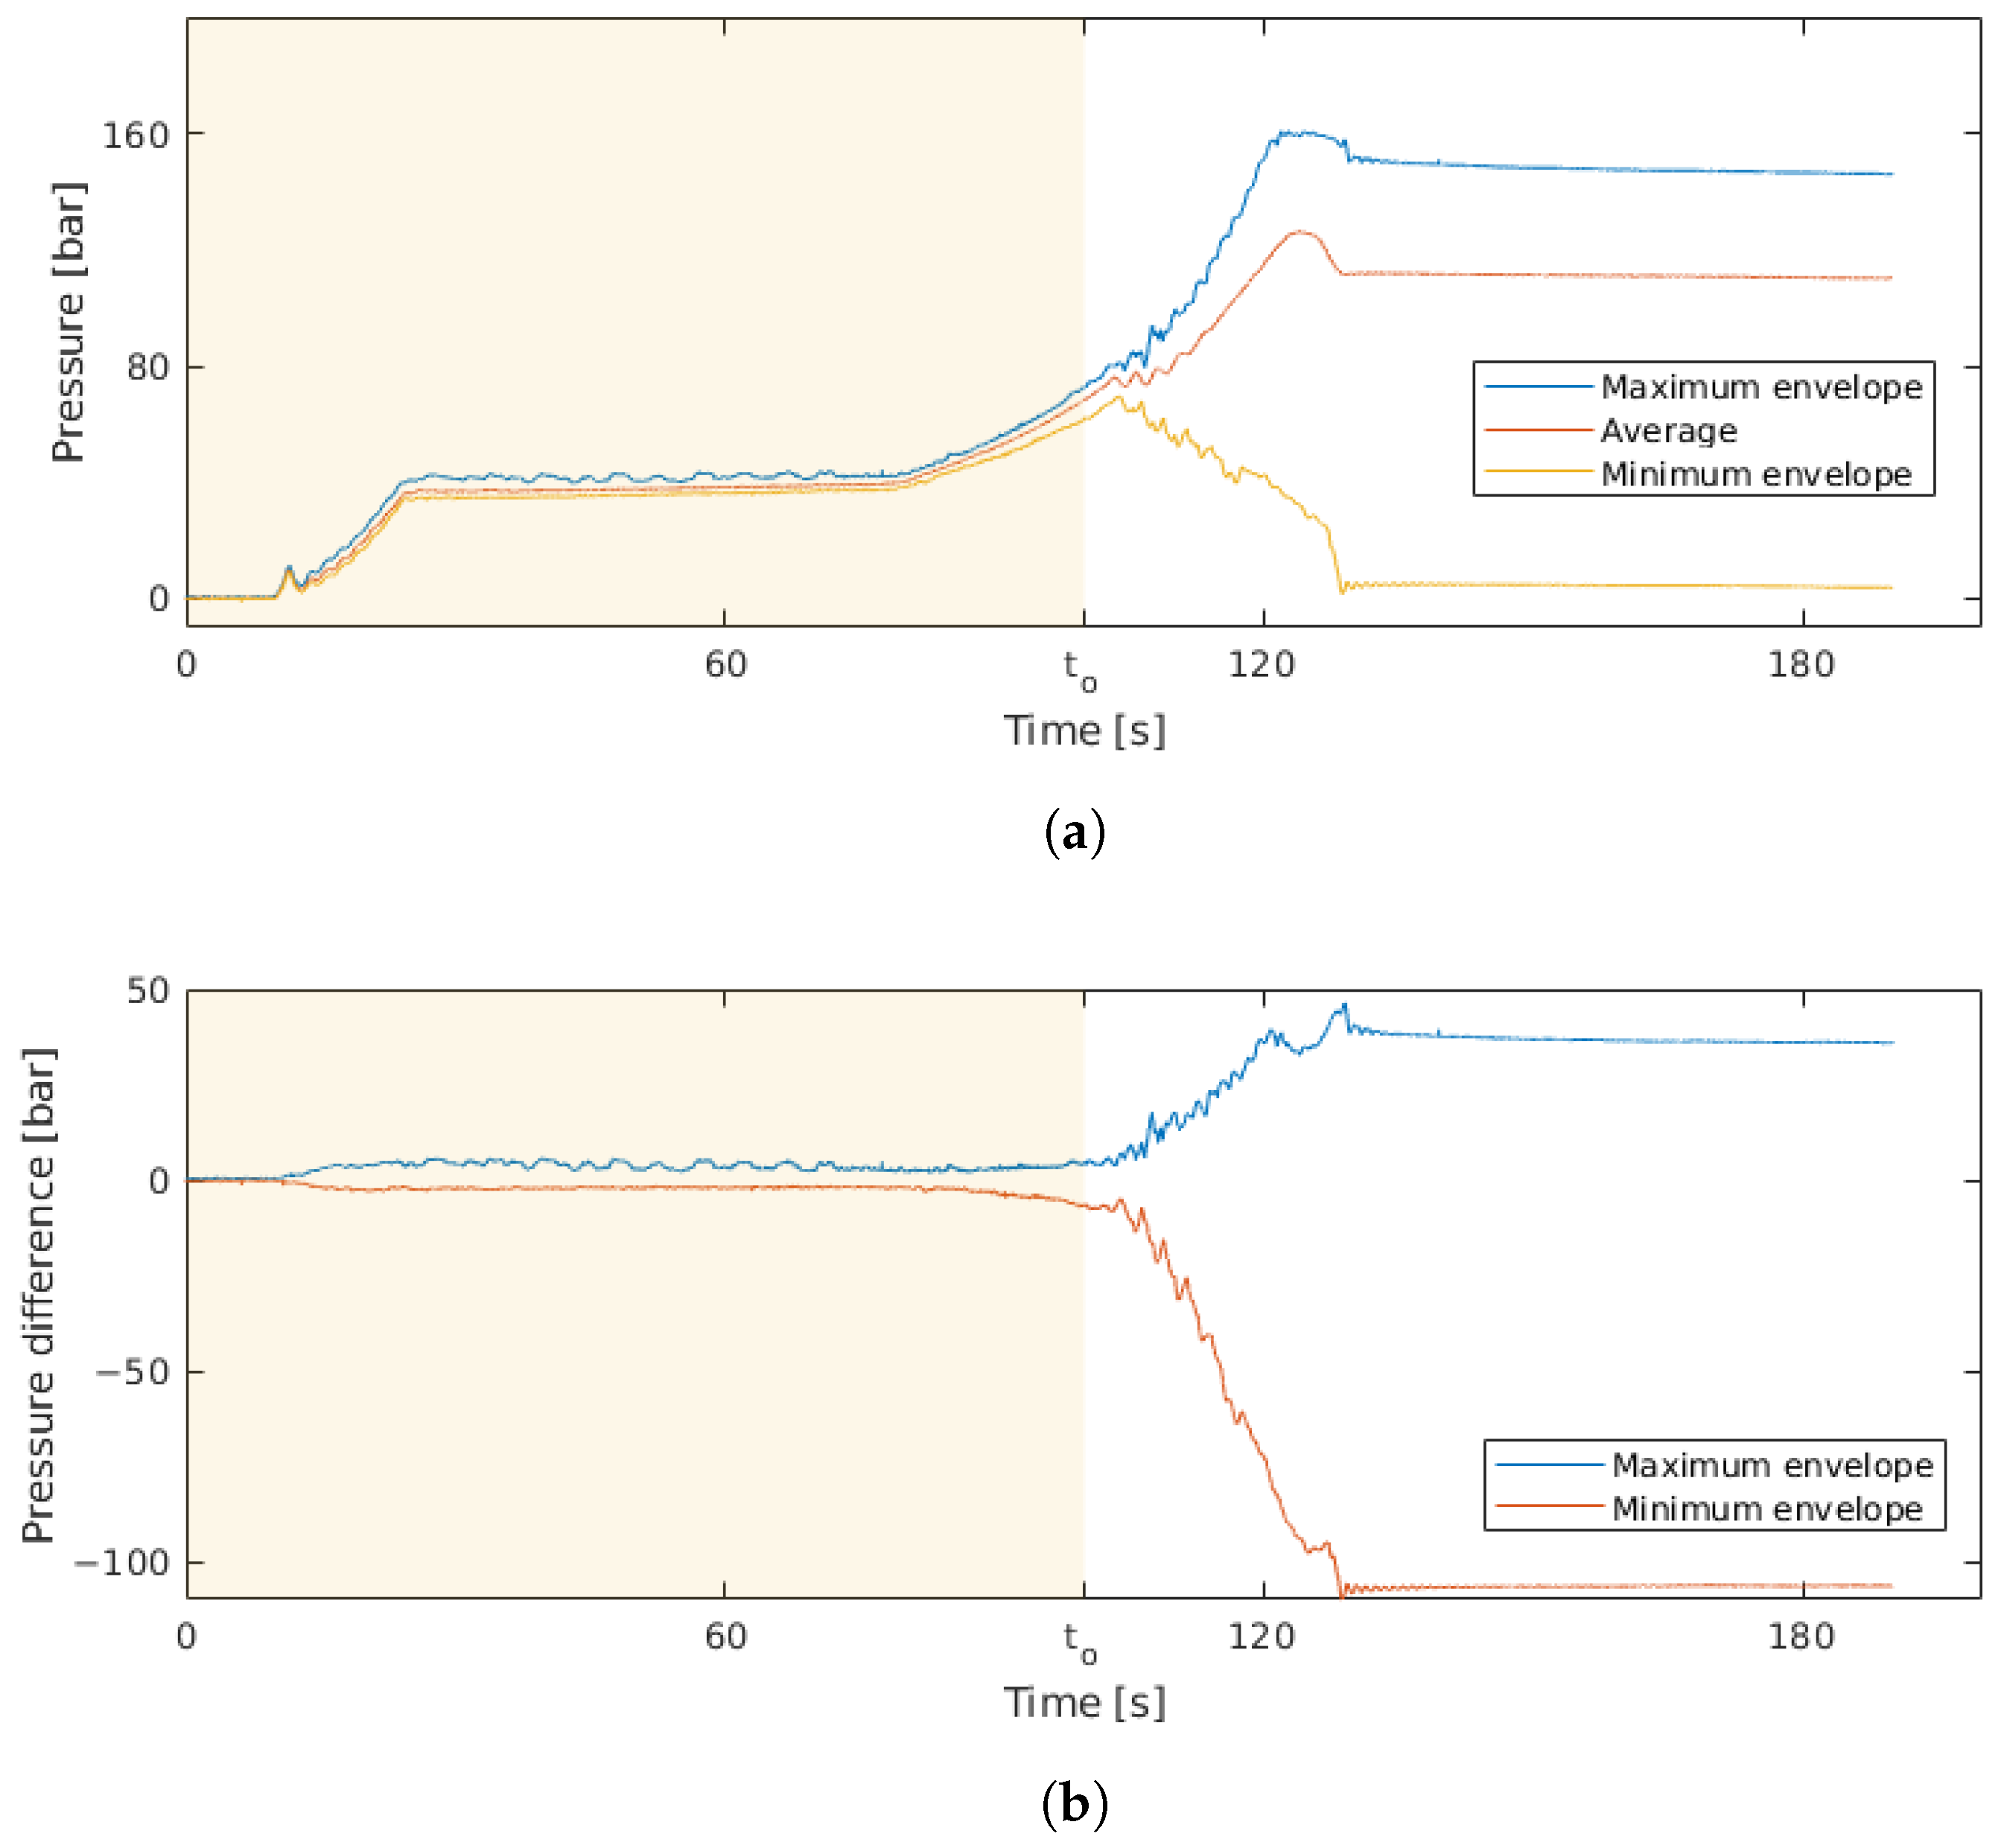
After event identification, the average curve, as well as the maximum and minimum envelopes, can be calculated. The results obtained for the month of January 2024 can be seen in
Figure 5, where it is possible to see that the curves follow the same trends in the shaded region, but deviate significantly later.
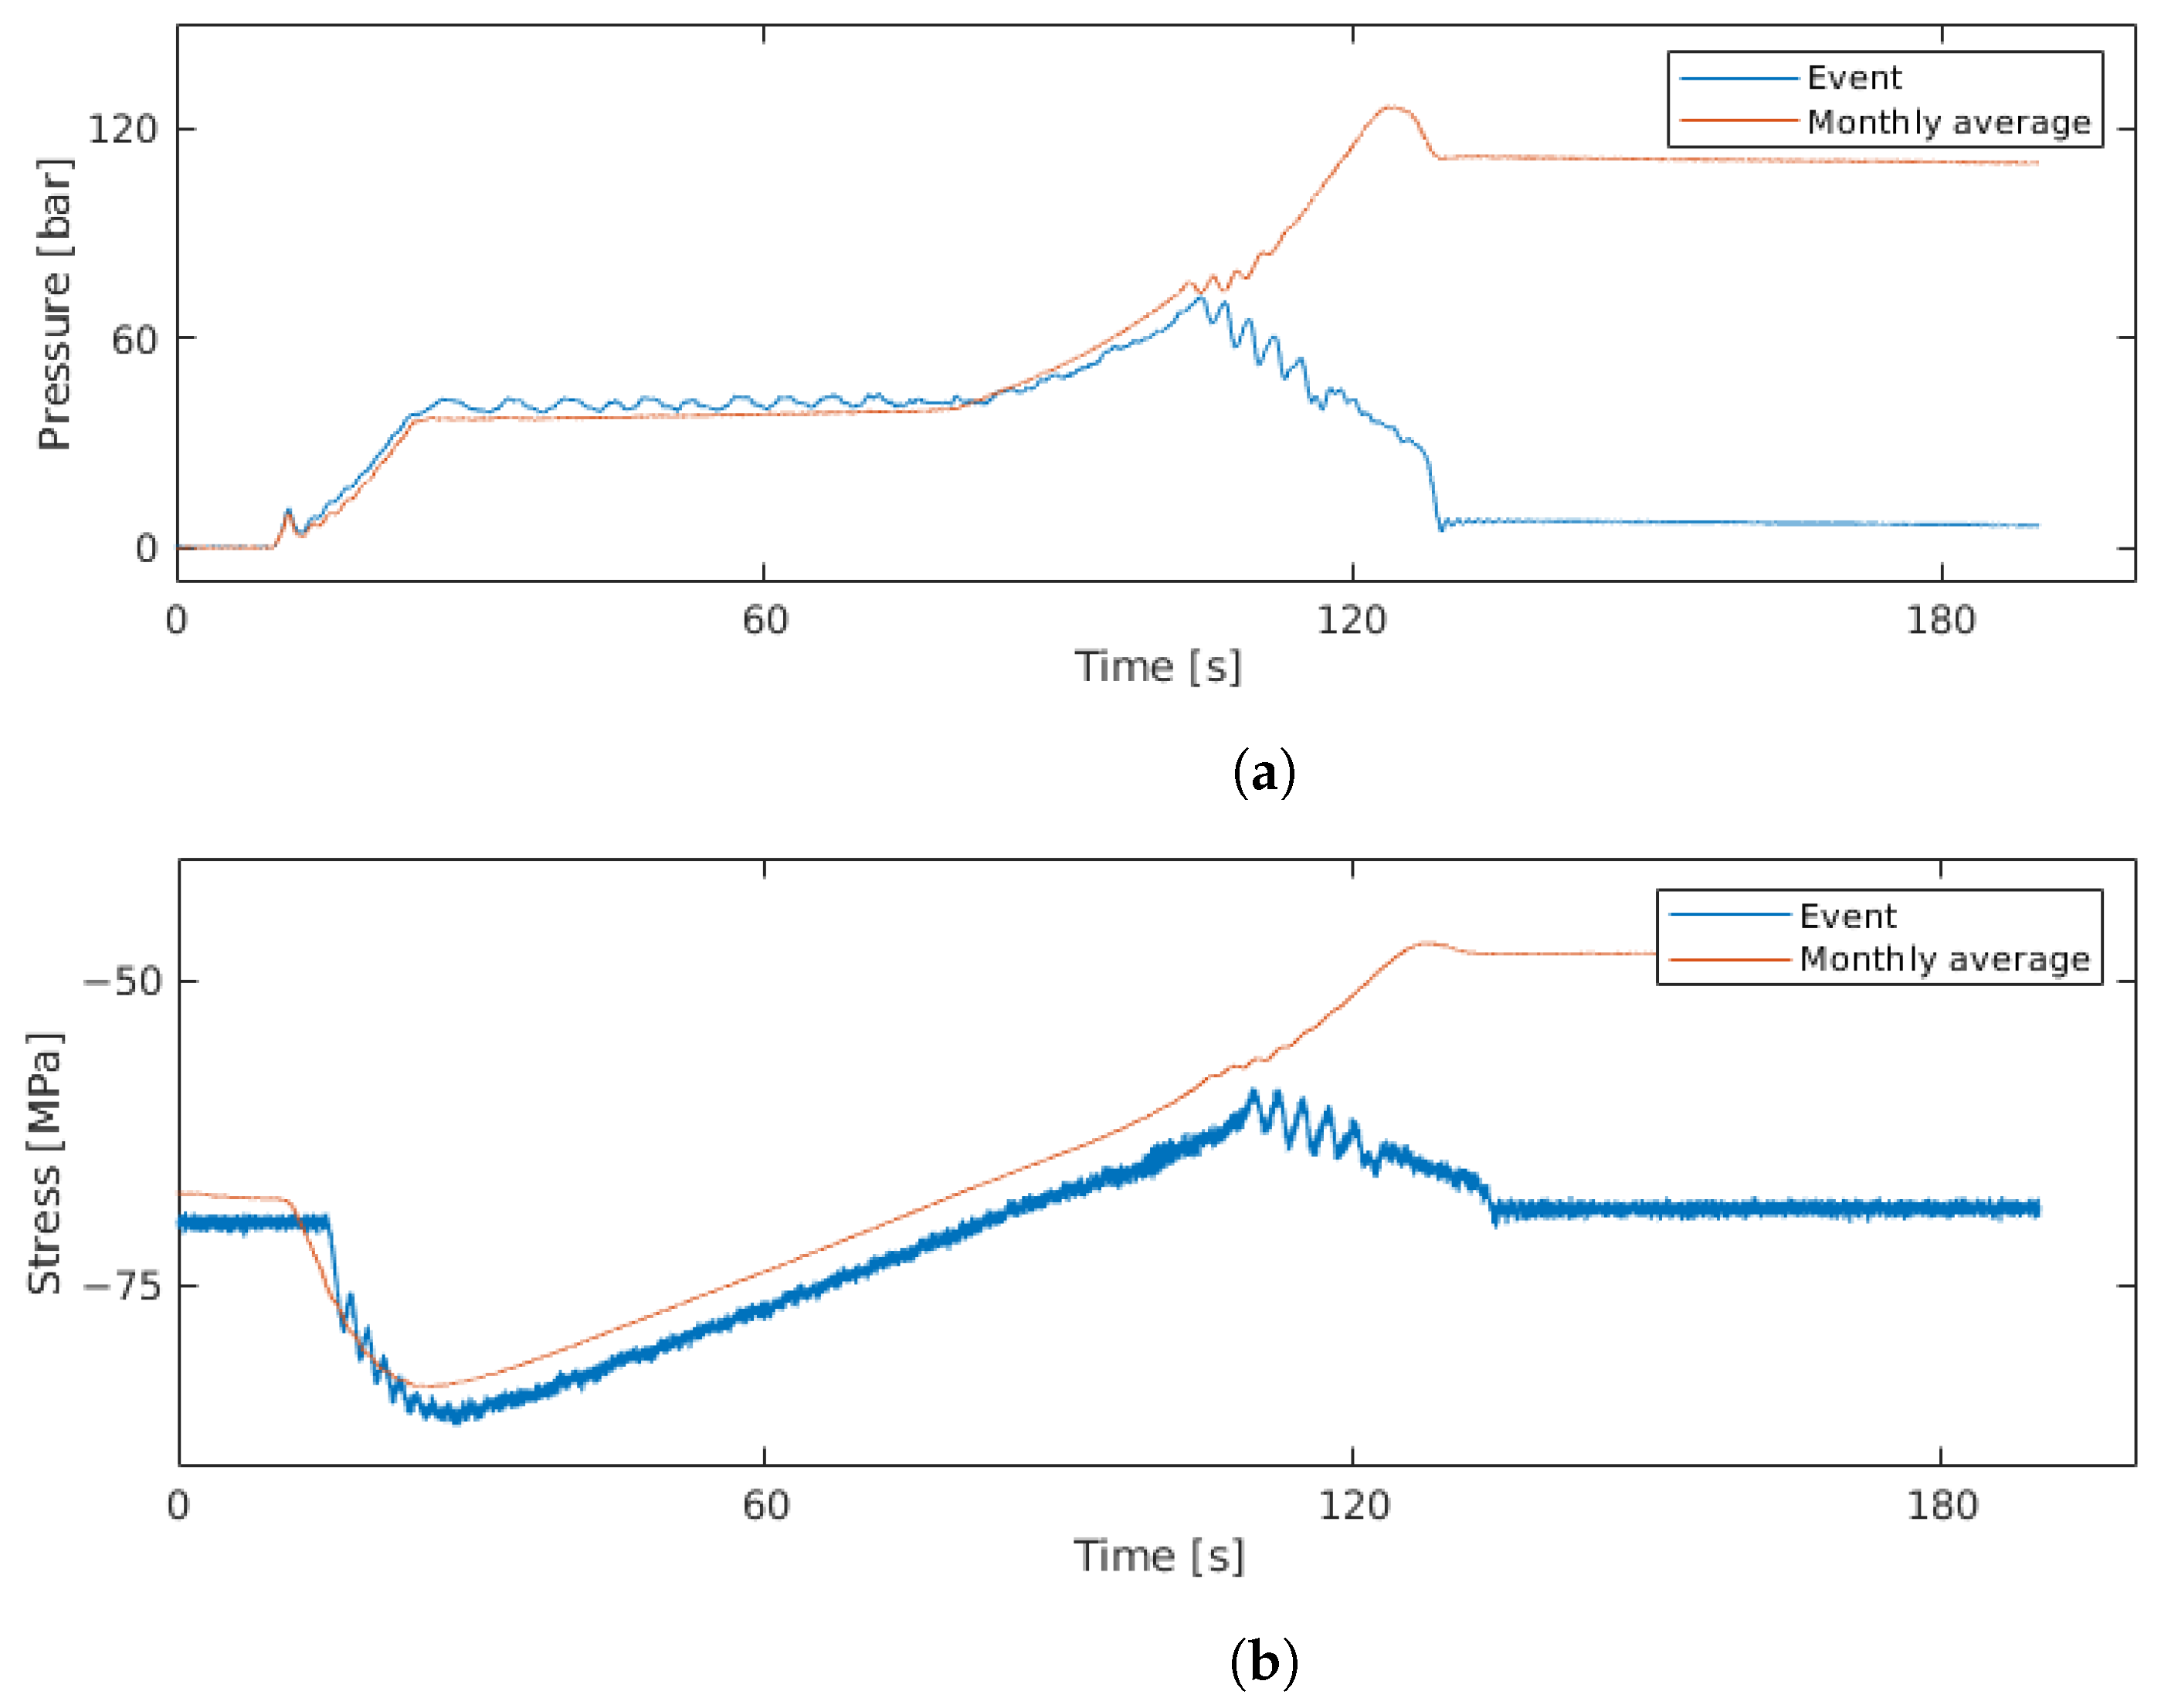
The calculated average curve can also be used to facilitate the extraction of certain parameters from individual events, such as oscillation frequencies, and to easily find deviating behaviour. For example,
Figure 6a shows an outlier opening event, where it is possible to see significant oscillations that are either not present in the average signal or have significantly lower amplitudes. In parallel, the same analysis was performed for other sensor signals. For example, in the same outlier opening event, the principal strain measured on the structure, and shown in
Figure 6b, also includes deviating behaviour, which manifests as an oscillation and a deviation from the average.
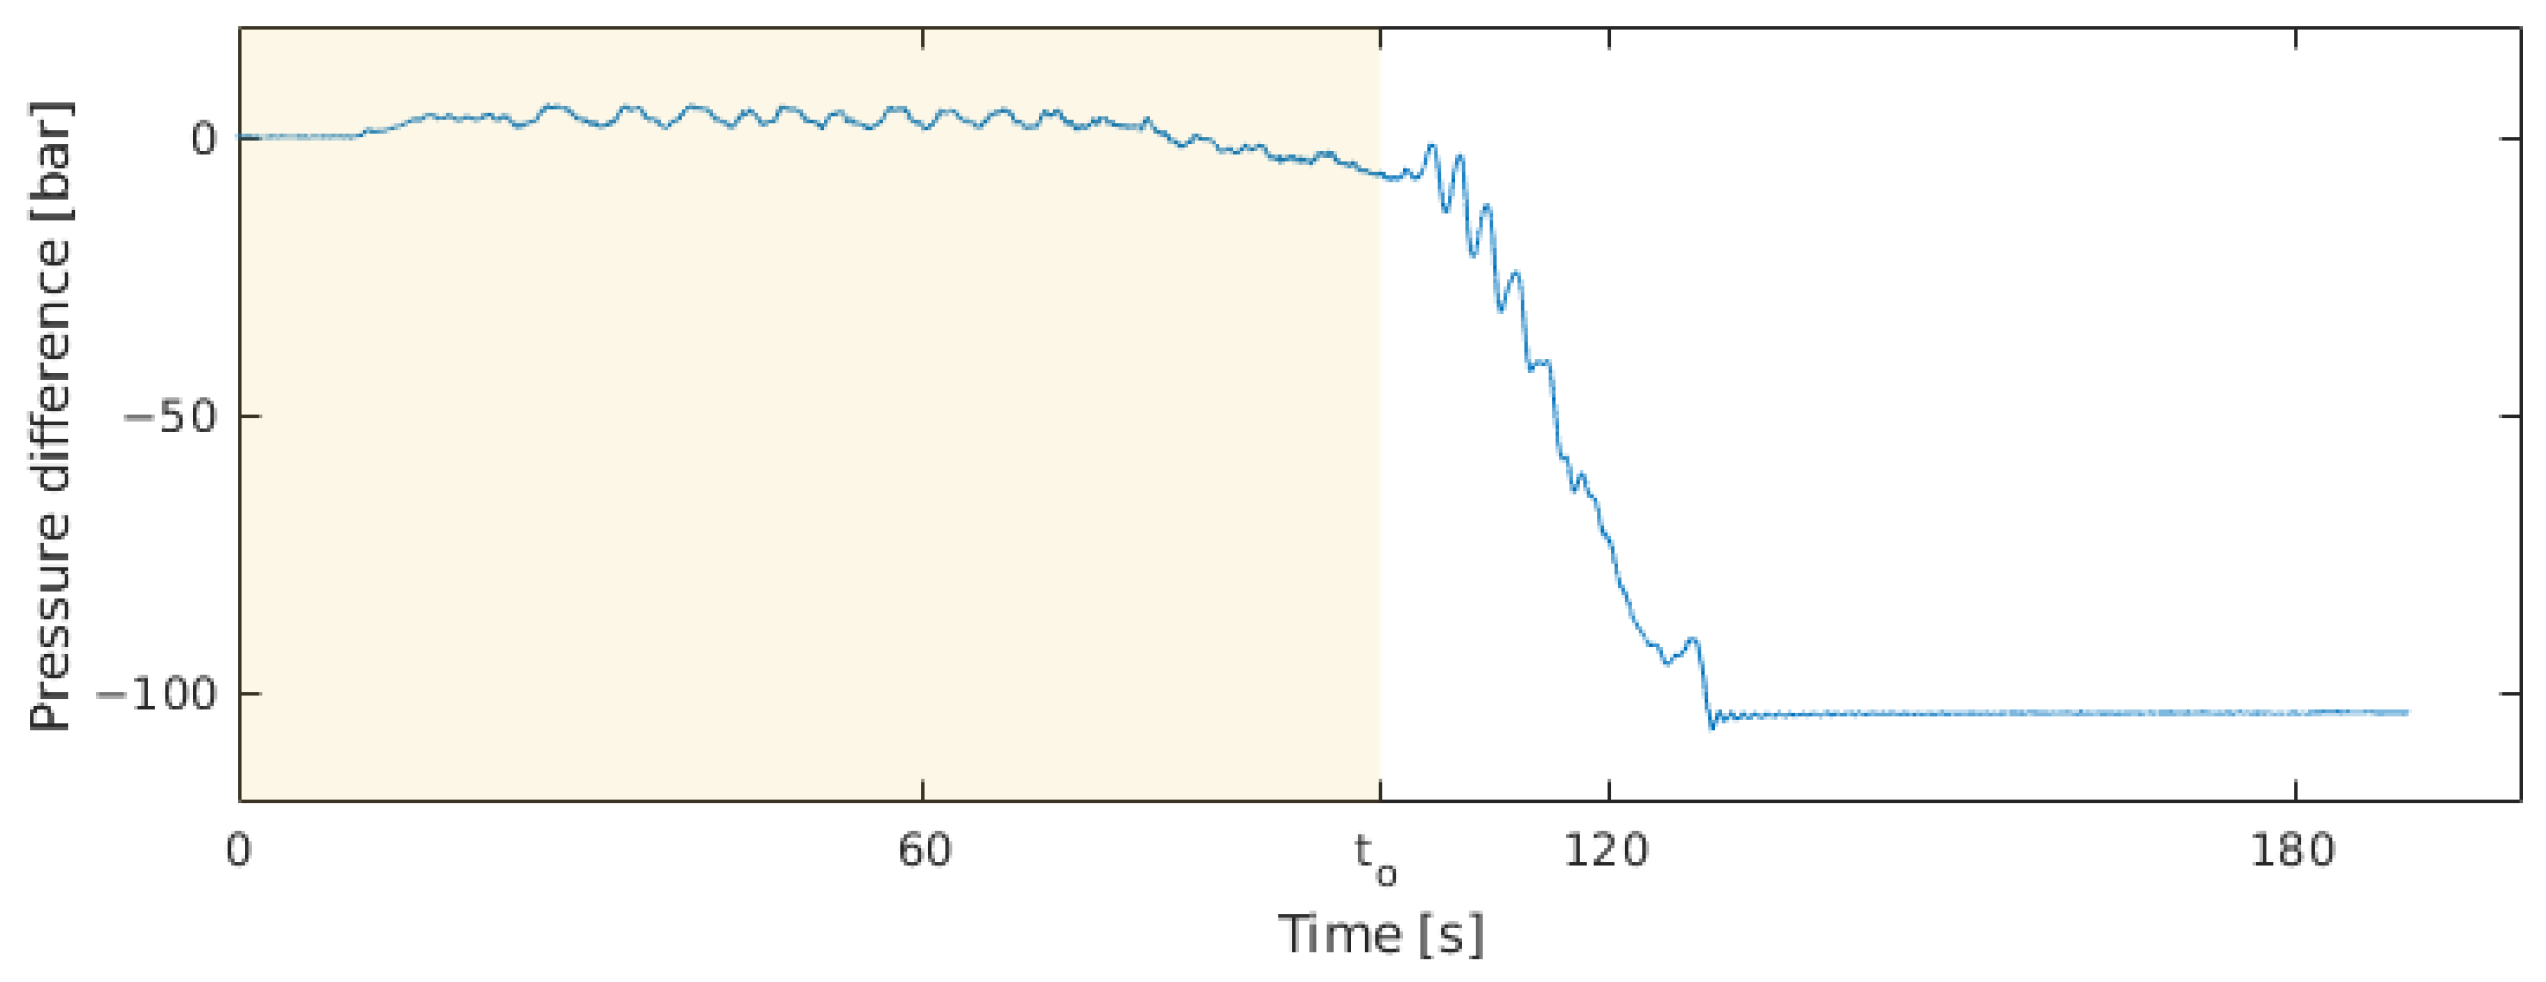
To further analyse these deviations, the difference between this particular event and the average curve can be calculated, obtaining the curve shown in
Figure 7. In this particular case, it is possible to clearly notice an oscillation in the middle of the shaded region at approximately 0.2 Hz, which is not present in the reference signal. Additionally, it is possible to see that the difference magnitude increases approximately linearly after the end of the cross-correlation matching region, showing that the underlying behaviour of the structure is still present, such as the final hump of
Figure 6a, which is removed in the difference plot.
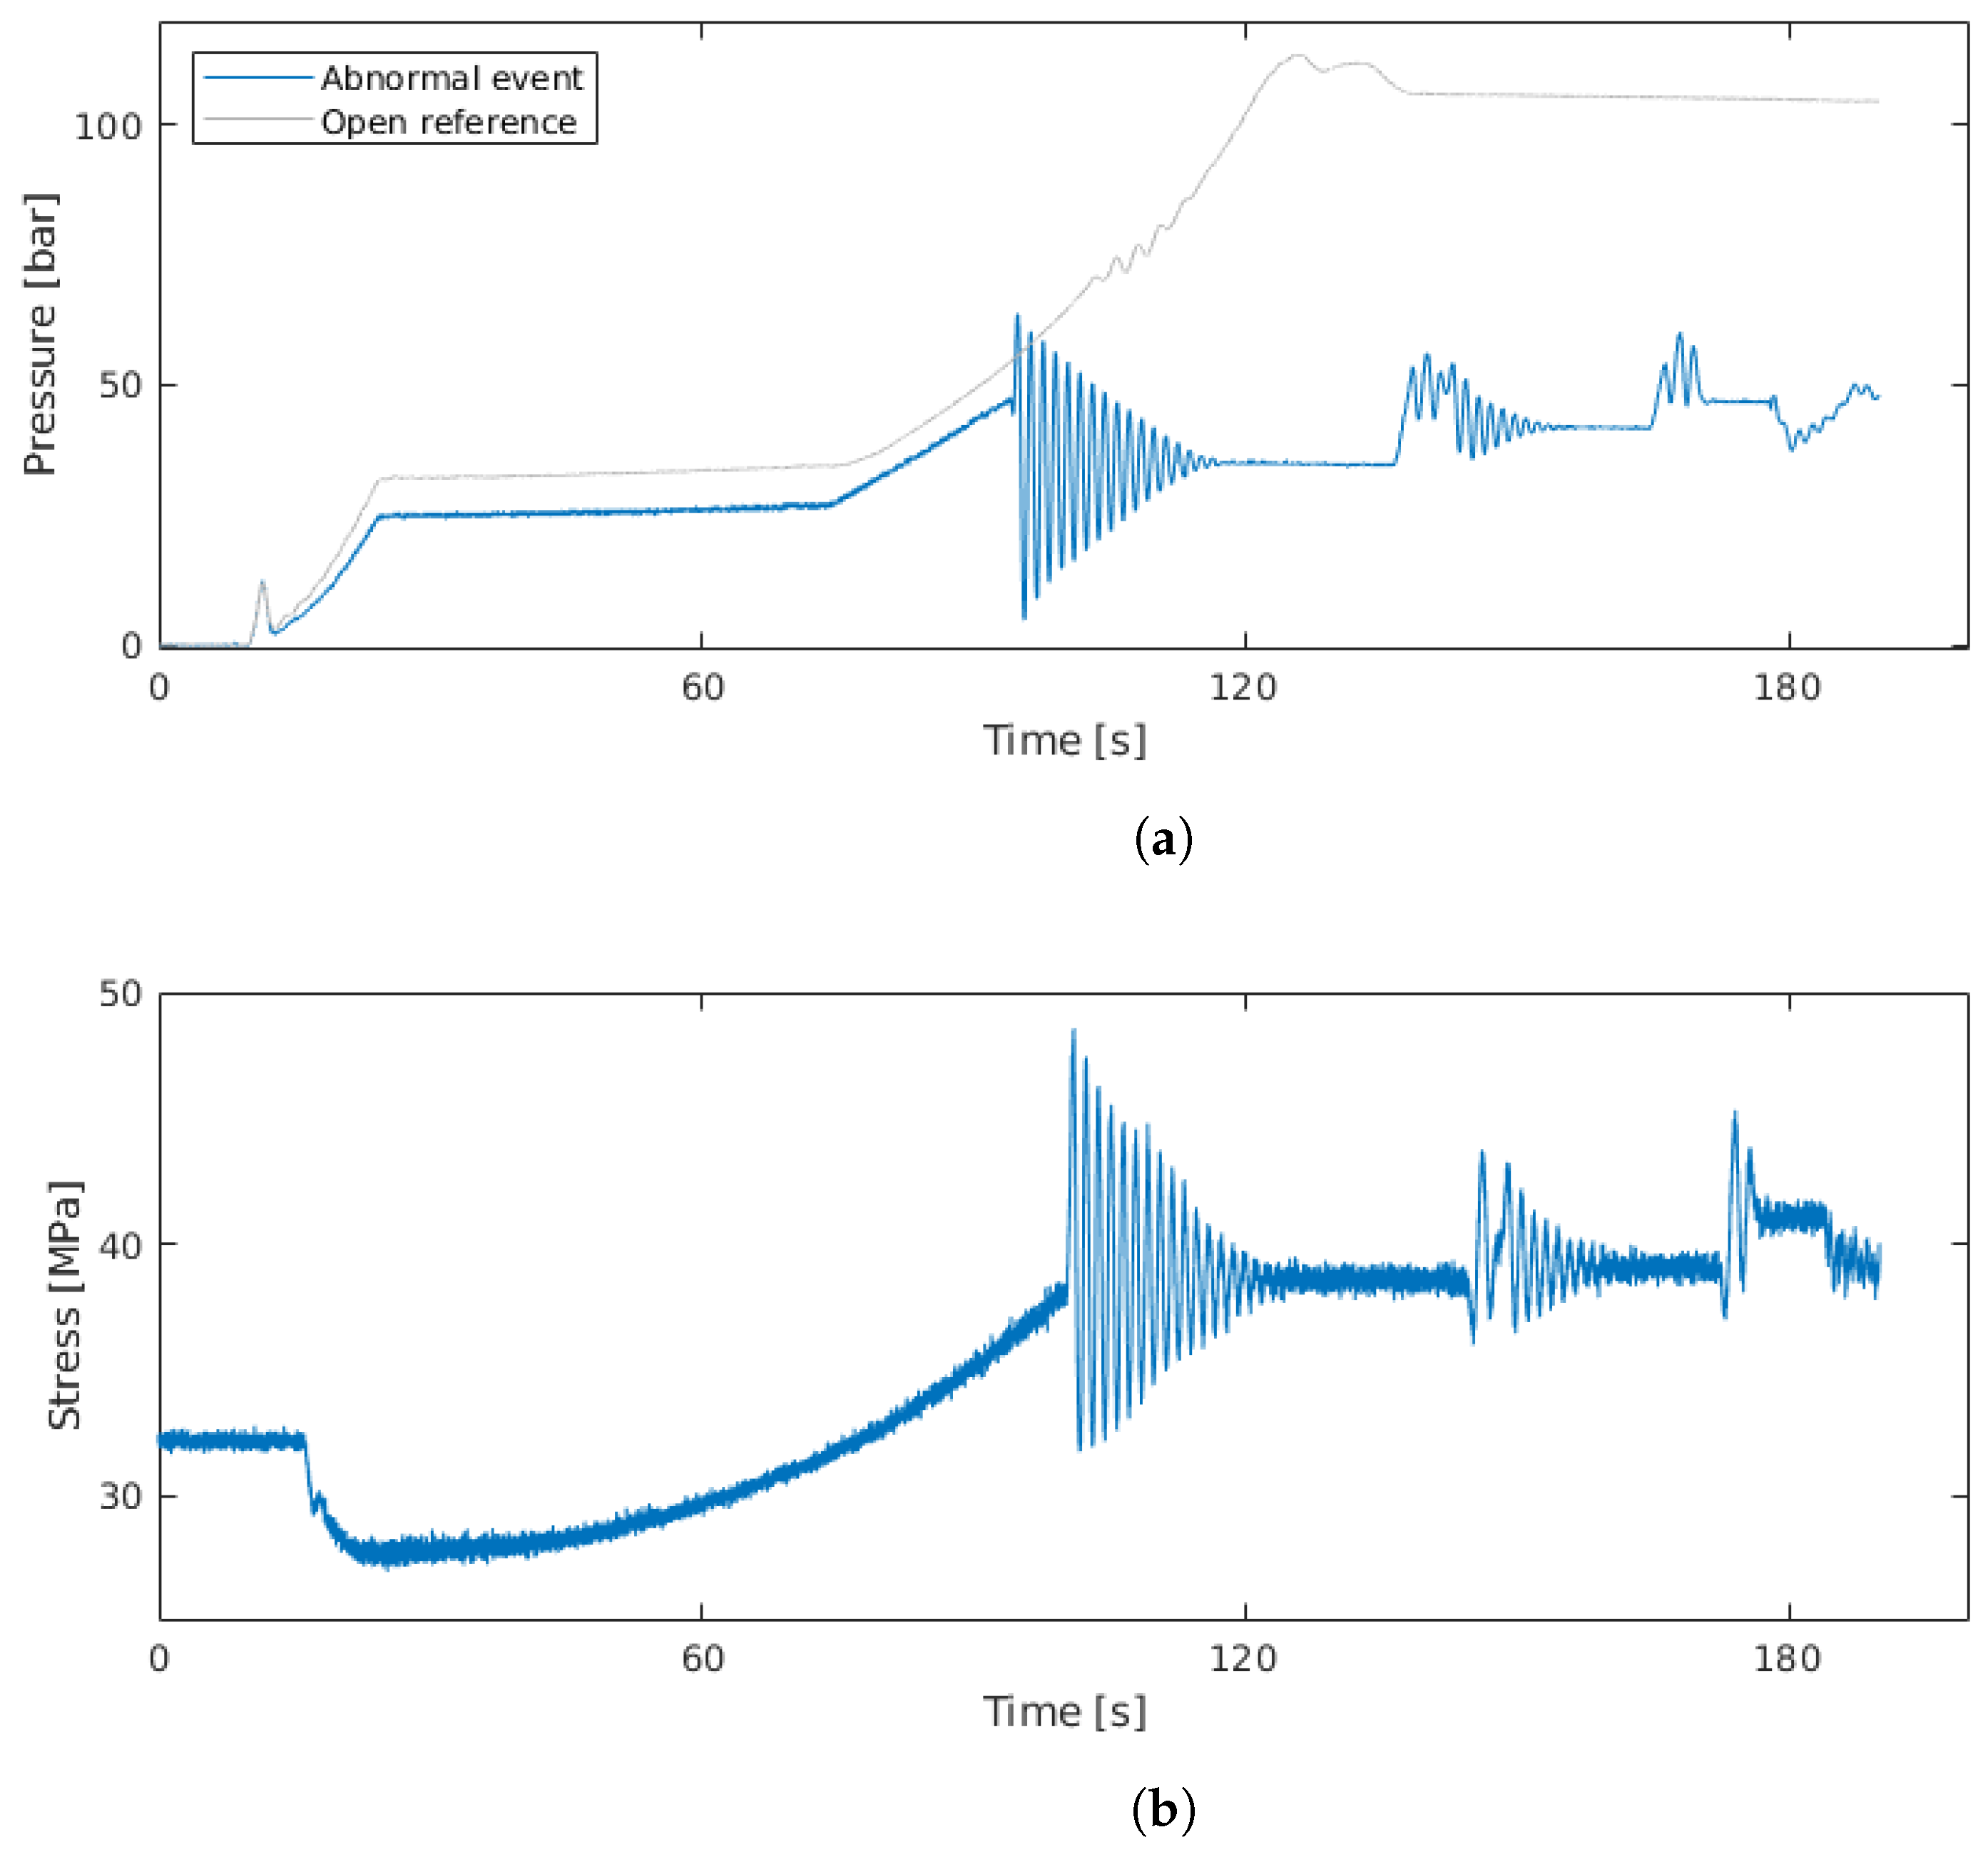
The proposed classification procedure is able to classify events into three categories: the previously mentioned opening and closing movements, as well as inconclusive ones. These often become the most interesting ones, as they do not fit the requirements for either an opening or closing movement and thus reflect an unexpected situation.
For example, the curve shown in
Figure 8a was classified as an inconclusive event. Even though it is possible to see that the event starts as a regular opening, it is also visible that, at some point, a mechanical issue caused a deviating behavior with significant oscillations. This is followed by the bridge operator’s actions to return the system to working order.
Complementing this,
Figure 8b shows matching rosette data for the same event, where it is possible to see the same oscillation profile as with the pressure sensors. After detecting abnormal situations, the main challenge is identifying the root cause. In this case, the two main possibilities are that either a hydraulic issue caused the oscillations or the structural behavior caused them. Any such event will then be submitted to further analyses to try to obtain a conclusive response to this question.
5. Conclusions
The developed monitoring system has been in operation for an extended period of time, during which it was already able to detect some anomalous situations and provided valuable insight regarding what happened, helping to identify their causes.
The proposed signal processing methods were developed considering the target bascule bridge in particular, making use of the expected waveforms to align and identify events.
The monitoring system has been in full operation since October 2023 and has analyzed, on average, 200 open and 200 close events per month. During this time, maintenance of the sensing system was also of utmost importance to ensure the availability of data when required. The next steps in this development include the continued maintenance of this system, as well as the analysis of future events. Another logical step, considering the increasing amount of available data, would be the implementation of predictive algorithms.


 ,
, 
