Abstract
Our contemporary society has never been more connected and aware of vital information in real time, through the use of innovative technologies. A considerable number of applications have transitioned into the cyber-physical domain, automating and optimizing their routines and processes via the dense network of sensing devices and the immense volumes of data they collect and instantly share. In this paper, we propose an innovative architecture based on the monitoring, analysis, planning, and execution (MAPE) paradigm for network and service performance optimization. Our study confirms distinct evidence that the utilization of learning algorithms, consuming datasets enriched with the users’ empirical opinions as input during the analysis and planning phases, contributes greatly to the optimization of video streaming quality, especially by handling different packet loss rates, paving the way for the achievable provision of a resilient communications platform for calamity assessment and management.
1. Introduction
As the fourth industrial revolution unfolds, we bear witness to the emergence of immersive ideas and technologies such as autonomous vehicle interconnection, remote automated management, machine-to-machine interactions, and emergency response efficiency optimization. The scaling of these ecosystems to a metropolitan or even global magnitude forms a concept described as the Internet of Things (IoT), wherein sensors and actuators operate and interact with our environment in a seamless and energy-efficient way, making volumes of information available across interoperable platforms [1,2]. However, legacy and on-premises architectures do not posses the capacity or the intuitiveness to accommodate or support the accessibility of IoT information. In order to materialize implementations of tremendous scale and ubiquitous distribution, commercial hosting infrastructures have transcended the limitations of obsolete technologies by embracing the common principles and patterns of cloud-native infrastructure (CNI) [3]. CNI contributed to the emergence of cloud-native computing (CNC), which constitutes an innovative approach in the development of globally scaled cloud-native applications (CNAs) [4,5].
Nevertheless, universal distribution requires careful orchestration of data synchronization in order to secure its consistency. Low interaction latencies and IoT data consistency can only be achieved by including next-generation networks (NGNs) of equivalent scalability and flexibility. The indisputable state-of-the-art NGN candidate capable of integrating ideally with CNI is 5G [6]. This highly scalable, fifth-generation telecommunications technology standard offers more than just high speeds with low latency and increased bandwidth capacity. In fact, 5G is becoming dominant by incorporating novel concepts such as software-defined networks (SDN) and network function virtualization (NFV) [7]. Both architectures constitute the foundation for introducing functionality and resource disaggregation solutions to new business scenarios over NFV infrastructures (NFVIs) [8]. Hence, 5G incorporates virtualization functionalities, over either standard virtual machines (VMs) or operating-system-level virtualization containers [9,10]. By doing so, it chains together virtual network functions (VNFs) and network services (NS), executing distinct processes not only on standard hardware appliances but also on CNC-enabled infrastructure [11]. Moreover, by means of network slicing, efficient VNF administration and maintenance can be achieved via its integrated management and orchestration (MANO) capabilities [12].
In this new digital era, where the boundaries of traditional computing are exceeded by entering the cyber-physical domain through robots, sensors, and autonomous processes, new vulnerabilities and attacks are introduced, affecting a wide range of real-time, mission-critical, and industrial control systems [13,14]. Standardization, as well as network design, configuration, deployment, and operation, constitutes the bedrock of the telecommunication network security guidelines and is essential to meet the requirements of the broad cybersecurity environment. Furthermore, compliance with the General Data Protection Regulation (GDPR) is mandatory and requires specialized human resources to study the regulations and then implement any changes in company procedures, IT applications, and infrastructures [15].
Nonetheless, the problems of self-adaptation and optimal placement of computational and networking CNI resources with near real-time responsiveness form the minimum common denominator that constrains the consolidation of CNAs of a global caliber and poses a threat to their functional effectiveness. To overcome this barrier, additional robust strategies should be adopted, while operating in unison with the MANO architecture. Thus, the MAPE framework was conceived as a shell for an overall CNA management and orchestration platform. At its core, the MAPE model iterates the following steps: introducing mechanisms to monitor a target system and its environmental variables, considering observations in tandem with the system’s architectural model, assessing improvement and optimization possibilities, intuitively deciding on a course of action, and ultimately deploying any possible selected alterations. It was primarily conceptualized by IBM in 2006 as a reference architecture, and its implementation was achieved mostly by the open-source solutions the company was supporting during this time [16]. In the modern era, the MAPE concept was furthered by the Sonata MANO platform [17] as it was gradually being incorporated in the 5G ecosystem. Since then, conditions have become more favourable for elaborating MAPE in CNA-related projects, as described primarily in Section 3, and its principles can easily be embodied in many use cases to overcome existing architectural limitations [18].
From this perspective, it is obvious that guaranteeing a specific QoS level is not an easy task, as the architecture of modern NSs has become more complex, and at the same time, the users’ requirements have increased. Even though technologies and frameworks for the management and orchestration of the physical and virtual resources are available, the analysis of each NS performance based on the users’ requirements and their life-cycle management in real time is not guaranteed. In this context, we study an intelligent MAPE-based optimization scheme that utilizes machine learning (ML) techniques. The performances of NSs, as well as the availability of the resources of the physical and virtual infrastructure, are analysed by trained ML models, in order to quickly and aptly adapt the orchestration actions of CNI resource allocation and scaling in highly dynamic and unknown critical environments. Our study confirms that the inclusion of quality-of-experience (QoE) metrics as input to the applied ML algorithms contributes greatly to the optimization of video streaming quality. Our proposal for an intelligent optimization service can be also viewed from a more generic perspective and applied in other use cases where cyber-physical systems are deployed to automate and optimize operations, such as those in the smart manufacturing sector and new-generation warehouse and logistics systems [19,20]. In these use cases, a digital twin of the processes in action are at the focus of the activities of the international research community and of IT solution designers. Our approach can be applied and tailored to these use cases to enhance current approaches with respect to intelligence and security. The synchronization between cyber systems and physical entities (as also in the case presented in this paper) is a crucial parameter for achieving the overall goal of action optimization in each case. Our experimental results show that the fluctuations in QoE metric values provide the advantage of swifter and more optimal service recuperation while handling parameters easily susceptible to change such as frame rate, bit rate, and packet loss.
The remainder of this paper is organized as follows. In Section 2, we present related work, while in Section 3, the proposed MAPE-based architecture is illustrated. The adopted methodology of MAPE’s analysis service is documented in Section 4. Finally, Section 5 and Section 6, respectively, provide a concise description of the experimental results and conclude the paper with a presentation of future work.
2. Related Work
Over the past half century, the deployment of network management systems (NMSs) was the established practice for applying monitoring and management operations to computer networks [21], and exemplary attempts have been made to modernize their functionality. The authors of [22] conceptualized a novel architecture for network management where applications are treated as software-oriented equipment, and therefore all resources, either physical or intangible, can be managed under the same model. By incorporating a mechanism known as active network technology [23], they theorized the dynamic construction of the governing functions and the active distribution of the related code across the network system. Although the idea may be conceptually relevant to adaptive network administration, its core architecture is based on obsolete technologies. Thus, the aforementioned model may not be applicable in modern, cloud-based applications where self-adaptation and optimal placement of resources with near-real-time responsiveness may be considered as prerequisites.
Another approach to network services optimization uses virtual network embedding (VNE) strategies [24]. The solution proposed in [25] seeks to address the problem of mapping virtual networks (VNs) of incoming virtual network requests (VNRs) onto a substrate underlay in an optimal way by maximizing the metric of revenue. The authors decompose the VNE problem into the two distinct subproblems of virtual node mapping (VNM) and virtual link mapping (VLM) and then deal with them separately. A greedy algorithm is used to solve VNM by choosing a set of eligible substrate nodes for each virtual node and then assigning the computational demands to the prominent one in every case, based on its available resources. However, the absence of coordination between the VNM and VLM results in disproportionally distancing the neighboring virtual nodes on the substrate topology, thus increasing the overall cost of the embedded paths and consequently resulting in low acceptance ratios, high network latencies, and low long-term revenue.
The adoption of cloud computing technology introduces new challenges regarding virtual resources management and network services performance. In this context, the authors in [26] propose an evolution-oriented, cloud-specific solution that focuses on security properties. The developed framework provides support for the evolution of applications by means of monitoring mechanisms that enable the analysis of experiences gathered during the deployment phase. To mitigate future security risks and vulnerabilities that cannot be predicted, the proposed solution integrates an evolution process oriented around real-time analysis and control operations, which includes the distributed and heterogeneous functionalities of cloud applications in the process loop. Consideration of novel security mechanisms and comparisons between the respective implementations are beyond the scope of this study. In [27], the authors introduce techniques that are oriented around policy management, in order to securely orchestrate cloud infrastructure. Intuitively, the proposed framework provides the capability of expressing these policies in multiple programming languages, supporting also various levels of abstraction. However, the challenges that remain represent a significant obstacle. The development of a formal policy language designed to express the desired policies that would cover key areas ranging from resource management and security to monitoring and access control is yet to be substantiated and materialized.
Nevertheless, the modernization process of integrating applications and services into IoT-oriented CNAs dictates compliance with the same set of principles, in order to overcome the challenges of self-adaptation, allowing these managed systems to auto-adjust with minimal or no human intervention. The Rainbow project [28] implemented an automated monitoring and analysis loop in autonomic computing that provides a framework for monitoring and administering actions upon system state alterations. The authors defined several fundamental sources of uncertainty and then tried to address them one by one. On these grounds, they developed their own self-adaptation language that tries to emulate the system administrator’s decision process. Although Rainbow achieved a balance between combining a centralized controller with a set of distributed infrastructures and a failure-tolerant design, it exhibited a lack of strategic data security functions and cognitive mechanisms for successfulness determination.
More recent research has focused on innovative technologies such as NFV. The authors in [29] presented a multi-objective optimization service function chain placement (MOO-SFCP) algorithm based on reinforcement learning RL. The goal of the algorithm is to optimize the resource allocation model, including several performance indexes such as underlying resource consumption revenue, revenue cost ratio, VNF acceptance rate, and network latency. The proposed algorithm was evaluated through extended simulation experiments. The authors in [30] presented a MANO framework for the automation of end-to-end network slicing, with the implementations of core network and transport network slices. Their approach aims to enhance the scalability and elasticity of the running services in 5G.
In this paper, we propose an innovative framework based on the principles of the MAPE paradigm, which combines state-of-the-art technologies (i.e., NFV, ML analysis, monitoring) to address specific management and orchestration issues in the IoT domain. Moreover, the consideration of QoE metrics in ML optimization modes constitutes a novelty that contributes decisively to the optimization of video streaming quality, as is established in a profound way in the following sections.
3. MAPE Framework Architecture
In this section we present architectural decisions and the components that compose the proposed solution, following the MAPE paradigm in use cases regarding IoT-enabled CNAs that run on central or fog-level cloud infrastructures and require automated and intelligent orchestration of services. The proposed architecture integrates with the appropriate tools that allow for the quality control of the MAPE services and the infrastructure resources focusing on QoS provisioning capabilities, enabled by monitoring certain related metrics that are collected from both the underlying infrastructure and the running VM-based or container-based services.
Notwithstanding the obstacles, the state of the art is mature enough to integrate the MAPE framework into use cases regarding IoT-enabled CNAs that run on central or fog-level cloud infrastructures and require automated and intelligent orchestration of services.
From this viewpoint, MAPE principles can be applied in many applications in the IoT domain that are sensitive to deviations in QoS levels. These types of applications could include e-health, autonomous ground and aerial vehicles, ecosystems providing streaming video from disaster sites, crops, etc. [31]. The increasing number of self-driving vehicles will eventually produce staggering amounts of data. Consequently, the network infrastructure should demonstrate quick and precise reflexes, in order to transparently handle the countless events triggered and optimally adapt the underlying network and computing resources to ambiguous issues and circumstances. A versatile and robust framework such as MAPE, with integrated learning mechanisms, would enable the close-to-real-time identification of state changes in the monitored vehicular ecosystem. Following the gathering of the desirable performance metrics from moving or stationary sources and sensors, the planning and execution service would commence targeted reallocations of the available computational and networking resources. These tailored alterations would aim to improve not only the overall road safety but also parameters such as the efficiency of the highway energy budget and traffic orchestration, after each iteration.
MAPE is responsible for gathering performance metrics from the running VNFs and application services, as well as the status of assigned resources in both computation and networking terms. These metrics are necessary for the process of optimization of network resources and for QoS provisioning. The proposed MAPE-based design shown in Figure 1 is composed of the following subcomponents that realize the MAPE concept: the monitoring service, the analysis service, and the planning and execution service. The roles and functionalities of these subcomponents are explained in the following paragraphs.
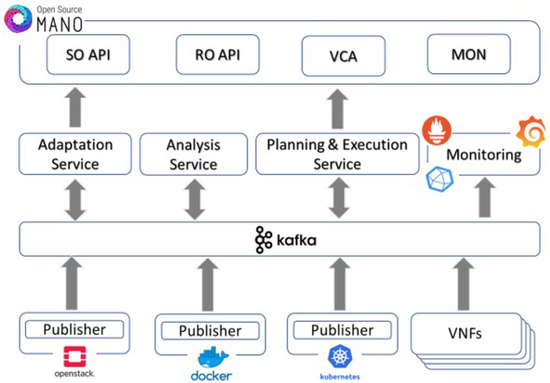
Figure 1.
Monitoring and analysis architecture.
3.1. Monitoring and Metrics Acquisition
The monitoring service (MS) aims at the automated collection of different types of data for every instantiated VNF, orchestrated by the MANO framework, including CPU usage, memory allocation, active/passive network throughput, and packet loss. Additionally, it is compliant with the flexibility for adding new monitoring entities, as well as the support for alerting mechanisms tailored to VNF-specific and NS-specific alerting rules. Finally, MS supports near-real-time responsiveness, accessibility, and scalability, as well as easy integration with MANO functional blocks, to provide the monitoring information needed to fulfil the management and orchestration tasks.
The MS collects several metrics to track not only the condition of resources in the integrated NVFI environments but also the performance of the network and the effects of the data traffic at the application layer. To share metrics in real time, a publish/subscribe type of message bus is realized by utilizing the open-source Apache Kafka platform [32]. Kafka is a software-defined implementation of a stream processing bus, aiming to provide a unified, high-throughput, low-latency platform for managing real-time data feeds. Kafka runs on a cluster of one or more servers called brokers. The collected metrics are stored for processing in an InfluxDB time series database, which empowers the handling of massive volumes of timestamped data produced by IoT-enabled devices [33]. It must be highlighted that the Kafka bus is accessible to all the internal and external services that may be interested in accessing, retrieving, and consuming either stored data or current metrics from the monitored entities. Overall, the major types of Kafka clients using the Kafka broker are:
- (a)
- Various data adaptation and transformation services wishing to push data from monitored environments, enrich the collected metrics, and prepare their proper consumption by other MAPE services.
- (b)
- An InfluxDB database that keeps records of collected metrics, either raw or processed, for future reference by external services.
- (c)
- ML-based processing and planning, with the goal of optimizing the performance of the running services based on QoS criteria.
The detailed technical specifications of MS are beyond the scope of this study.
3.2. Analysis and Optimization Services
The overall architectural loop of control for dynamic service self-adaptation receives input from the MS subsystem, collects monitoring metrics and preprocesses data, analyses information based on specific ML algorithms, makes predictions towards service optimization, applies actions by orchestrating resources, and executes service reconfiguration. The reference control model for resource optimization in the proposed solution is shown in Figure 2.
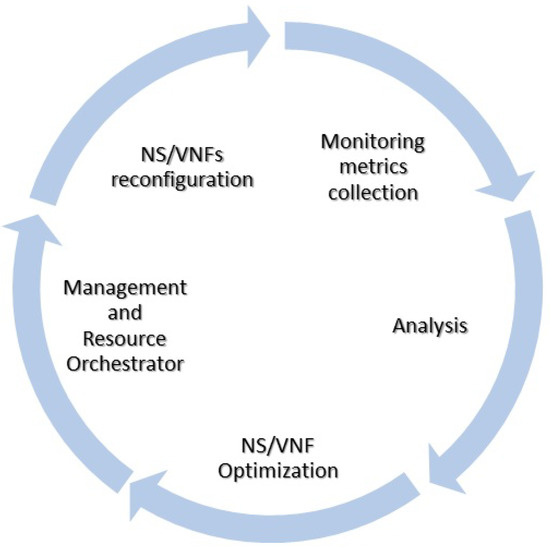
Figure 2.
Continuous optimization process.
The analysis service (AS) component should consider metrics received from the MS, which when combined, become as informative as possible regarding the system’s current state or future trends. For this purpose, the origin of incoming monitoring metrics should be diverse and inclusive, invoking infrastructure, application-level, and QoE metrics.
During the implementation phase, we considered the direction of the type of learning that should be applied, thus realizing the optimization engine (OE). Common approaches include supervised learning (SL), unsupervised learning (UL), and reinforcement learning (RL) [34,35]. Regarding the first case, the provided input is a labelled dataset, from which the model can learn. SL basically copes with two types of problems: classification problems where a discrete value should be predicted and regression problems in the case of continuous data. As far as UL is concerned, the provided input is not labelled, and it might not be complete or clean. UL is a type of self-organized learning that assists in finding unknown patterns in the data without existing labels. Utilizing the latter, a predefined input might or might not exist. RL is a type of learning that is based on the interaction of an agent with the environment. An action is executed in an environment, and the feedback received assists the learning of the agent, imitating a trial-and-error approach.
Of these types of learning, SL and RL are considered more appropriate for our case. In both of these cases, a proper dataset should be created. Throughout the implementation phase, versions of SL might include deep learning (DL) [36], as well as streaming linear algorithms implemented in Apache Spark [37]. The goals of these SL approaches will be to detect network anomalies and congestion, overutilization of resources, or underutilization of the overall system. On the other hand, RL will deal with the state modelling of the system, inherently focusing on all or most of its aspects, given that the collection of exploited monitoring metrics is diverse and describes the underlying system as precisely as possible. In our study, the AS part will include optimizations related to streaming video content (see Section 4.5).
Quality of Experience
Quality of experience (QoE) is a widely used metric that expresses the satisfaction that a user receives by interacting with an application or a service. It is similar to the user experience (UX) concept, which originates from the telecommunications field. QoE is defined by the International Telecommunication Union (ITU) as “the degree of delight or annoyance of the user of an application or service. It results from the fulfilment of his/her expectations with respect to the utility and/or enjoyment of the application or service in the light of the user’s personality and current state”.
Since the quality of the transmitted video is one of the main targets of the proposed solution, the integration of an objective or subjective QoE model aiming at calculating the mean opinion score (MOS) value is considered necessary. The MOS computation contributes to the enhancement of the OE’s operation, ensuring that trustworthy decisions are made regarding the corrective actions necessary for the improvement of the deployed services. The MOS measurement, employed in the QoE and telecommunications engineering domains, expresses the overall quality of a stimulus or system. It is a commonly used measure for audiovisual quality evaluation. In the context of this study, the ITU’s suggested objective model was examined and is further explained in Section 4.2.
4. Methodology of MAPE’s Analysis Service
In this section, a detailed deployment assessment of MAPE’s AS module is presented. As mentioned above, we decided to proceed with the SL and RL approaches. As far as SL is concerned, two discrete implementations were examined: a DL variant of a simple FFNN utilizing a specialized DL library, i.e., DeepLearning.scala (DLS) [38] and an LRE variation, both utilized as Apache Spark applications. The RL approach is based on Markov decision processes (MDP) [39], whereas the RL alternative adopts the state-space, modelling, and reward functionalities [40].
4.1. Supervised Learning: A Deep Learning Approach
DL is commonly performed by utilizing different variations of gradient descent. The initial calculation is a first-order derivative of the loss function, and consequently the weight is updated. This procedure is known as backpropagation [41], which is a pivotal concept of various DL algorithms. Combined with other optimization actions, DL transforms the weights of the NNs, thus producing a knowledge model learned from training data.
The proposed DLS framework combines object-oriented and functional programming constructs, aiming to form statically typed dynamic NNs from higher-order functions such as map/reduce, by implementing automatic differentiation (AD) with attributes that are uncommon in other frameworks [42]. Prior to AD, prominent DL structures followed either the define-and-run or the define-by-run foundational procedures. The former allows users to create computational graphs such as immutable abstract syntax trees (ASTs) [43], which can be evaluated during the framework runtime and scheduled for multiple device execution but are lacking in metalanguage interoperability. Considering the latter, a forward-pass calculation is executed by means of user-produced code. The internal states are generated by running a backward pass, thus exhibiting increased interoperability with the hosting language and therefore easily using control flows and native function calls.
On the other hand, DLS introduced the monadic deep learning mechanism [44], in the context of which the NNs are immutable, therefore combining the advantages of both define-and-run and define-by-run procedures. Complex NNs can be instantiated by executing simple code, while the code is differentiable, containing trainable variables that learn the underlying knowledge.
4.2. Reinforcement Learning: State-Space Modelling and Rewards
The optimization goals established in Section 3.2 can be materialized by assuming that the overall system presents approximately the same behaviour when it finds itself in a specific state, at least for relatively long periods of time. In order to encapsulate the complexity of the system, the required RL model would not be realistic in terms of resources and training time. Consequently, methods for a dynamic partitioning of states can be employed, aiming at the minimization of their total number. In the context of our study, the number of states utilized was relatively small, and the choice was to define static states, exploiting the statistical characteristics of the employed measurements.
Either a model-based or a model-free formulation of the algorithm can be selected for the process of reaching an optimal policy. In the former, the RL agent attempts to model the exact behaviour of the environment, while during the latter, the RL agent assesses whether a specific action is effective and the degree of that effectiveness without modelling the precise behaviour. Regarding the model-based approach, either dynamic programming algorithms or alternatives such as prioritized sweeping (PS) [45] are deployed for the computation of the optimal policy. PS maintains a detailed registry in order to limit the computational cost and focus all the effort on critical areas of the system. Certain computational thresholds are set between each real-world observation such as transitioning from one state to another. Once these limits are exceeded, the process refreshes not only the probability estimate but also the transition probabilities of successors observed in previous iterations.
On the other hand, the Q-learning algorithm is the most common representative of the model-free procedure. Despite being computationally efficient with a small memory footprint, this methodology performs only local updates. As a result, at the end of each iteration the process is limited to refreshing the value of the chosen action and consequently updating the initial state’s policy. To converge to an optimal policy, Q-learning would require a vast volume of observations. Hence, the model-based approach was adopted, and PS was selected as the strategy for calculating the optimal policy.
The most vital element of an RL algorithm is the reward mechanism. It must be designed carefully, as it is able to assist the fast convergence of the algorithm but could lead to false optimal policies [46]. At the beginning of our experiments, the definition of the reward function was the percentage of fluctuations of the MOS value. However, as our experiments progressed, additional reward components were introduced, aiming at optimizations in different parts of the system and introducing the concept of cost. The final reward received after the execution of an action is a weighted sum of these reward components, defined as follows:
- Mean Opinion Score: This reward component is defined as the percentage increment or decrement in the MOS, following the execution of a certain optimization action. If the MOS value is reduced after an action, then the reward is negative, otherwise it is positive. Therefore, assuming are the computed MOS values before and after an action’s execution, respectively, the reward is defined as:
- Bit Rate and Frame Rate: This reward component depends on the percentage increment or decrement in certain parameters, specifically the video transmission’s bit rate and frame rate. This reward is computed as a mean of the increment or decrement in both types of measurements. Let be the values of bit rate and frame rate before and after the execution of an optimization action. Then, this reward component is defined as:
- Number of VNF Instances: This reward component depends on the number VNFs that are running per NS, also considering the ones that might occur after a scale-out or scale-in operation. A positive reward is produced in cases where the number of running VNFs is decreased, and a negative reward is produced if the number of running VNFs increases. Let be the number of VNFs before and after an action’s execution. Then, this reward component is defined as:
Two of the reward components are focused on the quality of the video transmission before and after the execution of an optimization action, while the third is focused on the cost of the action. The total reward is computed as
The adjustment of the reward weights can lead to an effective joint optimization between QoE and cost by penalizing the VNF’s scaling-out operations according to needs and resource availabilities.
4.3. Analysis Flow and Components
The analysis (A) part of MAPE comprises two main components: the metric collector (MC), performing essential preprocessing operations on the monitoring data, and the actual analysis part, i.e., a DL classifier or an RL agent, performing the actual analysis of the processed metrics. The analysis architecture is modular, in the sense that its components can be easily replaced with alternative implementations without disruption of the overall operation, provided that their input and output data can be handled appropriately and follow a specified format.
4.3.1. Metric Collector
The subcomponent responsible for the collection and combination of these raw metrics according to time, origin, NS, and VNF is the metric collector component, written in Scala and deployed as an Apache Spark application. This component subscribes to the central Kafka bus and to the appropriate topics of interest, receives the raw metrics, and forms them into proper feature vectors, grouping them by running the VNF and VDU. Obviously, the topics receive all the enabled metrics supported by a monitoring tool, hence we should note that metrics published to and received from Kafka that are not included in the list of employed metrics are simply omitted.
Having received the raw metrics, the MC performs the necessary normalization actions and transforms them into feature vectors, before grouping them per running VNF. A timing deviation of one second is considered acceptable for two measurements of the same VNF being packed into the same feature vector. If a round of measurements is not properly synchronized, then the stale measurements will be discarded and will be updated with the most recent values until a complete and synchronized feature vector is formed.
When a synchronized set of measurements is collected, forming a feature vector, a simple min-max normalization is applied to the features. It is important to note that an extensive profiling of the incoming measurements was conducted a priori, to enable the min and max values and the statistical data of each metric to be known and thoroughly understood. Following the realization of a measurement vector, the MC component publishes the outcome to the central Kafka bus. Thence, it is consumed by the RL agent of the AS module, and in retrospect, after being processed, a possible suggestion intended for further consideration by the planning module is published to the Kafka bus.
4.3.2. DL Classifier
The DL classifier is a subcomponent of the analysis part of MAPE, written in Scala and deployed as an Apache Spark application. The DL classifier subscribes to the topics of the central Kafka bus, where the formatted and normalized measurements from the MC are published. The DL classifier utilizes the DeepLearning.scala framework. The NN is trained in advance, and the weights of the layers that yield the minimum squared loss are recorded.
When the DL classifier receives a set of formatted and normalized measurements and before these measurements are given as input to the trained NN, they must be sorted to follow the order of the features in the training-set vectors. When the measurements are sorted, the inference follows, and the feature vector is classified accordingly. There are three possible outcomes in the classification procedure, i.e., regular, irregular, and underutilized, as summarized in Table 1, leading to no action, scale-out, or scale-in operations, respectively.

Table 1.
Classification of operational states.
The DL classifier produces a classification for the overall state of the NS and notifies the planning part of MAPE accordingly. The updated payload that is published to the central Kafka bus includes the output of the analysis, i.e., the predicted class and optimization actions suggested to planning. Planning receives the published payload from the related Kafka topic and proceeds accordingly.
4.3.3. RL Agent
The RL agent is a component that can be used interchangeably with the DL classifier. Like the DL classifier, it also subscribes to the central Kafka bus and receives formatted metrics from the related topics published by the MC. The available optimization actions are identical in both implementations; however, the operation of the RL agent inherently differs in the decision-making procedures, since the DL classifier produces the classification of an NS state and makes an unambiguous suggestion for action, while the RL agent maps the NS state to a state of the internal environment and selects the optimal action.
The RL agent can generally target specific aspects of the system via an appropriate tuning of the reward function, which integrates a cost component in our implementation as well as the actual QoE metrics. In this manner, the end user or cloud provider can set custom optimization objectives. For instance, if the cost is not of interest and theoretically there are infinite available resources, the weight of this reward component can be set to zero, and the RL agent will only optimize the end-users’ QoE. In cases where both the cost and end-users’ QoE is of interest, a different combination of weights can lead to a different mapping of the environment, different optimal actions, and thus different decisions. The RL agent selects the action that maximizes the reward and proceeds to publishing the messages in the related topic to be used by planning. The updated payload includes the action suggested to planning, as in the DL classifier approach.
It should be highlighted that, according to the flow diagram illustrated in Figure 3, the RL agent of the AS module can easily be replaced by other optimization techniques, provided that the replacement uses the same feature vectors and produces a suggestion in the expected format. Such alternative solutions can be made available by integrating properly modified VNE optimization strategies that rely on algorithms to instantiate virtualized demands on a physical infrastructure. Adhering to specific optimization objectives, thus closing the loop of control as MAPE does and adapting autonomously to the demands of VNRs for resources, VNE solutions follow the same fundamental rules as our orchestration framework. However, depending on the specifics of the respective optimization objective, the embedding results may vary considerably, and the satisfaction of the resulting outcome can be compromised [47]. Integrating such embedding mechanisms with our MAPE architecture is out of the scope of this paper.
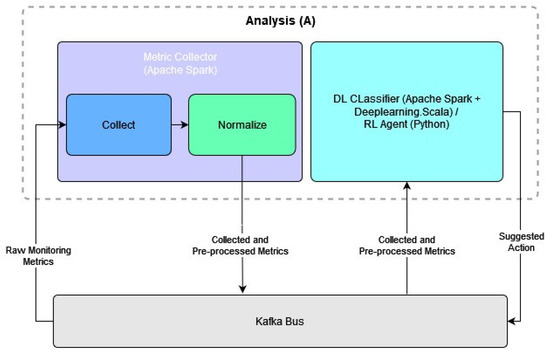
Figure 3.
Components of MAPE’s AS module.
4.4. Employed Metrics
As described in Section 3.2, our study focuses on the optimization of on-site video streaming. Thus, both networking and computational measurements play an integral part in the perseverance of the visual content quality. Furthermore, the QoE concept is adapted to ensure the adequate quality of the video content, despite the ITU’s original definition. Moreover, the OE, and especially the AS module, should be able to determine the overall state of the system efficiently and as accurately as possible. In this context, a combination of infrastructure (OpenStack NFVI), application-level, and QoE metrics have been employed to produce an accurate image of the system. Additionally, several metrics from collectd have been selected [48]. The collection of the utilized metrics is summarized in Table 2.
Table 2.
Employed monitoring metrics.
4.5. Opinion Model for Video Content Streaming
MAPE’s AS module is engineered to focus on optimizations related to streaming visual content using any device, from 5G-enabled mounted cameras to IoT wearables, UAVs, and UGVs, and this research aims to present and evaluate preliminary results for relevant field-originated video transmissions. According to ITU’s model for video telephony applications [49], perceived video quality is expressed, at a high level, as:
where denotes the basic video quality affected by the coding distortion, regarding a specific combination of video bit rate expressed in kilobits per second (kbps) and video frame rate expressed in frames per second (fps). In addition, represents the degree of video quality robustness due to packet loss, whereas represents the packet loss rate. The video quality baseline affected by coding distortion is defined by:
where represents the optimal frame rate that maximizes the video quality at each video bit rate and is expressed as:
is the maximum quality of a video for a constant bit rate, defined as:
and represents the degree of video quality robustness due to the frame rate, expressed as:
Additionally, the packet loss robustness factor , which represents the degree of video quality robustness against packet loss, is given by:
4.6. Optimization Actions
In our research, the optimization actions of the OE are focused on the horizontal scaling of services by handling computational and networking resources provided by the NFVI. Thus, the MANO (OSM) optimizes the life-cycle management of the NS/VNFs based on dynamic allocation of fundamental virtualization resources such as containers, VMs, and virtual networks. In cases of anomalies, congestion, or overutilization, the NS will be scaled out and another VNF will be aggregated. On the other hand, in cases where the NS has already been scaled out and is underutilized, the AS module, acknowledging the misplacement of resources, suggests the necessary scale-in actions and the additional VNF is scheduled for deletion, hence the respective resources are released.
The optimization actions are identical in both the DL and RL solutions (see Table 3). However, the way that each of these approaches reaches a decision is inherently different. The DL solution classifies an incoming vector of measurements and decides whether an optimization action should be executed, while the RL solution, having modelled the environment, maps the incoming vector of measurements to a state and performs the optimal action.
Table 3.
Available optimization actions.
4.7. Collection of Training Datasets
The learning approaches applied in our deployment include SL and RL techniques and have different needs in terms of essential training datasets. In both variations of the use-case scenario, the same metrics were employed as inputs, ranging from CPU and memory utilization to frame rate, packet loss, and even more qualitative parameters such as the QoE-oriented mean opinion score. Equivalently, the set of optimization functions, which includes scale-out and scale-in actions, is the resulting outcome for the two examined cases. The complete lists of inputs and outputs utilized in our use-cases are given in Table 2 and Table 3, respectively.
For the collection of these datasets, we streamed from a video transmission, evaluating its quality. The initial idea was to experiment with various values for the background traffic and number of streaming clients, which would bring the monitored system into a variety of states with respect to networking and computational performance. Our intention was to collect sets of monitoring measurements, including both resource consumption and network-related metrics. Finally, it was of great importance that the collected measurements depicted close-to-real-life conditions.
In the context of SL, a labelled dataset is necessary for the model to be properly trained and tested. Hence, the manual classifications of the visual quality of the streamed content and the association of these manual classifications with the monitoring metrics were collected in parallel. The SL-oriented training dataset collection flow begins with the initiation of a video transmission, followed by the introduction of background traffic and the beginning of the video streaming content with different numbers of clients. It then concludes with the visual classification of the quality of the streaming content as either “regular” or “degraded”, a classification which corresponds to regular and irregular states of the overall system, while matching these classifications to the collected measurements with appropriate timestamps. After the visual classification of the streaming content and the extraction of a labelled dataset, the collected data are normalized, proceeding to the training of an NN, utilizing DLS. A total of 5000 feature vectors were utilized for the training, selected from a total of approximately 7000. Furthermore, for the training of the NN, the usual 60-20-20 split was applied to our dataset, i.e., 60% of the samples were used for training, 20% were used for validation, and the other 20% were used for testing. At this point, we should underline the fact that the focus of the present work is on the validation of our proposed solution in the context of interoperability and performance optimization. Nevertheless, since we performed the collection of the employed dataset, we decided to keep it as balanced as possible, in order to ensure a more trustworthy model.
The collection approach for a training dataset differs in the RL solution. Ideally, an RL agent is capable of exploring the environment of deployment and identifying via trial and error the actions that yield the best rewards for the convergence of the model. However, an RL agent with zero prior knowledge will start by executing random actions, and by receiving negative or positive rewards it will commence the discovery of the environment and the evaluation of states. Therefore, the preliminary collection of prior experiences is essential. Once again, we experimented with different values for the background traffic and number of connected clients. The RL-based training dataset collection flow starts with the initiation of a video transmission and the introduction of background traffic. The beginning of the video streaming content with different numbers of clients and the observation of the environment and a primary recording of a set of measurements follows afterwards. Thereafter, the execution of a random optimization action, either -,-, or , occurs. It is then sequenced by the observation of the environment and the recording of a set of measurements depicting the state of the system after the optimization action. The collection flow is concluded with the recording of the experience in the form of transitioning from one state to another after the execution of the action.
Starting with a set of collected experiences, the RL agent initially performs training by processing them, computing and recording rewards for the state transitioning and thus updating the model of the environment. Consequently, the RL agent is continuously trained, since the execution of the same set of actions under the occurrence of a system condition transition may not yield the same positive rewards. In this way, the RL agent adapts and updates the acquired model of the environment accordingly.
4.8. Planning and Execution
The role of the execution service (ES) is to consider the outcomes of the service-specific OE and AS modules and to apply them by interacting with the necessary components or services. This element has been designed to support NFVO-based operations per NS or individual VNFs, media-specific operations per individual VNF, or hybrid operations. To achieve this functionality, the ES mechanism is responsible for communicating with the NFVO via the northbound interface (NBI) [50]. However, the current implementation of ES supports the action of scaling out an NS to one or more additional VNFs, as explained below.
Typically, an instantiated NS is composed of several VNFs that must be scaled and operated independently but still belong to the same service and hence must be completely described in the corresponding NS package. Scaling out distributes the workload of the NS across existing and newly instantiated resources, thus increasing the level of availability and extending the throughput capacity of the service. MAPE’s ES leverages NFVO functionalities to apply the NS’s scaling actions. During the scale-out process, the NFVO commits computational and networking resources, establishes connectivity across all the instantiated nodes, and organizes the new service. Once the scaling action is completed, the records of the NFVO are updated, and the NS is orchestrated accordingly.
5. Experimental Results
By exploiting the features of the DLS library, various types of NNs can be quickly trained and deployed. For the purposes of this study, a simple FFNN was utilized, structured as a three-layered NN. A combination of infrastructure-oriented, application-level, and QoE-based metrics were employed as inputs to the FFNN. A summary and a more detailed description of the incorporated metrics are given in Table 2 and Section 4.4, respectively. The outputs of our FFNN are the optimization actions of horizontal scaling of services, as summarized in Table 3 and detailed in Section 4.6.
5.1. QoE: Experimenting with Frame Rate, Bit Rate, and Packet Loss
The MOS was evaluated as a metric of great importance; hence, a series of comparisons of MOS values against different combinations of packet loss, frame rate, and bit rate were considered essential. The model adopted was the one defined by ITU and described in Section 4.5.
The plot in Figure 4 illustrates the impact the packet loss metric has on the MOS, with the settings for the frame rate and bit rate configured to 24 fps and approximately 8 Mbps, respectively. The observation that the computed MOS value declines to under the value of 1.5 when a loss rate of the order of 2% emerges validates the dominant role the packet loss plays in the context of this QoE model. Such a reduction is considered unacceptable, whereas a MOS value of at least 3.5 exceeds the acceptance threshold.
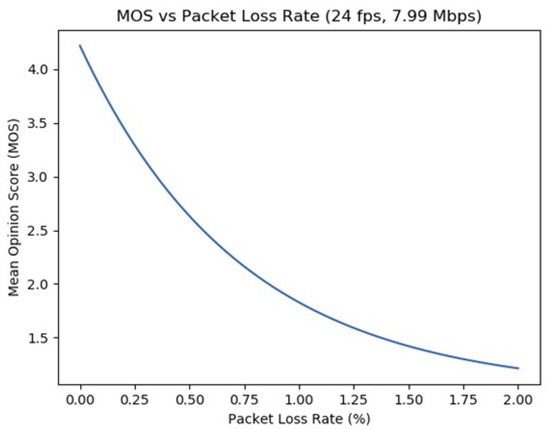
Figure 4.
MOS with respect to packet loss (ITU-T Recommendation P.1070).
Afterwards, the packet loss is set to a ratio of 0.05%, with a constant bit rate of approximately 8 Mbps. As expected, the higher the fps, the greater the increase in the MOS value, as Figure 5 suggests. It should be highlighted that a frame rate of at least 16 fps is considered to be a minimum threshold for acceptable video transmissions.
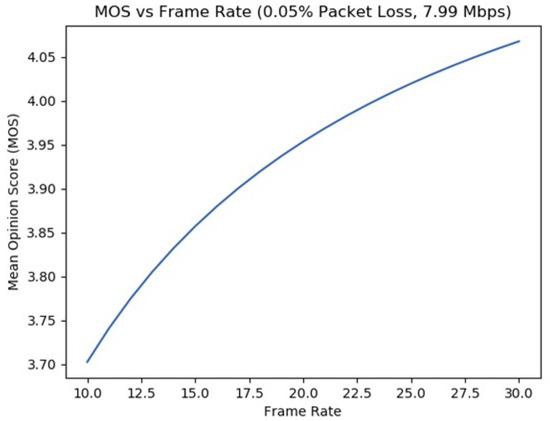
Figure 5.
MOS with respect to frame rate (ITU-T Recommendation P.1070).
Finally, in Figure 6, we set a constant packet loss of 0.05% and a frame rate of 24 fps. It can be discerned that the MOS fluctuates constantly at a satisfactory level, above the threshold value of 4.0, with a lower bound at around 7 Mbps.
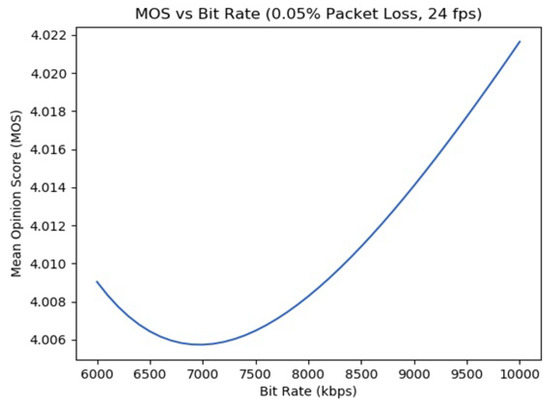
Figure 6.
MOS with respect to bit rate (ITU-T Recommendation P.1070).
5.2. Statistics for Inactive and Active MAPE
In this subsection, we evaluate the performance of the proposed solution using an NS that accepts requests for streaming video sessions. The tested NS consists of two VNFs, a proxy server, and an application server which receives users’ requests and responds with HTTP status code 200 when the NS is capable of providing a new session and with HTTP status code 500 if there are not enough resources to serve a new user. The evaluation of the proposed framework is based on two discrete trials that were conducted repeatedly. In the first trial, the MAPE is inactive and we simply make observations on the state of the overall system, while in the second trial the MAPE is activated.
In both trials, we considered metrics that adequately depict the overall state of the NS, i.e, (a) the number of current active sessions, (b) the throughput per VNF, and (c) the average response time. Moreover, the status codes of the server were recorded, to give a clearer image of the end users’ experience during the disruption of the NS’s regular operation.
As already stated, during the first trial, the MAPE is inactive, and the stressing of the NS begins, resulting in a disruption of its overall operation. As demonstrated in Figure 7, we can observe an increasing number of the current active sessions (Figure 7a), as well as the rising VNF throughput (Figure 7b), incoming as much as outgoing. The disruption of the NS has a negative impact on the average response time (Figure 7c) of the service, which consequently leads to server failures, recorded as internal server errors, i.e., instances of HTTP status code 500 (Figure 7d). It is clear that the increasing number of sessions leads to a disruption of the regular operation of the NS when there is no option for corrective action.
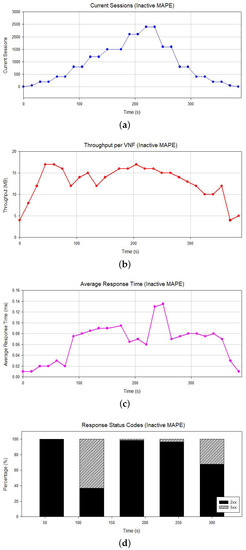
Figure 7.
Statistics for inactive MAPE. (a) Active sessions; (b) throughput per VNF; (c) average response time; (d) HTTP response codes.
Next, we executed the same experiment but this time with the MAPE framework activated. Once again, the monitoring metrics suggest an imminent disruption of the NS’s regular operation if we note the increasing number of current active sessions (Figure 8a) and the rising throughput per VNF instance (Figure 8b). Moreover, we observe a fluctuation in the average response time (Figure 8c). In this case, the MAPE identifies the high demand, and as the number of the current active sessions rises, the overall system state is classified as irregular (Figure 9a), eventually leading to a scale-out action, i.e., to deploying a second instance of the VNF under pressure. In Figure 9b we can observe the NS’s scaling status.
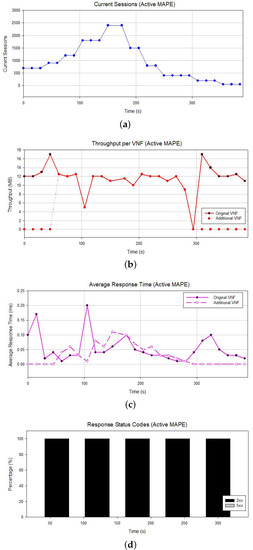
Figure 8.
Statistics for active MAPE. (a) Active sessions; (b) throughput per VNF; (c) average response time; (d) HTTP response codes.
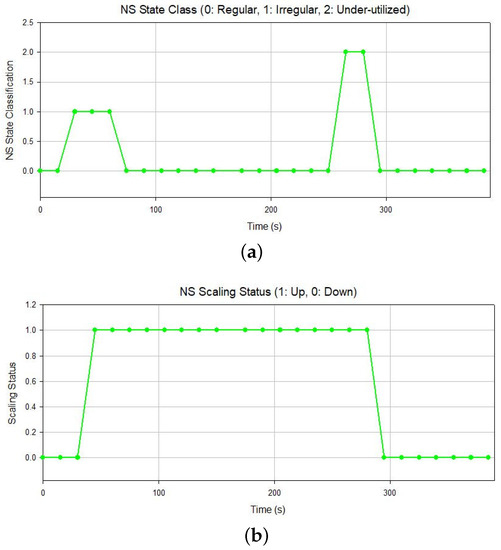
Figure 9.
NS state class and scaling status. (a) NS state classification; (b) NS scaling status.
In Figure 8b, we can observe the impact of the scale-out action on the throughput, which is now split between the two available VNF instances. The throughputs for the running VNFs are almost identical, proving that the NS has been configured to balance its load. Furthermore, as the lifetime of the additional VNF increases, the average response times of both VNF instances become smoother (Figure 8c). Additionally, we can clearly see the improvement in the server’s performance, with almost zero internal server errors (Figure 8d). This fact demonstrates that the MAPE framework detects and predicts the increasing demand for the service and proactively introduces another VNF instance to handle the increasing load. Indeed, with the addition of the VNF instance, the overall state of the system is classified as regular (Figure 9a).
After the sudden high demand for the service, with the situation properly addressed by the MAPE framework, a decrease is observed, expressed through a steady decline in the number of current active sessions (Figure 8a), as well as the average response time (Figure 8c). At this point, the MAPE framework classifies the overall system as underutilized and suggests a scaling-in operation, leading to the deletion of the additional VNF instance and the reconfiguration of the NS to re-route all the incoming and outgoing traffic via the remaining one(s). Indeed, Figure 9a shows the classification of the NS’s state as underutilized. Meanwhile, in Figure 9b, the scaling status of the NS, which now includes a single VNF, is shown. As expected, during the first moments after the deletion of the additional VNF a sudden increase in the remaining VNF’s throughput and average response time is observed; however, the NS state is regularized quickly.
6. Conclusions
In our research, we studied the MAPE framework for optimizing video streaming services, based on the innovative and emerging principles of IoT, CNC, 5G, and ML. One of the problems that NGN applications are facing is that, despite the fact that the technologies that we are using (i.e., SDN, NFV) support life-cycle management of runtime, it is difficult to guarantee the QoS using traditional monitoring mechanisms that identify the problems when they occur. In modern applications, in order to provide a specific experience level, we must analyse each service separately, predict the potential issues, and act proactively to avoid any negative impact on the QoS. In this context, in the presented work, we introduced the MAPE approach using the NFV architecture, and we presented preliminary results from prediction algorithms for transmitting visual content, given the requirements of the responding teams operating in the field, as expressed by the QoE MOS specification. According to the results, ML integration ensures the quality and trustworthiness of the optimization actions. From this perspective, it is established that the framework allows the system to react quickly in accordance with scaling factors and the placement of all available sets of resources, with the goal of optimizing the service’s performance and consequently satisfying the users’ requirements at execution time, especially under ambiguous networking and computational circumstances, by invoking parameters of a mutable nature such as the frame rate, bit rate, and packet loss. Furthermore, the deployment of inherent security features renders our developed MAPE architecture fundamentally secure, ensuring the robustness of the system, as well as the integrity and privacy of stored and transported information.
Nevertheless, this research should be furthered and the next milestones ought to be set. To the best of our knowledge, there are currently no available datasets from other MAPE implementations to contrast with our solution. The provision of a justified comparison to other relevant solutions, as soon as they become available, is a priority in our research roadmap.
Moreover, the effort to extend the set of ML algorithms, with the target of offering better coverage of the users requirements, while also training new models better and offering them as open-source models, represents a milestone in our forthcoming work. Alternatively, possible optimization solutions utilizing VNE optimization strategies could be substituted for the established OE, in order to extend the comparison baseline for optimization models.
Additional steps can be taken regarding the enrichment of MAPE’s by-design security. The integration of blockchain practices may prove to be a key security measure, to completely avoid the possibility of corrupted QoE MOS values and misleading states in action mapping. Blockchain adopts the same decentralized and distributed directives as the MAPE framework, rendering it compatible with the principles of MAPE’s core architecture. However, there are certain limitations that should be challenged. Blockchain ledgers can grow very large over time, which may lead to storage depletion. Furthermore, a substantial sacrifice in response time and slower optimization actions are possible eventualities.
Author Contributions
Conceptualization, P.A.K. and P.T.; methodology, P.A.K. and K.R.; software, K.R.; formal analysis, investigation K.R. and P.A.K.; data curation, K.R.; writing–original draft preparation, S.P., P.A.K. and K.R.; writing–review and editing, P.A.K., H.C.L. and P.T. All authors have read and agreed to the published version of the manuscript.
Funding
This research was partially supported by FASTER and has received funding from the European Union’s Horizon 2020 research and innovation program under grant agreement No. 833507.
Institutional Review Board Statement
Not applicable.
Informed Consent Statement
Not applicable.
Data Availability Statement
Not applicable.
Conflicts of Interest
The authors declare no conflict of interest.
Abbreviations
| AD | Automatic Differentiation |
| AS | Analysis Service |
| AST | Abstract Syntax Trees |
| CNA | Cloud Native Applications |
| CNC | Cloud Native Computing |
| CNI | Cloud Native Infrastructure |
| DL | Deep Learning |
| DLS | DeepLearning.scala |
| ES | Execution Service |
| FFNN | Feed-Forward Neural Network |
| GDPR | General Data Protection Regulation |
| IoT | Internet of Things |
| ITU | International Telecommunication Union |
| MANO | Management and Orchestration |
| MAPE | Monitoring Analysis Planning Execution |
| MC | Metric Collector |
| MDP | Markov Decision Processes |
| ML | Machine Learning |
| MOS | Mean Opinion Score |
| MS | Monitoring Service |
| NBI | Northbound Interface |
| NFV | Network Function Virtualization |
| NFVI | Network Function Virtualization Infrastructure |
| NFVO | NFV Orchestrator |
| NGN | Next-Generation Networks |
| NMS | Network Management Systems |
| NS | Network Services |
| OE | Optimization Engine |
| OSM | Open-Source MANO |
| PS | Prioritized Sweeping |
| QoE | Quality of Experience |
| QoS | Quality of Service |
| RL | Reinforcement Learning |
| SDN | Software-Defined Networks |
| SL | Supervised Learning |
| UL | Unsupervised Learning |
| UX | User Experience |
| VLM | Virtual Link Mapping |
| VM | Virtual Machines |
| VN | Virtual Networks |
| VNE | Virtual Network Embedding |
| VNF | Virtual Network Functions |
| VNM | Virtual Node Mapping |
| VNR | Virtual Network Requests |
| Mathematical Symbols | |
| Video bit rate | |
| Degree of video robustness due to frame rate | |
| Degree of video quality robustness due to packet loss | |
| Frame bit rate | |
| Mean opinion score | |
| n | Number of running VNFs |
| Optimal frame rate | |
| Packet loss rate | |
| Video quality | |
References
- Gubbi, J.; Buyya, R.; Marusic, S.; Palaniswami, M. Internet of Things (IoT): A vision, architectural elements, and future directions. Future Gener. Comput. Syst. 2013, 29, 1645–1660. [Google Scholar] [CrossRef]
- Dos Anjos, J.C.; Gross, J.L.; Matteussi, K.J.; González, G.V.; Leithardt, V.R.; Geyer, C.F. An algorithm to minimize energy consumption and elapsed time for IoT workloads in a hybrid architecture. Sensors 2021, 21, 2914. [Google Scholar] [CrossRef]
- Garrison, J.; Nova, K. Cloud Native Infrastructure: Patterns for Scalable Infrastructure and Applications in a Dynamic Environment; O’Reilly Media, Inc.: Sebastopol, CA, USA, 2017. [Google Scholar]
- Balalaie, A.; Heydarnoori, A.; Jamshidi, P. Microservices architecture enables devops: Migration to a cloud-native architecture. IEEE Softw. 2016, 33, 42–52. [Google Scholar] [CrossRef]
- Gannon, D.; Barga, R.; Sundaresan, N. Cloud-native applications. IEEE Cloud Comput. 2017, 4, 16–21. [Google Scholar] [CrossRef]
- Zafeiropoulos, A.; Fotopoulou, E.; Peuster, M.; Schneider, S.; Gouvas, P.; Behnke, D.; Müller, M.; Bök, P.B.; Trakadas, P.; Karkazis, P. Benchmarking and Profiling 5G Verticals’ Applications: An Industrial IoT Use Case. In Proceedings of the 2020 6th IEEE Conference on Network Softwarization (NetSoft), Ghent, Belgium, 29 June–3 July 2020; pp. 310–318. [Google Scholar] [CrossRef]
- Soenen, T.; Van Rossem, S.; Tavernier, W.; Vicens, F.; Valocchi, D.; Trakadas, P.; Karkazis, P.; Xilouris, G.; Eardley, P.; Kolometsos, S. Insights from SONATA: Implementing and integrating a microservice-based NFV service platform with a DevOps methodology. In Proceedings of the NOMS 2018-2018 IEEE/IFIP Network Operations and Management Symposium, Taipei, Taiwan, 23–27 April 2018; pp. 1–6. [Google Scholar] [CrossRef]
- Shekhawat, Y.; Piesk, J.; Sprengel, H.; Gómez, I.D.; Vicens, F.; Carrillo, S.C.; Trakadas, P.; Karkazis, P.; Zahariadis, T.; Touloupou, M. Orchestrating Live Immersive Media Services Over Cloud Native Edge Infrastructure. In Proceedings of the 2019 IEEE 2nd 5G World Forum (5GWF), Dresden, Germany, 30 September–2 October 2019; pp. 316–322. [Google Scholar] [CrossRef]
- Merkel, D. Docker: Lightweight linux containers for consistent development and deployment. Linux J. 2014, 2014, 2. [Google Scholar]
- Bernstein, D. Containers and cloud: From lxc to docker to kubernetes. IEEE Cloud Comput. 2014, 1, 81–84. [Google Scholar] [CrossRef]
- Yi, B.; Wang, X.; Li, K.; Huang, M. A comprehensive survey of network function virtualization. Comput. Netw. 2018, 133, 212–262. [Google Scholar] [CrossRef]
- Trakadas, P.; Karkazis, P.; Leligou, H.C.; Zahariadis, T.; Tavernier, W.; Soenen, T.; Van Rossem, S.; Miguel Contreras Murillo, L. Scalable monitoring for multiple virtualized infrastructures for 5G services. In Proceedings of the International Symposium on Advances in Software Defined Networking and Network Functions Virtualization (SoftNetworking 2018), Athens, Greece, 22–26 April 2018; pp. 1–4. [Google Scholar]
- Ericsson, T.L. A Guide to 5G Network Security. 2021. Available online: https://www.ericsson.com/en/security/a-guide-to-5g-network-security (accessed on 20 June 2022).
- CableLabs. A Comparative Introduction to 4G and 5G Authentication. 2021. Available online: https://www.cablelabs.com/insights/a-comparative-introduction-to-4g-and-5g-authentication (accessed on 20 June 2022).
- Pereira, F.; Crocker, P.; Leithardt, V.R. PADRES: Tool for PrivAcy, Data REgulation and Security. SoftwareX 2022, 17, 100895. [Google Scholar] [CrossRef]
- Computing Autonomic. An architectural blueprint for autonomic computing. In IBM White Paper; IBM: Armonk, NY, USA, 2006; Volume 31, pp. 1–6. [Google Scholar]
- SONATA MANO Framework. 2021. Available online: https://github.com/sonata-nfv/son-mano-framework/ (accessed on 28 June 2021).
- Garlan, D.; Schmerl, B.; Cheng, S.W. Software Architecture-Based Self-Adaptation. In Software Architecture-Based Self-Adaptation; Springer: Berlin/Heidelberg, Germany, 2009; pp. 31–55. [Google Scholar] [CrossRef]
- Leng, J.; Zhou, M.; Xiao, Y.; Zhang, H.; Liu, Q.; Shen, W.; Su, Q.; Li, L. Digital twins-based remote semi-physical commissioning of flow-type smart manufacturing systems. J. Clean. Prod. 2021, 306, 127278. [Google Scholar] [CrossRef]
- Leng, J.; Yan, D.; Liu, Q.; Zhang, H.; Zhao, G.; Wei, L.; Zhang, D.; Yu, A.; Chen, X. Digital twin-driven joint optimisation of packing and storage assignment in large-scale automated high-rise warehouse product-service system. Int. J. Comput. Integr. Manuf. 2021, 34, 783–800. [Google Scholar] [CrossRef]
- Majidha Fathima, K.M. A Survey of the Exemplary Practices in Network Operations and Management. In Data Intelligence and Cognitive Informatics; Jeena Jacob, I., Kolandapalayam Shanmugam, S., Piramuthu, S., Falkowski-Gilski, P., Eds.; Springer: Singapore, 2021; pp. 181–194. [Google Scholar] [CrossRef]
- Luan, Z.; Qian, D.; Zhang, X.; Liu, T.; Chen, H. A Novel Model and Architecture on NMS – Dynamically Constructed Network Management. In Advanced Parallel Processing Technologies; Zhou, X., Xu, M., Jähnichen, S., Cao, J., Eds.; Springer: Berlin/Heidelberg, Germany, 2003; pp. 398–403. [Google Scholar] [CrossRef]
- Tennenhouse, D.L.; Smith, J.M.; Sincoskie, W.D.; Wetherall, D.J.; Minden, G.J. A survey of active network research. IEEE Commun. Mag. 1997, 35, 80–86. [Google Scholar] [CrossRef]
- Fischer, A.; Botero, J.F.; Beck, M.T.; De Meer, H.; Hesselbach, X. Virtual Network Embedding: A Survey. IEEE Commun. Surv. Tutor. 2013, 15, 1888–1906. [Google Scholar] [CrossRef]
- Yu, M.; Yi, Y.; Rexford, J.; Chiang, M. Rethinking virtual network embedding: Substrate support for path splitting and migration. SIGCOMM Comput. Commun. Rev. 2008, 38, 17–29. [Google Scholar] [CrossRef]
- Toutouh, J.; Muñoz, A.; Nesmachnow, S. Evolution Oriented Monitoring Oriented to Security Properties for Cloud Applications. In Proceedings of the ARES 2018: The 13th International Conference on Availability, Reliability and Security, Hamburg, Germany, 27–30 August 2018. [Google Scholar] [CrossRef]
- Waller, A.; Sandy, I.; Power, E.; Aivaloglou, E.; Skianis, C.; Muñoz, A.; Maña, A. Policy based management for security in cloud computing. In Proceedings of the FTRA International Conference on Secure and Trust Computing, Data Management, and Application, Loutraki, Greece, 28–30 June 2011; pp. 130–137. [Google Scholar]
- Cheng, S.W.; Garlan, D. Handling uncertainty in autonomic systems. In Proceedings of the 22nd International Conference on Automated Software Engineering (ASE’07), Atlanta, GA, USA, 5 November 2007. [Google Scholar]
- Liu, H.; Ding, S.; Wang, S.; Zhao, G.; Wang, C. Multi-objective Optimization Service Function Chain Placement Algorithm Based on Reinforcement Learning. J. Netw. Syst. Manag. 2022, 30, 1–25. [Google Scholar] [CrossRef]
- Chiu, Y.S.; Yen, L.H.; Wang, T.H.; Tseng, C.C. A Cloud Native Management and Orchestration Framework for 5G End-to-End Network Slicing. Available online: https://people.cs.nctu.edu.tw/~lhyen/files/papers/main_r3.pdf (accessed on 20 June 2022).
- Zhou, H.; Xu, W.; Chen, J.; Wang, W. Evolutionary V2X technologies toward the Internet of vehicles: Challenges and opportunities. Proc. IEEE 2020, 108, 308–323. [Google Scholar] [CrossRef]
- Garg, N. Apache Kafka; Packt Publishing Ltd.: Birmingham, UK, 2013. [Google Scholar]
- InfluxDB. 2021. Available online: https://https://www.influxdata.com/ (accessed on 30 June 2021).
- Sathya, R.; Abraham, A. Comparison of supervised and unsupervised learning algorithms for pattern classification. Int. J. Adv. Res. Artif. Intell. 2013, 2, 34–38. [Google Scholar] [CrossRef]
- Gullapalli, V. A comparison of supervised and reinforcement learning methods on a reinforcement learning task. In Proceedings of the 1991 IEEE international Symposium on Intelligent Control, Arlington, VA, USA, 13–15 August 1991; pp. 394–399. [Google Scholar] [CrossRef]
- Goodfellow, I.; Bengio, Y.; Courville, A.; Bengio, Y. Deep Learning; MIT Press: Cambridge, UK, 2016; Volume 1. [Google Scholar]
- Apache Spark. 2021. Available online: https://spark.apache.org/ (accessed on 30 June 2021).
- ThoughtWorks. DeepLearning.scala. 2021. Available online: https://www.thoughtworks.com/deeplearning-scala (accessed on 18 June 2021).
- Puterman, M.L. Markov decision processes. Handb. Oper. Res. Manag. Sci. 1990, 2, 331–434. [Google Scholar]
- Barrett, E.; Howley, E.; Duggan, J. Applying reinforcement learning towards automating resource allocation and application scalability in the cloud. Concurr. Comput. Pract. Exp. 2013, 25, 1656–1674. [Google Scholar] [CrossRef]
- Werbos, P.J. Backpropagation through time: What it does and how to do it. Proc. IEEE 1990, 78, 1550–1560. [Google Scholar] [CrossRef]
- Baydin, A.G.; Pearlmutter, B.A.; Radul, A.A.; Siskind, J.M. Automatic differentiation in machine learning: A survey. J. Mach. Learn. Res. 2018, 18, 1–43. [Google Scholar]
- Baxter, I.D.; Yahin, A.; Moura, L.; Sant’Anna, M.; Bier, L. Clone detection using abstract syntax trees. In Proceedings of the International Conference on Software Maintenance (Cat. No. 98CB36272), Bethesda, MD, USA, 20 November 1998; pp. 368–377. [Google Scholar] [CrossRef]
- ThoughtWorks. Monadic Deep Learning. 2021. Available online: https://deeplearning.thoughtworks.school/assets/paper.pdf (accessed on 30 June 2021).
- Moore, A.W.; Atkeson, C.G. Prioritized sweeping: Reinforcement learning with less data and less time. Mach. Learn. 1993, 13, 103–130. [Google Scholar] [CrossRef]
- Matignon, L.; Laurent, G.J.; Le Fort-Piat, N. Reward function and initial values: Better choices for accelerated goal-directed reinforcement learning. In Proceedings of the International Conference on Artificial Neural Networks, Athens, Greece, 10–14 September 2006; pp. 840–849. [Google Scholar] [CrossRef]
- Prekas, S.; Karkazis, P.; Trakadas, P.; Nikolakakis, V. Comparison of VNE heuristic solutions with similar objective functions. In Proceedings of the 24th Pan-Hellenic Conference on Informatics, Athens, Greece, 20–22 November 2020. [Google Scholar] [CrossRef]
- Collectd. 2022. Available online: https://collectd.org/ (accessed on 30 June 2022).
- ITU-T. Opinion model for video-telephony applications. In ITU-T Recommendation P. 1070; ITU: Geneva, Switzerland, 2007. [Google Scholar]
- Israel, A.; Hoban, A.; Sepúlveda, A.; Salguero, F.; de Blas, G.; Kashalkar, K.; Ceppi, M.; Shuttleworth, M.; Harper, M.; Marchetti, M.; et al. OSM release three. In Open Source MANO, Technical Overview; ETSI: Sophia Antipolis, France, 2017. [Google Scholar]
Publisher’s Note: MDPI stays neutral with regard to jurisdictional claims in published maps and institutional affiliations. |
© 2022 by the authors. Licensee MDPI, Basel, Switzerland. This article is an open access article distributed under the terms and conditions of the Creative Commons Attribution (CC BY) license (https://creativecommons.org/licenses/by/4.0/).