
Deep Learning Beehive Monitoring System for Early Detection of the Varroa Mite


Abstract
:1. Introduction
2. Related Work
2.1. Related Work on Periodic Varroa Mite Treatments
2.2. Related Work on Varroa Mite Detection Technologies
3. Proposed Varroa Detection System Implementation
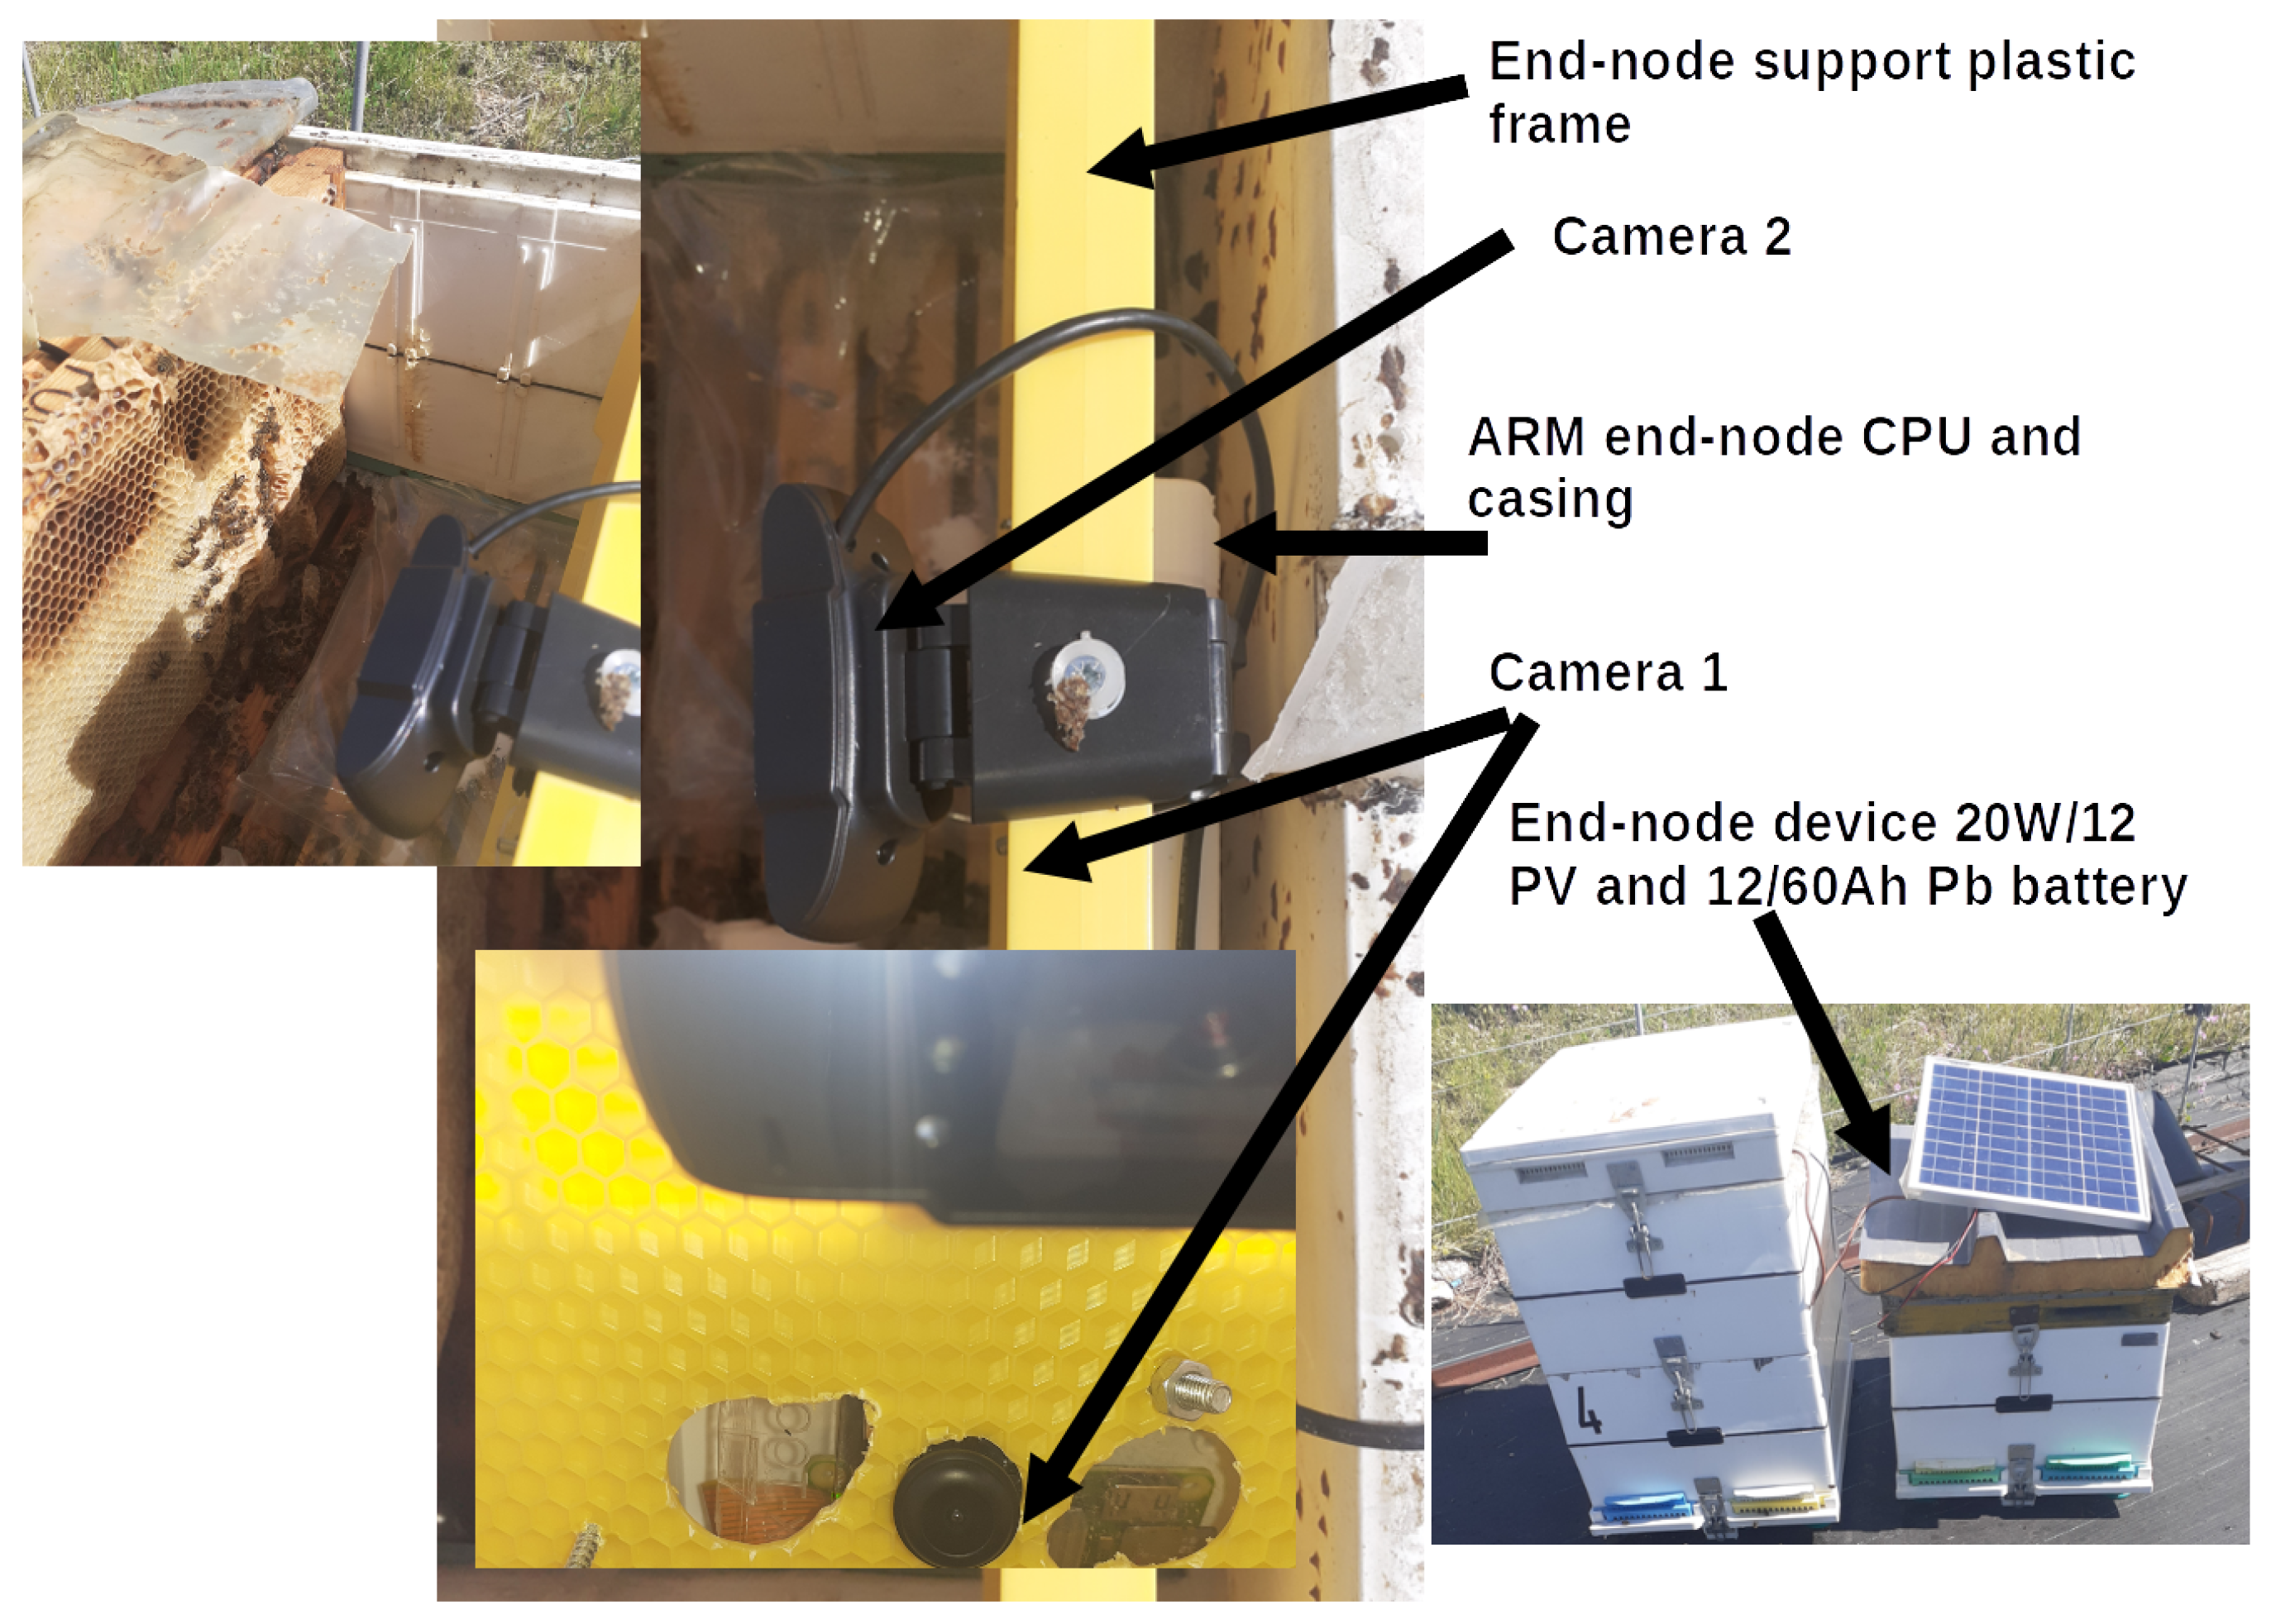
3.1. Beehive Camera End-Node
- The camera module component. There are two camera module components included in the end-node detection module. The first is a 5 MP camera with a fisheye lens of 160 sighting and manually adjusted focus. This camera is connected to the end node microprocessor using a 15 pin FFC cable. The first camera is located in the middle of the plastic frame (see Figure 1, Camera 1). There is also a second camera attached to the end-node device. This is a 5 MP USB camera located on top of the plastic frame. It is placed on top of a plastic frame covered entirely with a smooth plastic surface to avoid being built or waxed by bees. It is equipped with a small led and a hinged arm that allows the camera to take images above and on top of the frames. Both cameras are connected to a quad-core ARM microprocessor and can be used concurrently to capture bee images inside the brood box.
- The Microprocessor Control Unit (MCU). The MCU is a quad-core embedded 64 bit-ARM microprocessor device operating at 1 GHz, including a 512 MB LDDR2 RAM clocked at 450 MHz. The MCU is responsible for storing camera snapshots to its embedded SD-card and if appropriately configured, uploading them to the cloud, using the Varroa detection service Application Interface (API) is created for that purpose (see Figure 1, ARM end-node CPU).
- The data transmission modules. There are MCU embedded Wi-Fi and Bluetooth 4.2 with Bluetooth Low Energy (BLE) capable transponders attached to the MCU. The transponders are used in turn by the two modes of end-node device operations: Online and offline.
- The autonomous device power component. It includes a 20 W/12 V PV panel connected directly to a 12 V-60 Ah lead-acid SLA/AGM battery (see Figure 1). The battery is placed under the PV panel on top of the beehive and feeds the ARM MCU unit using a 12 V voltage regulator with outputs, used to power the end-node device through its micro-USB power port. The battery used is a deep depletion one, since the system might get fully discharged due to its short battery capacity, especially at night or on prolonged cloudy days.
- The real-time clock module. An Inter-Integrated Circuit (I2C) DS1307 Real Time Clock (RTC) module is placed at the General Purpose Input Output (GPIO) pin of the MCU for the process of keeping track of time if the end-node device is operating in offline mode. Suppose online appropriate Network Time Protocol (NTP) service is automatically used to calibrate time offsets and reset the RTC DateTime.
- The Wi-Fi concentrator. It is used only in the online mode of operation, and it is a Wi-Fi access point device that includes an LTE/3G cellular transceiver. The end-node MCU connects to the concentrator for the process of imagery data uploads to the cloud if the device operates in online mode. For the offline mode, the MCU BLE interface is used, transmitting to a distance up to 4–10 m the detection output of the beehive. The following subsection describes the end-node device’s two modes of operation.
3.2. End-Node Device Functionality and Modes of Operation
- Online mode: In this mode of operation, the process of Varroa detection is performed over the cloud. For this purpose, appropriate cloud service and API using HTTP requests have been implemented. The API is capable of image data transmission from the uploaded by the end-node MCU using HTTP protocol PUT requests. Also, an HTTP JSON POST request can be sent to the cloud API, including an API key and a beehive id, and the API returns as part of a JSON object. The Varroa detection results for this beehive, including the base64 encoded images Regions Of Interest (ROIs), where Varroa mite has been detected.The online mode of operation requires using the beehive concentrator, which is responsible for the node data transmissions over the internet over HTTP. It acts as an intermediate gateway among the end nodes and the cloud application service. The concentrator can upload images with an overall bandwidth capability that varies from 1–7/10–57 Mbps, depending on the gateway distance from the beehive [39]. If the distance is 20–30 m, it is limited by the LTE technology used.
- Offline mode: In places of limited Internet connectivity and cellular coverage, the end-node offline mode can be used. The offline mode does not require the use of the concentrator device.In this mode, a micro-service that includes a version of the detection algorithm inside the end-node device is used for the process of executing the Varroa detection algorithm locally (as presented in Figure 2). Then, the final CSV output is transmitted using the MCU BLE transponder to the farmers’ mobile phones. A BLE service and two read characteristics can be used for the CSV output, and Varroa detected ROI image acquisition accordingly. The beekeeper can check the status of each one of his beehives by moving close to the beehive and pairing with each one accordingly, performing the BLE read from his mobile phone. The drawbacks of the offline mode are that it offers 20–25% less end-node energy consumption and no communication provider costs. Nevertheless, it has difficulties with BLE pairing, especially if many BLE devices are close-by and there are difficulties on characteristic reads of imagery base64 encoded data [40,41]. For this reason, only one Varroa mite ROI is available (the last one detected) via that BLE characteristic.
4. Proposed Method for Varroa Mite Early Detection
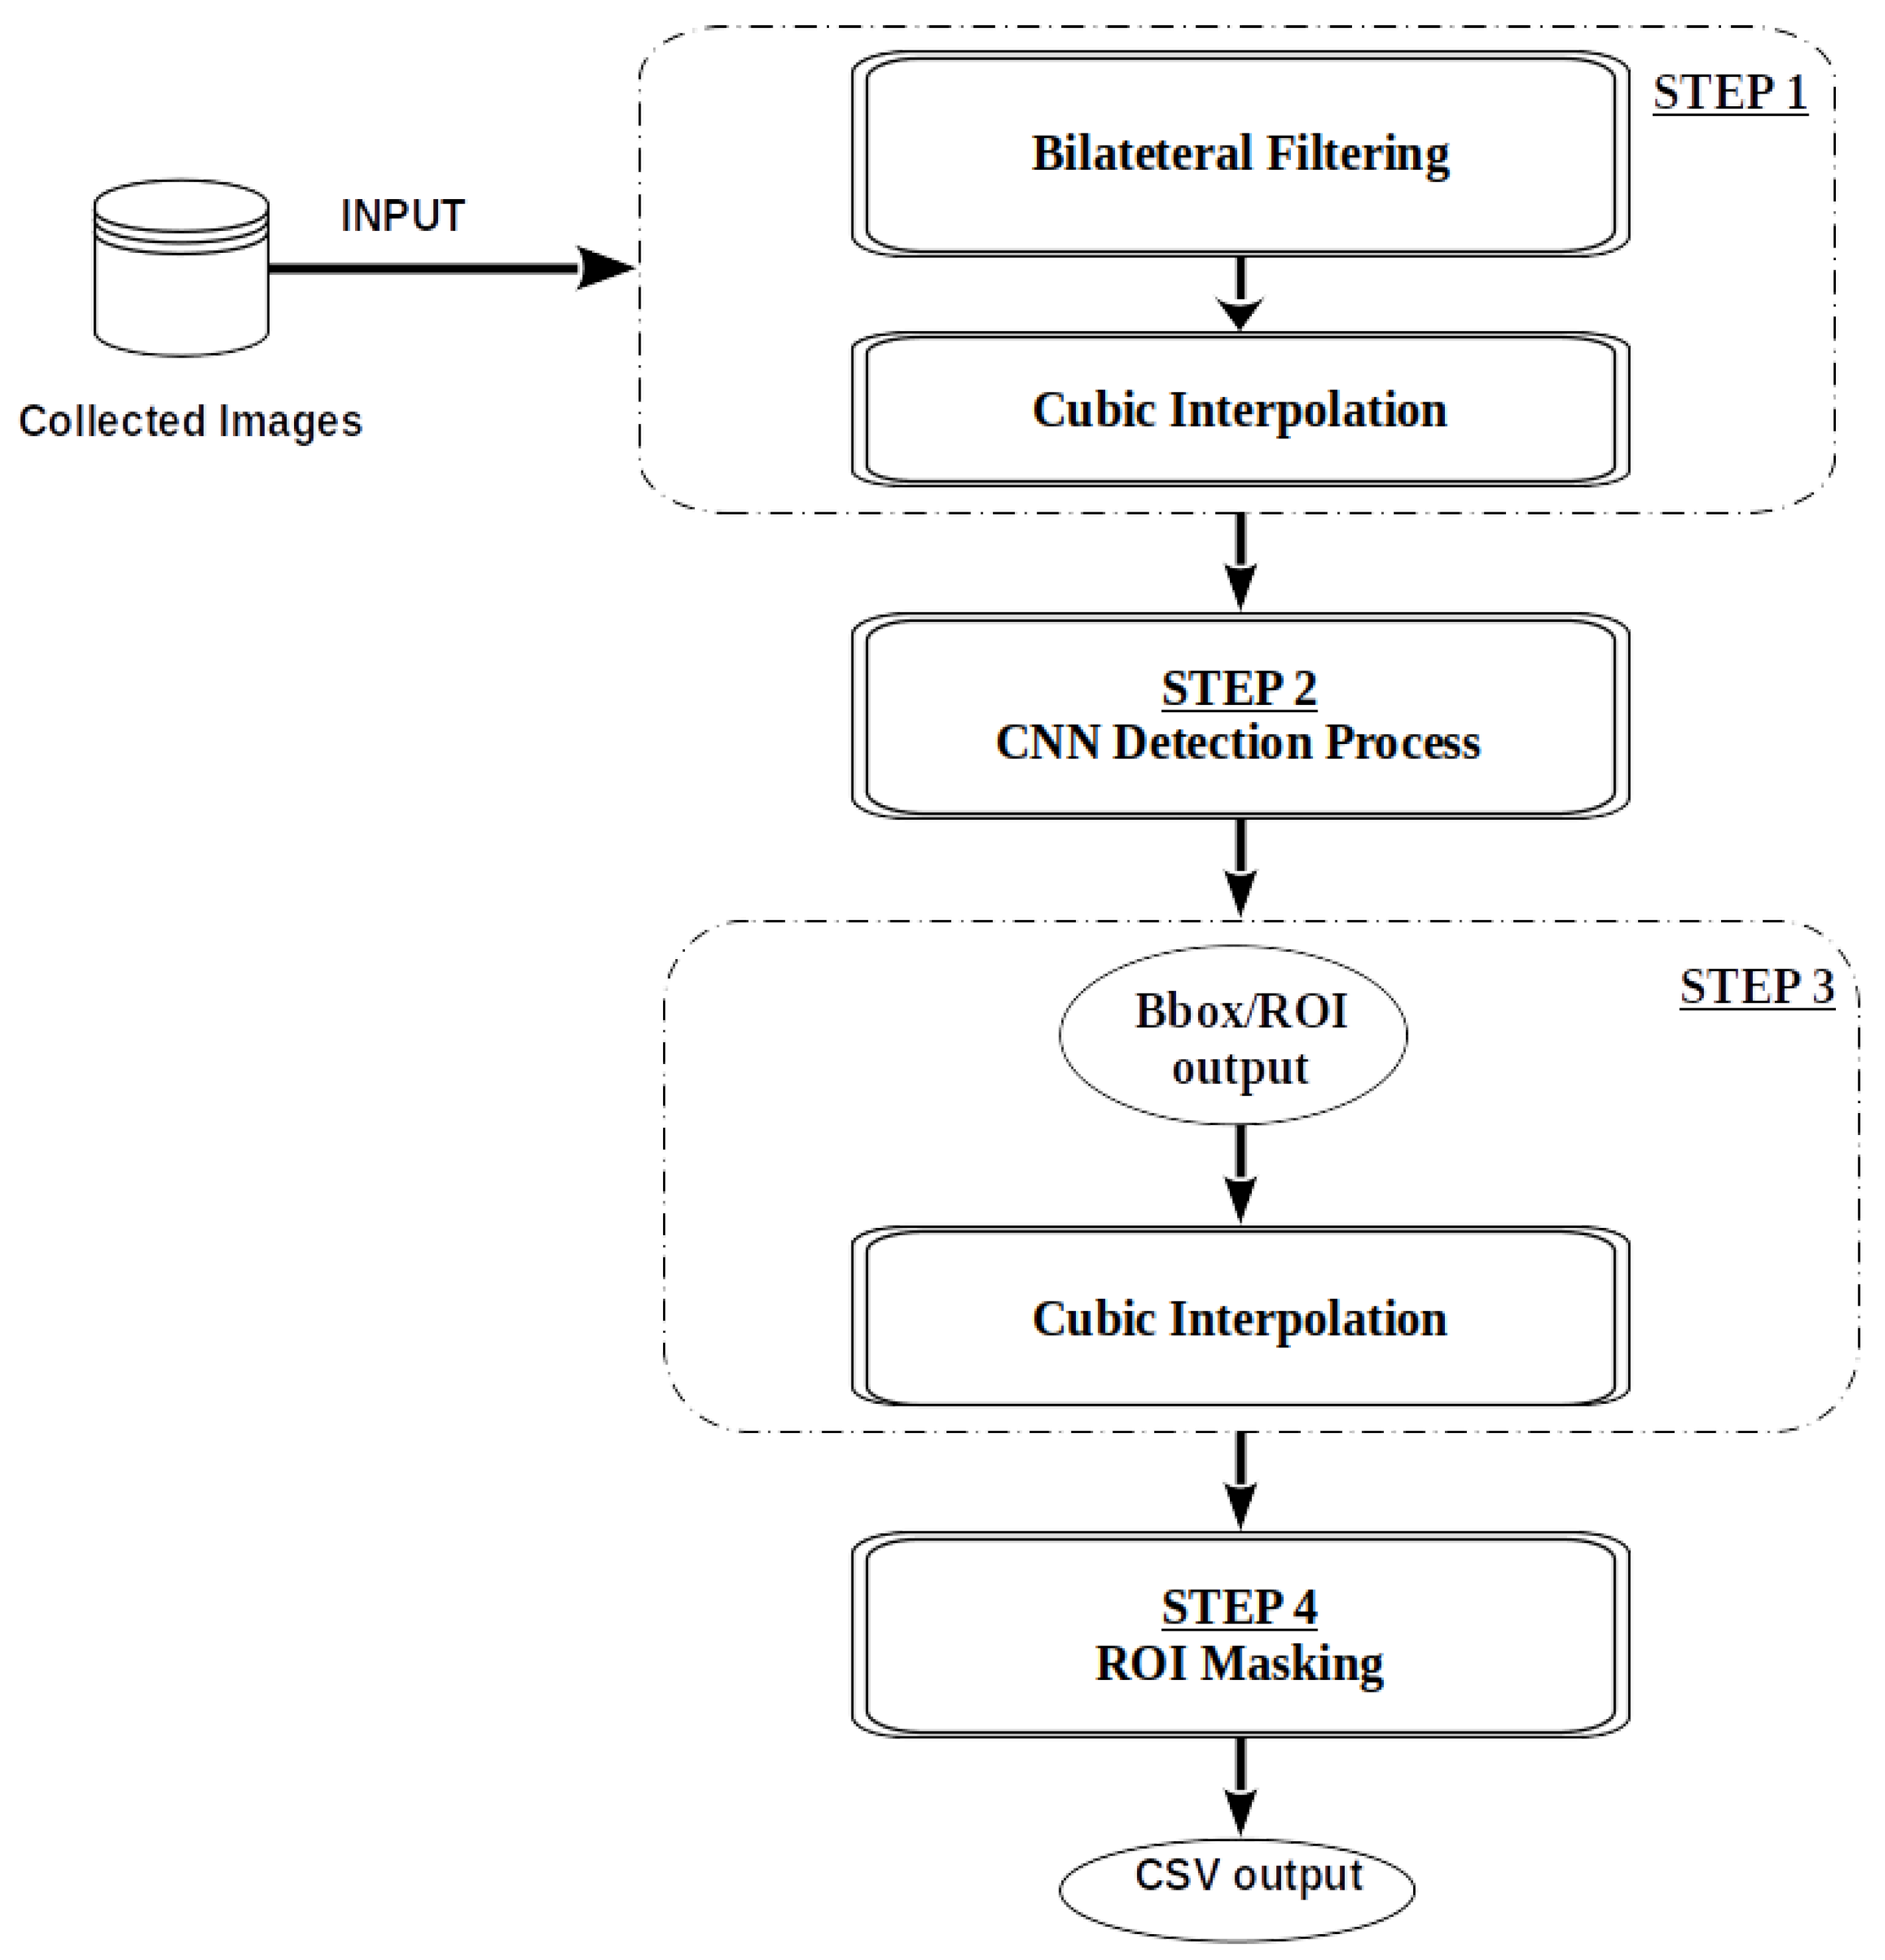
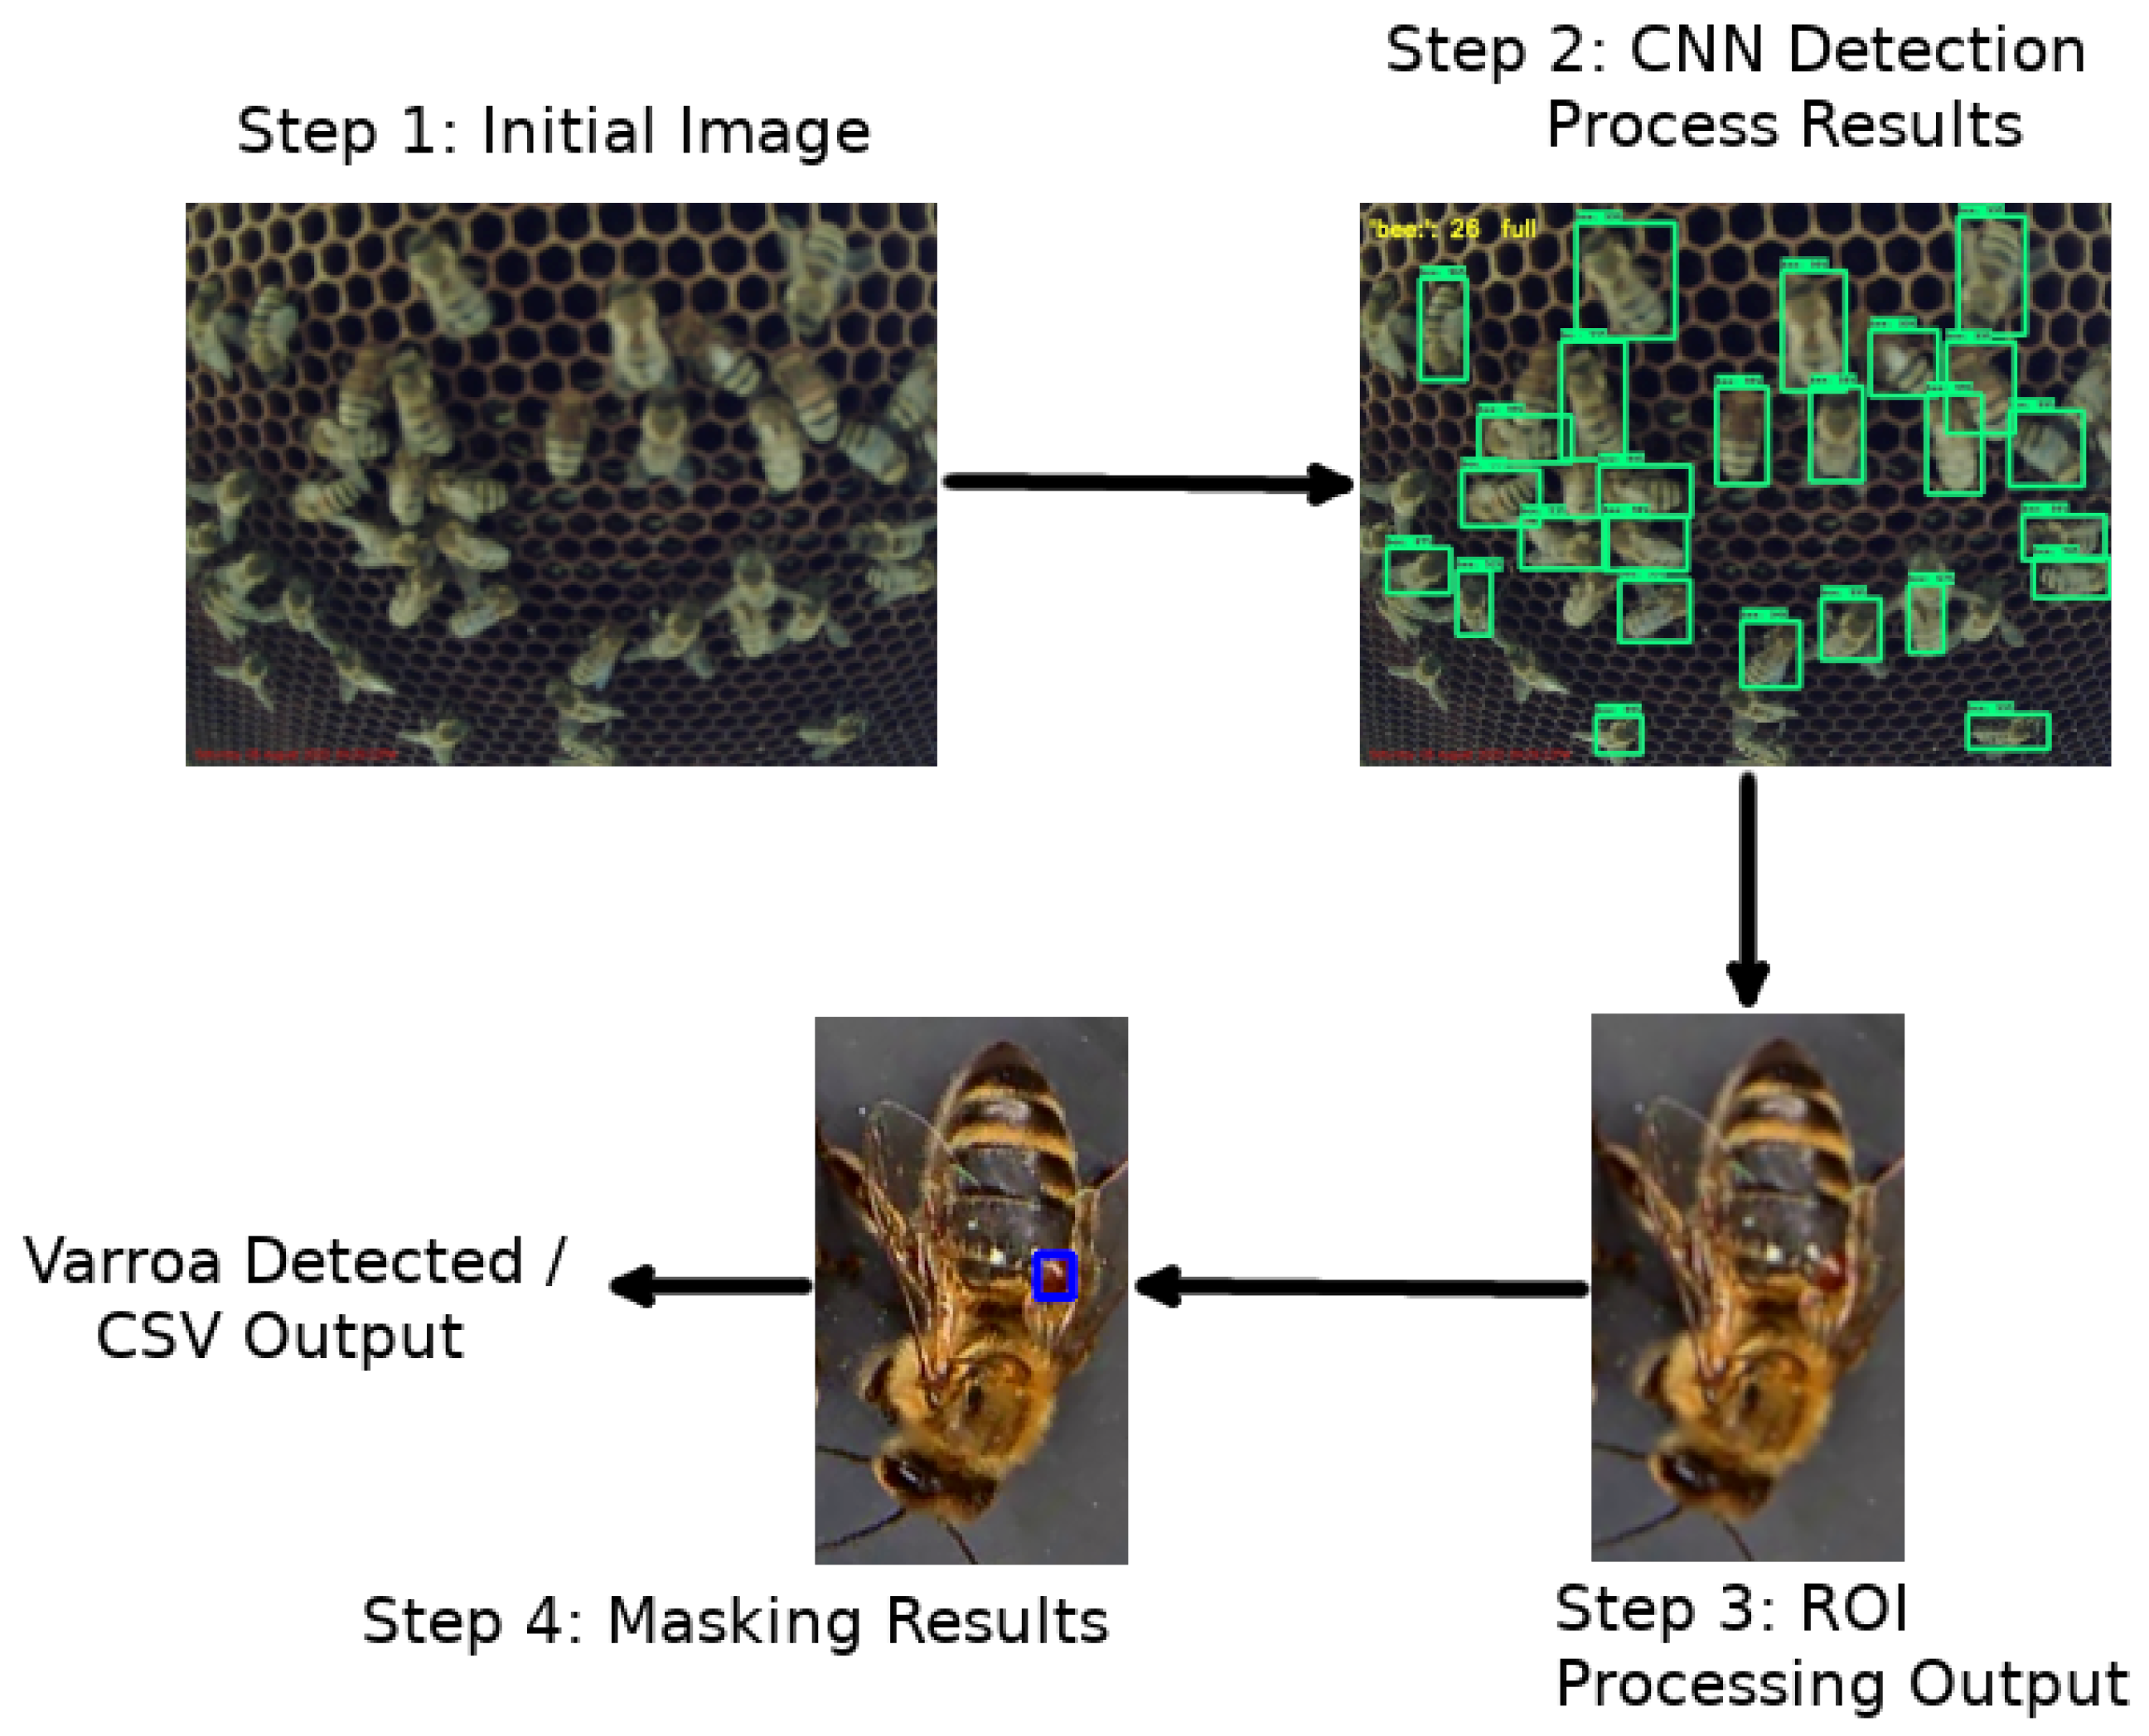
- Step 1—Initial data acquisition and data cleansing: The initial imagery dataset acquired by the Beehive monitoring module is manually analyzed and filtered to eliminate blur images or images of low resolution and light intensity. The photos in this experimentation taken from the camera module are set of the minimum acquisition of 5 Mpx size of px 300 dpi compressed at JPEG format using a compression ratio Q = 70, of picture size 350–500 KB each. Similarly, the trained CNN network and algorithms used are the most processing light for portable devices, using a minimum trained image size input of 640 × 640 px (lightly distorted at the image height) and Cubic interpolation.The trained Convolutional Neural Network (CNN) is used to solve the problem of swarming by counting bees’ concentration above the bee frames and inside the beehive lid. The detection categories that the authors’ classifier has used are:
- Class 0: No bees detected.
- Class 1: very small number of bee detection (less than 10).
- Class 2: Small number of bee detection (20–30).
- Class 3: Medium number of bee detection (30–50).
- Class 4: High number of bee detection (more than 50).
For each class, a number of detected bees has been set as a class identifier (The class identifier boundaries can be arbitrary and set accordingly at the detection service configuration file). Therefore, the selected initial dataset must consist of at least 1000 images per detection class, a total of 5000 images used for our training CNN case. - Step 2—Images transformation and manual data annotation: All images that went through the clearing process were manually annotated using the LabelImg [48] tool. There are other tools used for the photo annotation process, such as Labelbox [49], ImgAnnotation [50] and the Computer Vision Annotation Tool [51], which always create an output in either the JSON or XML format.The resolution and clarity of the original images are extremely important, as this facilitates the detection of the Varroa mite. Regarding the clarity of the photo, the method used is as follows. A bilateral filter smothers all images using a degree of smoothing sigma = 0.5–0.8 and a small 7 × 7 kernel. Afterward, all photos must be scaled to particular and fixed dimensions to be inserted into the training network. Scaling is performed either using a cubic interpolation process or a super-resolution EDSR process [52].The preparation of the photos is initially based on the dimensions that each training algorithm requires for its smooth operation. The OpenCV [53] library is used for the image transformation process and is part of the second and fifth stages of detection. The second stage is before the detection of bees using CNN, and the fifth is the stage of detection of the Varroa mite (see Figure 2).
- Step 2—Training process: The training process is based on the use of PyTorch pre-trained Convolutional Neural Network (CNN) models [54] and the use of all available system resources. The essential computer subsystem for the training process is the GPU to speed up the neural network training. CUDA tools and libraries are used for this purpose according to PyTorch requirements.CNN’s creation is based on pre-existing PyTorch [54] trained models used to train the neural network to detect bees. The selected PyTorch models and their capabilities for the detection process are presented in Table 1. After the annotation of the images of Step 2 is completed, the images are divided into two sets. The first set is the training set which contains 70–80% of the annotated photos, and the remaining 20–30% is the test set. The second can be divided into 50% to create another set which will be the validations sample. Then, you choose the model that will be used for the training. The output of the training process is the CNN model used in Figure 2, which is the Step 2 detection process of bee objects.
- Step 3—Detected bee contours: This step includes a selection process of bee-detected objects based on the confidence threshold value set by the service. A good confidence value threshold that can be used is above 0.5 (50%). Then, the Gaussian filtering cubic interpolation is applied to the selected contours to scale them to sizes (wxh) of 40 × 50 px for step 4 to apply on each distinct ROI.
- Step 4—ROI masking, Varroa mite detection step: This step includes a color transformation from RGB to HSV. Then, an appropriate HSV mask is applied to each bee scaled image, transforming them into binary images, where the detected by the mask areas are set to white and all other areas to black. Then, a Hough transformation is applied to detect circular areas with a lower-upper threshold of 10–90 px. If at least one circular area of this threshold is detected on a bee object, this bee is set as detected with Varroosis. The original color image, including the detected bee object contours with the masked Varroa mite areas annotated on each CNN detected image, is stored in the appropriate output folder. The detection results are appended to the detection service process CSV output file.
- Detection service process and data output: The detection process is performed by a daemon application that is installed as a service on a cloud server or at the embedded end-node device depending on the mode of operation (online, offline). This application loads the inference graph of the CNN neural network into the system memory so that the bees can be detected and then the Varroa mite can be detected. This procedure is performed on each image received from the end node device using HTTP PUT requests. The HTTP PUT method requires that the requested URI message be updated or created, which is enclosed in the body of the PUT message. Thus, if there is a resource in this URI, the message body is considered as a new modified version of this resource. Once the PUT request is received, the service starts scanning the bees and then the Varroa so you can output an updated CSV file containing the number of Varroa mites detected in each photo taken by the end node device. Figure 2 shows in detail the steps of the detection process implemented on the cloud server (online) or in the embedded end-node device (offline).
5. Experimental Scenarios and Results
5.1. Scenario I: Detection System Performance Tests
5.2. Scenario II: Detection Algorithm Accuracy Tests
5.3. Scenario III: Evaluation of Varroa Mite Detection Step
5.4. System Cross Comparison with Existing Literature Solutions
6. Conclusions
Author Contributions
Funding
Institutional Review Board Statement
Informed Consent Statement
Data Availability Statement
Acknowledgments
Conflicts of Interest
Abbreviations
| API | Application Interface |
| BLE | Bluetooth Low Energy |
| FFT | Frequency Fourier Transformation |
| GPIO | General Purpose Input Output |
| CCD | Colony collapse disorder |
| MDA | Mean Detection Accuracy |
| MFCC | Mel-frequency cepstrum coefficients |
| MEL | Melody-Logarithmic scale spectrogram |
| I2C | Inter-Integrated Circuit |
| CNN | Convolutional Neural Network |
| NTP | Network Time Protocol |
| RTC | Real Time Clock |
| ROI | Regions Of Interest |
| WSN | Wireless Sensor Network |
References
- Martinello, M.; Manzinello, C.; Borin, A.; Avram, L.E.; Dainese, N.; Giuliato, I.; Gallina, A.; Mutinelli, F. A Survey from 2015 to 2019 to Investigate the Occurrence of Pesticide Residues in Dead Honeybees and Other Matrices Related to Honeybee Mortality Incidents in Italy. Diversity 2020, 12, 15. [Google Scholar] [CrossRef] [Green Version]
- Oddie, M.; Büchler, R.; Dahle, B.; Kovacic, M.; Le Conte, Y.; Locke, B.; de Miranda, J.R.; Mondet, F.; Neumann, P. Rapid parallel evolution overcomes global honey bee parasite. Sci. Rep. 2018, 8, 7704. [Google Scholar] [CrossRef] [PubMed] [Green Version]
- Flores, J.M.; Gamiz, V.; Jimenez-Marin, A.; Flores-Cortes, A.; Gil-Lebrero, S.; Garrido, J.J.; Hernando, M.D. Impact of Varroa destructor and associated pathologies on the colony collapse disorder affecting honey bees. Res. Vet. Sci. 2021, 135, 85–95. [Google Scholar] [CrossRef] [PubMed]
- Dineva, K.; Atanasova, T. ICT-Based Beekeeping Using IoT and Machine Learning. In Proceedings of the Distributed Computer and Communication Networks, Moscow, Russia, 17–21 September 2018; Springer International Publishing: Cham, Switzerland, 2018; pp. 132–143. [Google Scholar]
- Olate-Olave, V.R.; Verde, M.; Vallejos, L.; Perez Raymonda, L.; Cortese, M.C.; Doorn, M. Bee Health and Productivity in Apis mellifera, a Consequence of Multiple Factors. Vet. Sci. 2021, 8, 76. [Google Scholar] [CrossRef]
- Rafael Braga, A.; Gomes, D.G.; Rogers, R.; Hassler, E.E.; Freitas, B.M.; Cazier, J.A. A method for mining combined data from in-hive sensors, weather and apiary inspections to forecast the health status of honey bee colonies. Comput. Electron. Agric. 2020, 169, 105161. [Google Scholar] [CrossRef]
- De la Mora, A.; Emsen, B.; Morfin, N.; Borges, D.; Eccles, L.; Kelly, P.G.; Goodwin, P.H.; Guzman-Novoa, E. Selective Breeding for Low and High Varroa destructor Growth in Honey Bee (Apis mellifera) Colonies: Initial Results of Two Generations. Insects 2020, 11, 864. [Google Scholar] [CrossRef]
- Le Conte, Y.; Arnold, G.; Desenfant, P. Influence of Brood Temperature and Hygrometry Variations on the Development of the Honey Bee Ectoparasite Varroa jacobsoni (Mesostigmata: Varroidae). Environ. Entomol. 1990, 19, 1780–1785. [Google Scholar] [CrossRef]
- Kraus, B.; Velthuis, H.H.W. High Humidity in the Honey Bee (Apis mellifera L.) Brood Nest Limits Reproduction of the Parasitic Mite Varroa jacobsoni Oud. Naturwissenschaften 1997, 84, 217–218. [Google Scholar] [CrossRef] [Green Version]
- Zacepins, A.; Kviesis, A.; Pecka, A.; Osadcuks, V. Development of Internet of Things concept for Precision Beekeeping. In Proceedings of the 18th International Carpathian Control Conference (ICCC), Sinaia, Romania, 28–31 May 2017; Volume 1, pp. 23–27. [Google Scholar] [CrossRef]
- Meikle, W.G.; Weiss, M.; Maes, P.W.; Fitz, W.; Snyder, L.A.; Sheehan, T.; Mott, B.M.; Anderson, K.E. Internal hive temperature as a means of monitoring honey bee colony health in a migratory beekeeping operation before and during winter. Apidologie 2017, 48, 666–680. [Google Scholar] [CrossRef] [Green Version]
- Kady, C.; Chedid, A.M.; Kortbawi, I.; Yaacoub, C.; Akl, A.; Daclin, N.; Trousset, F.; Pfister, F.; Zacharewicz, G. IoT-Driven Workflows for Risk Management and Control of Beehives. Diversity 2021, 13, 296. [Google Scholar] [CrossRef]
- Kontogiannis, S. An Internet of Things-Based Low-Power Integrated Beekeeping Safety and Conditions Monitoring System. Inventions 2019, 4, 52. [Google Scholar] [CrossRef] [Green Version]
- Mekala, M.S.; Viswanathan, P. A Survey: Smart agriculture IoT with cloud computing. In Proceedings of the 2017 International conference on Microelectronic Devices, Circuits and Systems (ICMDCS), Vellore, India, 10–12 August 2017; Volume 1, pp. 1–7. [Google Scholar] [CrossRef]
- Zabasta, A.; Kunicina, N.; Kondratjevs, K.; Ribickis, L. IoT Approach Application for Development of Autonomous Beekeeping System. In Proceedings of the 2019 International Conference in Engineering Applications (ICEA), Sao Miguel, Portugal, 8–11 July 2019; Volume 1, pp. 1–6. [Google Scholar] [CrossRef]
- Gil-Lebrero, S.; Quiles-Latorre, F.J.; Ortiz-Lopez, M.; Sanchez-Ruiz, V.; Gamiz-Lopez, V.; Luna-Rodriguez, J.J. Honey Bee Colonies Remote Monitoring System. Sensors 2017, 17, 55. [Google Scholar] [CrossRef] [Green Version]
- Zacepins, A.; Kviesis, A.; Stalidzans, E.; Liepniece, M.; Meitalovs, J. Remote detection of the swarming of honey bee colonies by single-point temperature monitoring. Biosyst. Eng. 2016, 148, 76–80. [Google Scholar] [CrossRef]
- Ntawuzumunsi, E.; Kumaran, S.; Sibomana, L. Self-Powered Smart Beehive Monitoring and Control System (SBMaCS). Sensors 2021, 21, 3522. [Google Scholar] [CrossRef]
- Nolasco, I.; Terenzi, A.; Cecchi, S.; Orcioni, S.; Bear, H.L.; Benetos, E. Audio-based Identification of Beehive States. In Proceedings of the IEEE International Conference on Acoustics, Speech and Signal Processing (ICASSP), Brighton, UK, 12–17 May 2019; Volume 1, pp. 8256–8260. [Google Scholar] [CrossRef] [Green Version]
- Simic, M.; Starcevic, V.; Kezić, N.; Babic, Z. Simple and Low-Cost Electronic System for Honey Bee Counting. In Proceedings of the 28th International Electrotechnical and Computer Science Conference, Portorož, Slovenia, 23–24 September 2019. [Google Scholar]
- Odemer, R. Approaches, challenges and recent advances in automated bee counting devices: A review. Ann. Appl. Biol. 2022, 180, 73–89. [Google Scholar] [CrossRef]
- Liew, L.H.; Lee, B.Y.; Chan, M. Cell detection for bee comb images using Circular Hough Transformation. In Proceedings of the nternational Conference on Science and Social Research (CSSR), Kuala Lumpur, Malaysia, 5–7 December 2010; pp. 191–195. [Google Scholar] [CrossRef]
- Baptiste, M.; Ekszterowicz, G.; Laurent, J.; Rival, M.; Pfister, F. Bee Hive Traffic Monitoring by Tracking Bee Flight Paths. 2018. Available online: https://hal.archives-ouvertes.fr/hal-01940300/document (accessed on 20 September 2019).
- Gregorc, A.; Sampson, B. Diagnosis of Varroa Mite (Varroa destructor) and Sustainable Control in Honey Bee (Apis mellifera) Colonies—A Review. Diversity 2019, 11, 243. [Google Scholar] [CrossRef] [Green Version]
- Prost, P.J.; Medori, P. Apiculture, 6th ed.; Intercept Ltd.: Mauritius, France, 1994. [Google Scholar]
- de Ruijter, A.; v.d. Eijnde, J. Detection of Varroa Mite in the Netherlands Using Tobacco Smoke. Bee World 1984, 65, 151–154. [Google Scholar] [CrossRef]
- Clement, H. Modern Beekeeping; Psichalos Publications: Athens, Greece, 2017. [Google Scholar]
- Ontario Ministry of Agriculture, Food and Rural Affairs. Varroa Mite—Sampling and Monitoring Infestation Levels. 2019. Available online: http://www.omafra.gov.on.ca/english/food/inspection/bees/varroa-sampling.htm (accessed on 13 March 2019).
- Szczurek, A.; Maciejewska, M.; Zajiczek, Z.; Bak, B.; Wilk, J.; Wilde, J.; Siuda, M. The Effectiveness of Varroa destructor Infestation Classification Using an E-Nose Depending on the Time of Day. Sensors 2020, 20, 2532. [Google Scholar] [CrossRef]
- Edwards Murphy, F.; Popovici, E.; Whelan, P.; Magno, M. Development of an heterogeneous wireless sensor network for instrumentation and analysis of beehives. In Proceedings of the 2015 IEEE International Instrumentation and Measurement Technology Conference (I2MTC) Proceedings, Pisa, Italy, 11–14 May 2015; pp. 346–351. [Google Scholar] [CrossRef]
- Bellos, C.V.; Fyraridis, A.; Stergios, G.S.; Stefanou, K.A.; Kontogiannis, S. A Quality and disease control system for beekeeping. In Proceedings of the 2021 6th South-East Europe Design Automation, Computer Engineering, Computer Networks and Social Media Conference (SEEDA-CECNSM), Preveza, Greece, 24–26 September 2021; pp. 1–4. [Google Scholar] [CrossRef]
- Sevin, S.; Tutun, H.; Mutlu, S. Detection of Varroa mites from honey bee hives by smart technology Var-Gor: A hive monitoring and image processing device. Turk. J. Vet. Anim. Sci. 2021, 45, 487–491. [Google Scholar] [CrossRef]
- Mrozek, D.; Gorny, R.; Wachowicz, A.; Malysiak-Mrozek, B. Edge-Based Detection of Varroosis in Beehives with IoT Devices with Embedded and TPU-Accelerated Machine Learning. Appl. Sci. 2021, 11, 11078. [Google Scholar] [CrossRef]
- Chazette, L.; Becker, M.; Szczerbicka, H. Basic algorithms for bee hive monitoring and laser-based mite control. In Proceedings of the 2016 IEEE Symposium Series on Computational Intelligence (SSCI), Athens, Greece, 6–9 December 2016; pp. 1–8. [Google Scholar] [CrossRef]
- Kaur, M. A CNN-Based Identification of Honeybees’ Infection Using Augmentation. Master’s Thesis, Unitec Institute of Technology, Auckland, New Zealand, 2021. [Google Scholar]
- Bilik, S.; Kratochvila, L.; Ligocki, A.; Bostik, O.; Zemcik, T.; Hybl, M.; Horak, K.; Zalud, L. Visual Diagnosis of the Varroa Destructor Parasitic Mite in Honeybees Using Object Detector Techniques. Sensors 2021, 21, 2764. [Google Scholar] [CrossRef] [PubMed]
- Redmon, J.; Divvala, S.; Girshick, R.; Farhadi, A. You Only Look Once: Unified, Real-Time Object Detection. In Proceedings of the 2016 IEEE Conference on Computer Vision and Pattern Recognition (CVPR), Las Vegas, NV, USA, 27–30 June 2016; pp. 779–788. [Google Scholar] [CrossRef] [Green Version]
- Liu, W.; Anguelov, D.; Erhan, D.; Szegedy, C.; Reed, S.; Fu, C.Y.; Berg, A.C. SSD: Single Shot MultiBox Detector. In Proceedings of the Computer Vision—ECCV 2016; Leibe, B., Matas, J., Sebe, N., Welling, M., Eds.; Springer International Publishing: Cham, Switzerland, 2016; pp. 21–37. [Google Scholar]
- Gomez, K.; Riggio, R.; Rasheed, T.; Granelli, F. Analysing the energy consumption behaviour of WiFi networks. In Proceedings of the IEEE Online Conference on Green Communications, Piscataway, NJ, USA, 26–29 September 2011; Volume 1, pp. 98–104. [Google Scholar] [CrossRef]
- Yang, J.; Poellabauer, C.; Mitra, P.; Neubecker, C. Beyond beaconing: Emerging applications and challenges of BLE. Ad Hoc Netw. 2020, 97, 102015. [Google Scholar] [CrossRef] [Green Version]
- Siva, J.; Yang, J.; Poellabauer, C. Connection-less BLE Performance Evaluation on Smartphones. Procedia Comput. Sci. 2019, 155, 51–58. [Google Scholar] [CrossRef]
- Minaee, S.; Boykov, Y.Y.; Porikli, F.; Plaza, A.J.; Kehtarnavaz, N.; Terzopoulos, D. Image Segmentation Using Deep Learning: A Survey. IEEE Trans. Pattern Anal. Mach. Intell. 2022, 44, 3523–3542. [Google Scholar] [CrossRef]
- Ahmed, A. Pre-trained CNNs Models for Content based Image Retrieval. Int. J. Adv. Comput. Sci. Appl. 2021, 12, 2021. [Google Scholar] [CrossRef]
- Ren, S.; He, K.; Girshick, R.; Sun, J. Faster R-CNN: Towards Real-Time Object Detection with Region Proposal Networks. arXiv 2016, arXiv:1506.01497. [Google Scholar] [CrossRef] [Green Version]
- Shahi, T.B.; Sitaula, C.; Neupane, A.; Guo, W. Fruit classification using attention-based MobileNetV2 for industrial applications. PLoS ONE 2022, 17, e0264586. [Google Scholar] [CrossRef]
- Wang, W.; Yang, Y.; Wang, X.; Wang, W.; Li, J. Development of convolutional neural network and its application in image classification: A survey. Optical Eng. 2019, 58, 1–19. [Google Scholar] [CrossRef] [Green Version]
- Bharati, P.; Pramanik, A. Deep Learning Techniques-R-CNN to Mask R-CNN: A Survey. In Proceedings of the Computational Intelligence in Pattern Recognition; Springer: Singapore, 2020; pp. 657–668. [Google Scholar]
- Tzudalin, D. LabelImg Is a Graphical Image Annotation Tool and Label Object Bounding Boxes in Images. 2016. Available online: https://github.com/tzutalin/labelImg (accessed on 18 September 2019).
- Labelbox Company. Labelbox: The Leading Training Data Platform for Data Labeling. Available online: https://labelbox.com (accessed on 5 June 2021).
- Image Annotation Tool. Available online: https://github.com/alexklaeser/imgAnnotation (accessed on 3 June 2021).
- Team, O. Computer Vision Annotation Tool (CVAT). 2021. Available online: https://github.com/openvinotoolkit/cvat (accessed on 15 June 2021).
- Lim, B.; Son, S.; Kim, H.; Nah, S.; Lee, K.M. Enhanced Deep Residual Networks for Single Image Super-Resolution. In Proceedings of the IEEE Conference on Computer Vision and Pattern Recognition Workshops (CVPRW), Honolulu, HI, USA, 21–26 July 2017; Volume 1, pp. 1132–1140. [Google Scholar] [CrossRef] [Green Version]
- Bradski, G. The OpenCV Library. Dr. Dobb’s J. Softw. Tools 2000, 120, 122–125. [Google Scholar]
- Models and Pre-Trained Weights—Torchvision 0.12 Documentation. Available online: https://pytorch.org/vision/stable/models.html (accessed on 9 January 2022).
- Sandler, M.; Howard, A.; Zhu, M.; Zhmoginov, A.; Chen, L.C. MobileNetV2: Inverted Residuals and Linear Bottlenecks. arXiv 2019, arXiv:1801.04381. [Google Scholar]
- Howard, A.; Sandler, M.; Chu, G.; Chen, L.C.; Chen, B.; Tan, M.; Wang, W.; Zhu, Y.; Pang, R.; Vasudevan, V.; et al. Searching for MobileNetV3. arXiv 2019, arXiv:1905.02244. [Google Scholar]
- He, K.; Zhang, X.; Ren, S.; Sun, J. Deep Residual Learning for Image Recognition. arXiv 2015, arXiv:1512.03385. [Google Scholar]
- Voudiotis, G.; Kontogiannis, S.; Pikridas, C. Proposed Smart Monitoring System for the Detection of Bee Swarming. Inventions 2021, 6, 87. [Google Scholar] [CrossRef]
- Tan, M.; Le, Q. EfficientNet: Rethinking Model Scaling for Convolutional Neural Networks. In Proceedings of the 36th International Conference on Machine Learning, Long Beach, CA, USA, 9–15 June 2019; Volume 97, pp. 6105–6114. [Google Scholar]


| CNN Mode | CNN Models Capabilities | ||
|---|---|---|---|
| Input Images Size (wxh) [px] | Accuracy for Detected ROIs Confidence Level Values = 100% | Accuracy for Detected ROIs Confidence Level Values ≥ 50% | |
| MobileNet V2 | 640 × 640 | 71.878 | 90.286 |
| MobileNet V3 | 640 × 640 | 74.042 | 91.340 |
| ResNet-50 FPN | 640 × 640 | 76.130 | 92.862 |
| CNN Models | Load Time (s) | Testing Detection Time (s) | Detection Average Time per Image (s) | Total Time (s) | Memory Usage (MB) |
|---|---|---|---|---|---|
| MobileNet V2 | 125.37 | 10,848.27 | 104.56 | 10,973.63 | 62.6 |
| MobileNet V3 | 94.4 | 8243.58 | 78.72 | 8837.98 | 66.4 |
| ResNet-50 FPN | 88.19 | 38,992.5 | 385.97 | 39,080.7 | 74.2 |
| CNN Models | Load Time (s) | Testing Detection Time (s) | Detection Average Time per Image (s) | Total Time (s) | Memory Usage (MB) |
|---|---|---|---|---|---|
| MobileNet V2 | 3.786 | 265.374 | 2.33 | 269.16 | 81.5 |
| MobileNet V3 | 2.037 | 205.216 | 1.808 | 207.25 | 80.2 |
| ResNet-50 FPN | 1.514 | 681.78 | 6.555 | 683.29 | 81.4 |
| CNN Models | Load Time (s) | Testing Detection Time (s) | Detection Average Time per Image (s) | Total Time (s) | Memory Usage (MB) |
|---|---|---|---|---|---|
| MobileNet V2 | 2.614 | 74.78 | 0.47 | 77.4 | 13.4 |
| MobileNet V3 | 1.92 | 59.32 | 0.37 | 61.24 | 13.1 |
| ResNet-50 FPN | 2.45 | 106.77 | 0.831 | 109.23 | 13.3 |
| CNN Models | Mean Detection Accuracy (MDA) | CNN Model mAP | End Node Device SF | Cloud Server Version 1 SF | Cloud Server Version 2 SF |
|---|---|---|---|---|---|
| Mobilenet V2 | 0.887 | 0.481 | 0.003 | 0.17 | 0.28 |
| Mobilenet V3 | 0.677 | 0.496 | 0.003 | 0.14 | 0.29 |
| ResNet-50 FPN | 0.821 | 0.467 | 0.001 | 0.1 | 0.25 |
| Class Test | Predicted Varroa | Predict No Varroa | Accuracy (%) | Precision (%) |
|---|---|---|---|---|
| Actual Varroa | TP = 64 | FN = 36 | 77 | 86 |
| Actual No Varroa | FP = 10 | TN = 90 |
| Proposed Solutions | Camera Facing Frames | Max Detection Precision (%) | Mean Detection Time (ms) | Offline Operation |
|---|---|---|---|---|
| Mrozek et al. [33] | No | 36 | 270 | No |
| Chazette et al. [34] | No | 72 | 2500 | Yes |
| Bilik et al. [36] | - | 87 | 0.05 | No |
| Authors’ system | Yes | 86 | 104,560 (Offline), 470 (Online) | Yes |
Publisher’s Note: MDPI stays neutral with regard to jurisdictional claims in published maps and institutional affiliations. |
© 2022 by the authors. Licensee MDPI, Basel, Switzerland. This article is an open access article distributed under the terms and conditions of the Creative Commons Attribution (CC BY) license (https://creativecommons.org/licenses/by/4.0/).
Share and Cite
Voudiotis, G.; Moraiti, A.; Kontogiannis, S. Deep Learning Beehive Monitoring System for Early Detection of the Varroa Mite. Signals 2022, 3, 506-523. https://doi.org/10.3390/signals3030030
Voudiotis G, Moraiti A, Kontogiannis S. Deep Learning Beehive Monitoring System for Early Detection of the Varroa Mite. Signals. 2022; 3(3):506-523. https://doi.org/10.3390/signals3030030
Chicago/Turabian StyleVoudiotis, George, Anna Moraiti, and Sotirios Kontogiannis. 2022. "Deep Learning Beehive Monitoring System for Early Detection of the Varroa Mite" Signals 3, no. 3: 506-523. https://doi.org/10.3390/signals3030030
APA StyleVoudiotis, G., Moraiti, A., & Kontogiannis, S. (2022). Deep Learning Beehive Monitoring System for Early Detection of the Varroa Mite. Signals, 3(3), 506-523. https://doi.org/10.3390/signals3030030