Article

Skyfall: Signal Fusion from a Smartphone Falling from the Stratosphere

1
Infrasound Laboratory, Hawaii Institute of Geophysics and Planetology, School of Ocean and Earth Science and Technology, University of Hawaii, Manoa, Kailua-Kona, HI 96740, USA
2
RedVox, Inc., Kailua-Kona, HI 96740, USA
3
Sandia National Laboratories, Albuquerque, NM 87123, USA
4
Nevada National Security Site, Las Vegas, NV 89030, USA
*
Author to whom correspondence should be addressed.
Signals 2022, 3(2), 209-234; https://doi.org/10.3390/signals3020014
Submission received: 23 February 2022 / Revised: 1 April 2022 / Accepted: 8 April 2022 / Published: 14 April 2022
(This article belongs to the Special Issue Internet of Things for Smart Planet: Present and Future)

Abstract

:
A smartphone plummeted from a stratospheric height of 36 km, providing a near-real-time record of its rapid descent and ground impact. An app recorded and streamed useful internal multi-sensor data at high sample rates. Signal fusion with external and internal sensor systems permitted a more detailed reconstruction of the Skyfall chronology, including its descent speed, rotation rate, and impact deceleration. Our results reinforce the potential of smartphones as an agile and versatile geophysical data collection system for environmental and disaster monitoring IoT applications. We discuss mobile environmental sensing capabilities and present a flexible data model to record and stream signals of interest. The Skyfall case study can be used as a guide to smartphone signal processing methods that are transportable to other hardware platforms and operating systems.

1. Introduction

The rapidly expanding capabilities of sensor systems in smartphones makes them viable Internet of Things (IoT) platforms [1] and has fueled their adoption as data collection systems. These mobile commercial off-the-shelf (COTS) cyber-physical systems [2] are well suited for constructing low size, weight, power, and cost (low SWaP-C) distributed sensor networks [3,4,5,6,7,8,9,10,11,12,13,14,15,16,17,18,19,20]. Early studies [3] concentrated on possibilities, whereas more recent studies focus on specific use cases. Some applications center on biosignals [4,5,6,7], improvements in geolocation [8,9,10], and educational or citizen science [11,12,13,14,15]. Our work contributes to the growing environmental and disaster monitoring IoT [1] at regional and global scales [16,17,18,19,20,21,22,23,24,25]. All of these efforts have been aided by the rapid increase in processor speeds and dynamic range of on-board sensors, which have improved signal quality and reduced signal latency.
One of the key disaster monitoring IoT applications is explosion monitoring. The basic concept of operation is that smartphones with optimized settings could use their internal sensors to provide useful information about the environmental impact of an explosive blast [20]. We present smartphones as an efficient technical solution for exploratory studies and to provide additional information for observational gaps. A variety of infrasound and geoacoustic monitoring scenarios have been evaluated since 2014 [20], with successful collection and analysis of explosive signals varying from small-yield surface detonations (e.g., [21]) to the 2022 multi-megaton eruption blast from the Hunga Tonga volcano [22].
This paper reports the results of an experiment designed to record surface explosions from high-altitude balloons. This is a viable concept of operation for remote environmental monitoring on Earth and Venus (e.g., [24]). The balloon flew up to ~36 km into the stratosphere, about 3.6 times the nominal 10 km cruising altitude of commercial aircraft. Despite the ambient low pressure and subzero temperatures, the smartphone acoustic and acceleration sensors picked up the explosion signal [23], and all sensors recorded the rapid, turbulent descent and ground impact. The very survivability of a smartphone operating and falling from stratospheric heights is noteworthy and a testament to the present-day ruggedness of these platforms. We present the first published smartphone measurements in the stratosphere; the first smartphone observations of the dynamics of a sensor system falling through the stratosphere and troposphere and impacting the ground; and the first airborne smartphone multimodal sensor fusion and validation with external geospatial and barometric sensor systems. At the time of writing, the explosion signal data are embargoed. However, the data from the balloon’s descent through the stratosphere and troposphere (the Skyfall), and its impact with the ground, are openly available and have much higher signal diversity.
Although the key application is disaster (e.g., explosion) monitoring IoT, one of our main motivations is educational. Various students, engineers, and researchers have requested practical advice on how to access, process, and integrate smartphone multi-sensor data. This paper addresses this knowledge gap by describing the Skyfall stage in detail and providing open-source methods to perform multi-sensor data fusion to reconstruct the descent timeline. Our intended audience are researchers, engineers, early-career, and citizen scientists interested in a hands-on guide to the present data-gathering capabilities of smartphones and the resulting types of data structures. Due to the breadth of the intended audience, we have made substantial efforts to make this paper accessible. The next section provides a summary of the systems, sensors, and signals that define this work. Section 3 presents the materials and methods available to the reader to reproduce our results. Section 4 discusses the signal fusion process in some detail, where the combination of the information inferred from the different sensor signals allows the reconstruction of a cohesive Skyfall narrative. Section 5 summarizes the results in Section 4 and provides some recommendations on how to approach and interpret multimodal signals. The concluding remarks place this work in the context of emerging IoT information systems.
When arriving at Section 4, or if jumping to the Section 5 summary, we invite the reader to imagine being an observer—perchance part of a disaster rescue team—in a comparable airborne platform the moment it lost lift and propulsion. A pre-configured smartphone in your pocket would have provided near-real-time situational awareness to support teams, sent a prompt recovery location, and permitted a detailed reconstruction of the descent and impact.

2. Summary of Systems, Sensors, and Signals

On 27 October 2020, a Samsung Galaxy S10 [26] smartphone was hoisted by a helium-filled mylar balloon over southern Nevada to capture blast signatures from a surface chemical explosion [23]. This S10 model has been extensively tested and validated operationally in nuclear reactor monitoring studies (e.g., [25]). The S10 smartphone collected geophysical and state-of-health information using multiple on-board sensors. Additional location and barometric pressure information was provided by lightweight external sensors specifically designed for high-altitude balloon deployment and payload recovery. The balloon reached an altitude of 36.3 km before the payload was released; its descent through the stratosphere and troposphere was slowed by a parachute. Although the landing was abrupt—as expected from the non-steerable parachute canopy—the smartphone was recovered intact and has been deployed in subsequent missions.
We focus on the environmental and geophysical signals recorded by the smartphone during its rapid descent until its ground impact ~30 min later. The smartphone was running the Android version of the RedVox application available through the Google Play Store [27] (an Apple version is also available through the App Store [28]). Signals from the surface explosion are explicitly excluded in this work as they are part of separate studies [21,23].
The choice of smartphones as our low SWaP-C system platform is worth a brief note. We presently experiment with single-board computers; after adding a wireless communication system, various external sensors, tuning the analogue-to-digital parameters, adding a touch screen for navigation, and calibrating and bench testing the system, we end up with a bulky stand-alone digital data acquisition system with a price point comparable to a smartphone. In contrast, anybody with a reasonably modern smartphone can download an app and start recording useful environmental data.
Some of the advantages of the smartphone platforms are their ubiquity, accessibility, and immediacy. However, the types of sensors and processors on board a smartphone vary widely and evolve rapidly. All smartphones have a microphone [29] and most of them use micro-electromechanical systems (MEMS) [30,31]. Original equipment manufacturers (OEMs) often obscure the specifications and configurations of microphones to protect their supply lines and retain their competitive advantage. With tens of thousands of smartphone models available in the wild, standardizing calibrations is a challenging task. The microphones are designed for the recording and transmission of speech, which requires an enhanced response across the 350–4800 Hz passband.
Wagner and Fick [30] described the pressure reciprocity calibration of MEMS microphones commonly used in smartphones across 100–10,000 Hz. Their measurements showed the MEMS microphone responses to be within manufacturer specifications. Brown and Evans [29] measured 1/3-octave sound pressure levels and reverberation time with iPhone applications (apps) and compared them to a Brüel & Kjaer (B&K) Hand Held Sound Level Meter Type 2250. This study found that iPhone and B&K sound pressure levels were typically within 5 dB of each other, and that iPhone internal microphones had a limited dynamic and frequency range; namely, the iPhone internal microphone had a poor response below 200 Hz due to high noise floor. Further literature describing the frequency magnitude response of smartphone microphones is limited.
Examination of various smartphone sound apps by Kardous and Shaw [32] found some of them accurate and reliable in occupational noise measurements. In follow-up studies [33,34], the accuracy of these apps when used with two different external calibrated microphones was examined. The authors showed that the accuracy and precision of smartphone measurements can be significantly enhanced with the use of external microphones. Extension of calibration methods to the infrasound range were performed by Asmar [35,36] on an ensemble of Samsung S8 smartphones.
Model-by-model calibration of smartphone sensor systems is a daunting task. By the time a study is completed and published (e.g., [35,36]), new models, apps, and operating system updates can render the results obsolete. It is a Sisyphean task to defend a given model’s sensor stack; we instead focus on the signals that are produced by the sensor systems and develop robust data models and transportable signal processing methods that can be implemented across diverse platforms.
Even without precise calibrations, smartphones can produce useful data. The embedded accelerometers and Global Navigation Satellite System (GNSS) receivers of smartphones have proven useful in earthquake monitoring studies. Minson et al. [16] confirmed the capability of smartphones in detecting displacements from moderate and larger earthquakes, and proposed the use of crowdsourcing with smartphone data to achieve Earthquake Early Warning Systems. The MyShake app [17,18] developed for the collection and analysis of earthquake data has matured and integrated into operational early warning systems [19].
Shortly after the infrasound app concept was proposed and developed [20] to extend the smartphone microphones to the infrasound range, it was applied to volcano monitoring [37], near-shore underwater and surf observations [37,38], and nuclear reactor monitoring [25,39,40]. Extension to the audio range and the inclusion of additional sensor channels allowed improved surface explosion characterization [21,41,42], as well as the collection of moving aircraft [43], rocket [44,45], and space craft [46] signatures in microphone, barometer, accelerometer, and gyroscope sensors. The 2022 Tonga eruption pressure signal was clearly observed by smartphone barometers in Hawaii and elsewhere at distances of thousands of kilometers [22], opening new possibilities for global monitoring applications.
Digital data collections in high-altitude balloons are relatively new and are considered viable platforms for the exploration of Venus (e.g., [24,47]), where the ground is too hot for surface deployments. High-altitude balloons present an extreme environment outside the design parameters of most consumer electronics, and rapid technical improvements in recent years [23,24,47,48,49] have made it possible to observe a wider range of signals.
In the next section we present the geophysical and environmental data recorded by the RedVox Android application on a S10 smartphone during Skyfall. As mentioned in the Introduction, one of our educational goals is to demonstrate how to access and process the heterogeneous multimodal signals typically available in a smartphone. To this end, raw data and Python open-source software are provided in [50,51,52,53,54,55,56,57].
The raw data are provided as an event report in the RedVox Cloud interface at redvox.io [50]. The methods and Python code used to produce the figures are provided as a GitHub repository [51]. The RedVox app’s Application Programming Interface (API) is available online as an open repository [52]. The Python Software Development Kit (SDK) for the RedVox app is also openly available [53] to facilitate the loading and inspection of the raw data. The open-source Redpandas framework [54] builds on the Pandas [55] serialized data structures and is used to process the Skyfall smartphone data. Standardized time-frequency representations use a quantized Gabor atom framework [56] and incorporate a multiresolution weighted wavelet z-transform [57]. Various digital signal processing algorithms and geophysical methods are documented in these open-source repositories, and the interested reader is invited to look into the functions imported to process the Skyfall data. With the raw data [50] and open-source software [51,52,53,54,55,56,57], a reader with minimal Python experience will be able to reproduce the results and use the paper as a guide.
Since smartphones and their kindred cyber-physical platforms are rapidly evolving, the data are a snapshot of the technology’s capabilities at the end of the year 2020. The RedVox SDK converts API 900 fields used in 2020 to the current API 1000 (API M) data protocol released in June 2021 [52]. At the time of writing, data collection and transmission under API M has been implemented in Android, iOS, Linux, and Mac OS operating systems on both Intel and ARM platforms.

3. Materials and Methods

We present signals collected during the Skyfall plunge, starting at a height of ~36 km a few seconds before the initiation of descent and ending on the ground. Although human-readable local time is more readily accessible in daily life, our computations use Unix time (also referred to as the epoch time) UTC, the number of seconds since 1 January 1970 relative to the Greenwich meridian. Although our highest sample rate was only 8 kHz, present-day smartphone audio systems are able to record at 192 kHz, corresponding to a sampling interval of 5.2 microseconds. Throughout this work, the native unit of time for computations is represented as the epoch time in microseconds.
The tables in this section are intended to highlight the most important systems specifications and API fields needed to verify the observations and results.

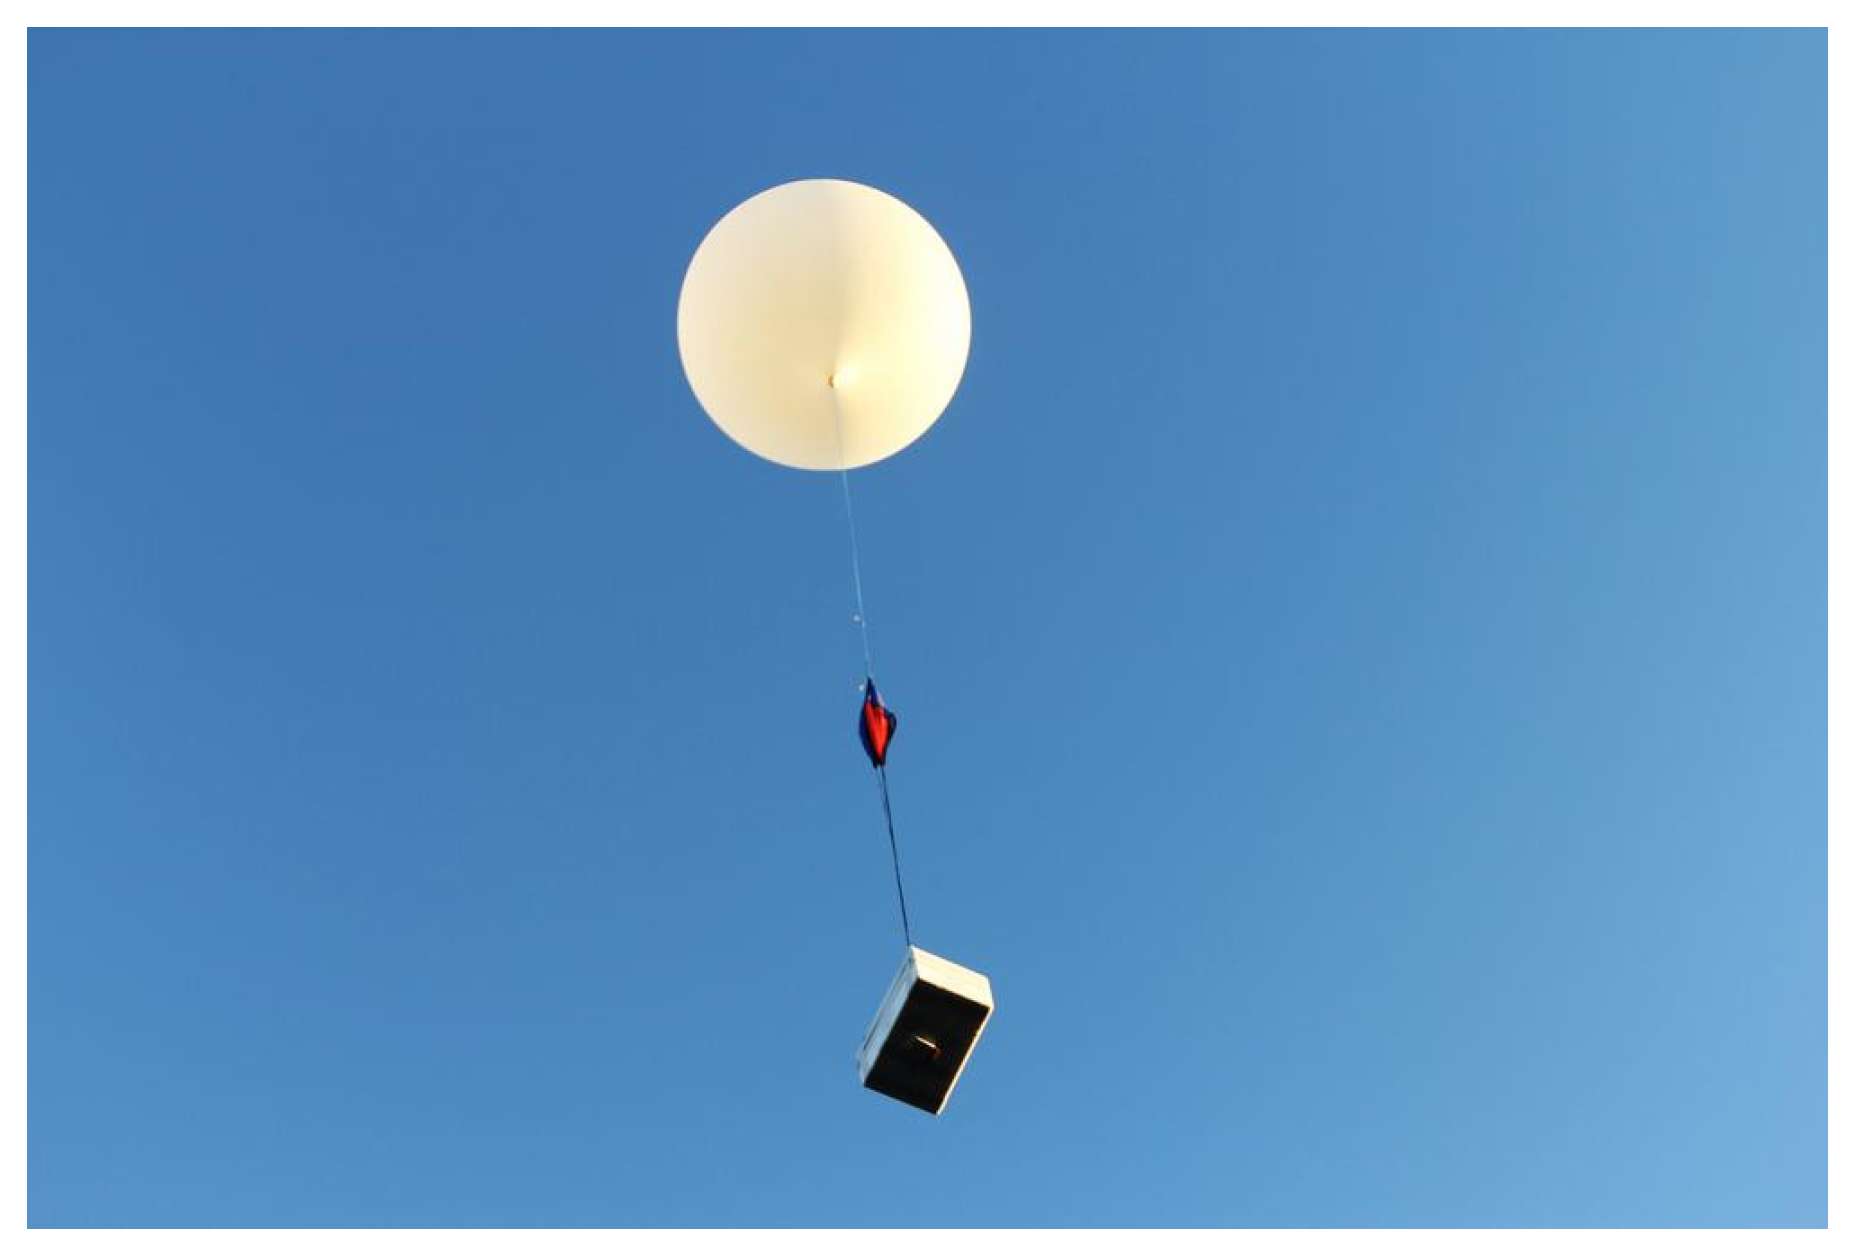
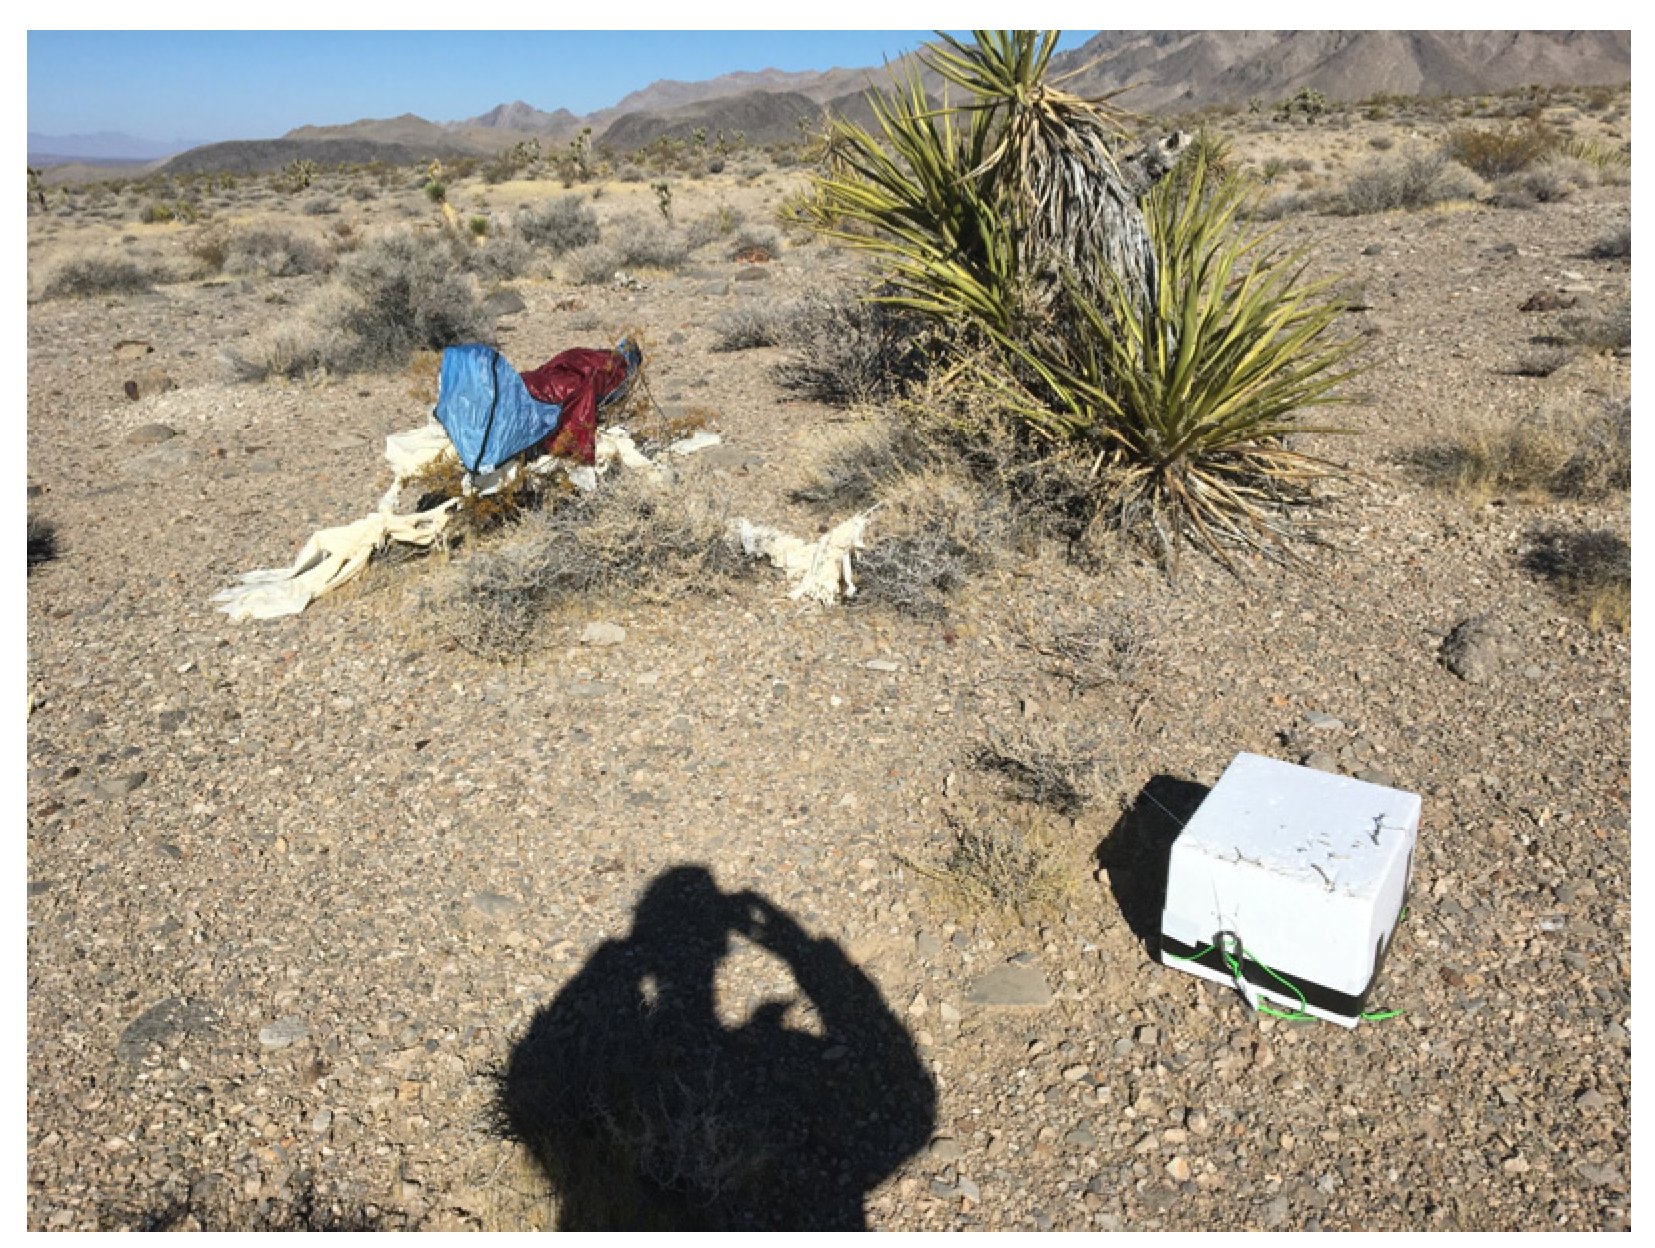
3.1. Balloon Platform

The flight system consisted of a 4 kg Totex [58] weather balloon carrying a 2.25 kg instrumentation package (Figure 1). The flight line was a 10 m paracord tether from the balloon nozzle to a Balloon Ascent Technologies HAB Bounder Balloon Cut-Down Device [59]. The Bounder was geofenced to automatically terminate the flight if the balloon approached the Las Vegas metro area. The cut-down device was connected to a fishing swivel tied to the top loop of a 1.21 m Rocketman parachute [60]. The descent rate for the 1.21 m standard parachute at 2.3 kg is specified at 6 m/s (~21 km/h). The fishing swivel allows the payload to rotate independently of the balloon, which tends to prevent violent spinning during ascent. A High-Altitude Science Stratotrack APRS (Automated Packet Reporting System) [61] transmitter beneath the parachute was intended to provide one-minute balloon location and ambient temperature readings during flight.
The key elements of the payload box were a PolarTech insulated shipping carton containing a SPOT Trace [62] asset tracker to report the landing location and a Samsung Galaxy S10 [26] in a protective case taped screen-down to the bottom of the box. The dimensions of the payload box were 38.1 cm long, 33 cm wide, and 25.4 cm high; the rectangular shape of the payload enclosure may have helped stabilize the descent, as the vertical axis remained relatively stable until impact. The payload box was sealed with duct tape prior to launch, but a hole in the side allowed a venting tube to pass air between the exterior and interior of the box.
There were four independent instruments for estimating location; however, two of the four instruments only provided sparse estimates intended for recovery. The APRS and SPOT Trace were primarily intended to provide redundancy for the payload recovery. Only the Bounder and the S10 smartphone had sufficiently high sample rates to reconstruct the details of the rapid descent trajectory, and both of these instruments had a barometer to provide secondary height estimates. The Bounder relies exclusively on the GNSS for position, whereas the S10 uses both GNSS and cellular location when available. Only the S10 used a cellular network to transmit data in real time when an adequate signal from a cellular network was available.
The balloon was inflated in a hangar at Desert Rock Airport, then launched at 12:16 UTC on 27 October 2020 into a brisk wind blowing to the south/southwest. The APRS tracker provided the balloon’s location every minute until it became too cold during the early dawn ascent. It resumed reporting positions once the sun had risen above the horizon and the tracker had risen high enough in the stratosphere for ambient temperatures to come back into range.
The balloon burst at 13:47:50 UTC at an altitude of 36,296 m, landing at 14:13:25 UTC at an elevation of 1038 m. Landing was first indicated by the RedVox S10, which reported that it was no longer moving and that the ambient temperature was rising as the payload box warmed up after landfall. The SPOT Trace then confirmed the landing site. The payload was recovered at 17:00 UTC on the same day. The payload box was upside down, and large amounts of balloon material were tangled on the flight line and the parachute (Figure 2). This suggests that the parachute may not have deployed properly and that the payload may have descended faster than planned. Although the box was externally scraped during the hard landing, the S10 was undamaged and has been redeployed in subsequent missions.

3.2. Bounder

We use the Balloon Ascent Technologies HAB BounderTM Balloon Cut-Down Device [59] as a primary reference for the balloon trajectory. Unlike smartphones, the Bounder is designed for high-altitude balloons (HAB) so its barometer specifications are better matched to the 36 km balloon height. Furthermore, the Bounder provides a continuous record, whereas the smartphone location has a gap at the higher altitudes.
The Bounder exports balloon GNSS location and barometric pressure data collected at a rate of ~1 Hz to a text file. Per the documentation sheet, the pressure rating on the Bounder barometer is 8 to 1200 hPa (0.8–120 kPa). The Bounder trajectory fields and observations for the event of interest are presented in Table 1 and Table 2 and shown in Figure 3; note the rapid descent after the peak height shown to the right of the red arrow in Figure 3. The Bounder’s peak recorded elevation at 13:47:50 GMT was 36,296 m above the WGS84 ellipsoid, and the balloon was ascending at the moment of the payload release. The Bounder data are provided in the Skyfall repository [51]. The values in the tables are representative of the original data precision and are not intended to represent the sensor accuracy.

3.3. Smartphone

All modern-day COTS smartphones come loaded with a suite of advanced low SWaP-C sensors. All mobile phones contain a microphone (mic) for voice communication. Starting with flip phones and continuing with smartphones, cameras shortly followed, along with accelerometers, gyroscopes, barometers, and other more esoteric sensor modalities. All operating systems (OSs) have a native application programming interface (API) to access data from internal sensors. An API is a formal definition of inputs and outputs for a given computational system; ideally, it provides a contract and documentation to a developer for how to interact with a given system. For example, the Google Android Platform API [63] describes what fields or methods are available, the data and types of data that can be accepted, and the data and types of data that can be returned. However, many OEMs interpret the Android API as recommendations and deviate from the ideal contract. The Google Android API provides access to all the possible elements in a smartphone. This is too much information for most applications. In contrast, the RedVox API [52] is much lighter and is used to organize and transport selected smartphone data.
RedVox APIs are tailored for collecting and standardizing a range of heterogeneous sensor data on diverse OSs. Google’s Protocol Buffers [64] provide a common serialization format and allow data to be accessed from multiple programming languages and environments. We store both device-specific metadata as well as user-specified sensor data. This includes sensors with stable, (mostly) evenly spaced sampling rates such as audio, sensors with unevenly spaced sampling rates, single channel sensors, and multi-channel sensors. Metadata includes station identification information, state-of-health metrics, and a summary of the station’s hardware and configuration. Enhanced metadata includes location, timing, timing correction information, and edge-computed event streams.
Data are quantized into individual files called packets. The duration of a packet is determined by the requested number of audio samples stored in the packet for a given sampling rate. Packets are compressed for both transport and storage using the LZ4 compression algorithm. The packets are always stored on the device and are also streamed to the RedVox Cloud Client [65] hosted by Amazon Web Services (AWS) if either cellular or Wi-Fi communications are available. Data packets collected during the Skyfall were transmitted over the cellular network in flight and after landing.
Associated with the API is a software developer kit (SDK) [53] which facilitates access to the data fields. The purpose of the SDK is to provide a wide range of tools to acquire, process, and analyze the data. The SDK functions on a variety of configurations of hardware and software, and should produce a consistent result when run across each of the configurations.
The components of the SDK critical to Skyfall are the Station and DataWindow objects. A Station object represents a single device. Each Station is capable of holding a variety of data from various sensors (e.g., audio, barometer, location, accelerometer, gyroscope, and magnetometer). A DataWindow object is a grouping of Station objects with a defined start and end datetime and is created by loading and processing the raw data stored in the packets [50]. DataWindow is intended for export to more traditional geophysical data formats such as miniseed or SAC, or converted to other data structures (i.e., a Pandas DataFrame) for analysis by data scientists.
The high-level specifications returned by the SDK from the S10 station are provided in Table 3. There are many possible field names in the SDK and its hierarchical structure can be initially confusing. In this table and the ones that follow, the full SDK field name is provided so that the reader can readily reproduce the results.
At the time of writing, the Android RedVox application has over 10,000 downloads and is supported by >10,000 different Android smartphone and tablet models running OS7 Nougat and higher, not including Android virtual machines.
For the purposes of the Skyfall event, there are three defining timescales of importance: the start of the clock (station start date), the start of the event, and the end of the event (Table 4). Although all timestamp precisions are in microseconds, only the corresponding epoch times in seconds are shown in Table 4. The station clock resets every time the app is stopped and started, and the station recording parameters can only be changed if the app recording is stopped. Therefore, it is possible to identify a station and its data collection settings during a recording session by its Station ID (Table 3) and its Station Start Date (Table 4).

3.3.1. Microphone

Since sound quality is a key competitive feature between makes and models, OEMs are protective of their microphone specifications and configurations. It is neither possible nor practical to characterize the response of the >10,000 different models of smartphones in the market, although some traditional methods have been pursued [31,32]. We work with the raw digital, uncalibrated output and concentrate on the signal-to-noise ratio (SNR) of the observed signal. The nominal and observed sample rate of the primary internal front-facing smartphone microphone are presented in Table 5. The microphone is one of the few internal sensors that are designed to be evenly sampled. When initiating a recording session, we request a nominal sample rate. However, the sample rate is locked to the smartphone’s crystal oscillator that is used for timing, which can drift with time. We compute the effective sample rate from the data window duration. The difference between the nominal and effective sample rate is small, and correctable. The float64 precision of the SDK is presented in the tables as a representative value for the selected data window so the reader can easily reproduce and compare the results.

3.3.2. Barometer

The specifications for the station barometer obtained through the Android framework are listed in Table 6. The barometer, accelerometer, gyroscope, and magnetometer sensors are sampled unevenly. The sampling strategy is to poll the sensor for changes, and only record if there is change. The primary metric is the sample interval between data points, which is averaged over the Skyfall data window to obtain a mean sample interval with its standard deviation. This can then be converted to a mean sample rate in Hz (Table 6). The barometer magnitude at sea level should have a static steady-state value of ~101 kPa. The expected static DC and AC offsets of the various on-board sensors can serve as a first-order quality check for a sensor’s state of health.
The pressure range of STMicroelectronics LPS22HH [66] is 260-1260 hPa (26–126 kPa), in contrast to the 0.8–120 kPa Bounder range [59]. The LPS22HH accuracy is 0.05 kPa, with a low-pressure sensor noise of 0.65 Pa. The digital output is specified as 24 bit and its sensitivity as 4096 LSB/hPa.
It is known that the height above the ellipsoid estimated from GNSS constellations has relatively large errors, and we can use the barometer as a secondary estimate for height. We expect the Bounder barometer to perform much better at high elevation as it can go down to 0.8 kPa. Barometric pressure is transitory and depends strongly on the specific time and location. Since the Bounder provides independent measures of height and pressure, we can construct an empirical function to compute height from pressure for the balloon height profile. Since pressure is expected to drop as the exponential of height, we performed a polynomial fit to the natural logarithm of scaled pressure. The method for the polynomial fit is provided in the redvox-pandas repository [54] as the function bounder_model_height_from_pressure.
Figure 4 compares the Bounder and S10 barometer data, showing a very good match below 20 km but divergence above 20 km heights. We postulate the Bounder barometer will be the most accurate of the two at high altitudes (>20 km) as its low-pressure specifications are better matched to the ~36 km height of this case study. Note the sample rate of the Bounder is ~1 Hz, whereas the sample rate of the S10 barometer is ~24 Hz.

3.3.3. Accelerometer and Gyroscope

The Accelerometer and Gyroscope specifications obtained through the Android framework under the RedVox API are listed in Table 7 and Table 8. These sensors are in synch and are routinely used in tandem in gaming applications to correct or compensate for each other. Although their average sample interval over the data window (and their sample rates in Hz) are identical, their standard deviation is out by ~10 microseconds. This suggests the cumulative accuracy of the timing and methods for these six data channels may be in the order of a hundredth of a millisecond. The final accuracy will be dependent on the make, model, crystal oscillator, and sensor data polling latency, and results will vary. We present the native float64 precision of the measurements so that we can evaluate if hardware and software hardware upgrades and updates can improve accuracy.
The accelerometer magnitude has a static steady-state value of 9.8 m/s2, corresponding to Earth’s gravity. In contrast, a static gyroscope should have no DC offset.
The documentation sheet for the ST Microelectronics LSM6DSO [67] 3D always-on, low-power accelerometer and gyroscope is thorough. This component has many possible configurations; the specific S10 configuration parameters are not saved under API 900, and a high level of detail is not available under the Android API and framework. In other words, some sensor configurations and settings are not transparent or readily recoverable, and will be at the discretion of the OEM.

3.3.4. Magnetometer

The magnetometer specifications obtained through the Android framework are listed in Table 9. The magnetometer is generally used for orientation relative to Earth’s magnetic pole, which has a steady-state magnitude of up to ~65 microTeslas.
The specification sheet for the Asahi Kasei AK09918 3-axis Electronic Compass [68] provides a nominal sensitivity of 0.15 microTesla/LSB and states the digital output is 16-bit per axis. The magnetometer can also measure rotation relative to the magnetic field vector at a given location. In the Results section, we will fuse the gyroscope and magnetometer channels to improve the reconstruction of the Skyfall chronology.

3.3.5. Station State of Health Information

The state of health (SOH) information supported by the API 900 framework that we used for Skyfall is minimal, and consists of the station internal temperature and remaining battery percentage. This information is useful for maintaining station uptime, as sustained temperatures below 0 °C and exceeding 40 °C impact mobile devices’ batteries and battery-charging capabilities. The device’s battery status and temperature data are collected once per packet, which is 32.8 s at 8000 Hz audio sample rate (218 points per packet). Although useful, the coarse temporal granularity of the SOH information under API 900 is marginal for SWaP-C optimization.
To address this deficiency, API M expanded the SOH recording capabilities to include network type, network strength, data transmission rate, temperature, cell service state, battery remaining, battery current, available RAM, available disk, CPU utilization, power state, and Wi-Fi wake lock state, when available, at a rate of up to once per second. Not all hardware and operating systems make these sensors accessible.

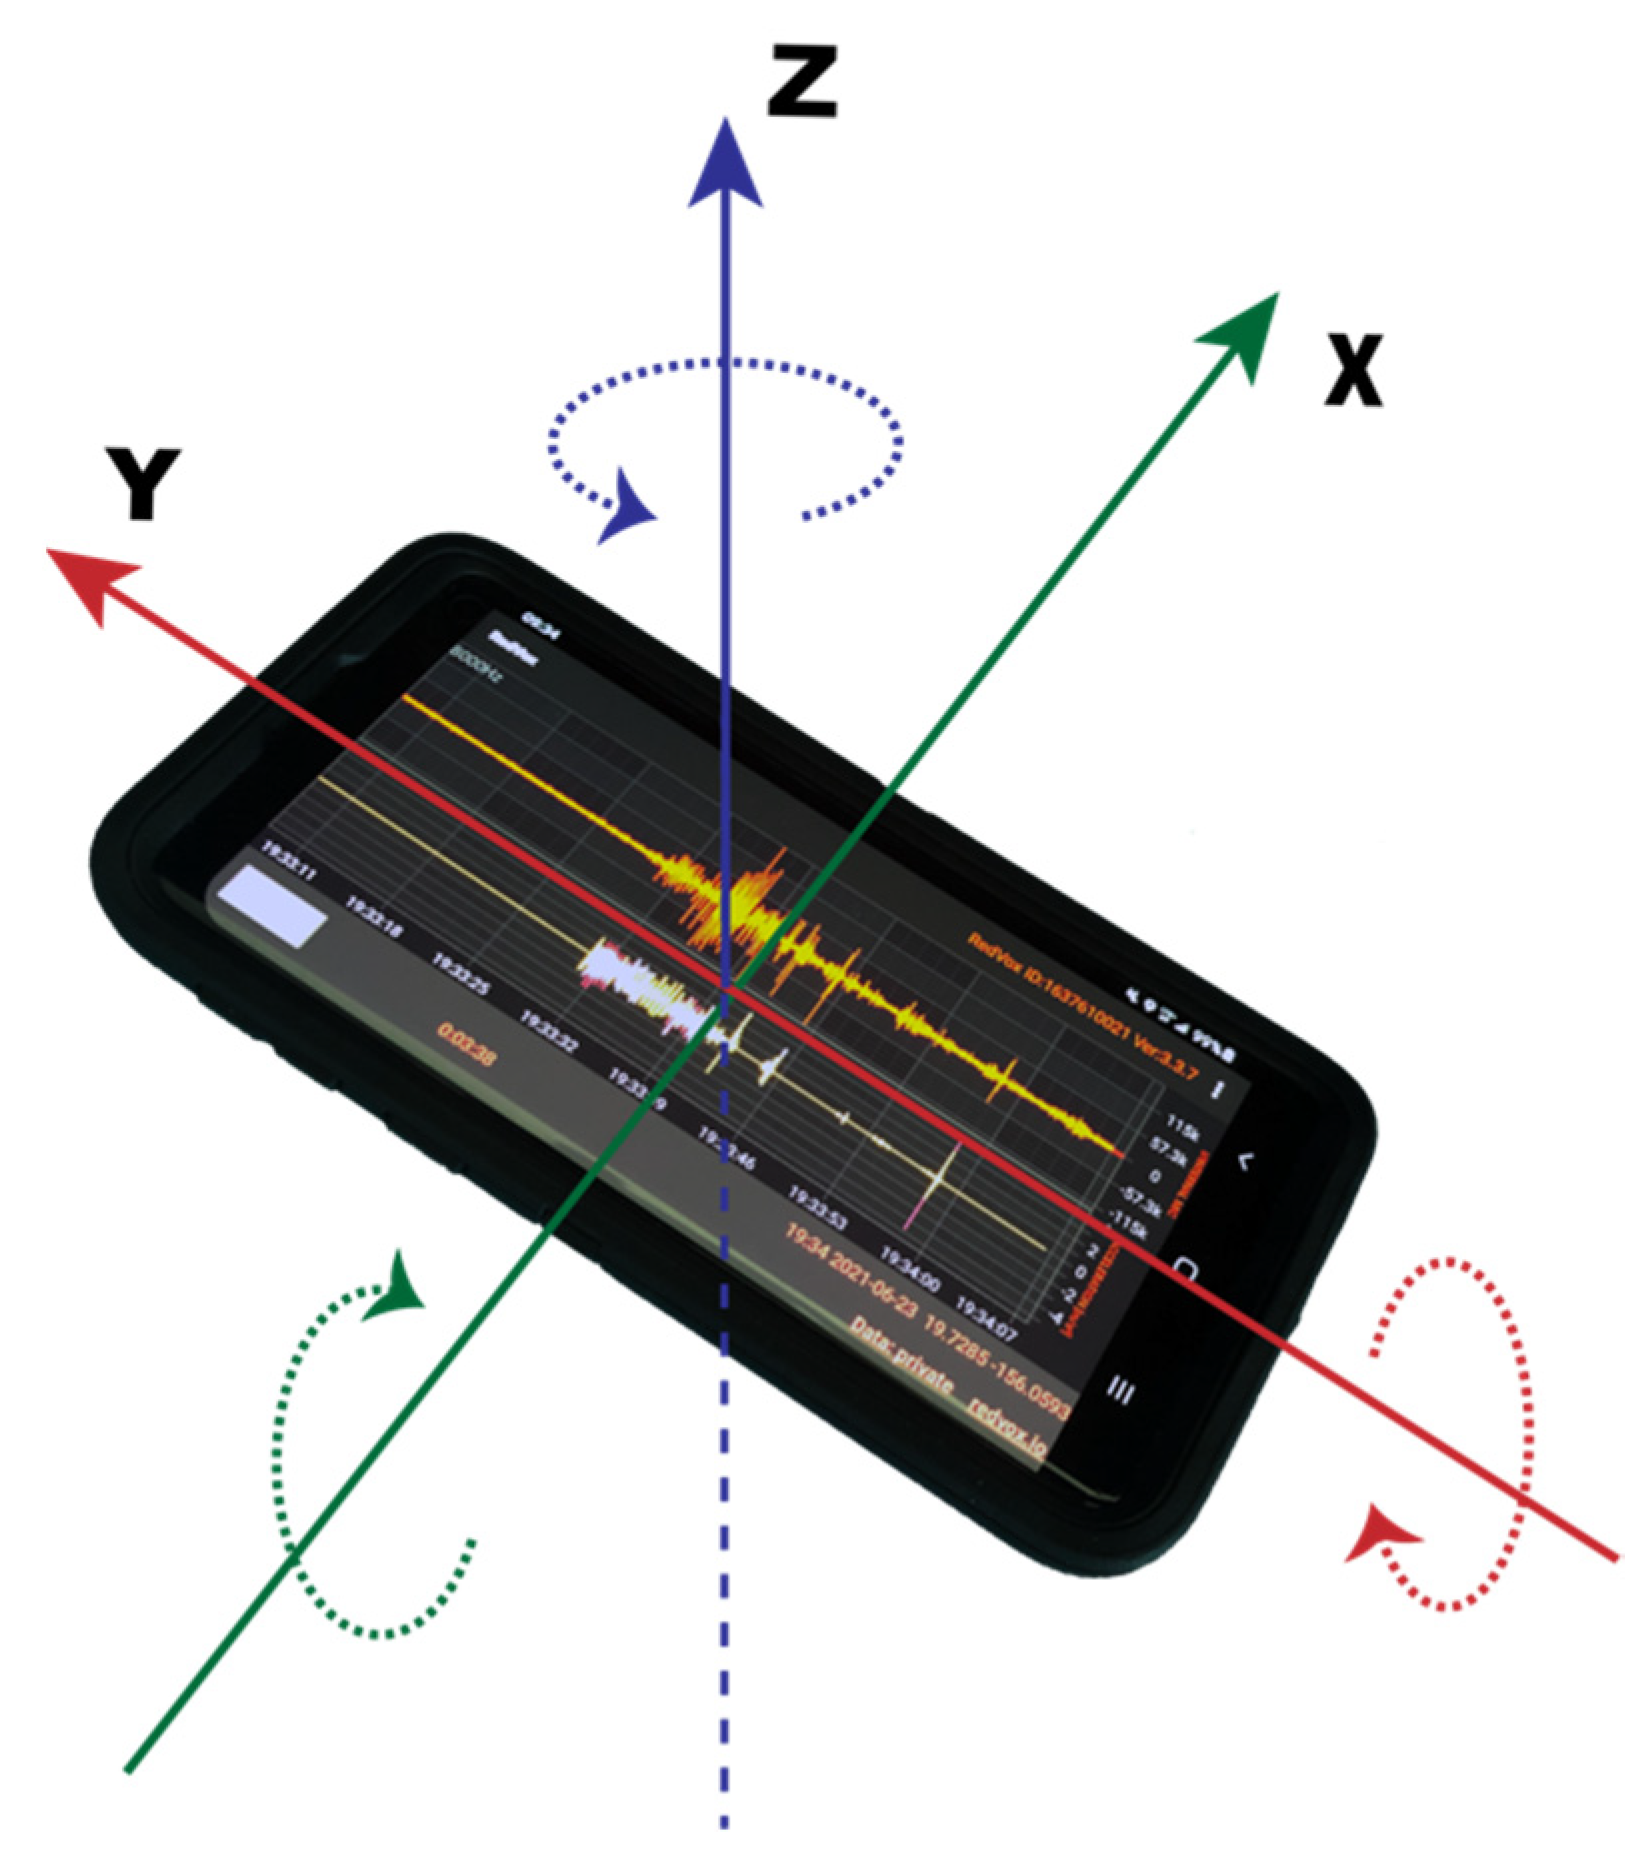
3.4. Station Timing, Orientation, and Location
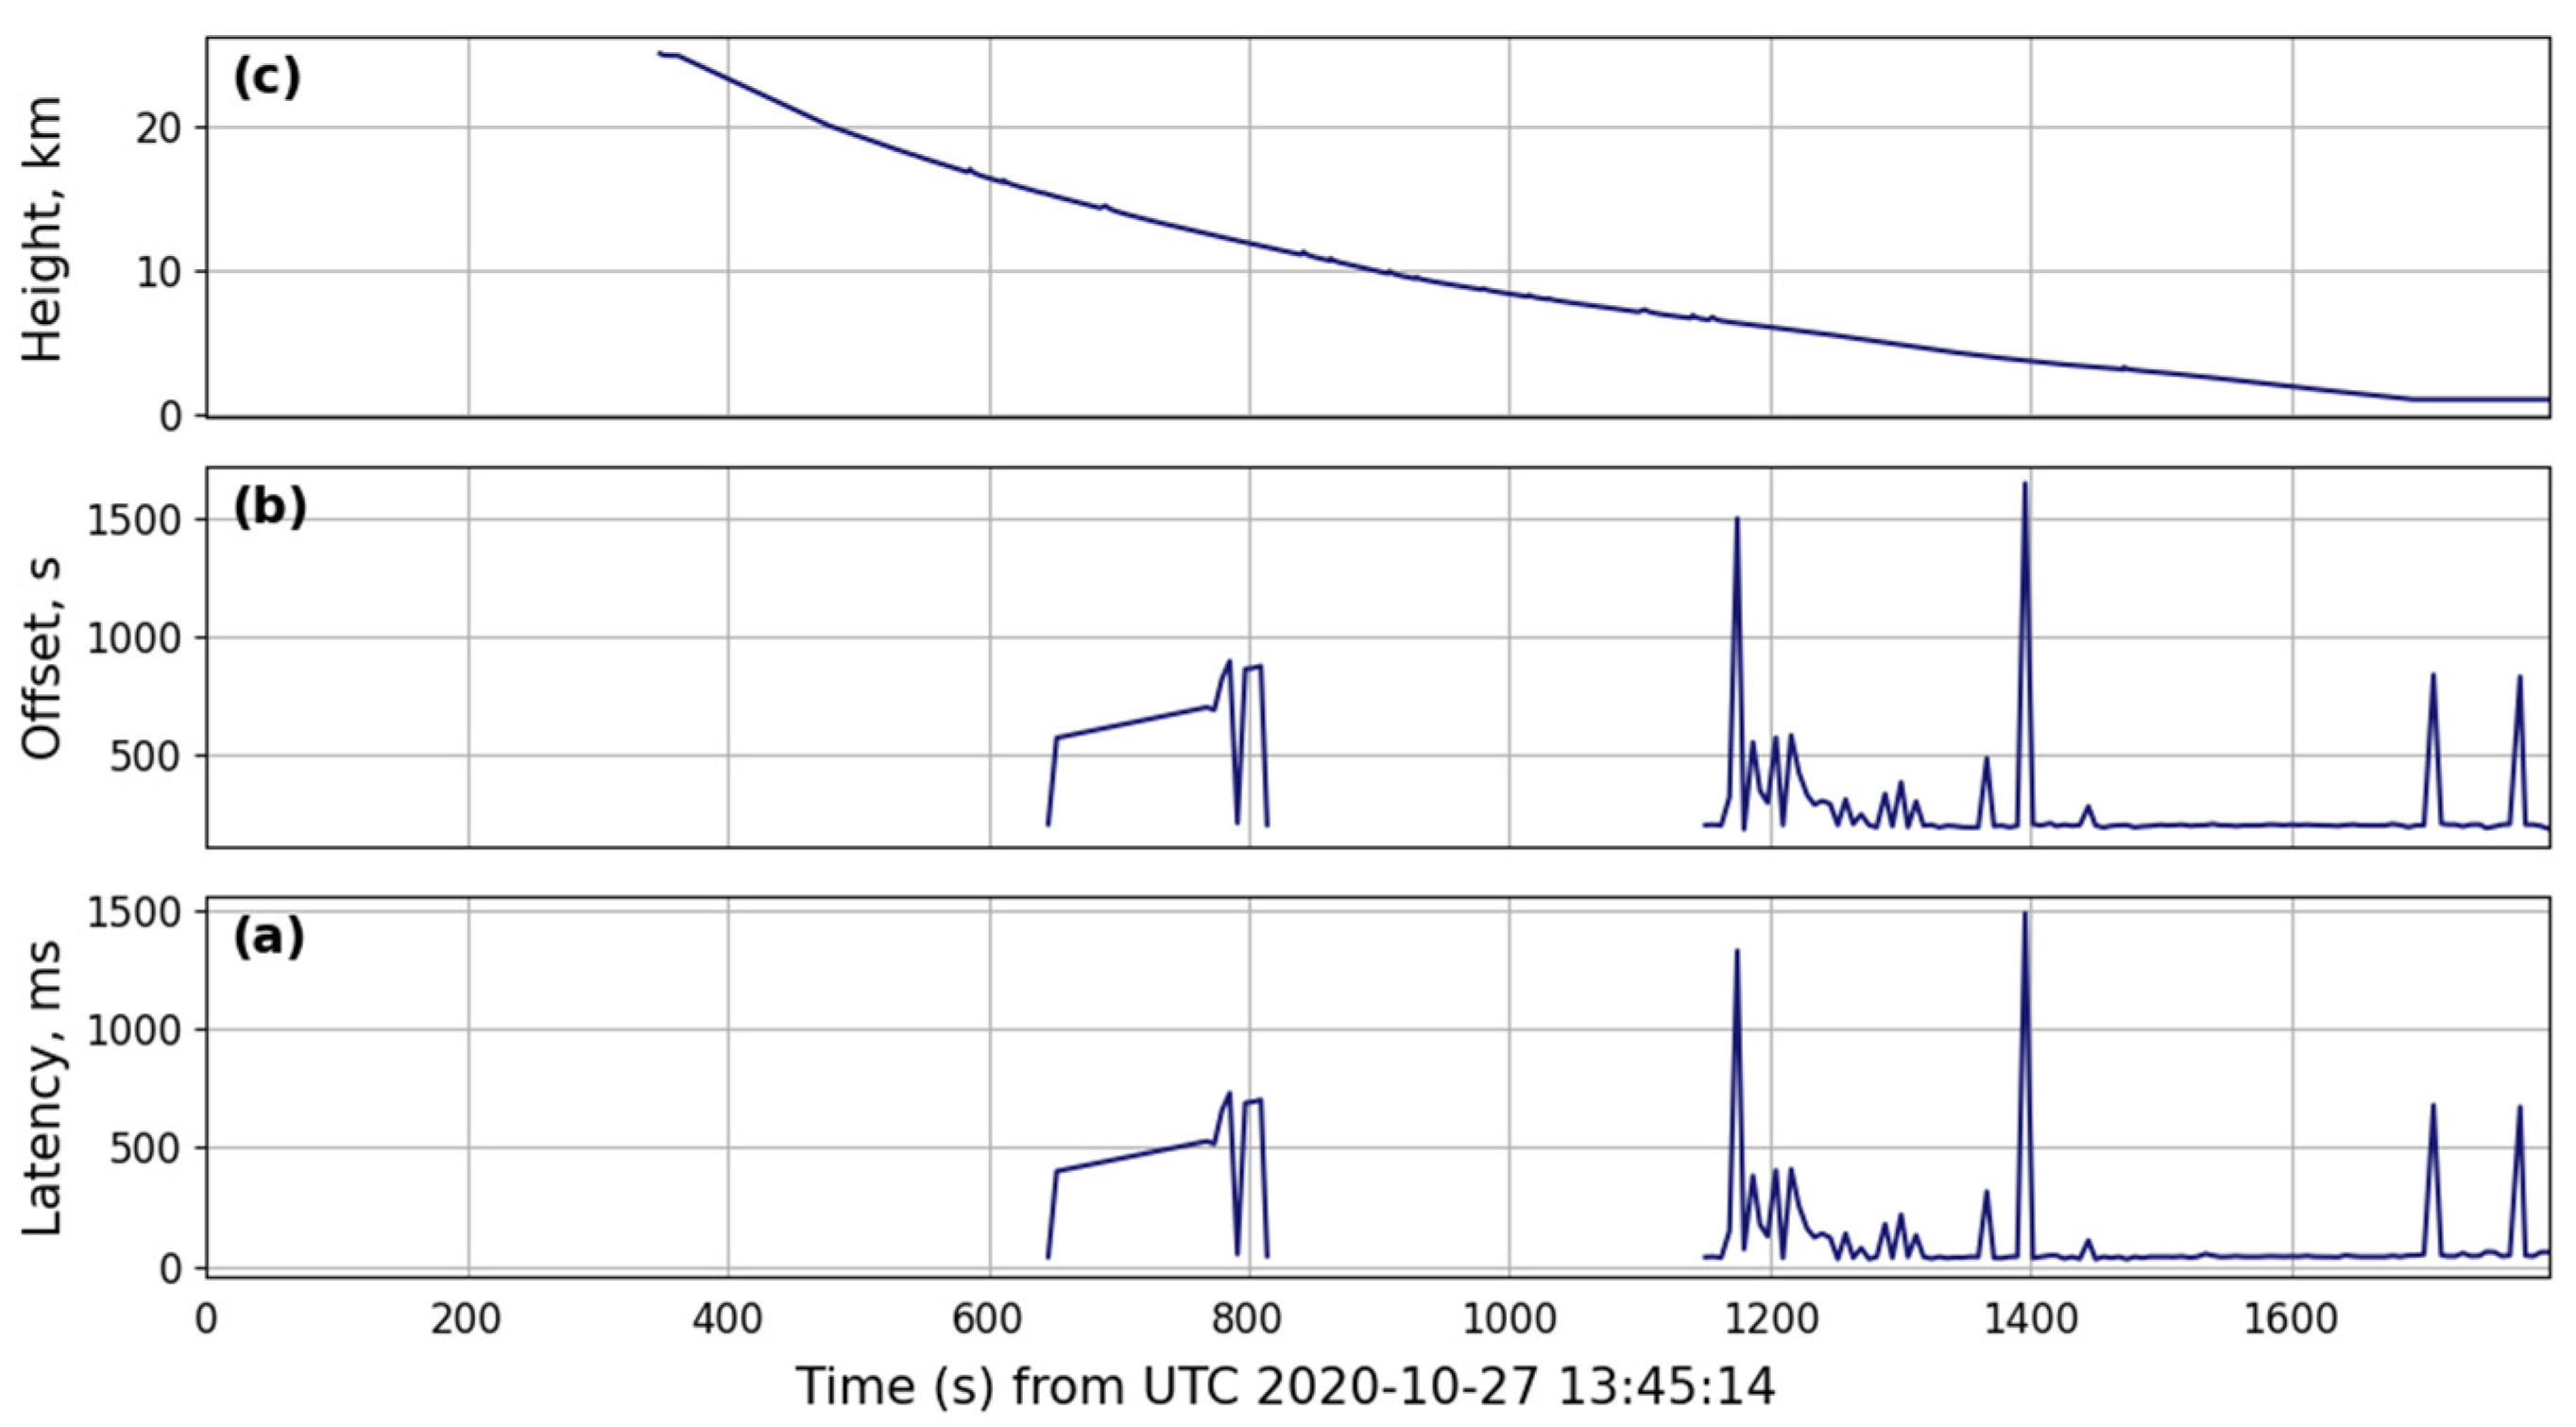
When, where, and how a recording station is deployed is captured by various sensors, and with a high level of redundancy. In the simplest scenario, the station is not moving and connected to a stable communication network. For Skyfall, the station only stops moving after the payload hits the ground, rolls over, and is dragged by the parachute.

3.4.1. Timing

There are various timelines available to a smartphone. When first booted, a smartphone internal clock does not know the time and would by default utilize the Unix epoch time zero of 1 January 1970 00:00 UTC. It will try to find the time via GNSS, cell, or Wi-Fi. The operating system time (OS time) will use any and all available combinations to update its internal clock. OS time will jump back and forth as needed to keep up with the various clocks at its disposal. GNSS time will also jump about depending on which satellites are available. A third timeline, the machine time, is initialized when the unit is booted. Although the machine time is monotonic, it is only as accurate as its internal oscillator. Accurately estimating true time is beyond the scope of this work; our aim is to obtain an estimate of timing errors for a given network configuration relative to a reference clock. In Skyfall, the reference clock is at Amazon Web Services and is only available when there is either cellular or Wi-Fi connectivity.
The application uses well-established tri-message exchange algorithms [69,70] for synchronization and relies on three assumptions: that the message propagation delay is nearly symmetrical, that errors of the timestamp itself have been mostly compensated, and that the clock’s skew is negligible during the message exchange. The synchronization process starts when the reference server sends a message of its current timestamp to the device. The device then records the time of receipt and, after a delay, returns the message with its current timestamp. The server records the time of receipt, completing the synchronization message exchange. Using the timestamps, we can find the average latency to calculate the offset between the clocks. The best-fit offset is selected by finding the best minimal statistically significant latency to compute the offset.
Timing correction is built into the RedVox SDK, and is presently only possible when communication is available to either a reference synchronization clock or GNSS satellites during data collection. Potential timing improvements (e.g., [71]) are under consideration.

3.4.2. Station Orientation

The S10 coordinate frame follows the Android and iOS smartphone-centered cartesian XYZ axis, with Z positive away from the screen (Figure 5). A smartphone accelerometer laying screen up on a flat, level surface has a constant value of −9.8 m/s2 in the Z-axis. If the long horizontal axis (Y) is pointing towards the north, the magnetometer X-axis should be zero and the Z-axis will be the projection of the magnetic line on the vertical. The gyroscope rotation should report zeros in repose, and will respond to rotation around the specified axis, positive counterclockwise (right-hand rule), and shown by rotation arrows in Figure 5.

3.4.3. Smartphone Location

As with timing, a smartphone will attempt to determine its location via GNSS, cell, or Wi-Fi. Skyfall represents an extreme high-altitude collection event, and the location framework did not perform well above 20 km height (twice aircraft cruising altitudes) as there is a data gap. The Skyfall API900 did not collect sufficient location information to disambiguate between cell, Wi-Fi, or GNSS location. Table 10 provides some representative values averaged over the Skyfall data window. The Sensor Name is the generic older name; the actual values are derived from both GNSS and cell. This omission is corrected under API M.
The location data that was obtained from the S10 matched the Bounder location (Figure 6) within the vertical scale of descent (km). As shown in Figure 7, synchronization via cell did not begin until the S10 dropped below 10 km. The spike just before 800 s probably corresponds to communications from a different cell tower. This suggests the height measurements above 8 km were from GNSS.
As previously noted, data streams and backfills (last in, first out) as soon as there is a communication link available. Figure 7 shows some high-latency connections above 10km; not much data would be successfully transmitted during those brief links. Low-latency cell communication was established below 8 km and data began to stream to the RedVox Cloud. The S10 was the first positioning system to report its final resting location, and all the valuable experimental data had been saved to the Cloud before the payload was recovered. The in-flight backfill capability is particularly valuable for balloon deployments, as landing zones can be unpredictable and it is not always possible to recover instrumentation in a timely manner.

4. Results

Each sensor modality provides useful and complementary information on the descent chronology, revealing their capabilities and limitations. Fused together, the signal ensemble permits a cohesive reconstruction of the Skyfall. Without detailed information, all we know is that the balloon payload fell from 36 km high and was slowed down by a parachute before it hit the ground. From the S10 signals, we learn it descended in a fast flat spin, slowed down when it reached the troposphere, and impacted the ground with a sudden (but non-deadly) deceleration before it flipped over. In the introduction we invited the reader to imagine being an observer in an airborne platform the moment it lost lift and propulsion. The S10 would have provided near-real-time situational awareness to recovery teams during the critical ground approach and sent a prompt landing location with enough information to estimate a survival probability.
This section has some redundancy in the narrative to highlight how each individual signal modality reinforces the others to provide a higher level of confidence in the Skyfall chronology. A more abstract and concise interpretation of the results is provided in Section 5, with some recommendations for interpreting multi-sensor signals.

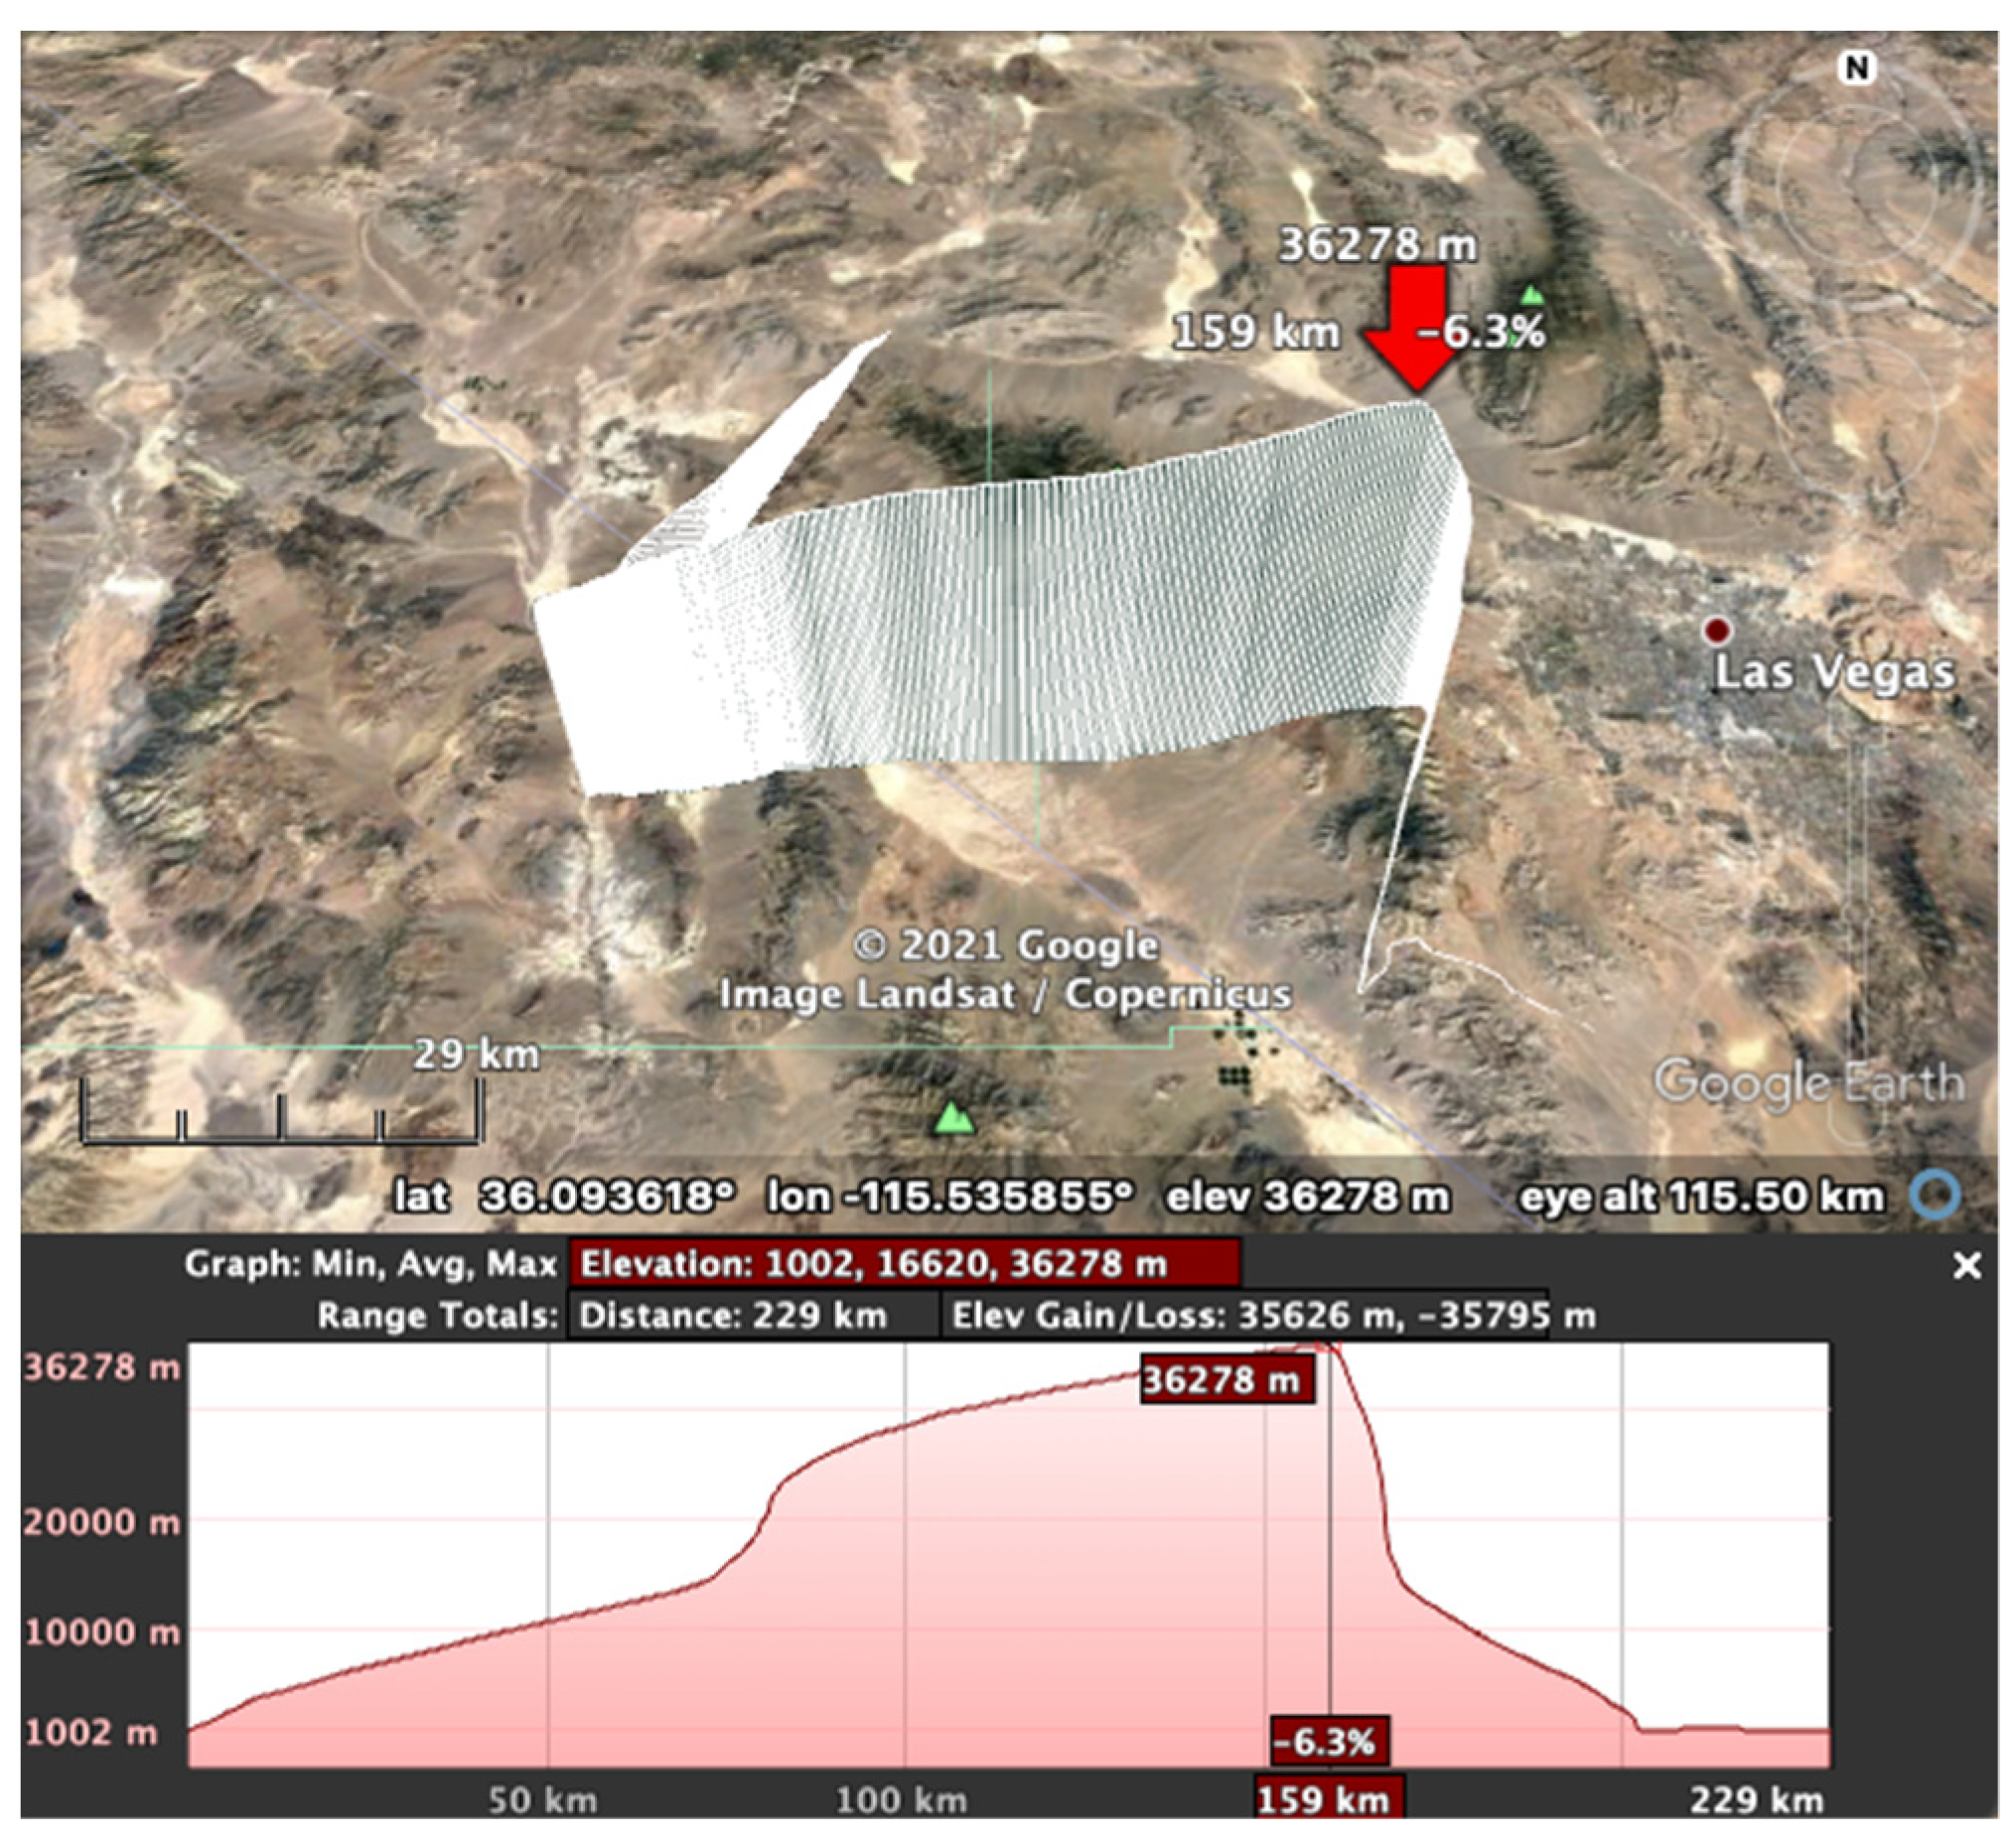
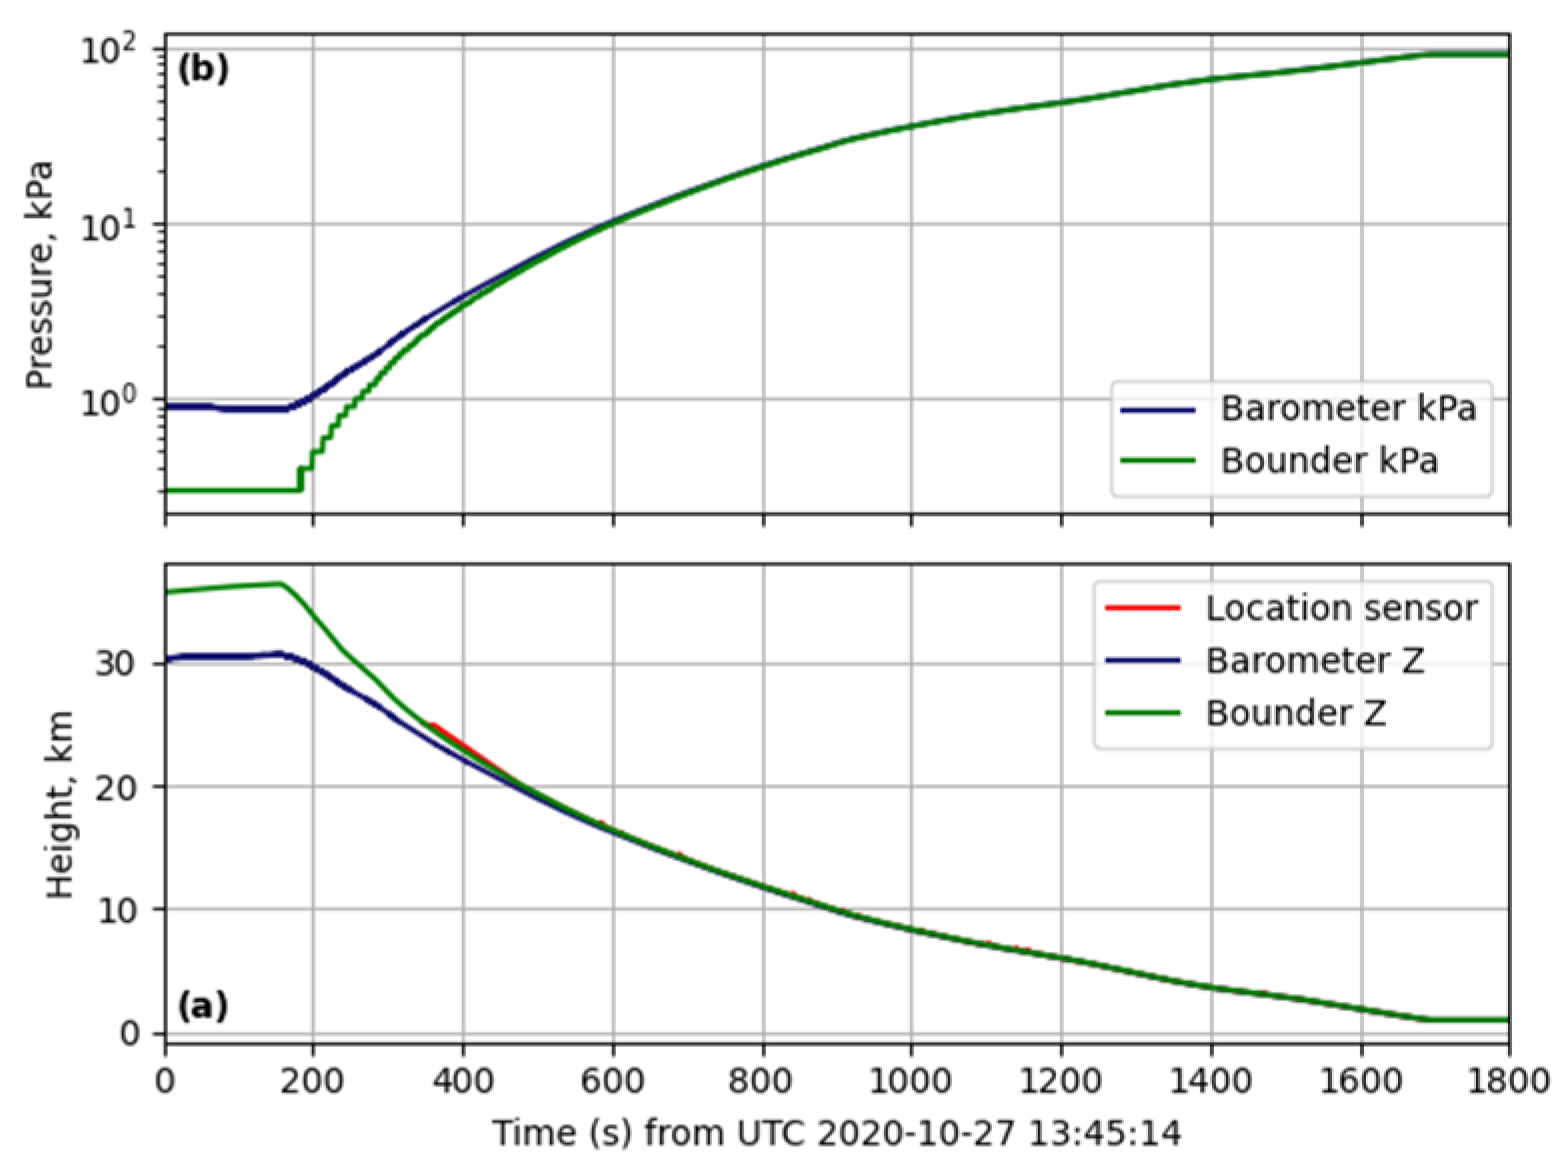
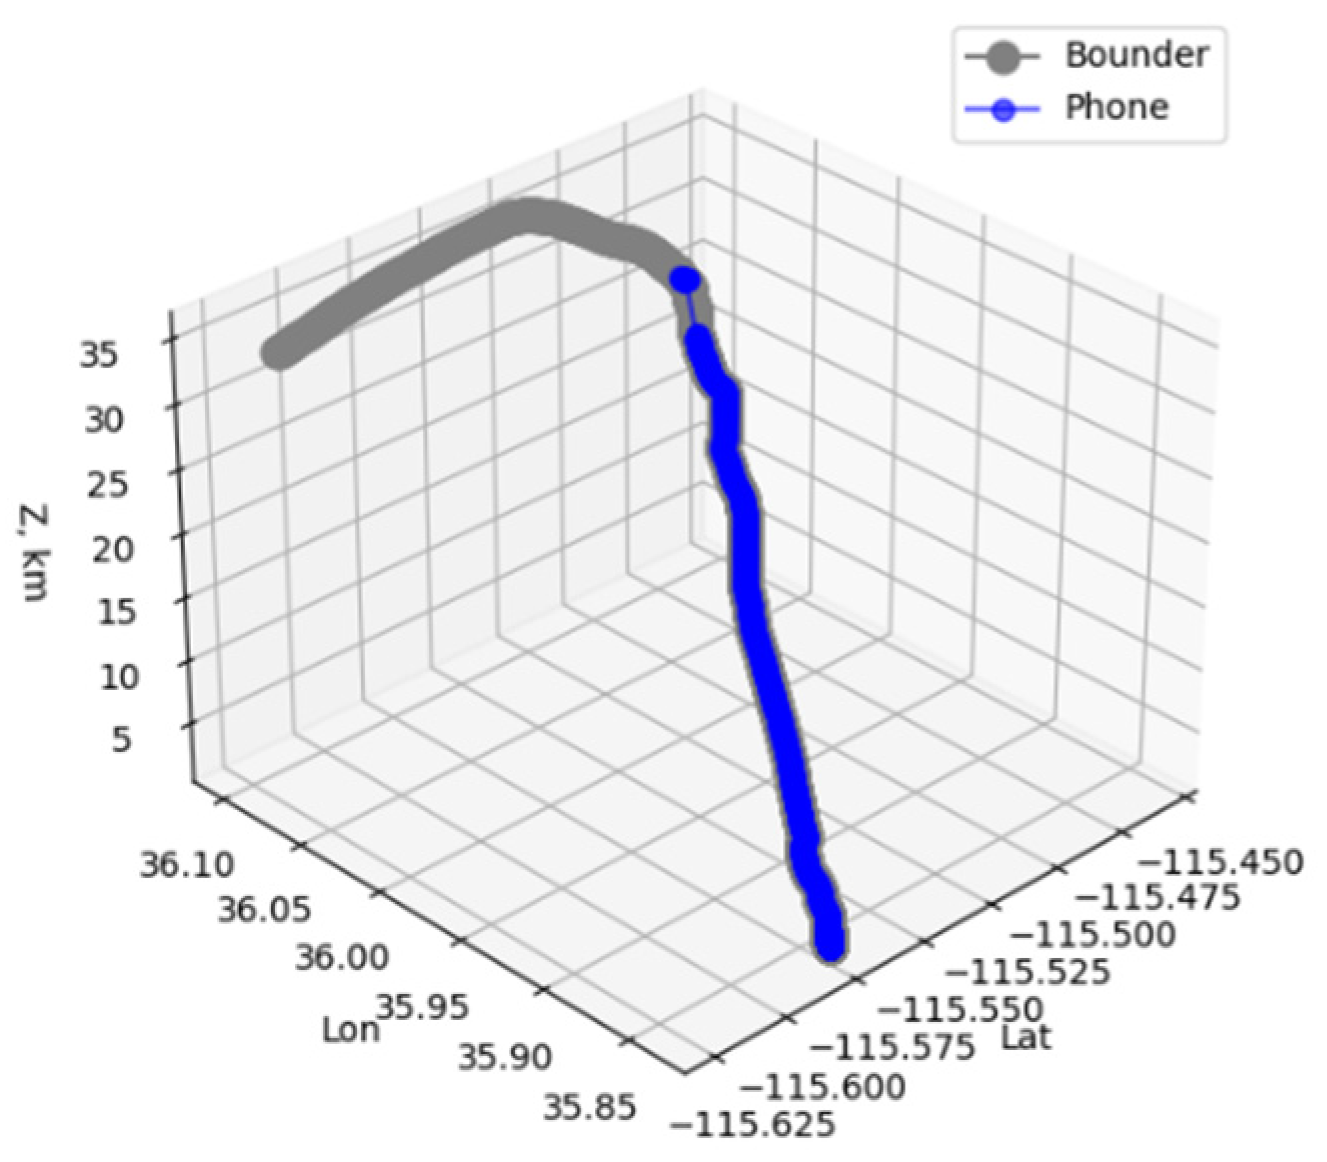
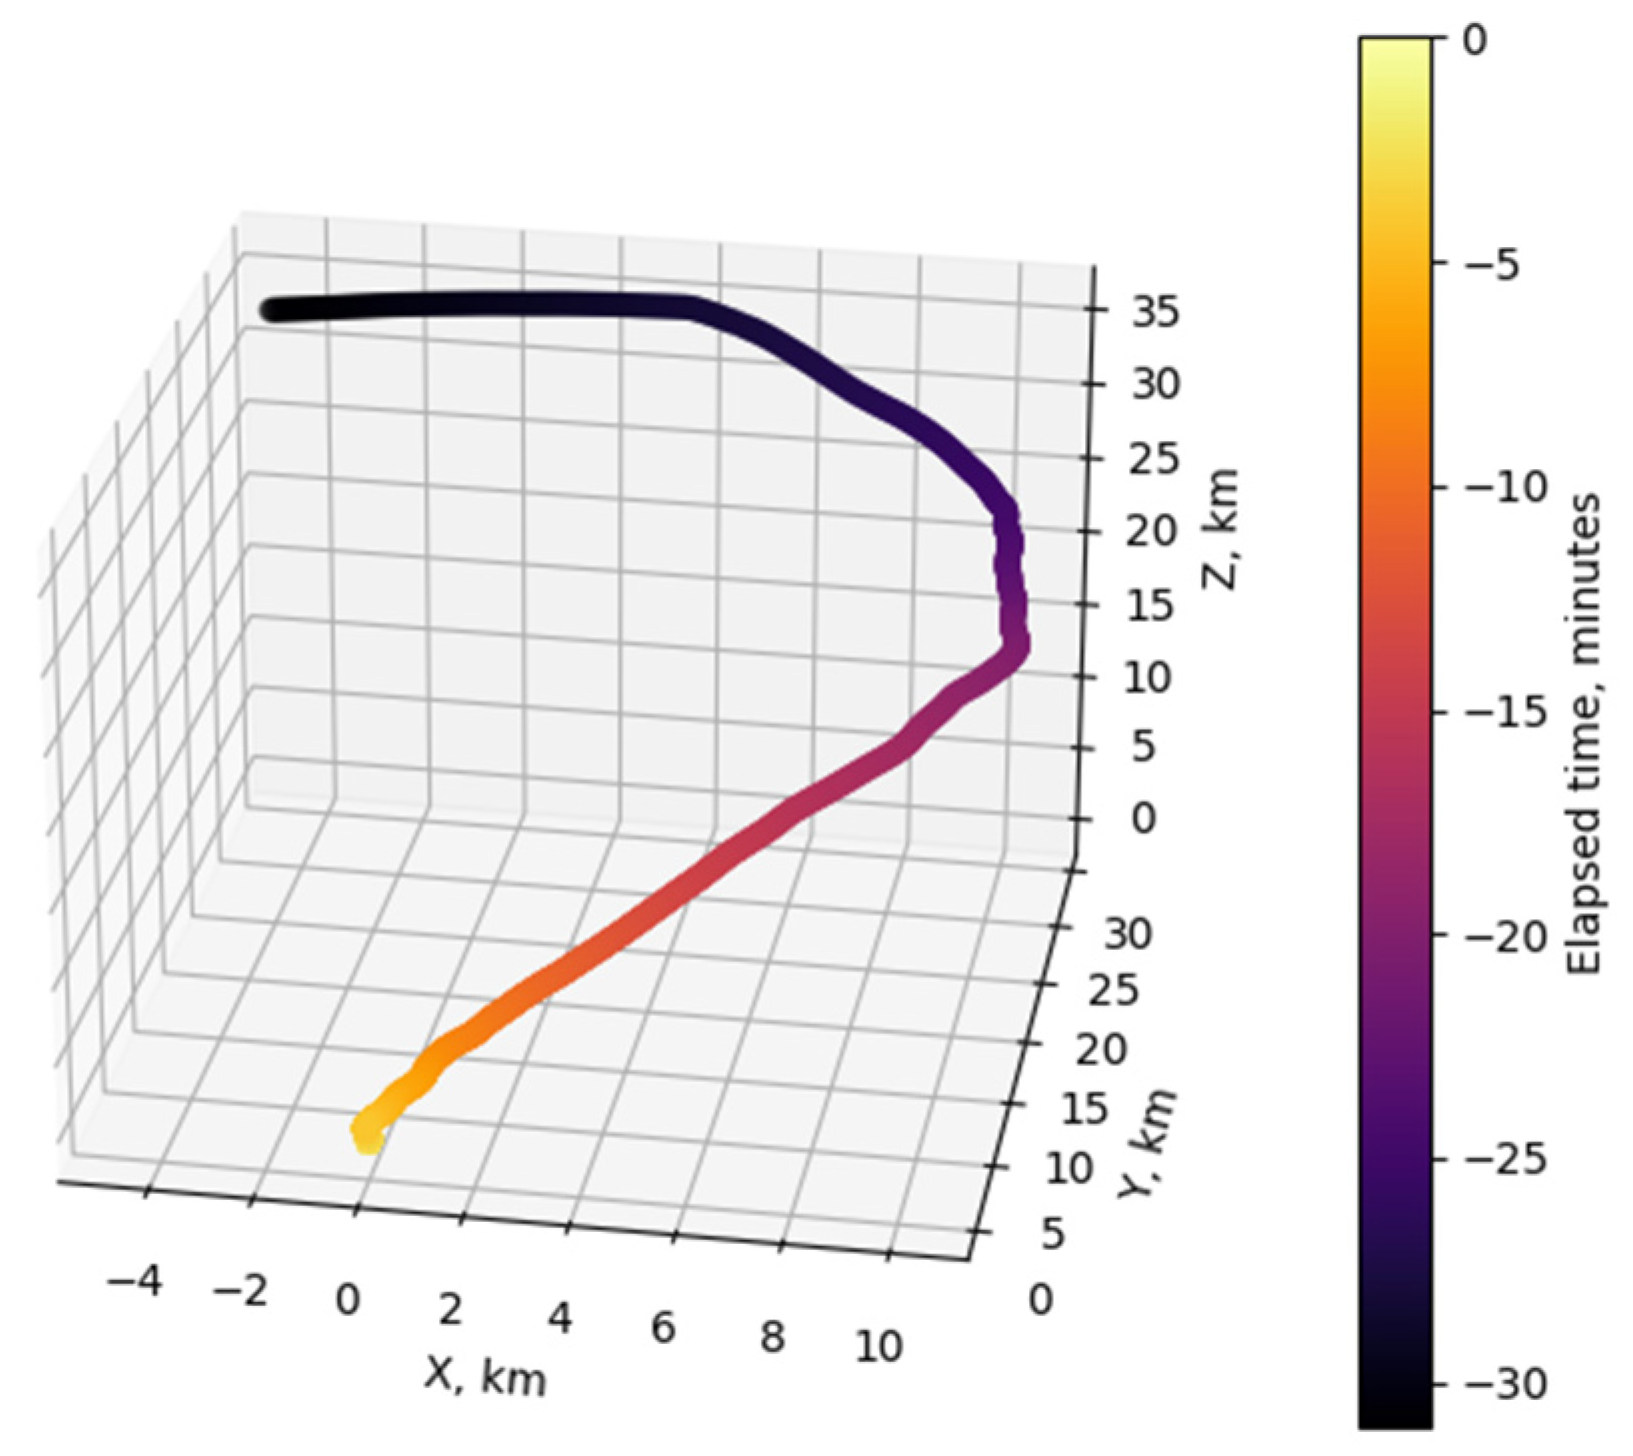
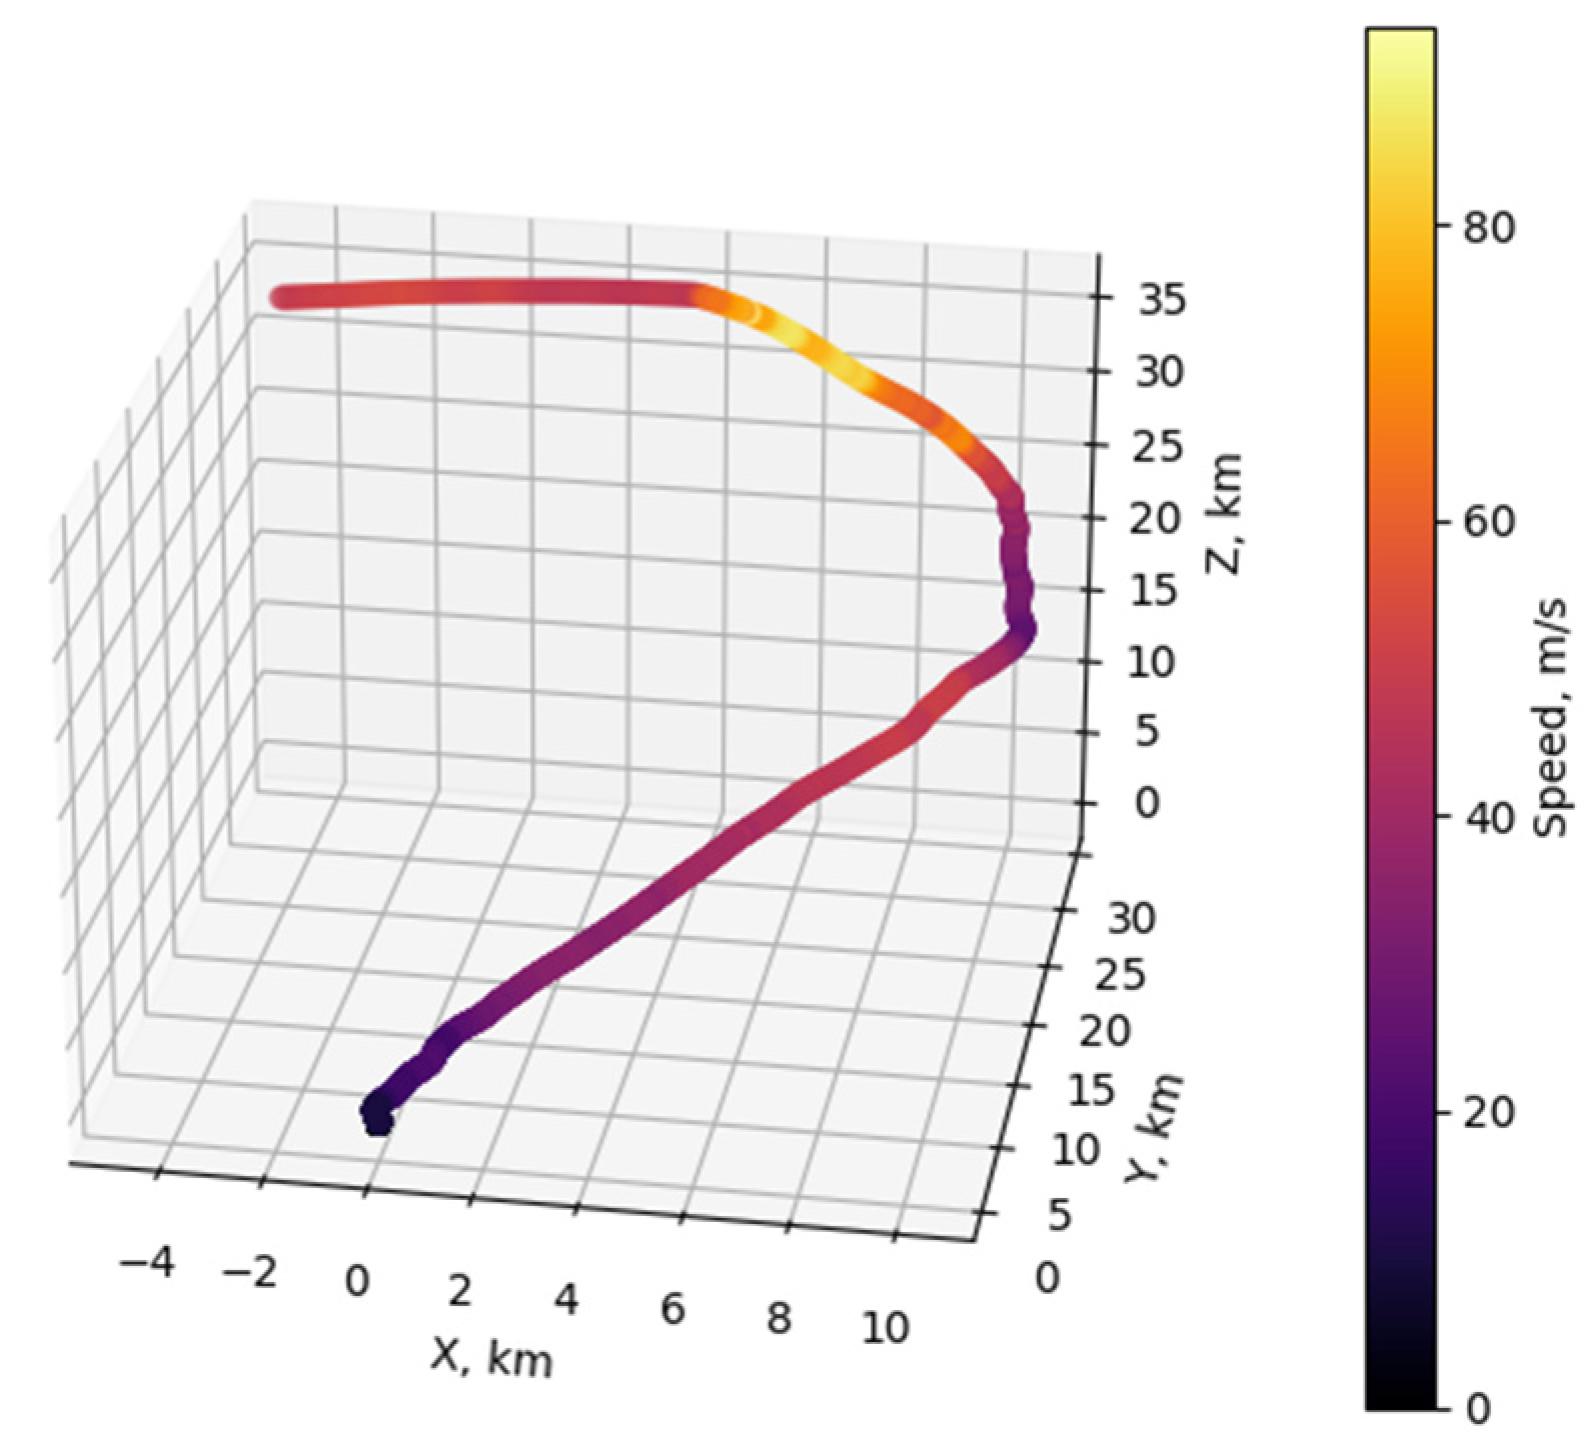
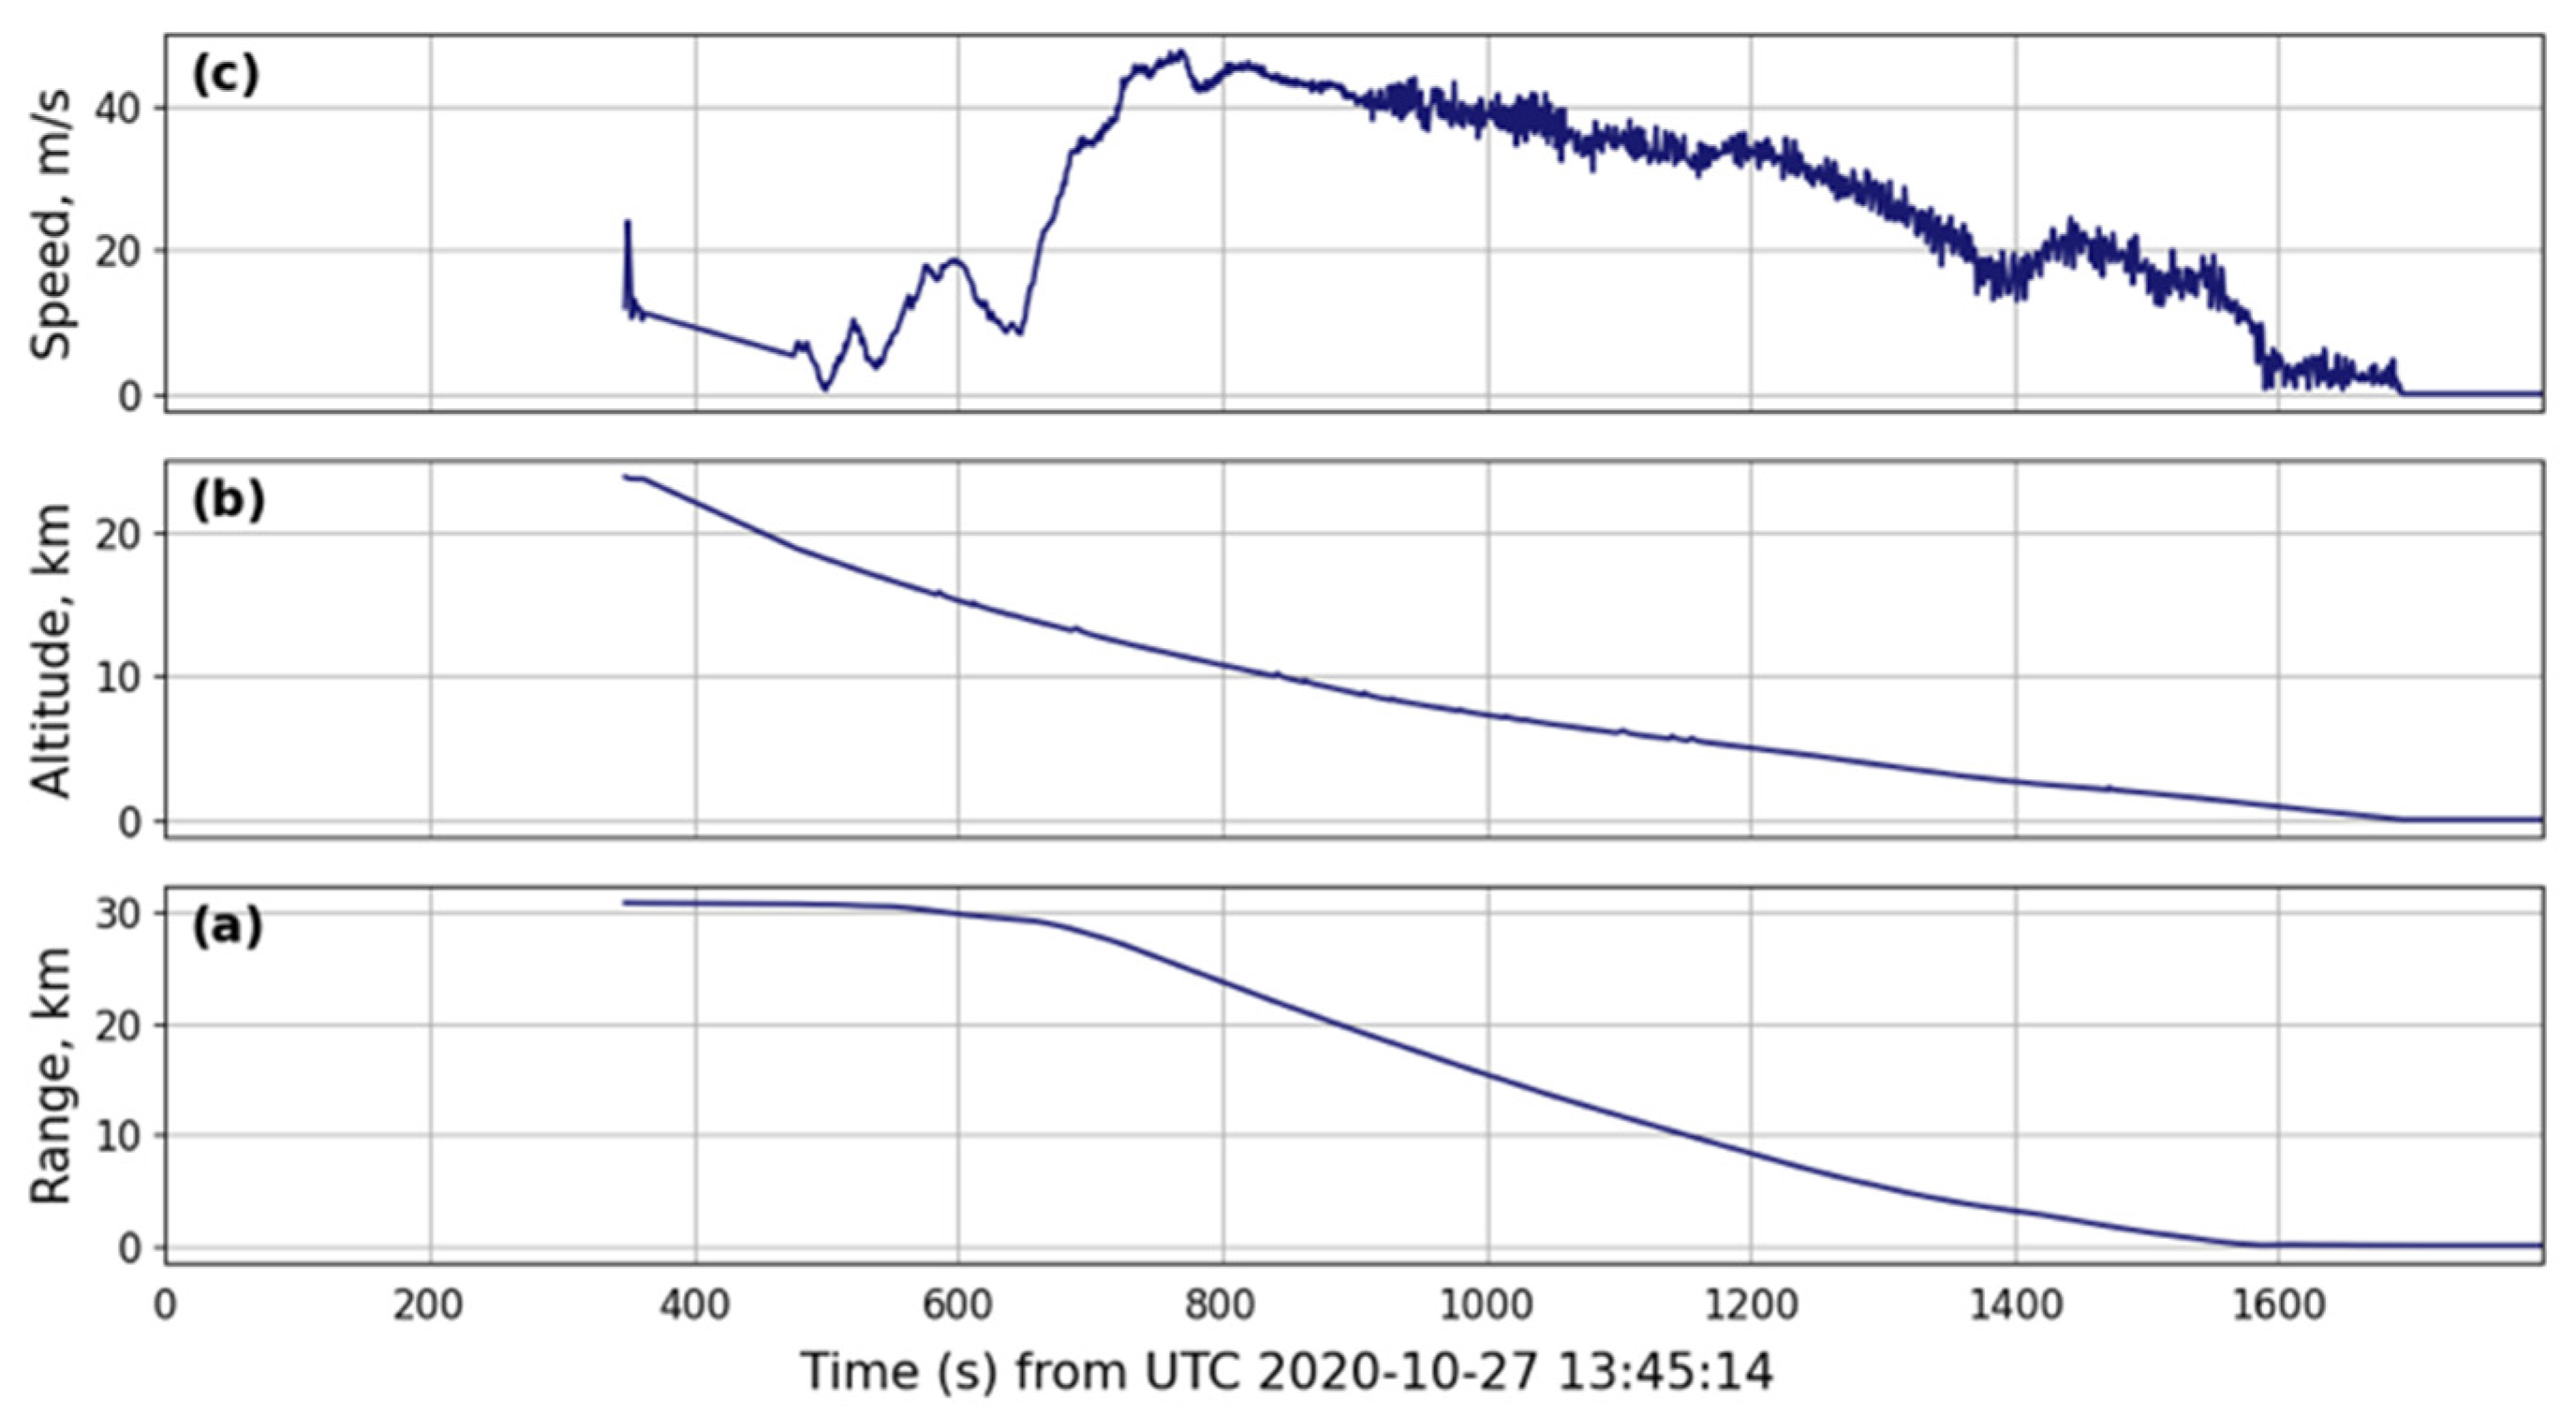
4.1. Bounder Location and Estimated Speed

The Bounder platform provided the most complete record of the payload position, although it does not contain information about its orientation or its rate of rotation. The Bounder position is converted to cartesian East North Up (ENU) XYZ coordinates in Figure 8 to show its trajectory with time relative to the end-of-flight terminus. A scalar speed is computed from the derivative of the cartesian coordinates in Figure 8 and is shown in Figure 9. The speed direction follows the trajectory. The balloon was initially moving briskly (~50 m/s) towards the southeast in the upper stratosphere (above 25 km), but swerved to the southwest in the troposphere (below 10 km). The fastest descent was at the onset of Skyfall, when it hit a top speed of ~80 m/s. It slowed down as the parachute deployed in the thin, cold stratosphere. The effects of the parachute seem clear in the lower stratosphere when it slowed down to ~20m/s. When it reached the troposphere, it was struck by a shearing wind that reversed its eastward journey. Surprisingly, it accelerated again in the upper troposphere to ~40 m/s; whether this was due to a parachute malfunction or strong winds is unclear from the Bounder location record.

4.2. Smartphone Location and Estimated Speed

The S10 smartphone location failed to provide location data in the upper stratosphere (Figure 10). This may be due to a phone’s tendency to turn off location logging when the screen goes off unless the “Always On” setting is enforced; this deficiency has been addressed in later app versions. However, vigorous movement tends to wake up a smartphone. The S10 began to record its location in the lower stratosphere, after its maximum descent speed of ~80m/s. Although the available S10 location and speed values are comparable to the Bounder, the S10 location data gap at height remains an unexpected surprise. As inferred from the synchronization data, cell position was only available below ~8 km. In summary, below 20 km and up to ground impact, the S10 location framework performed adequately (but not exceptionally) well, and it was the first sensor to report its position upon landing. Both the Bounder and the S10 show two regions of slow, near-vertical descent in the lower stratosphere (~10–20 km) where horizontal winds were low and the parachute performed as specified. As shown in Figure 10 with the higher-resolution smartphone data, the payload descent accelerated to ~40m/s in the troposphere, suggesting the parachute malfunctioned when it was hit by shearing winds. Fortunately, the parachute recovered, stabilized, and reached its nominal 6 m/s descent rate in the lower troposphere just before landfall, when it mattered most.

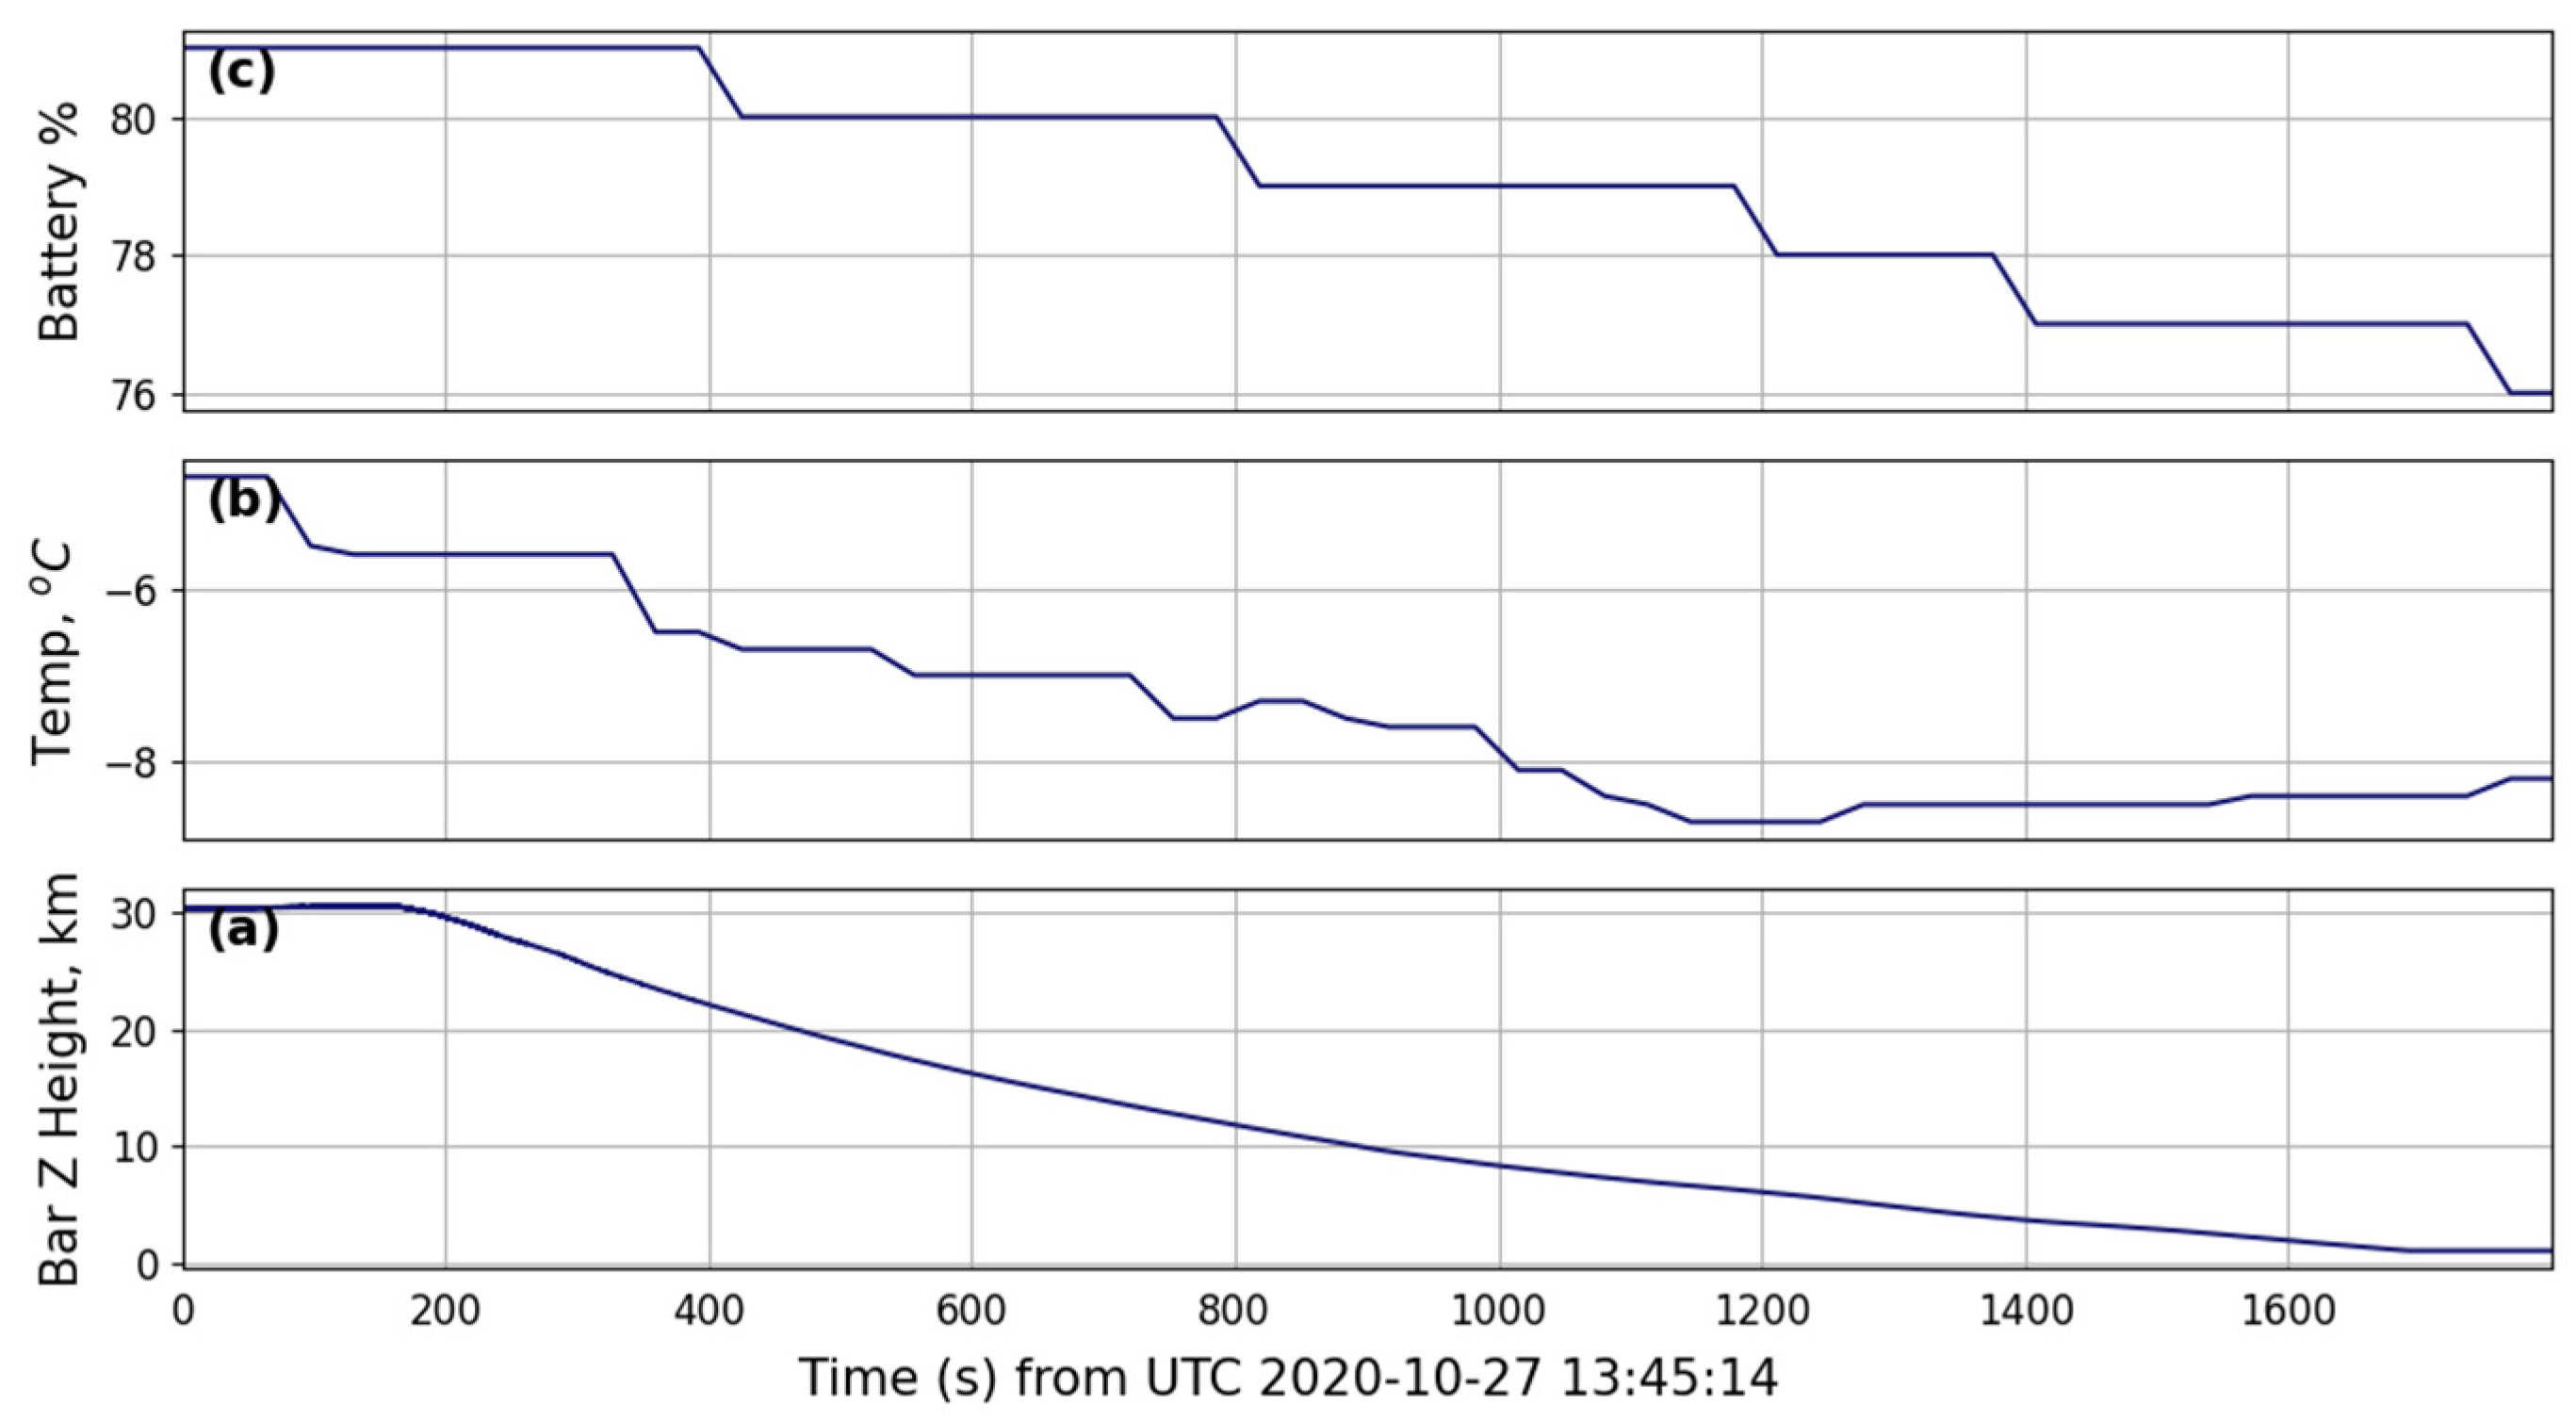
4.3. SOH Power and Temperature

The station power and temperature were coarsely sampled at intervals of ~30s and are shown in Figure 11. Not surprisingly, the internal battery was discharging during data collection. The S10 internal temperature during Skyfall did not rise above −4 °C; the external temperature would have been substantially lower. It is likely the station would have shut down and/or drained power rapidly had such low temperatures persisted. The temperature drop during descent is surprising; it should have been coldest at height. Advective cooling may have played a role. The reported internal temperature of the station dropped below −8 °C at ~8 km height after falling at relatively high speeds (>20 m/s). Temperature begins to rise again in the lower troposphere when the descent speed slows down to ~20m/s and, more predictably, continues to rise after ground impact.

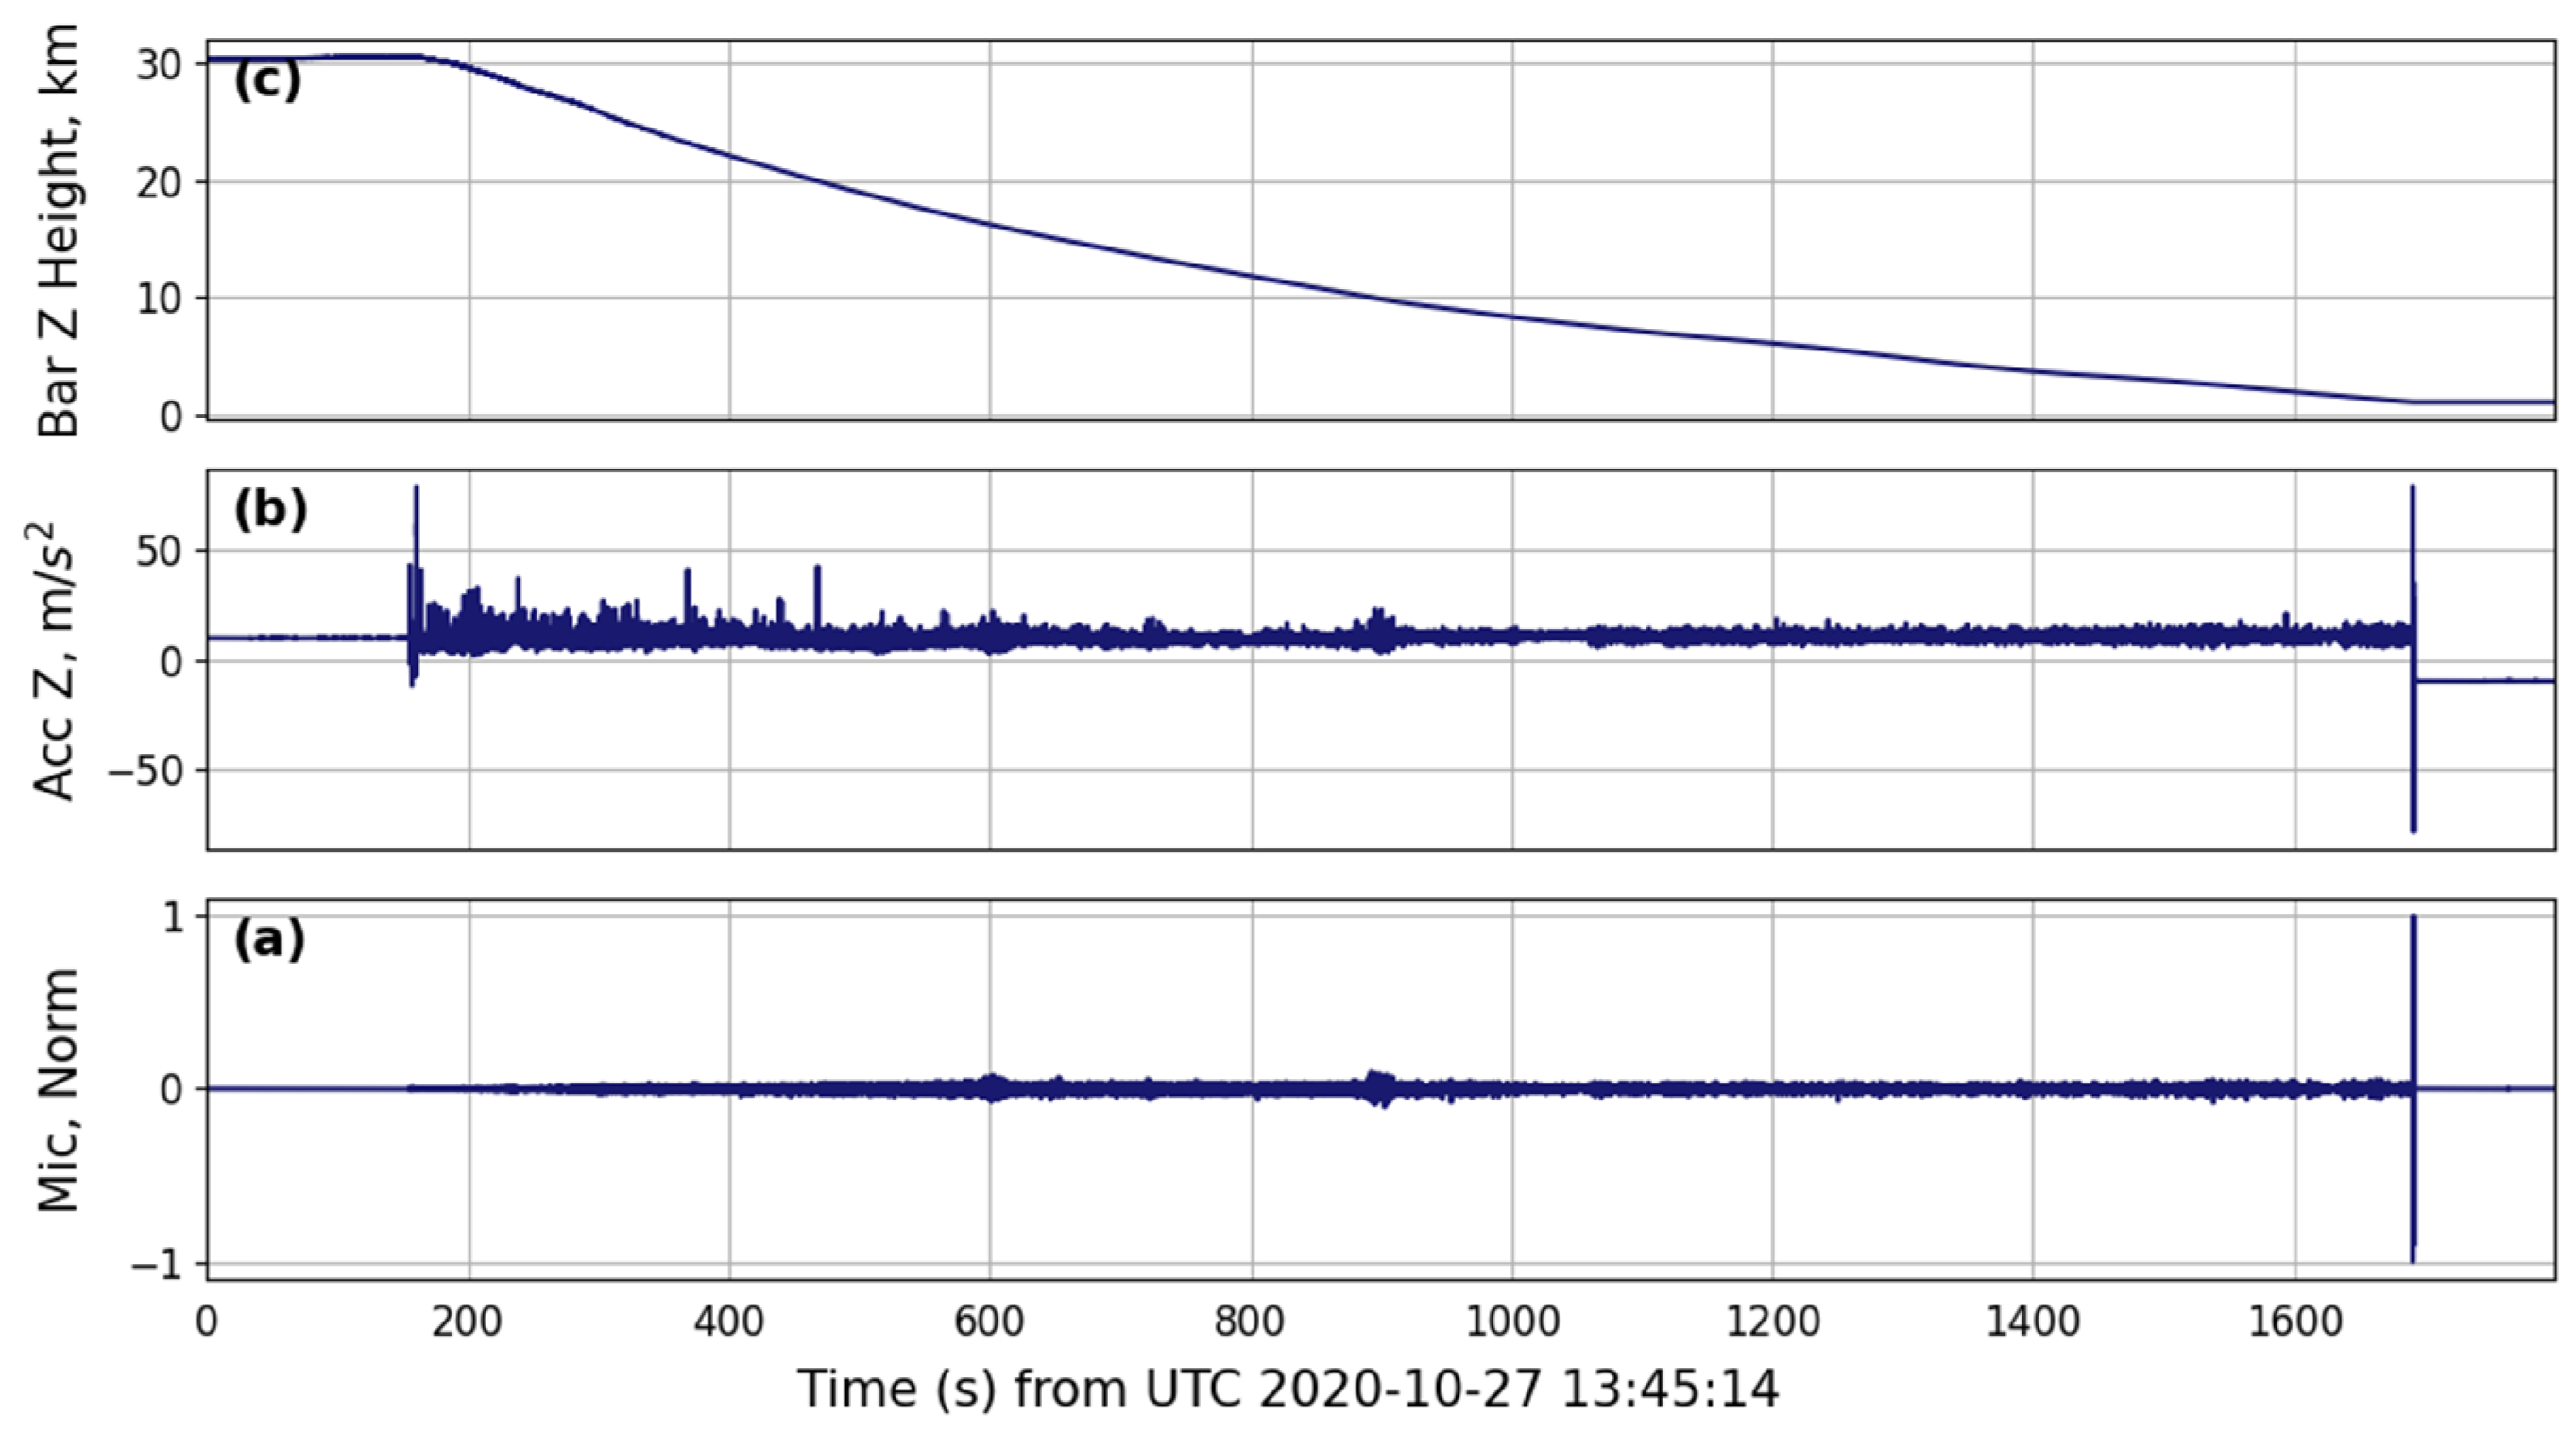
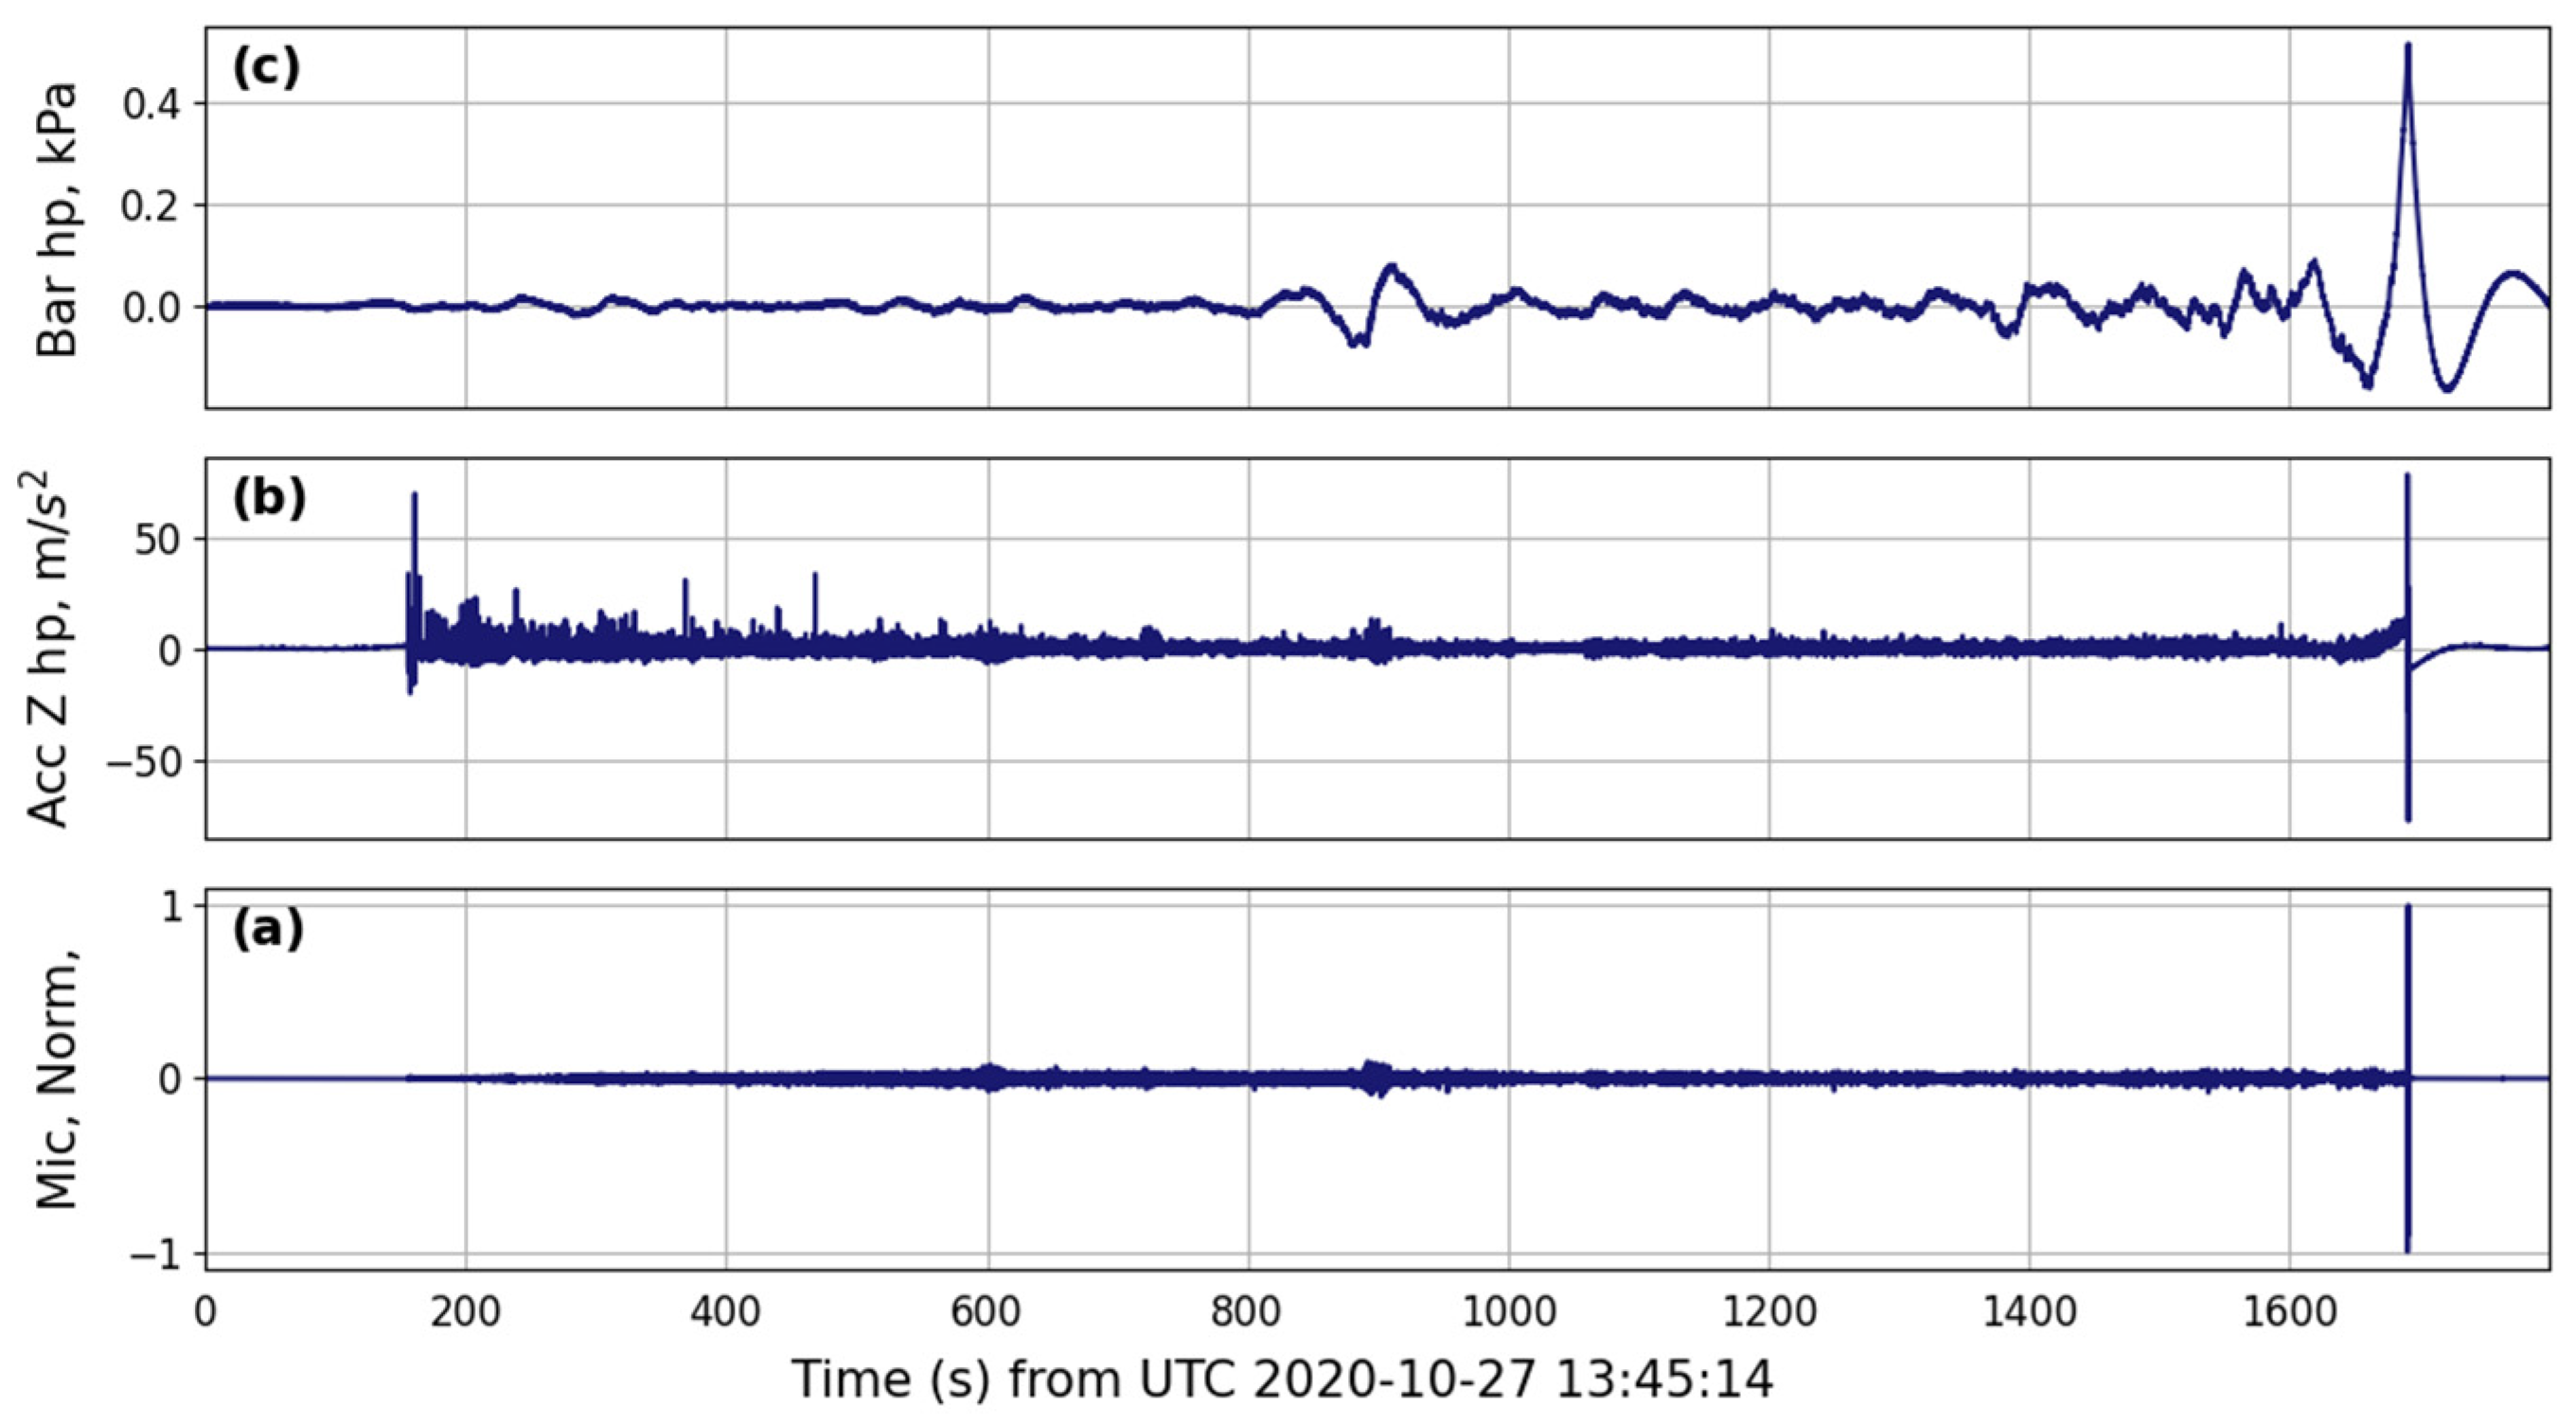
4.4. Acoustic Pressure, Barometric Pressure, and Vertical Acceleration

The microphone, barometer, and vertical accelerometer sensors provide useful insight into Skyfall. These three channels are often complementary during ground-based measurements and are discussed together. The audio channel, raw vertical acceleration, and height inferred from the barometer data are presented in Figure 12.
As mentioned in Section 3.3.2, the Bounder barometer was designed for high altitudes and provided independent measures of height and pressure. Since barometric pressure is transitory and depends strongly on time and location, we constructed an empirical function to compute height from pressure for the balloon height profile, and performed a polynomial fit to the natural logarithm of scaled pressure. The method for the polynomial fit is provided in the redvox-pandas repository [54]. We then fused the Bounder and S10 barometer pressure data (Figure 4) to obtain a finer temporal resolution for the pressure and height time series to reduce temporal uncertainty. The height is labeled as Bar Z Height (km) in Figure 11 and was later sampled at 24.4 samples/second, in contrast to the Bounder pressure, which was sampled at 1 sample/second. The substantial decrease in the sample intervals reduces timing and position uncertainty.
The raw accelerometer and microphone time series are dominated by the shock of the ground impact at the end of the record. The microphone has no substantial DC offset, as expected, and there is little audio signal during the initial release. Acoustic flow noise increased during descent, with a burst of increased noise when it reached the tropopause (~10 km) halfway through the record (~900 s), and ground impact evident at ~1700 s. Although the initial experiment was designed for audio exploration and succeeded in its primary mission [23], the acoustics are less prominent during Skyfall. It is not because there are no signals, but rather because their interpretation will be nuanced and beyond the scope of this paper. For example, there are interesting pressure perturbation around the time of tropospheric penetration (~950s into the record) that could be the topic of a separate study. Since the microphone data are sampled at 8 kHz, it can be converted to an audio file and code is provided in the Skyfall repository to perform this function [51]. It is a long (~30 min) listening session of audio noise, but with careful audio editing it is possible to hear whistling in some segments, supporting the advective cooling hypothesis postulated in Section 4.3.
The vertical acceleration signal in Figure 12 shows that the S10 was lying screen down, with gravity pointing up relative to the screen (Figure 5) before release (+9.8 m/s2). The release was a turbulent event with some tumbling, as suggested by the oscillations and reversals of sign in the vertical acceleration. At the terminus, the payload enclosure flipped over, reversing the sign of gravity (−9.8 m/s2). The microphone (mic) channel also clearly shows the impact.
High-pass filtering the signal above 100 Hz (Figure 13) enhances the fine-scale variability in the barometer and vertical acceleration sensors. The sudden stop at the end produced an overpressure of ~400 Pa in the barometer and, unsurprisingly, clipped the microphone.
Although the deceleration was abrupt, it was less than 10 times gravity (10G), and within the lower tolerance level survivable by humans [72]. The most informative signals for the Skyfall impact stage are the accelerometer channels when fused with the position and the height inferred from the barometer, as they pin down and verify the impact time and location. The accelerometer reports a rough but typically non-lethal landing acceleration magnitude of <8G, although the reported tumble after landing could be injurious.

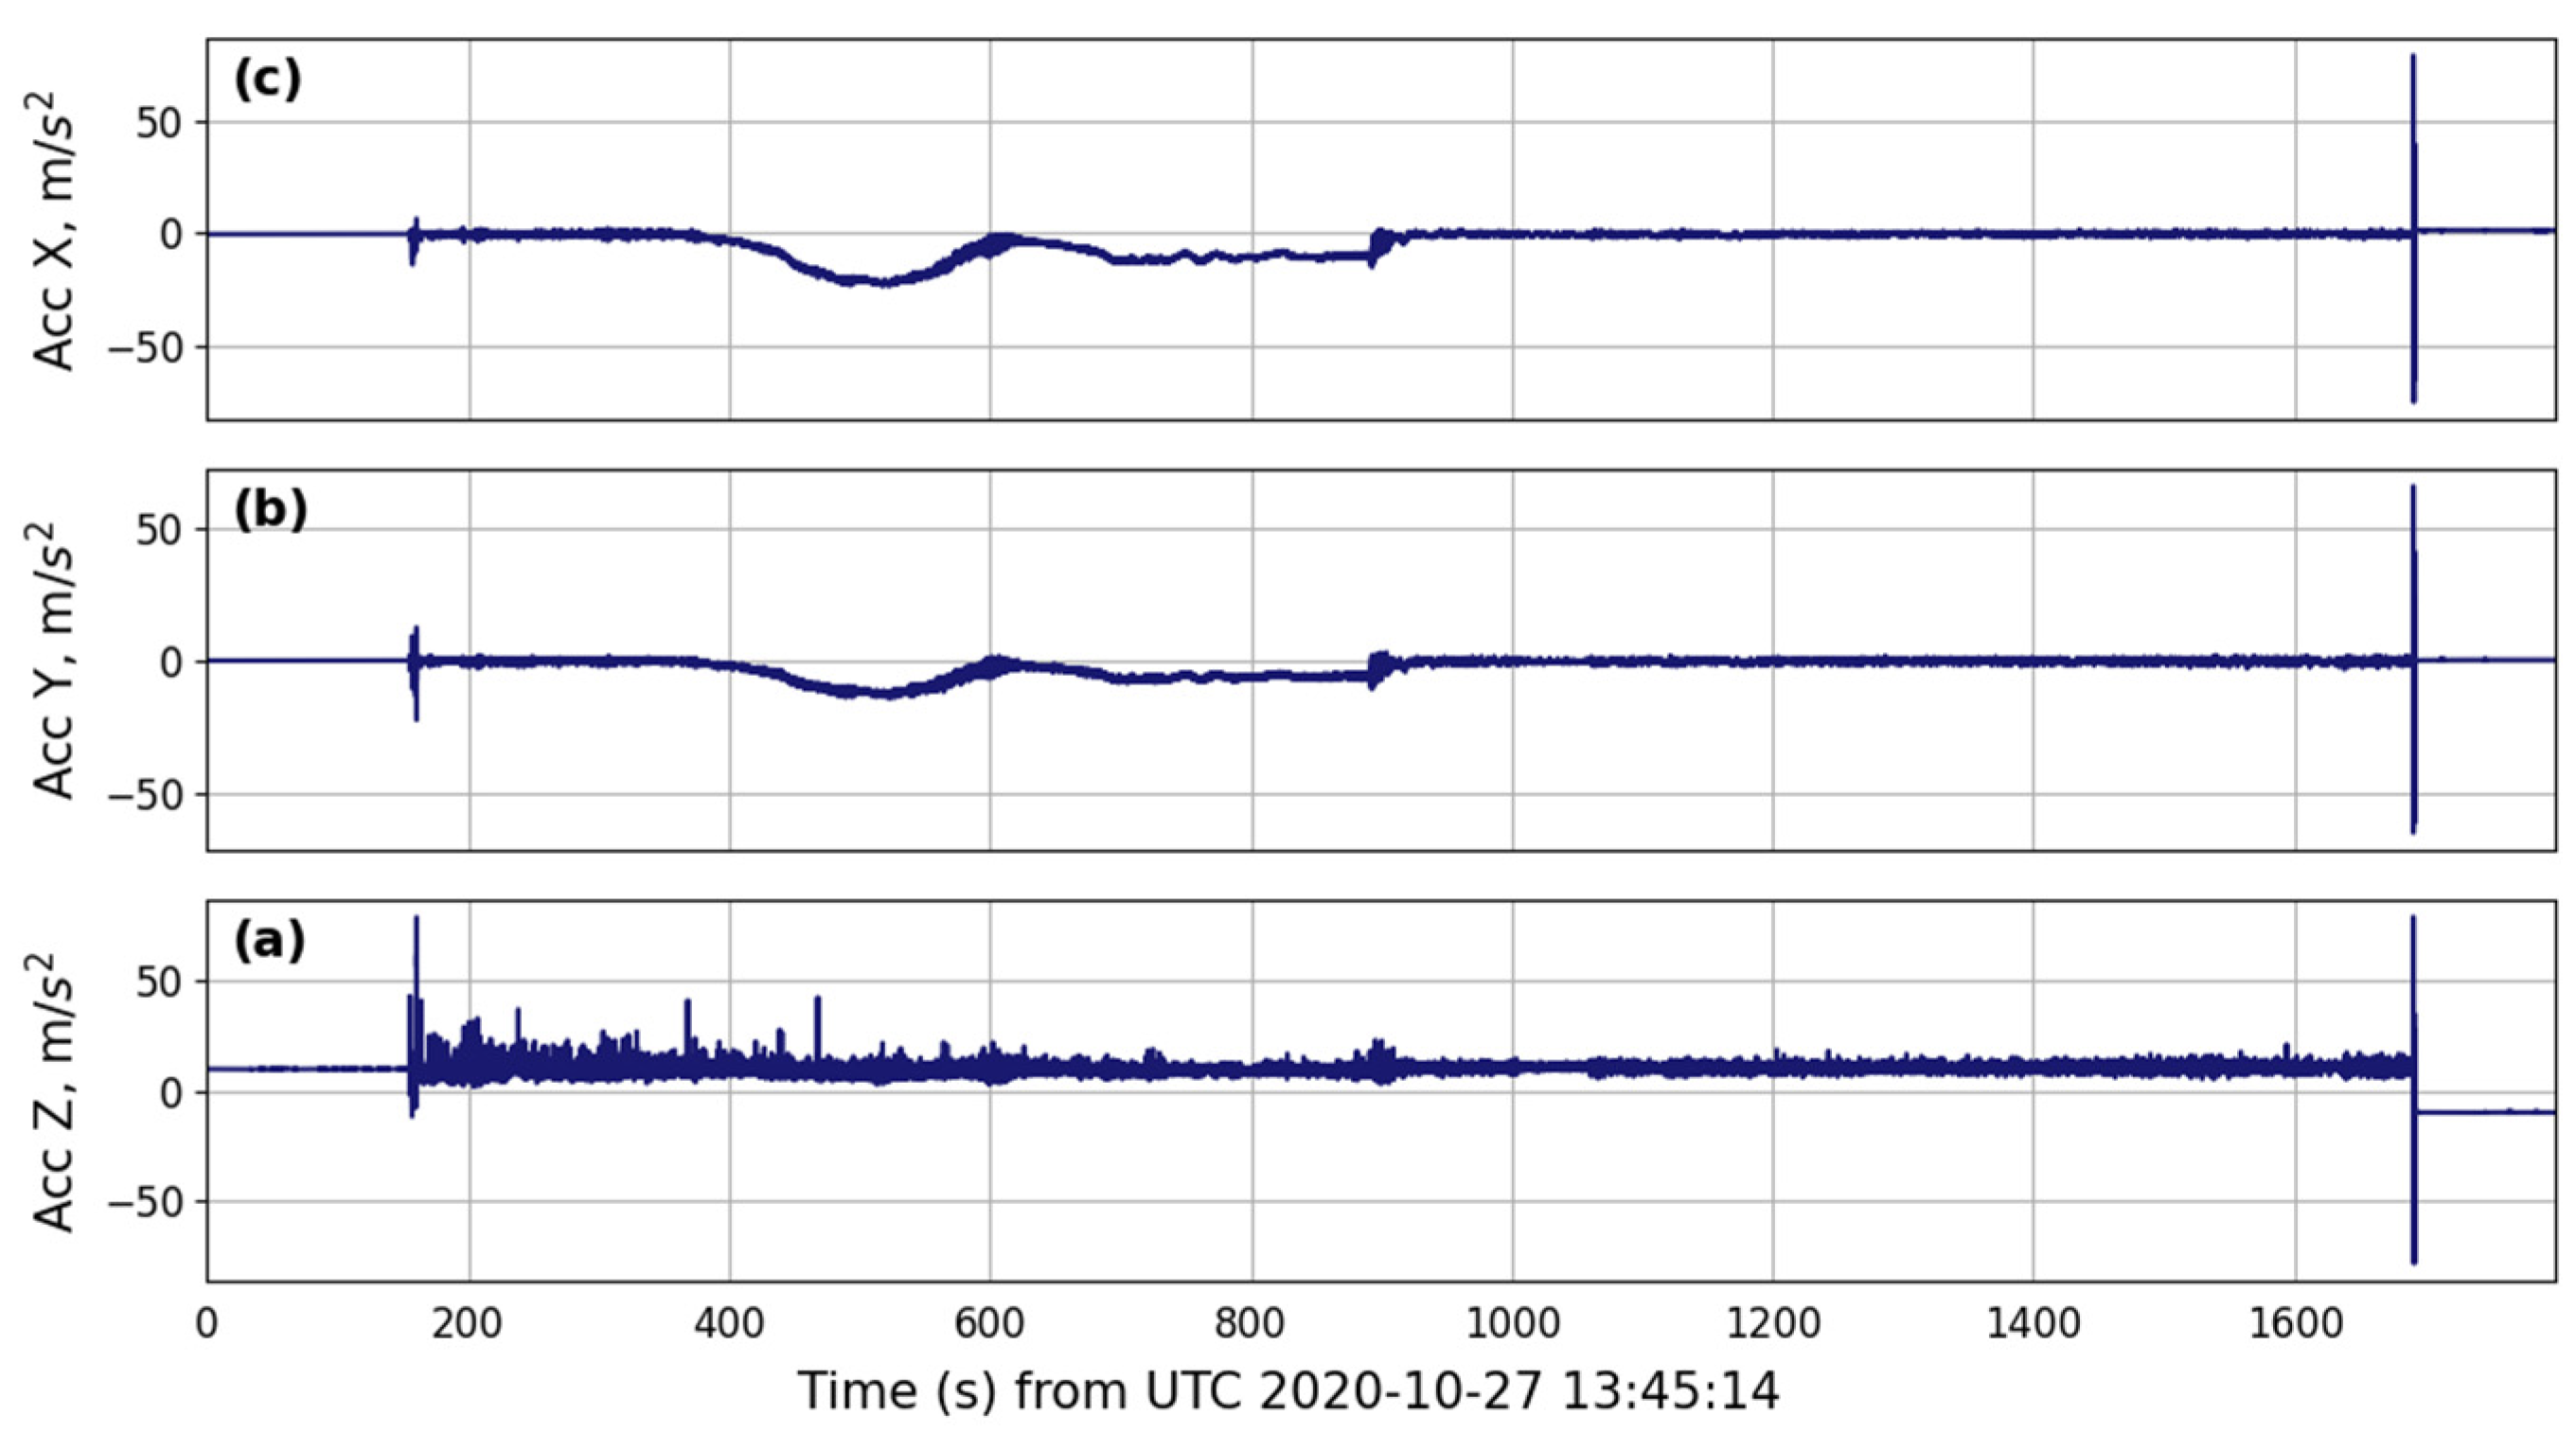
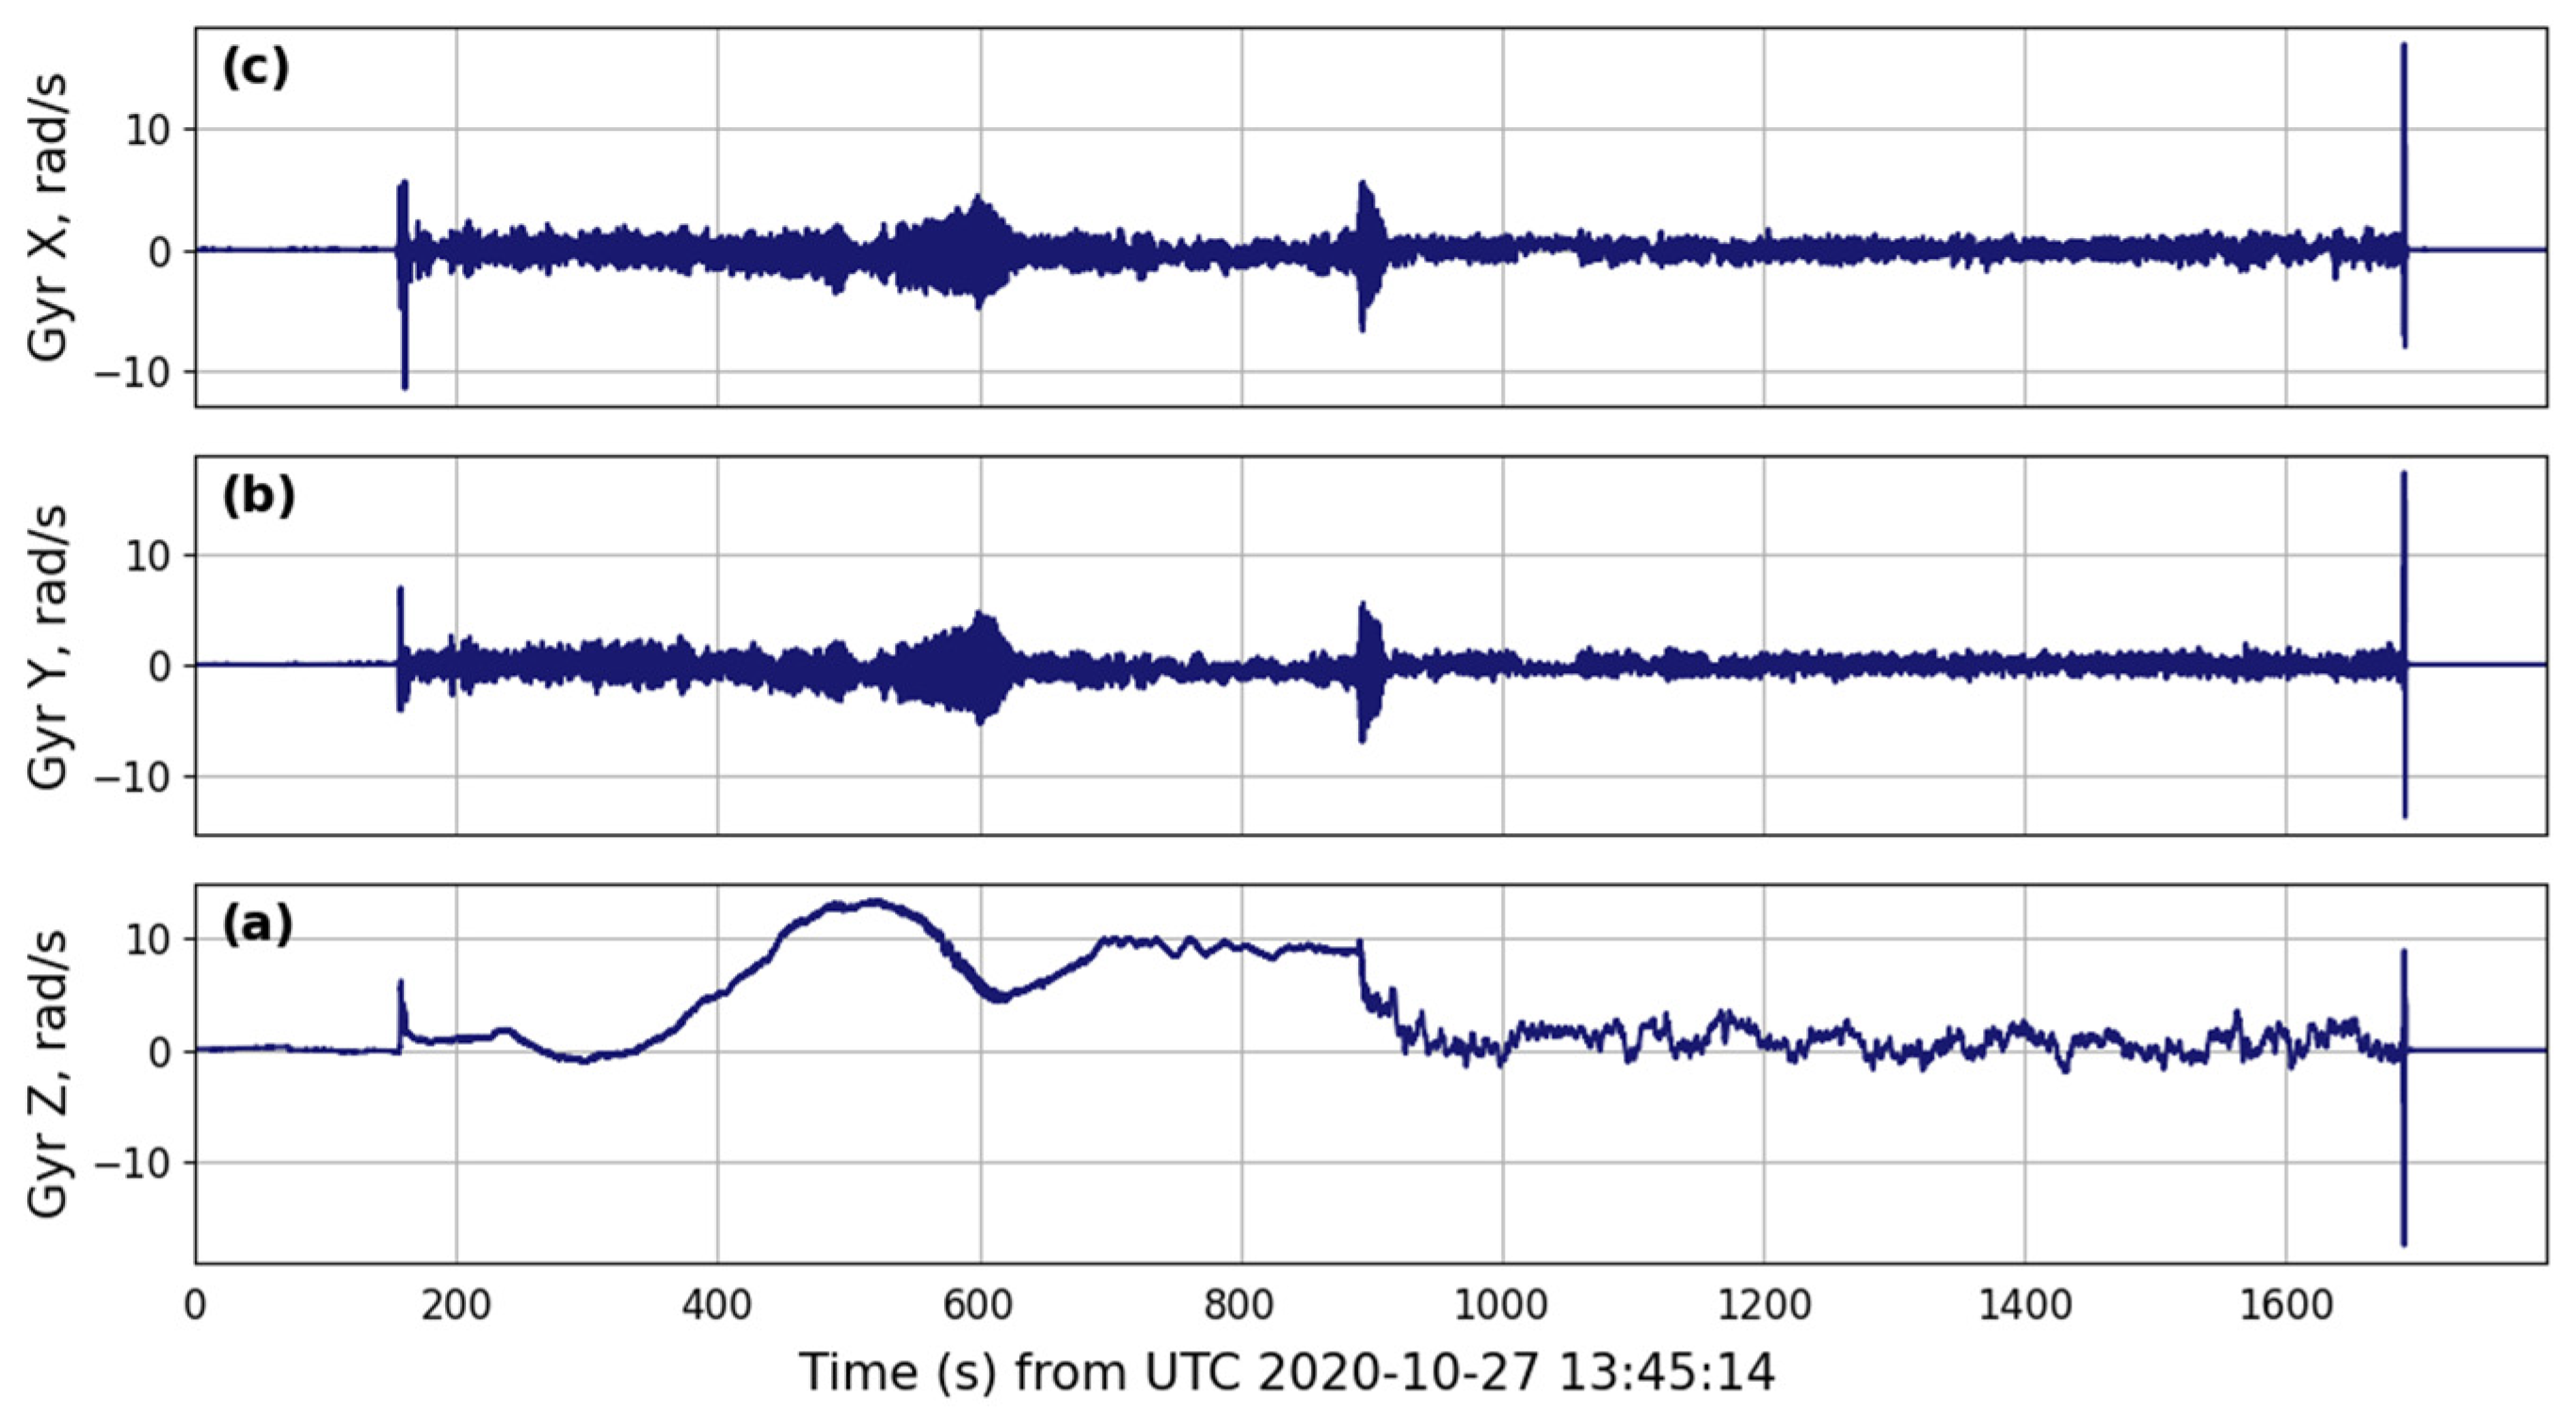
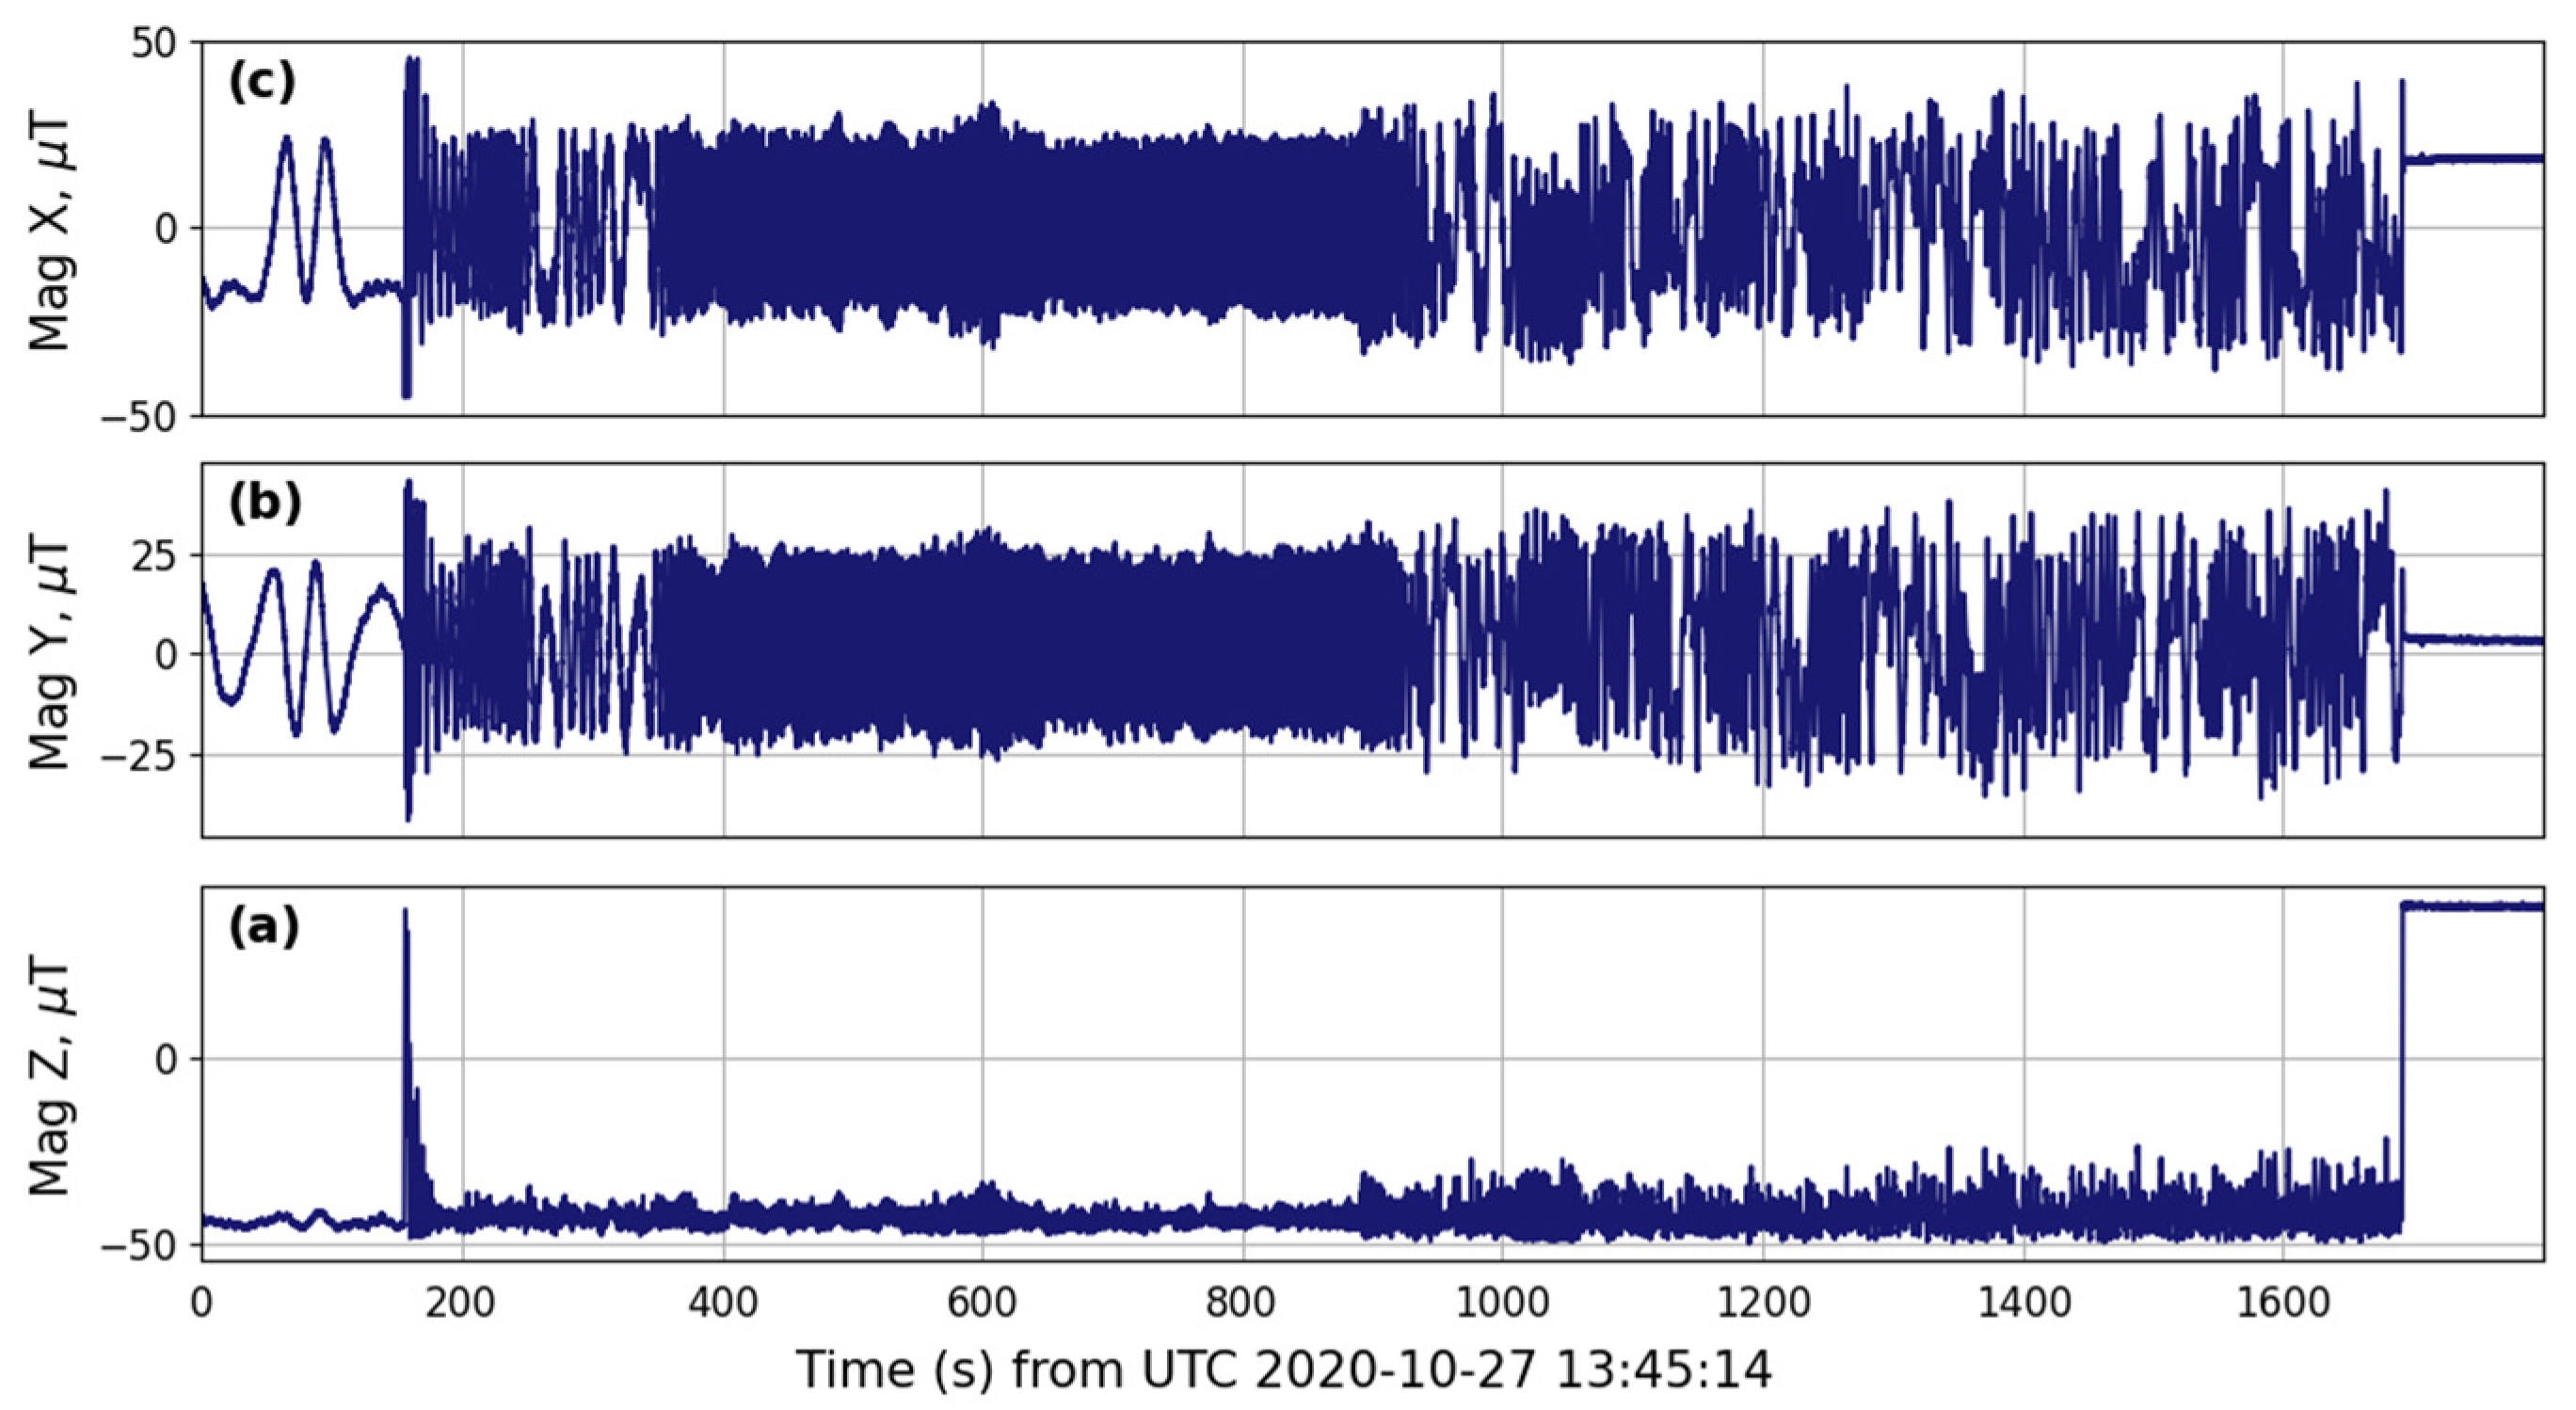
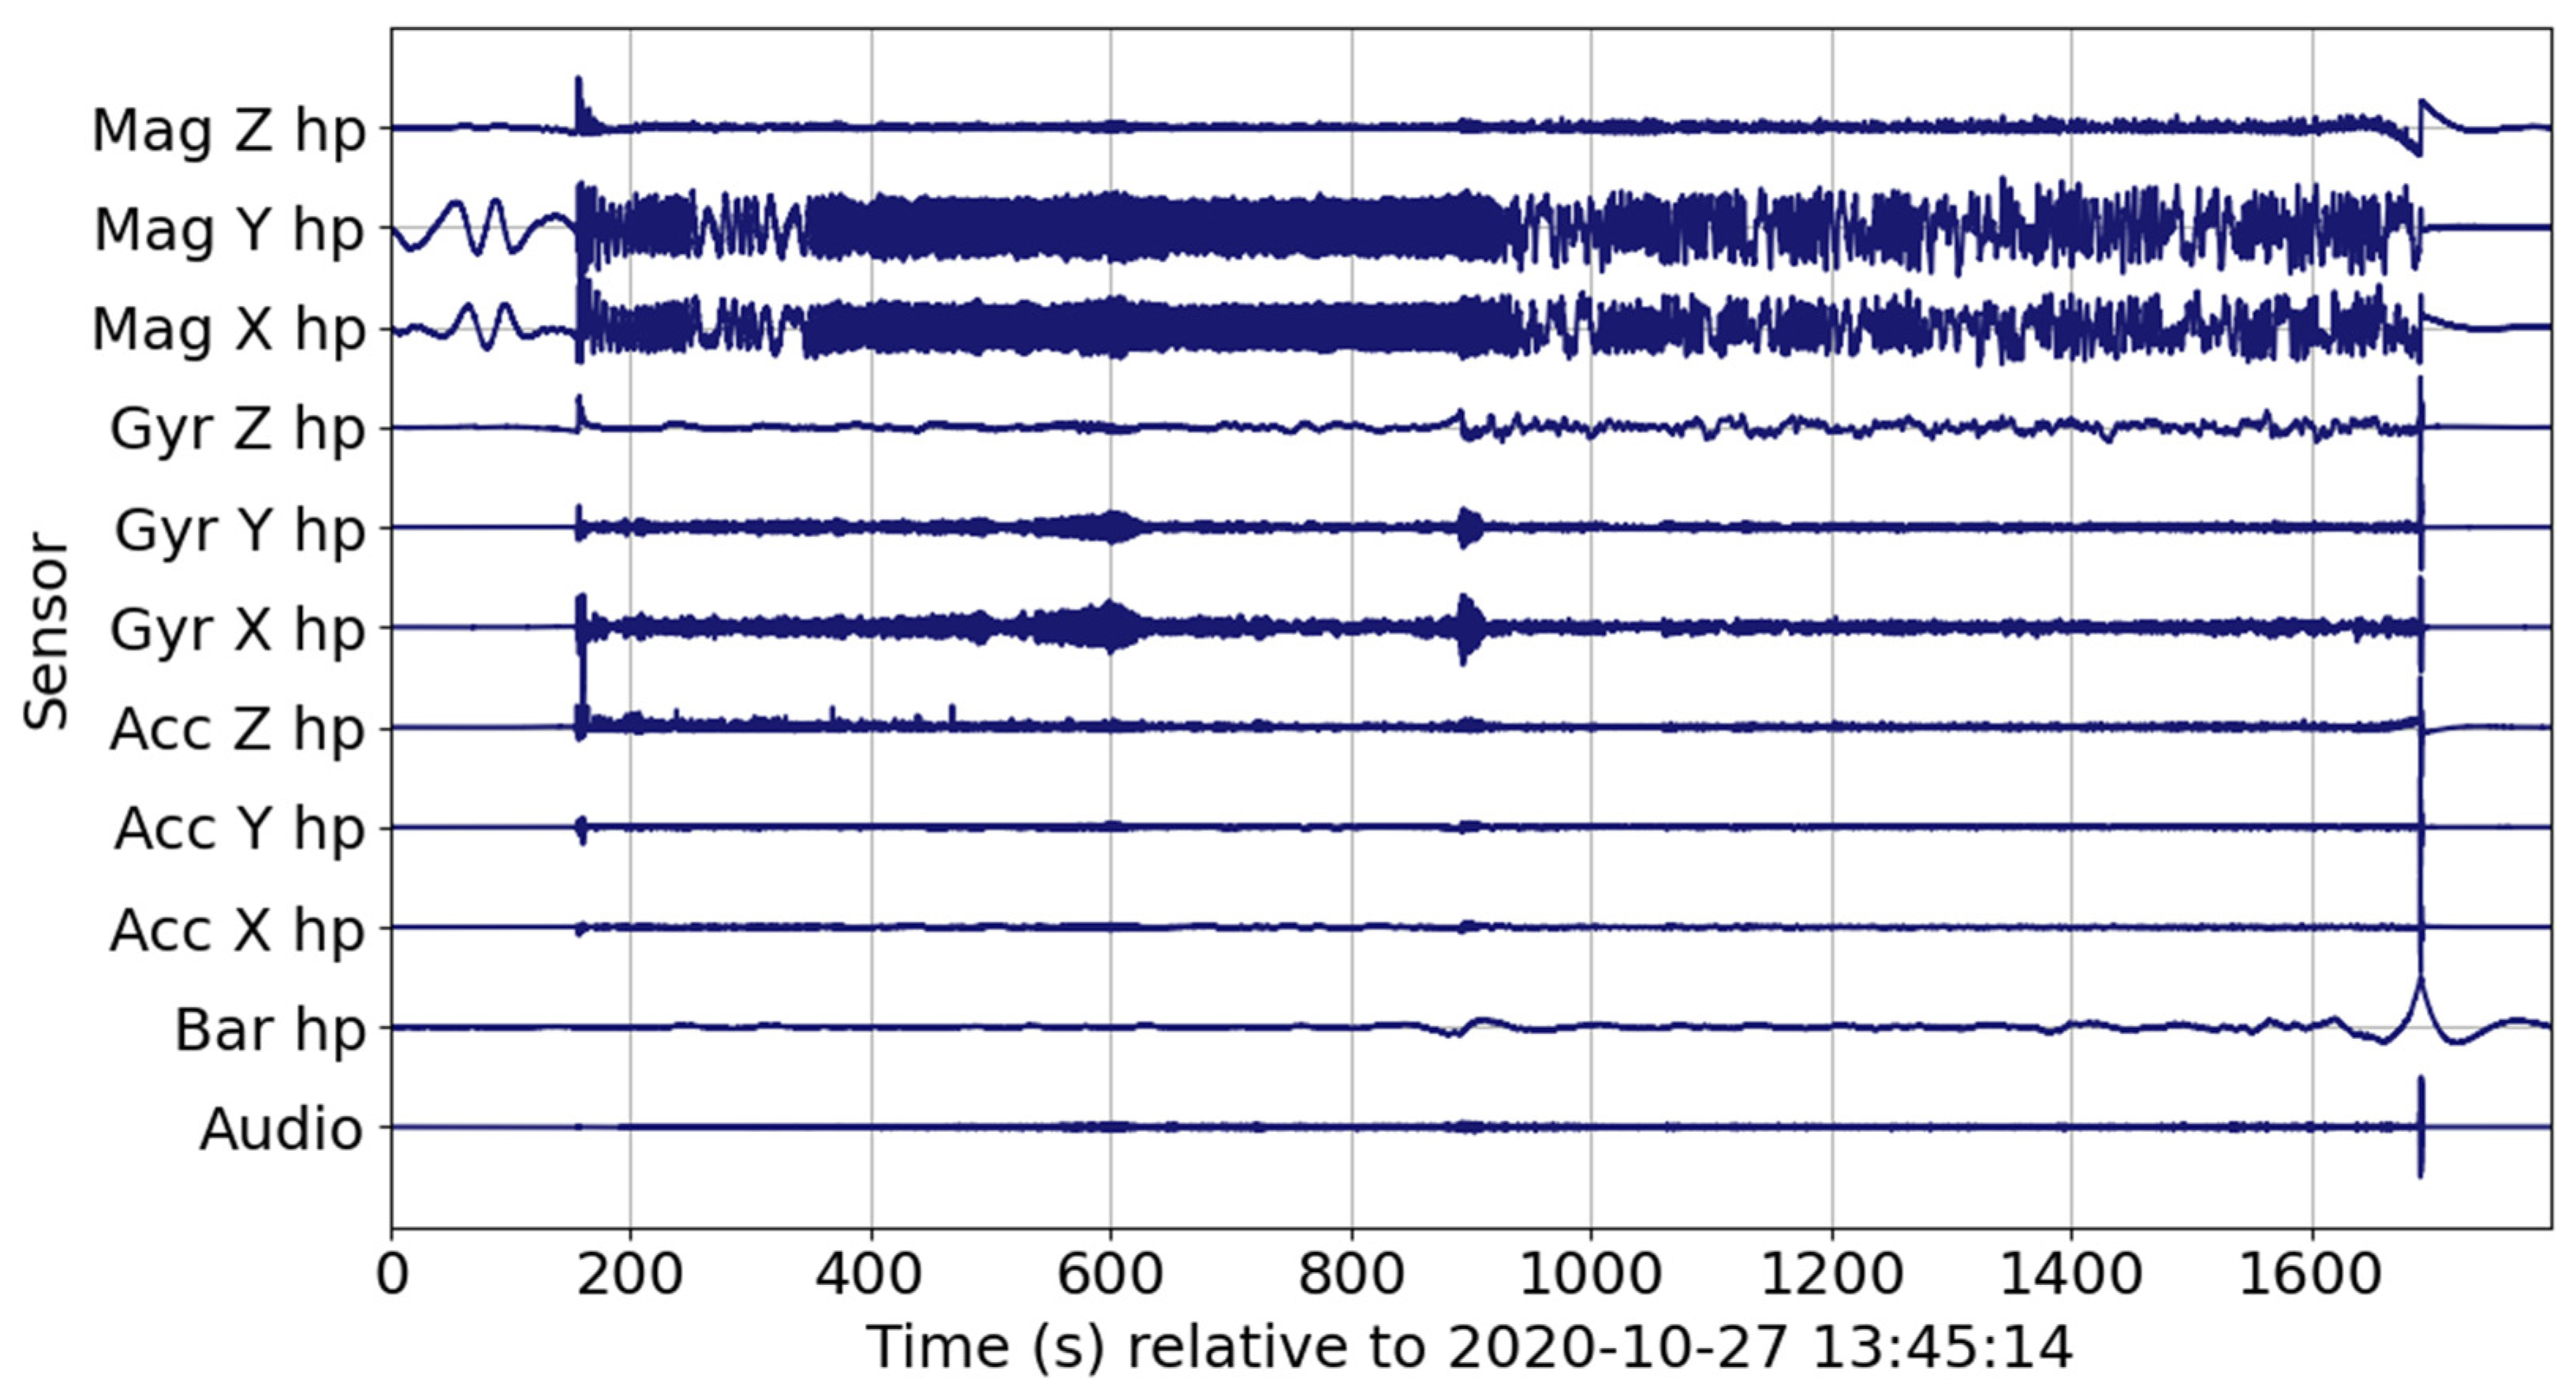
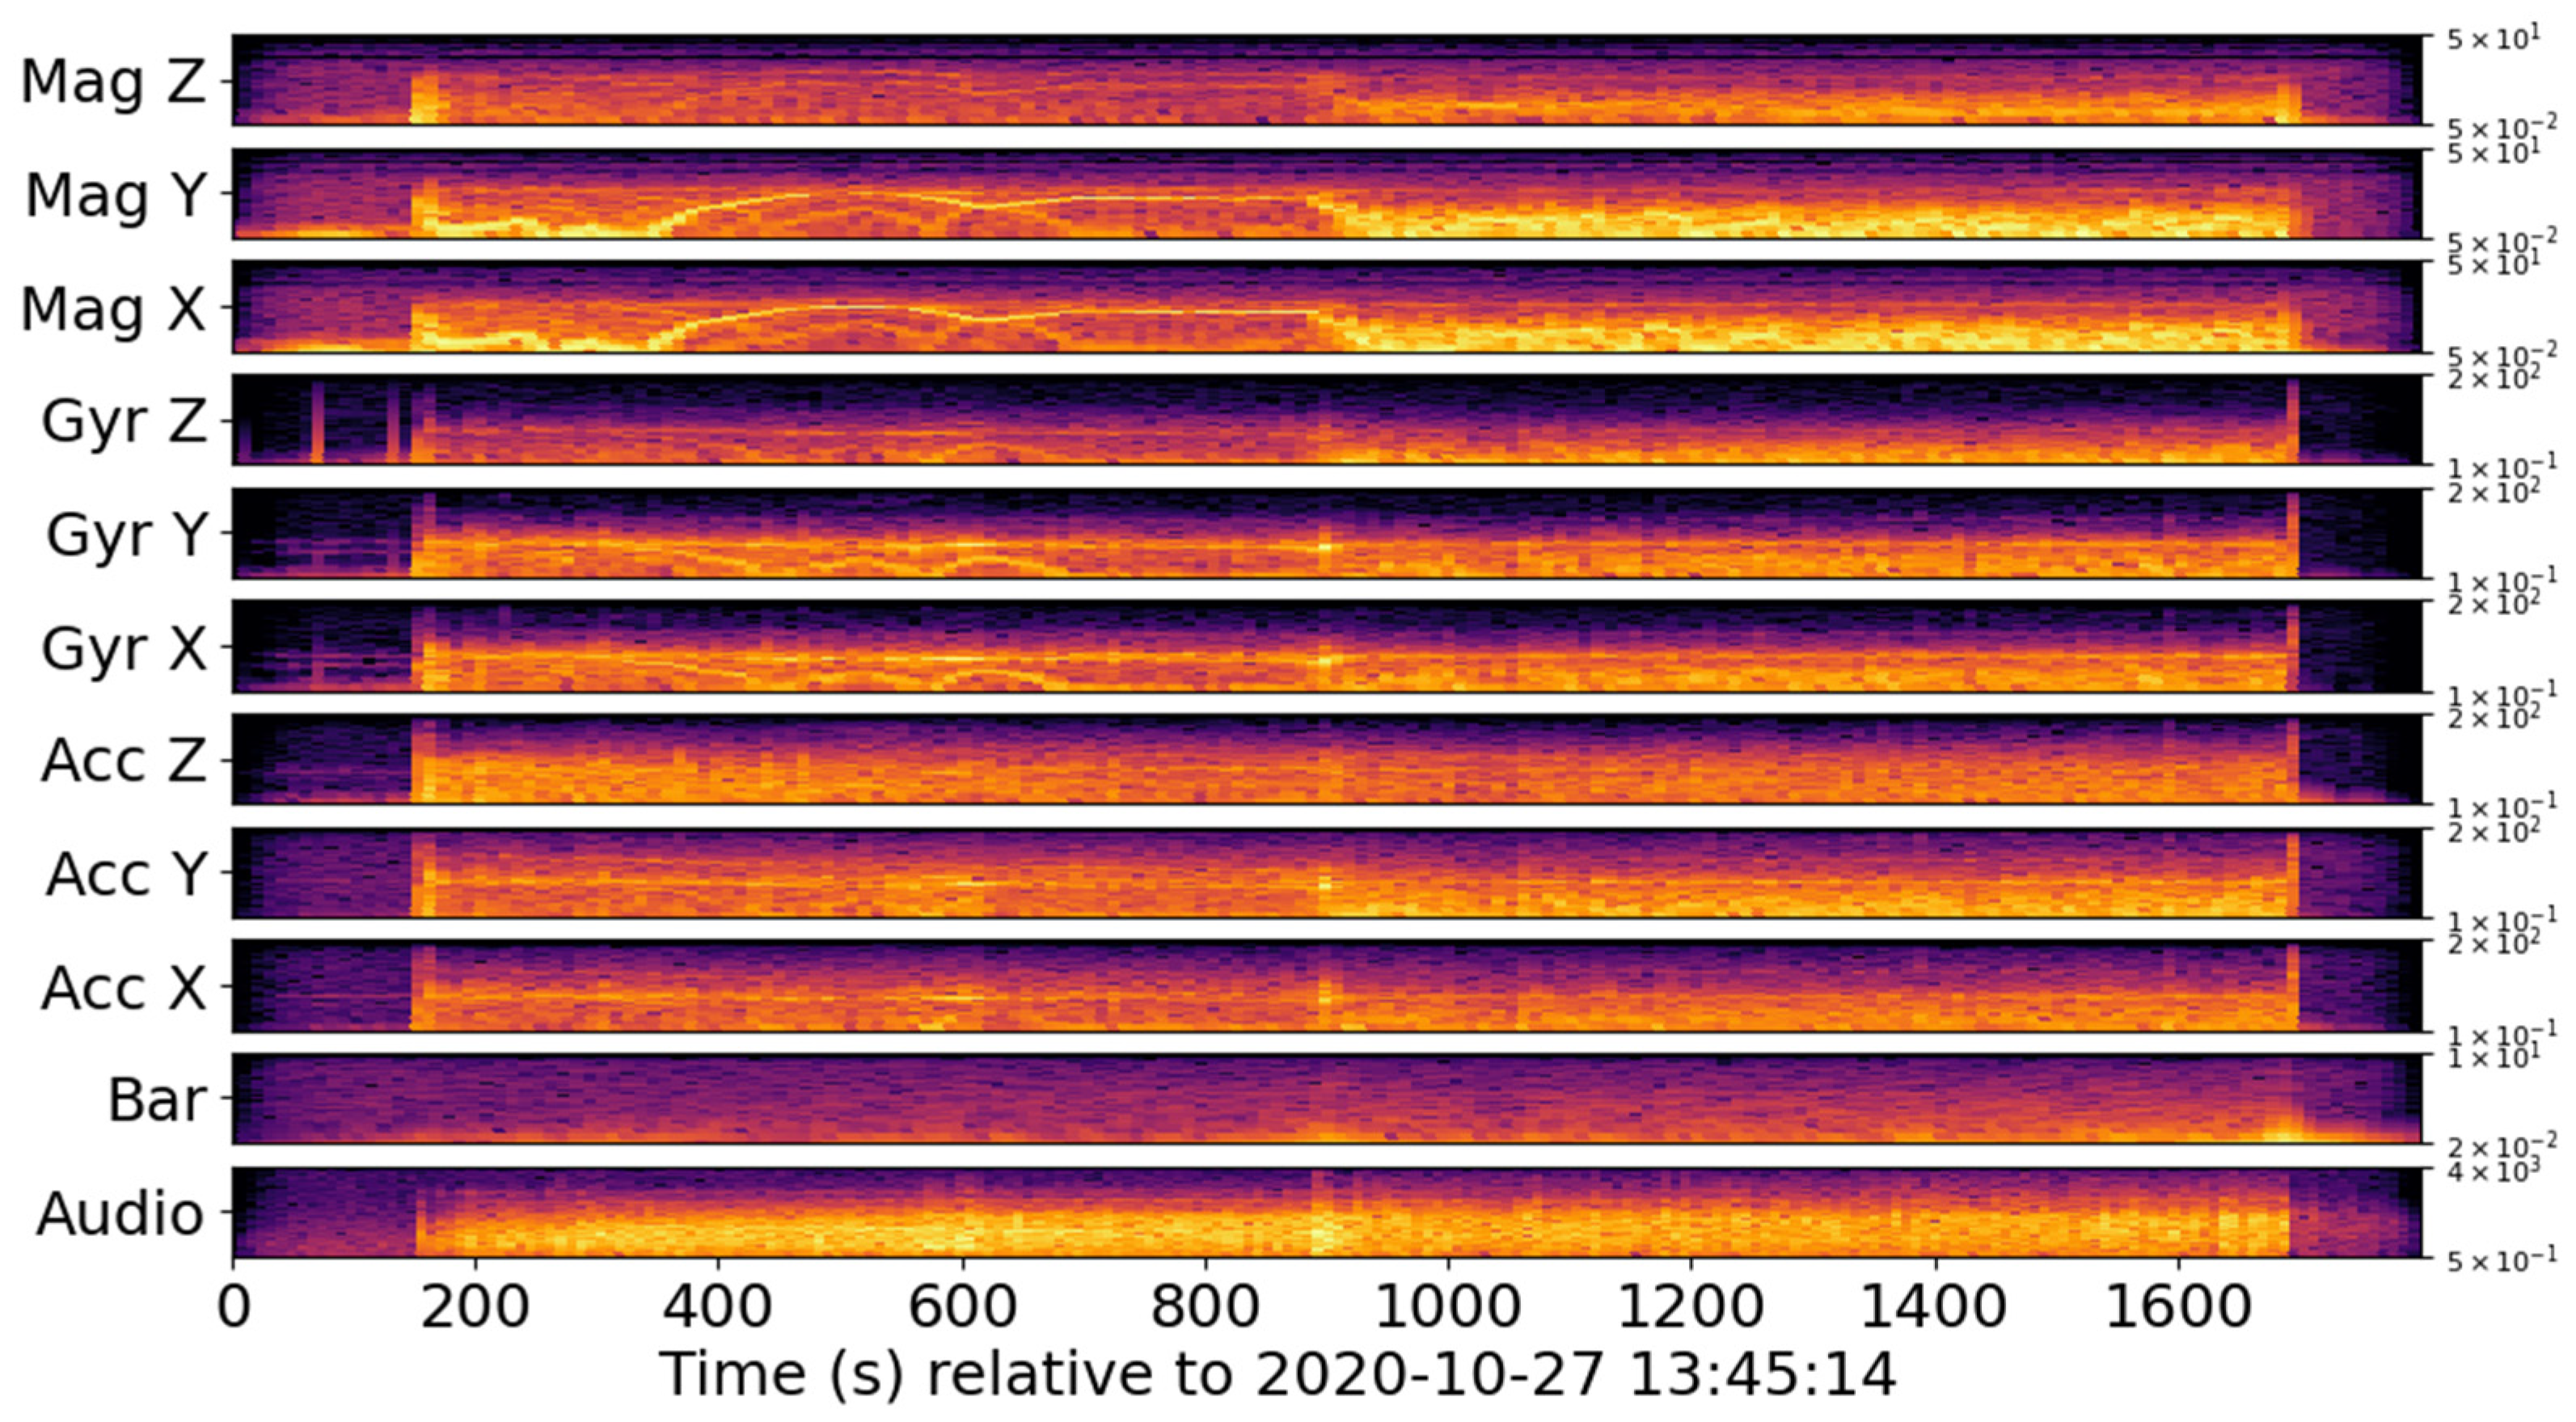
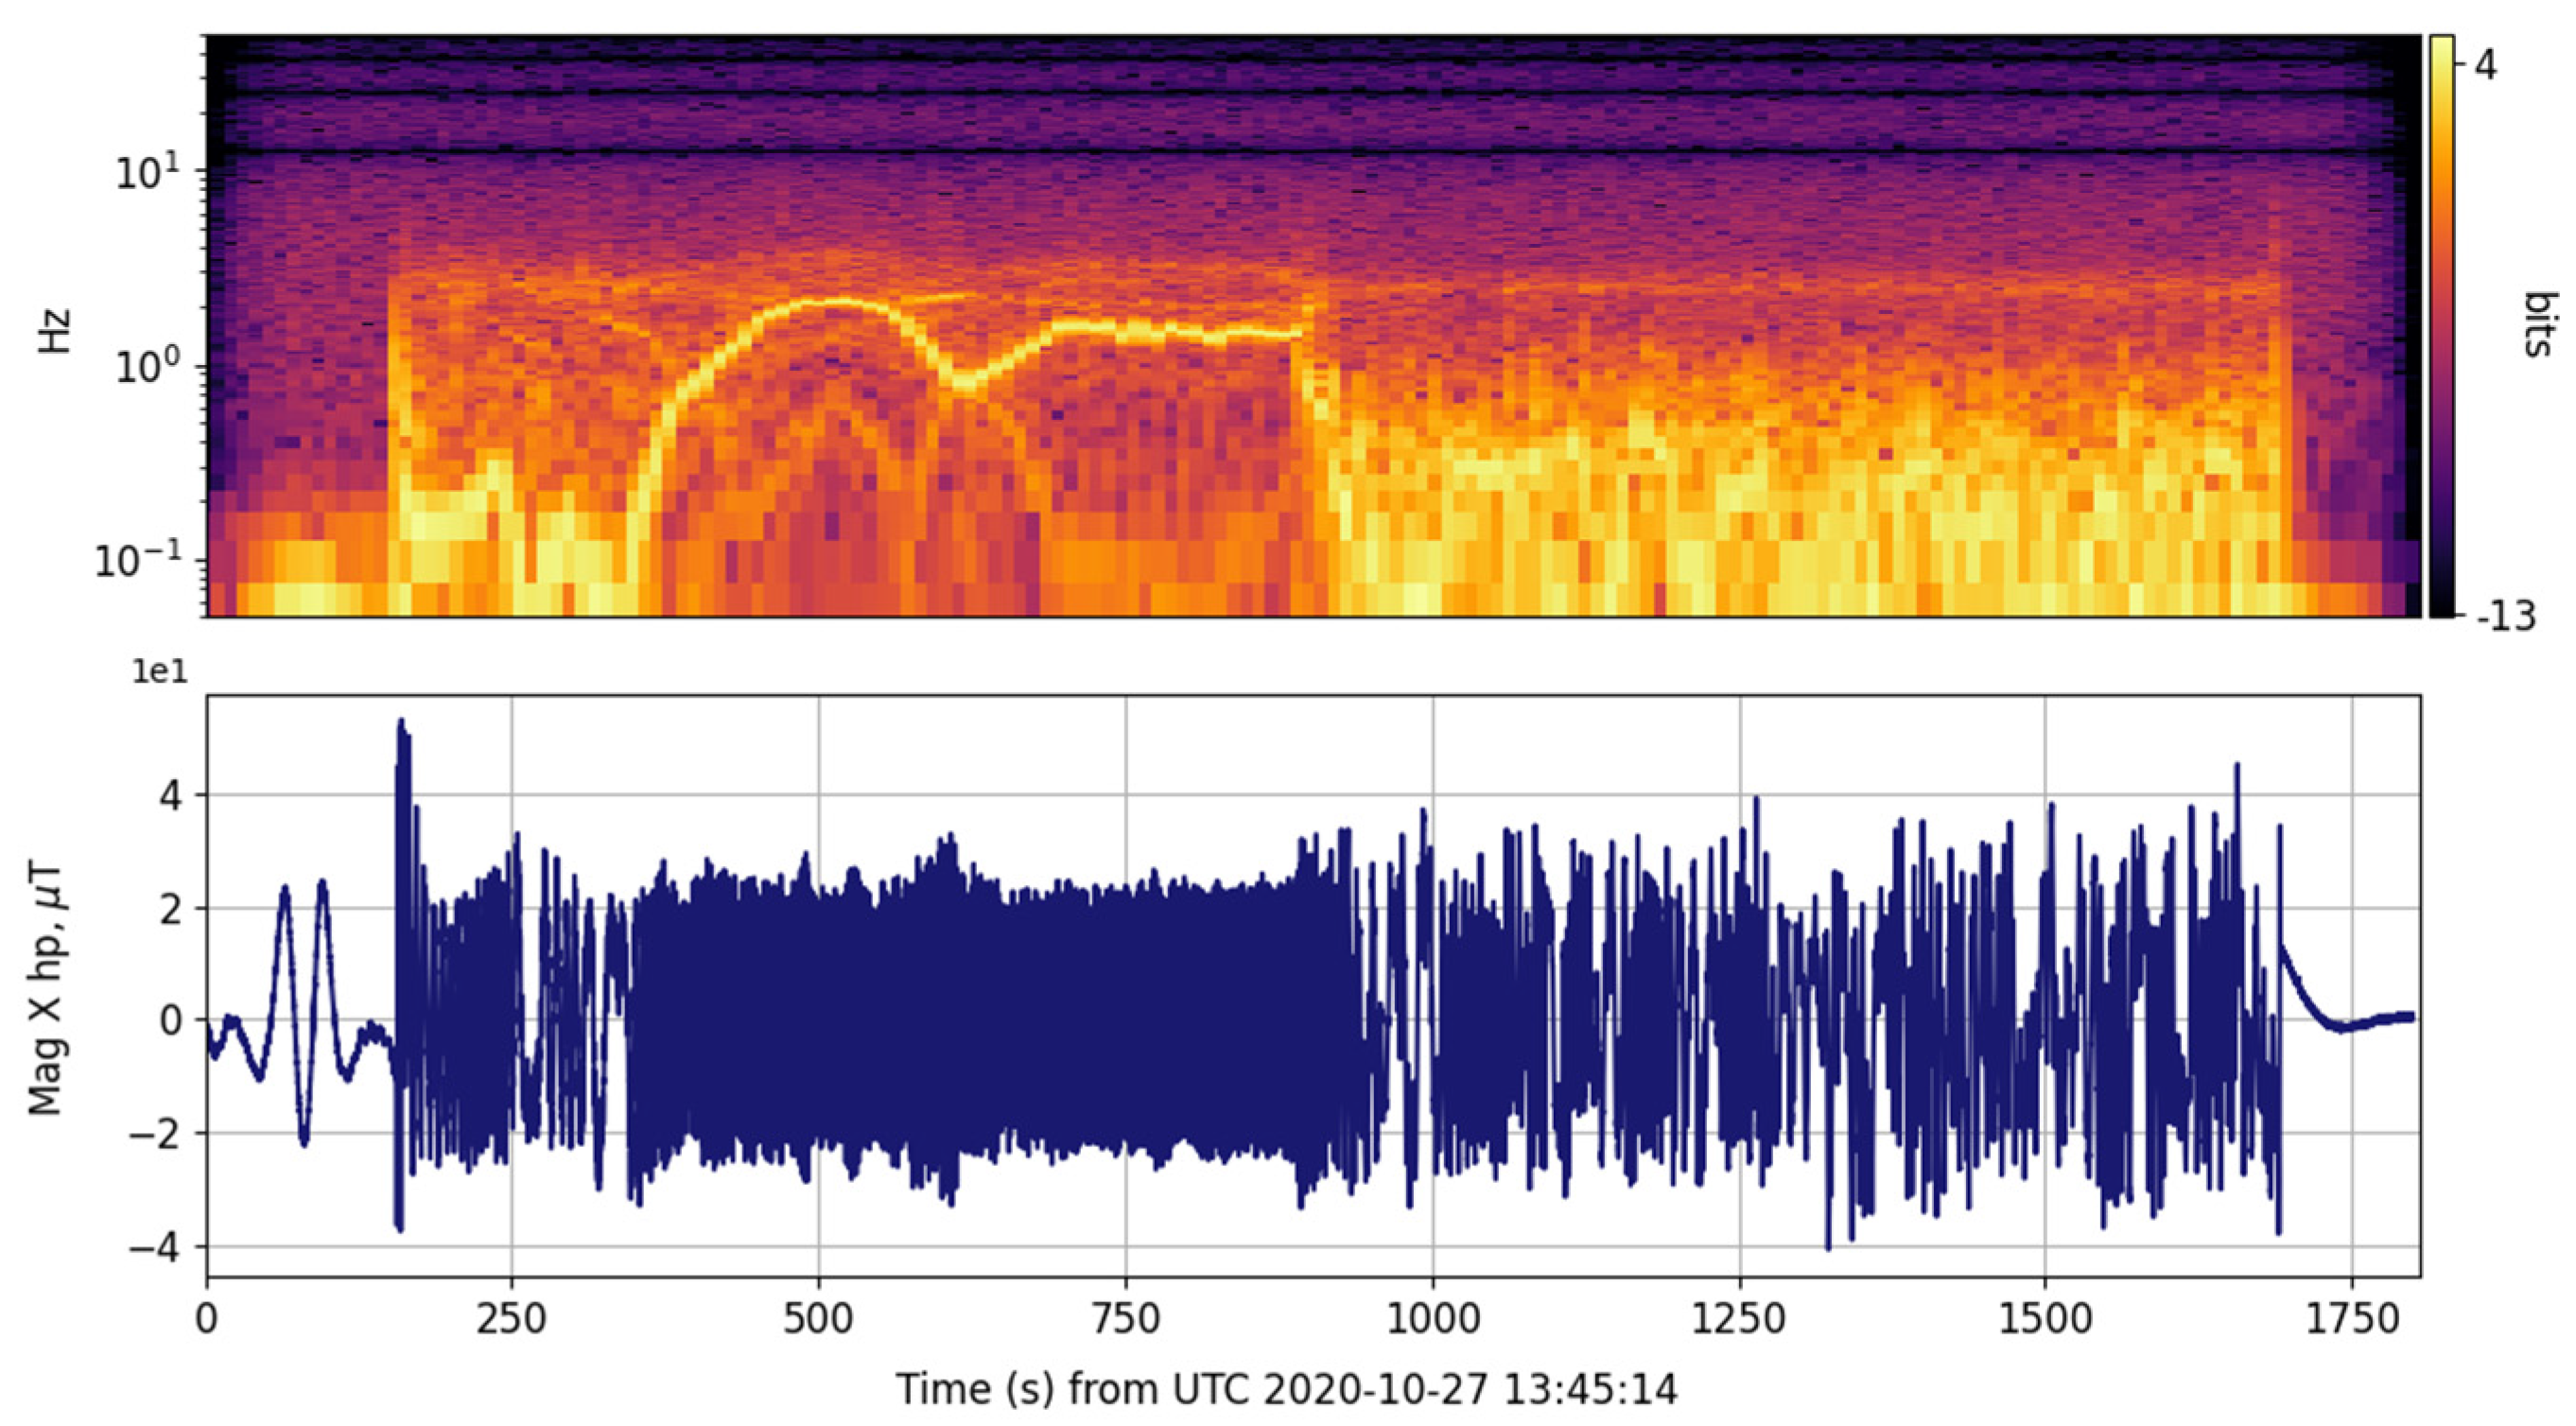
4.5. Three-Component Sensors: Accelerometer, Gyroscope, and Magnetometer

The three-component (3C) sensors provide insight into changes in the orientation of the payload. Accelerometers are included in almost all smartphones to detect when the device is picked up and for gaming apps. Gyroscopes are often bundled in with accelerometers to correct for a smartphone’s rotational orientation relative to gravity (e.g., screen orientation) and magnetometers are used for navigation. All the 3C channels are sampled unevenly, and all show three clear stages of descent: the release of the payload with a freefall in the low-density stratosphere, the transition to the denser atmosphere in the tropopause at ~900 s, and the impact with the ground. The accelerometer suggests the phone was deployed screen down and remained so through most of the turbulent descent. All (X–Y–Z) channels in Figure 14 show sign changes on release, consistent with an initial tumble during the initial stages of descent. The horizontal (X–Y) channels show high accelerations during the stratospheric descent and stabilized penetration into the troposphere. Since the DC offset of vertical acceleration was relatively stable at +9.8 m/s2 during most of Skyfall, we can describe the rotation about the Z-axis as a flat spin.
All three gyroscope channels in Figure 15 indicate a stable payload while tethered to the balloon with the initiation of rapid rotation after release. This reinforces the inferences made from the accelerometer channels that the payload initially tumbled after release. The gyration about the horizontal X and Y axes (panels (c) and (b) in the figure, respectively) along the base of the payload box are dominated by fluctuations around the value of 0 rad/s during the descent, while the Z channel (panel (a)) appears to show continuous and rapid rotation of the device about the Z-axis from approximately 300 to 900 s into the descent through the stratosphere. The vertical components of the gyroscope and accelerometer support the description of the primary rotation motion as a flat spin. The maximum rotation rate is 13.43 radians/second (2.14 rotations/s) or ~128 revolutions per minute (RPMs) sustained for ~100 s. A lower but more sustained rotation of ~10 radians/second (~95 RPMs) lasted for ~200 s.
After the 900 s mark (after entry into the troposphere), the gyroscope readings drop and fluctuate about 0 rad/s. This is also consistent with the accelerometer channels. All channels spike at ground impact, with the polarity changes also indicating a tumble.
Data collected by the magnetometer along the three axes of the device are shown in Figure 16. The magnetometer is also a good rotation sensor. A slow rotation about the Z-axis is evident in the X–Y components before release while tethered to the balloon, while the magnetic line component along the Z-axis is stable. All magnetometer channels switched polarity on initial release: the payload tumbled. In the X and Y directions (shown in panels (b) and (c), respectively), readings oscillate around 0 µT during descent. For both the X and Y channels, the frequency is markedly higher from about 350 to 950 s into the descent, slowing down thereafter. The amplitudes, however, are similar throughout the descent for both the X and Y channels. The data in the Z direction are shown in panel (a). Unlike those of the other channels, the readings in the Z direction do not oscillate around the value of 0 µT, but instead remain near −5 µT after the initial moments of the descent, indicating that the compass direction of the Z-axis remained relatively steady during the rapid descent, flipping only upon impact as inferred from the vertical accelerometer channel.
High-passed filtered channels are shown in Figure 17, with their corresponding estimated short-term Fourier transforms in Figure 18. The waveform plot amplitudes are normalized relative to the maximum values. The three main stages of the Skyfall are clear in all channels: initiation, transition to troposphere, and ground impact. The accelerometer, gyroscope, and magnetometer provide a cumulative nine channels of data and can be integrated with the high-resolution height estimates from the barometer to provide a cohesive Skyfall narrative with a high level of confidence. The signal fusion reveals that throughout the flight and descent, the payload was in a flat spin along the vertical axis, with different rates of rotation at different stages: slow before descent, frantic (>10 rad/s) in the stratosphere, and slowing down in the thermosphere. The payload only tumbled twice: at the onset of Skyfall and after ground impact. The impact was abrupt but relatively moderate at <10G due to the parachute reaching stability before landfall. All channels show an interesting transition as the S10 enters the troposphere, where it is hit by strong shear winds and where the parachute may have malfunctioned. Although it would be interesting to zoom into the tropopause penetration stage around the 950s timeline, it will substantially increase the length of the manuscript to no clear advantage. The reader is welcome to explore the data and tools at their disposal.
The tonal structure in the spectra in the rotation-sensitive channels (Figure 18) is a measure of the flat-spin rotation frequency, and there is no evidence for tumbling outside the initial and terminal states. The spectra also support the narrative that the payload tumbles only briefly after release and after impact.
The gyroscope spectra reinforce the time-domain representation, as expected. More interestingly, the X and Y components of the magnetometer spectrograms confirm the ~2 Hz maximum revolution rate of the payload in the stratosphere obtained from the gyroscope. The magnetometer was sampled at ~100 Hz, with a Nyquist frequency at 50 Hz. The base-2 logarithm (bits) [56] of the spectral magnitude of the X component of the magnetometer is shown in Figure 19. The peak spectral magnitude envelope matches the vertical component of the gyroscope in Figure 15, with a peak revolution rate of ~ 2 Hz. The flat spin loses its speed and stability after 950s when it enters the troposphere, as evidenced by the smearing of the spectral energy to lower frequencies. It would be possible to further decrease the uncertainties in rotation speeds with signal fusion in the frequency domain if desired. For example, standardized multiresolution time-frequency representations [56] would increase the temporal resolution of the lower frequency bands and permit direct comparison between signal modalities.
Raw data and Python code are provided to reconstruct the results in this paper, as well as produce additional results not presented herein. The reader is welcome to explore these openly available data and software to search within the various intriguing spectral patterns for each channel.

5. Skyfall Summary

Fusion of the Bounder and smartphone signals permitted the reconstruction of a cohesive Skyfall chronology. At the beginning of the record, the balloon is ascending through the stratosphere with the payload slowly spinning about its vertical axis. The Skyfall event begins with the dropping of the payload and substantial movement and rotation along all axes. After the initial tumble, the payload settles into a flat spin. The fastest descent occurred during the initial freefall through the thin stratosphere, where the parachute has little to work with. The second Skyfall stage corresponds to penetration into the troposphere and a reduction in rotational motion of the payload enclosure. The Skyfall terminates with impact on the ground, with high transient amplitudes on all channels. The final minutes of the record show that the payload enclosure flipped upside down and remained static, awaiting recovery and redeployment.
In the design and interpretation of multi-sensor experiments, it is useful to consider separately the absolute and differential responses of the sensor systems. The absolute response can provide useful, complementary information of a station position relative to Earth’s natural coordinate frame; e.g., gravity (up-down), magnetic north (left-right), and pressure (height). The absolute response can be readily used to verify sensor performance before and after deployment, and it grounds the signals to the physical world. The differential response yields useful information about rates of change, and strongly depends on the signal’s sampling rate. Interpretation of differential signals requires more knowledge of digital signal processing and filter implementation. For example, if a station is not moving, the absolute response of a sensor could be removed by detrending. However, if a station is moving, it is preferrable to high-pass filter the signal, with special care taken near the edge of the record. Changes in the absolute (DC) value of the signal will appear as transients, which should be interpreted with care. Rotation rate can be inferred from accelerometer, magnetometer, and gyroscopes, and should provide complementary results in the time and frequency (Fourier) domains. Vertical oscillations would be observable in accelerometers, barometers, and, if sufficiently fast, microphones. Persistent, stable fluctuations in differential (high-passed) signals may be clearer in the frequency domain. These useful signal processing methods are provided as examples in the Skyfall repository [51].

6. Concluding Remarks

The multi-sensor data models we presented are intended to facilitate collection and engagement from professionals and citizen scientists that wish to use and develop smartphone IoT capabilities. This paper shows how to use an SDK to access API fields and process the heterogeneous multimodal signals typically available in a smartphone. Raw data and Python open-source software are available in [50,51,52,53,54,55,56,57] to reproduce the results.
This first-of-kind smartphone deployment in a high-altitude balloon and parachute to the ground provided useful and verifiable signals [23] that can be used for explosion monitoring IoT. This is the first scientific study of an extreme smartphone data collection and drop test from stratospheric altitudes, and it presents smartphones as viable IoT platforms for the collection of geophysical and environmental data.
There is an abundance of fine structure within the Skyfall records and their spectra that can be explored by the interested reader, as all data and software are openly available. Ongoing and future research will use these frameworks and methods to study signals of interest on Earth and beyond.

Author Contributions

Conceptualization, M.A.G., D.B. and C.Z.; methodology, software, A.C., T.Y. and M.C.; validation and analysis, B.W., M.C., S.T. and S.P.; resources, D.B. and C.Z.; data curation, T.Y. and M.C.; writing—original draft preparation, M.A.G.; writing—review and editing, M.A.G., D.B., C.Z., A.C., T.Y., B.W., M.C., S.T. and S.P.; supervision, M.A.G. All authors have read and agreed to the published version of the manuscript.

Funding

This work was supported by the Department of Energy National Nuclear Security Administration under Award Numbers DE-NA0003920 (MTV) and DE-NA0003921 (ETI).

Disclaimer

This report was prepared as an account of work sponsored by agencies of the United States Government. Neither the United States Government nor any agency thereof, nor any of their employees, makes any warranty, express or implied, or assumes any legal liability or responsibility for the accuracy, completeness, or usefulness of any information, apparatus, product, or process disclosed, or represents that its use would not infringe privately owned rights. Reference herein to any specific commercial product, process, or service by trade name, trademark, manufacturer, or otherwise does not necessarily constitute or imply its endorsement, recommendation, or favoring by the United States Government or any agency thereof. The views and opinions of authors expressed herein do not necessarily state or reflect those of the United States Government or any agency thereof. The United States Government is authorized to reproduce and distribute reprints for Governmental purposes notwithstanding any copyright notation thereon. Sandia National Laboratories is a multimission laboratory managed and operated by National Technology & Engineering Solutions of Sandia, LLC, a wholly owned subsidiary of Honeywell International Inc., for the U.S. Department of Energy’s National Nuclear Security Administration under contract DE-NA0003525.

Institutional Review Board Statement

Not applicable.

Informed Consent Statement

Not applicable.

Data Availability Statement

All data, code, and methods are provided in [50,51,52,53,54,55,56,57].

Acknowledgments

The authors are thankful to contributions from J. Tobin and Y. Hatanaka while they were graduate students at ISLA. We are also grateful to K. McLin for his assistance in the recovery of the balloon, and to anonymous reviewers who helped improve the manuscript.

Conflicts of Interest

The authors declare no conflict of interest. The funders had no role in the design of the study; in the collection, analyses, or interpretation of data; in the writing of the manuscript, or in the decision to publish the results.

References

  1. El, M.A.; Boulmalf, M. Smartphone: The Ultimate IoT and IoE Device. In Smartphones from an Applied Research Perspective; IntechOpen: London, UK, 2017. [Google Scholar] [CrossRef] [Green Version]
  2. Smith, R.; Palin, D.; Philokypros, P.; Ioulianou, V.; Vassilakis, G.; Siamak, F. Shahandashti (2020) Battery draining attacks against edge computing nodes in IoT networks. Cyber-Phys. Syst. 2020, 6, 96–116. [Google Scholar] [CrossRef]
  3. Liu, M.A. Study of Mobile Sensing Using Smartphones. Int. J. Distrib. Sens. Netw. 2013, 9, 272916. [Google Scholar] [CrossRef] [Green Version]
  4. Manivannan, A.; Chin, W.C.B.; Barrat, A.; Bouffanais, R. On the Challenges and Potential of Using Barometric Sensors to Track Human Activity. Sensors 2020, 20, 6786. [Google Scholar] [CrossRef] [PubMed]
  5. Pinto, J.F.; de Silva, H.P.; Melo, F.; Fred, A. ScientIST: Biomedical Engineering Experiments Supported by Mobile Devices, Cloud and IoT. Signals 2020, 1, 110–120. [Google Scholar] [CrossRef]
  6. Daskalos, A.-C.; Theodoropoulos, P.; Spandonidis, C.; Vordos, N. Wearable Device for Observation of Physical Activity with the Purpose of Patient Monitoring Due to COVID-19. Signals 2022, 3, 11–28. [Google Scholar] [CrossRef]
  7. Abreu, M.; Carmo, A.S.; Franco, A.; Parreira, S.; Vidal, B.; Costa, M.; Peralta, A.R.; da Silva, H.P.; Bentes, C.; Fred, A. Mobile Applications for Epilepsy: Where Are We? Where Should We Go? A Systematic Review. Signals 2022, 3, 40–65. [Google Scholar] [CrossRef]
  8. Vourgidis, I.; Maglaras, L.; Alfakeeh, A.S.; Al-Bayatti, A.H.; Ferrag, M.A. Use of Smartphones for Ensuring Vulnerable Road User Safety through Path Prediction and Early Warning: An In-Depth Review of Capabilities, Limitations and Their Applications in Cooperative Intelligent Transport Systems. Sensors 2020, 20, 997. [Google Scholar] [CrossRef] [Green Version]
  9. Subedi, S.; Pyun, J.-Y. A Survey of Smartphone-Based Indoor Positioning System Using RF-Based Wireless Technologies. Sensors 2020, 20, 7230. [Google Scholar] [CrossRef]
  10. Xia, H.; Wang, X.; Qiao, Y.; Jian, J.; Chang, Y. Using Multiple Barometers to Detect the Floor Location of Smart Phones with Built-in Barometric Sensors for Indoor Positioning. Sensors 2015, 15, 7857–7877. [Google Scholar] [CrossRef]
  11. Wheatland, M.S.; Murphy, T.; Naoumenko, D.; van Schijndel, D.; Katsifis, G. The mobile phone as a free-rotation laboratory. Am. J. Phys. 2021, 89, 342–348. [Google Scholar] [CrossRef]
  12. Hellesund, S. Measuring Earth’s Magnetic Field Using a Smartphone Magnetometer. arXiv 2018, arXiv:1901.00857. [Google Scholar]
  13. Odenwald, S. Smartphone Sensors for Citizen Science Applications: Radioactivity and Magnetism. Citiz. Sci. Theory Pract. 2019, 4, 18. [Google Scholar] [CrossRef] [Green Version]
  14. Odenwald, S. Smartphone Sensors for Citizen Science Applications: Light and Sound. Citiz. Sci. Theory Pract. 2020, 5, 13. [Google Scholar] [CrossRef]
  15. Odenwald, S.F. Can smartphones detect geomagnetic storms? Space Weather. 2021, 19, e2020SW002669. [Google Scholar] [CrossRef]
  16. Minson, S.E.; Brooks, B.A.; Glennie, C.L.; Murray, J.R.; Langbein, J.O.; Owen, S.E.; Heaton, T.H.; Iannucci, R.A.; Hauser, D.L. Crowdsourced earthquake early warning. Sci. Adv. 2015, 1, e1500036. [Google Scholar] [CrossRef] [Green Version]
  17. Kong, Q.; Allen, R.M.; Schreier, L.; Kwon, Y.W. MyShake: A smartphone seismic network for earthquake early warning and beyond. Sci. Adv. 2016, 2, e1501055. [Google Scholar] [CrossRef] [Green Version]
  18. Allen, R.M.; Kong, Q.; Martin-Short, R. The MyShake Platform: A Global Vision for Earthquake Early Warning. Pure Appl. Geophys. 2020, 177, 1699–1712. [Google Scholar] [CrossRef] [Green Version]
  19. Poll, Z. There’s an earthquake Coming! The New Yorker, Annals of Technology. 10 August 2021. Available online: https://www.newyorker.com/tech/annals-of-technology/theres-an-earthquake-coming (accessed on 22 February 2022).
  20. Garcés, M.A. Ubiquitous Waveform Sensing; Infrasound, NNSA Review of Monitoring Research (RMR): Albuquerque, NM, USA, 2014. [Google Scholar]
  21. Takazawa, S.; Garcés, M.A.; Giraldo, L.O.; Hix, J.; Watson, S.; Chichester, D.; Zeiler, C. Explosion Data Fusion of Acoustic, Barometric, and Accelometric Data Collected on Smartphones; NNSA University Program Review (UPR): Atlanta, GA, USA, 2021. [Google Scholar]
  22. Tonga Blast Recorded by Smartphones, University of Hawaii SOEST News. 10 February 2022. Available online: https://www.soest.hawaii.edu/soestwp/announce/news/tonga-blast-recorded-by-smartphones/ (accessed on 22 February 2022).
  23. Popenhagen, S.; Garcés, M.A.; Bowman, D.; Zeiler, C. Analysis of Explosion Data Collected on an Airborne Platform; NNSA University Program Review (UPR): Atlanta, GA, USA, 2021. [Google Scholar]
  24. Bowman, D.; Lees, J.; Cutts, J.; Komjathy, A.; Young, E.; Seiffert, K.; Boslough, M.; Arrowsmith, S. Geoacoustic observations on drifting balloon-borne sensors. In Infrasound Monitoring for Atmospheric Studies; Le Pinchon, A., Blanc, E., Hauchecorne, A., Eds.; Springer: Cham, Switzerland, 2019; Chapter 4. [Google Scholar]
  25. Chichester, D.L.; Cardenas, E.S.; Asmar, K.; Christe, A.J.; Garcés, M.A.; Watson, S.M.; Holschuh, T.V.; Reichardt, T.; Maceira, M. Initial Assessment of Infrasound Signatures Tied to Nuclear Facility Operations. In Proceedings of the Institute of Nuclear Materials Management (INMM) 60th Annual Meeting, Palm Desert, CA, USA, 14–18 July 2019. [Google Scholar]
  26. Samsung Galaxy S10 Specifications. Available online: https://www.samsung.com/global/galaxy/galaxy-s10/specs/ (accessed on 22 February 2022).
  27. RedVox for Android on the Google Play Store. Available online: https://play.google.com/store/apps/details?id=io.redvox.InfraSoundRecorder&hl=en (accessed on 22 February 2022).
  28. RedVox for iOS and M1 Chip on Apple App Store. Available online: https://apps.apple.com/sz/app/redvox-recorder/id969566810 (accessed on 22 February 2022).
  29. Brown, R.; Evans, L. Acoustics and the smartphone. In Proceedings of the ACOUSTICS, Gold Coast, Australia, 2–4 November 2011. [Google Scholar]
  30. Wagner, R.P.; Fick, S.E. Pressure reciprocity calibration of a MEMS microphone. J. Acoust. Soc. Am. 2017, 142, EL251–EL257. [Google Scholar] [CrossRef] [Green Version]
  31. Ko, W.H. Trends and frontiers of MEMS. Sens. Actuators A 2017, 136, 62–67. [Google Scholar] [CrossRef]
  32. Kardous, C.A.; Shaw, P.B. Evaluation of smartphone sound measurement applications. J. Acoust. Soc. Am. 2014, 135, EL186–EL192. [Google Scholar] [CrossRef] [Green Version]
  33. Kardous, C.A.; Shaw, P.B. Evaluation of smartphone sound measurement application (apps) using external microphones—A follow-up study. J. Acoust. Soc. Am. 2016, 140, EL327–EL333. [Google Scholar] [CrossRef] [PubMed] [Green Version]
  34. Faber, B.M. Acoustical measurements with smartphones: Possibilities and limitations. Acoust. Today 2017, 13, 10–17. [Google Scholar]
  35. Asmar, K.; Garcés, M.A.; Williams, B. A method for estimating the amplitude response of smartphone built-in microphone sensors below 4 kHz. J. Acoust. Soc. Am. 2019, 146, 172. [Google Scholar] [CrossRef] [PubMed]
  36. Asmar, K.; Garcés, M.A.; Hart, D.; Williams, B. Digital acoustic sensor performance across the infrasound range in non-isolated conditions. J. Acoust. Soc. Am. 2018, 144, 3036. [Google Scholar] [CrossRef] [PubMed]
  37. Garcés, M.A. Evolution of Distributed Infrasound Sensor Networks. In Proceedings of the CTBTO Infrasound Technology Workshop, Vienna, Austria, 12–15 October 2015. [Google Scholar]
  38. Asmar, K.; Garcés, M.A.; Schnurr, J.; Christe, A. Surf infrasound recorded with smartphones during the 2016 Eddie Aikau, Acoustical Society of America and Acoustical Society of Japan. In Proceedings of the 5th Joint Meeting, Honolulu, HI, USA, 28 November–2 December 2016. [Google Scholar]
  39. Christe, A.; Garcés, M.A.; Asmar, K.; Magana-Zook, S.; Gaylord, J.; Chichester, D. Enabling Multi-Informatics for Nuclear Operation Scenarios via a Scalable and Data Agnostic Framework. In Proceedings of the NNSA CVT Workshop, Ann Arbor, MI, USA, 31 October–1 November 2019. [Google Scholar]
  40. Cardenás, E.S.; Garcés, M.A.; Watson, S.M.; Johnson, J.T.; Hix, J.D.; Chichester, D.L. Persistent Acoustic Sensing for Monitoring a Reactor Facility, Institute for Nuclear Materials Management (INMM). In Proceedings of the 62nd Annual Meeting, Vienna, Austria, 17–21 September 2021; Available online: https://resources.inmm.org/annual-meeting-proceedings/persistent-acoustic-sensing-monitoring-reactor-facility (accessed on 22 February 2022).
  41. Takazawa, S.; Garcés, M.A. Deep Learning for Extracting Scaled Distances from Synthetic Explosions. In Proceedings of the Enabling Technologies and Innovation (ETI) Workshop, Atlanta, GA, USA, 5–6 November 2019. [Google Scholar]
  42. Takazawa, S.; Garcés, M.A.; Giraldo, L.O.; Hix, J.; Watson, S.; Chichester, D. Towards explosive signal classification at the edge. In Proceedings of the University Program Review (UPR) 2021, Atlanta, GA, USA, 8–10 September 2021. [Google Scholar]
  43. Tobin, J.; Garcés, M.A.; Chichester, D. Inferring UAV Position Relative to Smartphone Sensors Based on Acoustic Characteristics. In Proceedings of the Monitoring, Technology and Verification (MTV) Workshop, Ann Arbor, MI, USA, 29–31 March 2021. [Google Scholar]
  44. Asmar, K.; Garcés, M.A.; Schnurr, J.; Christe, A. Rocket infrasound signatures recorded with smartphones. In Proceedings of the Consortium for Verification Technology (CVT) Workshop, Ann Arbor, MI, USA, 19–20 October 2016. [Google Scholar]
  45. Popenhagen, S.; Garcés, M.A. Rocket Ignition Detection Using Data Collected by Smartphones. In Proceedings of the Monitoring, Technology and Verification (MTV) Workshop, Ann Arbor, MI, USA, 29–31 March 2021. [Google Scholar]
  46. Schnurr, J.; Garcés, M.A.; Christe, A. Cosmos supersonic reentry analysis: A case study using traditional and mobile infrasound arrays, Acoustical Society of America and Acoustical Society of Japan. In Proceedings of the 5th Joint Meeting, Honolulu, HI, USA, 28 November–2 December 2016. [Google Scholar]
  47. Bowman, D.C.; Lees, J.M. A comparison of the ocean microbarom recorded on the ground and in the stratosphere. J. Geophys. Res. Atmos. 2017, 122, 9773–9782. [Google Scholar] [CrossRef]
  48. Krishnamoorthy, S.; Komjathy, A.; Pauken, M.T.; Cutts, J.A.; Garcia, R.F.; Mimoun, D.; Cadu, A.; Sournac, A.; Jackson, J.M.; Lai, V.H.; et al. Detection of Artificially Generated Seismic Signals Using Balloon-Borne Infrasound Sensors. Geophys. Res. Lett. 2018, 45, 3393–3403. [Google Scholar] [CrossRef] [Green Version]
  49. Brissaud, Q.; Krishnamoorthy, S.; Jackson, J.M.; Bowman, D.C.; Komjathy, A.; Cutts, J.A.; Zhan, Z.; Pauken, M.T.; Izraelevitz, J.S.; Walsh, G.J. The first detection of an earthquake from a balloon using its acoustic signature. Geophys. Res. Lett. 2021, 48, e2021GL093013. [Google Scholar] [CrossRef] [PubMed]
  50. Skyfall Raw Data Available from the Collection of Event Reports at RedVox.io Analysis/Featured Events. Available online: https://redvox.io/#/reports/3f3f (accessed on 22 February 2022).
  51. Skyfall GitHub Repository with Bounder Data. Available online: https://github.com/RedVoxInc/Skyfall (accessed on 22 February 2022).
  52. RedVox Application Programming Interface (API). Available online: https://github.com/RedVoxInc/redvox-api-1000 (accessed on 22 February 2022).
  53. RedVox Software Developer Kit (SDK). Available online: https://github.com/RedVoxInc/redvox-python-sdk (accessed on 22 February 2022).
  54. RedVox-Pandas Framework. Available online: https://github.com/RedVoxInc/redpandas (accessed on 22 February 2022).
  55. McKinney, W. Data structures for statistical computing in python. In Proceedings of the 9th Python in Science Conference, Austin, TX, USA, 28 June–3 July 2018; pp. 51–56. Available online: https://pypi.org/project/pandas/ (accessed on 22 February 2022).
  56. Garcés, M.A. Quantized constant-Q Gabor atoms for sparse binary representations of cyber-physical signatures. Entropy 2020, 22, 936. Available online: https://github.com/RedVoxInc/libquantum#libquantum (accessed on 22 February 2022). [CrossRef]
  57. Takazawa, S. Weighted Wavelet Z-Transform. Available online: https://github.com/RedVoxInc/libwwz (accessed on 22 February 2022).
  58. Totex Corporation Meteorological Balloon. Available online: https://totex.info/hinmoku_kikyu_e.html (accessed on 22 February 2022).
  59. Balloon Ascent Technologies HAB Bounder Balloon Cut-Down Device. Available online: https://loonatec.com/blog/wp-content/uploads/2020/09/HAB_Bounder_User_Guide_rev5.pdf (accessed on 22 February 2022).
  60. Rocketman Parachutes. Available online: https://the-rocketman.com/ (accessed on 22 February 2022).
  61. High Altitude Science StratoTrack APRS. Available online: https://www.highaltitudescience.com/products/stratotrack-aprs-transmitter (accessed on 22 February 2022).
  62. Globalstar SPOT Trace. Available online: https://www.globalstar.com/en-us/products/spot-for-business/spot-trace (accessed on 22 February 2022).
  63. Google Android Platform API. Available online: https://developer.android.com/reference (accessed on 22 February 2022).
  64. Google Protocol Buffers. Available online: https://developers.google.com/protocol-buffers (accessed on 22 February 2022).
  65. RedVox Cloud Service. Available online: https://www.redvox.io/#/home (accessed on 22 February 2022).
  66. ST Microelectronics LPS22HH Barometer Specifications. Available online: https://www.st.com/resource/en/datasheet/lps22hh.pdf (accessed on 22 February 2022).
  67. ST Microelectronics LSM6DSO Accelerometer and Gyroscope Specifications. Available online: https://www.st.com/resource/en/datasheet/lsm6dso.pdf (accessed on 22 February 2022).
  68. Asahi Kasei Microdevices (AKM) AK09918 3-Axis Electronic Compass Specifications. Available online: https://www.akm.com/content/dam/documents/products/electronic-compass/ak09918c/ak09918c-en-datasheet.pdf (accessed on 22 February 2022).
  69. Tian, C.; Jiang, H.; Liu, X.; Wang, X.; Liu, W.; Wang, Y. Tri-Message: A Lightweight Time Synchronization Protocol for High Latency and Resource-Constrained Networks. In Proceedings of the IEEE International Conference on Communications, Dresden, Germany, 14–18 June 2009; pp. 1–5. [Google Scholar] [CrossRef]
  70. Rhee, I.-K.; Lee, J.; Kim, J.; Serpedin, E.; Wu, Y.-C. Clock Synchronization in Wireless Sensor Networks: An Overview. Sensors 2009, 9, 56–85. [Google Scholar] [CrossRef] [Green Version]
  71. Faizullin, M.; Kornilova, A.; Akhmetyanov, A.; Ferrer, G. Twist-n-Sync: Software Clock Synchronization with Microseconds Accuracy Using MEMS-Gyroscopes. Sensors 2021, 21, 68. [Google Scholar] [CrossRef]
  72. Desjardins, S.H.; Laananen, D.H.; Singley, G.T., III. Aircraft Crash Survival Design Guide; USARTL-TR-79-22A; Applied Technology Laboratory, US Army Research and Technology Laboratories (AVRADCOM): Ft. Eustis, VA, USA, 1979. [Google Scholar]
Figure 1. A meteorological balloon carrying infrasound sensors in a PolarTech insulated shipping container in 2015. The parachute is visible between the box and the balloon. The Skyfall set-up is very similar to the one shown and described here.
Signals 03 00014 g001
Figure 2. Landing site, with payload box flipped upside down on the lower right and the parachute (blue and red) tangled with balloon shreds in the upper left.
Signals 03 00014 g002
Figure 3. Balloon trajectory for complete event. The Skyfall case study concentrates on the rapid descent from its peak height.
Signals 03 00014 g003
Figure 4. Comparison of the (a) height above the ellipsoid and (b) absolute pressure in the Bounder and S10.
Signals 03 00014 g004
Figure 5. Reference frame for three-component (3C) smartphone sensors.
Signals 03 00014 g005
Figure 6. Comparison between Bounder and smartphone location.
Signals 03 00014 g006
Figure 7. Timing synchronization framework showing (a) the estimated round-trip sync exchange latency in milliseconds, (b) the station clock offset correction from the reference clock in seconds, and (c) location height above ground in km.
Signals 03 00014 g007
Figure 8. Bounder height chronology relative to the end of the record.
Signals 03 00014 g008
Figure 9. Bounder speed estimated from position.
Signals 03 00014 g009
Figure 10. (a) Range, (b) altitude, and (c) speed inferred from the phone location framework. It did not report during the fastest descent, but it performed adequately below 20 km. The descent speed was in excess of ~20 m/s in the upper troposphere until it reached the lower troposphere.
Signals 03 00014 g010
Figure 11. Power status during Skyfall descent showing (a) height inferred from the barometer pressure during fall, (b) temperature, and (c) remaining battery percentage.
Signals 03 00014 g011
Figure 12. Sensor payloads for (a) audio, (b) Z-component acceleration, and (c) height inferred from barometric pressure.
Signals 03 00014 g012
Figure 13. Sensor payloads for (a) audio, (b) high-pass filtered Z-component of acceleration, and (c) high-pass filtered barometric pressure.
Signals 03 00014 g013
Figure 14. Acceleration channel payload for (a) Z-direction component, (b) Y-direction component, and (c) X-direction component.
Signals 03 00014 g014
Figure 15. Gyroscope channel payload for (a) Z-axis component, (b) Y-axis component, and (c) X-axis component. The maximum rotation rate is 2.14 rotations/s (~2.14 Hz) about the Z-axis.
Signals 03 00014 g015
Figure 16. Magnetometer channel payload for (a) Z-direction component, (b) Y-direction component, and (c) X-direction component.
Signals 03 00014 g016
Figure 17. High-pass filtered (hp) waveforms for sensors: audio, barometer (Bar), accelerometer (Acc), gyroscope (Gyr), and magnetometer (Mag). X-Y-Z coordinates are shown in Figure 5. The vertical axes are normalized to the peak absolute magnitude of each channel.
Signals 03 00014 g017
Figure 18. Short-term Fourier transforms of high-pass filtered (hp) waveforms for sensors: audio, barometer (Bar), accelerometer (Acc), gyroscope (Gyr), and magnetometer (Mag). The color scales to the maximum amplitude. The vertical axes represent logarithmic frequency in hertz to the sensor Nyquist. The standardized minimum frequency scales with the record duration and the sample rate [56].
Signals 03 00014 g018
Figure 19. Short-term Fourier transforms of high-pass filtered (hp) waveforms for the X component of the magnetometer (Mag); the Y component is nearly identical.
Signals 03 00014 g019
Table 1. Bounder Event Information.
DescriptionValue
Start Date Time2020-10-27 13:45:00
Start Epoch s1603806300
Start Latitude degrees36.07616
Start Longitude degrees−115.62339
Start Altitude m (WGS-84)35538
Stop Date Time2020-10-27 14:16:00
Start Epoch s1603808160
Stop Latitude degrees35.83728
Stop Longitude degrees−115.57234
Table 2. Bounder Location Sensor.
DescriptionFieldUnits
PresAtmospheric pressurehPa = mbar
Lon /LatGNSS longitude and latitudedegree decimal
AltGNSS altitude above ellipsoidmeters
DateGNSS dateYYYYMMDD
TimeGNSS timeHH:MM:SS
Sample Interval1.004, Derived from Timeseconds
Interval St Dev0.061, Derived from Timeseconds
Table 3. Smartphone Station Specifications.
DescriptionFieldValue
Station IDstation.id()1637610021
Makestation.metadata().makesamsung
Modelstation.metadata().modelSM-G973U1
OSstation.metadata().osANDROID
OS Versionstation.metadata().os_version10
App Versionstation.metadata().app_version2.6.20
SDK Versiondatawindow.sdk_version3.0.0rc37
Table 4. Station and Event Date.
DescriptionFieldEpoch sHuman UTC
Station Start Date 1station.start_date()16037192812020-10-26 13:34:41
Event Start Datestation.first_data_timestamp()16038063142020-10-27 13:45:14
Event End Datestation.last_data_timestamp()16038081142020-10-27 14:15:14
1 Not available before v.2.6.3.
Table 5. Audio Sensor.
DescriptionFieldValue
Sensor Namestation.audio_sensor().nameI/INTERNAL MIC
Nominal Rate Hzstation.audio_sample_rate_nominal_hz()8000.0
Sample Rate Hzstation.audio_sensor().sample_rate_hz()8000.043426
Sample Interval sstation.audio_sensor().sample_interval_s()0.000124999
Interval Dev sstation.audio_sensor().sample_interval_std_s()0.000000052
Table 6. Barometer Sensor.
DescriptionFieldValue
Sensor Namestation.barometer_sensor().nameLPS22HH
Barometer
Sample Rate Hzstation.barometer_sensor().sample_rate_hz()24.40309971
Sample Interval sstation.barometer_sensor().sample_interval_s()0.040978401
Interval Dev sstation.barometer_sensor().sample_interval_std_s()0.006281194
Table 7. Accelerometer Sensor.
DescriptionFieldValue
Sensor Namestation.accelerometer_sensor().nameLSM6DSO
Accelerometer
Sample Rate Hzstation.accelerometer_sensor().sample_rate_hz()401.0575129
Sample Interval sstation.accelerometer_sensor().sample_interval_s()0.002493408
Interval Dev sstation.accelerometer_sensor().sample_interval_std_s()0.001007224
Table 8. Gyroscope Sensor.
DescriptionFieldValue
Sensor Namestation.gyroscope_sensor().nameLSM6DSO
Gyroscope
Sample Rate Hzstation.gyroscope_sensor().sample_rate_hz()401.057526
Sample Interval sstation.gyroscope_sensor().sample_interval_s()0.002493408
Interval Dev sstation.gyroscope_sensor().sample_interval_std_s()0.000992285
Table 9. Magnetometer Sensor.
DescriptionFieldValue
Sensor Namestation.magnetometer_sensor().nameAK09918
Magnetometer
Sample Rate Hzstation.magnetometer_sensor().sample_rate_hz()100.1370283
Sample Interval sstation.magnetometer_sensor().sample_interval_s()0.009986316
Interval Dev sstation.magnetometer_sensor().sample_interval_std_s()0.001235985
Table 10. Smartphone Location Sensor.
DescriptionFieldValue
Sensor Namestation.location_sensor().nameGNSS
Sample Rate Hzstation.location_sensor().sample_rate_hz()0.709595563
Sample Interval sstation.location_sensor().sample_interval_s()1.409253456
Interval Dev sstation.location_sensor().sample_interval_std_s()12.22592513
Publisher’s Note: MDPI stays neutral with regard to jurisdictional claims in published maps and institutional affiliations.

