Article

Wearable Device for Observation of Physical Activity with the Purpose of Patient Monitoring Due to COVID-19

by
Angelos-Christos Daskalos
1,2,*,
Panayiotis Theodoropoulos
2,*,
Christos Spandonidis
2 and
Nick Vordos
1
1
Biophysics Laboratory, Physics Department, International Hellenic University, 65404 Kavala, Greece
2
Prisma Electronics SA, 45 Agias Kyriakis, Palaio Faliro, Attiki, 17675 Athens, Greece
*
Authors to whom correspondence should be addressed.
Signals 2022, 3(1), 11-28; https://doi.org/10.3390/signals3010002
Submission received: 3 December 2021 / Revised: 22 December 2021 / Accepted: 27 December 2021 / Published: 6 January 2022
(This article belongs to the Special Issue Deep Learning and Transfer Learning)

Abstract

:
In late 2019, a new genre of coronavirus (COVID-19) was first identified in humans in Wuhan, China. In addition to this, COVID-19 spreads through droplets, so quarantine is necessary to halt the spread and to recover physically. This modern urgency creates a critical challenge for the latest technologies to detect and monitor potential patients of this new disease. In this vein, the Internet of Things (IoT) contributes to solving such problems. This paper proposed a wearable device that utilizes real-time monitoring to detect body temperature and ambient conditions. Moreover, the system automatically alerts the concerned person using this device. The alert is transmitted when the body exceeds the allowed temperature threshold. To achieve this, we developed an algorithm that detects physical exercise named “Continuous Displacement Algorithm” based on an accelerometer to see whether a potential temperature rise can be attributed to physical activity. The people responsible for the person in quarantine can then connect via nRF Connect or a similar central application to acquire an accurate picture of the person’s condition. This experiment included an Arduino Nano BLE 33 Sense which contains several other sensors like a 9-axis IMU, several types of temperature, and ambient and other sensors equipped. This device successfully managed to measure wrist temperature at all states, ranging from 32 °C initially to 39 °C, providing better battery autonomy than other similar devices, lasting over 12 h, with fast charging capabilities (500 mA), and utilizing the BLE 5.0 protocol for data wireless data transmission and low power consumption. Furthermore, a 1D Convolutional Neural Network (CNN) was employed to classify whether the user is feverish while considering the physical activity status. The results obtained from the 1D CNN illustrated the manner in which it can be leveraged to acquire insight regarding the health of the users in the setting of the COVID-19 pandemic.

1. Introduction

Since late 2019–early 2020, the World Health Organization (WHO) has declared the coronavirus pandemic, inducing a global coordinated effort to halt the spread of this particularly infectious virus. Typically, coronaviruses present with respiratory symptoms. Among those who become infected, some may not manifest any symptoms. Nevertheless, a considerable portion of the population develops symptoms with varying degrees of severity ranging from mild to extremely harsh and potentially even causing death. Symptoms may include respiratory symptoms, fever, cough, shortness of breath or breathing difficulties, fatigue, and sore throat. Some people might show more severe symptoms, thus being hospitalized, most often with pneumonia. Self-isolation is identified as an efficient measure to curb the spread to the virus, with multiple states and countries worldwide imposing quarantine. Fever is one of the most commonly observed symptoms of COVID-19. Therefore, quarantined people are advised to frequently check their body temperature. Another issue that comes up is that older people and children may be unable to acquire an accurate temperature reading. In this particularly challenging setting, new opportunities arise to develop IoT applications through intelligent healthcare/system/monitoring systems [1,2,3,4]. In this regard, a wearable device to enable temperature measuring and physical activity monitoring is extremely beneficial. It serves doctors to monitor their patients while also maintaining a satisfactory quality of life when they are quarantined. More specifically, quarantine imposed by doctors to inhibit the spread of COVID-19 may incite adverse consequences for the patients’ mental and physical health; thus, assisting people in quarantine, physical activity becomes essential [5]. To prevent acute or sustained adverse effects on the body’s metabolic, vascular, and musculoskeletal systems and protect the patient’s mental health, physical activity is a viable option for quarantined people to strengthen their overall health during that period further; hence, it is imperative to encourage quarantined patients to remain physically active. However, for the correct monitoring, it is integral to consider that increase of body temperature is caused by physical exercise; thus, it is necessary to properly adapt the pertinent thresholds to detect fever and alert the patient [6,7]. The Human Activity Recognition (HAR) algorithm is widely used for movement prediction based on sensor data by using machine and deep learning [8,9]. However, this methodology requires large data samples and is significantly more complicated than alternatives.
Working towards this direction, this study proposed a particularly low-power wearable device utilizing the Bluetooth Low energy 5.0 communication protocol, several temperature sensors including an MLX90614 IR Temperature sensor and an MCP High Accuracy Touch Temperature sensor, a 9-axis Inertial measurement unit, and a Real-Time Clock PCF8523 [10,11,12,13,14,15]. The proposed solution presents significant autonomy and decent accuracy to contain the spread of the virus at home.
This project aimed to develop a device capable of distinguishing between healthy and febrile conditions utilizing measurements from several temperature sensors while also considering whether the user is exercising. The proposed algorithm presented in Section 3 of the present study enables the detection of physical activity undertaken by the user wearing our device. Additionally, we introduce a Convolutional Neural Network classifier used to classify the samples regarding the patient’s condition, providing proof of the feasibility of our device being employed to identify the state of the patients’ health correctly. This implementation facilitates monitoring patients’ conditions remotely, providing a safe diagnosis tool for doctors and physicians.
This study is organized as follows. In Section 2, a critical review of recent literature is presented. In Section 3, the wearable is described providing the specifications of instrumental sensors for its development. Section 4 illustrates the system architecture while also providing significant benefits of the approach. Besides, the algorithmic process adopted is presented. Section 5 includes the results stemming from the present study. Lastly, in Section 6, concluding remarks and discussion on future research steps are provided.

2. Critical Literature Review

Due to the ever-increasing need for human supervision, the use of wearable devices has gained considerable ground for limiting COVID-19. Currently, large companies are investigating techniques to identify infected people and whether infected people are quarantined properly through wearable devices. Some of the projects that have been explicitly developed are listed below.
A portable integration of IoT devices was implemented for monitoring body temperature, room temperature in real-time through a notification, and an alert system for quarantined people [16]. The alarm is transmitted when the body temperature exceeds the permissible temperature. In addition, an accelerometer algorithm was developed that predicts whether the quarantine’s temperature rise is due to either immobility or normal movement and generates an output to infer whether the temperature is the result of physical exercise or not to adjust the temperature automatically.
The experiment included an M5stickC, a MEMS accelerometer, an infrared thermometer, and a digital temperature sensor. Indoor temperature and humidity are measures to limit the spread of the virus. The information is transmitted via WiFi and MQTT under normal conditions. When the WiFi signal is lost, Bluetooth transfers data from the isolated person, the electronic device of a family member, or a medical member. Evidence suggests that many sensors could be sued to develop fever monitoring applications, enable large-scale health monitoring, and provide high-temporal and accurate data on fever responses [17]. Findings from individuals, who reported COVID-19 infections, prove that relative increases in temperature are observable with portable devices and are associated with self-reported fever. Finally, the data support the hypothesis that disease prediction is possible using data continuously called by portable sensors.
Subsequently, in [18], the authors proposed a framework consisting of three components: a lightweight and low-cost IoT node, a smartphone application, and fog-based Machine learning tools for data analysis and diagnosis. In this project, several health parameters were considered and monitored, including body temperature, cough rate, respiratory rate, and blood oxygen saturation. A dedicated smartphone app displays the condition of the user, and, if deemed necessary, a corresponding message notifies the user to maintain social distancing. Additionally, in this study, a Fuzzy Mamdani system (running at the fog server) computes the risk of spreading the infection regarding several environmental factors along with the health status of the user. Two distinct cases are distinguished for the communication between the IoT node and the fog server, specifically 4G/5G/Wi-Fi or LoRa, depending on environmental constraints. Lastly, in the context of this study, the authors presented a comparative analysis with respect to the energy requirements and bandwidth for multiple use-cases.
Furthermore, a wearable monitoring device utilizing simple sensors and microcontrollers to track body temperature, heart rate, respiration rate, and other vital signs was presented in [19] in an attempt to detect COVID-19 symptoms. Additionally, in [20], the authors presented an affordable IoT-based application. This project’s focal point was to minimize the probability of COVID-19 transfer. Specifically, a system to check patients’ health status remotely was proposed, acquiring periodic measurements concerning the user’s vital sings. The proposed design was composed of diverse set of sensors designated to measure the user’s heart rate, blood oxygen level (MAX30100), and body temperature (MLX90164) connected to a microprocessor (ATmega 2560) by using the I2C protocol.
Lastly, an IoT-based solution was suggested to conduct vital signs monitoring and alert officials in the event of detecting COVID-19 symptoms [21]. The proposed design entails the acquisition of readings from various sensors and determining the best course of action needed in each instance. The regular temperature reading ranges from 36.5 °C to 37.1 °C, and SpO2 measurements greater than 95% are deemed as normal. In the case that the measured values exceed certain thresholds, health officials are notified accordingly. The entire methodology is automated, reducing time and complexity, and importantly allowing for immediate intervention from health officials to halt the spread of the virus. Table 1 summarizes our device’s used modules and implemented protocols, along with similar devices from pertinent literature.

3. Wearable Prototype

In the present study, the MEMS accelerometer undertook the acquisition of acceleration data, aiming to categorize the activity status of the user through the CDA model. Depending on this status, the temperature threshold was adjusted accordingly. More specifically, if physical exercise is detected, the fever threshold was increased by approximately 0.5–1.0 °C. Afterwards, in case of febrility, the alert message was automatically sent to the user. The most significant information was displayed through an OLED screen and also sent to the user’s cellphone via BLE. Using the central application allowed us to connect to the Wearable device and read the published services, which were updated and then published every 2 s, allowing us to continuously monitor the patient and keep an eye on each parameter. Figure 1 illustrates the prototype being worn, along with the interface providing information about the device’s sensors.

3.1. Overview of the Designed System

Figure 2 summarizes the entire operating procedures of the designed system. The IMU acquired the data, which were then processed through the CDA to determine if exercise occurred. If the exercising boolean variable was true, the temperature cut-off value was adjusted automatically. Meanwhile, the ambient temperature and humidity sensor collected room conditions. The alerts were transmitted when the body temperature surpassed the temperature cut-off value. The essential data could be viewed via the OLED display or remotely through the BLE application. The collected information could always be saved via the BLE logs or a serial monitor application. The code for this project was written by using the famous Arduino IDE [22].

3.2. Sensors

The additions will not only help to monitor COVID-19, but also other similar medical applications in general. All the sensors are embedded within the prototype device equipped by the user. The involved sensors in the experiment were the following. Two main communication protocols were used between the various sensors and modules, including: I2C [23,24] and SPI [25], besides the BLE 5.0.
  • The Arduino Nano 33 BLE Sense was the main microcontroller since it is a well-known form factor. It contains a 9-axis IMU rendering the board ideal for wearable devices.
  • The HTS221, which measures the ambient temperature and humidity, was embedded in the Arduino Nano 33 BLE Sense MCU.
  • The thermal body sensor MLX90614 was connected to the I2C bus, along with the MCP9808 touch temperature sensor, the Adafruit PCF8523 real-time clock, and the Sparkfun Battery Babysitter [26]. The device’s exact specifications are the following: The operating voltage is at 3.3 V with 1 M.B. (nRF52840) CPU Flash memory. The LiPo battery added to the device is rated at 450 mAh, ensuring up to 12 h of continuous usage. The MCU contains a 9-axis IMU, and the linear acceleration range is at ±2 g at a frequency of 104 Hz.
  • The Waveshare 1.3-inch OLED display, connected via SPI bus, displayed the essential information: Body touch temperature, body infrared temperature, ambient temperature, and ambient humidity. Furthermore, battery percentage, date, and time were displayed through the OLED display.
Although the MCP9809’s accuracy increases incrementally after initial contact with the body, the measurement uncertainty of the contact thermometer is unavoidable. Once the touch temperature sensor exceeds the threshold and no exercise is detected, the user should consider using the infrared temperature sensor to evaluate the readings. If both sensors exceed the threshold, then febrility is likely in this instance regardless of the exercising variable. Careful and repeated measurements must be taken to evaluate if someone is ill.

4. System Description

4.1. General Approach

Recently, the advent of IoT technologies has redefined health care analytics. Abnormal measurements play a prominent role in healthcare analytics [27,28]. An IoT node transmits the data through a Bluetooth connection. At that moment, a doctor or a person responsible for the patient can observe the temperature in correlation with the activity and judge the health situation.
Wearable activity trackers can provide unique insights and contribute to the early detection of COVID-19 cases [29] by monitoring patients using wearable devices. The ideal combination can be achieved with the wearable device and the usage of IoT for the health monitoring of people in isolation [30]. This study provided an activity recognition tool using a 9-axis IMU, which allows the variation of signals to reflect the human activity. The approach focuses on distinguishing between regular activity, so the CDA is proved effective.
Using several temperature sensors allowed us to track the temperature fluctuations because fever is one of the key symptoms of COVID-19. The contact thermometer was configured appropriately to monitor the user’s body temperature with great fidelity. It is deemed worthy to mention that in the beginning of the monitoring, the sensor required a few seconds to calibrate. The standard body temperature threshold was automatically adapted depending on the physical exercise status. An infrared thermometer is an indispensable sensor that quickly finds the users’ temperature but lacks precision [31]. This type of recognition allows the observer to keep track of the users’ temperature variations and find out if the temperature is due to physical exercise [32].
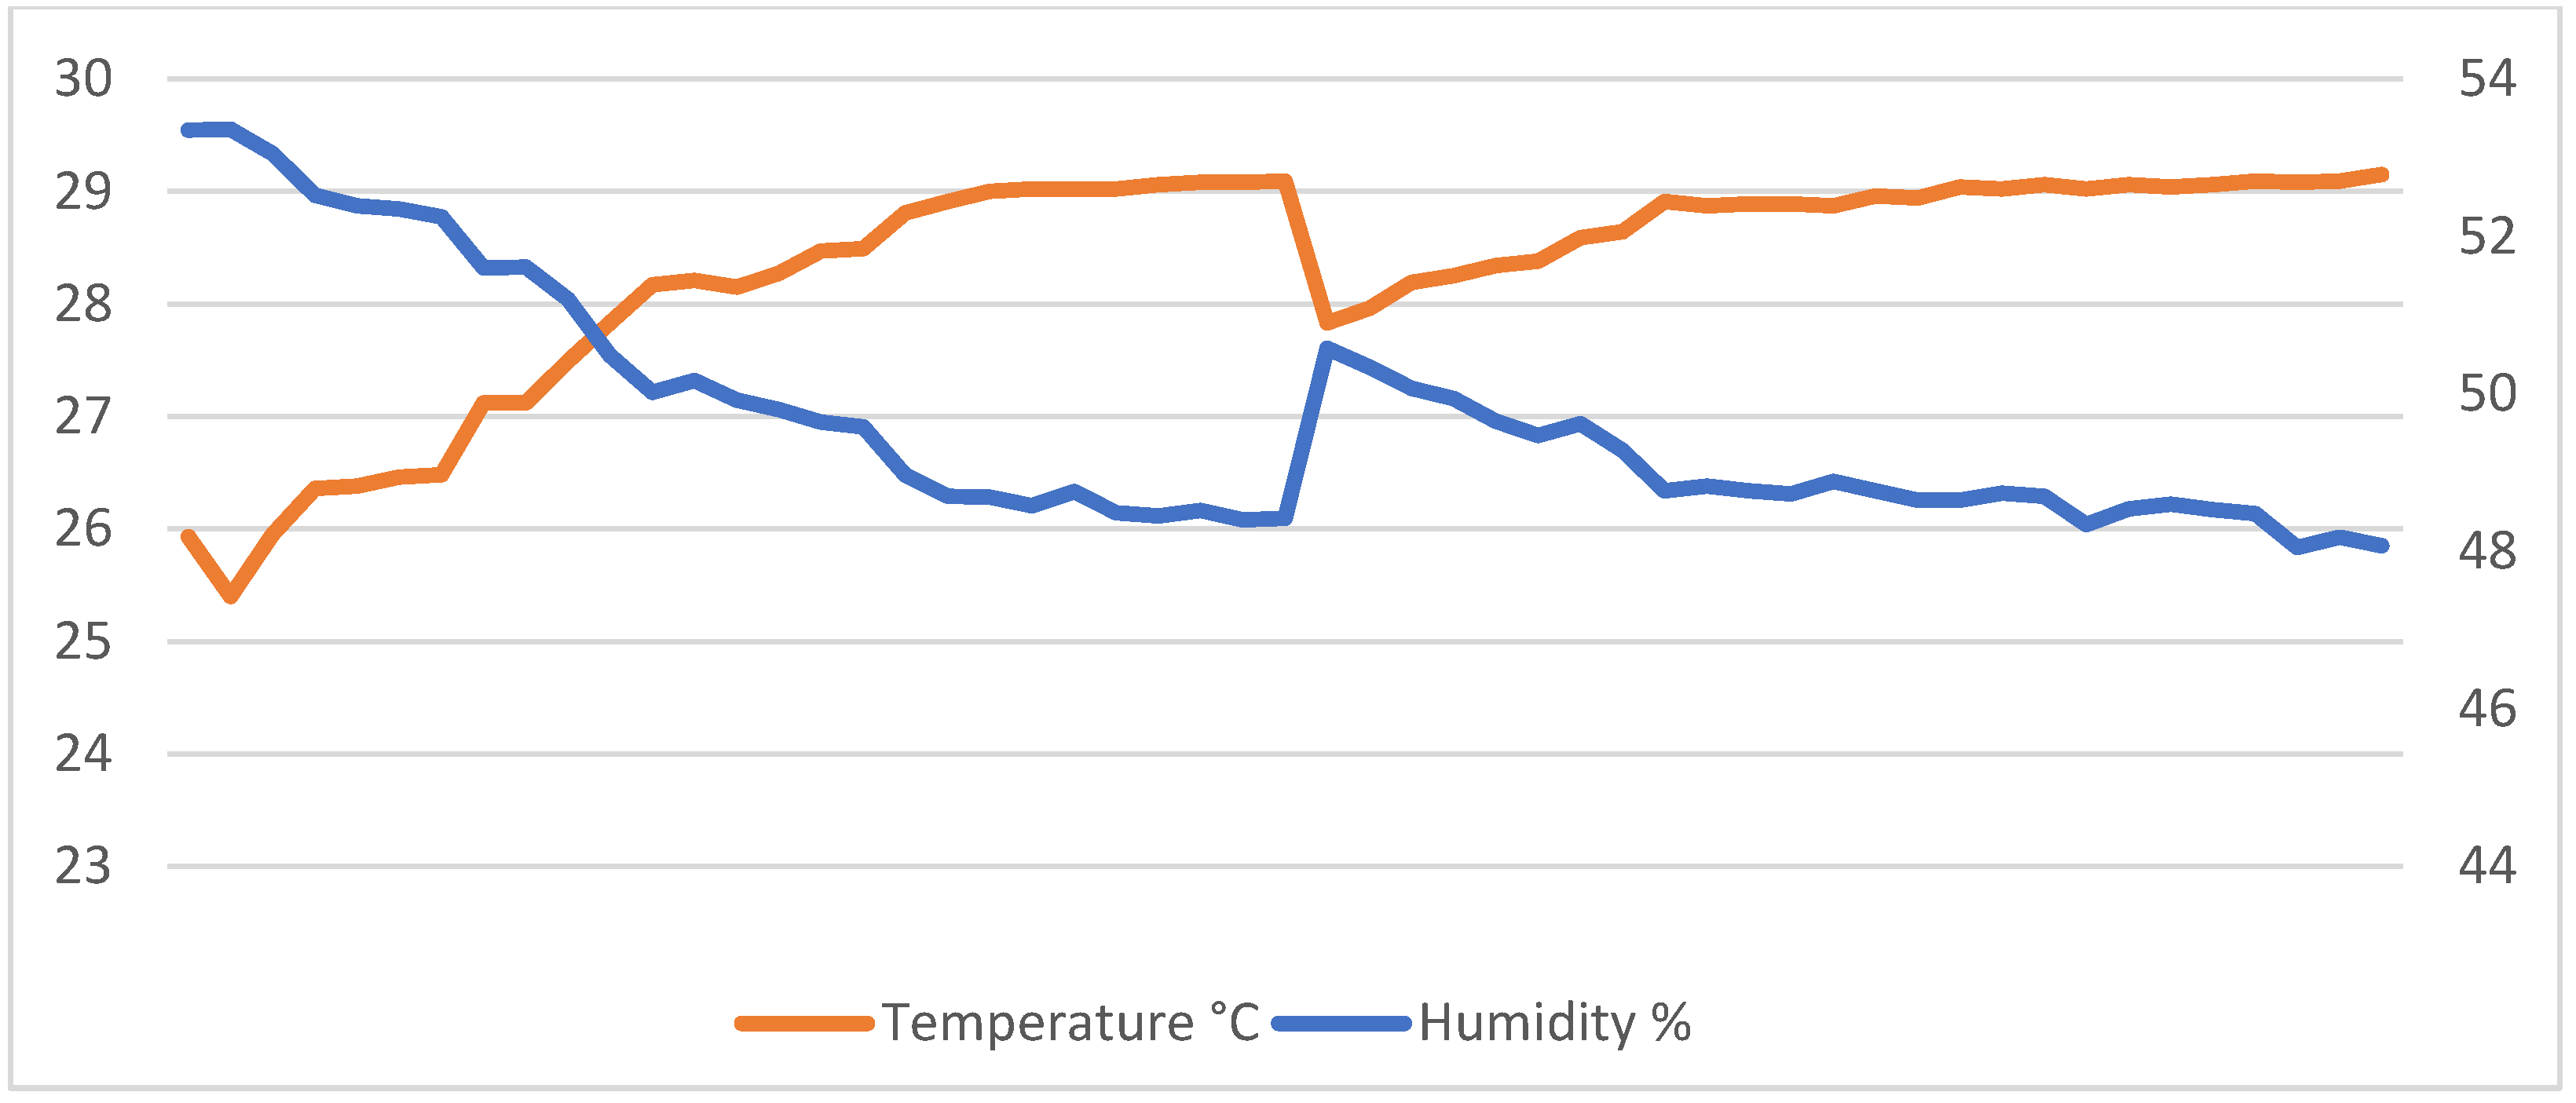
On the contrary, the ambient sensor HTS221—which was embedded in the board—responsible for measuring room temperature and humidity is necessary to assure the quarantined person’s suitable living conditions and restrain COVID-19 [33]. Therefore, in our design, there was a combination of three temperature sensors, each one checking the different types of temperature (touch/I.R./ambient) and humidity, as well as continuously checking the AmT (Ambient Temperature) and the AmH (Ambient temperature) surrounding the user. All the abovementioned data were shown to the user via the OLED display. Tracking of the ambient parameters is also important because if one is under supervision, it is mandatory to adjust the environment variables to halt the spread of the virus, in the particular values between 20–60% of humidity and 20–24 °C concerning the ambient temperature [34].
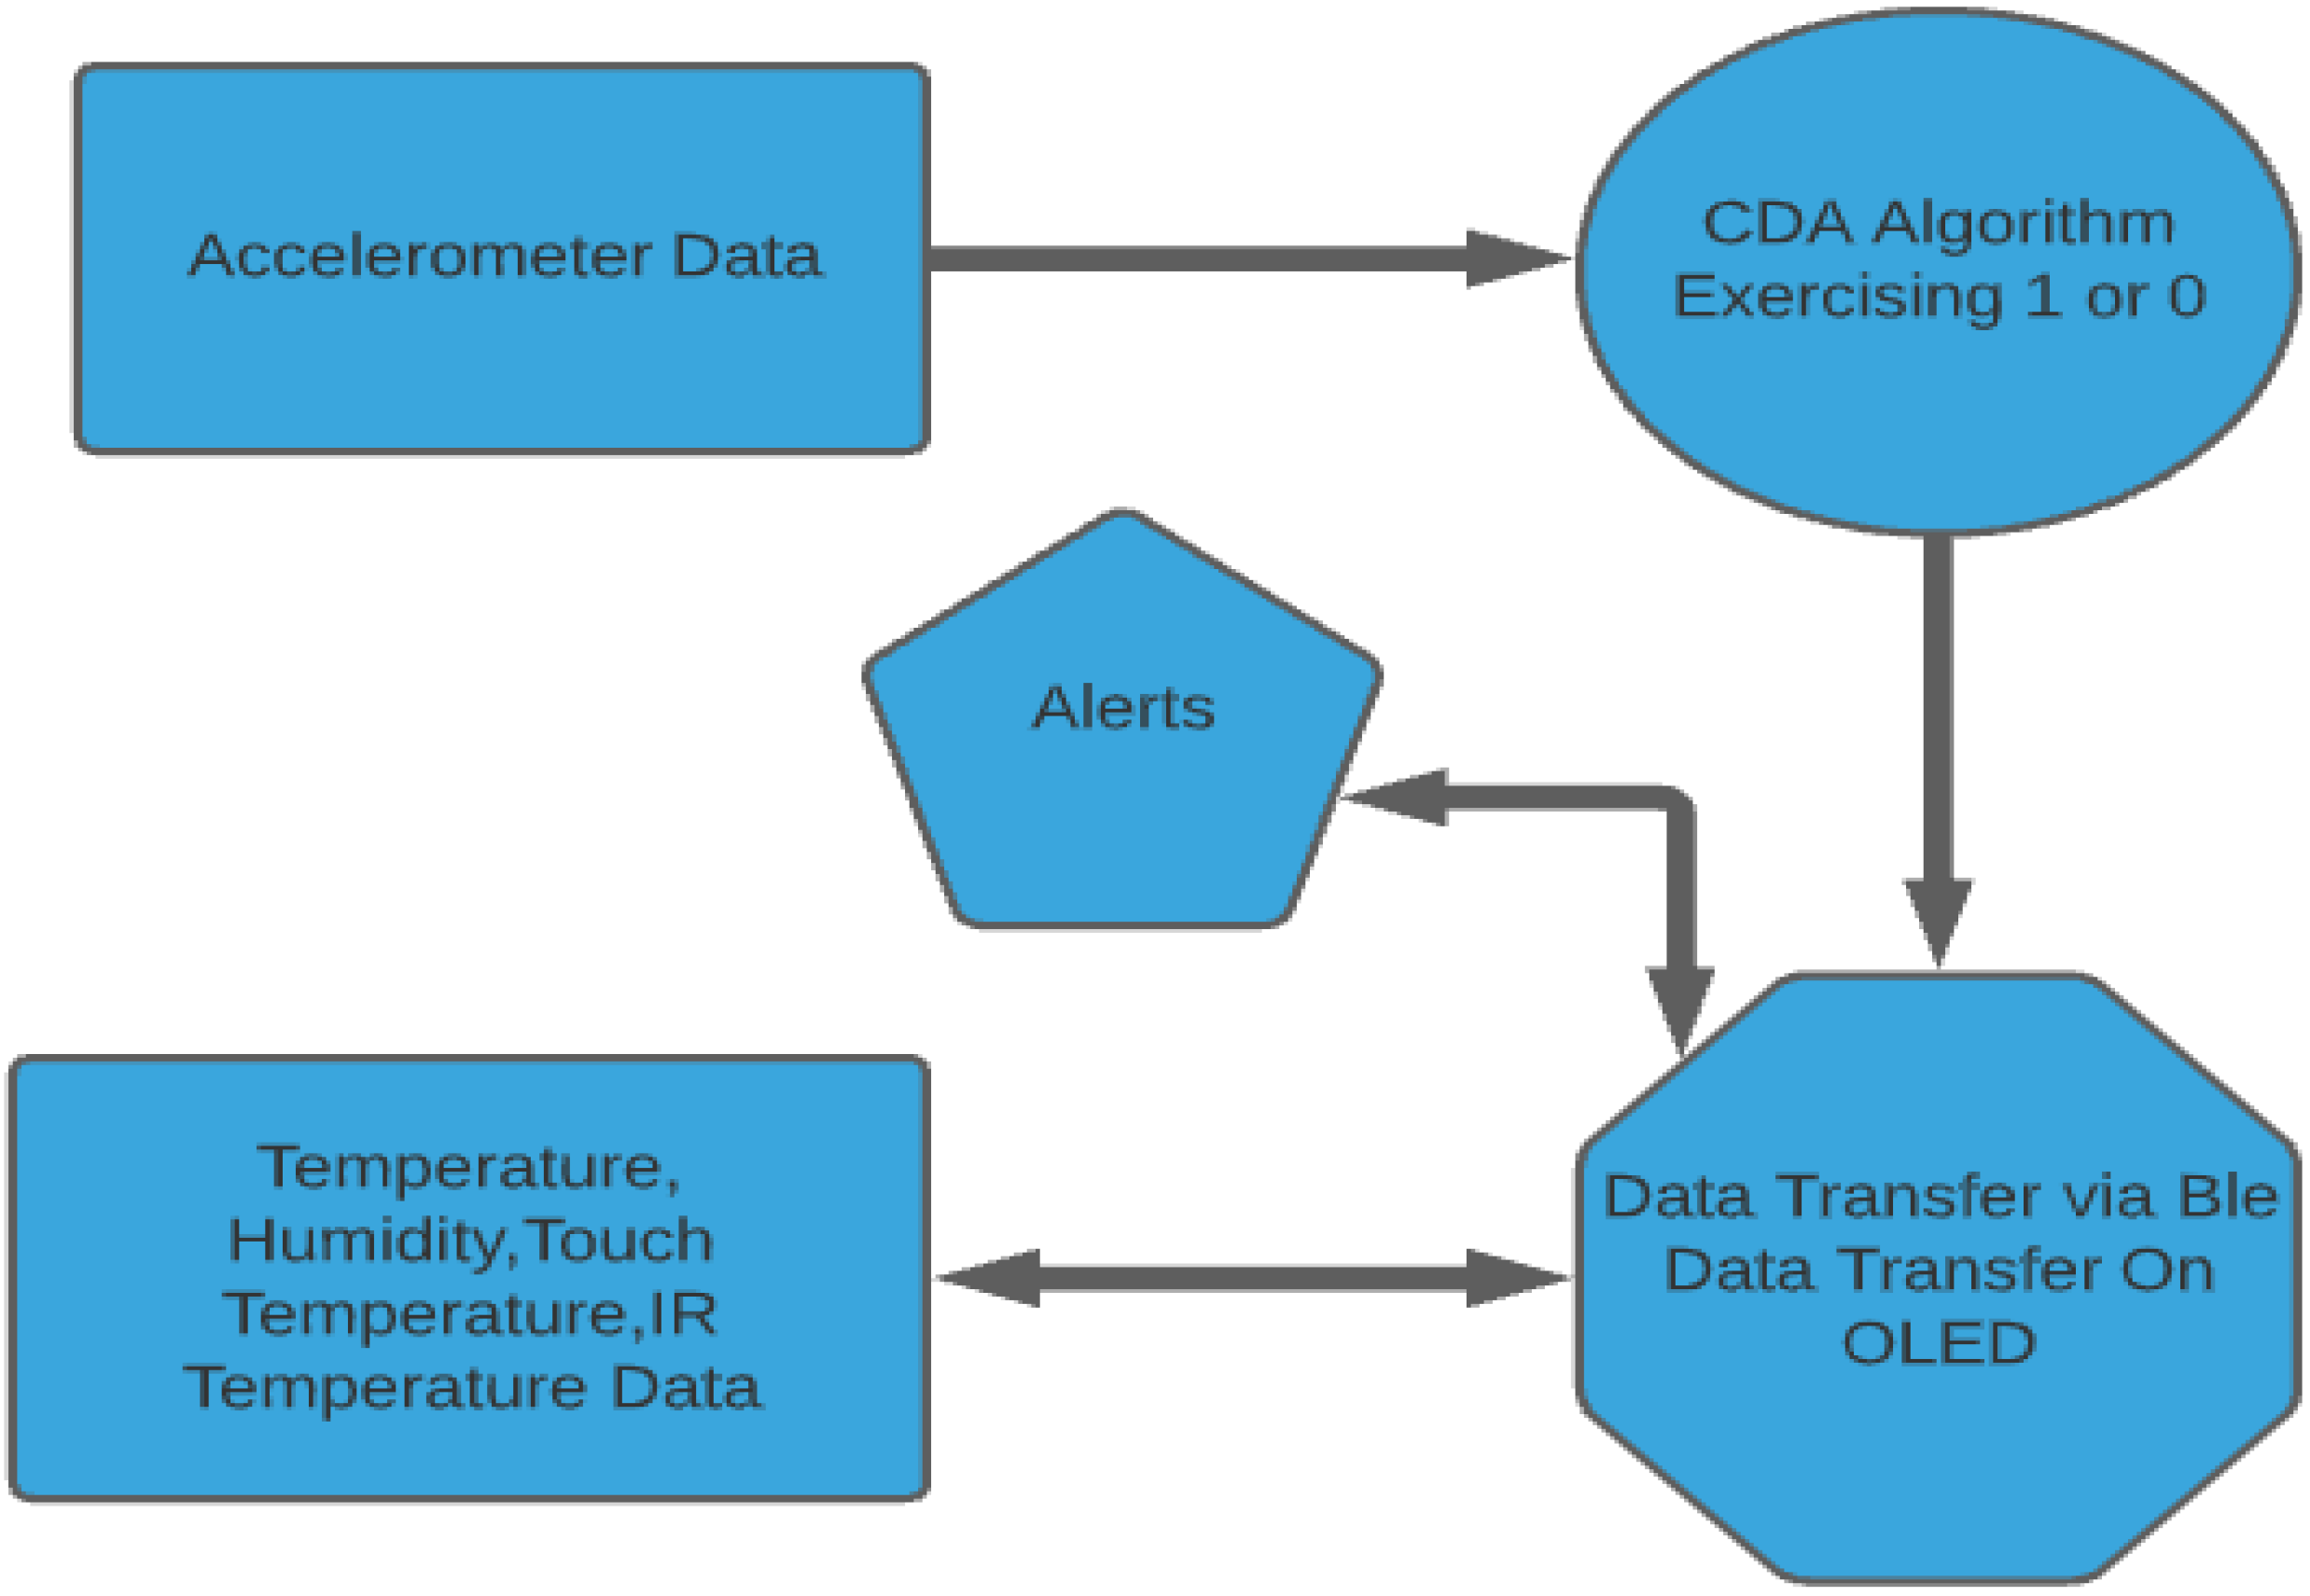
By analyzing the data measurements between room conditions and body state, we could improve the monitoring capabilities of infected people without needing to access large databases and without large training datasets. Besides that, we then send warnings via the OLED display and the BLE communicate when the body temperature exceeds the allowed threshold. The importance of the proposed system is that it combines simple logic, a small size, and multiple functionalities. This system features upgradeability, utilizing machine learning models. It can be customized or progressed to a more complex and multipurpose system that uses the rest of the sensors embedded on the Arduino Nano 33 BLE sense board.

4.2. Benefits of the Approach

We developed a Continuous Displacement Algorithm (CDA) which computes the number of observations surpassing the physical activity threshold, inciting automatic update of the temperature threshold. The accelerometer inside the wearable device provided the acceleration value. The extremes were calculated based on the acceleration variation as the input of the CDA model. The average human body temperature ranges from 36.8 to 37.0 °C since each person’s body temperature is different with negligible fluctuations. However, during physical exercise, the temperature hovers around 37.5 °C [35,36]. Additionally, ambient temperature and humidity are critical to impede the virus diffusion. The ambient temperature (AmT) should be around 20–24 °C, and the Ambient Humidity (AmH) approximately 20–60%. In this project, a wearable device based on Arduino nano 33 BLE sense’s embedded ambient sensors, two other temperature sensors were added to this device to obtain reliable readings, namely, an MLX90614 infrared thermometer and an MCP9808 high-accuracy contact thermometer [37].
The primary protocols used to transmit the information are BLE and were used as peripheral, serial transmission to an OLED display attached to the wearable device [38]. The measurements were available to the user at any time. They could simply connect to a Bluetooth central application like LightBlue primarily used in this project for data decoding) or nRF Connect to access the available data [39,40]. Altogether, the system is based on thermometer and accelerometer readings. The objectives include the smooth combination of contact—and non-contact—ambient thermometers to update the temperature and acquire accurate readings. The overall purpose of this device is to provide warnings if the body temperature is above the permissible limit, which the CDA detects.
Besides the simplicity and accuracy, an additional benefit of this design is distant patient supervision. In future applications, it is highly upgradeable, and it can perform pulse oximetry which can assist in notifying supervising staff or patients of the help they need and acquire accurate information about their current condition. Furthermore, one of the most significant benefits is that the Arduino Nano BLE 33 Sense can implement machine learning models with TinyML or TensorFlow [41,42].
Overall, this paper is an alternative approach to the system described in [43], using similar principles for acquiring and handling the data. It offers excellent future upgradeability while maintaining power efficiency—one of the critical features of the BLE 5.0 protocol.

4.3. Continuous Displacement Algorithm

To recognize human activity, it is mandatory to collect and process data provided by the IMU unit. In this case, the acceleration magnitude (Amag) was used to calculate the difference between its two-consecutive samples (Δαmag) with Amag, Amag-1, and compute the average between them, the previous and the current readings, for activity recognition.
Δ Amag = x 2 + y 2 + z 2
where x, y, z are the three axes of the accelerometer.
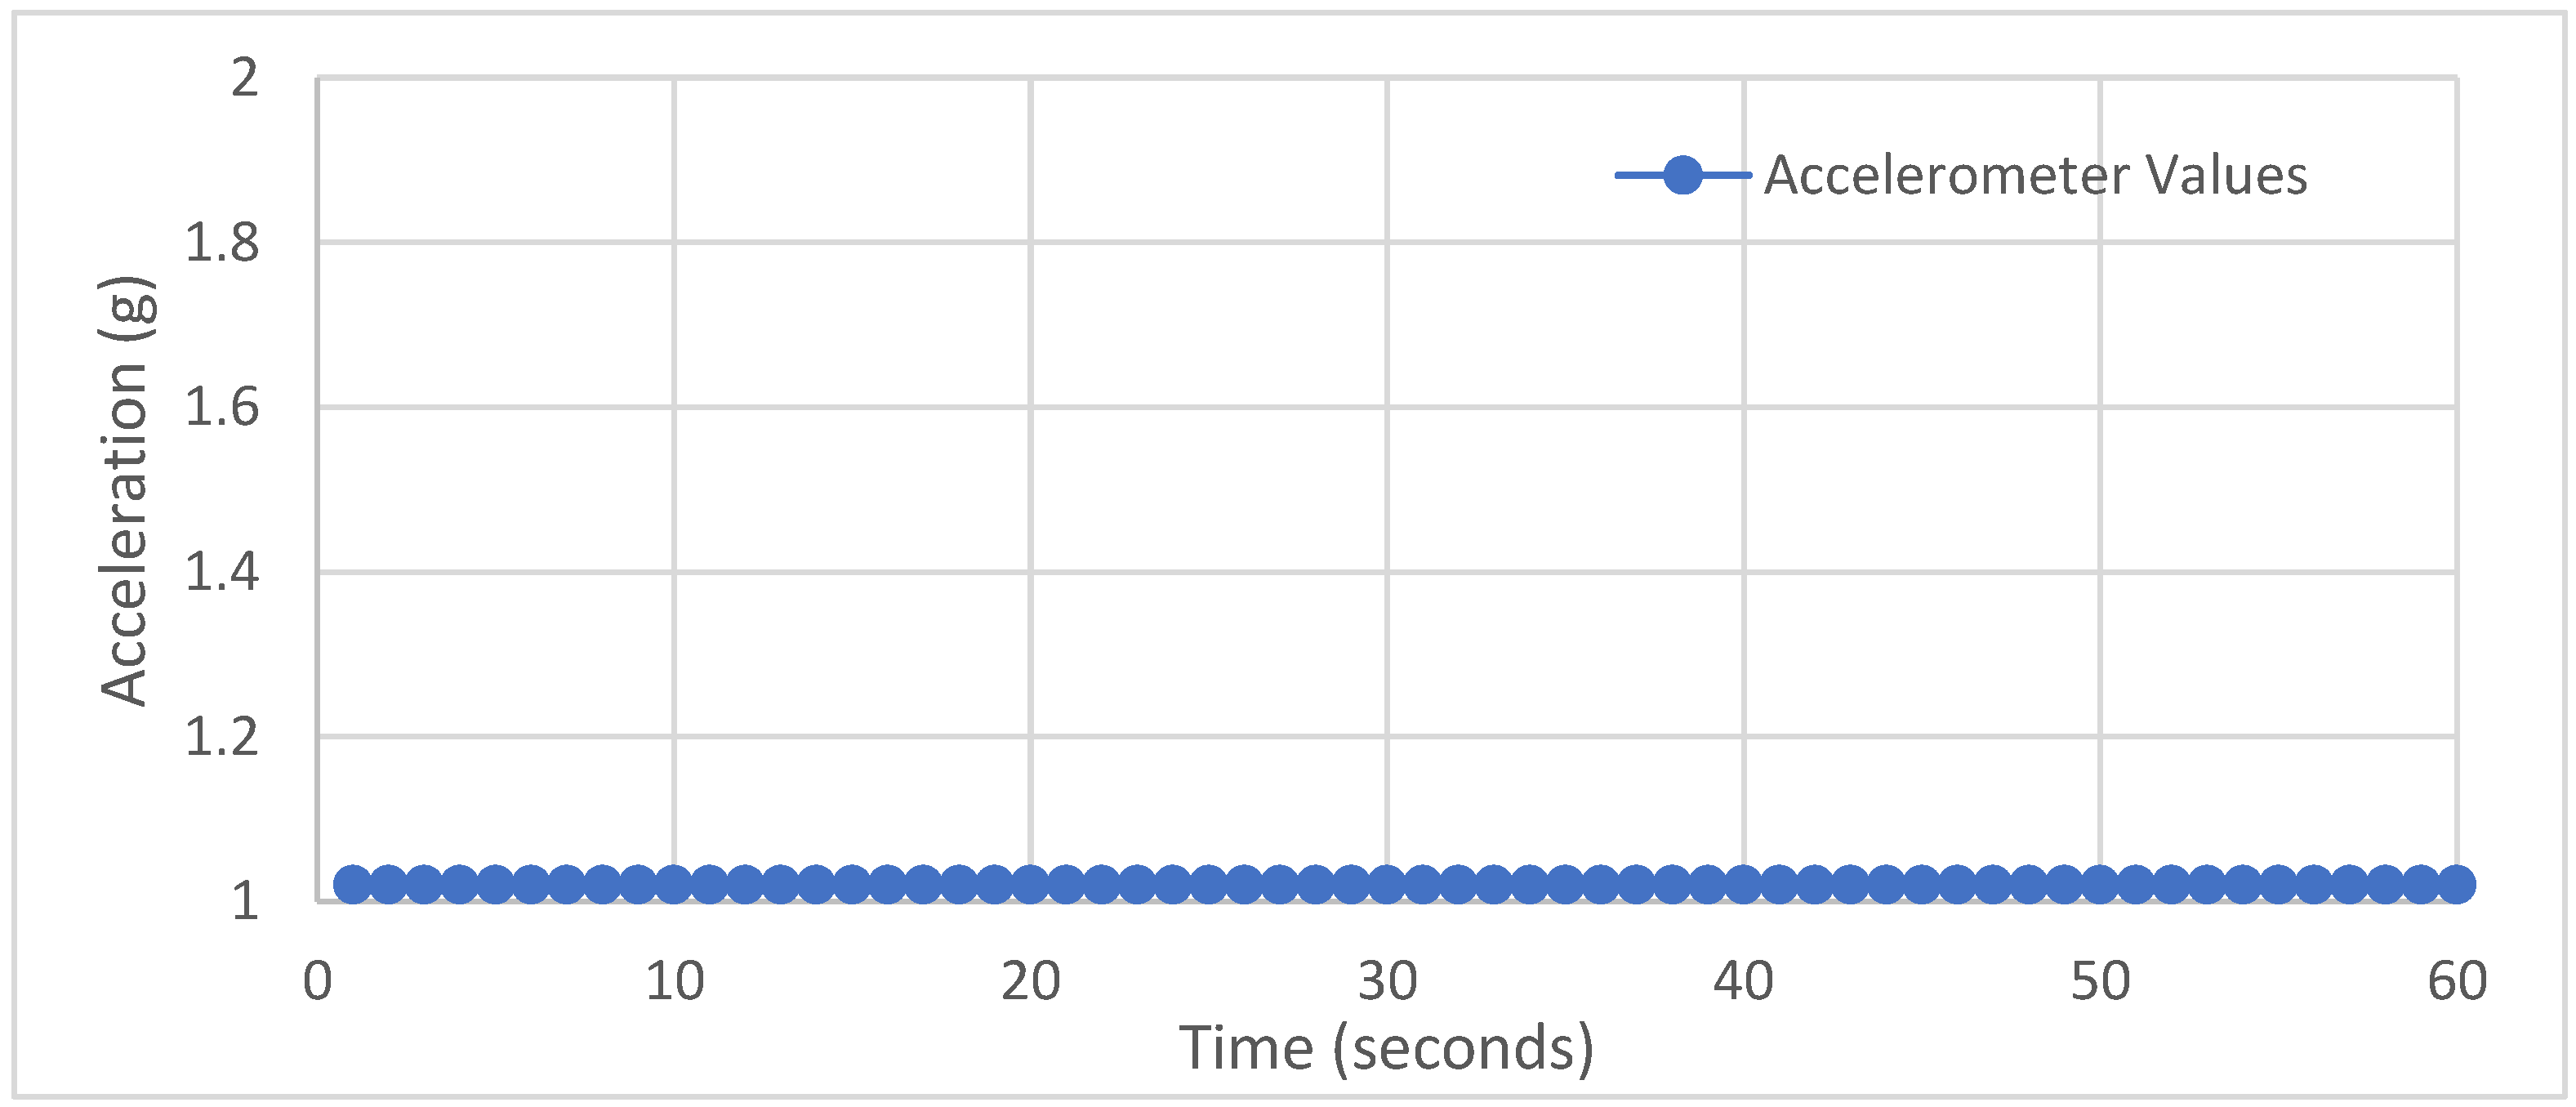
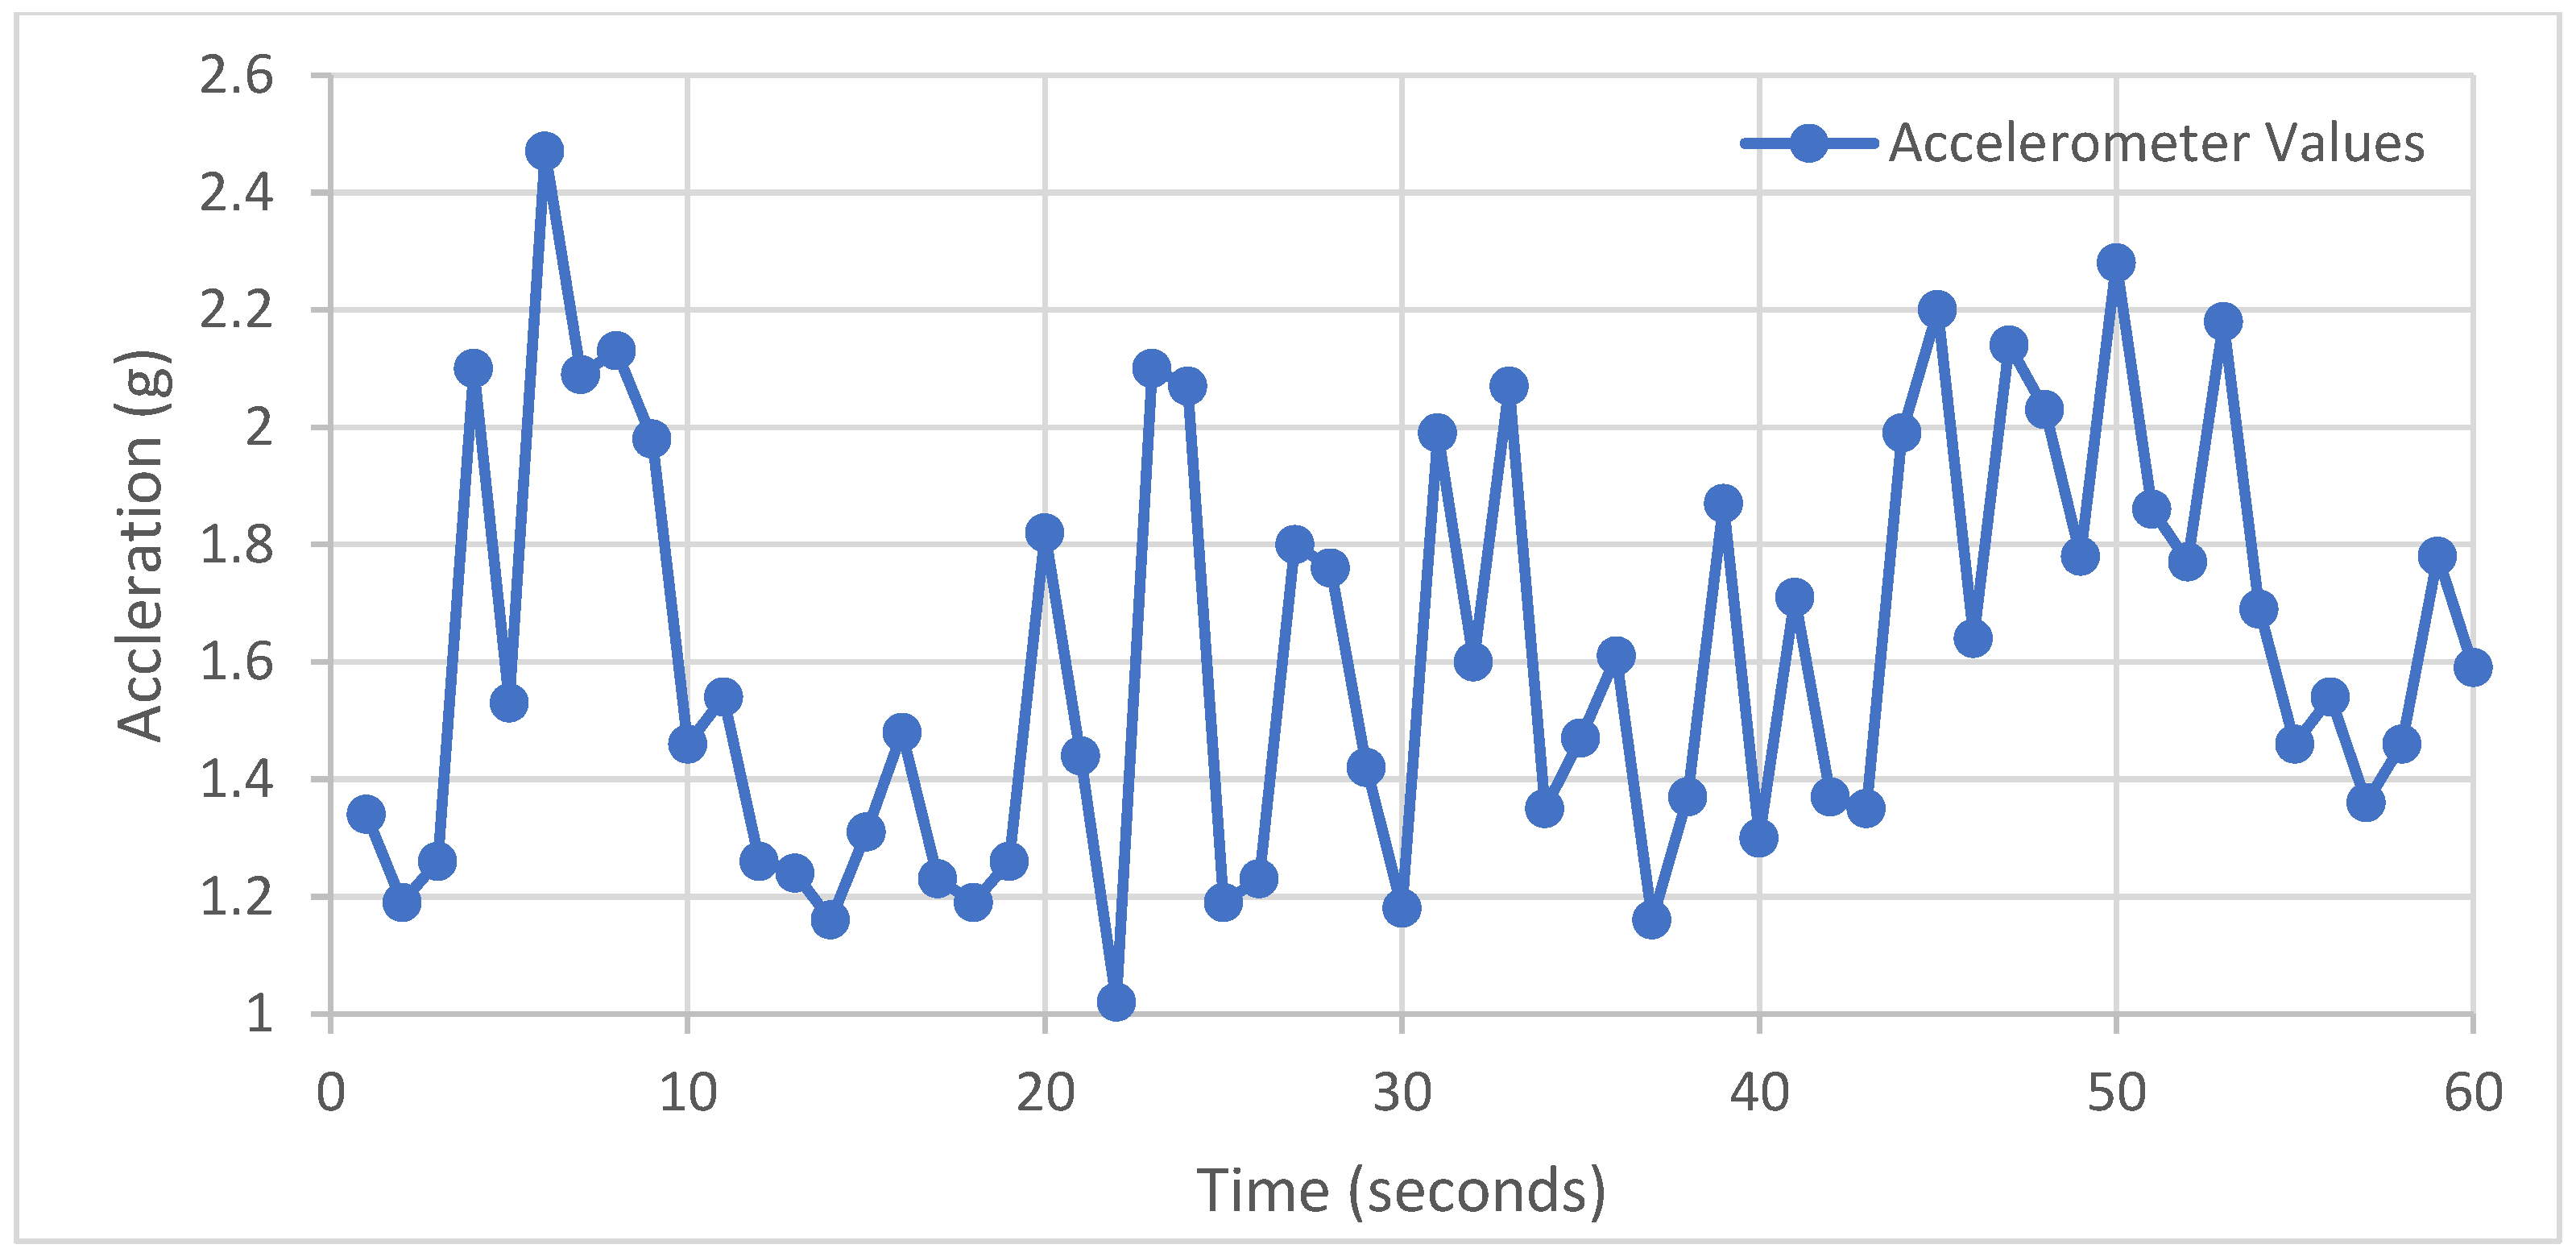
 Figure 3, Figure 4 and 
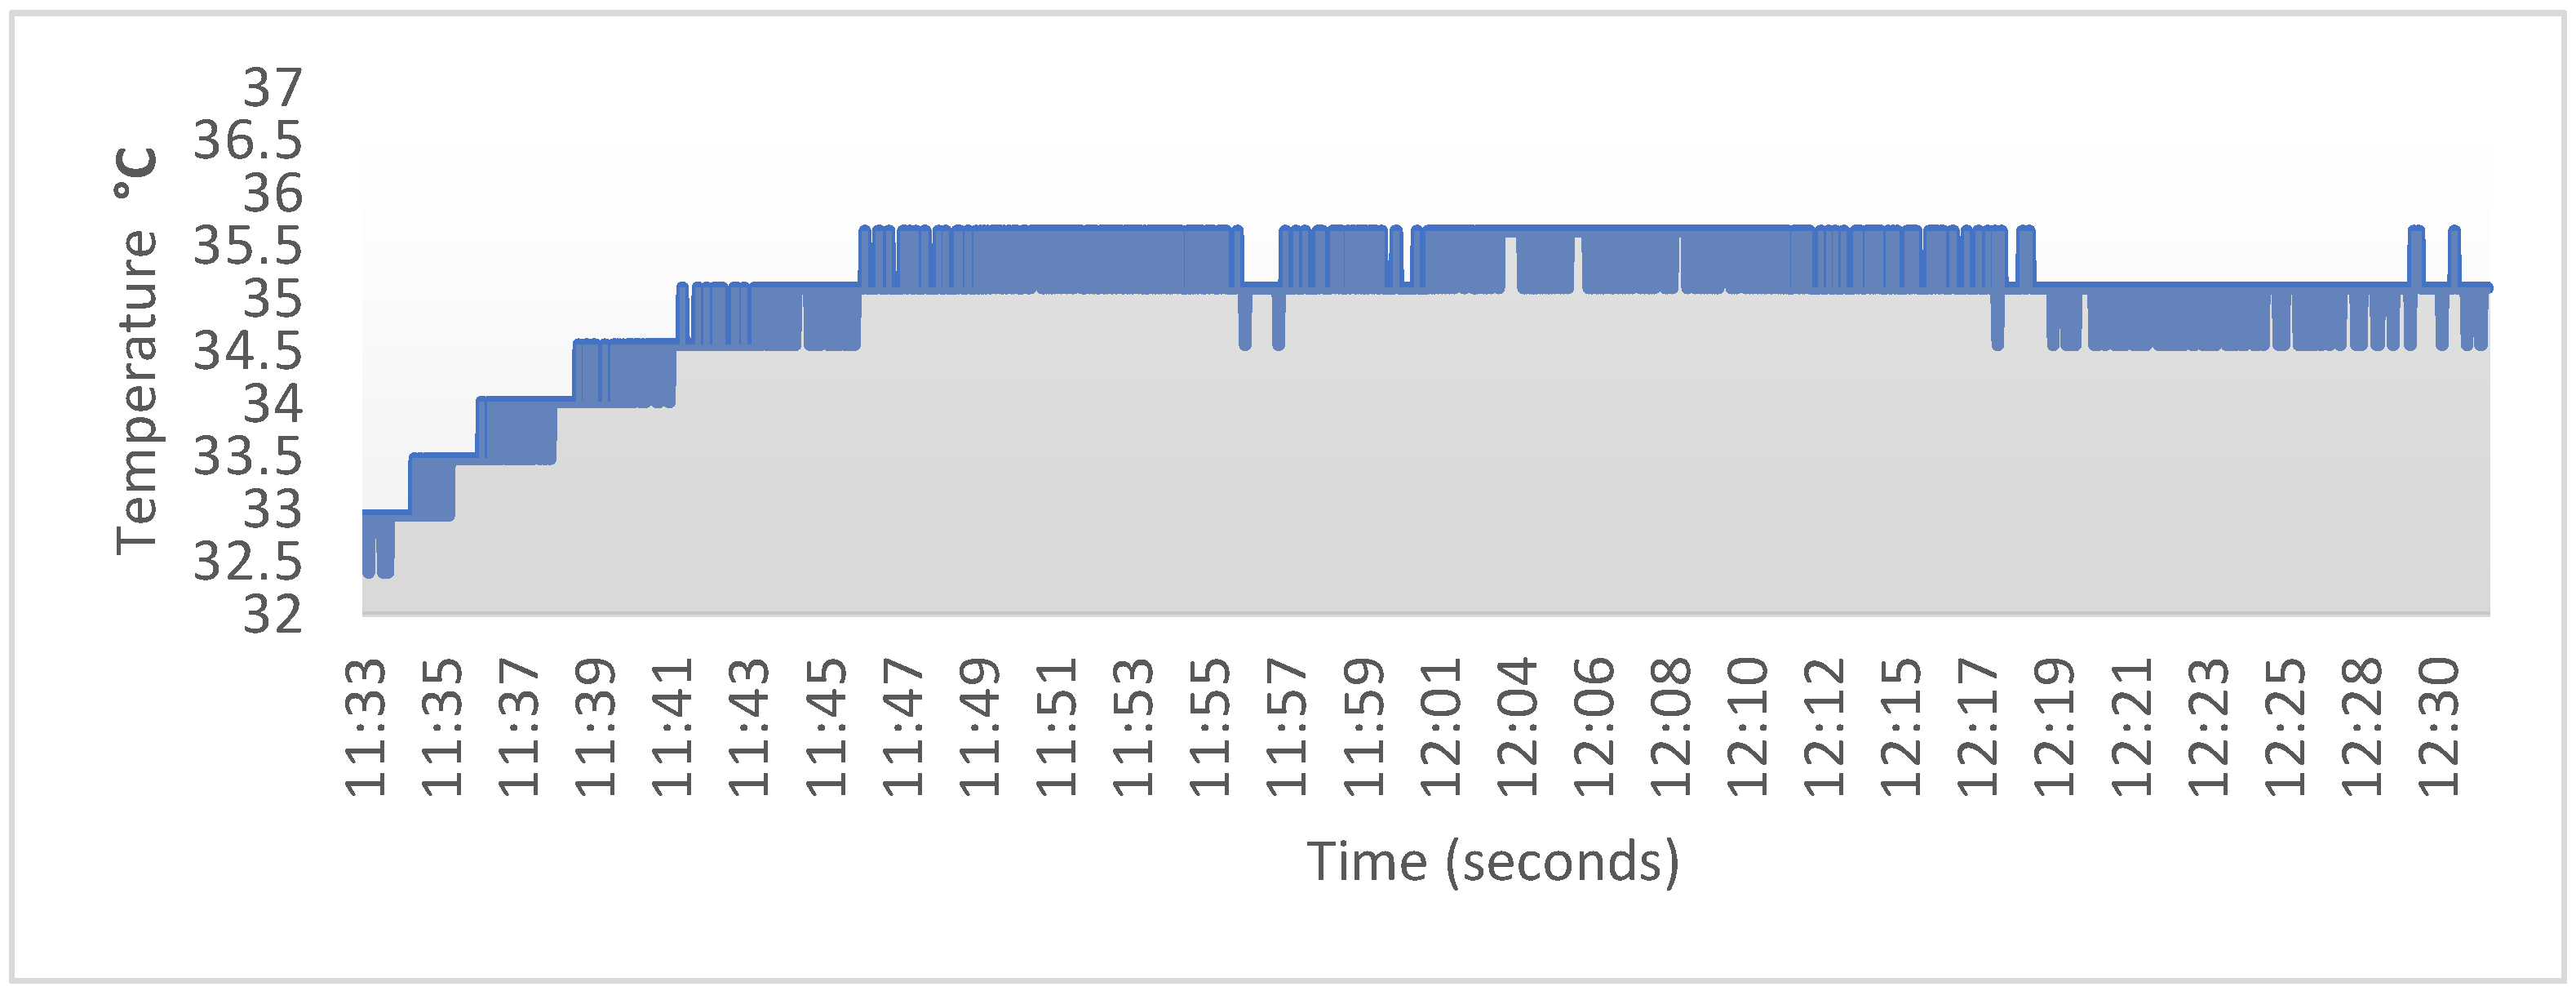
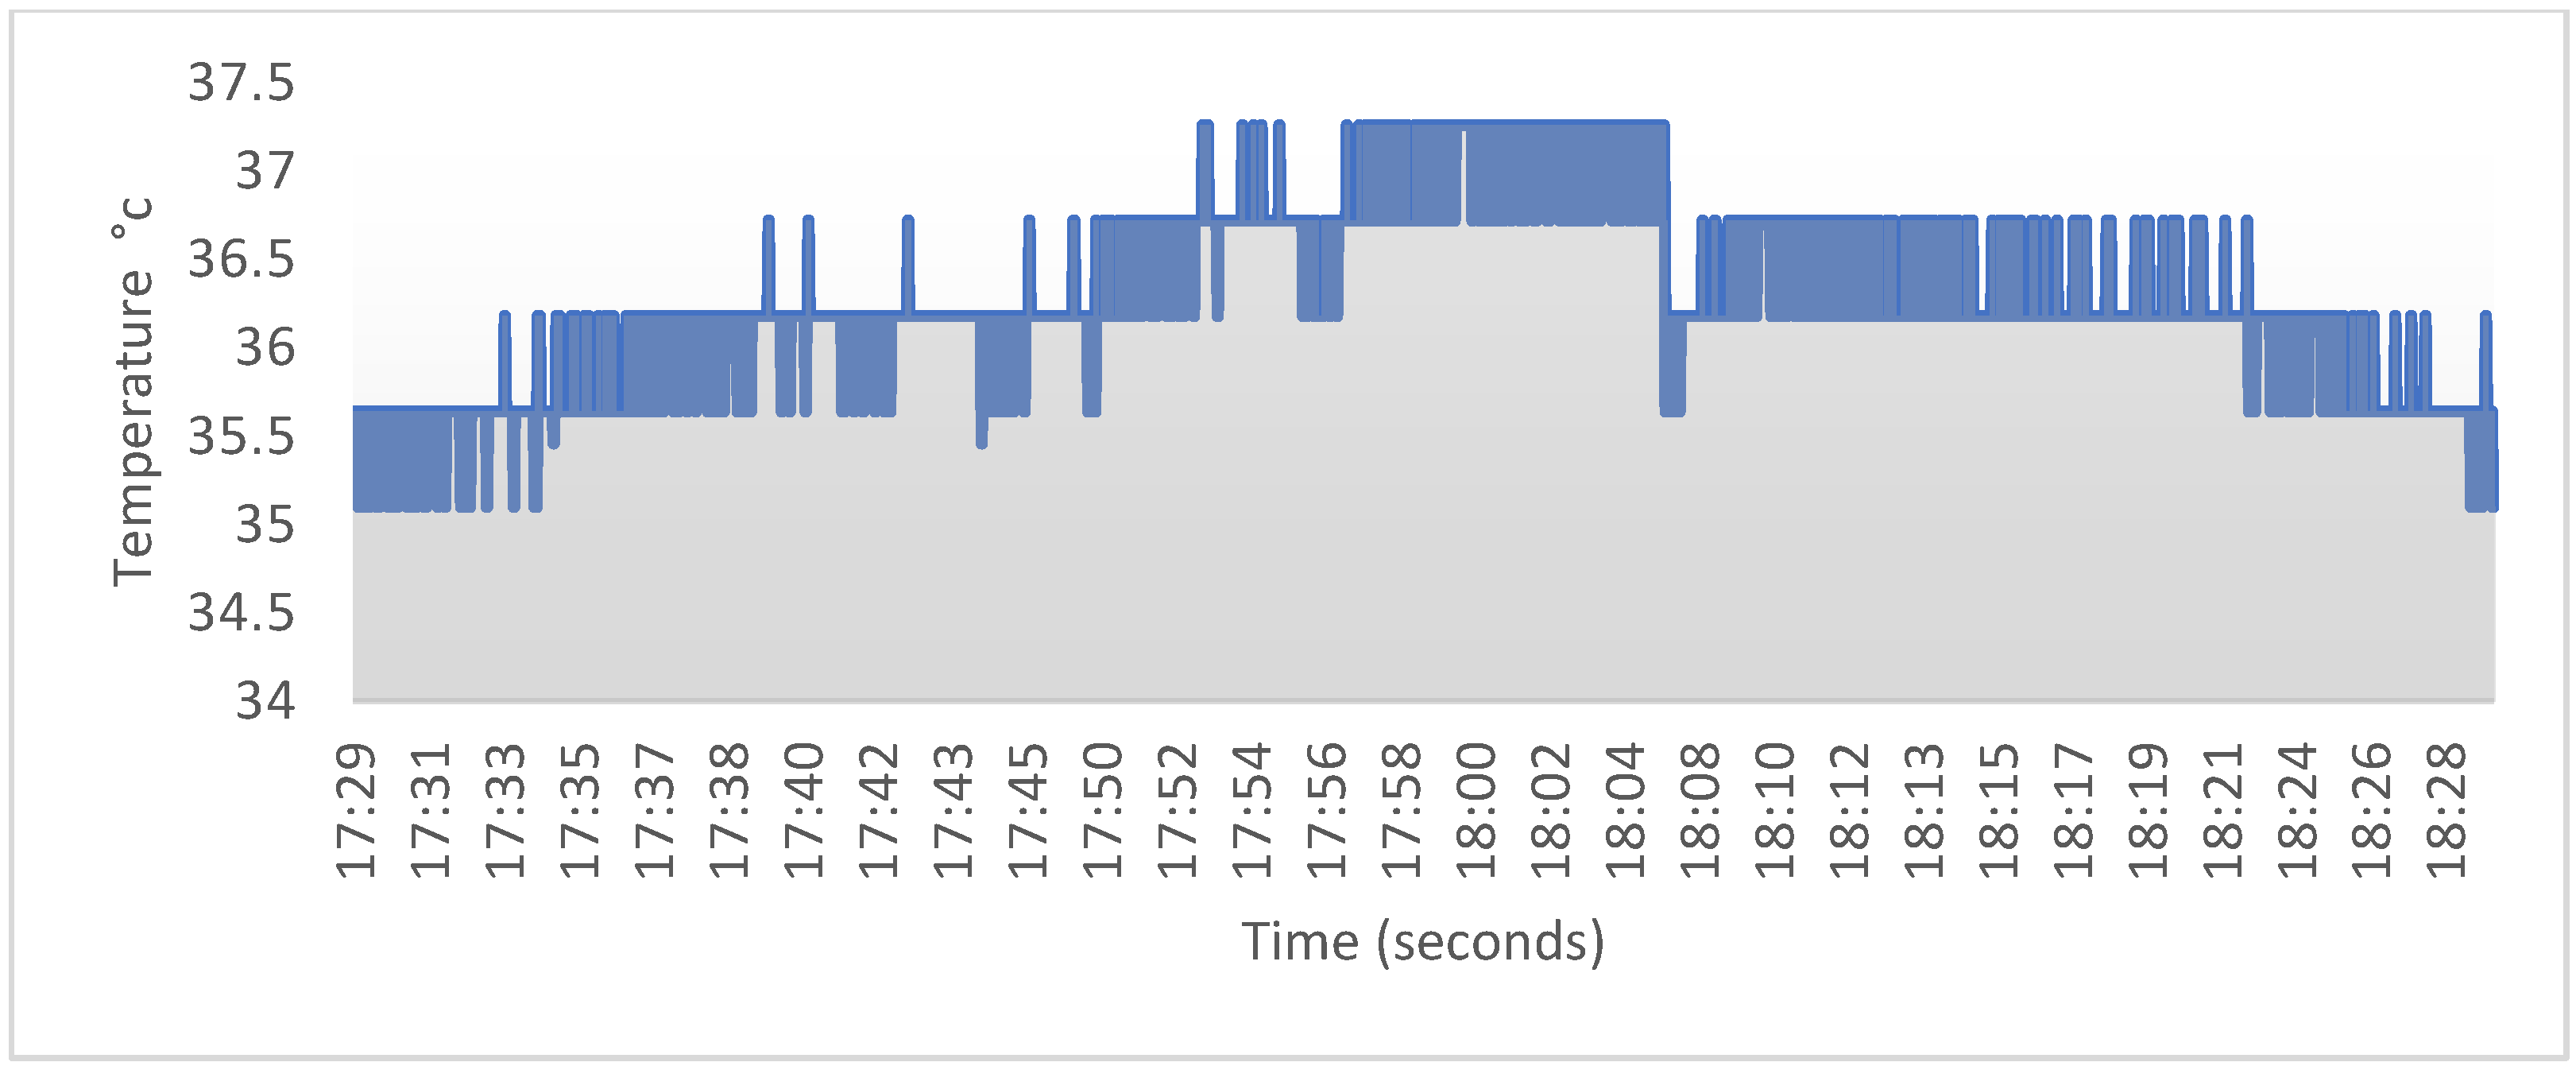
Figure 5 show the behavior of Amag and |ΔAmag| during three activity conditions:
  • No activity (sitting).
  • Ordinary movements (walking).
  • Doing physical exercise (running).
The Acc signal acquisition was carried out for 1 min in real-time. The signal can only react to the apparent motion of the body. Under stillness, no extremes were found, and the accelerometer maintained a constant value without any extremes, so the |Δαmag| maintained a constant value without unnecessary interruptions. Hence, the |Δαmag| was almost 1 at all times. Regular activities can cause sudden variations, but it is easy to realize that the signal behavior is random with tiny |Δαmag| at low frequencies. Likewise, if the user performs physical exercises, the Δαmag frequently varies with high repetitive extremes due to numerous motions that cause and |Δαmag| fluctuations repetitively with similar values. To distinguish between normal activities and training, the CDA counts the number of extremes per a specified period (20 s) to decide whether the person is exercising. Additionally, pertinent literature indicates that the body’s temperature returns to standard levels approximately 20 min after exercise. Therefore, the timer is to count that period and adjust the temperature threshold accordingly at 37.5 °C, which is the maximum body temperature during exercising.
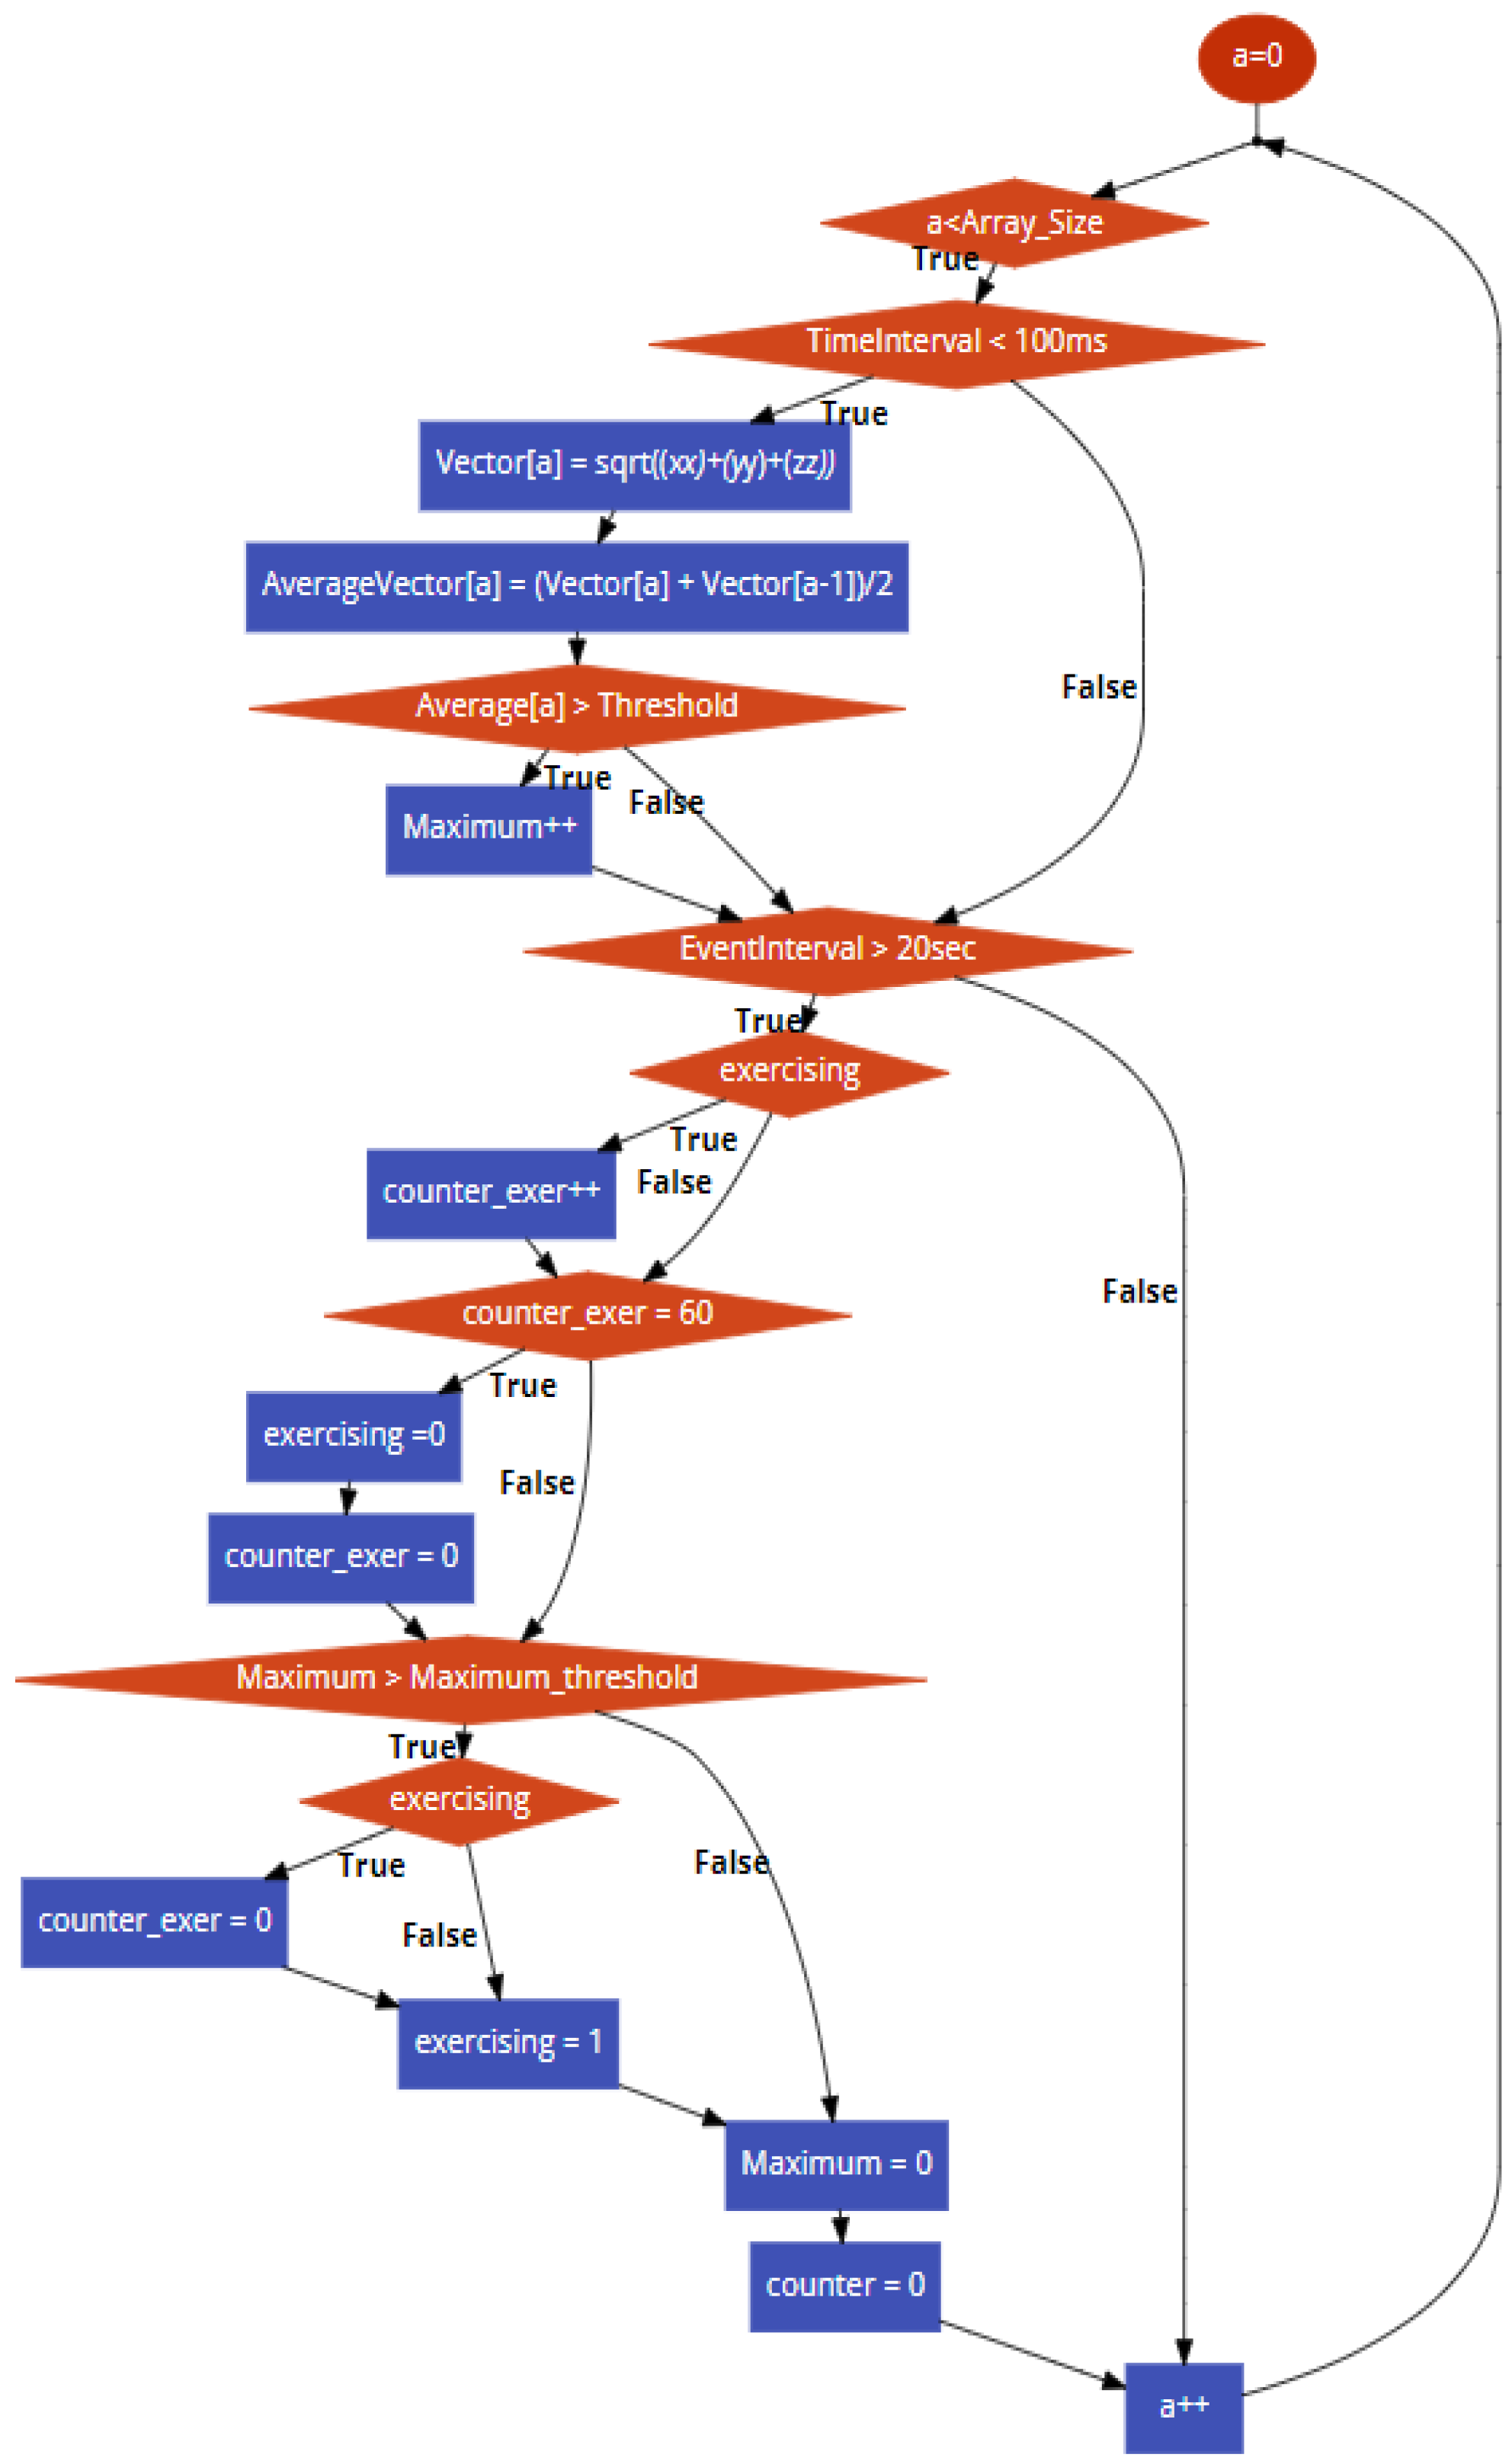
The CDA flowchart, in Figure 6, presents a comprehensive overview of the implemented algorithm. We gathered accelerometer data using the Vector Equation and stored the data into an array of 100 elements each time, calculating the average between two vector elements each time. After the data were stored into another array, a threshold was generated, computing the total average of the 100 elements. Values above that threshold were counted as local extreme values. If the local extremes were above a set value acting as a threshold, corporal activity was detected and adjusted the points accordingly. The following equation calculates the average vector:
AverageVector [ a ] = a = 0 99 vector [ a ] + vector [ a 1 ] a = 99 2 99
where: a is the capacity of an array ranging from 0 to 99 and Average Vector[a] is an array of 100 elements which calculates the avg of the vector[a] which is calculated by the ΔAmag formula.
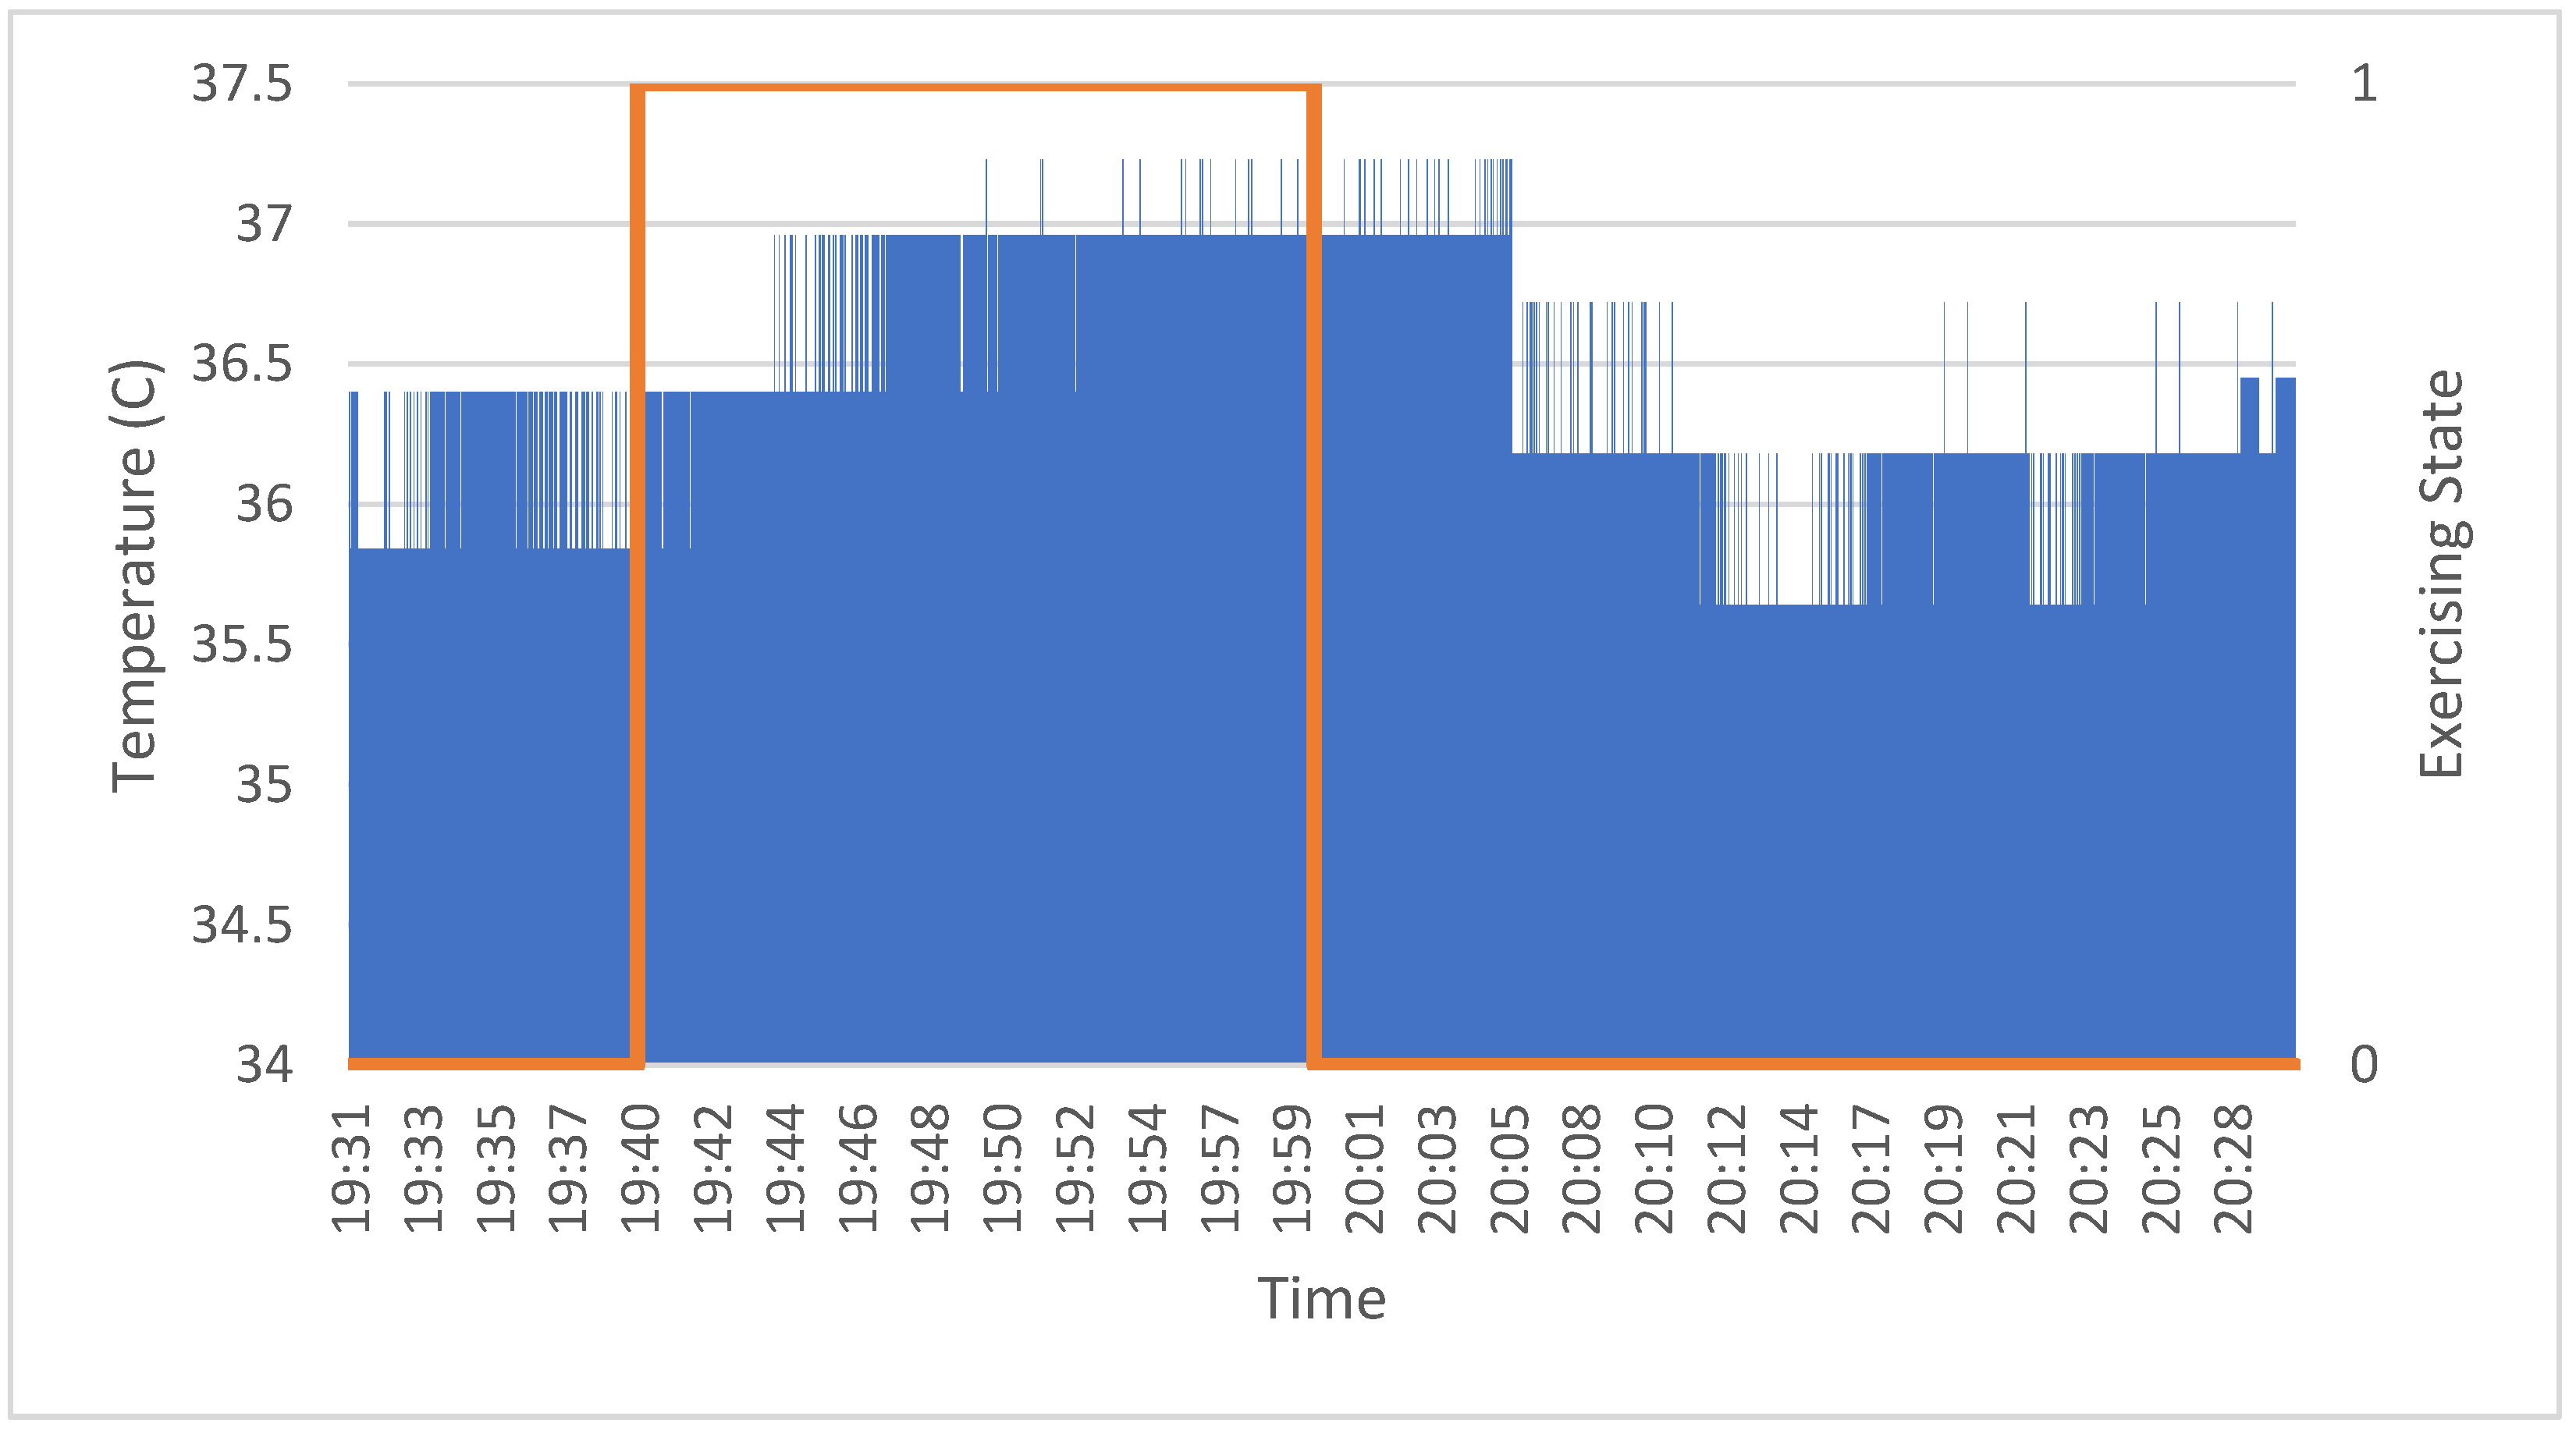
This process was repeated for 20 s each time. Suppose the number of spikes we found on that time interval is above the spike threshold. In this instance, the exercise’s Boolean variable is shifted from 0 to 1. Afterward, we adjust the temperature threshold from 36.8 to 37.5 °C which is the temperature threshold that comes into place if someone is exercising. This value is held for 20 min. The data acquisition is accomplished by using the device’s serial port to transmit data and a computer (in combination with a serial monitor) to receive data. In summary, if they are enough extremes in a specified period and if the corresponding extreme values are above the threshold, the flag is shifted from 0 to 1. Consequently, the temperature cut-off value is adjusted from 36.8 °C to 37.5 °C.

4.4. Deep Learning Analysis

Subsequently, we performed classifications and determined the condition of the user concerning their body temperature. Explicitly, we fed the measurements of the touch temperature sensors to identify an increase in the body temperature potentially caused by pathogenesis, thus signifying fever. The models employed for this task were unidimensional Convolutional Neural Networks. CNNs are a class of deep learning neural networks that display excellent capabilities in pattern recognition schemes. Their ability to extract regional features enables researchers to deal with complex tasks that are not possible with classic ANNs. Although, our signals stemmed from one device, and thus we did not possess a plethora of samples; we were prompted to select unidimensional CNNs as our classifier to provide proof of feasibility for our application in this task.
This selection also delineates our future directions regarding the simultaneous acquisition of multiple signals from interconnected devices in the context of family members wearing this device and obtaining feedback in real-time concerning their condition and relatives. In this vein, these networks present excellent scaling capabilities, thus rendering them great candidates to constitute the foundation for our analysis. Furthermore, these networks were also employed in our previous work [44], where they demonstrated significant efficacy in classifying the condition of vessel equipment. Therefore, it is deemed necessary to use methodologies established in other domains and determine their transferability. The primary functionalities of CNNs are explicated in detail, as follows:
Feature extraction: First, the convolution is characterized as a linear element-wise multiplication as a small array called the kernel glides through the input tensor of the layer and convolves the value of each time step. Equation (3) delineates this operation.
F ( x ) = K ° S ( x ) = i = N N K ( i ) S ( x i )
The emerging output tensor was fed into a nonlinear activation function. Recently, the rectifier linear unit (ReLU) has started to gain popularity, as it has been evinced capable of yielding remarkable results while also solving gradient problems related to other popular activation functions of the past, such as the sigmoid and the tanh.
Classification: The output feature map of the last convolution layer was converted into a vector, which was input into a traditional Feed-Forward Neural Network (FFNN) carrying out the assignment of the samples to the output labels.
Loss: The main objective of the optimization procedure is the minimization of the loss function. The utilized loss function was concluded based on the nature of the problem at hand. Explicitly, for our application, the Categorical Cross Entropy was utilized in the present study. Afterward, we assumed a dataset with M labels and N observations, and the vector of ground truth measurements is denoted as y = [ y 1 ,   y 2 ,   ,   y n ] . Similarly, the predicted values are denoted as a [ L ] = [ a 1 [ L ] ,   a 2 [ L ] ,   ,   a n [ L ] ] . Accepting CCE as our loss function then gives:
E = C C E ( y , a [ L ] ) = i = 1 M y i log ( a i [ L ] )
Subsequently, the backpropagation succeeded the forward pass. The gradient, namely the partial derivative of the loss, was calculated concerning the model’s output. Through this computation, the model was capable of updating its learnable parameters, namely weights and biases, achieving convergence of the inferred values and actual measurements, hence augmenting the model’s accuracy. Mathematically, we can formulate the aforementioned procedure as follows:
p = p a   L p
where p represents any learnable parameter and α denotes the learning rate of the optimizer of the model.
For our application, we had continuous time-series signals pertinent to the variables monitored by the watch’s sensors. We had available 2 h worth of data with a 1 Hz sampling frequency, accumulating to approximately 7200 data points, corresponding to 1 h (3600 data points) with the being user healthy and another hour with the user being febrile. Table 2 summarizes the data acquisition for the N.N. classification task and the user’s physical condition while wearing the watch.
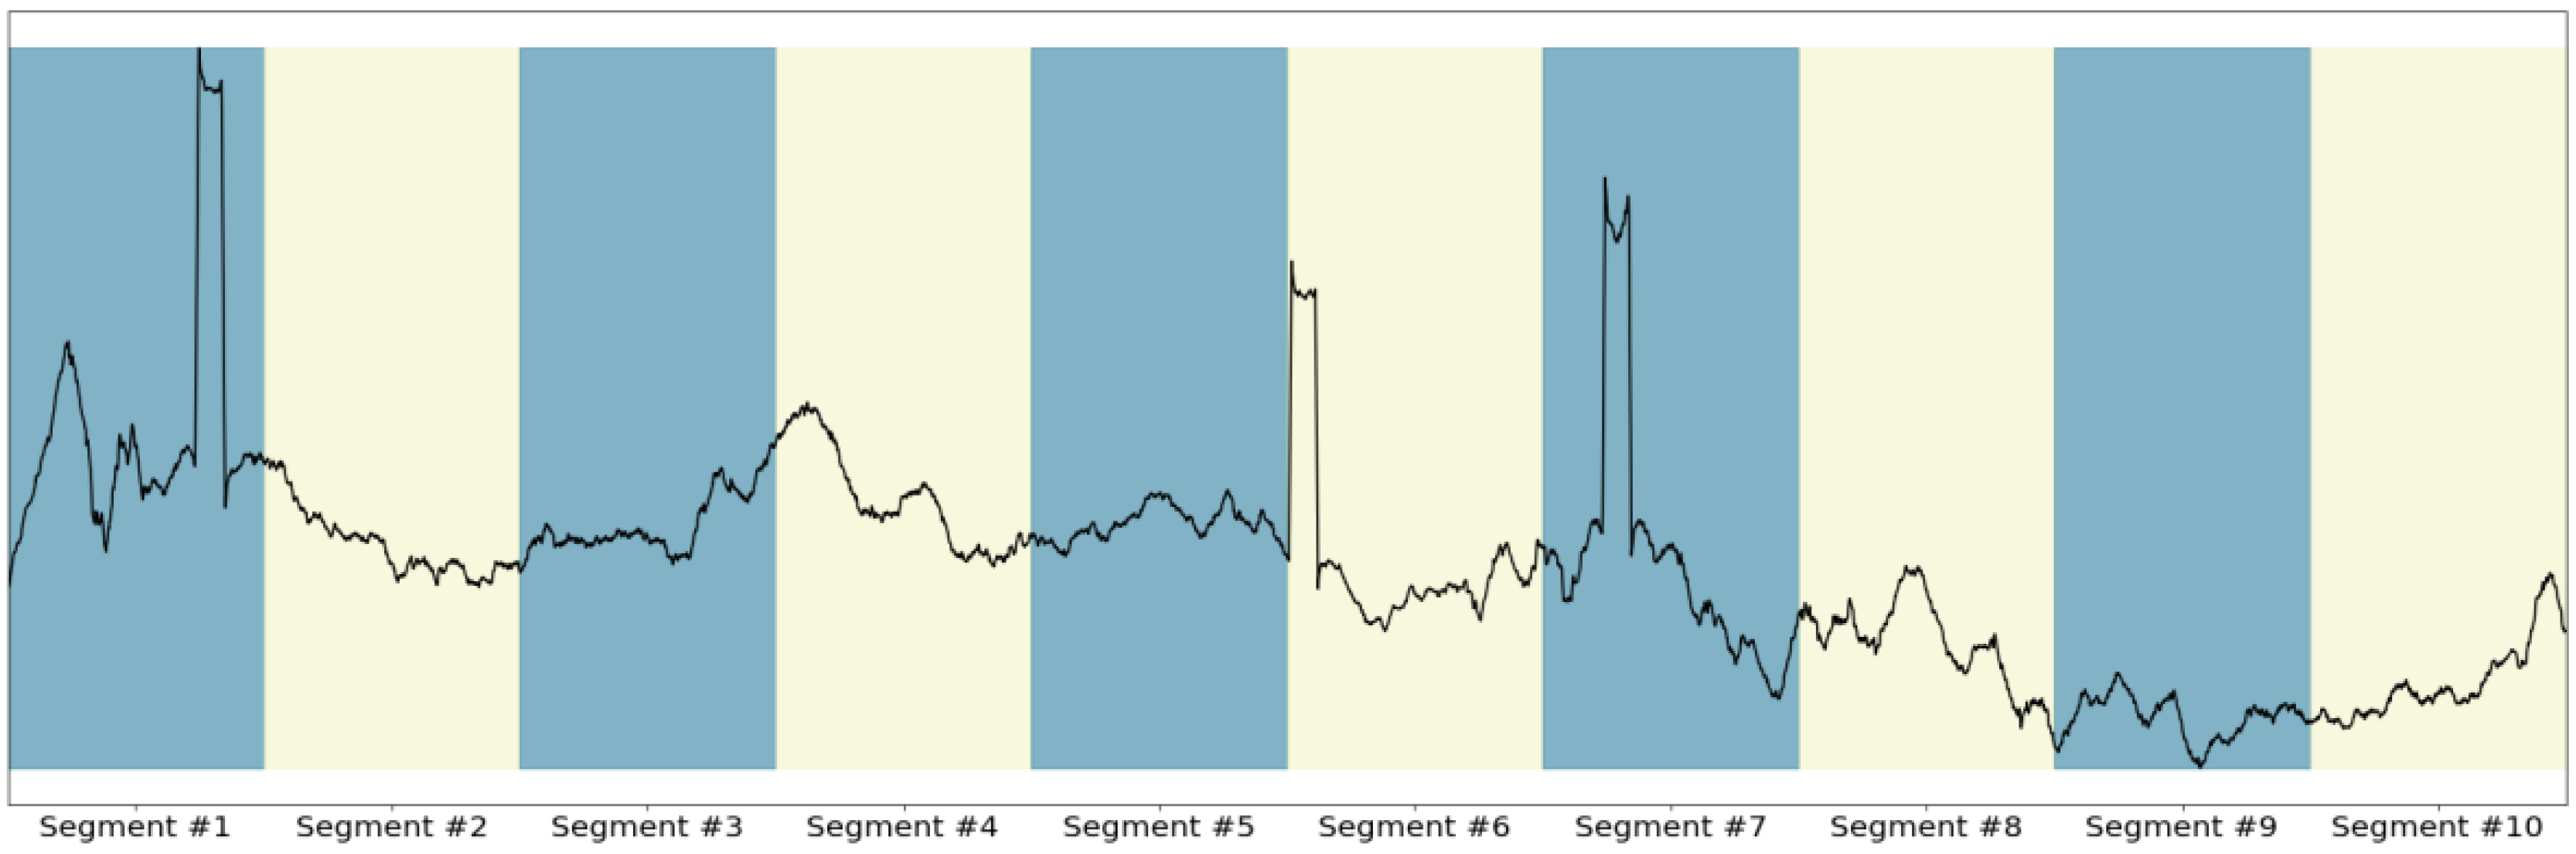
For the needs of our application, it was essential to parse the continuous-time series signals and create distinct segments that shall constitute the samples fed to the CNN. The dataset segmentation was carried out concerning a preconditioned timeframe, as illustrated in Figure 7, where the segmentation of an arbitrary signal was divided into 10 sections. Explicitly, for our application, a 5-min segment horizon was employed. Additionally, it is worth noting that an overlap of 75% between adjacent time windows was applied to maximize the number of available samples fed into the neural network. The 5-min input window with the 75% overlap yielded 250 samples across the two possible conditions of the user’s health (healthy and patient). These two states were equivalently represented in the dataset, as derived from the equal amount samples, respectively. Table 3 demonstrates the distribution of the samples to the training, validation, and test subsets for the neural net, respectively.

5. Results

After gathering samples, this section summarizes the obtained results using the device for 2 days. The data were monitored and recorded for analysis. The device was used three times each day for one hour for practical reasons. The experimental assessment is categorized into three main parts:
  • Overview of system interaction
  • Examination of data through the serial monitor each day of the quarantine
  • Presenting an outline of the most critical information during the whole quarantine period.
The interaction between each sensor, the displayed alert, and the data evaluation are examined. The measurements below were reported when the device was worn based on the following schedule. The quarantined person also used the device optimally to validate the data and acquire accurate results. The battery capacity lasts between 12–14 h of constant usage.
  • In the morning between 11.30 a.m. to 12.30 p.m.
  • In the evening, the device was worn from 5.30 p.m. to 6.30 p.m.
  • At night, the user wore the device between 7.30 p.m. and 8.30 p.m. and performed physical exercise.
Considering the fade time to acquire accurate readings using the high-accuracy contact thermometer, we started gathering samples after the 10-min mark for the most accurate measurements. Some of the parameters needed to take into consideration are listed as follows:
  • Age
  • Sex
  • Environment
  • Physical exercise before data gathering
  • People sick out of the people tested
  • Body part on which the sensor is used, etc.
  • Temperature sensors offset, etc.
  • The season during the year
  • Time of the day
  • Geolocation
It can be inferred from the information mentioned that data acquisition concerning temperature monitoring is a complicated procedure that requires carefully examined clues, large groups of people, and many other factors to guarantee the approximate maximum validity. Figure 8, Figure 9 and Figure 10 demonstrate the temperature signals acquired during the three use intervals, while Table 4 and Table 5 provide average values for different periods.
The user also measures the temperature several times during the day by using the infrared thermometer while taking off the device. All the data are monitored via BLE through a device because the infrared sensor does not require large amounts of sampling plus time to measure the results by hand.
The user also measures the temperature several times during the day by using the infrared thermometer while taking off the device. The device was programmed such that the user just needs to place the infrared sensor on the forehead, upper wrist, armpit, and rectum. All the data are monitored via BLE through a device for some time because the infrared sensor does not require high amounts of sampling plus time; hence, results can be measured by hand. Figure 11 illustrates the exercise time, and the orange line showcases the Boolean value of the quarantined person. Additionally, in the mentioned period, we witnessed the fluctuations in body temperature as time passed 20 min. It returned to normal after the exercising time passed, and the temperature returned to normal after ~10–20 min of exercising ended. Given the exercise information, the people responsible for the person in quarantine can acquire an accurate image of how this graph works and how the temperature fluctuates with exercise.

5.1. Ambient Conditions

The data of ambient conditions were also collected to visualize. The AmH is ordinarily high in Athens, especially in Piraeus. The quarantined person tried to adjust the room conditions during the day. The room temperature was mildly warm, constituting optimal conditions for the quarantined patient.
The data were used to demonstrate that the person that was monitored during quarantine had normal body conditions without fever while trying to maintain optimal room conditions, evincing that the designed system successfully tracked the person’s homeostasis under the COVID-19 pandemic. After using the device for an adjusted period, the user reported that the device had provided accurate information for the supervising people. Additionally, the patient’s family members were able to follow the temperature conditions as well as the ambient conditions (Figure 12), enabling them to take appropriate initiatives according to the data provided by the device (Table 6).

5.2. Deep Learning Analysis

For the selection of hyperparameters, we consulted [44], where unidimensional CNNs were employed to carry out Condition-Based Monitoring in-vessel equipment. The architecture of the networks, along with the applied value of other significant hyperparameters, such as the optimizer’s learning rate or the batch size, is tabulated in Table 7. The results of the experiments established the efficacy of the 1D-CNNs in identifying feverish symptoms to the user. Multiple runs were carried out to ensure the validity of our results. All 30 experiments yielded the same results, as shown in Figure 13 and Table 8. Explicitly, Table 8 presents the confusion matrix of the classifications demonstrating that the networks correctly classified every sample in the test set. Additionally, Figure 13 illustrates the Receiver Operating Characteristic (ROC) curve and the equivalent Area Under Curve (AUC) value, evincing the perfect classification carried out by our proposed classifier.

6. Conclusions

IoT-enables remote monitoring in the healthcare sector and enables physicians to treat their patients. Furthermore, remote monitoring of patients’ health contributes to curtail their hospital stay and prevents re-admissions. Therefore, the profound role of IoT in healthcare-related implementations becomes evident.
In the present study, a wearable system that can be used to monitor COVID-19 infected health status was presented. It was shown that the designed system successfully managed to monitor the user temperature and the ambient room temperature and humidity. The numerous measurements were acknowledged from the self-isolated person due to COVID-19. Furthermore, IoT enabled connecting sensor data supervising users via BLE. Utilizing the wireless protocol, the information almost always reached the connected devices, which is critical since the virus is most infectious via the respiratory system. This project’s primary goal was to design a functional device while also bearing its intuitiveness, practicality, along with its affordability. This small-size device was equipped with sensors managing to supervise the user’s health and distinguish high temperature due to fever or physical exercise. This device successfully measured wrist temperature at all states, ranging from 32 °C initially to 39 °C, providing better battery autonomy than other similar devices from pertinent literature, lasting over 12 h of usage and data recording, with fast charging capabilities (500 mA), and utilizing the BLE 5.0 protocol for data wireless data transmission and low power consumption.
This study emphasized the development of a Continuous Displacement Algorithm following the default thresholds of maximum points and temperature. Besides that, the ambient temperature and humidity were always available for the quarantined person to use and adjust accordingly to ensure suitable living conditions. Lastly, our samples were tested in deep learning analysis. The samples acquired during the three measurement periods were gathered and fed to a unidimensional CNN. This practice showcased remarkable accuracy in classifying the condition of the user concerning its febrility, achieving a perfect classification accuracy of the samples in the test set. Currently, the designed device underwent a series of clinical trials with the support of infected people to validate its strengths and identify its weaknesses. Besides, machine learning techniques to improve the system’s accuracy were considered.
Henceforward, the designed device will be tested with more people to validate its strengths and identify its weaknesses. In addition to that, it is scheduled to use machine learning techniques to improve the system’s accuracy. Another aspect providing room for improvement is the battery life along with the addition of a pulse oximeter sensor. This device can also be upgraded in terms of sensor calibration to provide more accurate results from all the sensors included. We also aim to materialize further improvements regarding the following attributes: the CDA, and the addition of a WiFi and GPS module for selection, MQTT protocol for data visualization on a personal computer or a mobile device interactively via NodeRed, and an OLED screen from non-touch to touch display. Furthermore, one future direction entails experimentation of this device and its efficacy on actual patients suffering from COVID-19.

Author Contributions

Conceptualization, C.S.; Data curation, A.-C.D., P.T. and N.V.; Formal analysis, A.-C.D., P.T. and C.S.; Project administration, C.S. and N.V.; Software, A.-C.D. and P.T.; Supervision, C.S. and N.V.; Validation, C.S. and N.V.; Writing—original draft, A.-C.D. and P.T.; Writing—review & editing, C.S. and N.V. All authors have read and agreed to the published version of the manuscript.

Funding

This research received no external funding.

Institutional Review Board Statement

Not applicable.

Informed Consent Statement

Not applicable.

Conflicts of Interest

The authors declare no conflict of interest.

References

  1. Goar, V.K.; Yadav, N.S.; Chowdhary, C.L.P.K.; Mittal, M. An IoT and Artificial Intelligence based Patient Care System focused on COVID-19 Pandemic. Int. J. Netw. Virtual Organ. 2022, in press. [Google Scholar]
  2. Al Bassam, N.; Hussain, S.A.; Al Qaraghuli, A.; Khan, J.; Sumesh, E.P.; Lavanya, V. IoT based wearable device to monitor the signs of quarantined remote patients of COVID-19. Inform. Med. Unlocked 2021, 24, 100588. [Google Scholar] [CrossRef] [PubMed]
  3. Best, J. Wearable technology: COVID-19 and the rise of remote clinical monitoring. BMJ 2021, 372, 413. [Google Scholar] [CrossRef] [PubMed]
  4. Channa, A.; Popescu, N.; Skibinska, J.; Burget, R. The Rise of Wearable Devices during the COVID-19 Pandemic: A Systematic Review. Sensors 2021, 21, 5758. [Google Scholar] [CrossRef] [PubMed]
  5. Füzéki, E.; Groneberg, D.A.; Banzer, W. Physical Activity during COVID-19 Induced Lockdown: Recommendations. J. Occup. Med. Toxicol. 2020, 15, 1–5. [Google Scholar] [CrossRef] [PubMed]
  6. WHO. Available online: https://www.euro.who.int/en/health-topics/health-emergencies/coronavirus-covid-19/publications-and-technical-guidance/noncommunicable-diseases/stay-physically-active-during-self-quarantine (accessed on 23 November 2021).
  7. Gleeson, M. Temperature Regulation during Exercise. Int. J. Sports Med. 1998, 19 (Suppl. 2), S96–S99. [Google Scholar] [CrossRef] [PubMed]
  8. Machine Learning Mastery. 2018. Available online: https://machinelearningmastery.com/deep-learning-models-for-human-activity-recognition/ (accessed on 19 November 2021).
  9. Subasi, A.; Khateeb, K.; Brahimi, T.; Sarirete, A. Chapter 5—Human activity recognition using machine learning methods in a smart healthcare environment. In Innovation in Health Informatics; Lytras, M.D., Sarirete, A., Eds.; Academic Press: Cambridge, MA, USA, 2020; pp. 123–144. [Google Scholar] [CrossRef]
  10. Bluetooth® Low Energy Channels—Developer Help. Available online: https://microchipdeveloper.com/wireless:ble-link-layer-channels (accessed on 19 November 2021).
  11. Bluetooth Technology Overview. Bluetooth® Technology Website. Available online: https://www.bluetooth.com/learn-about-bluetooth/tech-overview/ (accessed on 19 November 2021).
  12. Digital Non-Contact Infrared Thermometer (MLX90614) #Melexis. Available online: https://www.melexis.com/en/product/mlx90614/digital-plug-play-infrared-thermometer-to-can (accessed on 19 November 2021).
  13. Industries, Adafruit. Available online: https://www.adafruit.com/product/1782 (accessed on 19 November 2021).
  14. STMicroelectronics. Available online: https://www.st.com/en/mems-and-sensors/lsm9ds1.html (accessed on 23 November 2021).
  15. Adafruit Learning System. Available online: https://learn.adafruit.com/adafruit-pcf8523-real-time-clock/overview (accessed on 19 November 2021).
  16. Long, H.M.; Carratù, M.; Paciello, V.; Pietrosanto, A. Body Temperature—Indoor Condition Monitor and Activity Recognition by MEMS Accelerometer Based on IoT-Alert System for People in Quarantine Due to COVID-19. Sensors 2021, 21, 2313. [Google Scholar] [CrossRef]
  17. Smarr, B.L.; Aschbacher, K.; Fisher, S.M.; Chowdhary, A.; Dilchert, S.; Puldon, K.; Rao, A.; Hecht, F.M.; Mason, A.E. Feasibility of Continuous Fever Monitoring Using Wearable Devices. Sci. Rep. 2020, 10, 21640. [Google Scholar] [CrossRef] [PubMed]
  18. Vedaei, S.S.; Fotovvat, A.; Mohebbian, M.R.; Rahman, G.M.; Wahid, K.A.; Babyn, P.; Marateb, H.R.; Mansourian, M.; Sami, R. COVID-SAFE: An IoT-Based System for Automated Health Monitoring and Surveillance in Post-Pandemic Life. IEEE Access 2020, 8, 188538–188551. [Google Scholar] [CrossRef] [PubMed]
  19. Stojanović, R.; Škraba, A.; Lutovac, B. A Headset Like Wearable Device to Track COVID-19 Symptoms. In Proceedings of the 2020 9th Mediterranean Conference on Embedded Computing (MECO), Budva, Montenegro, 8–11 June 2020; pp. 1–4. [Google Scholar] [CrossRef]
  20. Hanoon, I.K.; Aal-Nouman, M.I. Cloud-based COVID-19 Patient Monitoring using Arduino. In Proceedings of the 2021 3rd East Indonesia Conference on Computer and Information Technology (EIConCIT), Surabaya, Indonesia, 9–11 April 2021; pp. 292–296. [Google Scholar] [CrossRef]
  21. Anjali, K.; Anand, R.; Prabhu, S.D.; Geethu, R.S. IoT Based Smart Healthcare System to Detect and Alert Covid Symptom. In Proceedings of the 2021 6th International Conference on Communication and Electronics Systems (ICCES), Coimbatre, India, 8–10 July 2021; pp. 685–692. [Google Scholar] [CrossRef]
  22. Arduino. Available online: https://www.arduino.cc/en/software (accessed on 29 November 2021).
  23. Exploring Arduino. Available online: https://www.exploringarduino.com/ (accessed on 19 November 2021).
  24. Learn.Sparkfun. Available online: https://learn.sparkfun.com/tutorials/i2c/all (accessed on 29 November 2021).
  25. Learn.Sparkfun. Available online: https://learn.sparkfun.com/tutorials/serial-peripheral-interface-spi/all (accessed on 29 November 2021).
  26. SparkFun Electronics. Available online: https://www.sparkfun.com/products/13777 (accessed on 19 November 2021).
  27. Wipro. Available online: https://www.wipro.com/business-process/what-can-iot-do-for-healthcare-/ (accessed on 29 November 2021).
  28. Ukil, A.; Bandyoapdhyay, S.; Puri, C.; Pal, A. IoT Healthcare Analytics: The Importance of Anomaly Detection. In Proceedings of the 2016 IEEE 30th International Conference on Advanced Information Networking and Applications (AINA), Crans-Montana, Switzerland, 23–25 March 2016; pp. 994–997. [Google Scholar] [CrossRef]
  29. Ceren, A.H.; Yetisen, A.K.; Güder, F.; Dincer, C. Wearable Devices for the Detection of COVID-19. Nat. Electron. 2021, 4, 13–14. [Google Scholar] [CrossRef]
  30. Islam, M.M.; Mahmud, S.; Muhammad, L.J.; Islam, M.R.; Nooruddin, S.; Ayon, S.I. Wearable Technology to Assist the Patients Infected with Novel Coronavirus (COVID-19). SN Comput. Sci. 2020, 1, 320. [Google Scholar] [CrossRef] [PubMed]
  31. Omega Engineering. Available online: https://www.omega.co.uk/prodinfo/infrared-thermometers.html (accessed on 19 November 2021).
  32. TEGAM. Available online: https://www.tegam.com/advantages-of-contact-thermometers-over-non-contactinfrared-thermometers/ (accessed on 19 November 2021).
  33. STMicroelectronics. Available online: https://www.st.com/en/mems-and-sensors/hts221.html (accessed on 29 November 2021).
  34. Occupational Safety and Health Administration. Available online: https://www.osha.gov/indoor-air-quality/faqs (accessed on 19 November 2021).
  35. 37.5. Available online: https://www.thirtysevenfive.com/uncategorized/blog/so-whats-the-ideal-body-temperature-during-exercise/ (accessed on 19 November 2021).
  36. MedlinePlus. Available online: https://medlineplus.gov/ency/article/001982.htm (accessed on 19 November 2021).
  37. Quraishi, S.A.; Berra, L.; Nozari, A. Indoor Temperature and Relative Humidity in Hospitals: Workplace Considerations during the Novel Coronavirus Pandemic. Occup. Environ. Med. 2020, 77, 508. [Google Scholar] [CrossRef] [PubMed]
  38. Waveshare Wiki. Available online: https://www.waveshare.com/wiki/1.3inch_OLED_(B) (accessed on 19 November 2021).
  39. Punch Through. Available online: https://punchthrough.com/lightblue/ (accessed on 29 November 2021).
  40. NRF Connect for Mobile. Available online: https://www.nordicsemi.com/Products/Development-tools/nRF-Connect-for-mobile (accessed on 23 November 2021).
  41. TinyML. Available online: https://www.tinyml.org/ (accessed on 19 November 2021).
  42. TensorFlow. Available online: https://www.tensorflow.org/ (accessed on 29 November 2021).
  43. Ge, C.H.E.N.; Jiarong, X.I.E.; Guangli, D.A.I.; Peijun Zheng, X.H.; Hongpeng, L.U.; Lei, X.U.; Xueqin, C.H.E.N.; Xiaomin, C.H.E.N. Validity of the Use of Wrist and Forehead Temperatures in Screening the General Population for COVID-19: A Prospective Real-World Study. Iran. J. Public Health 2020, 49 (Suppl. S1), 57–66. [Google Scholar] [CrossRef]
  44. Theodoropoulos, P.; Spandonidis, C.C.; Giannopoulos, F.; Fassois, S. A Deep Learning-Based Fault Detection Model for Optimization of Shipping Operations and Enhancement of Maritime Safety. Sensors 2021, 21, 5658. [Google Scholar] [CrossRef] [PubMed]
Figure 1. Wearable prototype and BLE advertised services.
Signals 03 00002 g001
Figure 2. Principle of operation of the designed system.
Signals 03 00002 g002
Figure 3. No activity.
Signals 03 00002 g003
Figure 4. Ordinary movements.
Signals 03 00002 g004
Figure 5. Physical exercise.
Signals 03 00002 g005
Figure 6. CDA flowchart.
Signals 03 00002 g006
Figure 7. Illustration of signal segmentation.
Signals 03 00002 g007
Figure 8. Morning Temperature signal.
Signals 03 00002 g008
Figure 9. Evening Temperature signal.
Signals 03 00002 g009
Figure 10. Night Temperature signal.
Signals 03 00002 g010
Figure 11. Exercise and temperature status.
Signals 03 00002 g011
Figure 12. Ambient conditions.
Signals 03 00002 g012
Figure 13. ROC curve of the 1D CNN classifier.
Signals 03 00002 g013
Table 1. Sensors and protocols in this project compared to pertinent literature.
Our DeviceSimilar Devices from Literature
Modules UsedProtocolsModules UsedProtocols
Arduino Nano 33 BLEI2CM5stickC (ESP32 based)I2C
MLX90614SPIESP8266SPI
PCF8523 RTCBLEATmega 2560WI-FI
MCP9808MLX906144G/5G
HTS221MCP9808LORA
NINA B306 BLEMAX30100MQTT
LMSDS1 9-axis IMU
1.3 inch OLED display
Table 2. Number of data points available.
ConditionDurationFrequency (Hz)Data Points
Healthy1 h13600
Febrile1 h13600
Total2 h17200
Table 3. Division of samples to each dataset.
Input WindowTotal SamplesTrain SetValidation SetTest Set
5 min125100520
5 min125100520
-2502001040
Table 4. Average Body Temperature of a day (High-Accuracy Touch Temperature Sensor).
ParametersMorningEveningNight
Minimum (°C)32.435.135.2
Maximum (°C)35.6437.1537.23
Average (°C)34.9736.2836.39
Exercising (0/1)001
Threshold (°C)37.037.037.5
Table 5. Average body temperature of a day (I.R. sensor).
TimeBody TempExercising (0/1)
8.35 am33.40
6.35 pm34.90
3.35 pm35.30
7.40 pm34.61
Table 6. Reported data from ambient conditions.
Average ValueMorningAfternoonNight
Humidity (%)535048
Temperature (°C)252729
Table 7. Architecture of 1D CNN.
Name of ComponentValue
Convolutional Layer #1256 × 256 × 15, Kernels: 3 × 3
Max Pooling Layer #1128 × 128 × 15 Kernels: 2 × 2
Convolutional Layer #2128 × 128 × 6, Kernels: 3 × 3
Max Pooling Layer #264 × 64 × 6, Kernels: 2 × 2
Convolutional Layer #364 × 64 × 6, Kernels: 3 × 3
Max Pooling Layer #332 × 32 × 6, Kernels: 2 × 2
FCN Layer #13 nodes, Dropout = 0
Output Layer2 nodes
Learning Rate5·10−4.0
Weight updatesEpochs·BatchSize = 8·100 = 800
Table 8. Confusion matrix of the 1D CNN classifier in identifying febrile patients.
True Class
Negative LabeledPositive Labeled
Predicted ClassNegative200
Positive020
Publisher’s Note: MDPI stays neutral with regard to jurisdictional claims in published maps and institutional affiliations.

