
A Study on the Essential and Parkinson’s Arm Tremor Classification †

 ,
,  ,
,
Abstract
:1. Introduction
2. Essential and Parkinson’s Tremor
2.1. Essential Tremor: Overview and Diagnosis
- chronic alcohol use;
- intake of antiarrhythmic, antidepressant and antispasmodic drugs;
- use of substances such as nicotine or cocaine.
- Starts gradually, mainly on one side of the body and focusing on the hands.
- Gets worse as movement increases.
- Increases with caffeine intake, stress, excessive fatigue and abrupt temperature changes.
- Causes a “yes-yes” and “no-no” head movement.
2.2. Parkinson’s Tremor: Overview and Diagnosis
- some daily activities are accomplished slower than in the past,
- balance problems,
- the letters become smaller when writing,
- tremor appears in the palm, hand, lips and legs,
- muscle stiffness,
- problems when walking (confused feet, step diminishes),
- the feeling that the feet are stuck on the floor,
- one hand remains motionless when walking,
- change in voice and sound pitch,
- difficulty of the person to get up from a seated position,
- weakness when fastening a garment.
- daily life experiences,
- daily life kinetic experiences,
- motion examination,
- difficulties occurring during various movements.
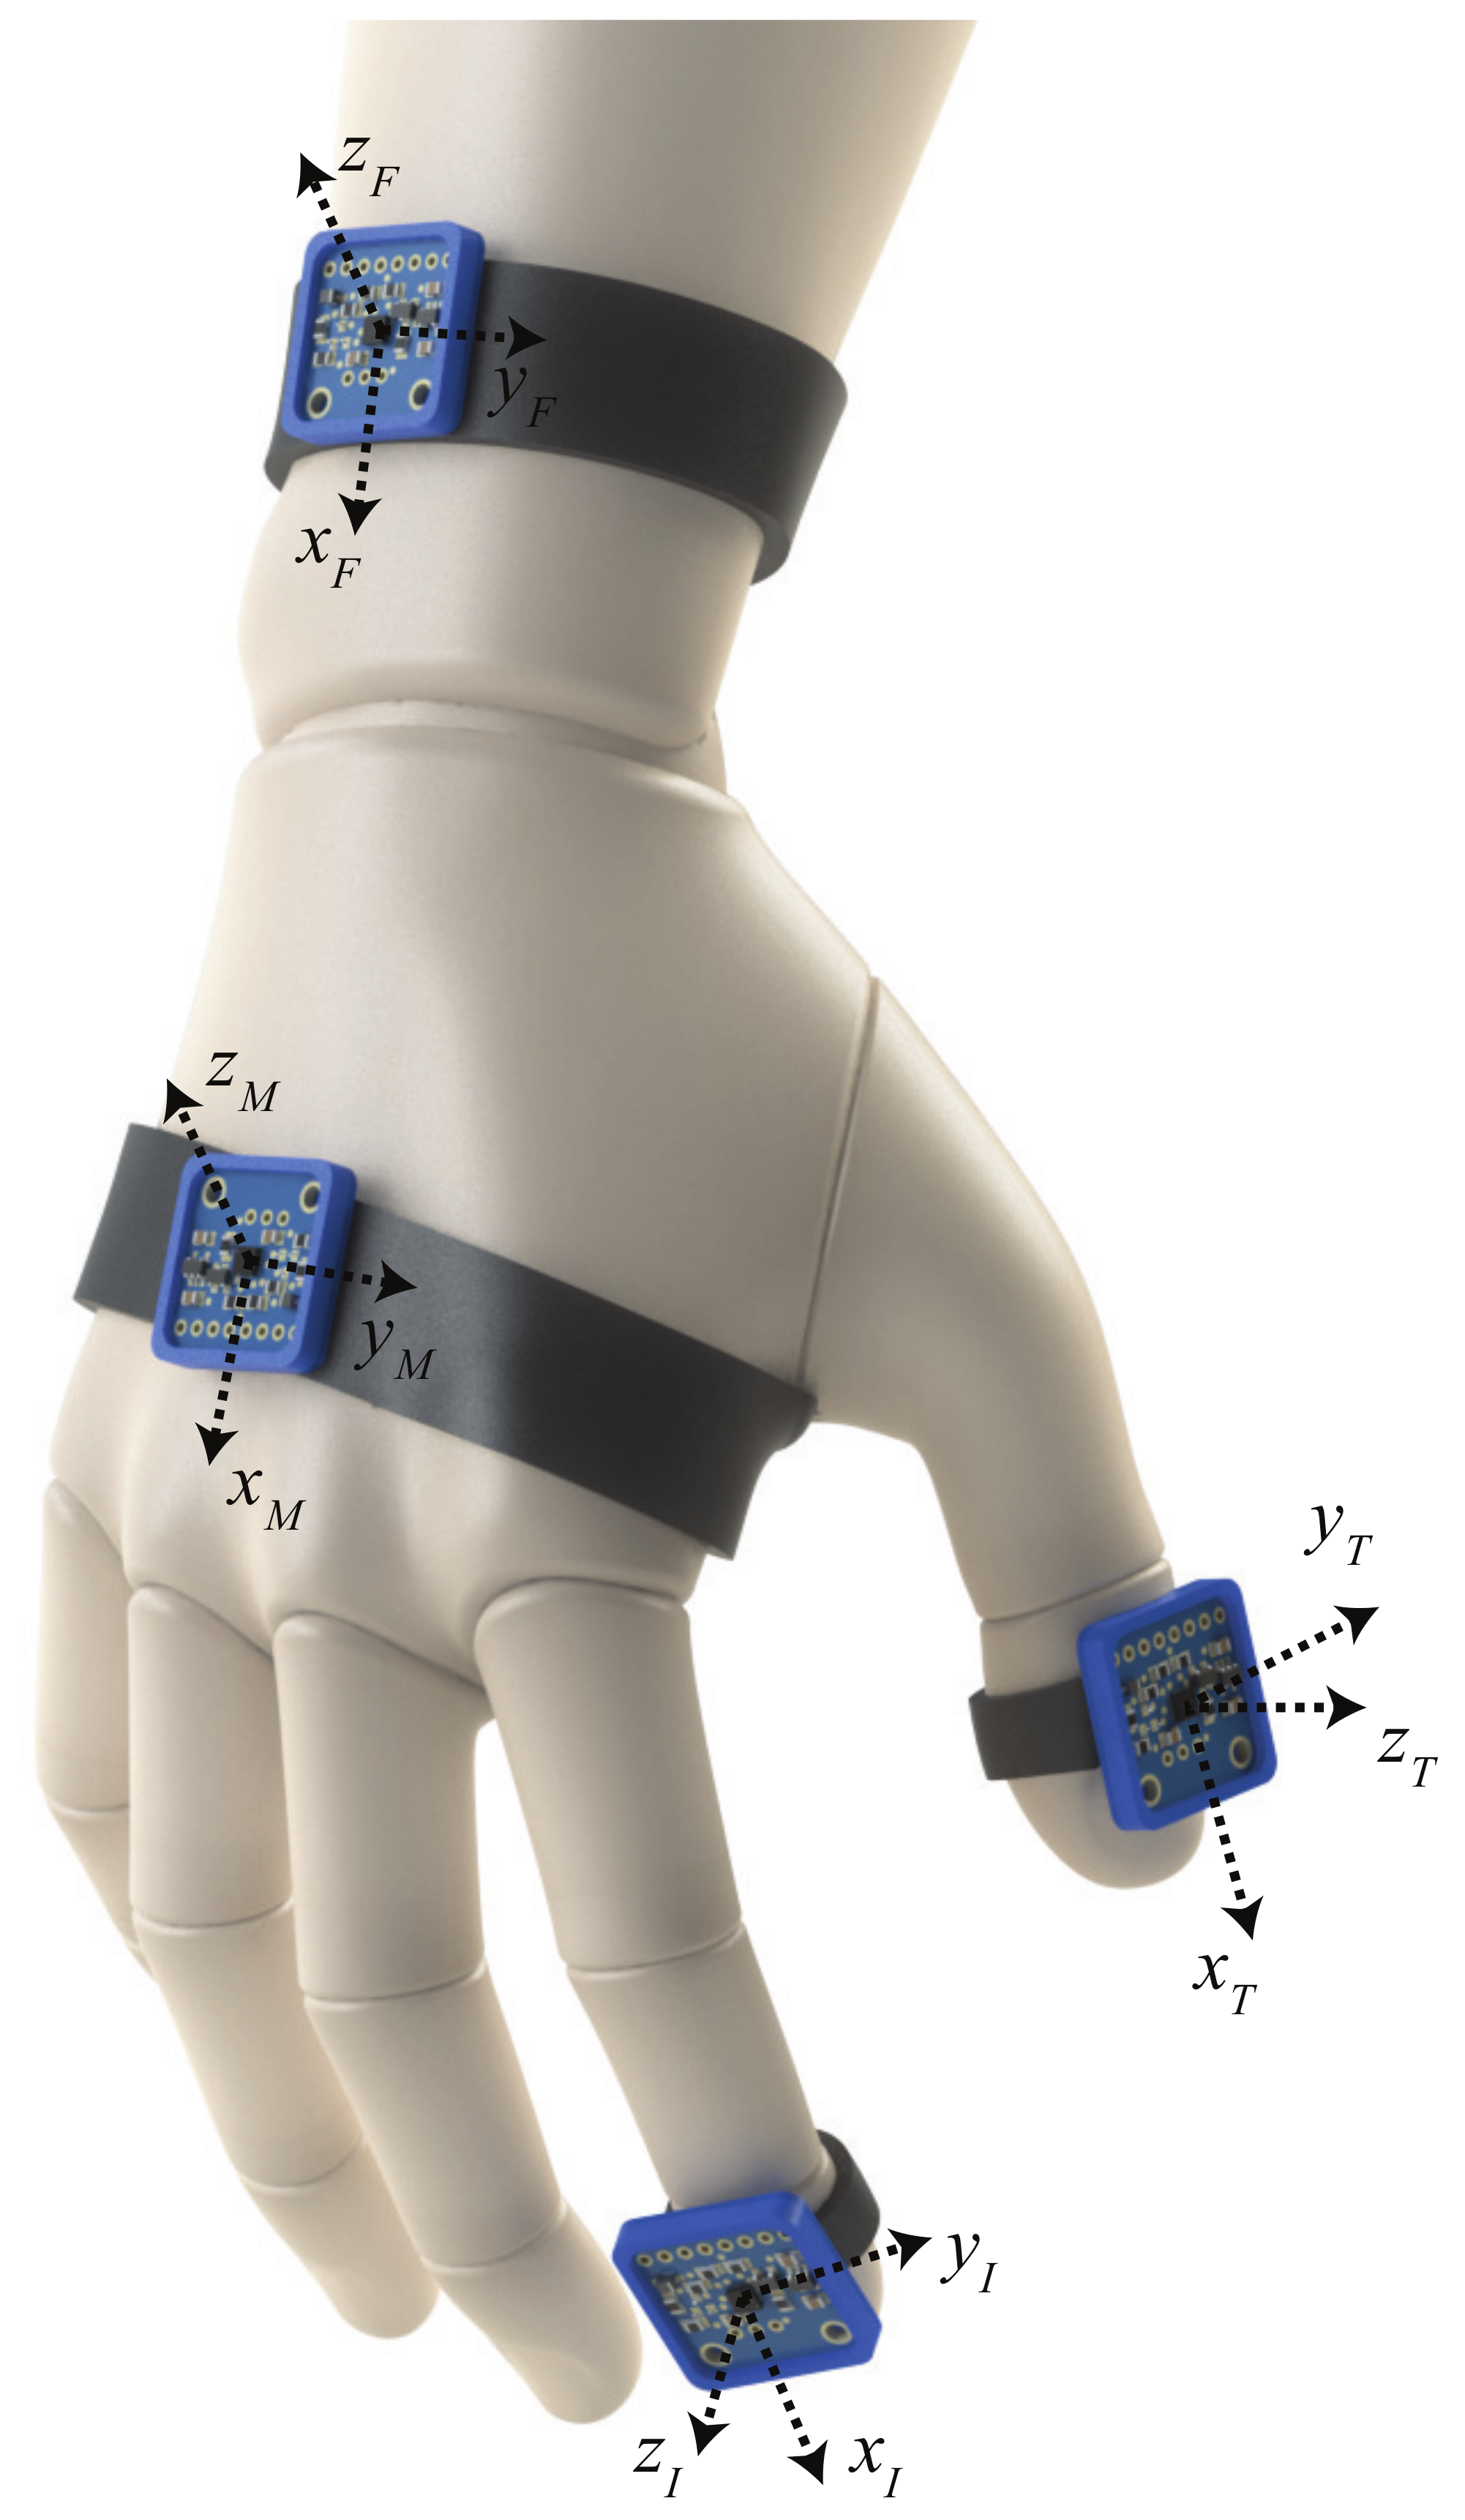
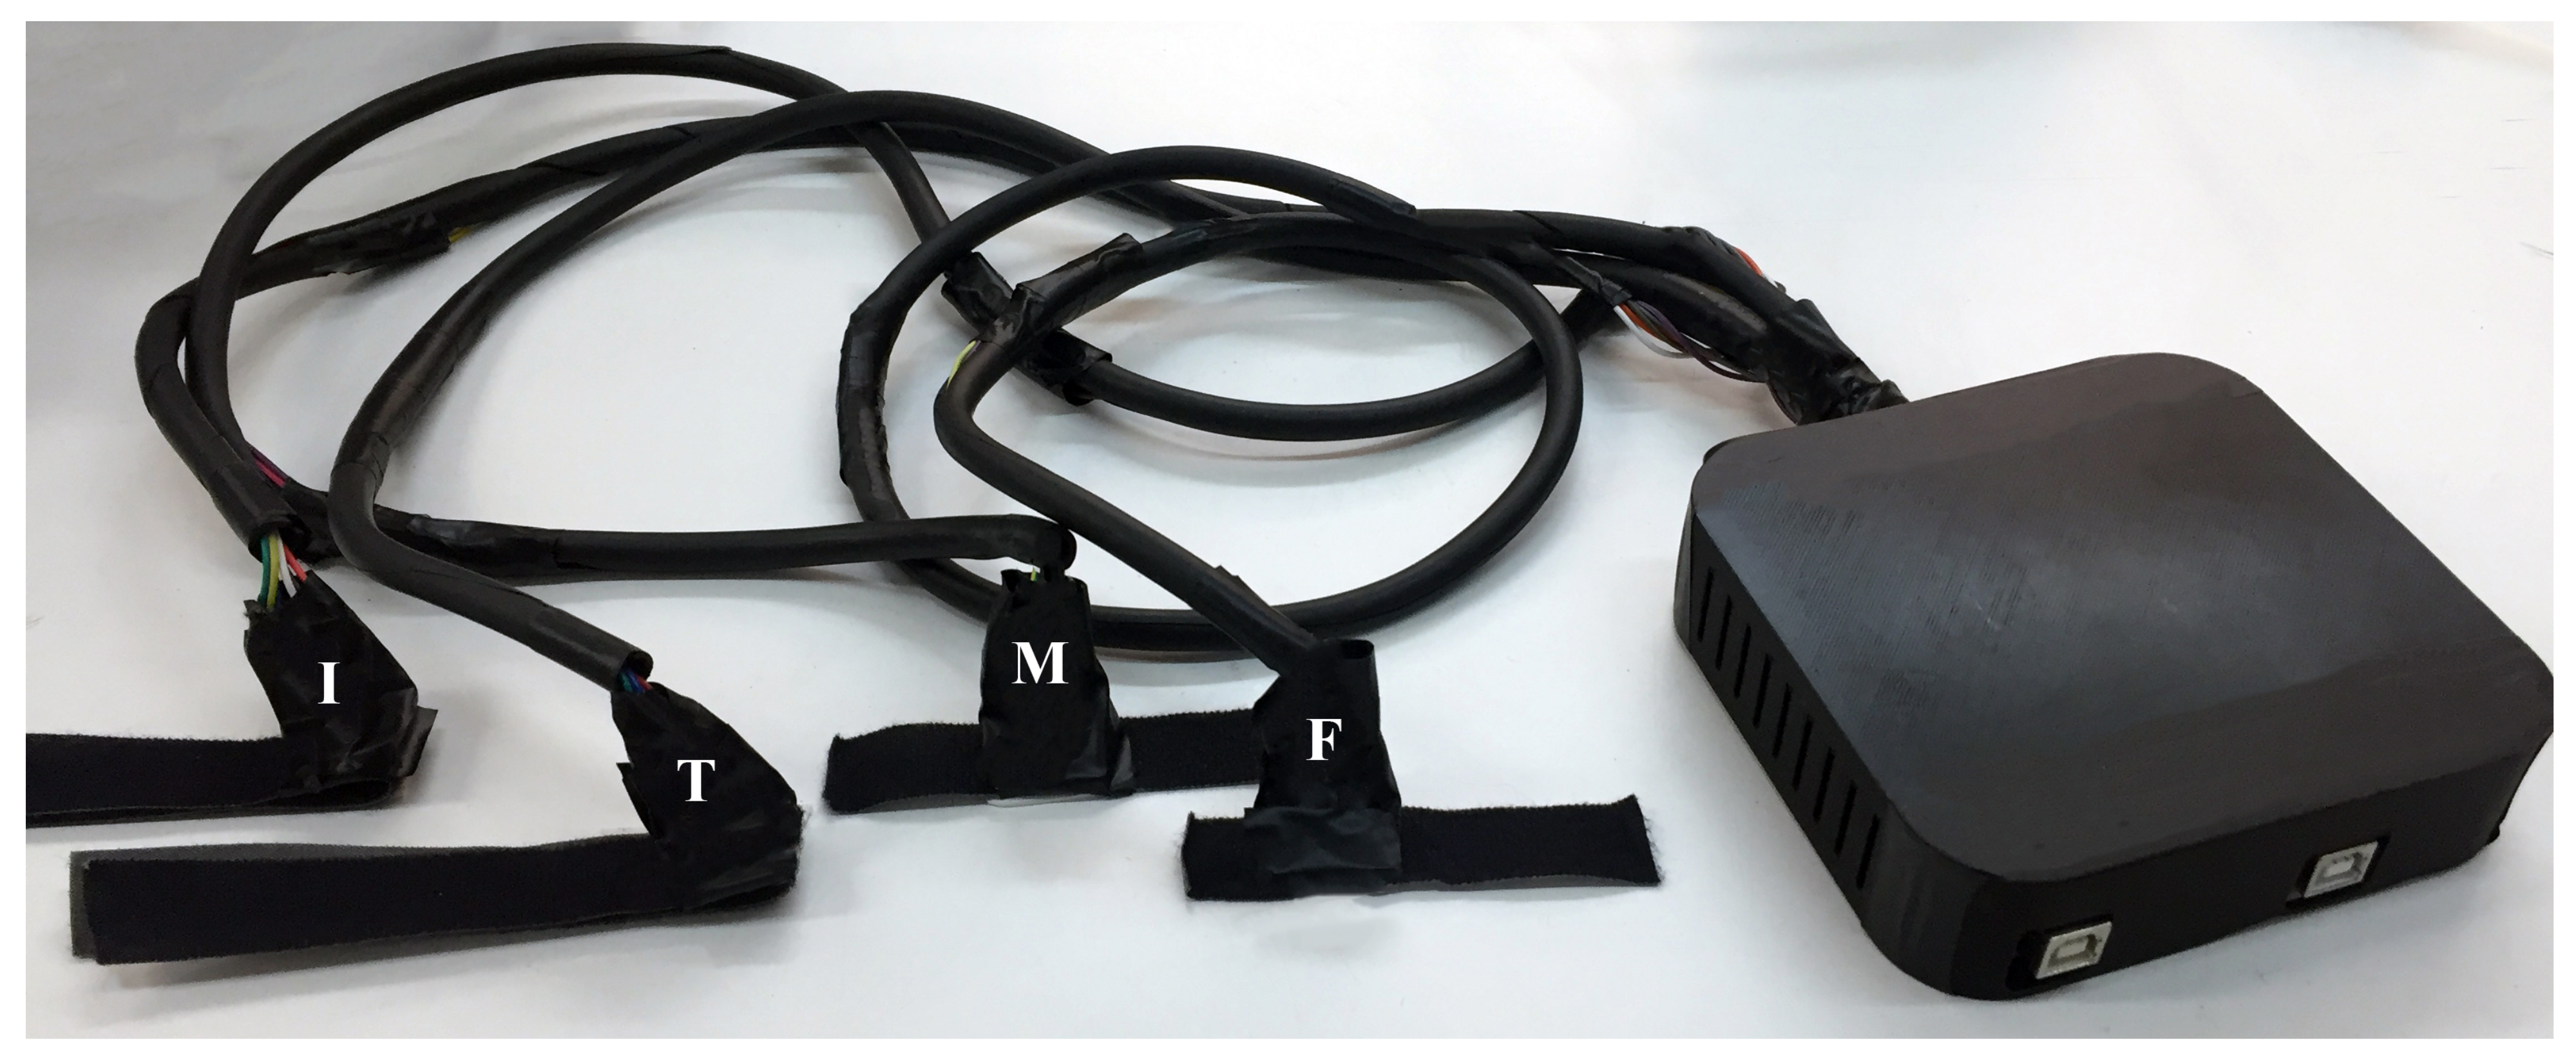
3. Data Acquisition Setup
3.1. Setup Specifics
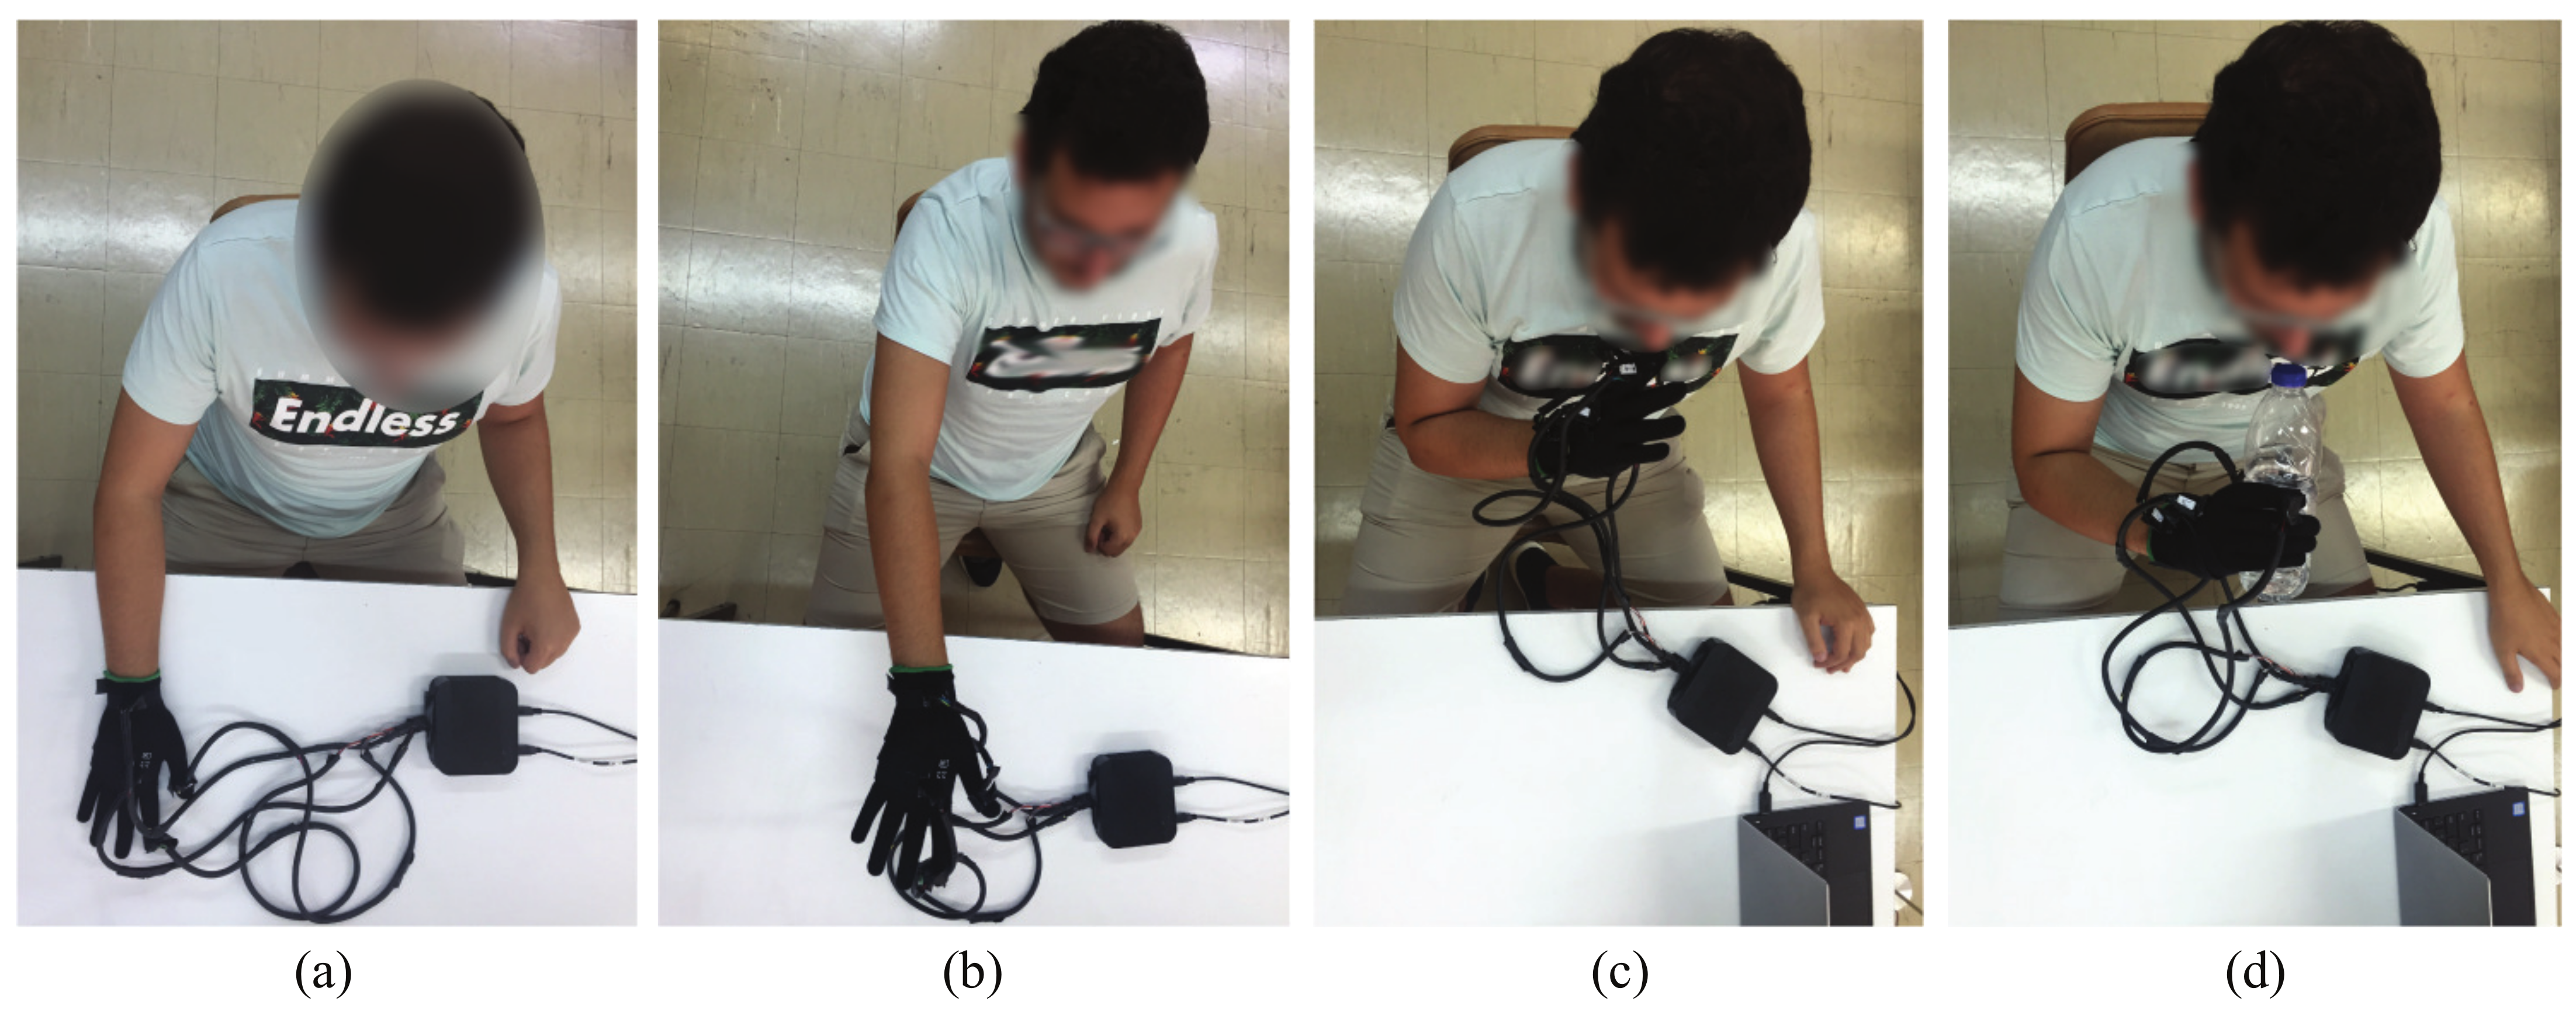
3.2. Acquisition Procedure
- Resting position: The palm touches the table without exercising force (Figure 3a).
- Extended position: The hand is extended at shoulder height (Figure 3b).
- Free motion: The hand performs an oscillatory movement from the table to the nose. This movement is repeated for the whole recording at moderate speed (Figure 3c).
- Motion while holding an object: The hand makes the same movement as in the free motion position, but this time the hand is holding a bottle half-full of water (Figure 3d).
4. Methodology
4.1. Data Acquisition and Processing
4.2. Extracted Features
- Division of initial acquired signal in sections (). Given that the total number of samples for each measurement is approximately 1800 (sampling rate: 62.5 Hz and recording time: 30 s) and each section consists of 40 samples, the total number of sections is approximately 45 with no overlaps.
- Calculation of local maximum for every section ().
- Calculation of an amplitude change, , for every section, defined as the absolute difference of the maximum acceleration of the previous section () from the maximum of the current section (), with .
- Calculation of the mean amplitude change.
- Calculation of the mean absolute deviation of amplitude changes.
- Calculation, for every section, of the period, , the difference between the time of the current section’s maximum and the previous section’s maximum.
- Calculation of the mean period.
- Calculation of the mean absolute deviation of periods.
- Finally, from the 4 extracted parameters, the mean, maximum, and minimum across accelerometer axes of each of the 4 features described above are calculated:
- Mean, maximum and minimum value of median value sum of each section’s amplitude (mean_amp).
- Mean, maximum and minimum value of median value sum of each section’s amplitude deviation (amp_dev).
- Mean, maximum and minimum value of median value sum of each section’s (t_mean).
- Mean, maximum and minimum value of median value sum of each section’s deviation (t_dev).
4.3. Categorization
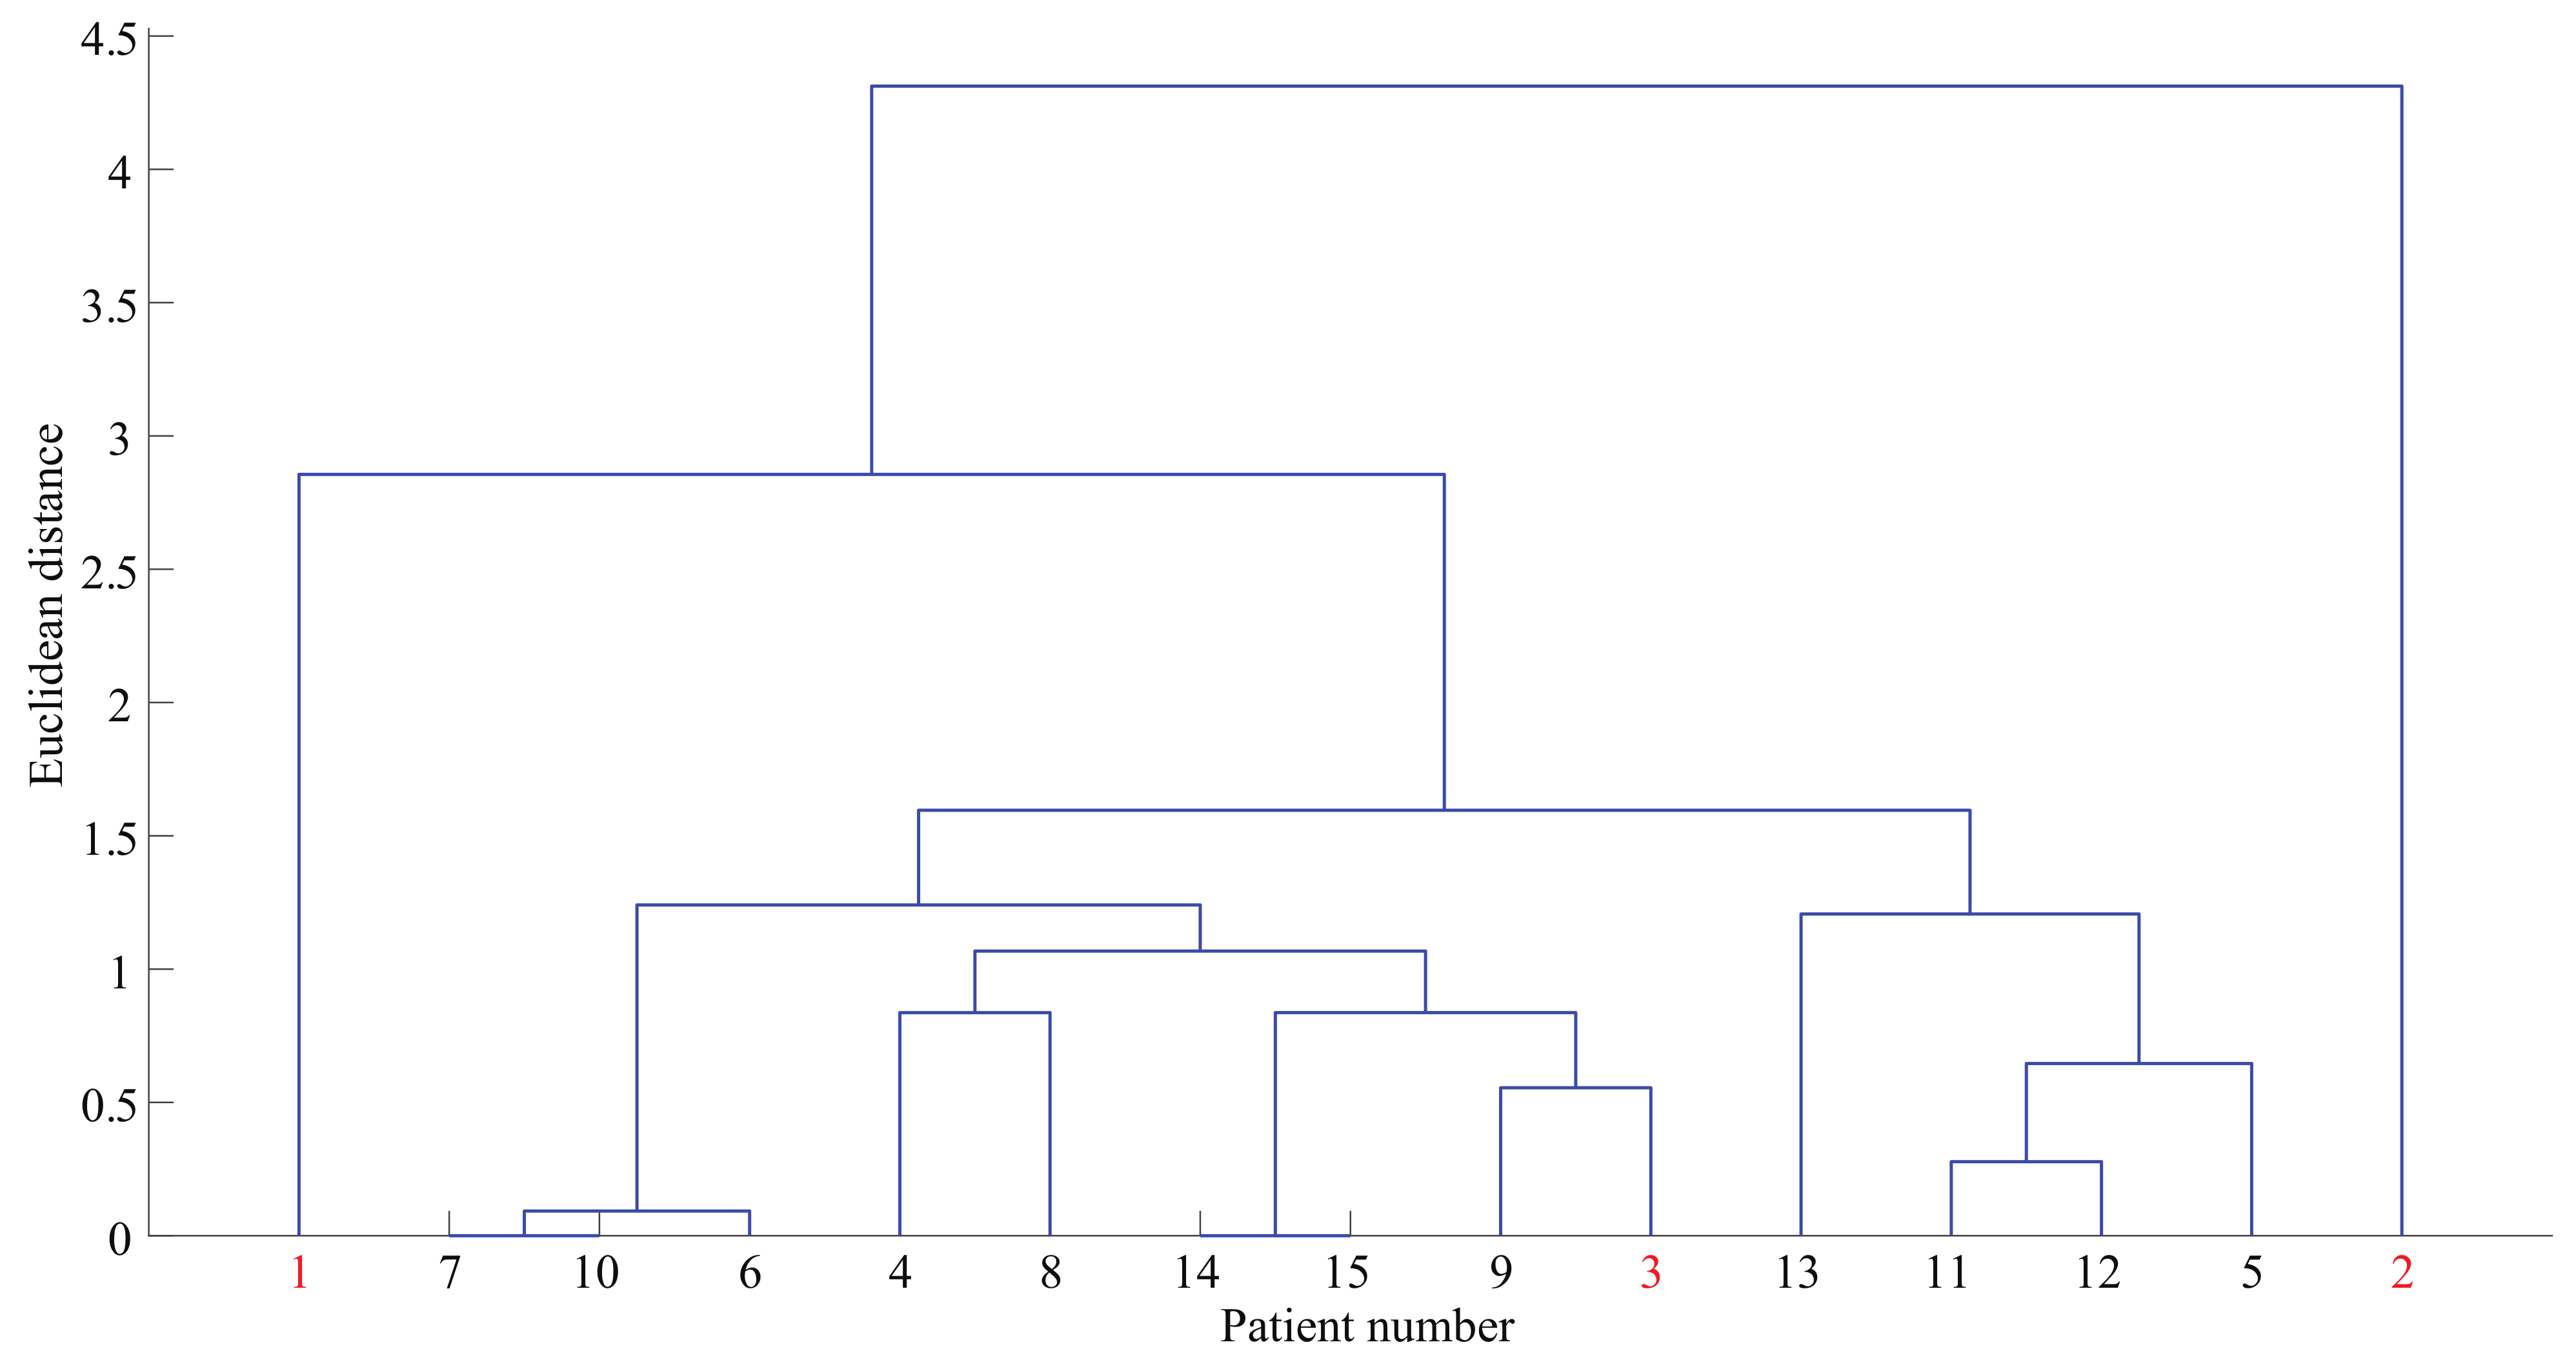
4.4. Hierarchical Clustering
4.5. Classification
5. Results
5.1. Received Data
5.2. Categorization
5.3. Hierarchical Grouping
5.4. Model Training and Prediction
5.5. Results
6. Conclusions
7. Future Work
Author Contributions
Funding
Institutional Review Board Statement
Informed Consent Statement
Data Availability Statement
Conflicts of Interest
Abbreviations
| PT | Parkinson’s tremor |
| ET | Essential tremor |
| NT | No diagnosed tremor |
| TETRAS | The ET Rating Assessment Scale |
| FDA | Food and Drug Administration |
| PET | Positron Emission Tomography |
| CT | Computed tomography |
| MDS | Movement Disorder Society |
| UPDRS | Unified Parkinson’s Disease Rating Scale |
| SPI | Serial Peripheral Interface |
| SSC | Statistical Signal Characteristics |
| LDA | Linear discriminant analysis |
| QDA | Quadratic discriminant analysis |
| SVM | Support vector machine |
| KNN | K-nearest neighbor |
| PSD | Power spectral density |
| CNN | Convolutional Neural Network |
| PCA | Principal Component Analysis |
References
- Anouti, A.; Koller, W.C. Tremor disorders. Diagnosis and management. West. J. Med. 1995, 162, 510. [Google Scholar] [PubMed]
- Bötzel, K.; Tronnier, V.; Gasser, T. Differenzialdiagnose und therapie des tremors. Dtsch. Arztebl 2014, 111, 225–235. [Google Scholar] [CrossRef] [Green Version]
- Louis, E.D. Linking Essential Tremor to the Cerebellum: Neuropathological Evidence. Cerebellum 2016, 15, 235–242. [Google Scholar] [CrossRef]
- Louis, E.D.; Ottman, R. How many people in the USA have essential tremor? Deriving a population estimate based on epidemiological data. Tremor Other Hyperkinet. Mov. 2014, 4, 259. [Google Scholar] [CrossRef] [PubMed]
- McAuley, J.H. Physiological and pathological tremors and rhythmic central motor control. Brain 2000, 123, 1545–1567. [Google Scholar] [CrossRef] [PubMed]
- Ahlrichs, C.; Lawo, M. Parkinson’s Disease Motor Symptoms in Machine Learning: A Review. Health Inform. Int. J. 2013, 2, 1–18. [Google Scholar] [CrossRef]
- Mandal, I.; Sairam, N. New machine-learning algorithms for prediction of Parkinson’s disease. Int. J. Syst. Sci. 2014, 45, 647–666. [Google Scholar] [CrossRef]
- Kavindya, P.; Awantha, W.V.; Wanasinghe, A.T.; Kulasekera, A.L.; Chathuranga, D.S.; Senanayake, B. Evaluation of Hand Tremor Frequency among Patients in Sri Lanka using a Soft Glove. In Proceedings of the MERCon 2020—6th International Multidisciplinary Moratuwa Engineering Research Conference, Moratuwa, Sri Lanka, 28–30 July 2020; Institute of Electrical and Electronics Engineers Inc.: New York, NY, USA, 2020; pp. 301–306. [Google Scholar] [CrossRef]
- Hernqvist, C.; Rosander, M. Machine Learning for Symptoms Quantification of Parkinson’s Disease Patients. Ph.D. Thesis, Chalmers University of Technology, Gothenburg, Sweden, 2017. [Google Scholar]
- McGurrin, P.; McNames, J.; Wu, T.; Hallett, M.; Haubenberger, D. Quantifying Tremor in Essential Tremor using Inertial Sensors—Validation of an Algorithm. IEEE J. Transl. Eng. Health Med. 2020, 15, 25055–25071. [Google Scholar] [CrossRef]
- Olsson, F.; Medvedev, A. Nonparametric Time-Domain Tremor Quantification with Smart Phone for Therapy Individualization. IEEE Trans. Control Syst. Technol. 2020, 28, 118–129. [Google Scholar] [CrossRef]
- Dai, H.; Cai, G.; Lin, Z.; Wang, Z.; Ye, Q. Validation of Inertial Sensing-based Wearable Device for Tremor and Bradykinesia Quantification. IEEE J. Biomed. Health Inform. 2020, 1. [Google Scholar] [CrossRef]
- Wu, H.; Zhang, Y.; Wu, X.; Yang, F. Assessment of Upper Limb Tremors in Patients with Parkinson’s Disease Based on Displacement and Acceleration Information. In Proceedings of the 2020 5th IEEE International Conference on Automation, Control and Robotics Engineering (CACRE), Dalian, China, 19–20 September 2020; pp. 177–182. [Google Scholar] [CrossRef]
- Duque, J.D.; Egea, A.J.; Reeb, T.; Rojas, H.A.; Gonzalez-Vargas, A.M. Angular Velocity Analysis Boosted by Machine Learning for Helping in the Differential Diagnosis of Parkinson’s Disease and Essential Tremor. IEEE Access 2020, 8, 88866–88875. [Google Scholar] [CrossRef]
- Papadopoulos, A.; Kyritsis, K.; Klingelhoefer, L.; Bostanjopoulou, S.; Chaudhuri, K.R.; Delopoulos, A. Detecting Parkinsonian Tremor from IMU Data Collected In-The-Wild using Deep Multiple-Instance Learning. IEEE J. Biomed. Health Inform. 2019, 24, 2559–2569. [Google Scholar] [CrossRef] [Green Version]
- Almeida, J.; Pedrosa, P.; Filho, R.; Carneiro, T.; Wei, W.; Damaševičius, R.; Maskeliūnas, R.; De, V.H.C.; Almeida, J.; Pedrosa, P.; et al. Detecting Parkinson’ s Disease with Sustained Phonation and Speech Signals using Machine Learning Techniques. In Pattern Recognition Letters; Elsevier: Amsterdam, The Netherlands, 2019; Volume 125, pp. 55–62. [Google Scholar]
- Varghese, B.K.; Geraldine Bessie Amali, D.; Uma Devi, K.S. Prediction of parkinson’s disease using machine learning techniques on speech dataset. Res. J. Pharm. Technol. 2019, 12, 1–5. [Google Scholar] [CrossRef]
- Klempíř, O.; Krupička, R. Machine learning using speech utterances for parkinson disease detection. Lékař a Technika 2018, 48, 66–71. [Google Scholar]
- Wroge, T.J.; Ozkanca, Y.; Demiroglu, C.; Si, D.; Atkins, D.C.; Ghomi, R.H. Parkinson’ s Disease Diagnosis Using Machine Learning and Voice. In Proceedings of the 2018 IEEE Signal Processing in Medicine and Biology Symposium (SPMB), Philadelphia, PA, USA, 1 December 2018; pp. 1–7. [Google Scholar]
- Sriram, T.V.; Rao, M.V.; Satya Narayana, G.; Kaladhar, D. Diagnosis of Parkinson Disease Using Machine Learning and Data Mining Systems from Voice Dataset. Adv. Intell. Syst. Comput. 2014, 327, 151–157. [Google Scholar] [CrossRef]
- Ray, S. A Predictive Diagnosis for Parkinson’ s Disease Through Machine Learning. Can. Sci. Fair J. 2019, 2, 5–16. [Google Scholar]
- Schaap, T. Predicting Severity of Parkinson’s Disease with Typing Behavior: A Machine Learning Approach. Ph.D. Thesis, Universiteit Utrecht, Utrecht, The Netherlands, 2018. [Google Scholar]
- Youngmann, B.; Allerhand, L.; Paltiel, O.; Yom-Tov, E.; Arkadir, D. A machine learning algorithm successfully screens for Parkinson’s in web users. Ann. Clin. Transl. Neurol. 2019, 6, 2503–2509. [Google Scholar] [CrossRef] [PubMed] [Green Version]
- Shiiba, T.; Arimura, Y.; Nagano, M.; Takahashi, T.; Takaki, A. Improvement of classification performance of Parkinson’s disease using shape features for machine learning on dopamine transporter single photon emission computed tomography. PLoS ONE 2020, 15, e0228289. [Google Scholar] [CrossRef] [PubMed]
- Ahmadi Rastegar, D.; Ho, N.; Halliday, G.M.; Dzamko, N. Parkinson’s progression prediction using machine learning and serum cytokines. NPJ Parkinson’s Dis. 2019, 5, 1–8. [Google Scholar] [CrossRef]
- Tsoulos, I.G.; Mitsi, G.; Stavrakoudis, A.; Papapetropoulos, S. Application of machine learning in a parkinson’s disease digital biomarker dataset using Neural Network Construction (NNC) methodology discriminates patient motor status. Front. ICT 2019, 6, 1–7. [Google Scholar] [CrossRef] [Green Version]
- Pham, T.D.; Wardell, K.; Eklund, A.; Salerud, G. Classification of short time series in early Parkinson’s disease with deep learning of fuzzy recurrence plots. IEEE/CAA J. Autom. Sin. 2019, 6, 1306–1317. [Google Scholar] [CrossRef]
- Goschenhofer, J.; Pfister, F.M.; Yuksel, K.A.; Bischl, B.; Fietzek, U.; Thomas, J. Wearable-based Parkinson’s Disease Severity Monitoring using Deep Learning. In Machine Learning and Knowledge Discovery in Databases, Proceedings of the Joint European Conference on Machine Learning and Knowledge Discovery in Databases, Würzburg, Germany, 16–20 September 2019; Springer: Berlin, Germany, 2019. [Google Scholar]
- Ibrahim, A.; Zhou, Y.; Jenkins, M.E.; Luisa Trejos, A.; Naish, M.D. The Design of a Parkinson’s Tremor Predictor and Estimator Using a Hybrid Convolutional-Multilayer Perceptron Neural Network. In Proceedings of the Annual International Conference of the IEEE Engineering in Medicine and Biology Society, Montréal, QC, Canada, 20–24 July 2021; Institute of Electrical and Electronics Engineers Inc.: New York, NY, USA, 2020; pp. 5996–6000. [Google Scholar] [CrossRef]
- Wingate, J.; Kollia, I.; Bidaut, L.; Kollias, S. A Unified Deep Learning Approach for Prediction of Parkinson’s Disease. IET Res. J. 2019, 14, 1–10. [Google Scholar]
- Pereira, C.R.; Weber, S.A.; Hook, C.; Rosa, G.H.; Papa, J.P. Deep learning-aided Parkinson’s disease diagnosis from handwritten dynamics. In Proceedings of the 2016 29th SIBGRAPI Conference on Graphics, Patterns and Images, SIBGRAPI 2016, Sao Paulo, Brazil, 4–7 October 2016; pp. 340–346. [Google Scholar] [CrossRef]
- Grover, S.; Bhartia, S.; Yadav, A.; Seeja, K.R. Predicting Severity of Parkinson’s Disease Using Deep Learning. Procedia Comput. Sci. 2018, 132, 1788–1794. [Google Scholar] [CrossRef]
- Hossen, A.; Muthuraman, M.; Al-Hakim, Z.; Raethjen, J.; Deuschl, G.; Heute, U. Discrimination of Parkinsonian tremor from essential tremor using statistical signal characterization of the spectrum of accelerometer signal. Bio-Med. Mater. Eng. 2013, 23, 513–531. [Google Scholar] [CrossRef]
- Darnall, N.D.; Donovan, C.K.; Aktar, S.; Tseng, H.Y.; Barthelmess, P.; Cohen, P.R.; Lin, D.C. Application of machine learning and numerical analysis to classify tremor in patients affected with essential tremor or Parkinson’s disease. Gerontechnology 2012, 10, 208–219. [Google Scholar] [CrossRef]
- Bartlett, C.; Miles, J.; Qamar, N.; Martinez, L.; Manno, D. TremorTrack: A privacy-aware solution for monitoring parkinsonian and essential tremors. In Proceedings of the IEEE Symposium on Computer-Based Medical Systems, Rochester, MN, USA, 28–30 July 2020; Institute of Electrical and Electronics Engineers Inc.: New York, NY, USA, 2020; pp. 392–396. [Google Scholar] [CrossRef]
- Skaramagkas, V.; Andrikopoulos, G.; Kefalopoulou, Z.; Polychronopoulos, P. Towards Differential Diagnosis of Essential and Parkinson’s Tremor via Machine Learning. In Proceedings of the 2020 28th Mediterranean Conference on Control and Automation (MED), Saint-Raphaël, France, 15–18 September 2020; pp. 782–787. [Google Scholar] [CrossRef]
- Essential Tremor Disorder|Johns Hopkins Medicine. Available online: https://www.hopkinsmedicine.org/health/conditions-and-diseases/essential-tremor-disorder (accessed on 24 March 2020).
- Sullivan, K.L.; Zesiewicz, T. Overview of Essential Tremor. Neuropsychiatr. Dis. Treat. 2010, 6, 401–408. [Google Scholar] [CrossRef] [Green Version]
- Lee, H.J.; Lee, W.W.; Kim, S.K.; Park, H.; Jeon, H.S.; Kim, H.B.; Jeon, B.S.; Park, K.S. Tremor frequency characteristics in Parkinson’s disease under resting-state and stress-state conditions. J. Neurol. Sci. 2016, 362, 272–277. [Google Scholar] [CrossRef]
- Cohen, O.; Pullman, S.; Jurewicz, E.; Watner, D.; Louis, E.D. Rest tremor in patients with essential tremor: Prevalence, clinical correlates, and electrophysiologic characteristics. Arch. Neurol. 2003, 60, 405–410. [Google Scholar] [CrossRef] [PubMed] [Green Version]
- Clark, L.N.; Louis, E.D. Essential tremor. In Handbook of Clinical Neurology; Elsevier B.V.: Amsterdam, The Netherlands, 2018; Volume 147, pp. 229–239. [Google Scholar] [CrossRef]
- Elble, R.J. The Essential Tremor Rating Assessment Scale. J. Neurol. Neuromed. 2016, 1, 34–38. [Google Scholar]
- Goetz, C.G. The history of Parkinson’s disease: Early clinical descriptions and neurological therapies. Cold Spring Harb. Perspect. Med. 2011, 1. [Google Scholar] [CrossRef] [PubMed] [Green Version]
- Hallett, M. Parkinsonism and Related Disorders Parkinson’ s disease tremor: Pathophysiology. Park. Realt. Disord. 2012, 18, S85–S86. [Google Scholar] [CrossRef]
- Parkinson’s Disease PET Scans: Uses, Results, and More; WebMD LLC: New York, NY, USA, 2020.
- Ling, H. Clinical Approach to Progressive Supranuclear Palsy. J. Mov. Disord. 2016, 9, 3–13. [Google Scholar] [CrossRef] [PubMed] [Green Version]
- Calisto, A.; Bramanti, A.; Galeano, M.; Angileri, F.; Campobello, G.; Serrano, S.; Azzerboni, B. A preliminary study for investigating idiopatic normal pressure hydrocephalus by means of statistical parameters classification of intracranial pressure recordings. In Proceedings of the 31st Annual International Conference of the IEEE Engineering in Medicine and Biology Society: Engineering the Future of Biomedicine, EMBC 2009, Minneapolis, MN, USA, 3–6 September 2009; pp. 2629–2632. [Google Scholar] [CrossRef]
- Anand, S.S.; Singh, H.; Dash, A.K. Clinical applications of PET and PET-CT. Med. J. Armed. Forces India 2009, 65, 353–358. [Google Scholar] [CrossRef] [Green Version]
- Clarke, C.E.; Patel, S.; Ives, N.; Rick, C.E.; Woolley, R.; Wheatley, K.; Walker, M.F.; Zhu, S.; Kandiyali, R.; Yao, G.; et al. Physiotherapy and Occupational Therapy vs No Therapy in Mild to Moderate Parkinson Disease: A Randomized Clinical Trial. JAMA Neurol. 2016, 73. [Google Scholar] [CrossRef]
- Schwab and England—Parkinson’s Disease Research, Education and Clinical Centers; Talkspace Network LLC: New York, NY, USA, 2015.
- Murtagh, F. Counting Dendrograms: A Survey. Discret. Appl. Math. 1984, 7, 191–199. [Google Scholar] [CrossRef] [Green Version]
- Navada, A.; Ansari, A.N.; Patil, S.; Sonkamble, B.A. Overview of use of decision tree algorithms in machine learning. In Proceedings of the 2011 IEEE Control and System Graduate Research Colloquium, ICSGRC 2011, Shah Alam, Malaysia, 27–28 June 2011; pp. 37–42. [Google Scholar] [CrossRef]
- Lin, G.C.; Wang, C.M.; Wang, W.J. An unsupervised linear discriminant analysis approach to multispectral MRI images classification. In Proceedings of the Sixth International Conference on Machine Learning and Cybernetics, ICMLC 2007, Hong Kong, China, 19–22 August 2007; Volume 4, pp. 2018–2023. [Google Scholar] [CrossRef]
- Schölkopf, B. SVMs—A practical consequence of learning theory. IEEE Intell. Syst. Their Appl. 1998, 13, 18–21. [Google Scholar] [CrossRef] [Green Version]
- Moldagulova, A.; Sulaiman, R.B. Using KNN algorithm for classification of textual documents. In Proceedings of the ICIT 2017—8th International Conference on Information Technology, Amman, Jordan, 17–18 May 2017; Institute of Electrical and Electronics Engineers Inc.: New York, NY, USA, 2017; pp. 665–671. [Google Scholar] [CrossRef]
- Huang, F.; Xie, G.; Xiao, R. Research on ensemble learning. In Proceedings of the 2009 International Conference on Artificial Intelligence and Computational Intelligence, AICI 2009, Shanghai, China, 7–8 November 2009; Volume 3, pp. 249–252. [Google Scholar] [CrossRef]
- Mikołajczyk, A.; Grochowski, M. Data augmentation for improving deep learning in image classification problem. In Proceedings of the 2018 International Interdisciplinary PhD Workshop, IIPhDW 2018, Swinoujscie, Poland, 9–12 May 2018; Institute of Electrical and Electronics Engineers Inc.: New York, NY, USA, 2018; pp. 117–122. [Google Scholar] [CrossRef]
- Parente, A.P.; de Souza, M.B.; Valdman, A.; Folly, R.O.M. Data augmentation applied to machine learning-based monitoring of a pulp and paper process. Processes 2019, 7, 958. [Google Scholar] [CrossRef] [Green Version]
- Barua, S.; Islam, M.M.; Yao, X.; Murase, K. MWMOTE—Majority weighted minority oversampling technique for imbalanced data set learning. IEEE Trans. Knowl. Data Eng. 2014, 26, 405–425. [Google Scholar] [CrossRef]
- Guo, C.; Ma, Y.; Xu, Z.; Cao, M.; Yao, Q. An Improved Oversampling Method for Imbalanced Data-SMOTE Based on Canopy and K-Means; Institute of Electrical and Electronics Engineers Inc.: New York, NY, USA, 2019; pp. 1467–1469. [Google Scholar] [CrossRef]
- Wang, W.; Huang, Y.; Wang, Y.; Wang, L. Generalized autoencoder: A neural network framework for dimensionality reduction. In Proceedings of the IEEE Computer Society Conference on Computer Vision and Pattern Recognition Workshops, Columbus, OH, USA, 23–28 June 2014; pp. 496–503. [Google Scholar] [CrossRef]
- Skaramagkas, V.; Andrikopoulos, G.; Manesis, S. An Experimental Investigation of Essential Hand Tremor Suppression via a Soft Exoskeletal Glove. In Proceedings of the 2020 European Control Conference (ECC), Saint Petersburg, Russia, 12–15 May 2020; pp. 889–894. [Google Scholar] [CrossRef]


| Body Part | 1 | 2 | 3 | 4 |
|---|---|---|---|---|
| Face or tongue | Slightly visible | Visible | Obvious in most facial expressions | Intense, deformable |
| Voice | Slight in voices such as “eee” or “aaa” | Visible in voices such as “eee” or “aaa” and slight during speech | Visible during speech | Difficulty in understanding certain words |
| Upper limb | Barely visible | 1–3 cm | 5–10 cm | 20 cm |
| Lower limb | Barely visible | Visible but feckless | 5 cm | 5 cm |
| Writing | Barely visible | Visible, all words can be read | Visible, most of the words can be read | No word can be read |
| Dot approximation task | Barely visible | 1–3 cm | 5–10 cm | 20 cm |
| Upright position | Barely visible | Visible but feckless | Moderate | Severe |
| Disease Stage | Description |
|---|---|
| Stage 0 | No sign of the disease |
| Stage 1 | Unilateral disease |
| Stage 1.5 | Unilateral disease plus axial involvement |
| Stage 2 | Bilateral illness, without any impairment of balance |
| Stage 2.5 | Mild bilateral disease, with recovery in the helix test |
| Stage 3 | Mild to moderate bilateral disease. Some volatility, independent |
| Stage 4 | Severe disabilities. Still able to walk or stand without help |
| Stage 5 | Use of wheelchair or lying in bed, unless assisted |
| Percentage | Description |
|---|---|
| 100% | Completely independent. Able to do all tasks without slowness or difficulty. |
| 90% | Completely independent. Able to do all tasks with some degree of slowness or difficulty. |
| 80% | Fully independent in most tasks, but with many tasks taking twice as long to complete. Awareness of difficulty and slowness. |
| 70% | Not completely independent. More challenges during some activities. |
| 60% | Some dependency. Ability to complete most tasks, but extremely slowly and with great effort. |
| 50% | More dependent. Difficulty during most tasks. |
| 40% | Very dependent. Ability to assist only in certain tasks. |
| 30% | More effort to accomplishing a few tasks. Greater assistance is needed. |
| 20% | Inability of performing unsupervised tasks. |
| 10% | Fully dependent. |
| 0% | Functions such as swallowing, cystic bladder and intestine do not work. Bedridden. |
| Position | Index | Thumb | Metacarpal | Forearm |
|---|---|---|---|---|
| Rest | ||||
| Postural | ||||
| Free motion | ||||
| Motion with object |
| Category | Algorithm |
|---|---|
| Trees [52] | Fine tree |
| Medium tree | |
| Coarse tree | |
| Discriminant analysis [53] | Linear discriminant analysis (LDA) |
| Quadratic discriminant analysis (QDA) | |
| Support vector machine (SVM) [54] | Linear SVM |
| Quadratic SVM | |
| Cubic SVM | |
| Fine Gaussian SVM | |
| Medium Gaussian SVM | |
| Coarse Gaussian SVM | |
| K-nearest neighbor (KNN) [55] | Fine KNN |
| Medium KNN | |
| Coarse KNN | |
| Cosine KNN | |
| Cubic KNN | |
| Weighted KNN | |
| Ensemble learning [56] | Boosted trees |
| Bagged trees | |
| Subspace KNN | |
| RUSBoosted trees |
| Category | PT | ET | NT |
|---|---|---|---|
| Gender (M/F) | 7/5 | 3/0 | 19/9 |
| Age (range) | 47–89 | 50–69 | 14–76 |
| Years since tremor appearance (range) | 1–18 | 5–42 | - |
| Early stage (yes/no) | 0/3 | 4/8 | - |
| Medication (Yes(ON/OFF)/No) | 10(7/3)/2 | 1(0/1)/2 | - |
| Tremor frequency in Hz (range) | 0–8.7 | 0–10 | - |
| Data | Original (ET, PT, NT) | Augmented (ET, PT, NT) | Total (ET, PT, NT) |
|---|---|---|---|
| Training | 25 (2, 8, 15) | 115 (30, 40, 45) | 140 (32, 48, 60) |
| Test | 18 (1, 4, 13) | 40 (15, 12, 13) | 58 (16, 16, 26) |
| Total | 43 (3, 12, 28) | 155 (45, 52, 58) | 198 (48, 64, 86) |
| Measurement | ET (%) () | PT (%) () | NT (%) () | Total (%) | Algorithm | Training Time (sec) | Prediction Speed (obj./sec) |
|---|---|---|---|---|---|---|---|
| 93.7 | 68.7 | 50.0 | 67.2 | RUS Boosted trees | 0.45 | 4800 | |
| 87.5 | 37.5 | 73.1 | 67.2 | Medium tree | 4.71 | 3400 | |
| 87.5 | 43.7 | 43.6 | 51.72 | Bagged trees | 7.29 | 690 | |
| 100.0 | 75.0 | 92.3 | 89.6 | Bagged trees | 2.89 | 1200 | |
| 100.0 | 50 | 92.3 | 78.8 | Quadratic SVM | 2.65 | 2800 | |
| 100.0 | 41.7 | 92.1 | 78.8 | Fine KNN | 3.07 | 3300 | |
| 81.2 | 56.2 | 61.5 | 63.8 | Quadratic SVM | 1.81 | 3600 | |
| 62.5 | 45.8 | 73.1 | 61.4 | Linear SVM | 1.91 | 3800 | |
| 62.5 | 37.5 | 73.1 | 57.6 | Bagged trees | 2.12 | 1300 | |
| 100.0 | 6.2 | 92.3 | 70.7 | Bagged trees | 2.18 | 1300 | |
| 93.7 | 6.25 | 91.7 | 67.8 | Linear SVM | 1.66 | 1900 | |
| 100.0 | 0 | 91.7 | 67.8 | Quadratic SVM | 1.58 | 3800 | |
| 100.0 | 50.0 | 96.1 | 84.5 | Fine Gaussian SVM | 1.72 | 2700 | |
| 100.0 | 50.0 | 100.0 | 85.7 | Weighted KNN | 1.67 | 6300 | |
| 93.7 | 36.4 | 95.8 | 78.8 | Quadratic SVM | 1.86 | 2700 | |
| 100.0 | 87.5 | 88.4 | 91.4 | Quadratic SVM | 1.88 | 4100 | |
| 100.0 | 100.0 | 61.5 | 78.3 | Fine Gaussian SVM | 1.74 | 3500 | |
| 100.0 | 100.0 | 30.78 | 68.9 | Linear SVM | 1.95 | 4300 | |
| 100.0 | 18.7 | 84.6 | 70.7 | Bagged trees | 2.28 | 1200 | |
| 100.0 | 0 | 100.0 | 71.9 | Fine Gaussian SVM | 1.68 | 3500 | |
| 100.0 | 0 | 28 | 40.3 | Linear SVM | 1.96 | 3500 | |
| 100.0 | 75.0 | 92.3 | 89.6 | Bagged trees | 2.83 | 950 | |
| 100.0 | 0 | 100.0 | 73.9 | Quadratic SVM | 1.73 | 3300 | |
| 100.0 | 0 | 100.0 | 73.9 | Linear SVM | 1.80 | 3600 | |
| 93.7 | 87.5 | 38.4 | 67.2 | Bagged trees | 2.26 | 1000 | |
| 93.7 | 50 | 50 | 62.1 | Weighted KNN | 0.55 | 5700 | |
| 93.7 | 56.25 | 50 | 63.2 | Quadratic SVM | 1.75 | 3000 | |
| 100.0 | 100.0 | 92.3 | 96.5 | Linear SVM | 1.86 | 3600 | |
| 100.0 | 100.0 | 100.0 | 100.0 | Quadratic SVM | 1.78 | 3500 | |
| 100.0 | 100.0 | 100.0 | 100.0 | Cubic SVM | 1.69 | 3600 | |
| 100.0 | 50.0 | 100.0 | 86.2 | Cubic SVM | 1.20 | 2900 | |
| 0 | 75.0 | 100.0 | 62.5 | Quadratic SVM | 1.28 | 2900 | |
| 0 | 75.0 | 100.0 | 62.5 | Linear SVM | 1.36 | 3700 | |
| 100.0 | 68.7 | 100.0 | 91.4 | Cubic SVM | 2.20 | 4700 | |
| 100.0 | 68.7 | 100.0 | 91.4 | Quadratic SVM | 2.53 | 4300 | |
| 100.0 | 62.5 | 92.3 | 86.2 | Fine KNN | 1.41 | 3800 | |
| 93.7 | 43.7 | 50.0 | 60.3 | Linear SVM | 1.89 | 4200 | |
| 100.0 | 31.2 | 52.4 | 60.2 | Quadratic SVM | 1.81 | 3500 | |
| 100.0 | 50.0 | 57.1 | 67.9 | Bagged trees | 2.46 | 890 | |
| 100.0 | 93.7 | 34.6 | 68.9 | Bagged trees | 2.69 | 1100 | |
| 100.0 | 68.7 | 23.1 | 56.9 | Quadratic SVM | 2.45 | 4500 | |
| 100.0 | 68.7 | 23.1 | 56.9 | Fine KNN | 1.98 | 5300 | |
| 100.0 | 75.0 | 76.9 | 82.8 | Quadratic discriminant | 1.65 | 6100 | |
| 100.0 | 75.0 | 95.2 | 90.6 | Linear discriminant | 1.78 | 8600 | |
| 100.0 | 50.0 | 100.0 | 84.9 | Linear SVM | 2.28 | 4100 | |
| 100.0 | 100.0 | 92.3 | 96.5 | Cubic SVM | 1.38 | 2200 | |
| 100.0 | 100.0 | 86.9 | 92.0 | Linear SVM | 1.17 | 4200 | |
| 100.0 | 75.0 | 93.3 | 90 | Bagged trees | 2.82 | 860 |
| Classifier | Sensitivity | Specificity | Accuracy | ||||
|---|---|---|---|---|---|---|---|
| ET | PT | NT | ET | PT | NT | ||
| Fine Tree | 90.63 | 51.56 | 46.52 | 85.59 | 73.92 | 81.25 | 60.31 |
| Medium Tree | 90.63 | 51.56 | 46.52 | 85.59 | 73.92 | 81.25 | 60.31 |
| Coarse Tree | 89.06 | 57.81 | 35.53 | 90.62 | 65.43 | 79.69 | 57.30 |
| Linear discriminant | 89.06 | 59.38 | 64.74 | 83.64 | 83.53 | 88.28 | 69.88 |
| Quadratic discriminant | 85.94 | 48.44 | 77.24 | 92.57 | 87.10 | 75.00 | 71.60 |
| Linear SVM | 96.88 | 39.06 | 76.01 | 80.98 | 94.64 | 80.47 | 71.54 |
| Quadratic SVM | 96.88 | 39.06 | 75.60 | 85.86 | 91.51 | 78.13 | 71.56 |
| Cubic SVM | 98.44 | 43.75 | 80.59 | 87.81 | 95.24 | 77.34 | 75.17 |
| Fine Gaussian SVM | 92.19 | 64.06 | 59.66 | 97.30 | 75.43 | 81.25 | 69.73 |
| Medium Gaussian SVM | 92.19 | 65.63 | 50.41 | 88.67 | 77.73 | 83.59 | 66.78 |
| Coarse Gaussian SVM | 48.44 | 32.81 | 64.29 | 82.74 | 75.97 | 64.84 | 50.98 |
| Fine KNN | 98.44 | 53.13 | 57.55 | 84.75 | 82.66 | 84.38 | 67.64 |
| Medium KNN | 84.38 | 62.50 | 47.02 | 88.84 | 72.38 | 82.03 | 62.08 |
| Coarse KNN | 0.00 | 0.00 | 100.00 | 100.00 | 98.21 | 2.34 | 43.53 |
| Cosine KNN | 93.75 | 53.13 | 40.75 | 86.42 | 67.29 | 86.72 | 59.26 |
| Cubic KNN | 79.69 | 62.50 | 47.25 | 90.19 | 69.00 | 82.03 | 60.66 |
| Weighted KNN | 96.88 | 62.50 | 50.14 | 90.70 | 76.54 | 82.81 | 66.86 |
| Boosted trees | 0.00 | 0.00 | 100.00 | 100.00 | 100.00 | 0.00 | 43.53 |
| Bagged Trees | 92.19 | 48.44 | 57.10 | 90.03 | 81.55 | 73.44 | 64.79 |
| Subspace KNN | 92.19 | 29.69 | 41.71 | 75.58 | 78.17 | 74.22 | 52.43 |
| RUS Boosted trees | 96.88 | 59.38 | 46.02 | 77.69 | 80.20 | 89.84 | 64.00 |
| Classifier | Sensitivity | Specificity | Accuracy | ||||
|---|---|---|---|---|---|---|---|
| ET | PT | NT | ET | PT | NT | ||
| Fine Tree | 98.44 | 54.69 | 58.23 | 83.53 | 81.36 | 90.63 | 68.15 |
| Medium Tree | 98.44 | 54.69 | 58.23 | 83.53 | 81.36 | 90.63 | 68.15 |
| Coarse Tree | 98.44 | 48.44 | 57.48 | 78.55 | 83.47 | 90.63 | 65.83 |
| Linear Discriminant | 98.44 | 53.13 | 64.24 | 84.41 | 81.20 | 96.09 | 71.59 |
| Quadratic Discriminant | 100.00 | 81.25 | 55.11 | 100.00 | 68.43 | 90.63 | 70.41 |
| Linear SVM | 96.88 | 53.13 | 48.15 | 88.51 | 66.30 | 93.75 | 61.68 |
| Quadratic SVM | 100.00 | 62.50 | 54.27 | 94.14 | 70.07 | 90.63 | 67.48 |
| Cubic SVM | 100.00 | 71.88 | 50.62 | 96.27 | 66.61 | 91.41 | 66.83 |
| Fine Gaussian SVM | 100.00 | 70.31 | 58.03 | 100.00 | 70.73 | 85.16 | 69.83 |
| Medium Gaussian SVM | 100.00 | 54.69 | 56.97 | 90.51 | 73.85 | 91.41 | 68.08 |
| Coarse Gaussian SVM | 67.19 | 50.00 | 61.16 | 91.51 | 69.27 | 85.16 | 62.95 |
| Fine KNN | 100.00 | 76.56 | 59.18 | 98.90 | 72.22 | 89.84 | 72.81 |
| Medium KNN | 100.00 | 51.56 | 60.21 | 88.51 | 76.82 | 92.19 | 69.32 |
| Coarse KNN | 0.00 | 18.75 | 82.69 | 100.00 | 79.76 | 21.88 | 50.30 |
| Cosine KNN | 100.00 | 43.75 | 55.67 | 81.85 | 77.08 | 93.75 | 65.29 |
| Cubic KNN | 100.00 | 46.88 | 59.84 | 87.01 | 77.13 | 91.41 | 68.07 |
| Weighted KNN | 100.00 | 51.56 | 61.36 | 90.51 | 76.65 | 90.63 | 69.98 |
| Boosted trees | 0.00 | 0.00 | 100.00 | 100.00 | 100.00 | 0.00 | 52.89 |
| Bagged Trees | 100.00 | 65.63 | 60.36 | 93.57 | 75.47 | 91.41 | 71.86 |
| Subspace KNN | 100.00 | 60.94 | 58.32 | 91.20 | 75.17 | 89.84 | 69.08 |
| RUS Boosted trees | 100.00 | 54.69 | 58.18 | 84.31 | 82.41 | 86.72 | 68.27 |
| Classifier | Sensitivity | Specificity | Accuracy | ||||
|---|---|---|---|---|---|---|---|
| ET | PT | NT | ET | PT | NT | ||
| Fine Tree | 82.81 | 9.38 | 91.59 | 82.71 | 95.06 | 66.41 | 66.62 |
| Medium Tree | 82.81 | 9.38 | 91.59 | 82.71 | 95.06 | 66.41 | 66.62 |
| Coarse Tree | 78.13 | 3.13 | 92.26 | 79.05 | 97.56 | 63.28 | 64.36 |
| Linear Discriminant | 50.00 | 37.50 | 65.02 | 65.36 | 86.98 | 77.34 | 53.16 |
| Quadratic Discriminant | 50.00 | 4.69 | 99.26 | 100.00 | 89.48 | 40.63 | 60.28 |
| Linear SVM | 50.00 | 32.81 | 62.88 | 67.49 | 84.98 | 73.44 | 51.10 |
| Quadratic SVM | 57.81 | 39.06 | 91.59 | 93.01 | 88.48 | 65.63 | 68.13 |
| Cubic SVM | 57.81 | 15.63 | 84.84 | 92.34 | 80.30 | 60.16 | 57.95 |
| Fine Gaussian SVM | 50.00 | 0.00 | 100.00 | 100.00 | 100.00 | 25.00 | 59.52 |
| Medium Gaussian SVM | 65.63 | 28.13 | 73.58 | 94.95 | 85.86 | 49.22 | 58.12 |
| Coarse Gaussian SVM | 25.00 | 31.25 | 84.84 | 91.50 | 85.80 | 45.31 | 53.47 |
| Fine KNN | 65.63 | 7.81 | 84.12 | 93.82 | 95.71 | 36.72 | 57.44 |
| Medium KNN | 65.63 | 28.13 | 75.53 | 90.89 | 92.24 | 48.44 | 59.26 |
| Coarse KNN | 0.00 | 0.00 | 98.81 | 100.00 | 99.32 | 0.00 | 44.48 |
| Cosine KNN | 65.63 | 32.81 | 64.72 | 82.46 | 90.20 | 56.25 | 55.90 |
| Cubic KNN | 65.63 | 28.13 | 70.90 | 88.89 | 91.14 | 48.44 | 56.93 |
| Weighted KNN | 65.63 | 28.13 | 76.53 | 91.50 | 92.74 | 47.66 | 59.69 |
| Boosted trees | 0.00 | 0.00 | 100.00 | 100.00 | 100.00 | 0.00 | 44.32 |
| Bagged Trees | 90.63 | 12.50 | 80.29 | 78.85 | 93.56 | 69.53 | 63.53 |
| Subspace KNN | 71.88 | 29.69 | 70.55 | 96.82 | 82.06 | 54.69 | 59.48 |
| RUS Boosted trees | 57.81 | 9.38 | 93.06 | 86.25 | 90.56 | 57.81 | 60.48 |
| Classifier | Sensitivity | Specificity | Accuracy | ||||
|---|---|---|---|---|---|---|---|
| ET | PT | NT | ET | PT | NT | ||
| Fine Tree | 82.81 | 9.38 | 91.59 | 82.71 | 95.06 | 66.41 | 66.62 |
| Medium Tree | 82.81 | 9.38 | 91.59 | 82.71 | 95.06 | 66.41 | 66.62 |
| Coarse Tree | 78.13 | 3.13 | 92.26 | 79.05 | 97.56 | 63.28 | 64.36 |
| Linear Discriminant | 100.00 | 35.94 | 73.53 | 82.96 | 86.61 | 86.72 | 70.71 |
| Quadratic Discriminant | 100.00 | 35.94 | 73.53 | 82.96 | 86.61 | 86.72 | 70.71 |
| Linear SVM | 100.00 | 35.94 | 70.65 | 82.96 | 84.82 | 86.72 | 69.42 |
| Quadratic SVM | 98.44 | 48.44 | 86.68 | 87.50 | 92.73 | 86.72 | 79.13 |
| Cubic SVM | 98.44 | 48.44 | 86.68 | 87.50 | 92.73 | 86.72 | 79.13 |
| Fine Gaussian SVM | 98.44 | 48.44 | 88.86 | 82.58 | 94.05 | 98.44 | 80.86 |
| Medium Gaussian SVM | 100.00 | 40.63 | 90.53 | 84.45 | 95.24 | 90.63 | 80.40 |
| Coarse Gaussian SVM | 100.00 | 40.63 | 91.91 | 83.26 | 97.02 | 93.75 | 82.62 |
| Fine KNN | 100.00 | 25.00 | 84.56 | 90.48 | 87.50 | 75.00 | 71.36 |
| Medium KNN | 100.00 | 37.50 | 85.72 | 79.98 | 94.94 | 93.75 | 78.47 |
| Coarse KNN | 85.94 | 50.00 | 85.98 | 83.18 | 89.29 | 99.22 | 78.00 |
| Cosine KNN | 100.00 | 37.50 | 87.75 | 85.42 | 94.35 | 86.72 | 79.01 |
| Cubic KNN | 98.44 | 39.06 | 77.32 | 76.33 | 90.48 | 100.00 | 74.37 |
| Weighted KNN | 0.00 | 3.13 | 100.00 | 100.00 | 97.32 | 6.25 | 56.40 |
| Boosted trees | 96.88 | 17.19 | 66.75 | 64.43 | 90.18 | 99.22 | 64.79 |
| Bagged Trees | 98.44 | 37.50 | 76.36 | 76.33 | 89.88 | 99.22 | 73.50 |
| Subspace KNN | 100.00 | 34.38 | 81.17 | 75.74 | 93.45 | 98.44 | 75.23 |
| RUS Boosted trees | 0.00 | 0.00 | 100.00 | 100.00 | 100.00 | 0.00 | 55.72 |
Publisher’s Note: MDPI stays neutral with regard to jurisdictional claims in published maps and institutional affiliations. |
© 2021 by the authors. Licensee MDPI, Basel, Switzerland. This article is an open access article distributed under the terms and conditions of the Creative Commons Attribution (CC BY) license (https://creativecommons.org/licenses/by/4.0/).
Share and Cite
Skaramagkas, V.; Andrikopoulos, G.; Kefalopoulou, Z.; Polychronopoulos, P. A Study on the Essential and Parkinson’s Arm Tremor Classification. Signals 2021, 2, 201-224. https://doi.org/10.3390/signals2020016
Skaramagkas V, Andrikopoulos G, Kefalopoulou Z, Polychronopoulos P. A Study on the Essential and Parkinson’s Arm Tremor Classification. Signals. 2021; 2(2):201-224. https://doi.org/10.3390/signals2020016
Chicago/Turabian StyleSkaramagkas, Vasileios, George Andrikopoulos, Zinovia Kefalopoulou, and Panagiotis Polychronopoulos. 2021. "A Study on the Essential and Parkinson’s Arm Tremor Classification" Signals 2, no. 2: 201-224. https://doi.org/10.3390/signals2020016
APA StyleSkaramagkas, V., Andrikopoulos, G., Kefalopoulou, Z., & Polychronopoulos, P. (2021). A Study on the Essential and Parkinson’s Arm Tremor Classification. Signals, 2(2), 201-224. https://doi.org/10.3390/signals2020016