4.1. IBI Distributions Estimation
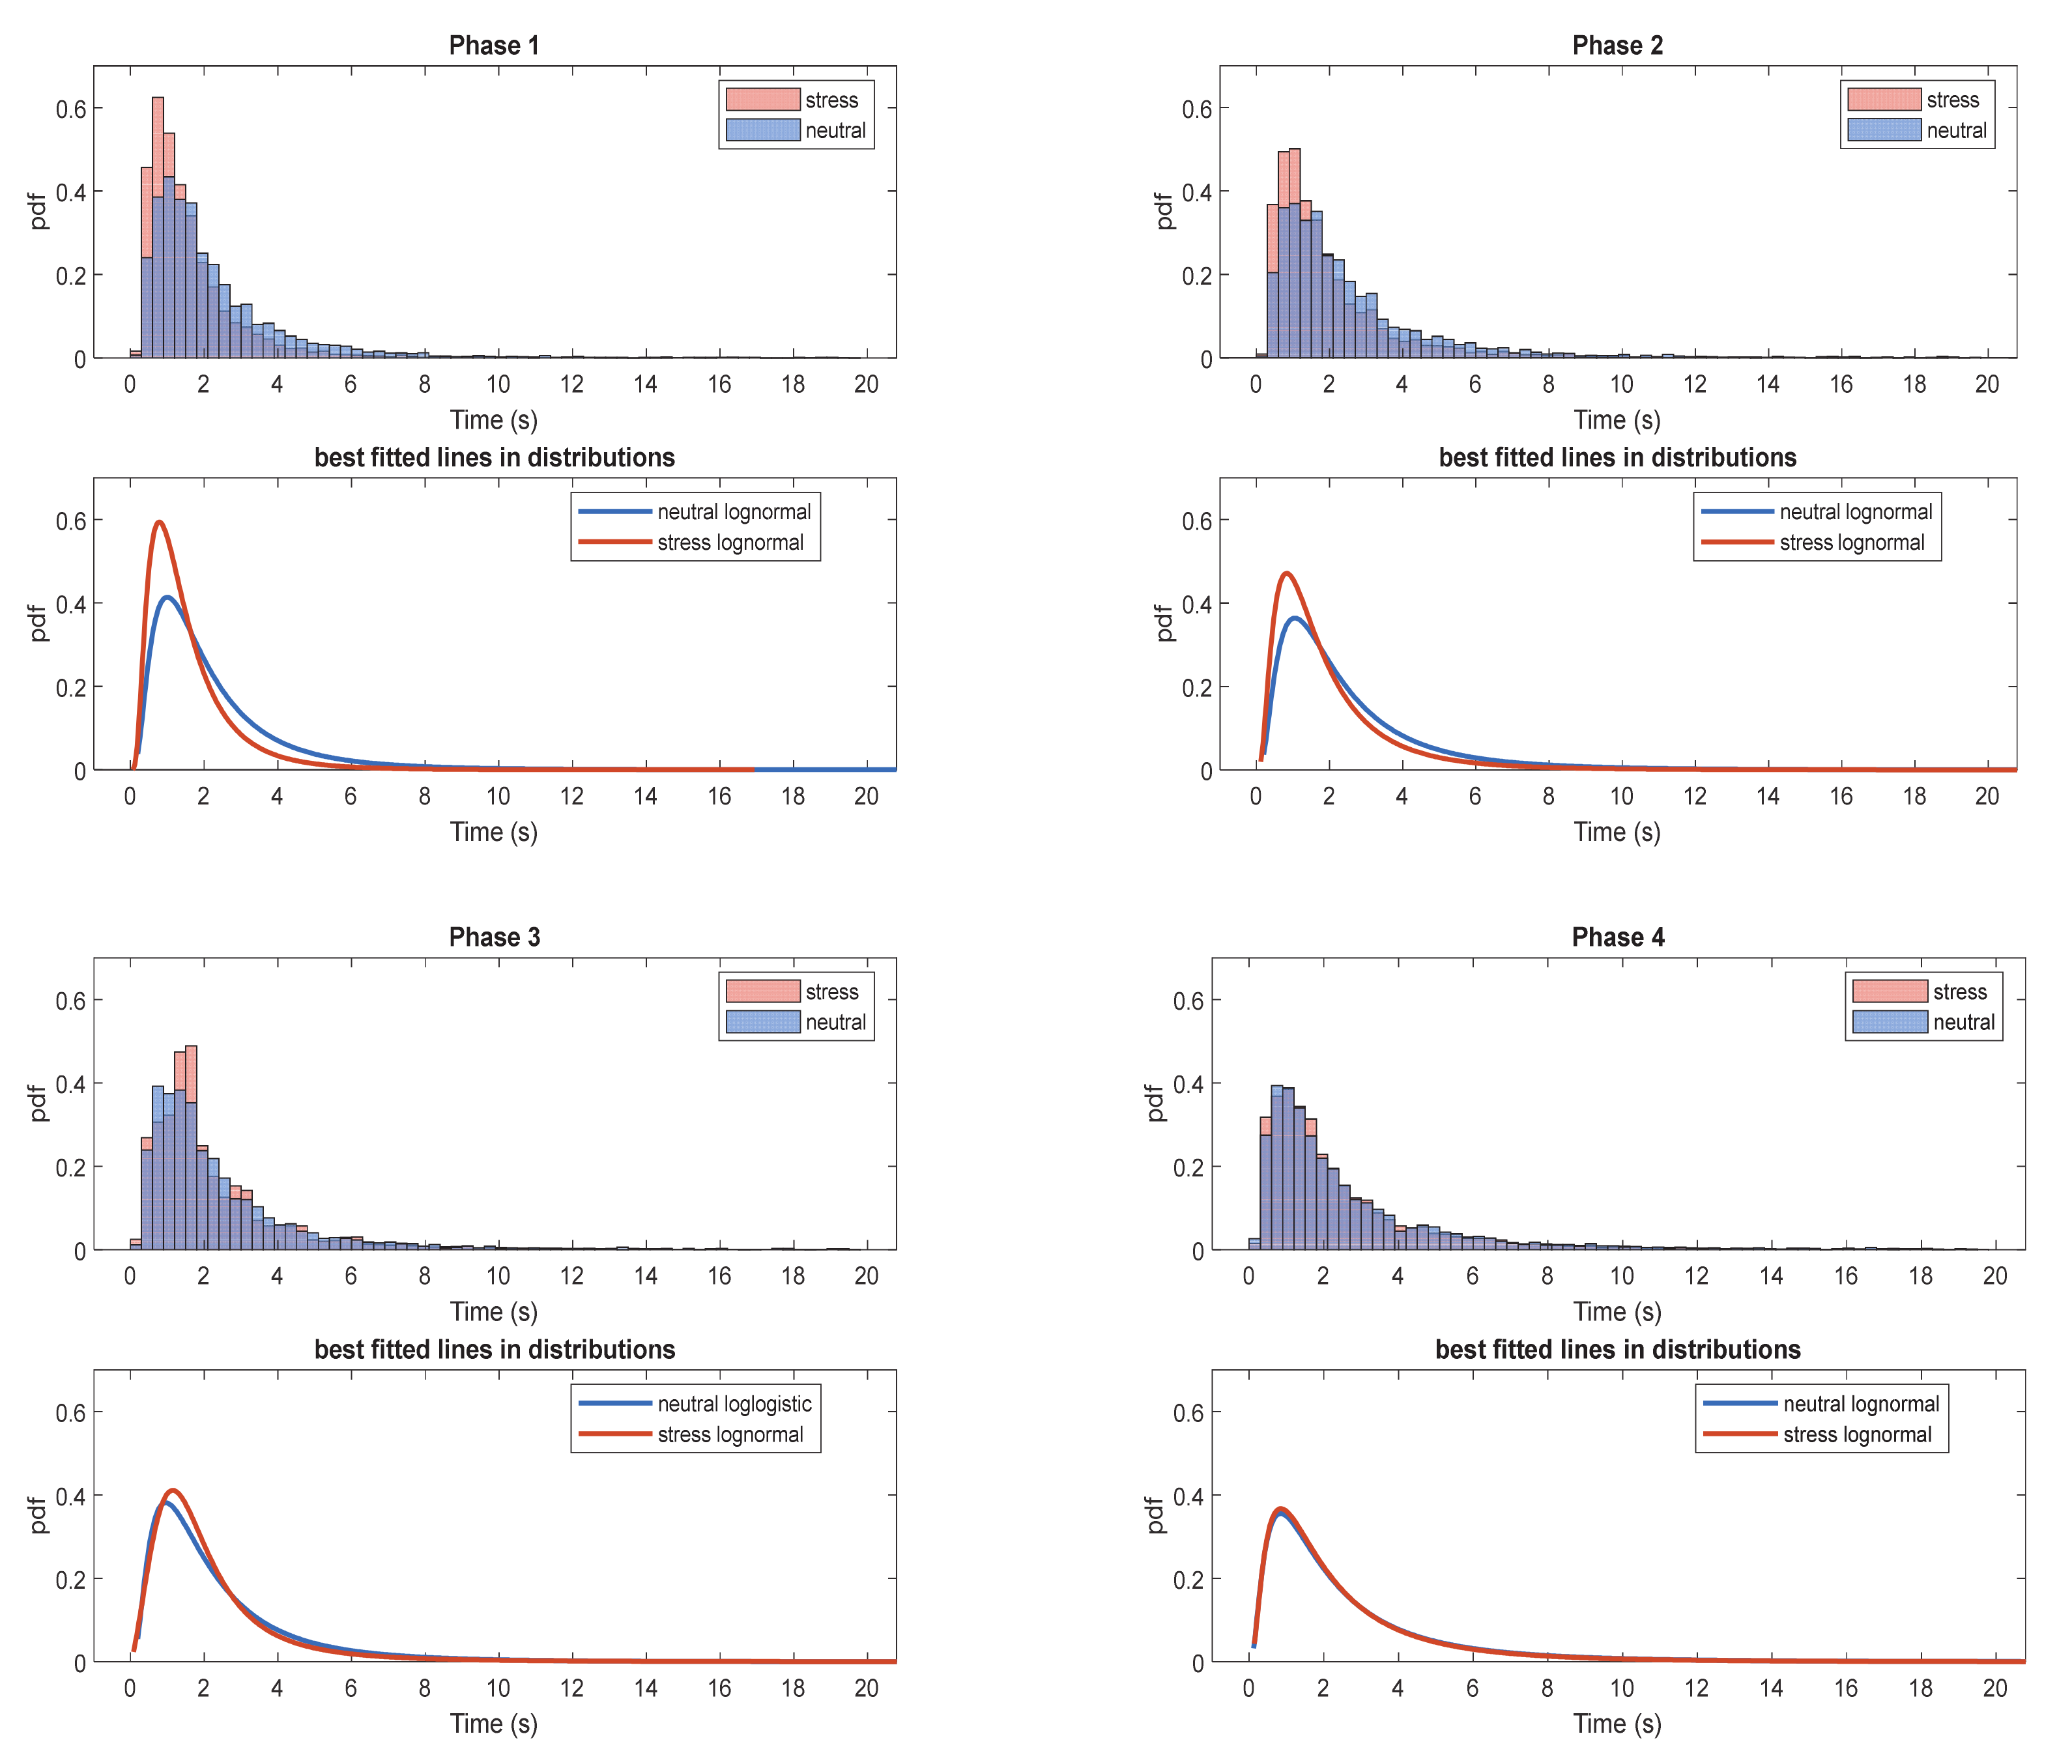
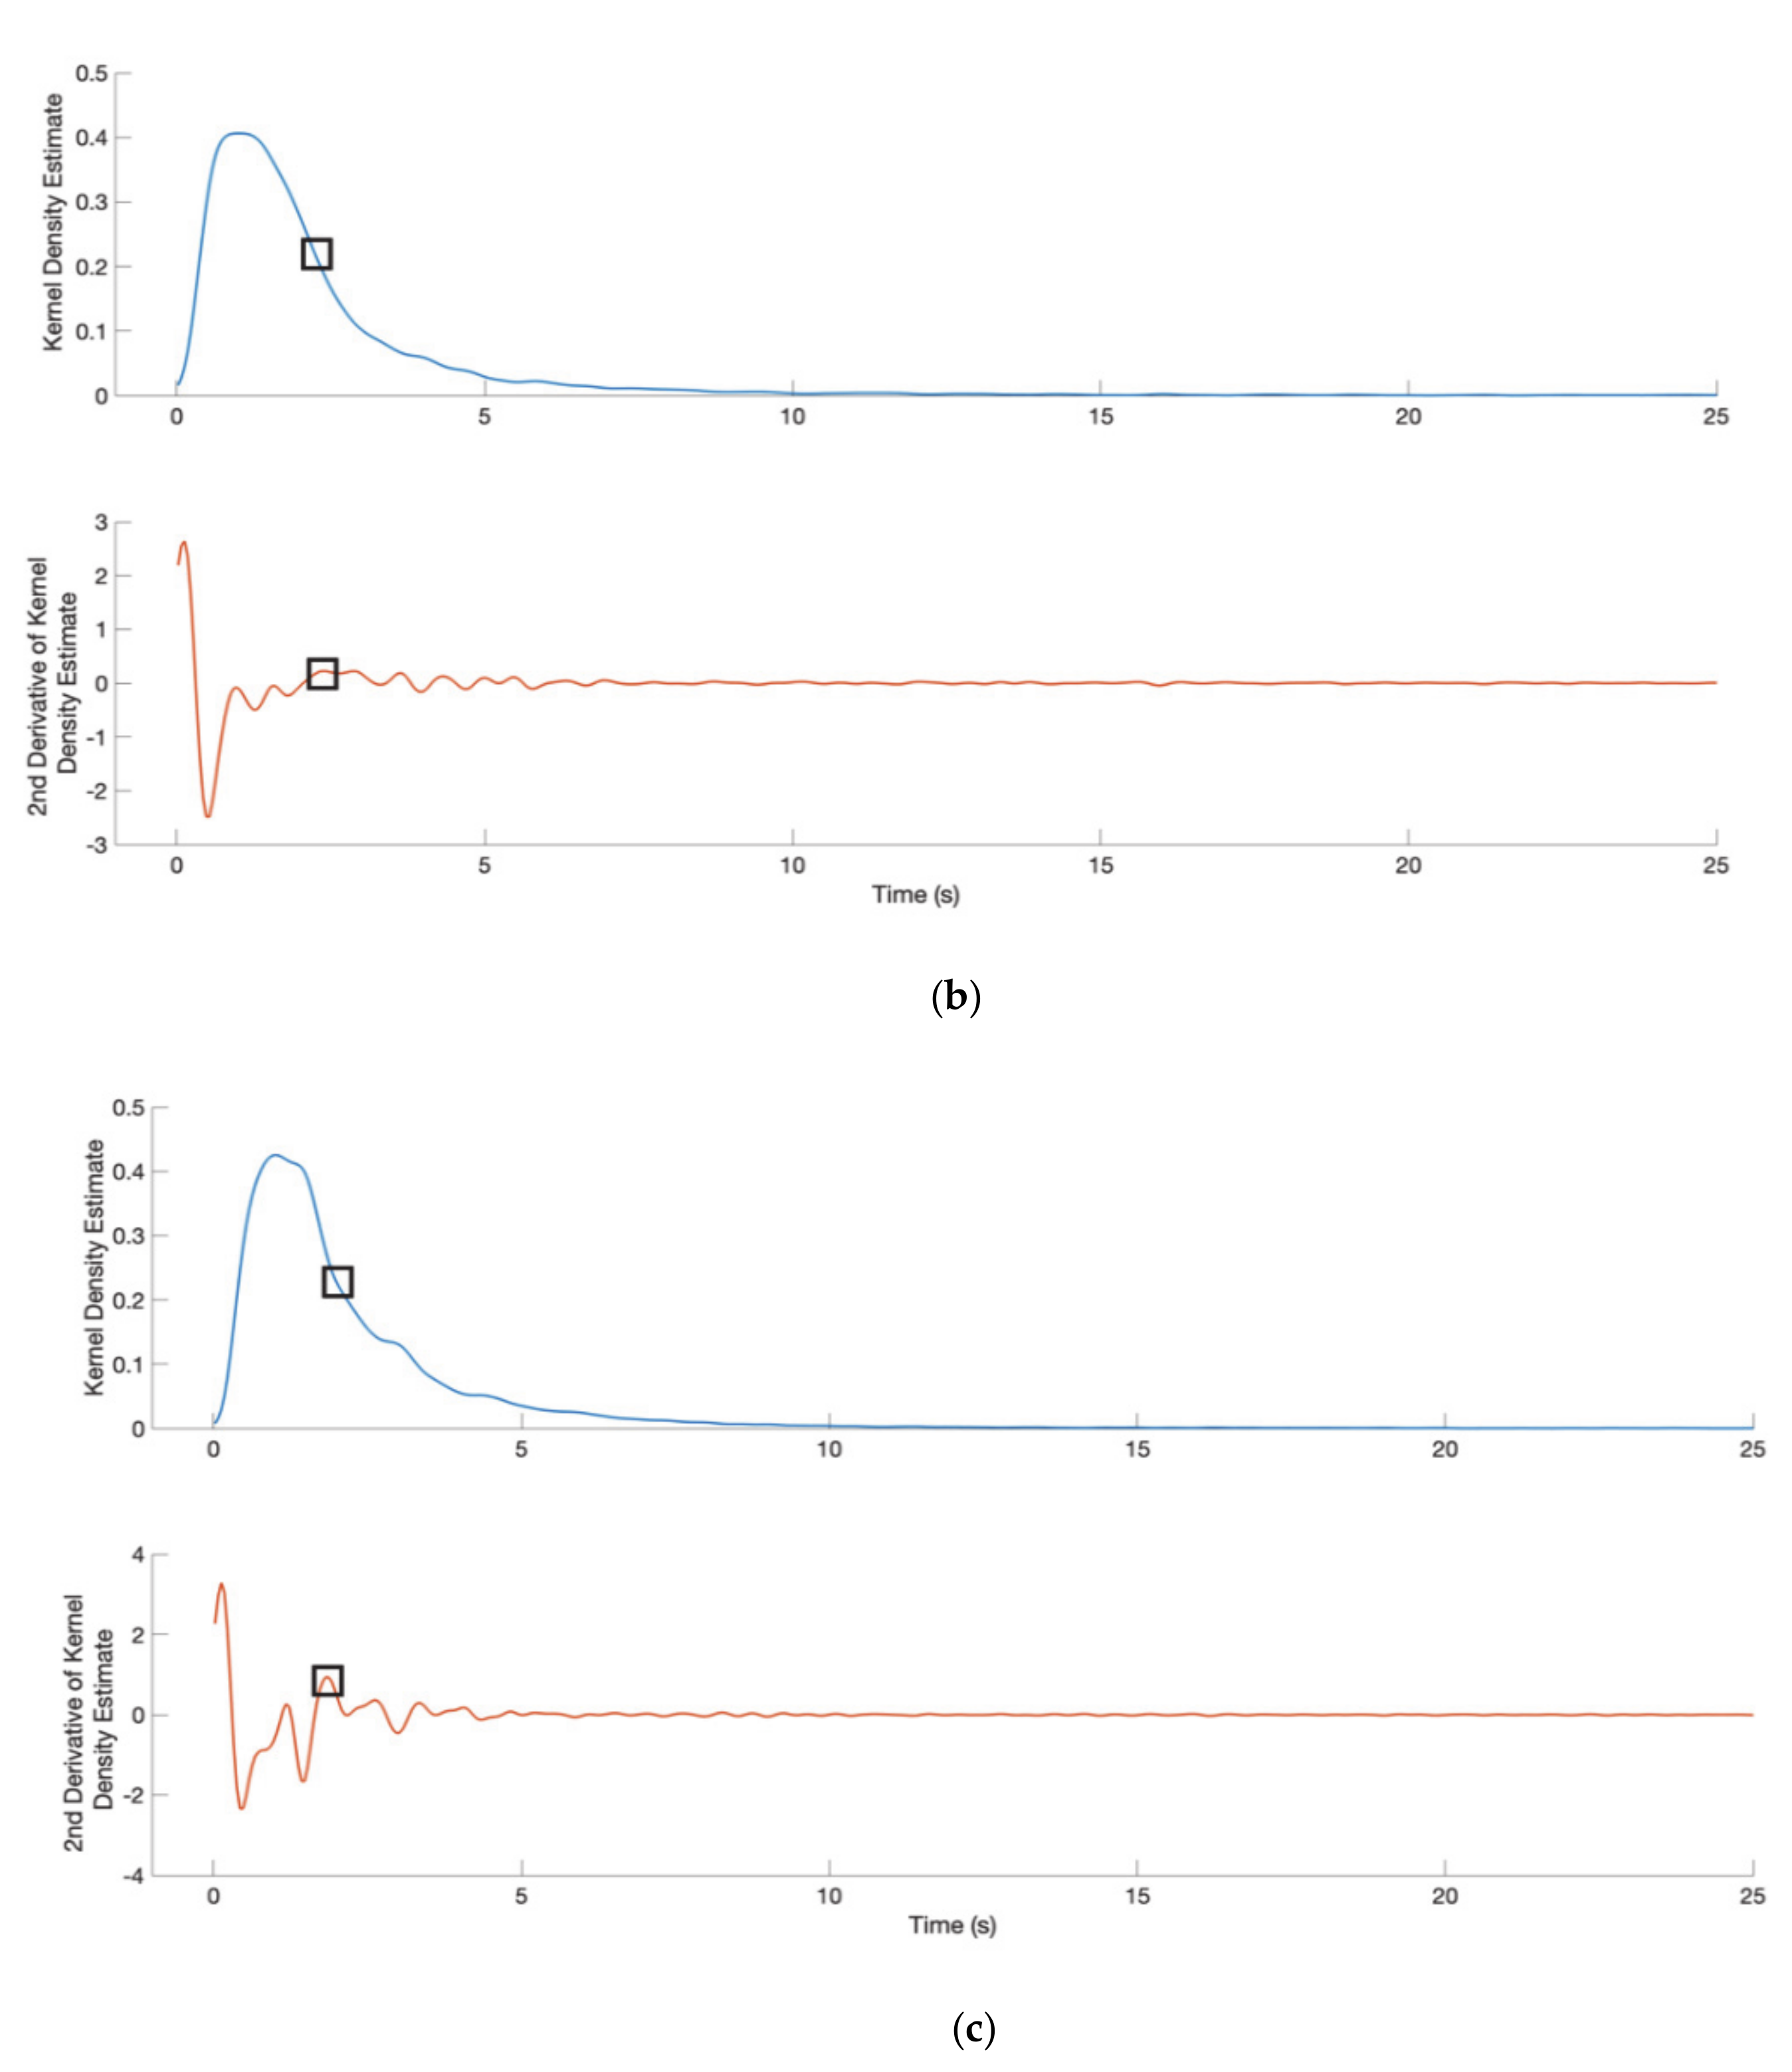
The normalized IBI histograms providing the probability density function (pdf) were extracted for each experimental task of the three datasets under investigation. The IBI histograms were grouped according to their experimental phase and induced affective state (neutral, stress). For each aggregated histogram, the best fitted distribution to the data was extracted among the candidate distributions (beta, exponential, gamma, logistic, log-logistic, lognormal, normal, Rayleigh, Weibull distributions). The aggregated IBI histograms for each experimental phase along with their best fitted distributions, are shown in
Figure 3.
Inspecting the behaviour of the distribution for each task in
Figure 3, it can be deduced that the stressful states (e.g., interview, emotional recall) distributions have offset to the right in relation to the stressful state for the first 2 phases. This can be partially attributed to the fact that during stress conditions eye blink rate increases. The best fitted distribution on each phase is lognormal in all cases except phase 3 neutral state which is log-logistic. All best-fitted distributions are presented in
Table 3. The differentiation of distribution of IBI that each task follows for the dataset was checked using 2 samples Kolmogorov-Smirnov test [
25].
It can be observed that in most cases the best-fitted distribution among the distributions described is the lognormal distribution. During the 3 out of 4 experimental phases (social exposure, emotional recall and mental tasks), the 2-sample Kolmogorov-Smirnov X
2 test revealed that the data of neutral and stress states come from different distributions. Then, it was investigated whether the IBI distributions present significant differences between the two emotional states (neutral, stress) for each experimental phase utilizing all the 3 available datasets. The IBI comparison was performed using the Z-test of two log-normal samples [
26] and the results are shown in
Table 4.
It can be observed, that during the social exposure, emotional recall and mental tasks a statistically significant difference between the neutral and stress state is present. Especially, during 2 of these phases (social exposure, emotional recall) significantly reduced IBI exists during stress compared to neutral states. These results indicate that during stress conditions there are increased blinks, as supported also in relevant literature [
7,
8].
4.4. Markovian Analysis
The main feature used in order to capture the task dynamics is the IBI. By separating the IBIs distribution in two categories it is an open question whether the generation of blinks is subject to two attractor states, one in which blinks occur in a short time, resulting in short IBIs, and another in which blinks occur in a long time, resulting in long IBIs. These different states of blink generation during watching neutral, relax and stressful video was analyzed by applying first-order Markovian Analysis. The state transition probability matrices (STPMs)
were calculated and compared with the
matrices giving the probability of being at state
, in order to test whether the generation of blinks during relaxing/stress procedures is a stochastic process. The statistical significance between these two matrices was calculated and the results are presented in
Table 6.
In
Table 6 the matrices
are presented for each experiment, phase and task. Based on chi-square statistics with 2 degrees of freedom at
significance level,
P is significantly different from
when the values of
is larger than the value 5.991, based on chi-square distribution tables. This was the case for all tasks. Thus the null hypothesis that matrix
P is equal to matrix
was rejected and a first-order Markov process was assumed for all tasks. Therefore, it was conjectured that the process generating blinks possessed, at least, first-order “memory” in all tasks. For each original element value of the matrix P, a distribution of 1000 Bootstrap values was derived, and the 2.5% and 97.5% percentiles of this distribution were calculated and used as the 95% confidence interval for the particular original element value of the P matrix.
Furthermore,
Table 6 shows that
and
are significantly higher than the corresponding
and
, for all experiments, phases and tasks—except, marginally, for
for experiment 1, social exposure phase, neutral task—while
and
are significantly lower than the corresponding
and
, based on their 95% confidence intervals as presented in
Table 6. These results provide an indication that state 1 and state 2 can be characterized as “auto-attractors”, meaning that the blink generation system has a tendency to either maintain short IBIs (state 1) or long IBIs (state 2), while avoiding transitions from one state to the other. In order to investigate furthermore the indications about the existence of auto-attractor states, looking at differences within matrix
P, it was observed that
was significantly higher than
for all experiments, phases and tasks. On the other hand,
was significantly higher than
for both tasks of the stressful video phase of experiments 2 and 3, for both tasks of the mental tasks phase of experiment 3, while for experiment 1
was significantly higher than
for the neutral tasks of the emotional recall and stresfull video phases. Thus, the evidence that state 1 is an auto-attractor in all experiments, phases and tasks (keeping in mind the exception for one task, stated above) is strengthened. On the other hand, the nature of state 2 as an auto-attractor seems to hold mainly for the stressful video phase (for both tasks) for experiments 2 and 3.
In conclusion, the generation of blinks seems not to be a purely random process. Instead, it appears to possess “memory”, in the sense that the previous state of the system (i.e., whether a short or long IBI preceded the current IBI) influences which will be the current state. Furthermore, there are strong indications that the short IBI state (state 1) can be characterized as an auto-attractor, across experiments, phases and tasks. Indications on whether the long IBI state (state 2) can be characterized as an auto-attractor across experiments and tasks seem to hold strongly for only the stressful videos phase. The preponderance of the short IBIs states over the long IBIs states, possibly in line with the indications that state 1 is an auto-attractor, is ascertained by the fact that is greater than for every task. Taking into account the finding that the auto-attractor nature of the short IBIs state exists for both the relaxation and the stress-inducing tasks and since stress has been shown to induce higher BR (therefore shorter IBIs), it would be interesting to further investigate whether the short IBI state, during which a subject produces relatively many blinks in sequence during the task, corresponds to an intra-task differentiation of stress levels, even for relaxation-inducing tasks.
As a further step of investigating the Markov dynamics of states 1 and 2, we compared the percentages of difference between and , i = 1,2 between neutral and stressful tasks in the various phases. A higher percentage of difference for one task compared to the other, for a given state, might provide an indication that the attractor nature of that state is stronger for the task where the percentage is greater. The aim of the investigation was whether there existed a trend across experiments and phases, “linking” attractor states to neutral or stressful tasks. According to the above rationale, in the social exposure phase and emotional recall phase (except from experiment 2), the percentage of difference between and is greater in neutral than in stressed tasks, while, conversely, in the stressful videos phase the percentage of the difference between and is greater in stressed than in neutral tasks. In the emotional recall phase the same occurs in the 1st and 2nd experiment. For the mental task phase and the stressful videos phase, in the 3rd experiment, the percentage of difference between and and and is greater in neutral than in stressed tasks. Additionally, for the stressful videos phase, in experiment 2, the percentage of the difference between and is greater in neutral than in stressed tasks, while the percentage of the difference between and is greater in stressed than in neutral tasks.
It was mentioned above that the rate of blink generation is increasing under stressed tasks, so the “short” attractor (#1) could be expected to be strongest in stressed tasks, while, in contradistinction, the “long” attractor (#2) is expected to be strongest in the neutral tasks. This expectation was not verified across all the experiments based on the Markovian Analysis presented above. In order to investigate the impact of the attractor’s existence on the classification accuracy, further analyses were implemented. Specifically, for each phase, we selected the experiment that presented concurrently the strongest attractor values, as indicated by the percentage difference between values
and
(denoted
in the following), as well as between
and
(denoted
in the following), under stressed and neutral tasks, respectively, and then trained, per phase, the classifiers using only the subjects from the selected experiment. As far as the classifier structure and classification testing are concerned, the hyperparameters of the 1D CNN architecture and LSTM classifier remained the same. The nested cross-validation scheme was selected to 3 × 5 after trial-error investigation. The classification results are presented in
Table 7.
Specifically, in the social exposure phase under stressed tasks is strongest in experiments 1 and 3 (3%), while in the social exposure phase under neutral tasks is strongest in experiment 1 (79%). So the experiment for which both and reached their peaks was experiment 1. Therefore, the IBI sequences of experiment 1 were fed into the classifiers (CNN and LSTM). For the other phases, the application of the above methodology did not lead to a selection of one specific experiment, since, as exposed hereafter, and had peaks at different experiments. For the emotional recall phase, experiment 1 presents the strongest (84%), while is strongest in experiment 2 (12%). For the stressful images phase, which has only a stress producing task and the neutral task used for comparison is the neutral task of the emotional recall phase, is strongest in experiment 2 (12%), while is strongest for experiments 1 (84%). Additionally, since the mental task phase was present only in experiment 3 the proposed methodology was not applied for this phase. Finally, for the stressful videos phase is strongest n experiment 1 (19%), while is strongest in experiment 1 (67%).
As can be seen from
Table 7 there is a notable improvement for the classification accuracy for the social exposure phase, for both the CNN and the LSTM classifier, when data were used only from experiment 1, according to the methodological criteria stated above. Of note is also the fact that the classification accuracy reached for the LSTM classifier is highest than any accuracy value reached when data from all experiments were used concurrently, as presented in
Table 5.
