1. Introduction
Educational practices have been increasingly and widely evolving through the inclusion of project-based learning (PBL), flipped classroom (FC) and analogous methodologies [
1]. These allow students to learn more independently through interactive teacher-mediated resources, such as video lessons or instructional guide models that potentiates their autonomous search for solutions to real world problems. It is therefore characterized by learning through questions and problem solving rather than mechanical memorization. The main goal is to increase student’s autonomy and enhance their critical thinking.
A recent study [
2] has evaluated the effect of PBL and FC approaches in the outcome of students, concluding that they contribute to improve the learning process in all the evaluated parameters. Namely, PBL and FC contribute to better reasoning ability, increase in creativity, spirit of cooperation, and assistance improvement. In addition, a better adaptation was noticeable when facing several situations in their daily lives.
Over the past years, mobile devices (e.g., smartphones and tablets), have become available to a large number of students and are nowadays widespread within the classroom. While such devices can often work as a distraction, they also have the potential to become powerful teaching tools across multiple disciplines. Furthermore, they enable students to work virtually anywhere, even in remote teaching (as recently required during the COVID-19 outbreak). However, this is still relatively unexplored, especially in higher education.
In this work we describe the results of an approach that builds on the ease of access to mobile devices, and combines it with state-of-the-art software and Internet of Things (IoT) hardware, to support PBL teaching in biomedical engineering courses, building upon previous work from our team in the field of low-cost physiological sensing [
3]. The remainder of the paper is organized as follows.
Section 2 presents the candidate supporting tools.
Section 3 describes the proposed methodology, illustrated with a preliminary case study.
Section 4 outlines the main findings of our work. Finally,
Section 5 and
Section 6 include the discussion, summary of the main conclusions, and describe future work guidelines.
2. Background
2.1. Google Science Journal
In line with the trends described in
Section 1, Google has launched the Science Journal (GSJ) initiative [
4], a cloud-enabled mobile app designed to support K-12 education. It uses the mobile phone as a measurement and documentation tool for science experiments.
Students can create a log of their activities, supported by text annotation and pictures, as well as perform recordings made with the internal sensors of the mobile device (e.g., microphone, acceleromenter, gyroscope, magnetometer, barometer, and others).
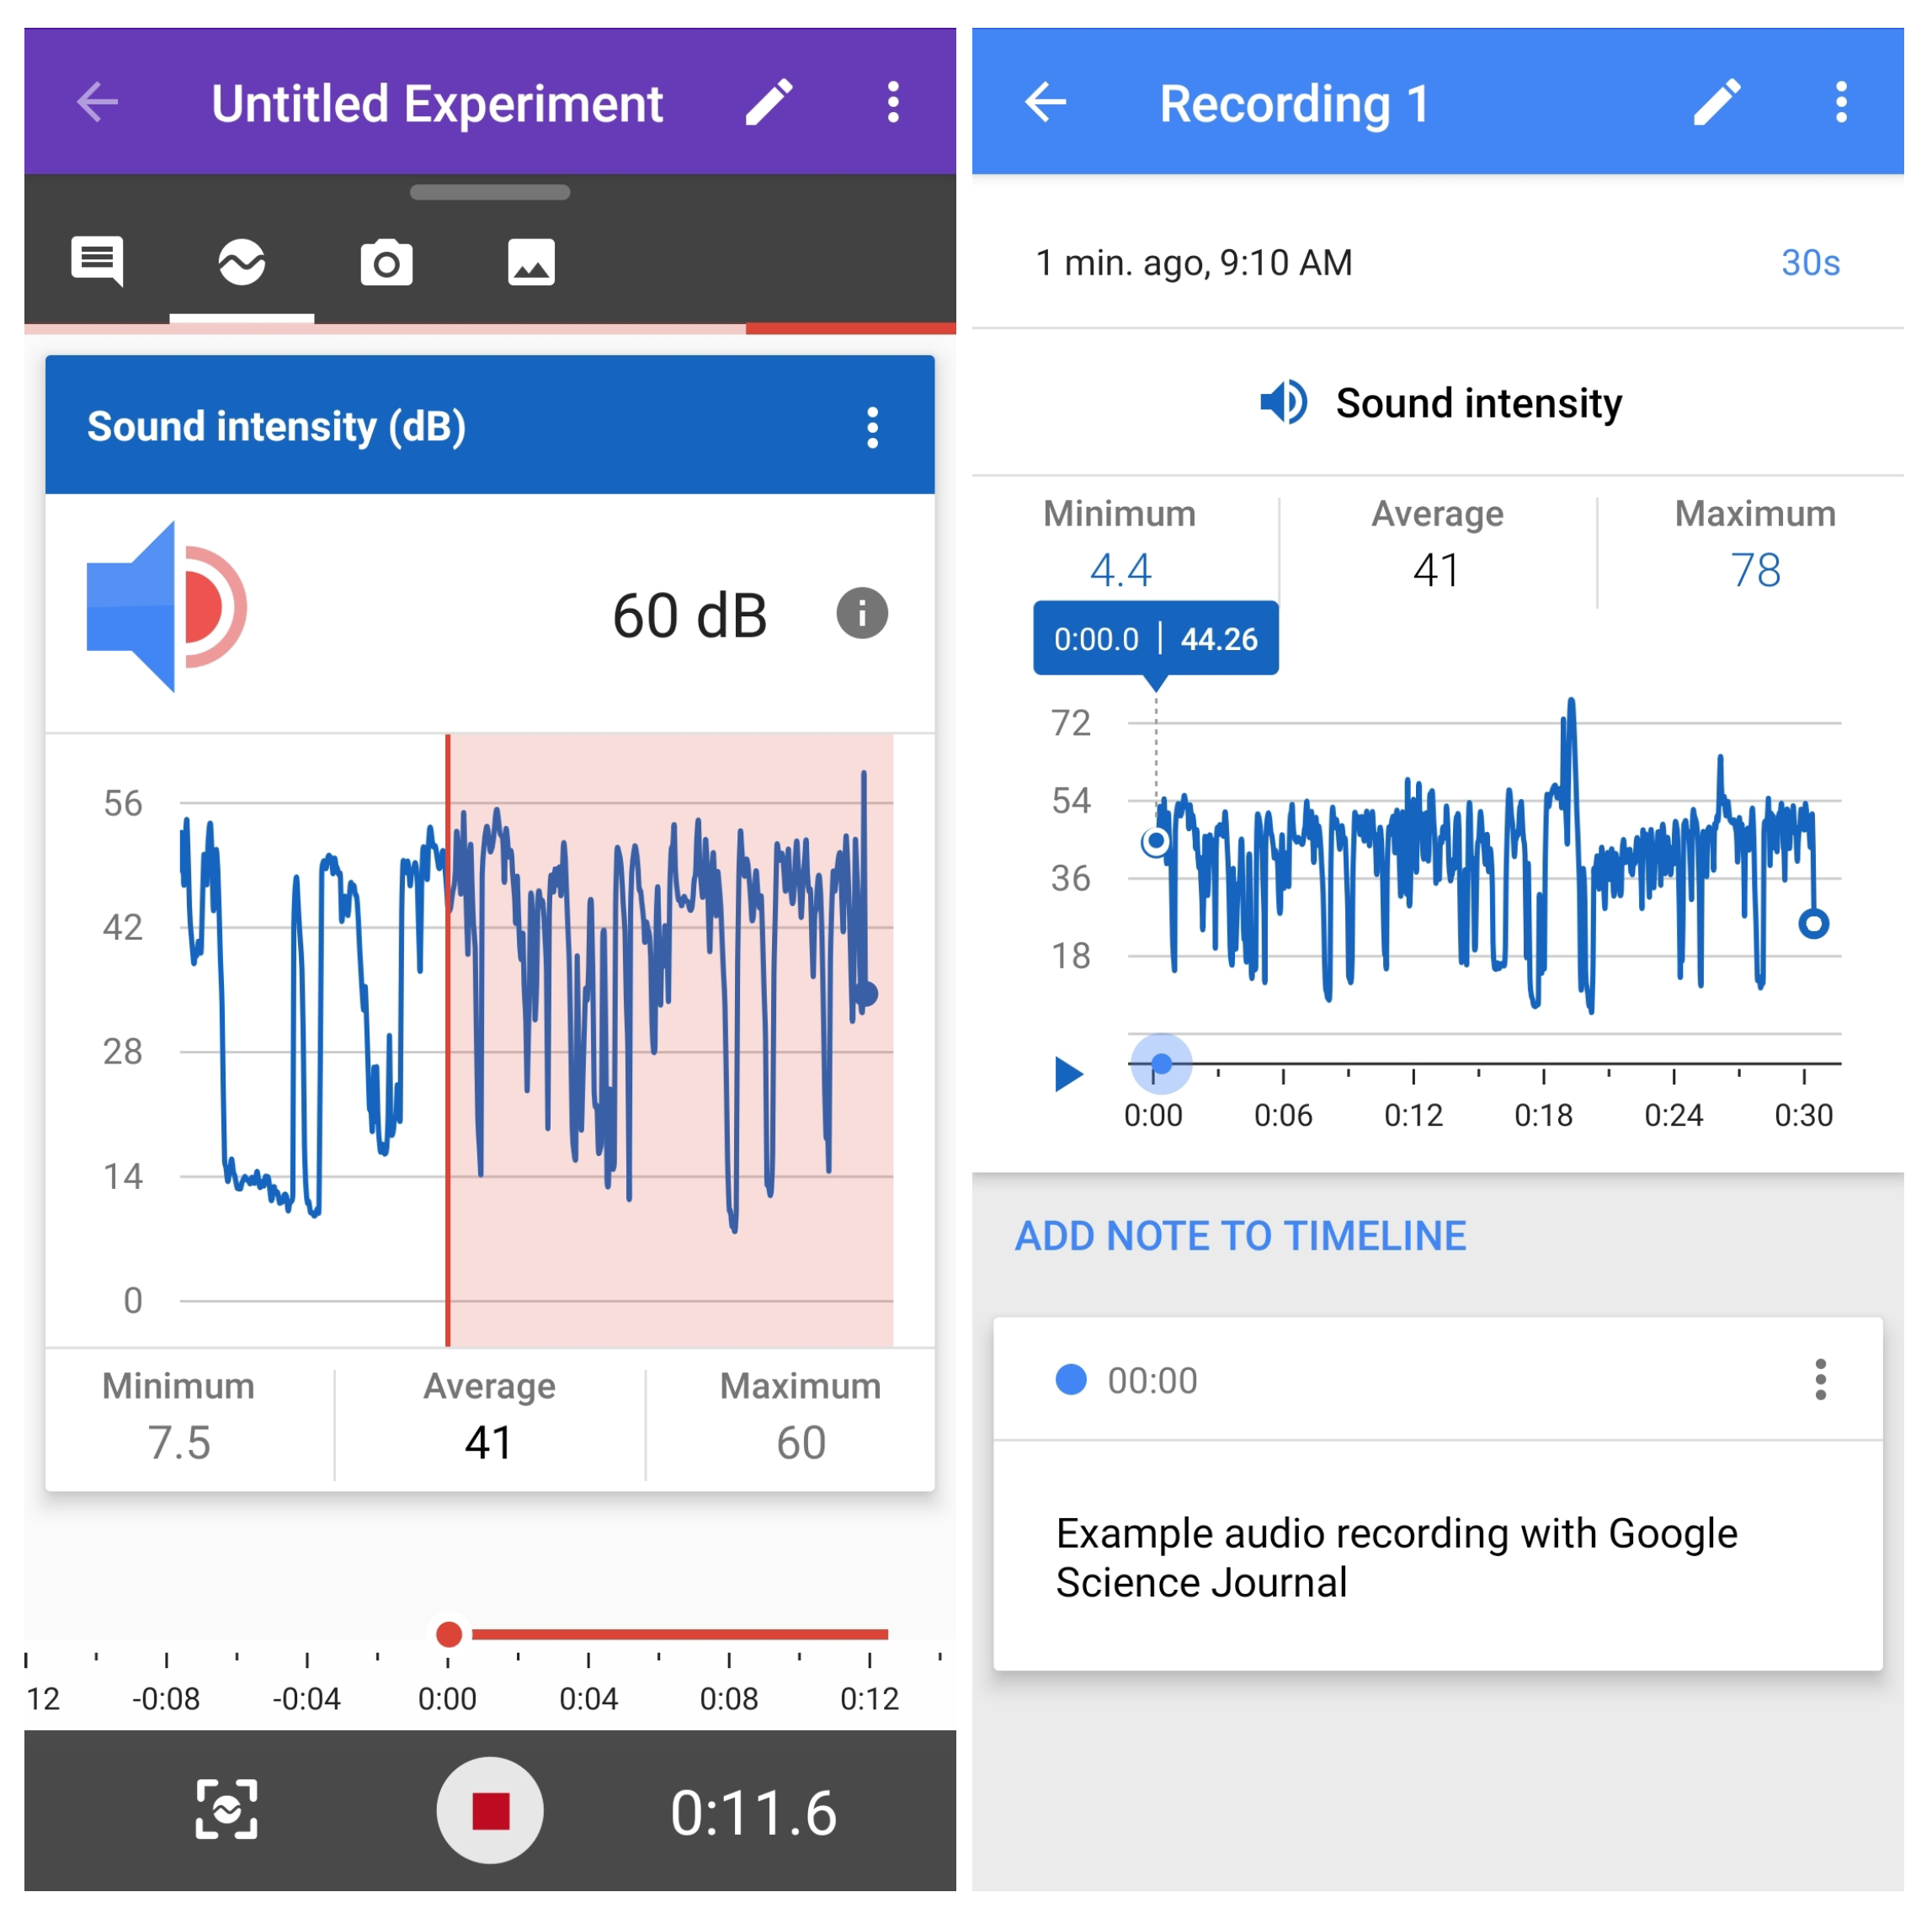
Figure 1 depicts an example of a sound intensity measurement experiment that, in the field of biomedical engineering, could be applicable (e.g. for cough analysis).
To further extend the capabilities of the platform in terms of sensing, Google provides a set of open APIs and a firmware for the popular Arduino platform [
5], enabling the recording of data from external sensors also. The app is compatible with Android and iOS, although in the latter not all features are yet available, and enables exporting the recorded data as Comma-Separated Values (CSV) files that can be used for post-processing, and seamlessly shared (e.g., to the Google Drive).
2.2. Arduino MKR WIFI 1010
One option currently available to easily connect external sensors to the GSJ has been introduced by the Arduino [
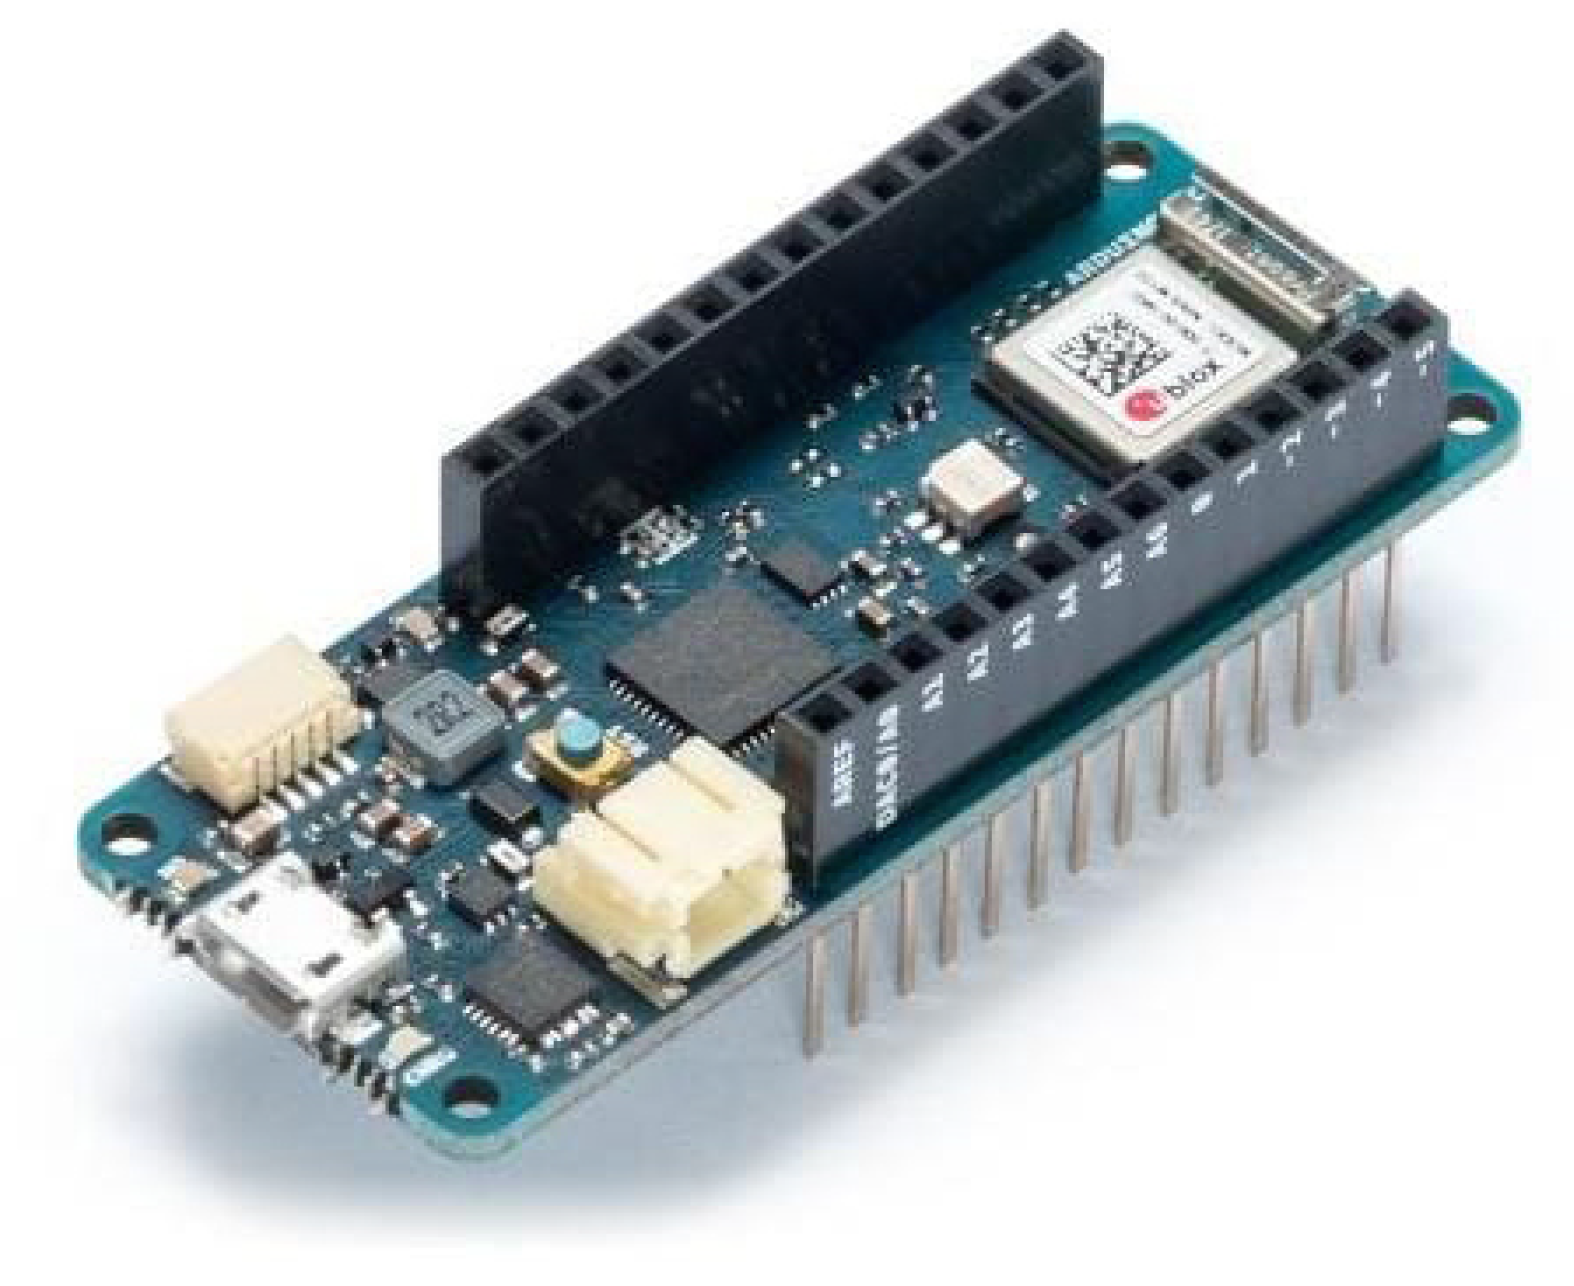
5], combining their MKR WIFI 1010 with a purpose-built Science Carrier Board (SCB) and the firmware made available by Google. The Arduino MKR WIFI 1010 includes a 32-bit Cortex-M0+ ARM microcontroller (programmable like a conventional Arduino) running at a clock speed up to 48 MHz, providing up to 20 analog inputs and up to 8 digital I/O ports, Wi-Fi and Bluetooth connectivity, and a cryptochip for secure communication using SHA-256 encryption. In addition, it has 32 KB of Static Random Access Memory (SRAM) and 8 general purpose digital pins that can be either outputs or inputs.
The connectivity interfaces also allow the board to communicate in a simplified way with any mobile device (e.g., a tablet or a smartphone), without the students needing in-depth knowledge of networking and communication. The Arduino MKR WIFI 1010 can be powered by an external battery and the GSJ firmware enables direct connection with the GSJ mobile app.
Figure 2 depicts the base hardware, and the main technical specifications are listed in
Table 1. For use with the GSJ, the SCB integrates a 9 DoF Inertial Measurement Unit (IMU) and exposes a more limited number of ports, albeit useful to connect external sensors; in particular, only two analog inputs are available.
2.3. Biomedical Sensing on the Arduino
As previously introduced, our work is focused on PBL teaching in biomedical engineering. The Arduino MKR WIFI 1010 SCB is designed primarily for general physics and electrical engineering experiments, reason for which it lacks a suitable sensor set to support such activities. Although multiple options for physiological sensing with the Arduino currently exist [
6], previous research from our team has lead to the creation of a low-cost scientifically validated biomedical sensing kit compatible with the Arduino [
3,
7].
Sensor options include Electrocardiography (ECG), Electromyography (EMG), Electroencephalography (EEG), Electrodermal Activity (EDA), and several others. These can be powered from the V supply available on the SCB and have an analog output, enabling the direct connection to the analog inputs on the SCB. Some of the sensors require a reference voltage.
2.4. Jupyter Notebooks
With the software and hardware components described in the previous sections, we have an end-to-end workflow that includes biomedical data acquisition from a subject (
Section 2.3), transmission to a mobile device when specialized sensors are needed (
Section 2.2), and recording in a journal-like format with the option to export the raw data (
Section 2.1). A final stage of post-processing and analysis of the recorded data are also generally required.
For that purpose, we consider the storage and sharing of pedagogical materials in the Jupyter Notebooks format. This is a free cloud-based environment, which can also be installed locally on the computer, and that enables the creation of documents incorporating live code, equations, graphics and narrative text.
We chose to host our Jupyter Notebooks on GitHub, as it is the platform most widely used by the community at large to share software. In particular, the Binder extension [
8] integrates directly with GitHub, enabling the creation of a Jupyter environment to run the Python scripts online, without needing to install any software. Other available options include Google Colaboratory (or Colab) [
9], or Microsoft Azure Notebooks [
10], which allows users to develop and run Jupyter Notebooks using the Microsoft Azure Cloud Services.
Students can use these tools interactively to create, execute, and easily share their Python scripts to process and extract analytics from the data collected using the GSJ and/or SCB. The Google Colab option has the advantage of enabling direct access to the Google Drive, hence simplifying the process of accessing data recorded with the GSJ app.
3. Proposed Approach
3.1. Reporting Experimental Activities
In its simplest form, the GSJ allows users to document the performed experiments, and create a digital report as a result. In such journals, students can write and keep relevant information, including both notes from the lecture and from their experiments, as well as photographs to illustrate them. Moreover, journals can be organized by the user through titles, plain text and caption images, and shared within the class.
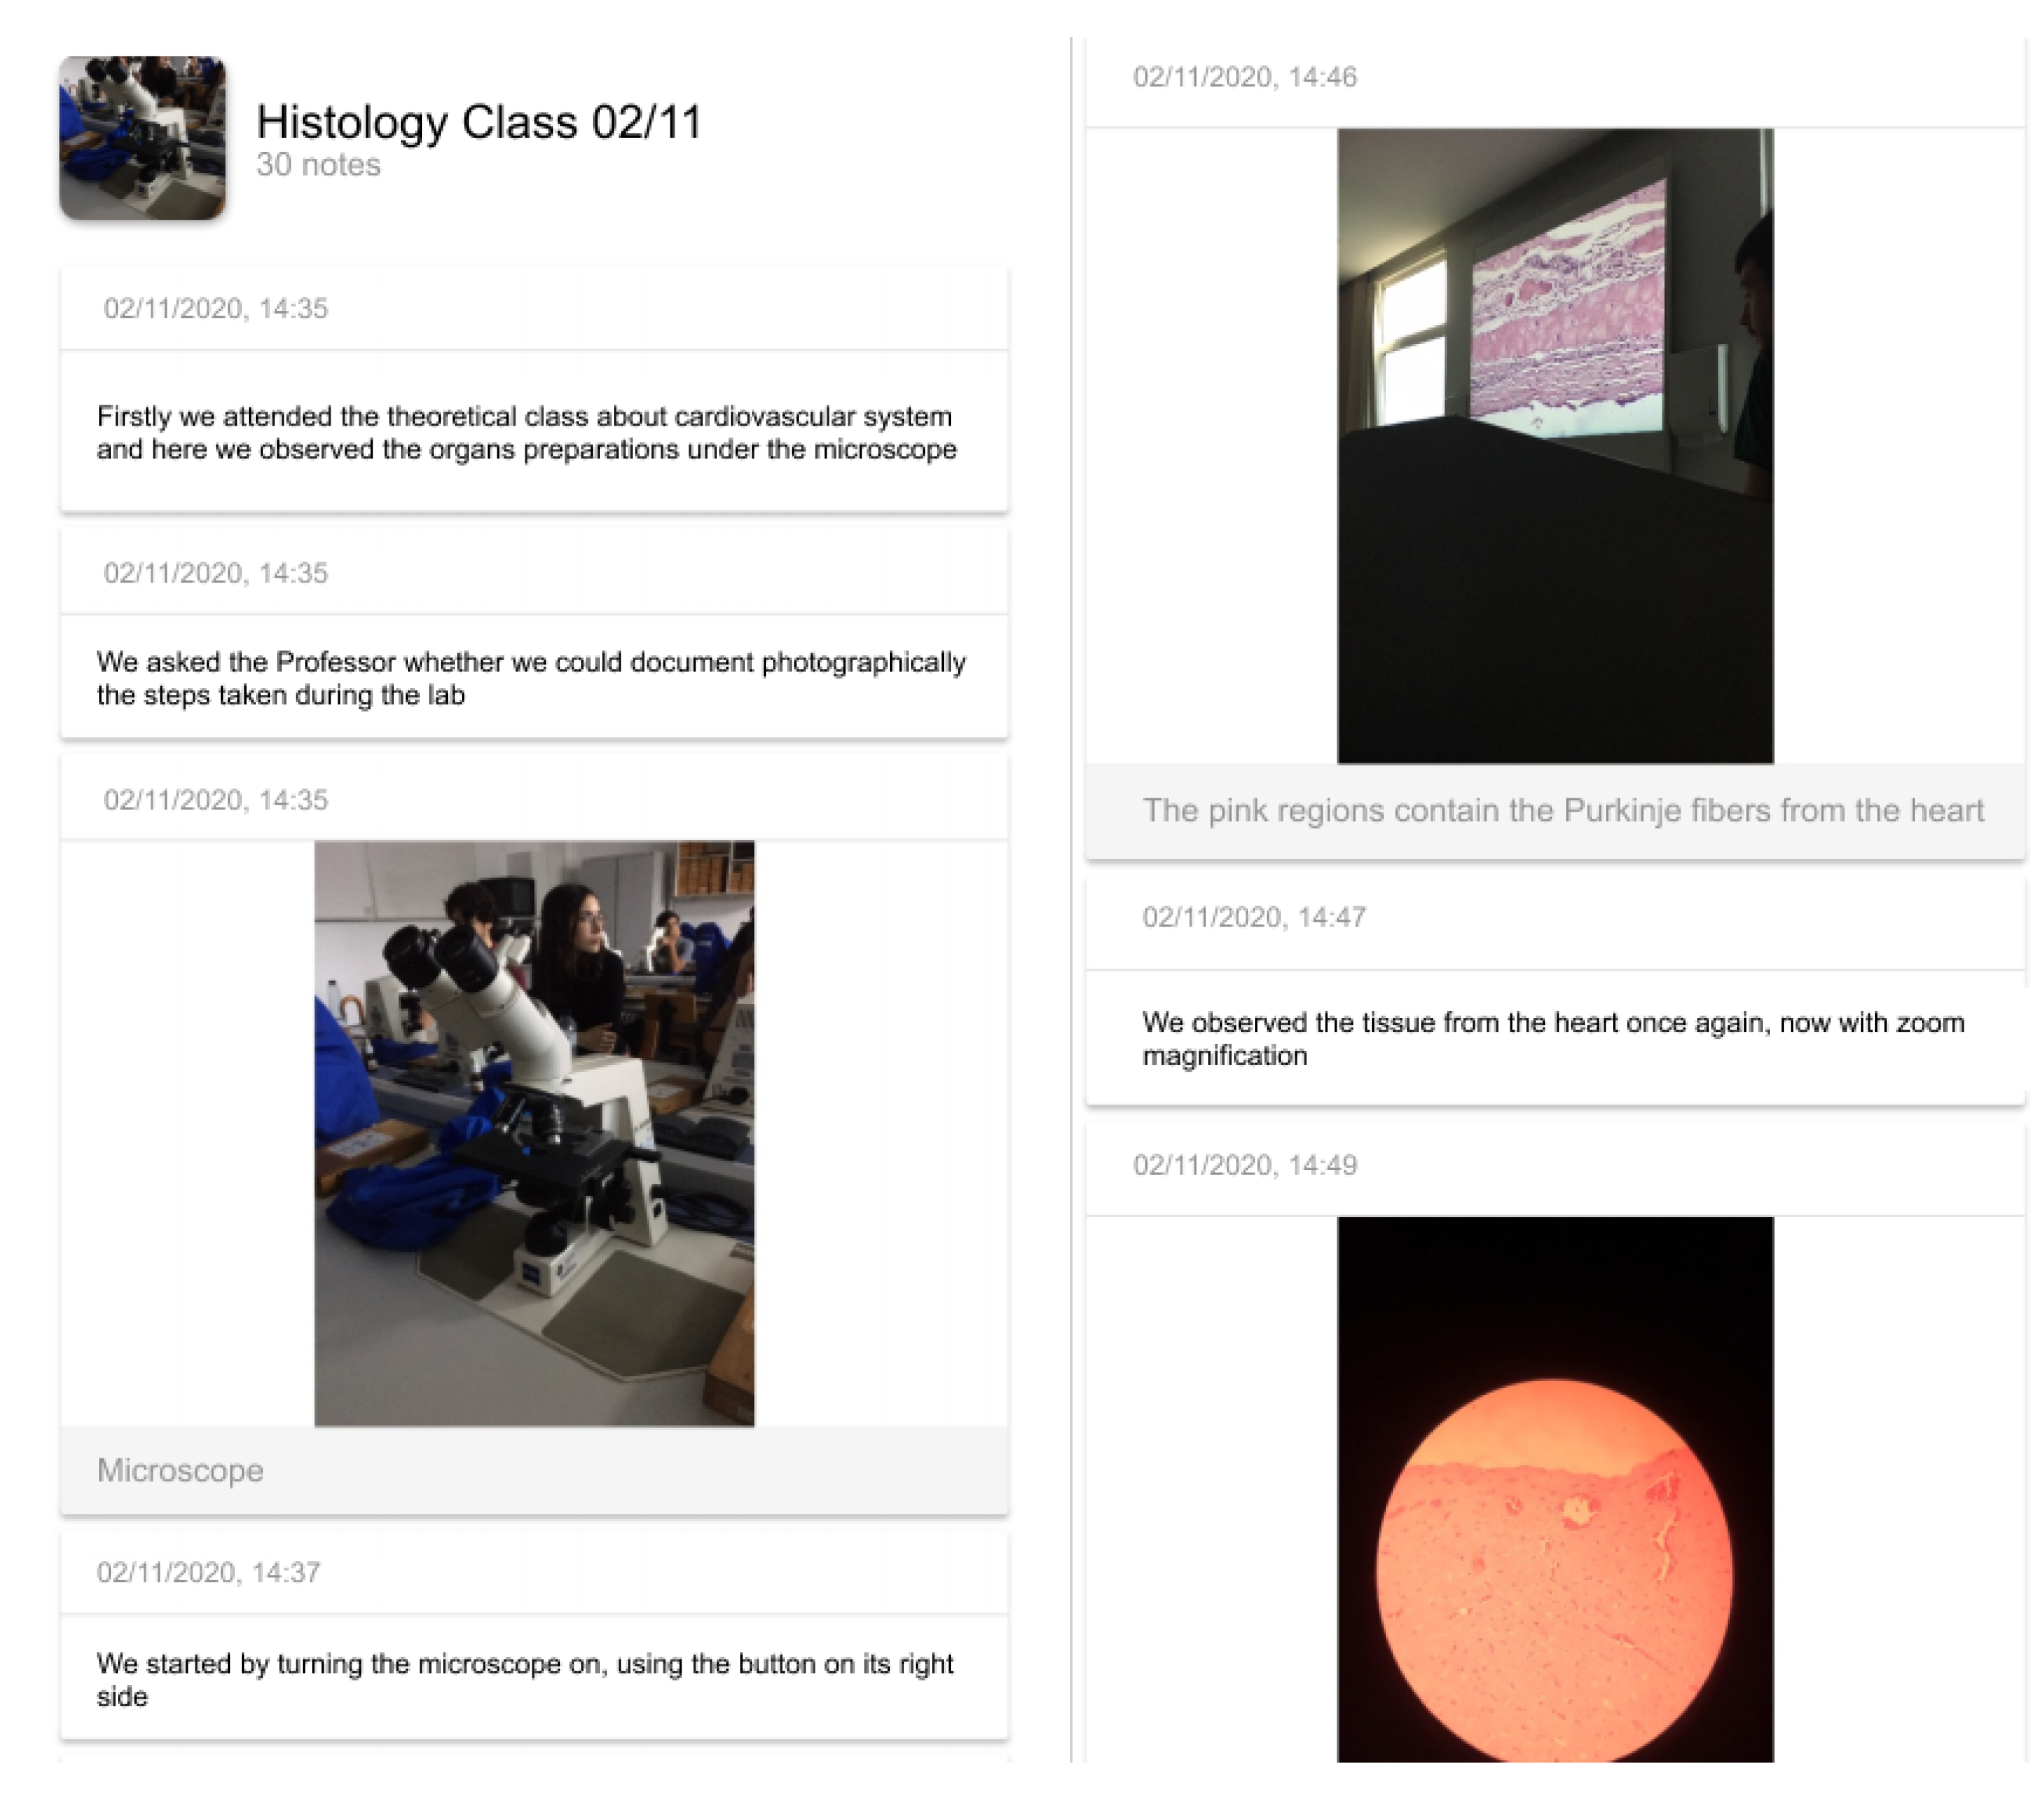
Figure 3 illustrates an excerpt of the report made by a group of students during an experimental class of a Histology course, describing the concepts learned, procedures followed, and image records from the studied tissues.
3.2. Technical Evaluation
ScientIST builds upon the background technologies described in
Section 2, and proposes a workflow (
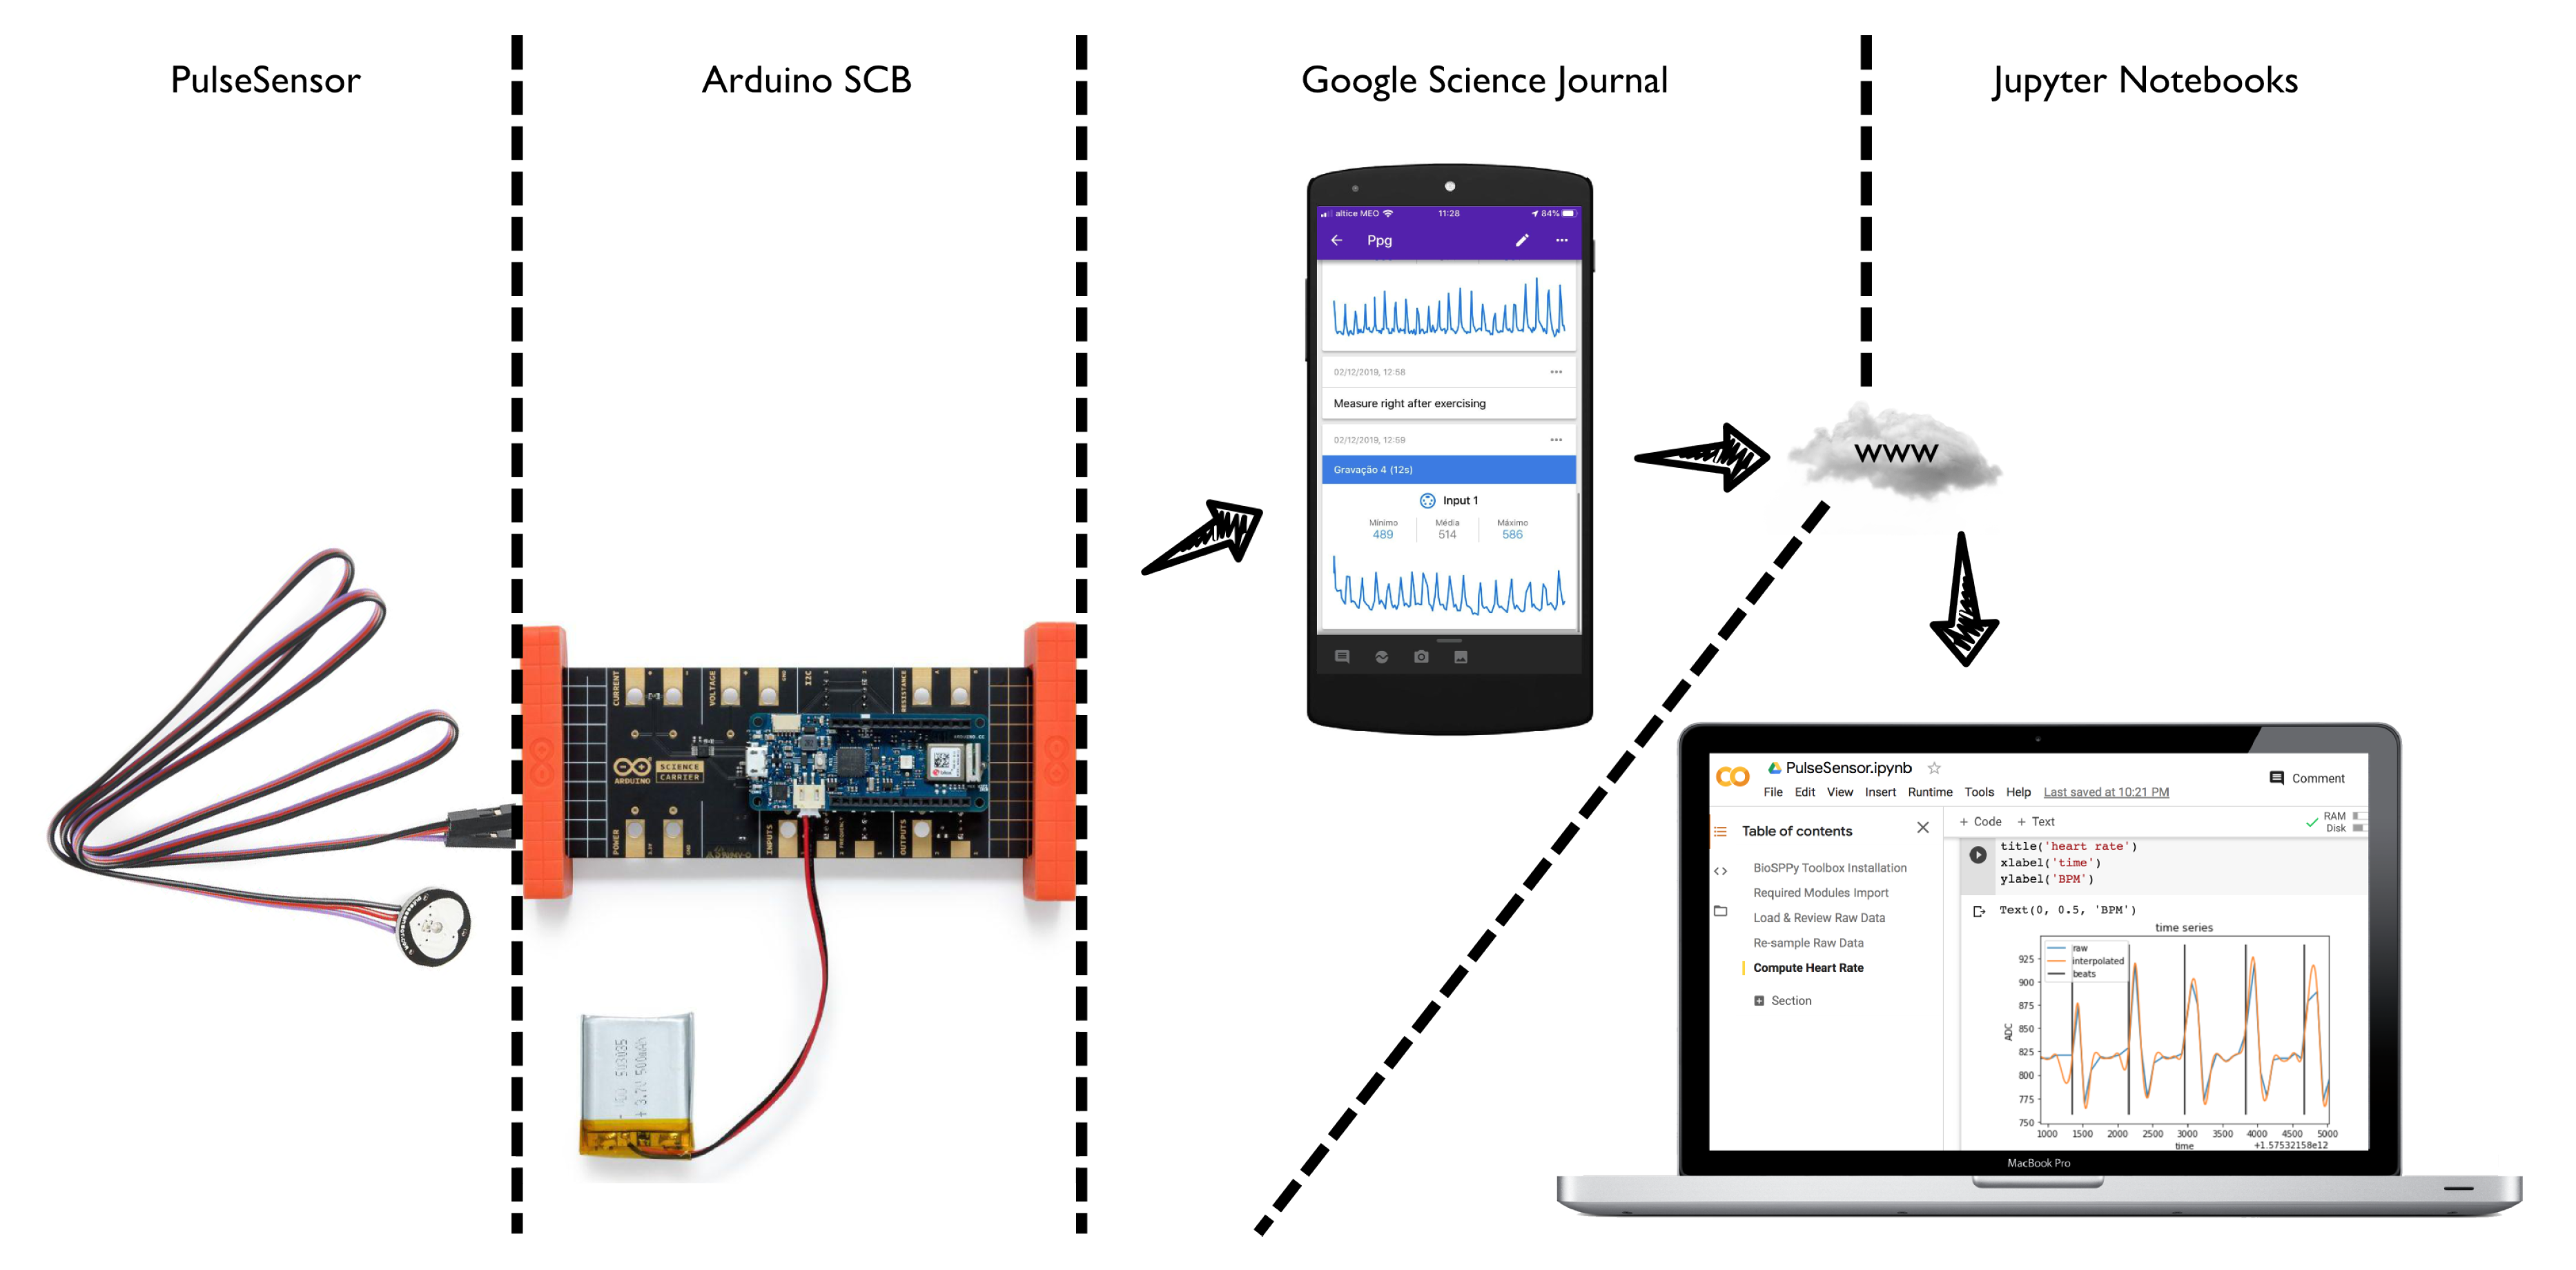
Figure 4) in which biomedical sensors with an analog output are powered from the Arduino SCB and connected to its analog inputs. A log of the experiment is created on a mobile device using GSJ (including biomedical sensor data visualization and recording), and the resulting data are exported to CSV files, to conduct post-processing. Given the emphasis of our work on biomedical data, the BioSPPy toolbox [
11] is used for signal processing and feature extraction.
The Arduino SCB does not comply with the Nyquist theorem requirements (see
Section 4.1), and lacks the
reference voltage required by some of the more common biomedical sensors, as such, we illustrate this workflow with an experiment devised for a course on Introduction to Biomedical Engineering using Photoplethysmography (PPG). This is a noninvasive technique to monitor blood perfusion as a result of arterial translucency, in which an LED iluminates the skin surface using a light source in a wavelength capable of penetrating it, ideally reaching the hypodermis where arteries can be found (i.e., red to infrared) [
12]. A photodetector captures the amount of reflected or transmitted light (depending on the operating mode).
In each cardiac cycle, blood is vigorously pumped during the diastole and traverses the blood vessels across the body to the periphery, while during the diastole blood slowly flows back to the heart. Since part of the light emitted by the LED is absorbed by blood cells, the higher the blood volume, the higher the amount of light absorbed. Measuring the amount of light reaching the photodetector over time, enables the recording of the blood volume changes throughout the cardiac cycle. The dynamics of the resulting signal is a process with relatively low frequency [
12].
To support the case study we use a PulseSensor (
https://pulsesensor.com/) PPG sensor. Power is provided by the Arduino SCB using the 0–3.3 V pins and the analog output is connected to the analog input on the SCB; all the connections are made via the Molex Sherlock pins on the SCB. Within the GSJ mobile app, a new journal is created with the information about the experiment and procedure. A subject is asked to sit down with the PulseSensor placed on his index finger, enabling a visualization and recording of the PPG time series on the journal. The next step is to export the data to a CSV file, and run the post-processing Python script, by means of a Jupyter Notebook, to process the data and compute the heart rate using the BioSPPy toolbox.
4. Results
4.1. Technical Evaluation
For our envisioned experiments, determining the technical capabilities of the SCB when used in GSJ, is of utmost importance. In particular, guaranteeing that the sampling period meets the Nyquist rate is a requirement to enable rigorous experimentation. As
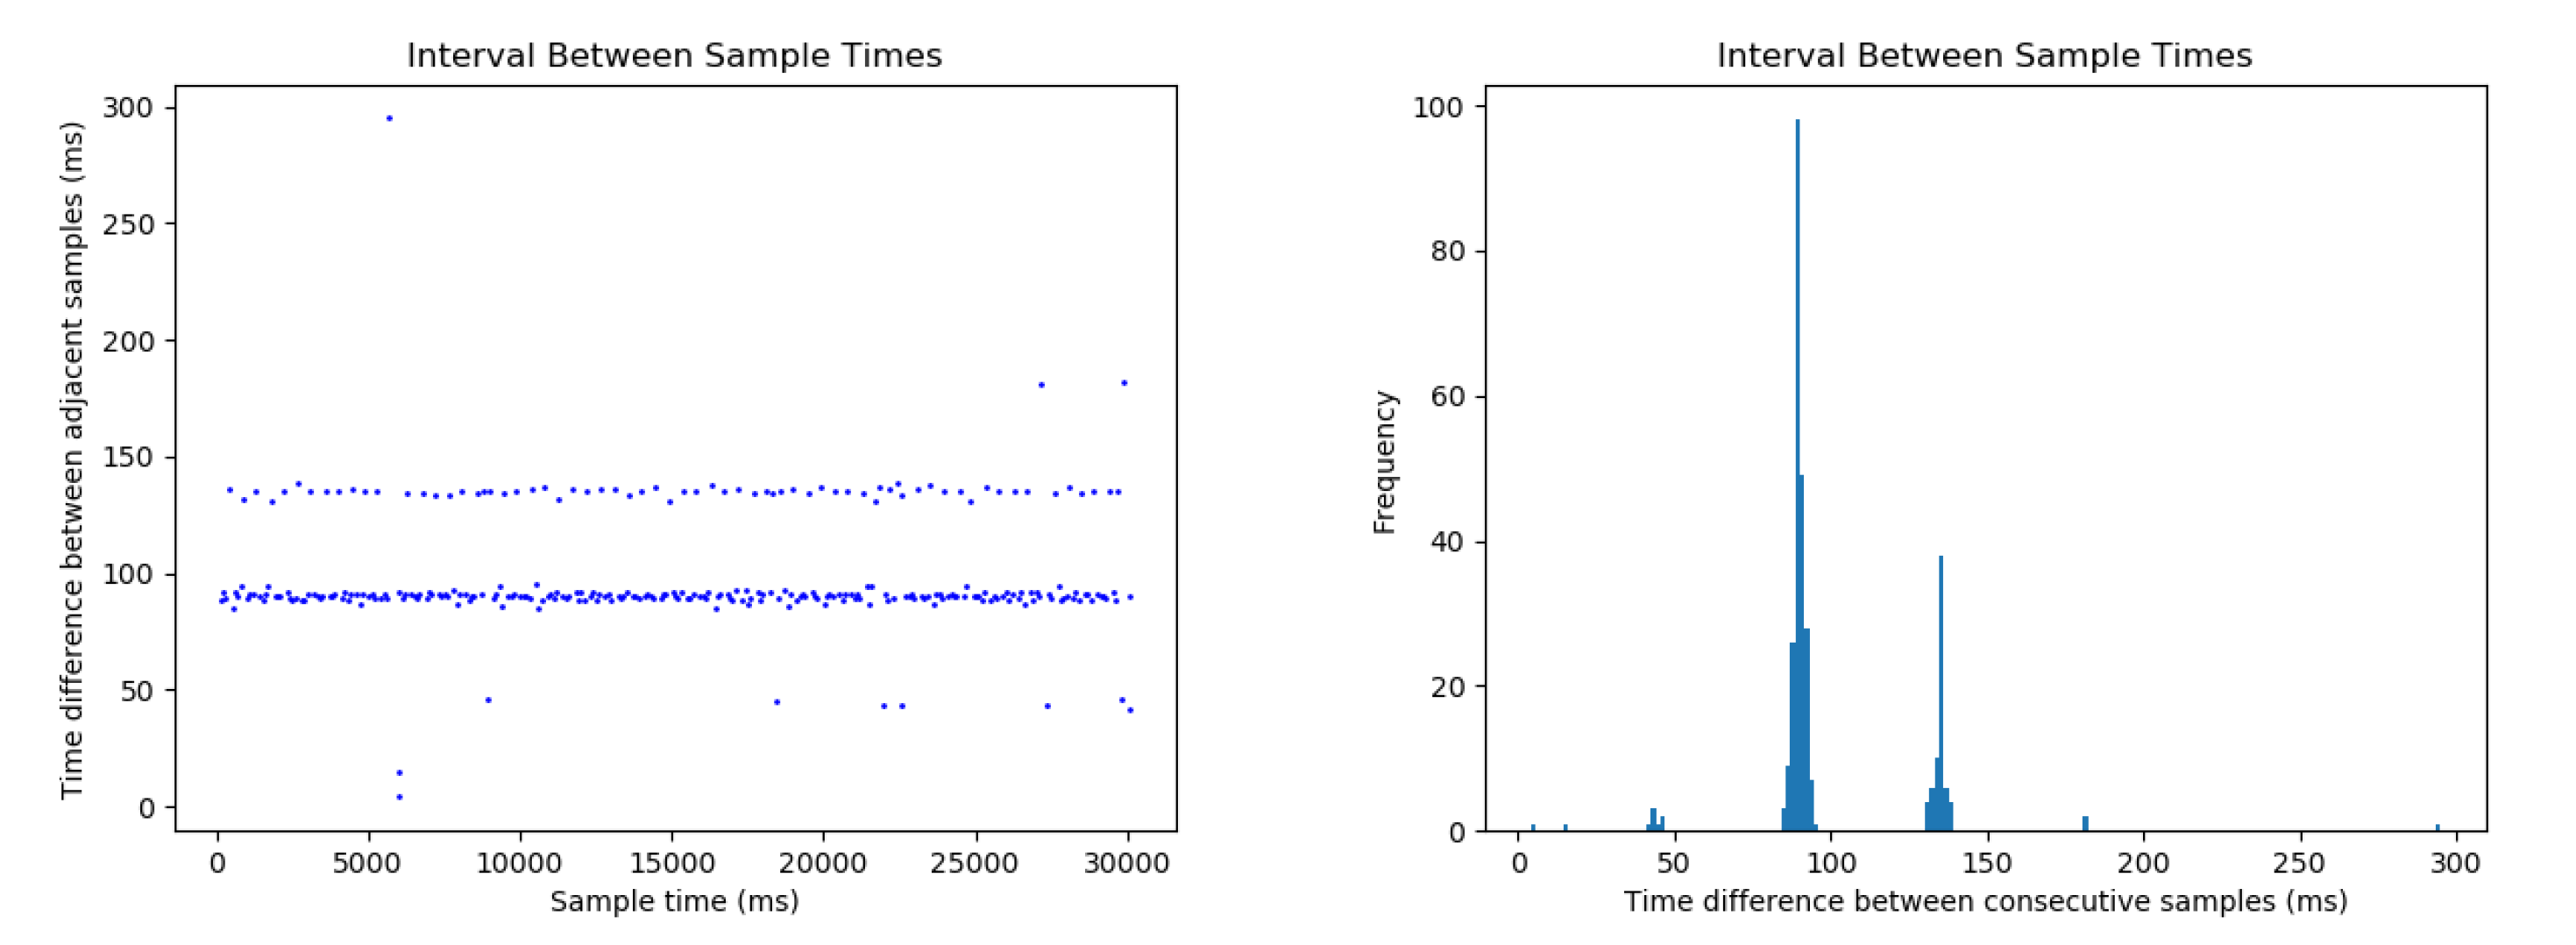
Figure 5 suggests, there is a great discrepancy in the sampling period
. To assess the average sampling rate (
), the following approximation was calculated:
It is not a constant sampling rate nor is it sufficiently high for all biomedical signals; such performance limitations appear to be a direct consequence of the default GSJ Arduino firmware. Specifically, there is a delay of approximately 100 ms in every sampling iteration and every acquisition is an average of 30 samples. After removing these two singularities from the firmware, the sampling rate increased ten fold (to 136 Hz) but it remained inconsistent, allowing us to conclude that the main bottleneck may be the Arduino library that handles the Bluetooth communication (ArduinoBLE).
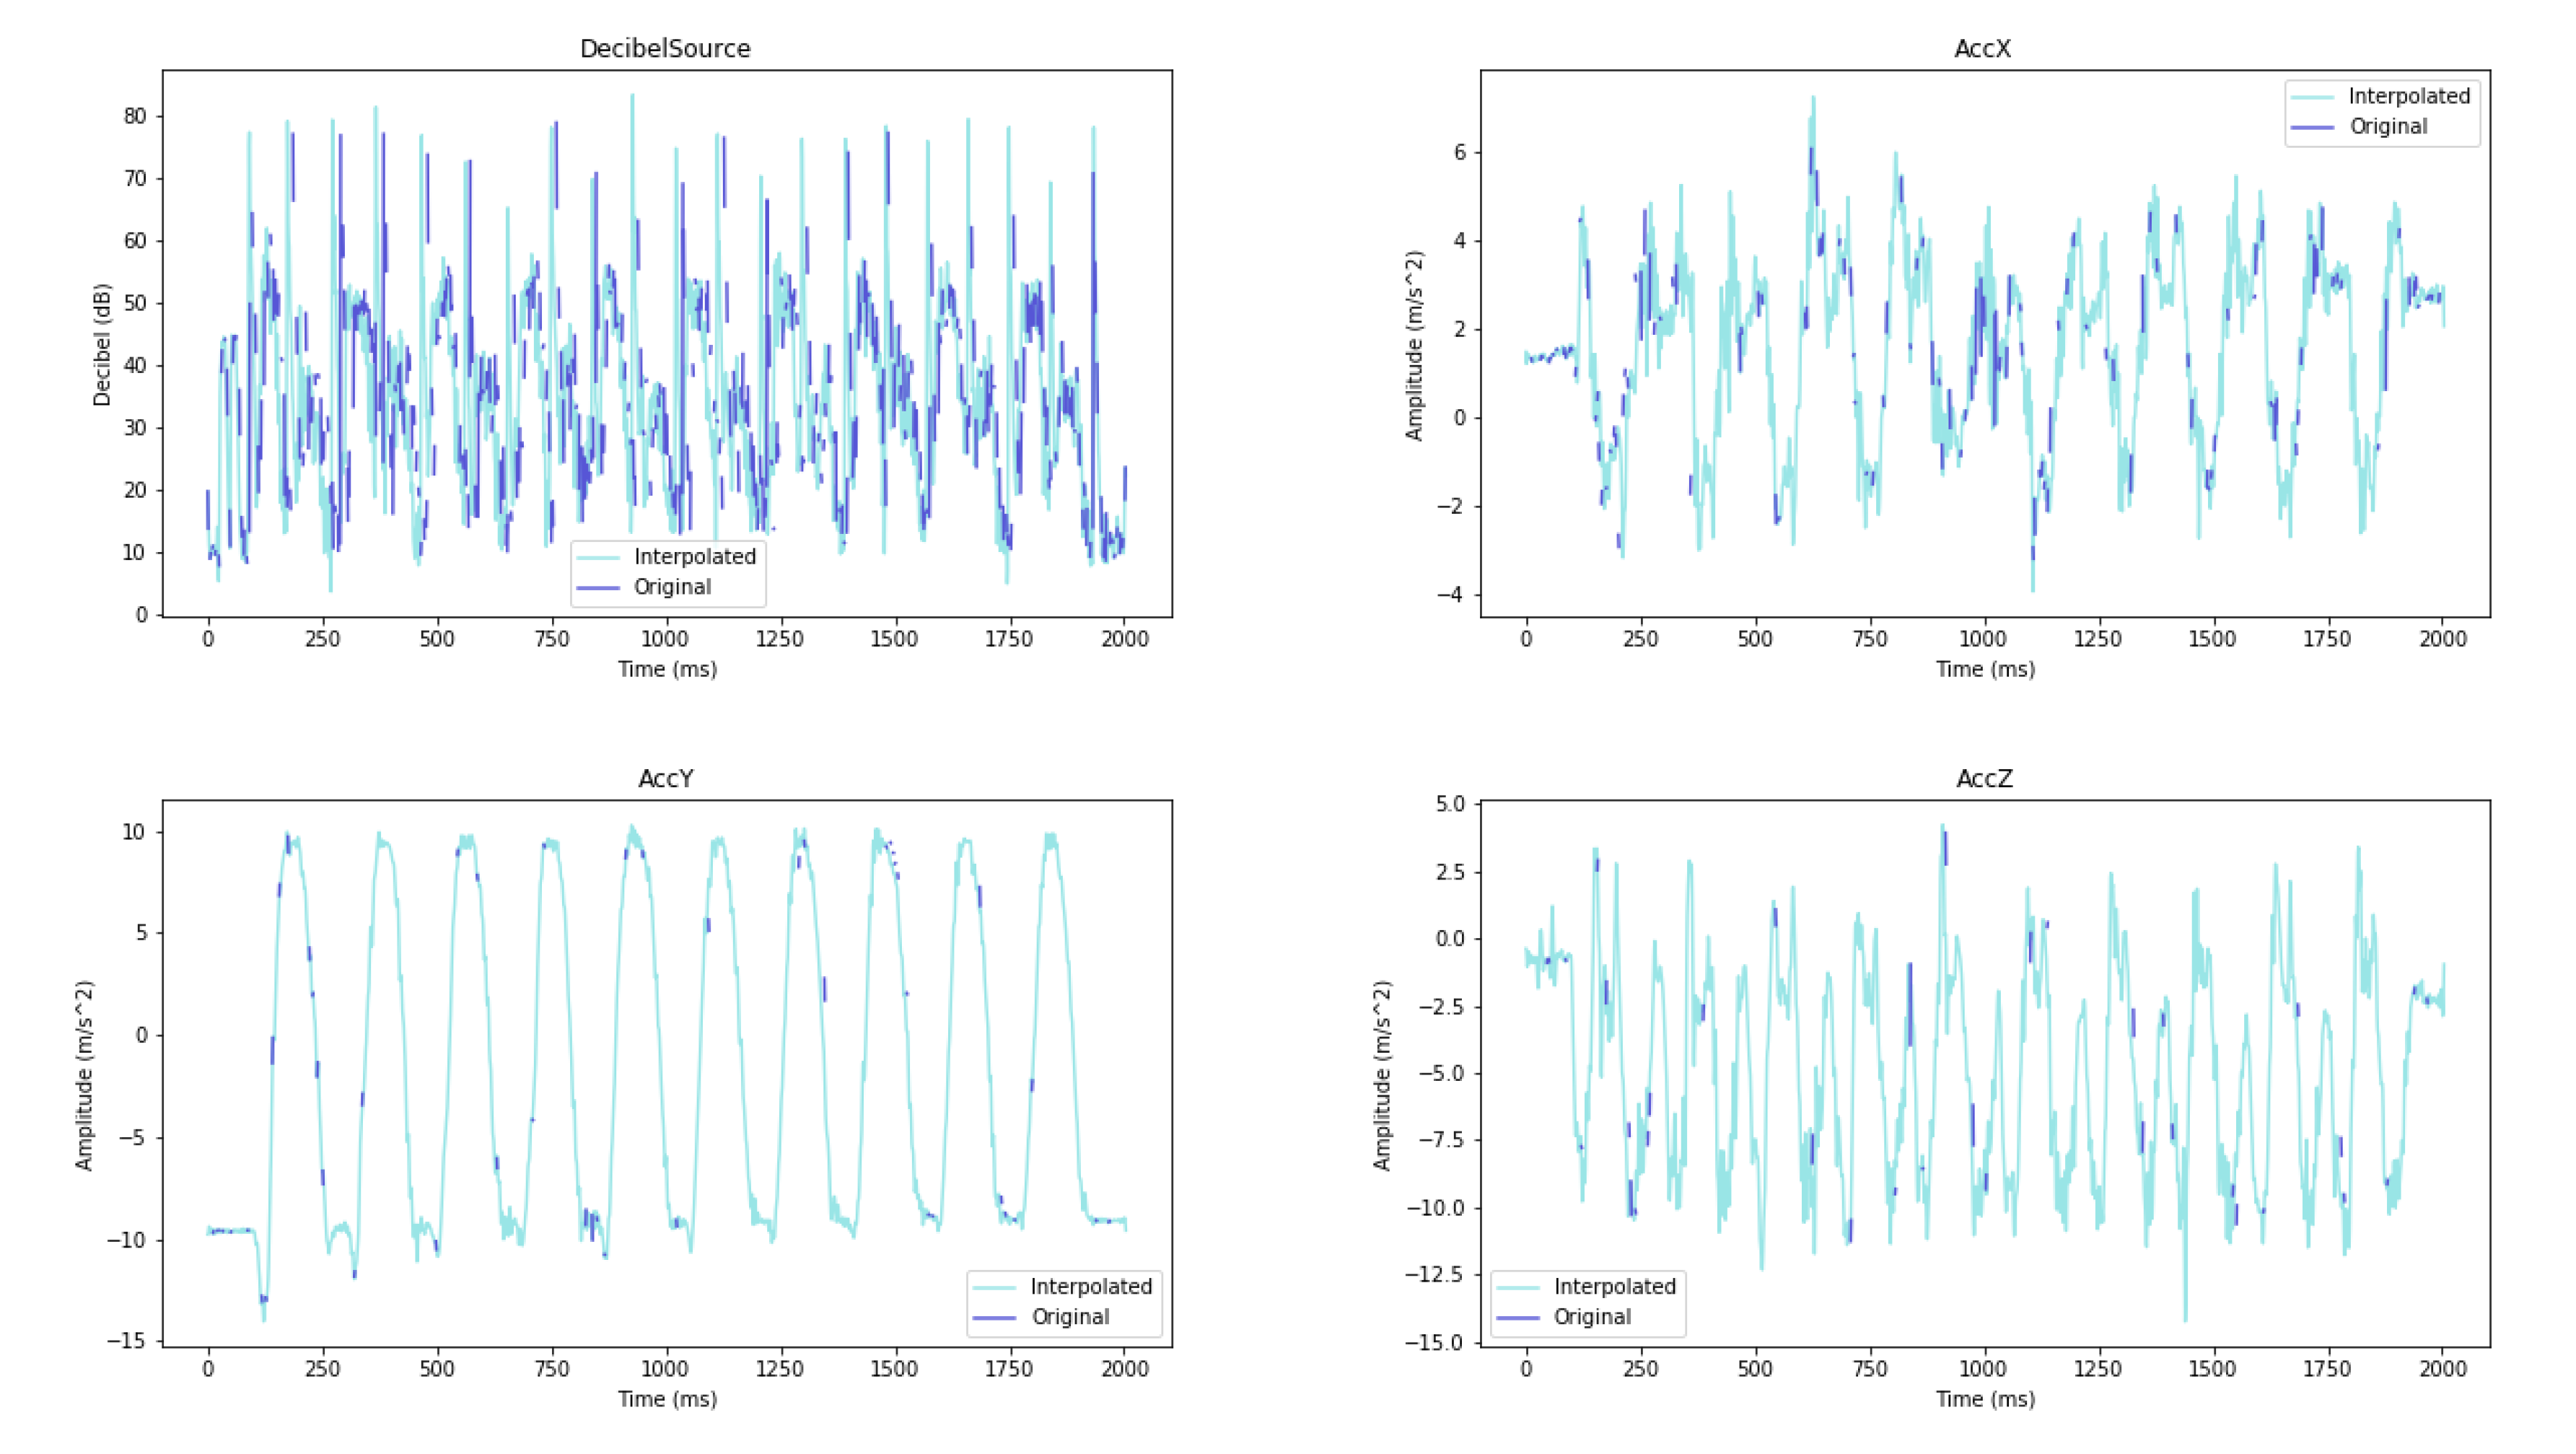
We also assessed the performance of GSJ when acquiring data from the internal sensors of the mobile device. A total of 17 recordings were performed with different smartphone models, in which participants recorded signals from four channels, including microphone and accelerometer data (from the three axis). The time reference created by GSJ was associated with the recorded data points and used to plot them against time. There was evidence of missing data in around 75% of the recordings, for the four sensor channels collected (
Figure 6). Although this can be partially addressed in post-processing using interpolation techniques to reconstruct the signals, it may be a limitation for some use cases.
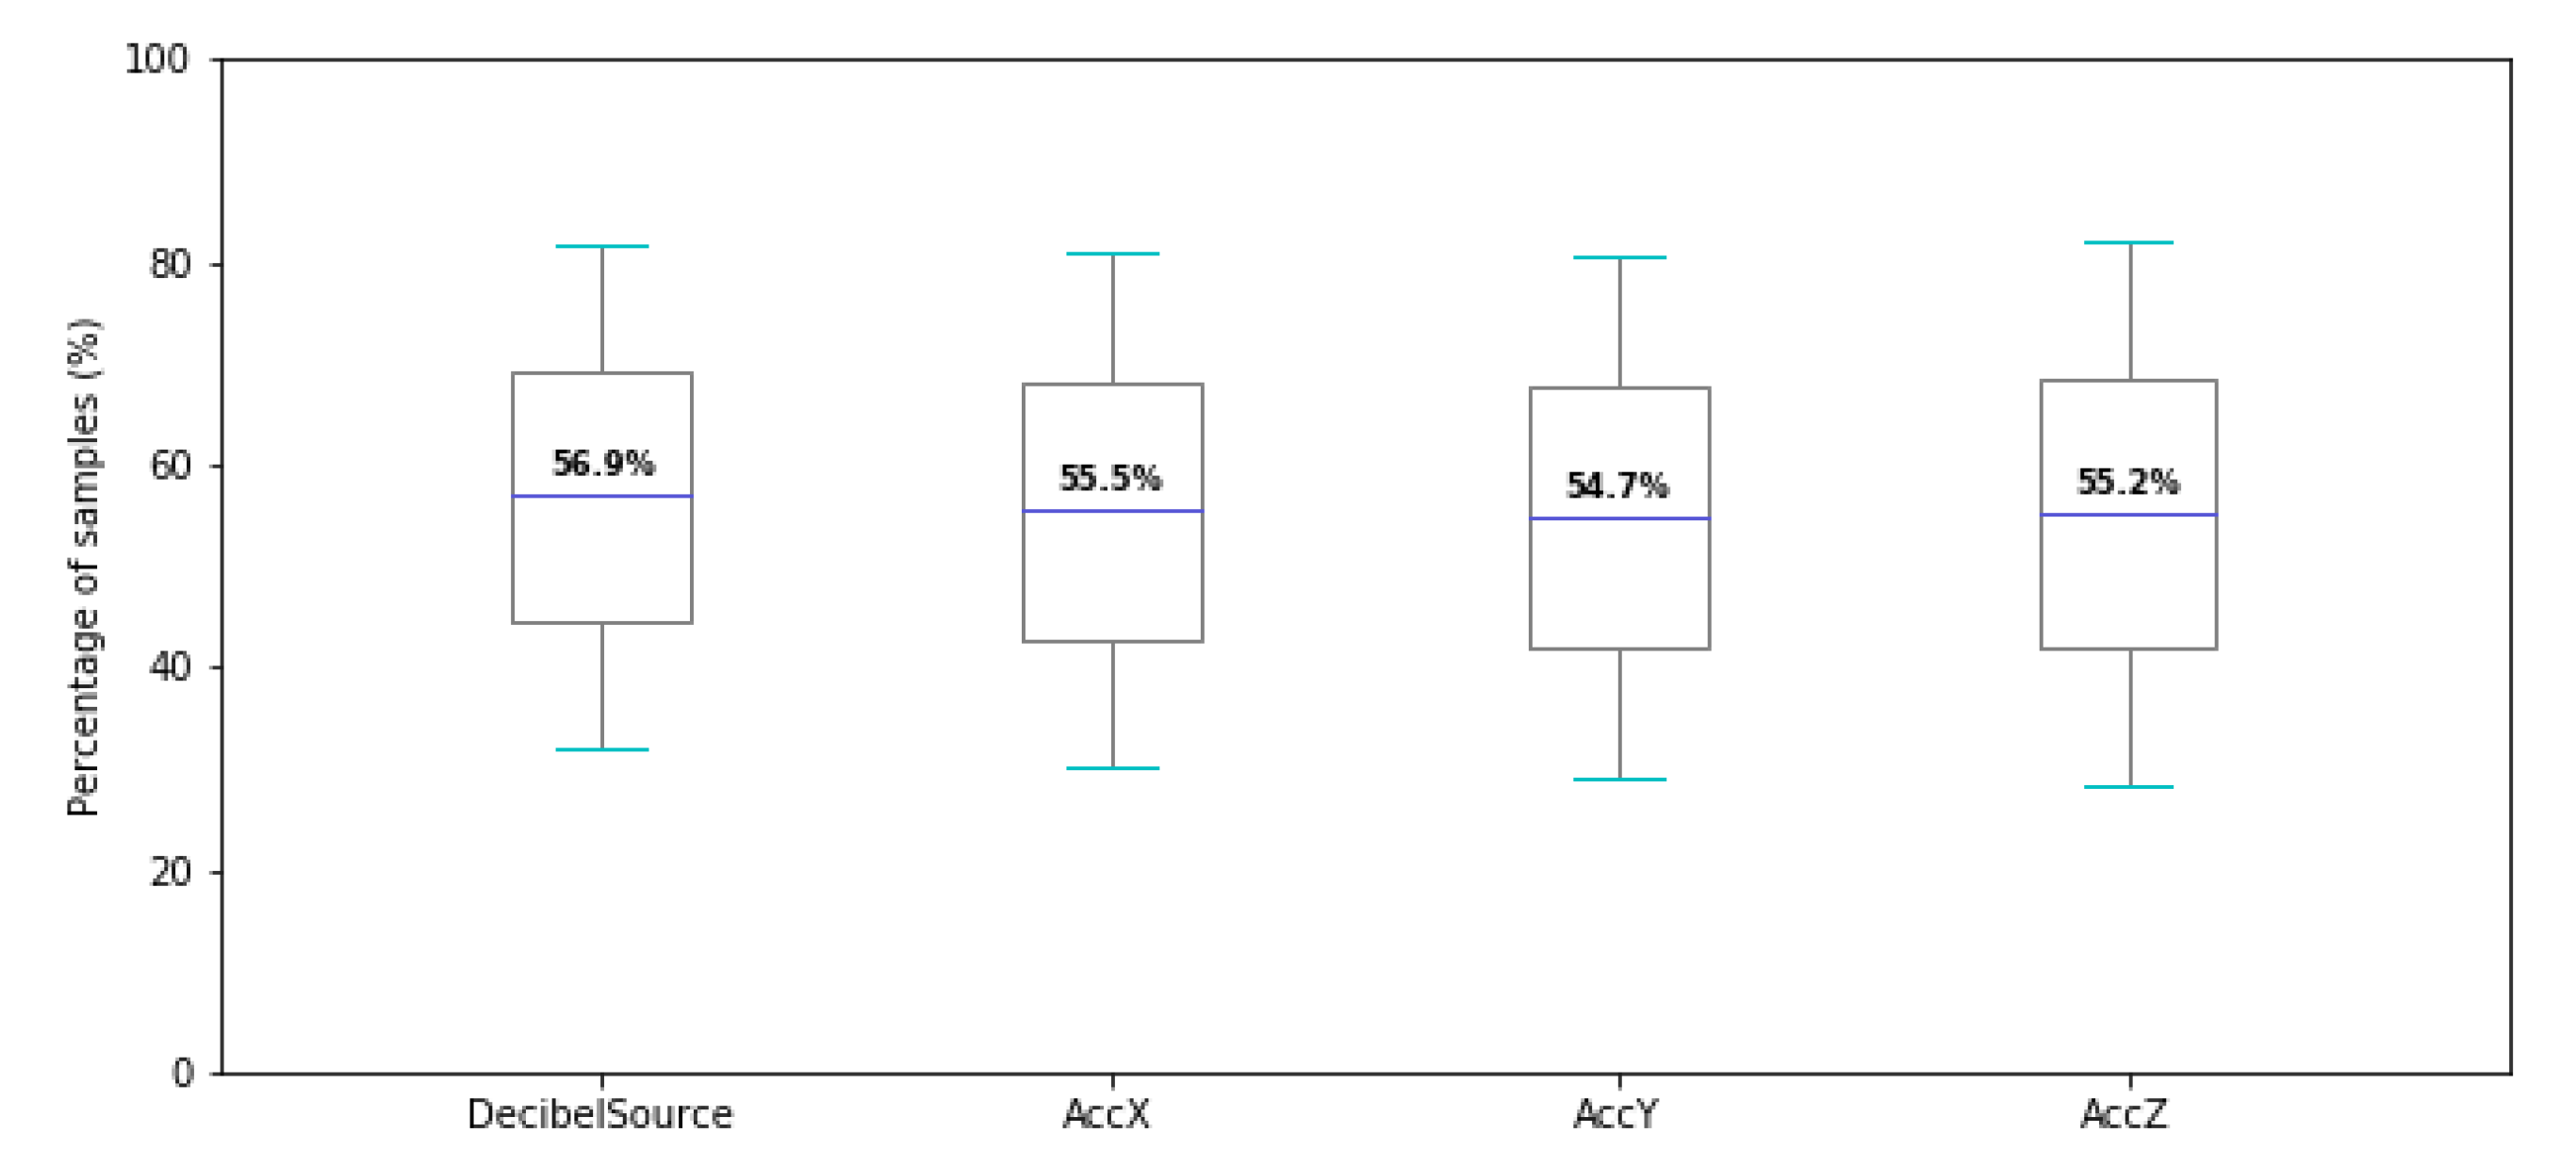
Figure 7 summarizes the findings in terms of percentage of samples recorded (
), and
Table 2 details the sampling percentage obtained in each acquisition from the dataset. The recorded percentage considers the ratio between the samples acquired for a given channel and all the expected sample points, considering the time reference. These results, ranging within 54.7% and 56.9%, are fairly low comparing to what would be desirable. Nevertheless, each average value is associated with a fairly high standard deviation, which highlights that this is not a systematic problem, as confirmed by the fact that four acquisitions recorded 100% of the data. When analysing these recordings, one can observe that for some participants (3, 6, 10 and 14), all samples were obtained for all channels, while in the other cases a high sample loss was observed. It implies that the specifications of the smartphones can greatly influence the reliability of the acquisition process, in particular the existence of missing data.
4.2. Usability and User Experience
To assess the perception and satisfaction of the students regarding the proposed approach, a class of 19 students (10 female) was asked to answer a feedback survey, as a result of using our workflow. A survey was performed, including two closed-ended questions. Firstly, the user was asked to select one of six response options for the question “How would you rank your technical skills?”. Secondly, we used the System Usability Scale (SUS), which is a widely used approach to collect qualitative data related with measurable usability criteria. It is implemented through individual interviews with prospective users, consisting in ten item questionnaire with five response options. The SUS provides an accurate and widely accepted means to determine the degree of user satisfaction with respect to a given system [
13].
Those were followed by four open-ended questions: “What are the main advantages you see in the proposed system?”, “Do you see yourself using this system beyond the scope of this experiment and, if so, in which cases?”, “Are there any specific features or functionalities that you would like to see implemented?”, and “What would you say are the main limitations of the system?”.
The SUS has a minimum score of 0 and maximum score of 100. Hence, each of its ten questions leads to a score within 0 and 10. A user should answer all items, and in case they feel unable to respond to one of the items, they should mark the center point of the scale. The general SUS questionnaire was adjusted by replacing the word “website” in every question with “system”.
It is generally posed to the user after they tested the system, prior any debriefing or discussion. Moreover, users are asked to record their immediate responses, rather than thinking about the items for a long time. This scale has had a great success among usability practitioners, for being a quick and easy-to-use usability measure [
14]. According to Bangor et al. [
15] the SUS is not biased against certain types of user interfaces or against gender.
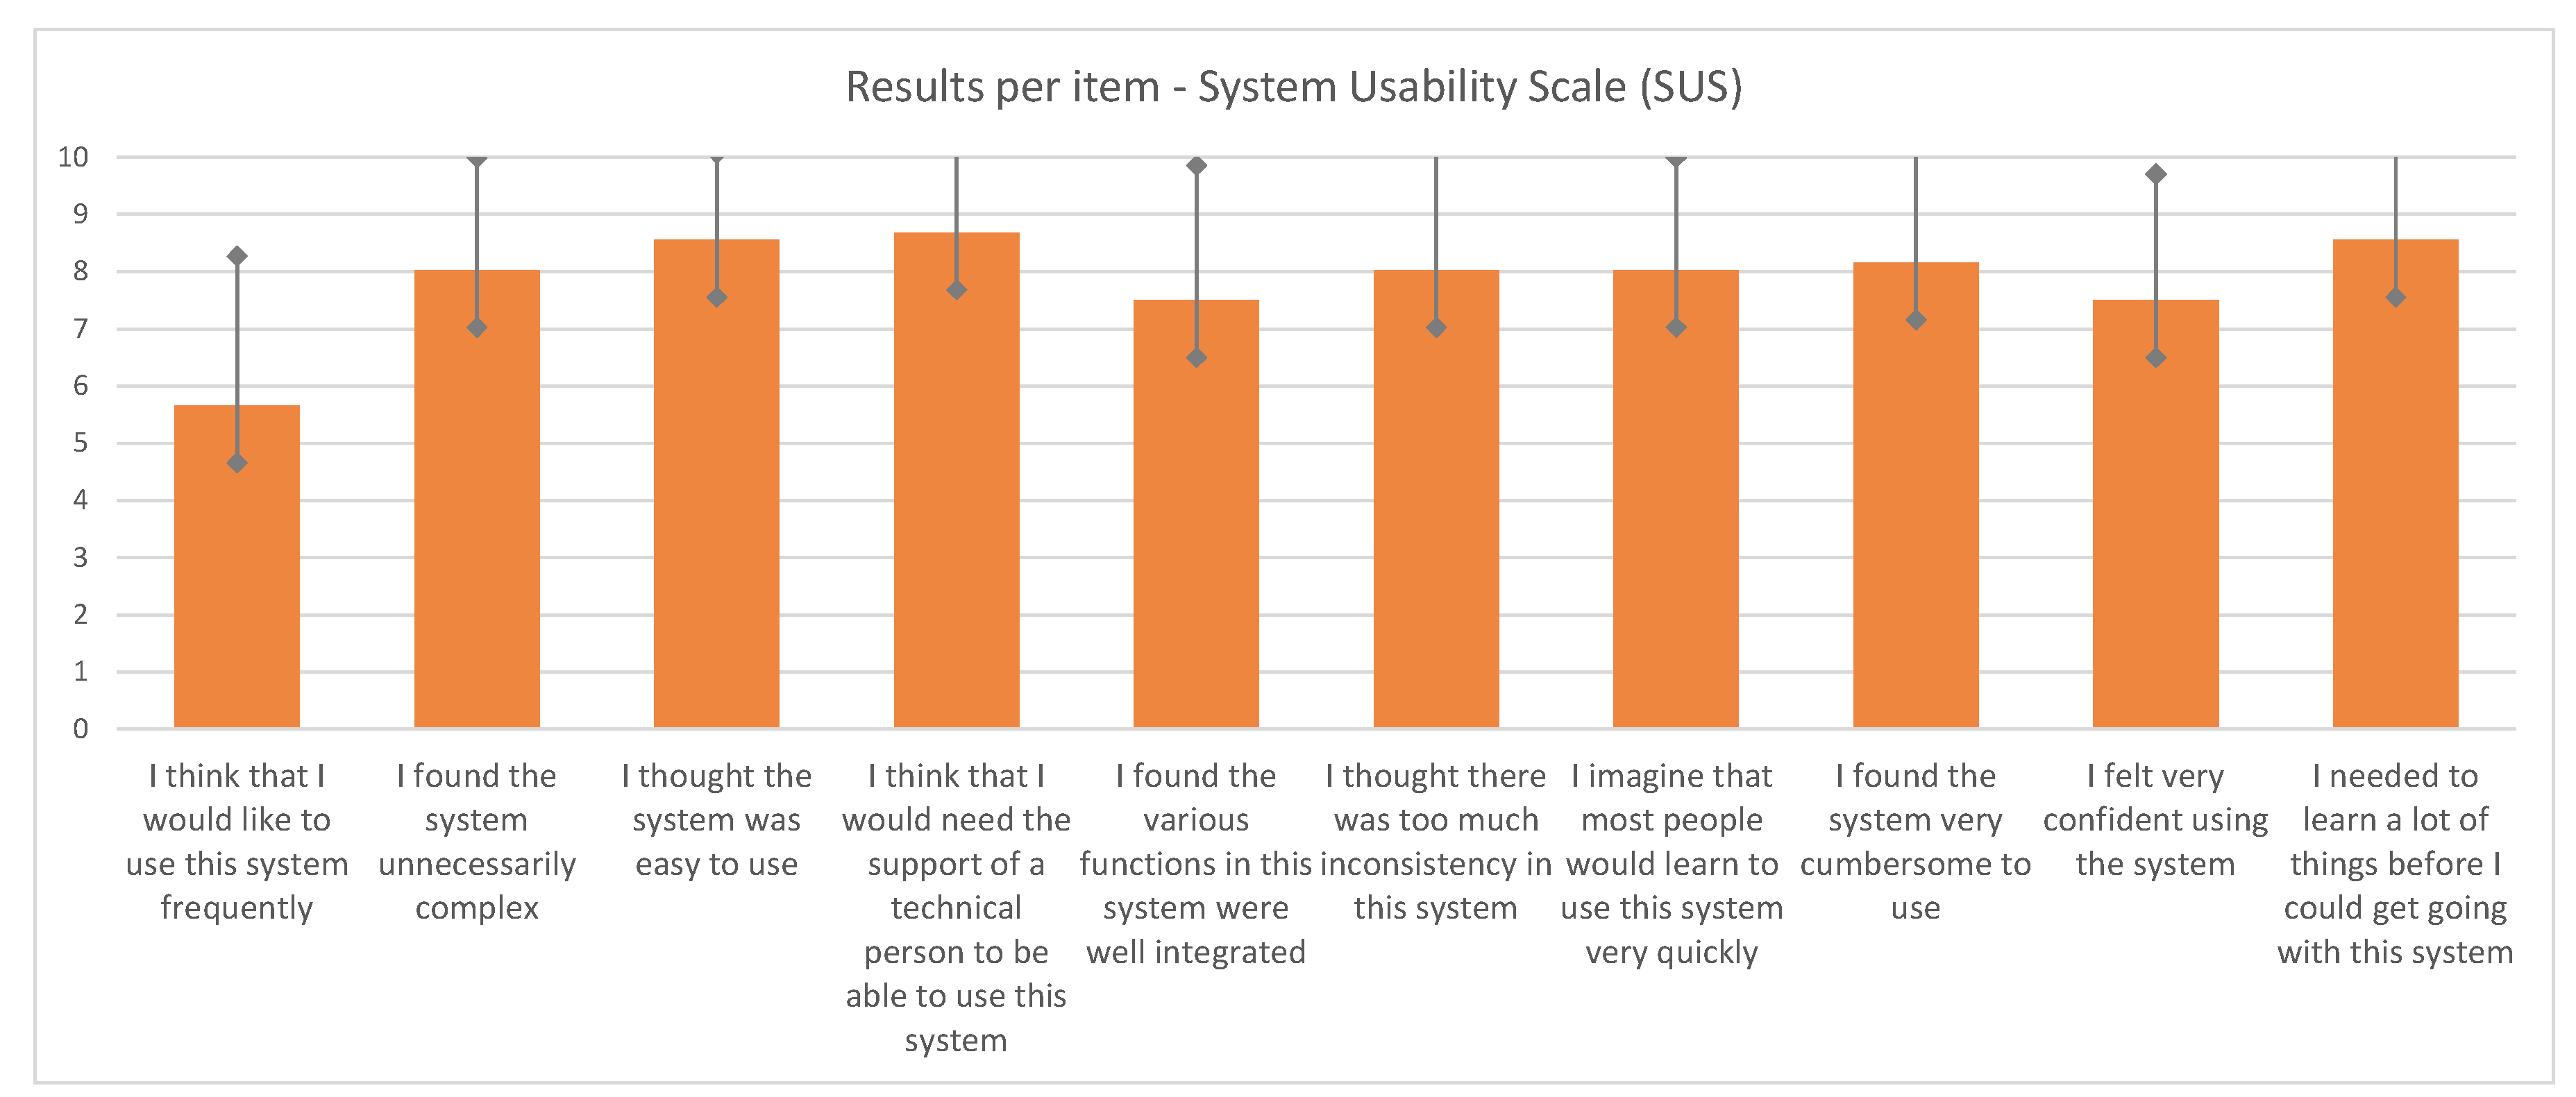
The overall results suggest that the proposed methodology is easy to use and enables a short learning curve, with an average score of 78.68% (±15.28% standard deviation), and the average results obtained for each of the 10 items of the SUS are illustrated in
Figure 8. The obtained results showed average scores above 7.5 for nine of the items, except for the first one “I think that I would like to use this system frequently”, which lead to an average score of 5.66.
The best user feedback was obtained on the item “I think that I would need the support of a technical person to be able to use this system”, with an average score of 8.68, highlighting the ease-of-use of the overall workflow and its capability of empowering the students to feel confident using it independently.
A salience analysis of the answers to the open-ended questions revealed as positive aspects the “ease of use”, “handiness”, and the “portability” of the system, enabling the students to conduct experiments “everywhere”. Limitations identified by the students were mostly related with the lack of other sensors beyond the PPG, the dependency on the accuracy of the sensors embedded in each phone, and the lack of a computer-based application to communicate with the SCB.
Furthermore, students reported that they found it easier to study using the journal, organized and illustrated with the images taken during the experiment, rather than using the notes they took from the class.
5. Discussion
Biosignal acquisition has quite strict hardware requirements [
16], and instruments need to be designed with accurate sampling rates and high noise rejection capabilities. Although the noise specifications depend mostly on the sensor frontend, the sampling rate depends on the acquisition system. As such, we evaluated the behavior of the Arduino SCB when used in conjunction with the GSJ.
To assess the sampling rate accuracy, we deployed the case study described in
Section 3, revealing performance limitations in some of the technologies. The sampling rate obtained, as summarized in
Section 4.1, is fairly low for most biosignal acquisition applications; even disregarding the non-uniform sampling, according to the Nyquist rate only signals of up to 50 Hz could be sampled. Considering that signals such as EMG, ECG and EEG have higher bandwidths, the sampling rate achieved by the SCB and GSJ enables experimentation with signals such as EDA, PPG, force, respiration, motion, pressure, or temperature, for example.
As previously mentioned, the Arduino SCB lacks a reference voltage source, however, this can be generated at the sensor using a resistive voltage divider. There was also evidence of missing data when using the GSJ and sensors embedded in the smartphones. The results suggested that the computational capability of the smartphone is a major factor determining the loss of samples during acquisition. Future work might thus include a comparison analysis of different mobile phone models. Nevertheless, this work enabled us to determine the receptiveness of the students to the proposed approach, resulted in the understanding of several technical limitations with the base tools, and in identifying future work perspectives.
Software limitations include the lack of reporting capabilities and adapting the features to the higher education needs. One of the features to be optimized for higher education is the creation of advanced lab guides, and experiment templates, which would benefit the whole efficiency of use for students and teachers. Furthermore, Android users are not able to export reports as PDF, and students report the lack of a computer-based application, which would benefit the experiment process.
Hardware-wise, the time and amplitude resolution limit the set of sensors that can be used, and should be improved. Regarding external communication, the system is not able to communicate with the computer, and the interfacing of external sensors should become more user-friendly.
6. Conclusions
In this article we propose a methodology to support teaching in biomedical engineering based on state-of-the-art mobile, cloud and IoT technologies. The Arduino SCB, GSJ, and Jupyter Notebooks (in particular Google Colab) provide an adequate end-to-end integration between the signal source (i.e., a subject’s body) and deriving meaningful analytics, while providing a rich learning experience.
These tools are generally used for physics and electrical engineering education, therefore lacking physiological sensing capabilities. While this can be addressed through specialized third-party sensors compatible with the Arduino SCB, other technical limitations appear to hinder a more widespread use.
In particular, experimental tests have revealed the sampling rate to be fairly low (below 140 Hz maximum) and non-uniform. Furthermore, a reference voltage source, useful for sensors that require an offset, is also missing. Future work is envisioned to primarily address such aspects.
Nevertheless, the proposed ScientIST approach shows promising results in a PPG data acquisition and analysis case study, which was further extended with a real-world usability assessment. The usability and user experience reported by the students through the SUS questionnaire have shown average scores above 7.5 (maximum score: 10) for 9 out of the 10 items, and an overall 78.68% score, reinforcing the positive and encouraging results.
Author Contributions
Conceptualization and methodology, A.F. and H.P.d.S.; software, J.F.P.; validation, J.F.P. and F.M.; formal analysis, writing—original draft preparation and writing—review and editing, J.F.P., A.F., and H.P.d.S. All authors have read and agreed to the published version of the manuscript.
Funding
This work has been partially funded by the Instituto Superior Técnico (IST) under Project 1018P.05667.1.01/CC3311—ScientIST, and by the Instituto de Telecomunicações (IT) via FCT/MCTES through national funds and when applicable co-funded EU funds under the project UIDB/50008/2020.
Acknowledgments
The authors would like to express our great appreciation to the volunteers whom participated in this work, for their valuable feedback and constructive suggestions. We would also like to acknowledge the assistance provided by Ana Beatriz Almeida, Maria Madalena Nunes, Carolina Ruas da Silva, and Rita Magalhães in the initial stages of this work, and by Mariana Abreu and Patrícia Bota in the user experience study.
Conflicts of Interest
The authors declare no conflict of interest.
References
- Bender, W. Project-Based Learning. 2012. Available online: https://books.google.pt/books?id=UL0-vVkipKwC (accessed on 12 February 2020).
- Andrini, V.; Pratama, H.; Maduretno, T. The effect of flipped classroom and project based learning model on student’s critical thinking ability. J. Phys. Conf. Ser. 2019, 1–8. [Google Scholar] [CrossRef]
- Da Silva, H.P.; Fred, A.; Martins, R. Biosignals for Everyone. IEEE Pervasive Comput. 2014, 13, 64–71. [Google Scholar] [CrossRef]
- Google Science Journal. Available online: https://sciencejournal.withgoogle.com/ (accessed on 12 February 2020).
- Banzi, M. Getting Started with Arduino. 2009. Available online: https://www.bibsonomy.org/bibtex/2d5c254c91a2a95f22daec0b989da20ad/enitsirhc (accessed on 12 February 2020).
- Da Silva, H.P. Physiological Sensing Now Open to the World. IEEE Pulse 2018, 9, 9–11. [Google Scholar] [CrossRef] [PubMed]
- Batista, D.; da Silva, H.P.; Fred, A.; Moreira, C.; Reis, M.; Ferreira, H. Benchmarking of the BITalino Biomedical Toolkit Against an Established Gold Standard. Healthc. Technol. Lett. 2019, 6, 32–36. [Google Scholar] [CrossRef] [PubMed]
- Binder. Available online: https://github.com/binder-examples/jupyter-extension (accessed on 29 April 2020).
- Google Colaboratory. Available online: https://colab.research.google.com (accessed on 12 February 2020).
- Microsoft Azure Notebooks. Available online: https://notebooks.azure.com/ (accessed on 29 April 2020).
- Carreiras, C.; Alves, A.P.; Lourenço, A.; Canento, F.; Silva, H.; Fred, A. BioSPPy: Biosignal Processing in Python. Available online: https://github.com/PIA-Group/BioSPPy/ (accessed on 12 February 2020).
- Webster, J. Design of Pulse Oximeters; CRC Press: Boca Raton, FL, USA, 1997. [Google Scholar]
- Brooke, J. “SUS-A Quick and Dirty Usability Scale.” Usability Evaluation in Industry; CRC Press: Boca Raton, FL, USA, 1996; ISBN 9780748404605. [Google Scholar]
- Borsci, S.; Federici, S.; Lauriola, M. On the dimensionality of the System Usability Scale: A test of alternative measurement models. Cogn. Process. 2009, 10, 193–197. [Google Scholar] [CrossRef] [PubMed]
- Bangor, A.; Kortum, P.; Miller, J. An Empirical Evaluation of the System Usability Scale. Int. J. Hum. Comput. Interact. 2008, 24, 574–594. [Google Scholar] [CrossRef]
- Guerreiro, J.; Lourenço, A.; da Silva, H.P.; Fred, A. Performance Comparison of Low-cost Hardware Platforms Targeting Physiological Computing Applications. Procedia Technol. 2014, 17, 399–406. [Google Scholar] [CrossRef]
© 2020 by the authors. Licensee MDPI, Basel, Switzerland. This article is an open access article distributed under the terms and conditions of the Creative Commons Attribution (CC BY) license (http://creativecommons.org/licenses/by/4.0/).
