Abstract
Traditionally, an open window is considered a kind of reference for perfect sound absorption. The sound reflection and absorption of an aperture is analyzed by means of an impedance model representing a rectangular absorbing surface surrounded by a thin, infinite rigid baffle. The most important part of the model is the complex radiation impedance. It is shown that the sound absorption coefficient of the open window is not exactly 1, but it is angle-dependent and decreases towards low frequencies. Two diffraction effects are identified: the refraction that appears when a wave passes through an aperture, and the scattering of waves from the edges of the aperture. A revised model for sound absorption is presented, taking these diffraction effects into account. It is shown that the refraction effect is the reason for measured absorption coefficients greater than 1, whereas the scattering effect can explain the typical decrease in absorption towards lower frequencies. The revised model is validated against examples of measured sound absorption. Finally, it is discussed how room acoustic calculation models can handle realistic absorption data.
1. Introduction
The classical understanding of room acoustics is closely related to Sabine’s work with the reverberation time as a function of volume and absorption area, and he referred to the equivalent area open window as a reference for sound absorption [1] (pp. 23–24). Then, he assumed that the sound absorption coefficient of an open window would be 1, i.e., a total sound transmission through the opening. In the classical theory, it is assumed that the sound power incident on a surface is proportional to the geometrical projection of the area, S cos θ, where S is the area and θ is the angle of incidence. So, at grazing incidence, the incident sound power is assumed to be zero. The assumptions are approximations that can give rise to calculation problems, especially when a specific angle of incidence is considered. The discrepancy between the assumed and the real incident sound power on a sound absorbing surface of finite size has the consequence that the statistical absorption coefficient as measured in a diffuse sound field can take values above 1, i.e., that the absorbed sound power is greater than the incident sound power. This has led to empirical-based proposals of a possible edge correction, but a deeper understanding of the physics behind the phenomenon has been missing.
Previous research on the absorption properties of an open window or aperture includes theoretical work and experimental work. Wilson and Soroka [2] studied a circular aperture in walls with different thicknesses and provided a numerical approach based on measurements between two reverberant rooms. Below a so-called ‘transition frequency’ (including opening depth and radius), the transmitted energy decreased. Later, Sauter and Soroka also studied sound transmission through rectangular apertures in a thick wall [3]. They concluded that the sound transmission of apertures in thick walls between reverberant rooms can be represented by plane waves normally incident on the aperture, plane wave reflection from the aperture wall, three-dimensional radiation back into the source room, plane wave propagation through the aperture, and three-dimensional radiation into the receiving room.
In an early work by the author, he studied the angle-dependent sound transmission through windows, including an open window, by scale model measurements in an anechoic chamber [4]. He also provided a simplified impedance model using only the real part of the radiation impedance.
Sgard et al. [5] presented an extensive review of early investigations on acoustical properties of apertures and suggested a numerical method to predict the diffuse field transmission loss of apertures and slits. This work was continued with further experimental measurements by Trompette et al. [6].
Martellotta [7] collected experimental data for the absorption coefficient of openings of different dimensions and suggested an empirical model for the absorption coefficient as a function of a dimensionless frequency parameter.
In geometrical room acoustical computer models (image source models and ray tracing models), the calculations are based on sound reflections at specific angles of incidence, not on sound absorption as in Sabine’s reverberation time formula. Until now, such computer models have used statistical absorption coefficients truncated to a maximum of 1 as input data for the surface materials. With some approximations, the author has shown in earlier work that it is possible to derive angle-dependent reflection factors from the statistical absorption coefficients [8,9]. However, a more accurate model for sound reflection is needed to improve the accuracy of computer models based on geometrical acoustics. For wave-based models, the surface materials must be defined by their impedance, not by the statistical absorption coefficient.
Previous research dealing with prediction models for the angle-dependent absorption is rather sparse. The author has suggested a simplified model with real surface impedances [8] and later a model with complex impedances derived from the statistical absorption coefficients [9]. The work by Thomasson [10,11] deals with the sound absorption as a function of the area. He derived an impedance model for sound absorption, which has many similarities with the present work. A major difference is that he did not include sound transmission in his model, so he could not deal with the case of an open window. Instead, he assumed the maximum absorption to be approximated by a surface impedance equal to the complex conjugate of the radiation impedance at 60°, which would lead to a reflection factor of zero. However, such a surface impedance does not exist physically.
More recently, prediction models for the diffuse sound absorption of finite absorbers in a diffuse sound field have been proposed [12,13]. The diffuse sound absorption coefficient is obtained as a ratio of the power dissipated by the absorber to the intensity of the diffuse sound field and the area of the absorber by employing the direct boundary integral formulation for the scattering problem. Although the results of these models are excellent, they do not provide the angle-dependent absorption coefficients that are needed for room acoustic simulation models.
When measuring the sound absorption coefficient in a reverberation chamber in accordance with ISO 354 [14], the area of the test sample must be between 10 to 12 m2 or larger in case of a room volume above 200 m3. The reasons for this area requirement are twofold: a smaller area would increase the measurement uncertainty, which is critical, and the so-called edge-effect would increase. The latter refers to the fact that the absorption is area-dependent, and the absorption increases for smaller samples. Even with the relatively large test samples that are usually applied, it is quite usual that the measured sound absorption coefficient exceeds 1. Since the 1960s, many researchers have studied the edge effect and tried to find a prediction method, but without convincing success [15,16,17]. So, for practical applications, e.g., in room acoustic calculation models, the absorption coefficients are truncated to be ≤1. This is obviously a very coarse and unsatisfactory solution.
Recently, a method has been proposed that allows measurement of the angle-dependent absorption coefficient and surface impedance in a reverberant chamber [18,19]. A wavenumber transform is applied to separate incident and reflected plane-wave components. The absorption coefficient is determined simultaneously for all angles. The frequency range of the applied setup is from 315 Hz to 2000 Hz in one-third octave bands. These measurement methods are interesting because they can provide a better understanding of the sound absorption properties of materials. However, they are too complicated to be considered as possible alternative test methods in general.
The proposed impedance model for angle-dependent sound reflection and absorption suggests that Sabine was right in pointing at the open window as the ideal absorber, but the assumption that the open window has an absorption coefficient of 1 is only true for large areas and high frequencies. The main problems to be analyzed in the present paper are the angle-dependent reflection and the diffraction effects, including the so-called edge effect. The goals are to obtain a better understanding of measured data in reverberation chambers and to find solutions that allow the associated effects to be modelled in a room acoustic prediction model.
2. Impedance Models for Sound Reflection and Transmission
2.1. Electrical Analogue Circuits
The use of impedance models and other electrical or mechanical analogies for acoustical phenomena has advantages, but also limitations, because the wave-nature of sound is not included in such analogies. Nevertheless, it is possible to derive information on some diffraction effects for a finite-size surface from a simple impedance model.
The electrical analogue circuit of sound reflection and transmission is shown in Figure 1. The wall impedance is Zw, the radiation impedance is Zr, and both are normalized with the characteristic impedance of air, ρc. In the electrical analogy, the voltage corresponds to the sound pressure and the current to the particle velocity. The driving voltage corresponds to the sound pressure at a totally reflecting surface, which is 2pi. The sound pressure of the transmitted sound, pt, corresponds to the voltage drop over the radiation impedance on the backside of the panel.
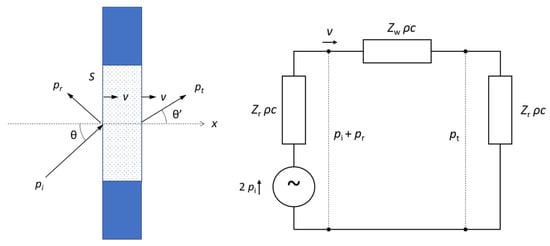
Figure 1.
Sound field components and electrical analogue circuit of sound transmission and reflection.
The following definitions apply. The specific radiation impedance is the complex ratio of the radiated sound pressure to the normal velocity at the surface (x = 0), normalized by the characteristic impedance of air:
The radiation impedance depends on the angle of incidence, but also on the wavelength relative to the size of the surface. See Appendix A for details about the radiation impedance. In the case of sound transmission in Figure 1, the radiation impedance is the same on both sides because the air is assumed to have the same acoustical properties on both sides. The radiation impedance is also called the field impedance in the literature [8,10,11].
The specific wall impedance is the complex ratio of the sound pressure difference over the wall to the normal velocity of the surface, normalized by the characteristic impedance of air:
In the case of an open window, the pressure difference is zero, and thus Zw = 0.
If the sound-absorbing material is backed by a rigid wall, as is often assumed, the electrical analogue circuit of sound reflection is shown in Figure 2.
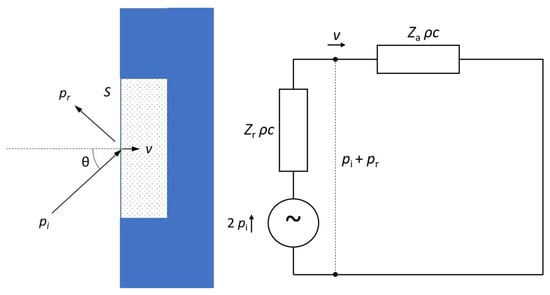
Figure 2.
Sound field components and electrical analogue circuit of sound absorption and reflection from a material with rigid backing.
In this case, the transmission is neglected, and instead of the specific wall impedance, the specific surface impedance Za is applied. This is defined as the complex ratio of the sound pressure on the surface to the normal velocity of the surface, normalized by the characteristic impedance of air:
In the case of sound transmission, as in Figure 1, the surface impedance is the sum of the wall impedance Zw and the radiation impedance Zr.
2.2. The Reflection Factor for a Finite Area
The characteristic dimension of the surface is defined as e = ½√S, where S is the area of the surface. Thus, for a square surface, the length of each side is 2e. The dimensionless frequency parameter is ke, where k = 2π/λ is the angular wavenumber and λ is the wavelength.
For a finite area, the direction of sound propagation through to surface is θ′, which may deviate slightly from the angle of incidence θ (see Figure 1). This refraction will be discussed in detail later. The shifted angle can be related to the real part of the radiation impedance (see Appendix A):
Thus, the relation between the particle velocities of the sound waves (incident, reflected, and transmitted) and the normal velocity on the surface is not exactly cos(θ), but inherent in the radiation impedance. The normal velocity v of the surface can be expressed in the following equations:
The angle-dependent pressure reflection factor is the complex ratio of the sound pressure of the reflected sound wave to the sound pressure of the incident sound, both taken at the reflecting surface (see also [11] (p. 22)):
where Zr*(θ) is the complex conjugate of the specific radiation impedance. For a local-reacting material, the surface impedance Za is independent of the angle of incidence, but in general, the surface impedance can also be angle-dependent. In the following, it is understood that the radiation impedance Zr is always a function of the angle of incidence.
2.3. Sound Power Components
Applying an energy balance principle on the sound reflection leads to the incident sound power (P1) being split into three components: transmitted (P2), dissipated (P3), and reflected sound power (P4) (see Figure 3B). In addition, there can be a possibility of scattered reflection from the edges (P5), which contributes to the reflected sound power. Thus, we have a power balance:

Figure 3.
Incident, absorbed, and reflected sound power components. (A) Sound-absorbing patch with a rigid backing. (B) A transparent absorber in a rigid baffle. (C) Aperture in a rigid baffle.
The classical theory is a high-frequency model assuming the wavelength to be very small compared to the dimensions of the surface, λ << √S. This assumption is often referred to as the case of an infinite surface, which is disturbing because the incident sound power is proportional to the surface area S, and this area must be finite. In the classical theory, P5 is zero.
A plane wave with the sound pressure pi has the sound intensity:
where P0 is the sound power incident at normal incidence and S is the area of the reflecting surface. In the following, P0 will be used as a reference for the other sound power components.
The angle of incidence is θ and the projection of the surface on a plane perpendicular to the direction of propagation is S cos(θ). In the classical theory, the incident sound power on the surface is:
Taking the wavelength into account, the incident sound power P1 on the surface area S is a function of the real part of the radiation impedance Zr (see Figure 1) and the impedance model yields [11] Equation (52):
Similarly, the transmitted sound power P2 that is radiated from the backside of the panel is proportional to Re{Zr}:
In general, energy losses in a component of the electrical analogy are due to the real part of that component. Thus, the dissipated sound power P3 is proportional to Re{Zw} (see Thomasson [10] Equation (19)):
The absorbed sound power is the sum of transmitted and dissipated sound powers:
The reflected sound power P4 (without the scattered reflection) can be calculated as the non-absorbed part of the incident sound power:
The scattered reflection from the edges and the associated sound power P5 will be considered next.
2.4. Diffraction Effects
The finite size of the surface that is investigated for sound reflection and absorption leads to diffraction effects. These effects are wave-based and lead to deviations from the conventional geometrical acoustics. Figure 3A shows a situation with a sound-absorbing patch surrounded by a large rigid baffle and a plane sound wave incident at an oblique angle. The transparent absorber also has the transmitted sound power (P2) (see Figure 3B). It is possible to isolate the diffraction effects by studying the case of an open window (an aperture). The aperture does not have dissipated sound power (P3) and reflected sound power (P4) (see Figure 3C). However, the possibility of sound reflection from the surrounding edges due to diffraction is indicated with the sound power P5. This is a scattered sound reflection, while P4 represents a geometrical reflection. It is assumed that P5 is the same in all three cases in Figure 3. Thus, the total reflected sound power is P4 + P5, and this will be discussed in more detail in Section 3.2.
2.5. Sound Absorption at Oblique Incidence
The physical absorption coefficient is the ratio of absorbed sound power (Equation (13)) to the incident sound power (Equation (10)). It can also be calculated as the not-reflected sound energy relative to the incident sound energy using the pressure reflection factor. The result is the same:
It is noted that α(θ) ≤ 1 because 0 ≤ |r(θ)| ≤ 1. In geometrical acoustics, the incident sound power on a surface is proportional to the projection of the surface on a plane perpendicular to the direction of the incident plane sound wave (see Equation (9)). Using this as a reference for the absorption, we obtain the apparent absorption coefficient:
The issue with the apparent absorption coefficient is that it can exceed 1, and α′ → ∞ for the angle of incidence approaching grazing incidence, θ → 90°.
2.6. Sound Absorption in a Diffuse Sound Field
As an attempt to describe the measured absorption coefficients in a reverberation chamber, the statistical absorption coefficient can theoretically be calculated by integration of the absorbed and incident sound powers over the hemisphere. Then, P1,∞ is the incident sound power as in Equation (16). The result is the statistical absorption coefficient:
The statistical absorption coefficient can take values that exceed 1, which is well known from measurements in a reverberation chamber in accordance with ISO 354 [14]. This phenomenon is sometimes called the edge effect, although physically it is more accurate to name it a refraction effect, as will be discussed in the following. For the application of measured absorption data in practice, it is typical that values above 1 are truncated to 1.
The physical absorption coefficient in Equation (15) can also be applied to the calculation of all angles of incidence, as in a diffuse sound field, and we obtain the random-incidence absorption coefficient. This is the ratio of the incident sound power and the absorbed sound power, both integrated over the hemisphere:
The random-incidence absorption coefficient is bound to be within 0 and 1, and thus, it may not be able to reproduce the measured absorption coefficient in a diffuse sound field. Like in Thomasson [11] (Equation (11)), the ratio between αstat and αran can be expressed by the frequency-dependent factor K:
However, as will be revealed later in Section 4, none of them are very good matches for the measured absorption coefficient.
3. The Open Window
3.1. Reflection and Absorption
An acoustically ‘ideal’ open window would have the reflection factor r = 0 for all angles of incidence and frequencies. The corresponding surface impedance must be Za = Zr* (see Equation (8)). This was the assumption for maximum absorption made by Thomasson [11] (p. 11). However, such a surface impedance is not physically possible.
A real aperture in a rigid baffle has the wall impedance Zw = 0, and thus the surface impedance of the aperture is Za = Zr. From Equation (6), we then have the reflection factor of the aperture:
The phase angle of the reflection factor is φ. At the grazing incidence, the modulus of the reflection factor has the asymptotic value:
The physical absorption coefficient of the aperture can then be calculated:
The same result is also obtained from Equation (15) with Za = Zr. The physical absorption coefficient of the aperture is depicted for various angles of incidence in Figure 4. The abscissa is the dimensionless frequency parameter ke. At low frequencies (ke < 2), the absorption is low, rapidly decreasing towards lower frequencies, and there is no influence of the angle of incidence. At high frequencies (ke >> 1), the absorption is strongly angle-dependent, and the asymptotic value at grazing incidence is α(θ) → 0.50 for θ → 90°. This means that at grazing incidence, the energy is divided in such a way that one-half is absorbed (i.e., transmitted) and the other half is reflected. Then, the grazing incidence results could somehow make sense from a geometrical acoustics point of view, as we would hit exactly the edge of the aperture. It means that the power is then split half and half on either side of the baffle.
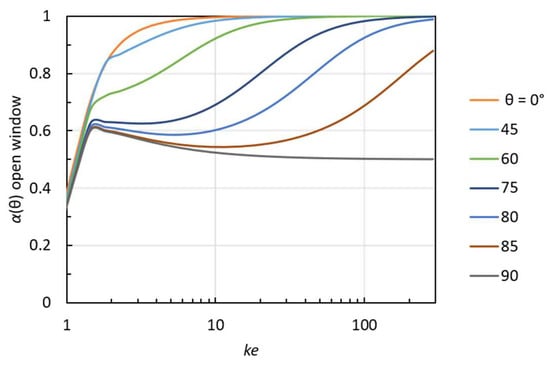
Figure 4.
The physical absorption coefficient at oblique incidence (Equation (22)) of a square aperture with side length 2e.
If we instead apply the assumed incident power based according to geometrical acoustics, we obtain the apparent absorption coefficient of the aperture from Equation (16):
This can take values above unity, and at grazing incidence, we have α′(θ) → ∞ for θ → 90°. This is not because the absorption is extremely high, but because the assumed incident power approaches zero. The apparent absorption coefficient of the aperture is depicted for various angles of incidence in Figure 5. At an angle of 60°, the apparent absorption coefficient reaches a value of 2 at ke = 1.6. Even higher values appear at angles above 60°.
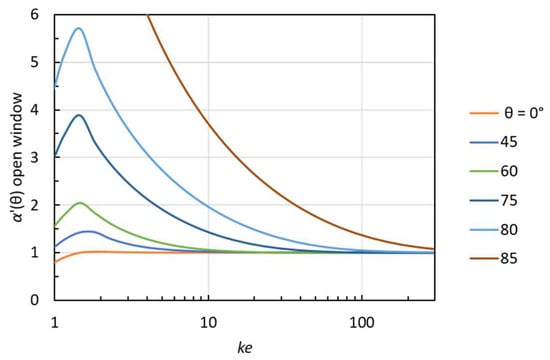
Figure 5.
The apparent absorption coefficient at oblique incidence (Equation (23)) of a square aperture with side length 2e.
3.2. The Scattering Effect
The scattering effect is due to diffraction at the edges around the absorbing patch and gives rise to a sound power P5, which adds to the reflected sound power P4. In the case of an open window, the only reflected sound is the scattered sound P5. This scattering effect can be quantitatively derived by studying the case of an aperture in a rigid baffle (see Figure 3C).
The amount of the scattering effect can be estimated from the reflection factor of the aperture (Equation (20)). The scattered sound power is:
The scattered sound power is depicted as a function of the angle of incidence in Figure 6. This sound power is due to the interaction between neighboring surfaces, here between the rigid baffle and the aperture.

Figure 6.
The scattering effect of a square aperture. Reflected (scattered) sound power P5 relative to incident sound power at normal incidence P0 as a function of the angle of incidence.
3.3. The Refraction Effect
The other diffraction effect to look at is the refraction. This is particularly pronounced at angles of incidence near the grazing incidence, where the angle of transmitted sound θ’ is smaller than the angle of incidence θ (see Figure 3B,C). In fact, the change in direction is assumed to happen before the sound wave path through the aperture (see Figure 7). This explains why the incident sound power P1 is greater than that assumed in the classical theory P1,∞, according to which it is simply proportional to cos θ.
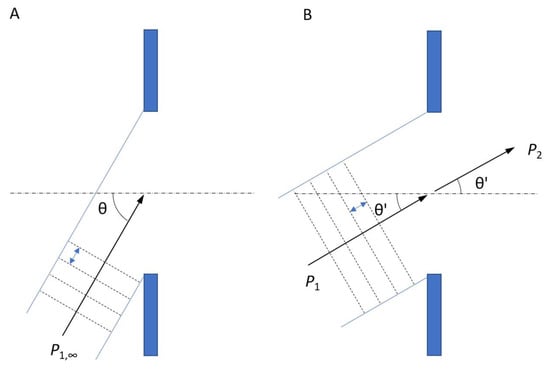
Figure 7.
Refraction effect of a plane wave incident on an aperture. The wavelength is indicated by the double arrow between dotted lines. (A) Direction of incident sound is θ and P1,∞ is the incident sound power in classical theory. (B) Direction of refracted and transmitted sound is θ′ and incident sound power is P1 > P1,∞. The transmitted power is P2 = P1.
The problem with the incident sound power as a function of the angle of incidence can be better understood if we apply normalization; here, the incident sound power P0 of a plane wave is perpendicular to the surface. The normalized incident sound power as a function of angle of incidence is shown in Figure 8. For comparison, the incident sound power according to the classical theory is the dotted curve for ke → ∞.
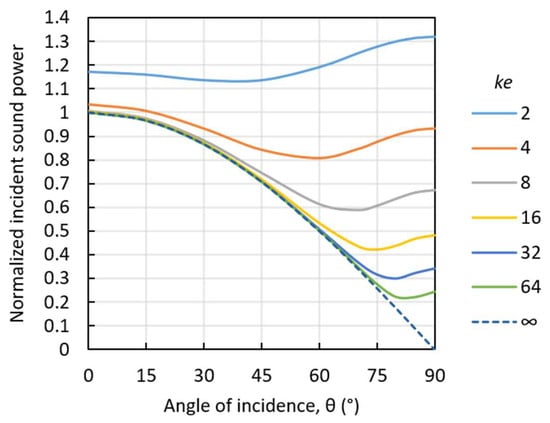
Figure 8.
The refraction effect of a square aperture. The incident sound power P1 relative to that at normal incidence P0 as a function of the angle of incidence.
At very low frequencies (ke < 4), the refraction effect is so strong that the sound transmitted through the aperture is radiated in all directions like that from a point source. However, at medium and high frequencies, the sound transmission through the aperture can be associated with a certain direction having the following angle:
In a diffuse sound field, the sound incident on the aperture from directions close to the grazing incidence is refracted, and the apparent maximum angle of incidence θ′(lim) can be estimated by inserting Re{Zr} for θ = 90° into Equation (25) (see Table 1).

Table 1.
The real part of the radiation efficiency at grazing incidence, the apparent maximum angle of incidence for a diffuse sound field, the normalized incident sound power, and the normalized scattered sound power.
3.4. The Diffraction Effects of an Aperture in a Diffuse Sound Field
By integration over the hemisphere, the statistical and the random incidence absorption coefficients of the aperture are found by Equations (17) and (18) with Za = Zr. The results for a square aperture with an area of 2 m2 are depicted in Figure 9, together with the normal incidence absorption coefficient.

Figure 9.
Calculated absorption coefficients of a square aperture with an area of 2 m2. The physical absorption coefficients for normal incidence and random incidence, together with the statistical absorption coefficient.
It is noted that the random incidence absorption coefficient is less than the normal incidence absorption coefficient, which is always less than unity.
The statistical absorption coefficient exceeds unity at all frequencies and has a maximum of αstat ≈ 2 at 125 Hz, corresponding to ke = 1.6. As mentioned above, the finite area gives rise to two different diffraction effects, which are seen in the absorption properties of the aperture. The refraction effect gives rise to values of the statistical absorption coefficient αstat > 1, while the scattering effect yields an additional reflected sound power, which explains the decrease in absorption towards low frequencies, such as below 125 Hz in the example in Figure 10. It is remarkable that these two diffraction effects were already described in 1970, although in other words, by Sauter and Soroka [3].
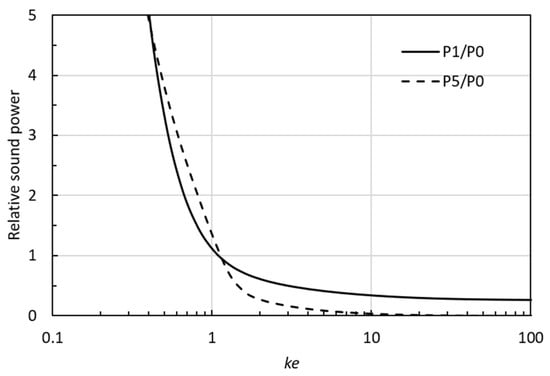
Figure 10.
The two diffraction effects for an aperture calculated for random incidence in a diffuse sound field as a function of normalized frequency ke. Full line: The incident sound power P1 relative to P0 (the refraction effect). Dashed line: The reflected sound power P5 relative to P0 (the scattering effect).
The two diffraction effects are shown as a function of the frequency parameter ke in Figure 10. For ke > 2, the scattering effect is very small, but at lower frequencies (ke < 1.1), the scattering effect is strong. In actuality, the scattered sound power at random incidence exceeds the incident sound power in the range 0.4 < ke < 1.1, which is seen more clearly in Figure 11. Physically, one might think this is impossible. However, this is a wave phenomenon similar to the diffraction effect known from the sound reflection from a finite-size panel; in a frequency range above the limiting frequency for a reflecting panel, the energy reflection coefficient actually exceeds unity (see [20] Figure 4).
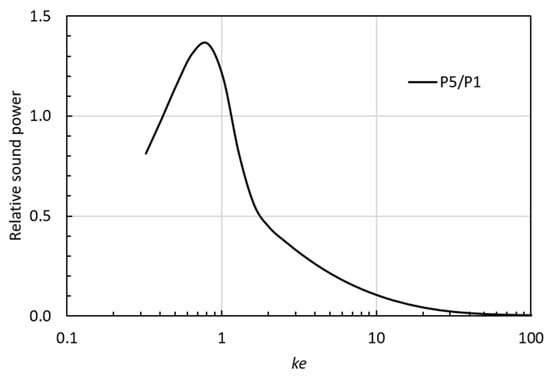
Figure 11.
The ratio between the reflected (scattered) sound power P5 and the incident sound power P1 for random incidence on an aperture in a diffuse sound field as a function of normalized frequency ke.
Figure 12 is an illustration of the importance of the diffraction effects at low, medium, and high frequencies. At high frequencies (ke ∞), the incident sound power is one-quarter that in a plane wave at normal incidence, while the scattered sound power is zero. At medium frequencies (ke = 2), the incident sound power is higher because of the refraction effect, and the scattered sound power is noticeable. At low frequencies (ke = 1), both diffraction effects are very strong, and the incident sound power exceeds that for normal incidence.
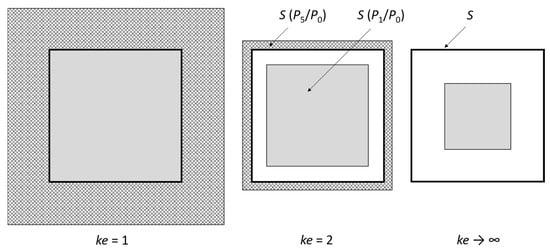
Figure 12.
Illustration of diffraction effects of a square aperture in a diffuse sound field. The area of the aperture is S, and the incident sound power is proportional to the shown grey area inside the aperture. The scattered (reflected) sound power is proportional to the hatched area surrounding the aperture.
3.5. Angle-Dependent Reflection from an Aperture
The pressure reflection factor, defined as the ratio of reflected to incident sound pressure, is complex, i.e., it has an amplitude and a phase. Depending on the surface material, the phase angle can be positive or negative. Physically, this means that the sound reflection seems to take place at an imaginary surface that is located either a little in front of or a little behind the real surface. This phenomenon is well known from measurements of materials in an impedance tube, where the phase angle is calculated from the distance from the surface to the first pressure node. The phase angle of the reflection can also be interpreted as a frequency-dependent time delay, which can be either negative or positive. However, the negative time delay gives rise to a causality problem. If the sound reflection should be modelled as a filter, this filter should be acausal.
The pressure reflection factor given in Equation (20) is shown in Figure 13 as a function of the angle of incidence for the case of a square aperture with an area of 2 m2. For frequencies above 500 Hz and angles below 45°, the reflection factor is relatively small (<0.2), and the phase angle is around π/2 (90°). However, when the angle of incidence exceeds 45° and approaches 90°, the reflection pattern changes significantly. At frequencies above 125 Hz, the amplitude increases to around 0.7 and the phase angle decreases to around π/4 (45°). The corresponding physical absorption coefficient at the grazing incidence is around 0.5 (see Figure 4).

Figure 13.
Modulus and phase of the pressure reflection factor for the case of a square aperture with an area of 2 m2.
The phase shift of 45° for sound reflection near the grazing incidence corresponds to a negative time delay, which means that the reflected wave seems to jump forward by one-eighth of a wavelength. At other angles of incidence closer to normal incidence, the phase shift is around 90° and the negative time delay is twice as big, corresponding to one-quarter of the wavelength. This reveals that the present impedance model for sound reflection is acausal. In previous work by the author, it was found that the sound reflections from membrane absorbers and resonant absorbers above the resonance frequency have negative time delays and thus are acausal [9]. Berthelot [21] also found that surface impedance models for porous materials are not causal. This means that a causality requirement is not valid for impedance models of sound reflection, and this must be attributed to the sound as a wave phenomenon.
4. Revised Model for Sound Absorption
4.1. Sound-Absorbing Patch with Rigid Backing in a Large Rigid Baffle
The hypothesis for the revised model for sound absorption is that the open window is a valid reference for sound absorption: The sound absorption of a material surrounded by a large rigid baffle cannot exceed that of an aperture with the same size.
For a plane wave at oblique incidence, this implies that the factor M must be applied to the apparent sound absorption coefficient. By doing so, it is expected that the results will be closer to those measured in a reverberation chamber. The factor M is equal to the absorption coefficient of the aperture given by Equation (22) and depicted in Figure 4:
Like the radiation impedance Zr, M is dependent on the angle of incidence and the frequency parameter ke. For high frequencies (ke > 10) and angles of incidence up to around 45°, the difference between the classical model and the revised model is negligible. However, at lower frequencies and for larger angles of incidence, the difference can be significant. Especially near the grazing incidence, it is noted that the revised model leads to very low absorption and thus a stronger angle dependency than with the classical models.
From Equation (16), we obtain the apparent sound absorption coefficient in the revised model:
The statistical absorption coefficient calculated with the revised theory is then:
The idea of the revised model was first presented in a short conference paper in 2022 [22]. The model has recently been implemented in the material calculator of the room acoustic software ODEON [23] (pp. 74–80). The surface impedance of a material is calculated by the transfer matrix method, in which the material is represented by a transfer matrix, relating the pressure and the normal particle velocity on either side [24]. Porous materials are characterized by density and flow resistivity.
4.2. Examples for Validation of the Revised Model
In order to test the revised model against experimental data, some examples of measurement results were taken from [25]. These measurements were made in a reverberation chamber in accordance with ISO 354 [14]. The test objects consisted of combinations of mineral wool, polyester wool, and various air cavities (see Table 2). Only four cases were selected for the present comparison; other cases were only 50 mm thick, and the difference between the theoretical models would be negligible. Other cases were covered on top with various slat structures that have a minor influence on the measured results, and these were not used for the validation. The measurements were made in one-third octave bands from 63 Hz to 8000 Hz. The selected cases have absorption coefficients higher than unity at some frequencies. The dimensions of the test samples were 3.9 m by 2.6 m, i.e., an area of 10.1 m2. The test objects were placed on the floor of the test chamber and surrounded on the sides by a rigid frame. However, the surface of the test objects was not surrounded by a baffle as assumed in the theory. This is assumed to lead to slightly lower measured absorption coefficients compared to a situation with a surrounding baffle.

Table 2.
The construction of the four test objects from top to bottom [25].
The mineral wool has a surface density of 30 kg/m2, and the flow resistivity is assumed to be 20,000 N∙s∙m−4. The polyester fiber wool has a surface density of 20 kg/m2, and the flow resistivity is assumed to be 1750 N∙s∙m−4. From these data, the statistical absorption coefficient, the random incidence absorption coefficient, and the revised statistical absorption coefficient are derived. The corresponding equations are Equations (17), (18) and (28), respectively.
Figure 14 shows the three calculated absorption coefficients together with the measured data for Case A. The measured absorption coefficients exceed 1 at mid frequencies and high frequencies. This cannot be reproduced by the physical absorption coefficient, whereas the calculated statistical absorption coefficient yields values that are too high. The revised model is in better agreement with measured data, although not perfect. In a frequency range of 100 Hz to 200 Hz, the measured absorption is lower than that predicted by the revised model, which might be explained by the position of the test sample on the floor without a surrounding baffle, as mentioned above.

Figure 14.
Measured and calculated absorption coefficients for Case A.
The results for Case B are shown in Figure 15. The measured absorption coefficients exceed 1 for most frequencies above 125 Hz. In general, the agreement with the revised model is quite good.

Figure 15.
Measured and calculated absorption coefficients for Case B.
The results for Case C are shown in Figure 16. The total thickness of the construction is doubled from 200 mm to 400 mm compared to the former Case B. Thus, it is unexpected that the measured absorption coefficient is lower than in the previous case in the frequency range of 125 Hz to 250 Hz. The absorption is particularly low at 63 Hz and 160 Hz. There might be some resonance effects in the air cavity that affect the results at low frequencies. Above 200 Hz, the agreement with the revised model is quite good.
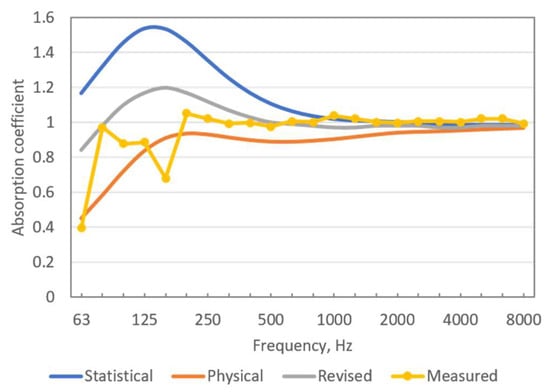
Figure 16.
Measured and calculated absorption coefficients for Case C.
The results for Case D are shown in Figure 17. The tendency is the same as in the previous Case C, but the unexpected dip in the measured absorption between 80 Hz and 200 Hz is more pronounced. A dip in the curve is seen at 63 Hz and another one around 125 Hz. A possible explanation may be the influence of one-dimensional modes in the cavity. In actuality, the test specimen’s width of 2.6 m provides the natural frequencies 66 Hz, 132 Hz, and 198 Hz for the first three modes in this direction. These frequencies correspond to the location of the dips. If this should be included in the calculation model, it would need 3D modelling of the cavity.
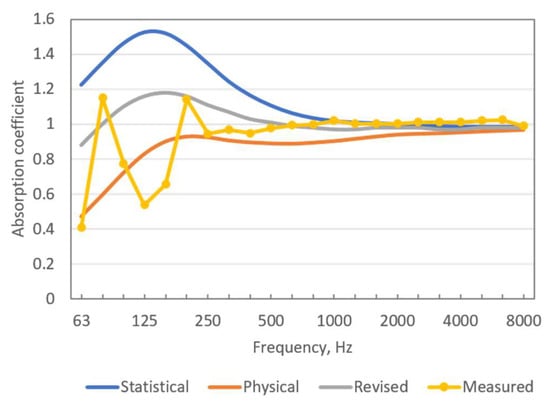
Figure 17.
Measured and calculated absorption coefficients for Case D.
The unexpected measurement results in the low-frequency region for Cases C and D were also addressed by the authors in the original paper [25]. They suggested a lack of diffusion at low frequencies in the reverberation chamber or possible standing waves between the sides of the test object and the walls of the chamber as explanations. However, it seems more likely that the reason is related to the air cavity inside the test objects C and D, as suggested above. The effect is not seen in cases without a cavity, but it is very strong in cases with a cavity.
If this analysis is true, and we can disregard the measured data at 63 Hz, 100 Hz, 125 Hz, and 160 Hz for Cases C and D, the revised model appears to be superior to the statistical and physical models.
5. Discussion
One of the problems in room acoustics is how to deal with measured absorption coefficients that exceed 1 in cases of highly absorbing materials. The simple truncation of results above 1 is not a satisfactory solution because information contained in the measured data is thrown away. However, this is what happens when measured absorption data are converted to the so-called practical sound absorption coefficient in accordance with ISO 11654 [26] (clause 4.1). In room acoustical calculation models, it is also common practice to truncate values above 1.
However, the revised model for sound absorption presented here aims to accept and understand the measurement results, also when the absorption coefficient exceeds 1. The issue is illustrated in Figure 18, for example, Case B.

Figure 18.
Calculated absorption coefficients according to the revised model for Case B. The angle-dependent apparent absorption coefficients (27) and the statistical absorption coefficient (28).
In order to achieve the correct statistical absorption coefficient, it may be necessary to apply angle-dependent absorption coefficients that are significantly greater than 1 when the angle of incidence is above 45°. It is noted that the absorption coefficient at 60° is very close to the statistical absorption coefficient. At some frequencies, the absorption coefficient exceeds 2 when the angle of incidence is greater than 75°. This means that the energy reflection coefficient is not limited to being between 0 and 1, but it can take negative values.
Sound reflections in the room acoustics computer model ODEON are calculated according to the method outlined in [8]. Equation (15) is applied, and this implies that sound reflections are dependent on the size of the surface and the angle of incidence. If the revised model is to be applied to selected surfaces with high sound absorption, Equation (27) should be applied instead. The challenge here is how to deal with possible negative energy reflection coefficients. Here, it is important to remember the background for this, namely that the considered surface with high absorption is supposed to have a limited area and be surrounded by highly reflective surfaces.
In the room acoustic computer model, the calculated reflection contributes to the construction of an impulse response or an energy decay curve in a particular receiver position within the room. This means that the contribution from the highly absorbing surface considered here will be a single contribution among a large number of contributions from other surfaces with less absorption. Thus, the possible negative reflection coefficient from the absorbing surface will suck energy from the total collection of energy contributions.
An alternative application of the revised model could be to merge the absorption of the different materials on a surface. For example, if the highly absorbing material is placed on the floor of the reverberation chamber, all reflections from the floor should be assigned with the combined absorption coefficient α1+2, calculated from:
where S1 is the area of the sound-absorbing patch with absorption coefficient α1, and S2 is the area of the surrounding floor with absorption coefficient α2. Since α2 is very low, the combined absorption coefficient will not exceed 1, even if α1 does so.
The aim of the calculation model based on the revised theory for sound absorption is to be able to reproduce the absorption data as measured in a reverberation chamber, also when the results exceed 1. If this can be realized, the room acoustics calculation model may also be able to provide more accurate results in other types of rooms.
Another theme to be considered in future research is the influence of standing waves in a cavity as part of a sound-absorbing structure. The problems that can occur at low frequencies are clearly demonstrated in some of the cases analyzed above. Current prediction models for sound-absorbing structures with deep cavities are not reliable, and a better prediction model can not only help in understanding the nature of the problem but may also help in developing more efficient sound absorbers.
6. Conclusions
Two diffraction effects are identified in connection with the sound reflection from a material sample with a finite area. One diffraction effect is the scattered reflection from the edges of the sample, and this causes a decrease in sound absorption towards low frequencies. This effect is related to the imaginary part of the radiation impedance of the absorbing surface. It is shown that the scattering effect can be separated and quantified by studying the case of an aperture in a large rigid baffle. It is argued that this represents an unavoidable amount of sound reflection, also valid for the case of an absorbing patch surrounded by a rigid baffle.
The other diffraction effect is a refraction of the incident sound wave, which can be pronounced for large angles of incidence. This effect is related to the real part of the radiation impedance of the absorbing surface. In a diffuse sound field, this effect causes the incident sound power to be greater than assumed in the classical room acoustic theory, and this explains why absorption coefficients measured in a reverberation chamber can exceed 1. This is often referred to as the edge effect.
A revised impedance model is presented for sound absorption that includes these diffraction effects. It is argued that measured absorption coefficients above 1 should not be truncated, as it is common practice today. Instead, the reason for such measurement results should be better understood. The revised impedance model may contribute to this.
The impedance model of the sound reflection from an aperture has revealed that the reflection is acausal. The phase shift of the reflection can be interpreted as an apparent reflection plane, the position of which is frequency-dependent and in front of the physical pane of the aperture. For ke > 1, the phase shift is between 45° and 90°. It is found that a causality requirement is generally not valid for impedance models of sound reflection.
Funding
This research received no external funding.
Data Availability Statement
The data presented in this study are available on request from the corresponding author.
Acknowledgments
The author wants to thank Antoine Richard from Odeon A/S for constructive discussions during the preparation of this work. He is particularly acknowledged for validation and implementation of the revised model in the ODEON material calculator. Janne Riionheimo from Aalto University has been helpful in providing detailed information about the measurements referred to in Section 4.2.
Conflicts of Interest
Author Jens Holger Rindel was employed by the company Odeon A/S. Author Jens Holger Rindel declares that the research was conducted in the absence of any commercial or financial relationships that could be construed as a potential conflict of interest.
Appendix A. The Radiation Impedance
The radiation impedance of a finite area is fundamental for the calculation models for sound transmission, reflection, and absorption. The radiation impedance is a function of the angle of radiation or the angle of incidence, respectively, depending on which part of the process is considered. The radiation impedance is complex, but usually the imaginary part has been neglected because only the radiated sound power was relevant. However, for the current application, it is essential to include both the real and the imaginary parts of the radiation impedance. A combined approximation method for calculating both real and imaginary parts of the radiation impedance of a rectangular panel was derived by Davy et al. [27]. This is the approximation applied in the current work.
For a square panel with the side length e, the real and imaginary specific radiation impedance are displayed in Figure A1 as functions of the angle of incidence and with the dimensionless frequency parameter ke, where k is the wave number.
The asymptotic limit of the real part of the specific radiation impedance is (see Figure A1):
At normal incidence, the specific radiation impedance is approximately:
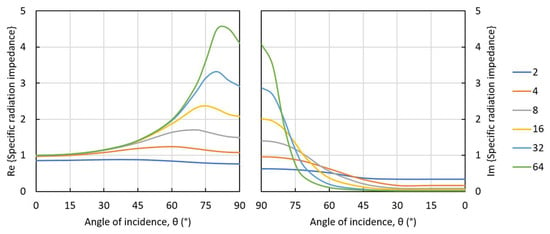
Figure A1.
Real and imaginary parts of the specific radiation impedance as functions of the angle of incidence. The dimensionless frequency parameter is ke.
The approximations of the specific radiation impedance in the present work are after Davy et al. [27] (Equation (53)–(63)). In Figure A1, the real and imaginary parts are displayed with mirrored axes for the angle of incidence in order to emphasize that the two parts are equal at the grazing incidence. This is in contrast to the normal incidence, where the real part is 1 (except for very low ke) and the imaginary part is close to zero.
The results of the approximation formulas can be compared to the results of numerical integration by Thomasson [11] (Table I) for selected examples of the frequency parameter ke (see Figure A2). The agreement is not perfect, but is thought to be close enough for the present application. The approximation to the real part of the radiation impedance by Davy et al. [27] (Equation (53)–(63)) seems to be better than that by Rindel [8] Equation (6).
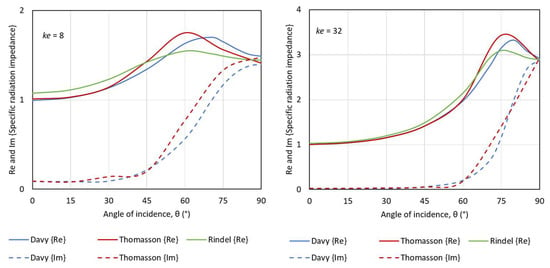
Figure A2.
Comparison of approximations to the specific radiation impedance as functions of the angle of incidence for two examples, ke = 8 and 32. The results of the formulas by Davy et al. [27] are compared with the numerical integrations by Thomasson [11] and the formula by Rindel [8].
References
- Sabine, W.C. Reverberation. In Paper No. 1 in Collected Papers on Acoustics; Harvard University Press: Cambridge, MA, USA, 1923; pp. 23–24. [Google Scholar]
- Wilson, G.P.; Soroka, W.W. Approximation to the diffraction of sound by a circular aperture in a rigid wall of finite thickness. J. Acoust. Soc. Am. 1965, 37, 287–297. [Google Scholar] [CrossRef]
- Sauter, A.; Soroka, W.W. Sound transmission through rectangular slots of finite depth between reverberant rooms. J. Acoust. Soc. Am. 1970, 47, 5–11. [Google Scholar] [CrossRef]
- Rindel, J.H. Transmission of Traffic Noise Through Windows—Influence of Incident Angle on Sound Insulation in Theory and Experiment. Report No. 9. Ph.D. Thesis, The Acoustics Laboratory, Technical University of Denmark, Lyngby, Denmark, 1975. [Google Scholar]
- Sgard, F.; Nelisse, H.; Atalla, N. On the modelling of the diffuse field sound transmission loss of finite thickness apertures. J. Acoust. Soc. Am. 2007, 122, 302–313. [Google Scholar] [CrossRef] [PubMed]
- Trompette, N.; Barbry, J.-L.; Sgard, F.; Nelisse, H. Sound transmission loss of rectangular and slit-shaped apertures: Experimental results and correlation with a modal model. J. Acoust. Soc. Am. 2009, 125, 31–41. [Google Scholar] [CrossRef] [PubMed]
- Martellotta, F. On the sound absorption by openings in rooms (L). J. Acoust. Soc. Am. 2012, 132, 2951–2954. [Google Scholar] [CrossRef] [PubMed]
- Rindel, J.H. Modelling the Angle-Dependent Pressure Reflection Factor. Appl. Acoust. 1993, 38, 223–234. [Google Scholar] [CrossRef]
- Rindel, J.H. An impedance model for estimating the complex pressure reflection factor. In Proceedings of the Forum Acusticum, Aalborg, Denmark, 27 June–1 July 2011; pp. 1535–1540. [Google Scholar]
- Thomasson, S.-I. On the Absorption Coefficient. Acustica 1980, 44, 265–273. [Google Scholar]
- Thomasson, S.-I. Theory and Experiments on the Sound Absorption as Function of the Area; Report TRITA-TAK-8201; Royal Institute of Technology: Stockholm, Sweden, 1982. [Google Scholar]
- Van hoorickx, C.; Didier, P.; Reynders, E.P.B. Prediction and uncertainty quantification of the diffuse sound absorption of finite absorbers. J. Sound Vib. 2022, 539, 117258. [Google Scholar] [CrossRef]
- Li, X. Prediction the diffuse sound absorption coefficient of a baffled finite absorber. Appl. Acoust. 2025, 235, 110711. [Google Scholar] [CrossRef]
- ISO 354; Acoustics—Measurement of Sound Absorption in a Reverberation Room. 2nd ed. International Organization of Standardization: Geneva, Switzerland, 2003.
- Northwood, T.D. Absorption of diffuse sound by a strip or rectangular patch of absorptive material. J. Acoust. Soc. Am. 1963, 35, 1173–1177. [Google Scholar] [CrossRef]
- Ten Wolde, T. Measurement of the edge effect in reverberation rooms. Acustica 1967, 18, 207–212. [Google Scholar]
- Bartel, T.W. Effect of absorber geometry on apparent absorption coefficients as measured in a reverberation chamber. J. Acoust. Soc. Am. 1981, 69, 1065–1074. [Google Scholar] [CrossRef]
- Richard, A.; Fernandez-Grande, E.; Brunskog, J.; Jeong, C.H. Estimation of surface impedance at oblique incidence based on sparse array processing. J. Acoust. Soc. Am. 2020, 147, 4115–4125. [Google Scholar] [CrossRef] [PubMed]
- Nolan, M. Estimation of angle-dependent absorption coefficients from spatially distributed in situ measurements. J. Acoust. Soc. Am. 2017, 141, EL119–EL124. [Google Scholar] [CrossRef] [PubMed]
- Rindel, J.H. Attenuation of Sound Reflections due to Diffraction. In Proceedings of the Nordic Acoustical Meeting NAM-86, Aalborg, Denmark, 20–22 August 1986; pp. 257–260. [Google Scholar]
- Berthelot, Y.H. Surface acoustic impedance and causality. J. Acoust. Soc. Am. 2001, 109, 1736–1739. [Google Scholar] [CrossRef] [PubMed]
- Rindel, J.H.; Richard, A. A revised theory for the absorption of a rectangular absorber in an infinite rigid baffle. In Proceedings of the 34th International Conference on Acoustics, Gyeongju, Republic of Korea, 24–28 October 2022. [Google Scholar]
- ODEON Room Acoustics Software, User’s Manual Version 18; Kgs.: Lyngby, Denmark, 2024.
- Allard, J.F.; Atalla, N. Propagation of Sound in Porous Media: Modelling Sound Absorbing Materials, 2nd ed.; John Wiley & Sons, Ltd.: Chichester, UK, 2009. [Google Scholar]
- Riionheimo, J.; Näveri, N.; Lokki, T.; Möller, H. Sound absorption of slat structures for practical applications. Proc. Inst. Acoust. 2018, 40, 493–502. [Google Scholar]
- ISO 11654; Acoustics—Sound Absorbers for Use in Buildings—Rating of Sound Absorption. International Organization of Standardization: Geneva, Switzerland, 1997.
- Davy, J.L.; Larner, D.J.; Wareing, R.R.; Pearse, J.R. The average specific forced radiation wave impedance of a finite rectangular panel. J. Acoust. Soc. Am. 2014, 136, 525–536. [Google Scholar] [CrossRef]
Disclaimer/Publisher’s Note: The statements, opinions and data contained in all publications are solely those of the individual author(s) and contributor(s) and not of MDPI and/or the editor(s). MDPI and/or the editor(s) disclaim responsibility for any injury to people or property resulting from any ideas, methods, instructions or products referred to in the content. |
© 2025 by the author. Licensee MDPI, Basel, Switzerland. This article is an open access article distributed under the terms and conditions of the Creative Commons Attribution (CC BY) license (https://creativecommons.org/licenses/by/4.0/).