

Recent Developments in Investigating and Understanding Impact Sound Annoyance—A Literature Review †


Abstract
1. Introduction
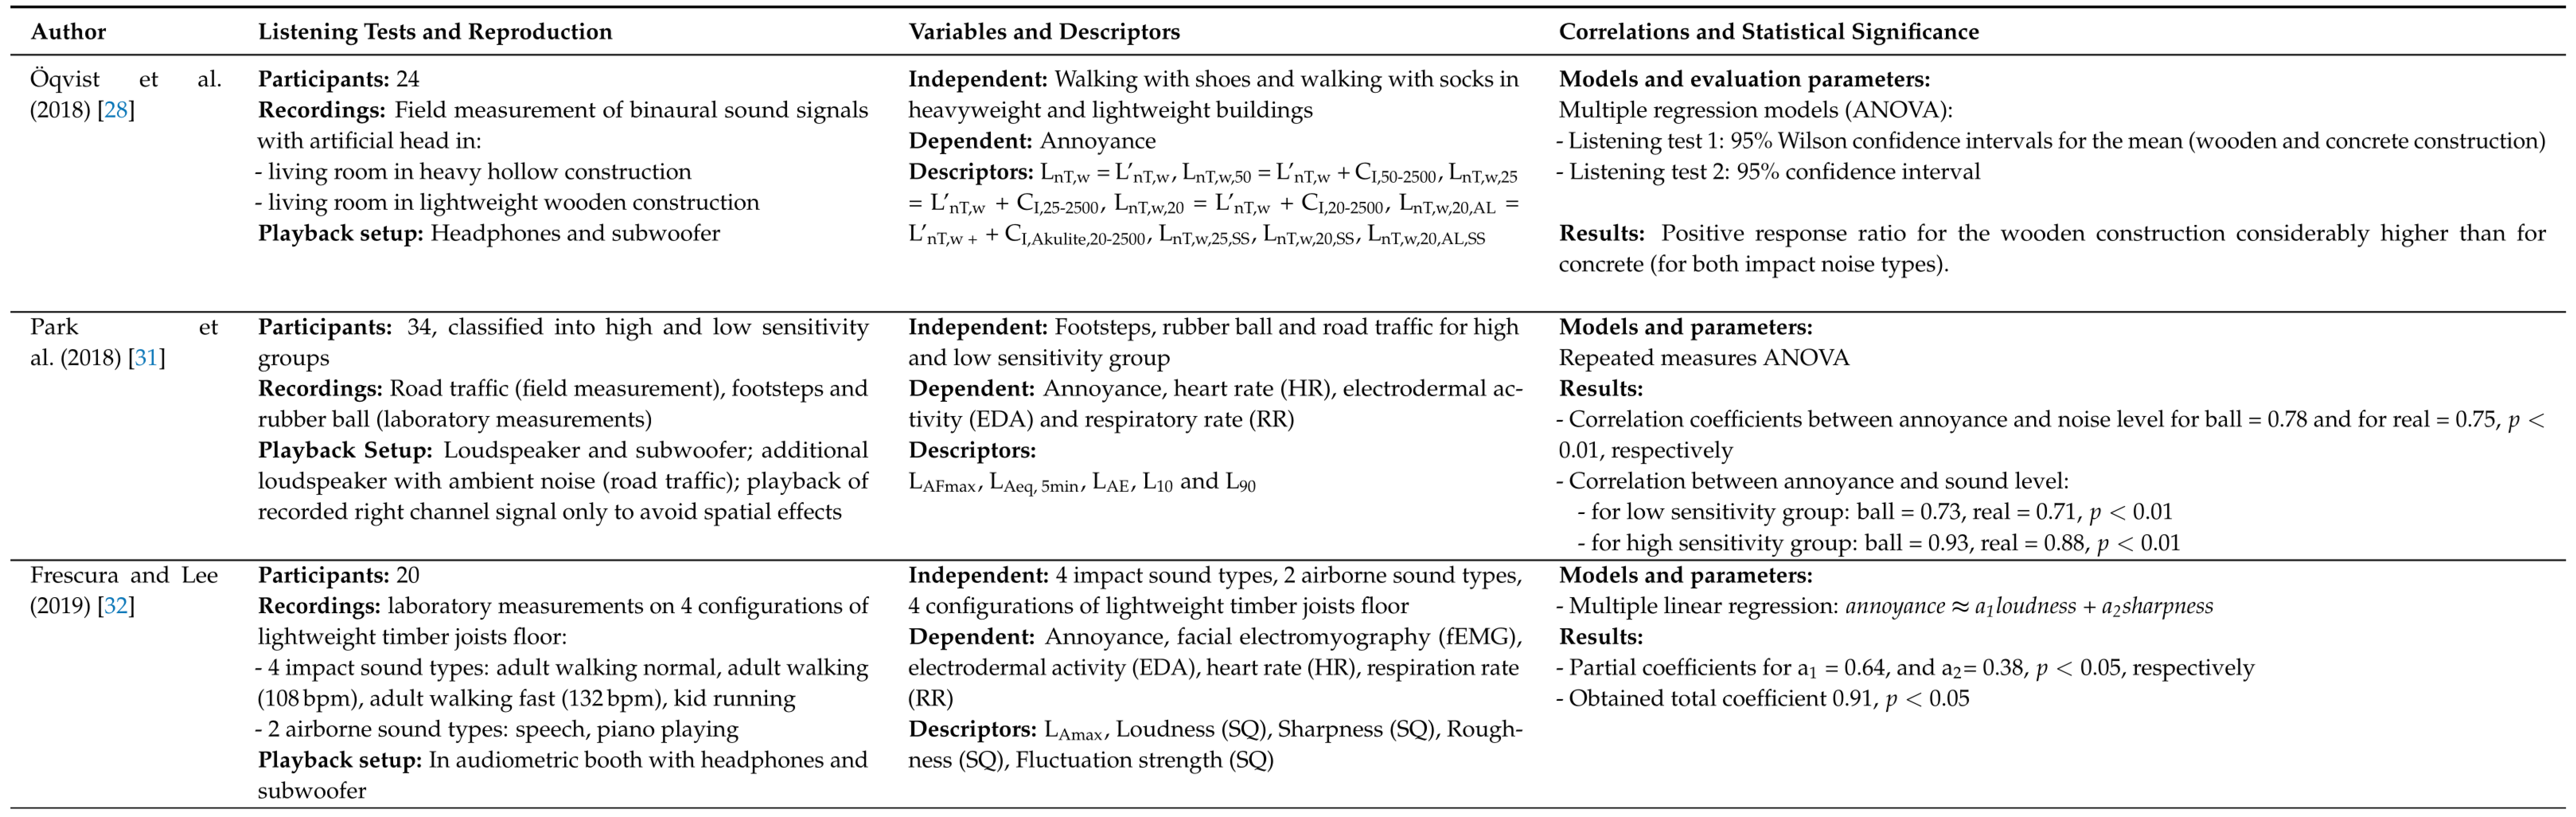
“… account for up to one third of the variance observed in annoyance reactions.” (Fenech, 2021, p. 2) [10].
“… studies that approach acoustic comfort in living spaces by linking acoustical data and subjective responses in laboratory tests.” (Vardaxis and Bard, 2018, p. 1) [11].
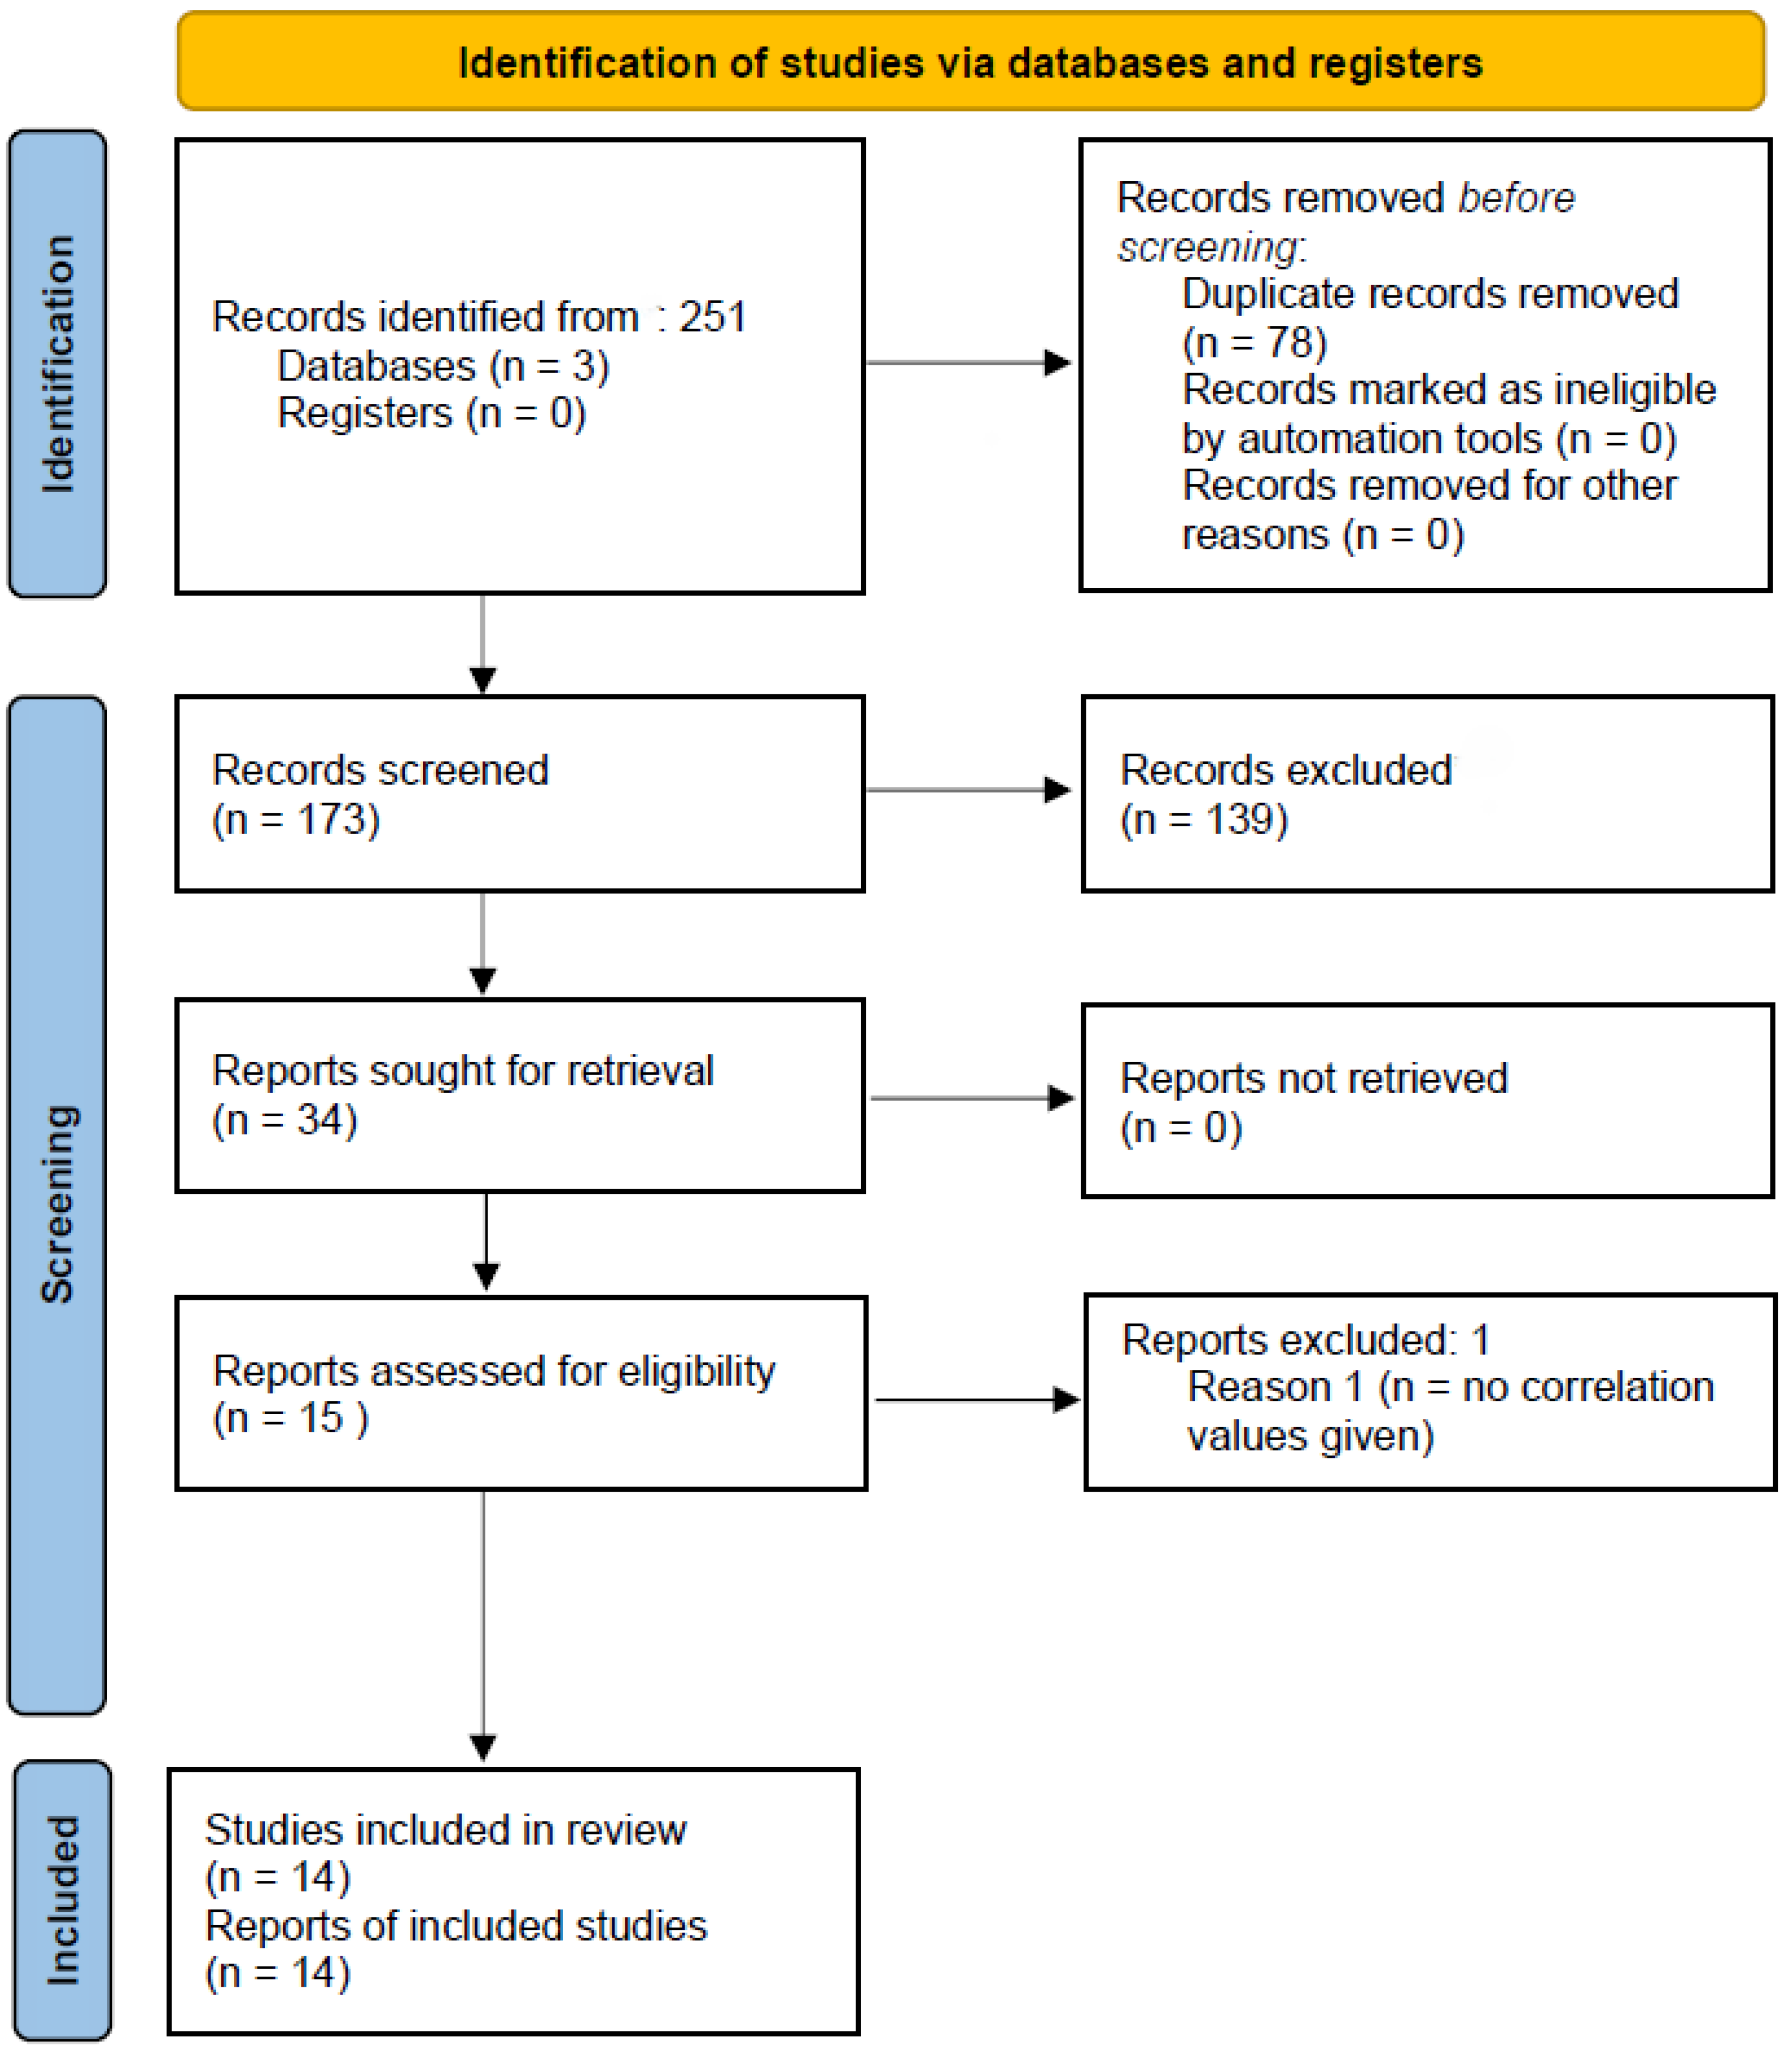
2. Method
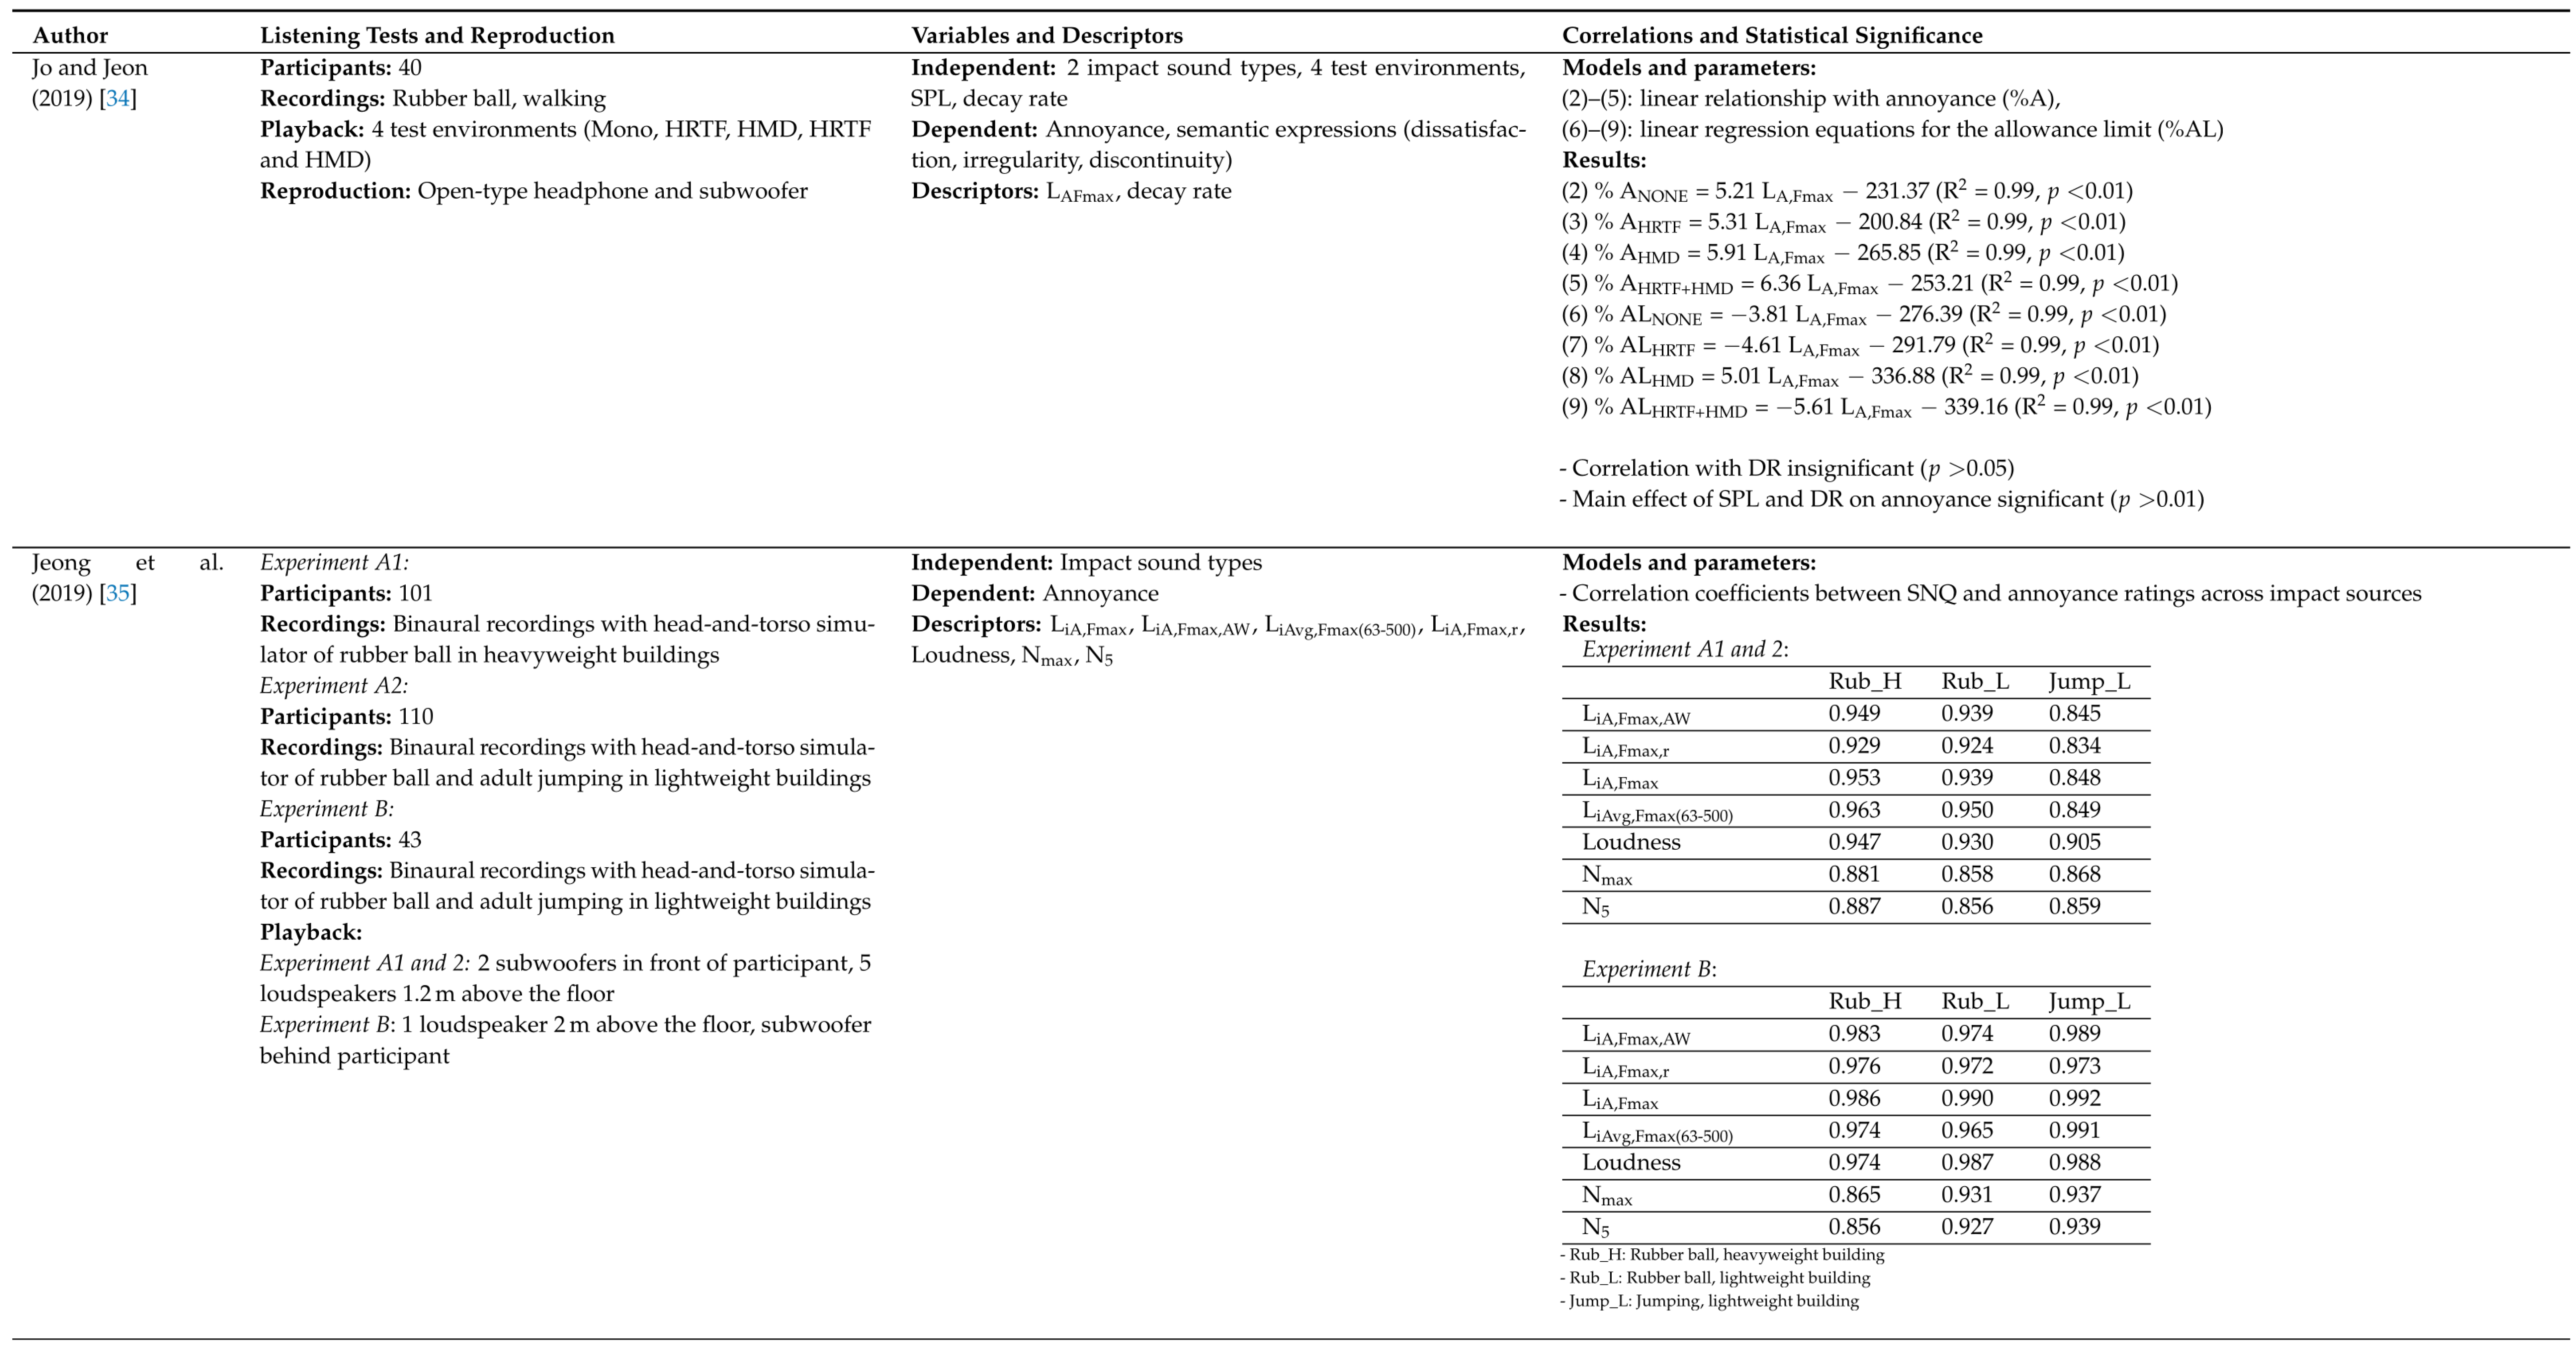
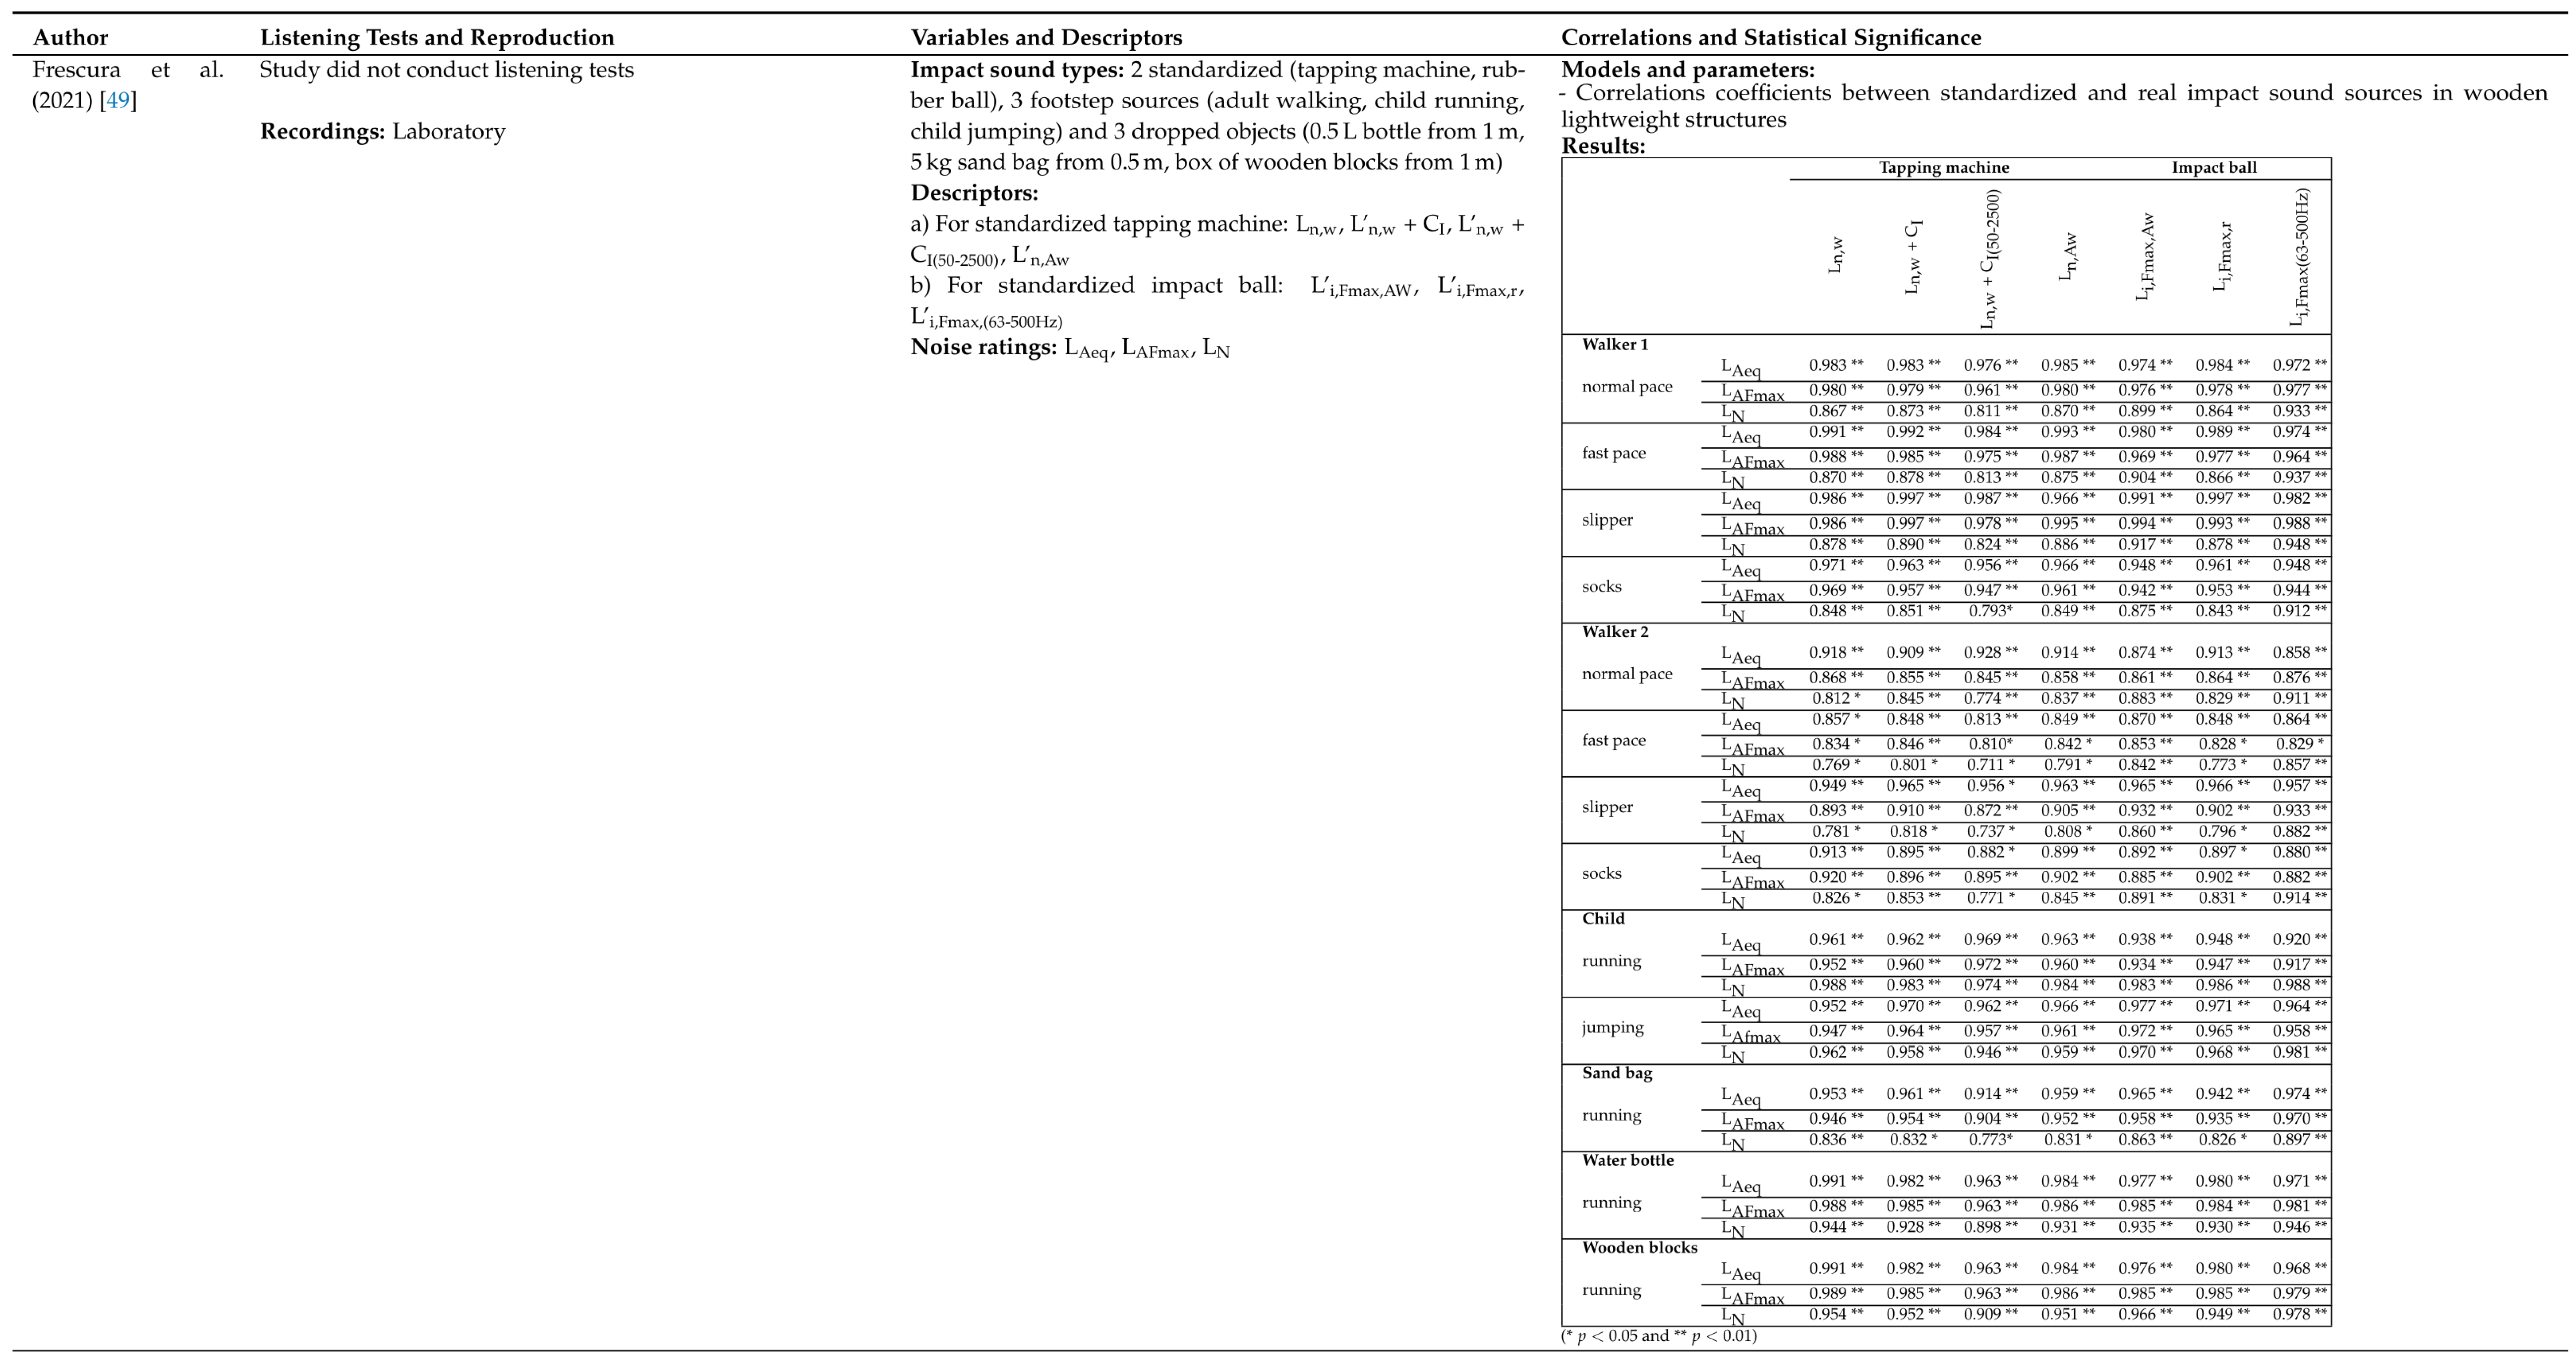
3. Results
“… assessed the lightweight floor structures adequately considering the realistic situations with different real impact sources” (Frescura et al. (2021), p. 11) [49].
4. Discussion
4.1. Impact Sound Type
4.2. Low Frequency Consideration
4.3. Listening Test Environment
4.4. Spectral, Spatial and Temporal Characteristics
4.5. Non-Acoustic Factors
4.6. Additional Dependent Variables
4.7. Number of Participants
4.8. Structures Investigated
4.9. New Findings
5. Conclusions
Funding
Conflicts of Interest
Abbreviations
| TLA | Three letter acronym |
| LD | Linear dichroism |
| SNQ | Single number quantity |
| HRTF | Head-related transfer function |
| HMD | Head-mounted display |
| fEMG | Facial electromyography |
| EDA | Electrodermal activity |
| HR | Heart rate |
| RR | Respiration rate |
Appendix A


| SNQ | Definition | Standard | References |
|---|---|---|---|
| IACC | Interaural cross-correlation function: Covariance of delayed versions of the left and right ear time signal | ISO 3382-1 | [49] |
| SPL | Sound pressure level | ISO 3740:2019 | [34] |
| Lw | Weighted reduction of ISPL | ISO 717-2 | [41] |
| Llin | Weighted reduction of ISPL + spectrum adaptation term C | ISO 717-2 | [41] |
| ICC | Derived from sound attenuation values tested at sixteen standard frequencies from 100 to 3150 Hz | [37] | |
| L10 | Percentile sound pressure level | [31] | |
| L90 | Percentile sound pressure level | [31] | |
| LA | A-weighted sound pressure level | ||
| LAE | A-weighted sound pressure level | [31,46] | |
| LAF,5% | Corresponding to the A-weighted SPL exceeded in 5% of the measurement time | [47] | |
| LAF,10% | Corresponding to the A-weighted SPL exceeded in 10% of the measurement time | [47] | |
| LAeq | A-weighted sound pressure level in dB, equivalent to the total sound energy over a specific period of time | JIS A 1418, KS F 2810-2 | [31,46,49] |
| LAmax | Maximum A-weighted sound pressure level | JIS A 1418, KS F 2810-2 | [32] |
| LA,Fmax | A-weighted, maximum sound level measured with a fast time-constant | [31,34,37,46,49] | |
| LAmax,r | JIS A 14119-2, KS F KS 2863-2 | ||
| LiA,Fmax | A-weighted maximum impact sound level | [35,41,44,46] | |
| LLiA,Fmax,AW | [35] | ||
| LLi,Fmax,AW | Inverse A-weighted impact sound pressure level | JIS A 1418, KS F 2810-2 | [49] |
| Li,Fmax,r | A-weighted impact sound pressure level | [49] | |
| Li,Fmax(50-630 Hz) | [47] | ||
| LiA,Fmax,r | [35] | ||
| LiAvg,Fmax(63-500 Hz) | Arithmetic average of maximum sound pressure levels in octave bands from 63 Hz to 500 Hz | JIS A 14119-2, KS F 2863-2 | [35,49] |
| Li,Favg,Fmax | [47] | ||
| DR | Similar to reverberation time but for impact sounds | [34] | |
| JND | Just noticeable difference | ||
| Ln,AW | JIS A 14119-2, KS F 2863-1 | [49] | |
| Ln,w | Impact sound insulation index characterizing a building element (laboratory measurements) | ISO 717-2, ISO 140-7, EN ISO 12354-2, ISO 16283-2 | [28,37,41,49] |
| L’n,w | Apparent impact sound insulation index (same as Ln,w for field measurements) | ISO 717-2, ISO 140-7, EN ISO 12354-2, ISO 16283-2 | [39,42] |
| LnT,w | Weighted standardized impact sound pressure level—laboratory measurements | ISO 140-7 | [28] |
| L’nT,w | Weighted standardized impact sound pressure level—field measurements | ISO 717-2 | [28,42,47] |
| L’n100-3150 Hz | |||
| LCF,max | C-weighted, fast response, maximum, sound level | [37] | |
| LnT,w,25,SS | [28] | ||
| LnT,w,20,SS | [28] | ||
| LnT,w,20,AL,SS | [28] | ||
| L’n100-3150 Hz | [47] | ||
| Spectrum adaptation terms | Definition | Standard | References |
| C | C is an A-weighted pink noise spectrum adaptation term | ISO 717-1, ISO 717-2, EN ISO 12354-1, EN ISO 12354-2 | |
| CI | Unweighted impact sound level | ISO 71-2 | [39,41,49] |
| CI,50 | [37,41] | ||
| C50 | |||
| CI,20-2500 Hz | Unweighted impact sound level for the frequency range 20–2500Ḣz | SS 25267:2015 | [28,42] |
| CI,Akulite,20-2500 | [28] | ||
| CI,25-2500 Hz | Unweighted impact sound level for the frequency range 25–2500Ḣz | [28] | |
| CI,50-2500 Hz | Unweighted impact sound level for the frequency range 50–2500Ḣz | ISO 717-2 | [28,39,42,49] |
| CI,S1 … CI,S5 | [39] | ||
| CI,opt | [39] | ||
| C | [41] | ||
| Sound Quality | Definition | Standard | References |
| L | Loudness: sound quality metric defined by Zwicker and Fastl | ISO 532-1:2017 | [32,35,49] |
| LLZ | Zwicker’s loudness level | ISO 532-1:2017 | [32,35,49] |
| N5 | Percentile loudness: SQ metric defined by Zwicker and Fastl | ISO 532-1:2017 | [35] |
| N10 | Percentile loudness: SQ metric defined by Zwicker and Fastl | ISO 532-1:2017 | [35] |
| Nmax | Maximum loudness: SQ metric defined by Zwicker and Fastl | ISO 532-1:2017 | [35] |
| FS | Fluctuation strength: SQ defined by Zwicker and Fastl | [32] | |
| T | Tonality: SQ metric defined by Zwicker and Fastl | ||
| UA | Unbiased annoyance: SQ metric defined by Zwicker and Fastl | ||
| S | Sharpness: SQ metric defined by Zwicker and Fastl | [32] | |
| R | Roughness: SQ metric defined by Zwicker and Fastl | [32] |
References
- World Health Organization. Regional Office for Europe. Environmental Noise Guidelines for the European Region. Available online: https://www.who.int/europe/publications/i/item/9789289053563 (accessed on 12 December 2023).
- Langdon, F.; Buller, I.; Scholes, W. Noise from neighbours and the sound insulation of party floors and walls in flats. J. Sound Vib. 1983, 88, 243–270. [Google Scholar] [CrossRef]
- Sato, H.; Hirota, T.; Hiramitsu, A.; Tanaka, M. Subjective evaluation of floor impact sound of wood-frame construction dwellings in different living situation. In Proceedings of the INTERNOISE 2014—43rd International Congress on Noise Control Engineering: Improving the World Through Noise Control, Melbourne, Australia, 16–19 November 2014. [Google Scholar]
- Bard Hagberg, K. Management of Acoustics in Lightweight Structures. Ph.D. Thesis, Department of Construction Sciences, Lund University, Lund, Sweden, 2018. [Google Scholar]
- Rasmussen, B.; Machímbarrena, M. Building Acoustics Throughout Europe Volume 1: Towards a Common Framework in Building Acoustics Throughout Europe; COST: Brussels, Belgium, 2014. [Google Scholar]
- Rasmussen, B.; Rindel, J. Concepts for evaluation of sound insulation of dwellings—From chaos to consensus? In Proceedings of the Forum Acusticum Budapest 2005: 4th European Congress on Acustics, Budapest, Hungary, 29 August–2 September 2005. [Google Scholar]
- Rasmussen, B. Acoustic classification of dwellings—A growing diversity of sound insulation descriptors in national schemes in Europe. In Proceedings of the ICA 2022 24th International Congress on Acoustics, Aalborg, Denmark, 24 October 2022; pp. 199–206. [Google Scholar]
- ISO-717-2:2013; Acoustics—Rating of Sound Insulation Buildings and of Building Elements–Part 2: Impact Sound Insulation. International Organisation for Standardization: Geneva, Switzerland, 2017.
- Lokki, T. Sensory evaluation of concert hall acoustics. In Proceedings of the Meetings on Acoustics, Montreal, QC, Canada, 2–7 June 2013; AIP Publishing: Melville, NY, USA, 2013; Volume 19. [Google Scholar]
- Fenech, B.; Lavia, L.; Rodgers, G.; Notley, H. Development of a new ISO Technical Specification on non-acoustic factors to improve the interpretation of socio-acoustic surveys. Acoust. Bull. 2022, 48, 54–61. [Google Scholar]
- Vardaxis, N.G.; Bard, D. Review of acoustic comfort evaluation in dwellings: Part II—Impact sound data associated with subjective responses in laboratory tests. Build. Acoust. 2018, 25, 171–192. [Google Scholar] [CrossRef]
- Jeon, J.Y.; Jeong, J.; Vorlaender, M.; Thaden, R. Evaluation of Floor Impact Sound Insulation in Reinforced Concrete Buildings. Acta Acust. United Acust. 2004, 90, 313–318. [Google Scholar]
- Jeon, J.Y. Subjective Evaluation of Floor Impact Noise Based on the Model of ACF/IACF. J. Sound Vib. 2001, 241, 147–155. [Google Scholar] [CrossRef]
- Jeon, J.Y.; Jeong, J.; Ando, Y. Objective and Subjective Evaluation of Floor Impact Noise. J. Temporal Des. Archit. Environ. 2008, 2, 20. [Google Scholar]
- Jeon, J.Y.; Ryu, J.; Jeong, J.; Tachibana, H. Review of the Impact Ball in Evaluating Floor Impact Sound. Acta Acust. United Acust. 2006, 92, 777–786. [Google Scholar]
- Jeon, J.Y.; Sato, S.I. Annoyance caused by heavyweight floor impact sounds in relation to the autocorrelation function and sound quality metrics. J. Sound Vib. 2008, 311, 767–785. [Google Scholar] [CrossRef]
- Jeon, J.Y.; Lee, P.; Kim, J.; Yoo, S.Y. Subjective evaluation of heavy-weight floor impact sounds in relation to spatial characteristics. J. Acoust. Soc. Am. 2009, 125, 2987–2994. [Google Scholar] [CrossRef]
- Kim, J.; Ryu, J.; Jeon, J.Y. Effect of temporal decay on perception of heavy-weight floor impact sounds. J. Acoust. Soc. Am. 2013, 134, 2730–2738. [Google Scholar] [CrossRef]
- Jeon, J.Y.; Oh, S.M. Psychoacoustical evaluation of heavyweight floor impact sounds in apartment buildings. In Proceedings of the INTERNOISE 2014—43rd International Congress on Noise Control Engineering: Improving the World Through Noise Control, Melbourne, Australia, 16–19 November 2014. [Google Scholar]
- Ryu, J.; Sato, H.; Kurakata, K.; Hiramitsu, A.; Tanaka, M.; Hirota, T. Relation between annoyance and single-number quantities for rating heavy-weight floor impact sound insulation in wooden houses. J. Acoust. Soc. Am. 2011, 129, 3047–3055. [Google Scholar] [CrossRef] [PubMed]
- Gover, B.; Bradley, J.; Schoenwald, S.; Zeitler, B. Subjective ranking of footstep and low-frequency impact sounds on lightweight wood-framed floor assemblies. In Proceedings of the Forum Acusticum, Aalborg, Denmark, 27 June–1 July 2011; pp. 1–6. [Google Scholar]
- Bradley, J.; Zeitler, B.; Schoenwald, S. Objective and subjective assessment of lightweight wood-framed floor assemblies in response to footstep and low-frequency impact sounds. In Proceedings of the the Inter-Noise, Osaka, Japan, 4–7 September 2011; Volume 3, pp. 1–7. [Google Scholar]
- Subjective and objective evaluation of impact noise sources in wooden buildings. Build. Acoust. 2013, 20, 193–213. [CrossRef]
- Kylliäinen, M.; Hongisto, V.; Oliva, D.; Rekola, L. A laboratory listening experiment on subjective and objective rating of impact sound insulation of concrete floors. In Proceedings of the INTER-NOISE and NOISE-CON Congress and Conference Proceedings, Hamburg, Germany, 21–24 August 2016. [Google Scholar]
- Kylliäinen, M.; Hongisto, V.; Oliva, D.; Rekola, L. Subjective and Objective Rating of Impact Sound Insulation of a Concrete Floor with Various Coverings. Acta Acust. United Acust. 2017, 103, 236–251. [Google Scholar] [CrossRef]
- Öqvist, R.; Ljunggren, F.; Johnsson, R. Listening test of walking noise from 20 Hz in dwellings. In Proceedings of the INTER-NOISE and NOISE-CON Congress and Conference Proceedings, Hong Kong, China, 27–30 August 2017. [Google Scholar]
- Moher, D.; Liberati, A.; Tetzlaff, J.; Altman, D.G. Preferred reporting items for systematic reviews and meta-analyses: The PRISMA statement. BMJ 2009, 339. [Google Scholar] [CrossRef]
- Öqvist, R.; Ljunggren, F.; Johnsson, R. Walking sound annoyance vs. impact sound insulation from 20 Hz. Appl. Acoust. 2018, 135, 1–7. [Google Scholar] [CrossRef]
- Ljunggren, F.; Simmons, C.; Hagberg, K. Correlation between sound insulation and occupants’ perception – Proposal of alternative single number rating of impact sound. Appl. Acoust. 2014, 85, 57–68. [Google Scholar] [CrossRef]
- Kylliäinen, M. Rating the Impact Sound Insulation of Concrete Floors with Single-Number Quantities Based on a Psychoacoustic Experiment. Ph.D Thesis, Tampere University, Tampere, Finland, 2019. [Google Scholar]
- Park, S.H.; Lee, P.J.; Jeong, J.H. Effects of Noise Sensitivity on Psychophysiological Responses to Building Noise. Build. Environ. 2018, 136, 302–311. [Google Scholar] [CrossRef]
- Frescura, A.; Lee, P. Perception of combined indoor noise sources in lightweight buildings. In Proceedings of the International Congress on Acoustics, Aachen, Germany, 9–13 September 2019. [Google Scholar]
- Schütte, M.; Marks, A.; Wenning, E.; Griefahn, B. The development of the noise sensitivity questionnaire. Noise Health 2007, 9, 15–24. [Google Scholar] [CrossRef]
- Jo, H.I.; Jeon, J.Y. Downstairs Resident Classification Characteristics for Upstairs Walking Vibration Noise in an Apartment Building under Virtual Reality Environment. Build. Environ. 2019, 150, 21–32. [Google Scholar] [CrossRef]
- Jeong, J.H.; Park, S.H.; Lee, P.J. Single-Number Quantities of Heavyweight Impact Sound Insulation. Acta Acust. United Acust. 2019, 105, 5–8. [Google Scholar] [CrossRef]
- ISO-16283-2:2020; Acoustics—Field Measurements of Sound Insulation in Buildings and of Building Elements–Part 2: Impact Sound Insulation. International Organisation for Standardization: Geneva, Switzerland, 2020.
- Müller-Trapet, M.; Möller, K.; Choi, Y.J.; Zeitler, B. A subjective study of source types and rating methods for impact sounds in buildings. In INTER-NOISE and NOISE-CON Congress and Conference Proceedings; Institute of Noise Control Engineering: Wakefield, MA, USA, 2020. [Google Scholar]
- ISO-532:2017; Acoustics—Methods for Calculating Loudness–Part 1: Zwicker Method. International Organisation for Standardization: Geneva, Switzerland, 2017.
- Kylliäinen, M.; Virjonen, P.; Hongisto, V. Optimized Reference Spectrum for Rating the Impact Sound Insulation of Concrete Floors. J. Acoust. Soc. Am. 2019, 145, 407–416. [Google Scholar] [CrossRef] [PubMed]
- American Society for Testing Materials. Standard Classification for Determination of Signle Number Metrics for Impact Noise; ASTM International: West Conshohocken, PA, USA, 2021. [Google Scholar]
- Hongisto, V.; Virjonen, P.; Maula, H.; Saarinen, P.; Radun, J. Impact Sound Insulation of Floating Floors: A Psychoacoustic Experiment Linking Standard Objective Rating and Subjective Perception. Build. Environ. 2020, 184, 107225. [Google Scholar] [CrossRef]
- Amiryarahmadi, N.; Kropp, W. A virtual design studio for low frequency impact sound from walking. Acta Acust. 2021, 5, 40. [Google Scholar] [CrossRef]
- Hagberg, K.; Larsson, K.; Bard, D. AkuLite—A research project to strengthen light weight structures. In Proceedings of the 39th International Congress on Noise Control Engineering 2010, INTER-NOISE 2010, Lisbon, Portugal, 13–16 June 2010; pp. 6032–6040. [Google Scholar]
- Shin, H.K.; Park, S.H.; Kim, M.J.; woo Kim, K. A study on subjective response to heavy-weight impact sound through representative spectrum analysis: A case study in South Korea. Appl. Acoust. 2022, 188, 108562. [Google Scholar] [CrossRef]
- Frescura, A.; Lee, P.J.; Soeta, Y.; Ariki, A. Effects of Spatial Characteristics of Footsteps Sounds and Non-Acoustic Factors on Annoyance in Lightweight Timber Buildings. Build. Environ. 2022, 222, 109405. [Google Scholar] [CrossRef]
- Kim, S.; Kim, J.; Lee, S.; Song, H.; Song, M.; Ryu, J. Effect of Temporal Pattern of Impact Sound on Annoyance: Children’s Impact Sounds on the Floor. Build. Environ. 2022, 208, 108609. [Google Scholar] [CrossRef]
- Panosso, A.D.S.; Paul, S. Subjective Evaluation of Floor Impact Noise Using the Tapping Machine and a Non-Standardized Source. Acta Sci. Technol. 2022, 44, e59025. [Google Scholar] [CrossRef]
- Otto, N.; Amman, S.; Eaton, C.; Lake, S. Guidelines for Jury Evaluations of Automotive Sounds. J. Sound Vib. 2001, 35, 24–47. [Google Scholar] [CrossRef]
- Frescura, A.; Lee, P.J.; Schöpfer, F.; Schanda, U. Correlations between Standardised and Real Impact Sound Sources in Lightweight Wooden Structures. Appl. Acoust. 2021, 173, 107690. [Google Scholar] [CrossRef]
- Lee, P.J.; Kim, J.H.; Jeon, J.Y. Psychoacoustical Characteristics of Impact Ball Sounds on Concrete Floors. Acta Acust. United Acust. 2009, 95, 707–717. [Google Scholar] [CrossRef]
- Swedish Institute for Standards. SS 25267:2015; Acoustics—Sound Classification of Spaces in Buildings—Dwellings. Swedish Institute for Standards: Stockholm, Sweden, 2015. [Google Scholar]
- Larsson, K.; Forssén, J.; Kropp, W.; Brunskog, J.; Ljunggren, S.; Bard, D.; Sandberg, G.; Ljunggren, F.; Ågren, A.; Hallström, O.; et al. Acoustics in Wooden Buildings–State of the Art 2008 Summary of a Swedish Cooperation Project. In Proceedings of the Joint Baltic-Nordic Acoustics Meeting. Reykjavik, Iceland, 17–19 August 2008; pp. 17–19. [Google Scholar]
- Reynders, E.P.; Hoorickx, C.V. Uncertainty quantification of diffuse sound insulation values. J. Sound Vib. 2023, 544, 117404. [Google Scholar] [CrossRef]
- Dolezal, F.; Reichenauer, A.; Wilfling, A.; Neusser, M.; Prislan, R. Recording, Processing, and Reproduction of Vibrations Produced by Impact Noise Sources in Buildings. Acoustics 2024, 6, 97–113. [Google Scholar] [CrossRef]
- International Organisation for Standardization. Acoustics—Soundscape–Part 2: Data Collection and Reporting Requirements; International Organisation for Standardization: Geneva, Switzerland, 2018. [Google Scholar]
- Skoda, S.; Müller-Trapet, M.; Choi, Y.J.; Cunha, I.B.D.; Mahn, J. Annoyance Evaluation of Impact Sounds on Timber Floors in Different Listening Test; p. 8.
- Kreibig, S. Autonomic Nervous System Activity in Emotion: A Review. Biol. Psychol. 2010, 84, 394–421. [Google Scholar] [CrossRef] [PubMed]
- Park, S.H.; Lee, P. Effects of floor impact noise on people—Annoyance and physiological responses. In Proceedings of the 12th ICBEN Congress on Noise as a Public Health Problem, Zurich, Switzerland, 18–22 June 2017. [Google Scholar]
Disclaimer/Publisher’s Note: The statements, opinions and data contained in all publications are solely those of the individual author(s) and contributor(s) and not of MDPI and/or the editor(s). MDPI and/or the editor(s) disclaim responsibility for any injury to people or property resulting from any ideas, methods, instructions or products referred to in the content. |
© 2025 by the authors. Licensee MDPI, Basel, Switzerland. This article is an open access article distributed under the terms and conditions of the Creative Commons Attribution (CC BY) license (https://creativecommons.org/licenses/by/4.0/).
Share and Cite
Vrhovnik, M.M.; Prislan, R. Recent Developments in Investigating and Understanding Impact Sound Annoyance—A Literature Review. Acoustics 2025, 7, 21. https://doi.org/10.3390/acoustics7020021
Vrhovnik MM, Prislan R. Recent Developments in Investigating and Understanding Impact Sound Annoyance—A Literature Review. Acoustics. 2025; 7(2):21. https://doi.org/10.3390/acoustics7020021
Chicago/Turabian StyleVrhovnik, Martina Marija, and Rok Prislan. 2025. "Recent Developments in Investigating and Understanding Impact Sound Annoyance—A Literature Review" Acoustics 7, no. 2: 21. https://doi.org/10.3390/acoustics7020021
APA StyleVrhovnik, M. M., & Prislan, R. (2025). Recent Developments in Investigating and Understanding Impact Sound Annoyance—A Literature Review. Acoustics, 7(2), 21. https://doi.org/10.3390/acoustics7020021