Abstract
Nonlinear acoustic effects become prominent when acoustic waves propagate through an orifice, particularly at higher pressure amplitudes, potentially generating vortex rings and transferring acoustic energy into the flow. This study develops and validates a predictive theoretical model for acoustic behaviour both within and outside an orifice under linear conditions. Using transfer matrices, the model predicts the external acoustic field, while finite element numerical simulations are employed to validate the theoretical predictions in the linear regime. The experimental setup includes an impedance tube with a plate and orifice, supported by a custom-built system, where a loudspeaker generates acoustic waves. A single microphone is used to measure acoustic particle velocity and characterize the phenomenon, enabling the identification of the onset of nonlinearity. The experimental data show good agreement with the linear theoretical predictions. This work represents the first observation of nonlinear effects in a free-field environment within a semi-anechoic chamber, eliminating reflections from external surfaces, and demonstrates the efficacy of a purely acoustic-based system (speaker and two microphones) for evaluating speaker velocity and the resulting velocity within the orifice.
1. Introduction
Acoustic streaming is a phenomenon where acoustic energy is converted into steady fluid flow due to the viscosity and inertia of the medium, resulting in dissipation during sound wave propagation. This dissipation causes a pressure gradient along the direction of wave propagation, which leads to mass flow. Various types of acoustic streaming have been studied, including Rayleigh streaming (largely diffused in thermoacoustic devices) [1,2,3], Eckert streaming [4], and Gedeon streaming [5,6,7,8]. Each of these phenomena arises from different simplifications of the Navier–Stokes equations, making the underlying processes complex to interpret. For instance, Rayleigh’s theory is limited to low-power sources and slow-speed streaming, while higher-power sources introduce significant inertial effects [9].
A particularly relevant phenomenon in this context is synthetic jets (or Jet-Driven Streaming), which occurs when an acoustic wave interacts with an orifice [10,11]. Synthetic jets are created by the motion of a diaphragm, piston, or loudspeaker, generating vortex trains without the need for mass flux from an external source. This characteristic differentiates synthetic jets from conventional jets and has led to increased interest in their application for aerodynamic flow control. Recent advancements highlight their potential for drag reduction, lift enhancement, mixing augmentation, flow-induced noise suppression, and propulsion systems for small vehicles, particularly in underwater environments [12,13,14,15,16,17,18,19,20,21,22].
Research in the field has provided valuable insights into acoustic behaviour in ducts with orifice plates. Horner and Hu [23] explored higher-order mode propagation in ducts using a hybrid decomposition approach to address complexities arising when wavelengths are comparable to the duct dimensions. Gaeta and Ahuja [24] investigated the effect of non-circular orifice shapes on acoustic impedance, noting deviations from circular orifices that impact resonant liner performance. Han et al. [25] used computational fluid dynamics to derive nonlinear acoustic impedance of circular orifices, presenting fitting formulas validated by experimental data. Komkin, Bykov, and Moskalenko [26] provided measurements of jet parameters in nonlinear regimes, offering insights into variations in jet velocity with distance from the orifice.
This study introduces a theoretical model to predict acoustic behaviour both within and outside an orifice under linear conditions, utilizing transfer matrices. The model is validated through extensive numerical simulations and experimental analysis. An impedance tube with a plate and orifice, supported by a custom-built system, is used for experiments. Acoustic waves are generated by a loudspeaker within the tube, and particle velocity is measured using a single-microphone method to characterize the acoustic phenomena. This setup allows for a detailed comparison of theoretical predictions with experimental data and facilitates the identification of nonlinear behaviour. Notably, this study provides the first observation of nonlinear effects in a free-field environment within a semi-anechoic chamber, ensuring minimal influence from external reflections.
This paper is structured as follows: Section 2 presents the theoretical background, including Ingård’s formulation for deriving critical velocities for the onset of nonlinear phenomena. Section 3 describes the experimental setup, the modelling approach using transfer matrices, and validation through finite element simulations. Section 4 discusses the experimental results obtained in the semi-anechoic chamber. Finally, Section 5 concludes the study with key findings and implications.
2. Theoretical Background
In 1950, Ingård [27] utilized standing waves in an acoustically driven circular tube to induce an oscillating velocity field on a holed plate positioned near a pressure node. This setup allowed him to observe the formation of jets from trains of vortex rings on both sides of the orifice. Ingård’s experimental setup consisted of a steel plate with a circular orifice, placed between two cylindrical sections of tubing with an interior diameter of 7.62 cm (3 inches). These tubes were connected to an impedance tube of the same diameter. The acoustic impedance of the orifice was determined using the conventional standing-wave measurement technique within the tube. To visualize the streaming around the orifice, smoke particles were introduced into the cylindrical section immediately following the impedance tube. The study encompassed 25 orifices, varying in thickness from 0.5 mm to 20 mm and in diameter from 3.5 mm to 20 mm. The frequency range of the experiments spanned from 100 Hz to 1000 Hz, with particle velocities through the orifice ranging from a few centimeters per second to 700 cm/s. From these observations, Ingård developed detailed phase diagrams that characterized the behaviour of the vortex-induced jets. The phase diagrams reveal four distinct types of circulation based on sound amplitude and frequency for a fixed orifice diameter and thickness. Figure 1a,b report the phase diagrams for two orifices characterized by a thickness of 0.05 cm and a diameter of 0.5 cm and 1.0 cm, respectively. It is worth noticing that at very low frequencies or minimal thicknesses, the fluid behaviour can transition directly from Region 1 to Region 4. It is particularly noteworthy that the ’eutectic point’ approaches the origin as the orifice diameter increases, making direct transitions from Region 1 to Region 4 possible only for very small orifices, specifically those with a radius much smaller than the viscous boundary layer, which depends on the frequency. In Region 1, two centers of circulation are visible just outside the edges of the orifice at very low sound intensities.
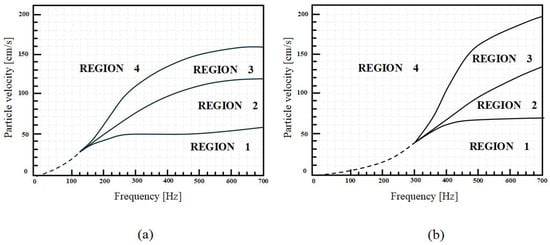
Figure 1.
Frequency Phase diagrams developed by Ingård [27] for an orifice with 0.05 cm thickness and a diameter of (a) 0.5 cm and (b) 1.0 cm.
In Region 2, the outflow gradually disappears, and the inflow becomes pure as sound intensity increases sufficiently. This type of flow generates very high stream velocities, resulting in turbulence at the orifice edges.
The turbulence marks the beginning of Region 3, characterized by an exchange of particles between the streams on either side of the orifice. Pulsatory effects start to overlay the streams but are not yet predominant. In Region 3, streaming occurs at higher intensity levels, and pulsations become increasingly significant. When the intensity reaches a sufficiently high level, a true pulsatory jet forms, causing complete turbulence within the tube.
As the sound level continues to rise, a continuous jet emerges on one side of the orifice. With further increases, the jet appears on the other side as well. When symmetry is achieved, Region 4 is reached. Therefore, the device generating the vortex rings is essentially an orifice. When a steady flow pass through the orifice, it experiences a pressure drop. Due to flow separation and turbulence, this pressure loss is proportional to the kinetic energy in the orifice , where is the acoustic particle velocity in the orifice. The orifice acts as an equivalent acoustic resistance for sound waves, leading to a quasi-static modulation of speed and corresponding pressure loss when acoustic nonlinearity arises. To accurately predict this phenomenon, the transition between linear and nonlinear acoustic conditions needs to be identified. Ingård developed an empirical correlation for this purpose, defining a critical velocity computed as follows [28]:
Here, is the angular frequency of the sound wave; is the kinematic viscosity . t and d are the thickness and the diameter of the orifice, respectively. Additional considerations made by Ingård are reported in Appendix A.
3. Materials and Methods
The following section introduces the innovative experimental setup designed to observe acoustic nonlinearities arising from propagation within a pore. A predictive theoretical model of the external acoustic field under linear conditions was then developed using transfer matrices. Finite element numerical simulations were conducted to validate the theoretical model in the linear regime. This approach allows for a comparison between the experimental data and the linear theoretical predictions, enabling the identification of the onset of nonlinear behaviour.
3.1. Experimental Setup
The experimental setup consists of an impedance tube with a diameter of 100 mm and a length of 410 mm (Figure 2). The sound pressure in the tube is generated by a loudspeaker Hertz HV100 of 100 mm diameter and a max power of 100 W. At the end of the impedance tube is a holed plate of 3 mm thickness with a diameter of 3 mm.The plate and flange are made of 3 mm thick aluminium and are held together by 8 M4 stainless steel threaded bars, as shown in Figure 3. Particular attention was given to ensuring that the orifice maintained a sharp edge during the fabrication process, as this is a crucial parameter for studying the onset of nonlinearities. The sharp discontinuity in the cross-section caused by the orifice played a key role in triggering nonlinear acoustic effects, while a smooth-edged orifice could introduce additional variables, such as an altered surface-to-fluid volume ratio, potentially leading to uncontrolled nonlinear phenomena. For the measurements, the tube was placed in a semi-anechoic chamber to avoid external interference and to replicate free-field conditions (Figure 4).
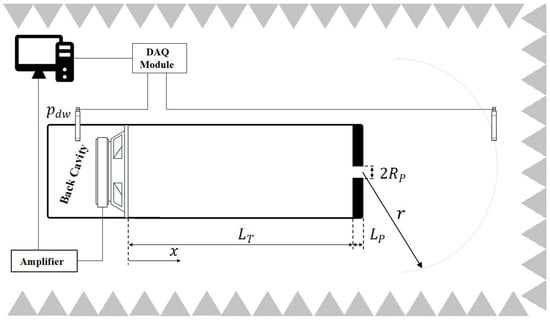
Figure 2.
Schematic representation of the experimental setup in a semi-anechoic chamber. The setup includes a speaker emitting sound waves into a plane wave tube with a perforated plate at the end. Two microphones are positioned within the setup: one for measuring the volume velocity of the speaker and the other for detecting acoustic pressure at a specific point in the external field.
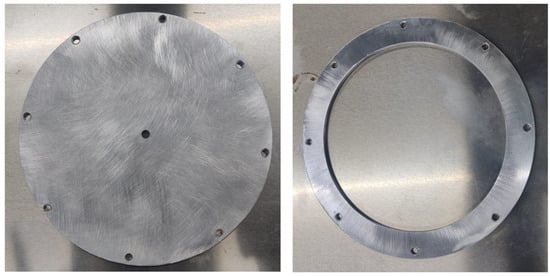
Figure 3.
The flange and plate with the orifice.
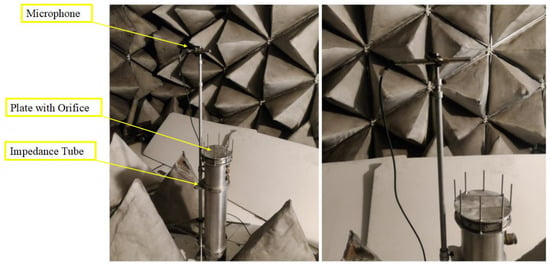
Figure 4.
Experimental setup placed in the semi-anechoic chamber; microphone placed 45 cm from the orifice.
The measurement system was based on a National Instruments ADC NI PXIe-1073, Austin, TX, USA, Stati Uniti controlled by a LabView® VI, which commands the input voltage of the MESA® Power Booster V11 amplifier that feeds the speaker. A precise PCB Piezoelectronic® Model 377C20 condenser microphone, connected to the Microphone Preamplifier Model 426E01, was used for the measurements. Before each test cycle, the calibration of the ½-inch microphone was verified using a G.R.A.S. calibrator (114 dB @ 1000 Hz). This procedure allowed for precise determination of the microphone’s sensitivity, enabling accurate assessment of the acoustic pressure from the signal as picked up. The speaker velocity was derived from the acoustic pressure measured in the speaker back cavity [29,30]. Thanks to this method, the speaker volume velocity could be carried out with the measurement of the acoustic pressure in the back cavity of the speaker (Figure 5).
where and are the volume of the speaker back cavity and the acoustic pressure in the back cavity, respectively. and are the specific heat ratio and the static pressure. is the imaginary unit.
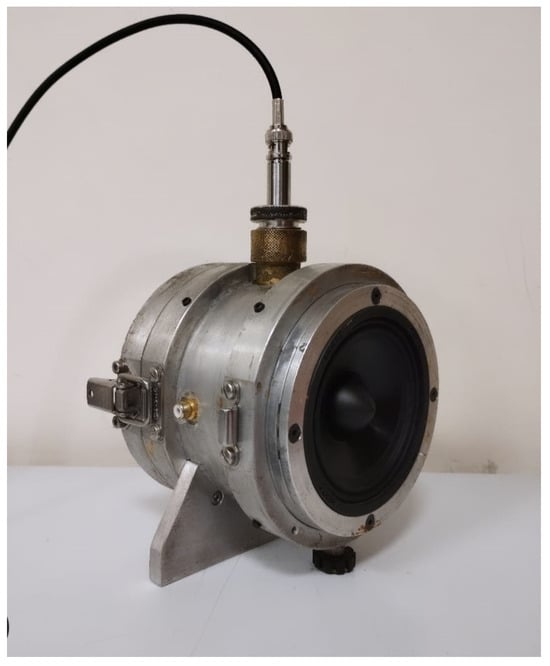
Figure 5.
Loudspeaker setup including its back cavity and an internal microphone. The microphone is positioned inside the back cavity to measure the acoustic pressure necessary for determining the speaker’s velocity.
3.2. The Transfer Matrix Method
The transfer matrix methodformulation implies the hypothesis of plain wave propagation, so it is suitable to describe the acoustic linear behaviour inside the device if the frequency remains under the frequency of the first transversal mode of the tube (, and the sound speed). Therefore, the transfer matrix method links the acoustic state variables, such as the acoustic pressure p and the acoustic volume velocity U, between the inlet and outlet of a certain element of the domain where the fluid properties are uniform, as in the following equation [31]:
Here, L and A are the length and the cross-sectional area of the considered element, k is the acoustic wavenumber, and is the characteristic impedance of the medium. The propagation within the tube can be considered inviscid and therefore lossless because the tube radius is much larger than the thermal and viscous boundary layers [32], defined, respectively, as
Here, , and are the thermal conductivity, the dynamic viscosity, and the static density of the fluid, respectively (in this study, air at ambient pressure and temperature were used as fluid media). Consequently, in the tube the acoustic wavenumber and the characteristic impedance are equal to the ones in free air:
On the other hand, thermal and viscous losses are far from negligible inside the orifice. Therefore, using Equivalent Gas modelling, the losses can be taken into account by using appropriate complex quantities for the equivalent medium, such as the complex density and bulk modulus (or the complex wavenumber and the complex characteristic impedance ) [33]. In the case of circular pore geometry, they can be written as
where and are the Bessel function of first and zero order, respectively.
Furthermore, due to the section discontinuity between the tube and the hole , an end correction matrix between the tube and the hole matrix has to be added,
with and . Therefore, the Total Transfer Matrix is evaluated as follows:
Here, , and are the transfer matrix of the tube, end correction, and the orifice, as seen, respectively, in Equations (3) and (9). Furthermore, at the outlet section of the hole, the Radiation Impedance can be assessed though the Levine and Schwinger relation [10]
where . Therefore, this setup is characterized by two boundary conditions (the origin of the reference system is fixed to the representative surface of the acoustic source as in Figure 6):
- , where is the acoustic volume velocity fixed by the acoustic source (i.e., the loudspeaker);
- , due to Radiation Impedance, which fixes the values of the ratio between the acoustic pressure and volume velocity at the outlet section of the hole.
This latter condition allows one to assess the acoustic pressure at the beginning section of the tube as follows:
are the elements of the Total Transfer Matrix, Equation (10). Once the acoustic fields at the outlet section of the hole are known, it is possible to compute the acoustic pressure in the external domain using the Radiating Piston Model. When , it can be proved that the Radiating Piston Model reduces itself to a simple monopole source [34]. More details of the mathematical derivation are reported in Appendix B. Therefore, in this case the sound field outside the orifice can be assessed by applying the follow formulation:
where r is the distance between the orifice and the field point. To ensure the reliability of the theoretical model, numerical simulations of the same device were carried out.
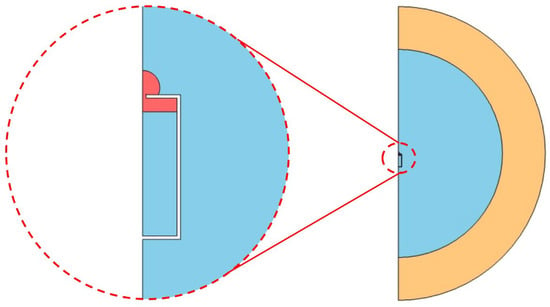
Figure 6.
Computational Domain: in light blue, the lossless region, in red the thermoviscous region corresponding to the orifice and its inlet and outlet near region (zoomed section on the left), in light orange the Perfectly Matched Layer non-reflecting domain.
3.3. Numerical Simulations
The numerical simulations were conducted using a finite element method to verify and validate the theoretical model developed based on the transfer matrix method. These simulations solve the wave equation in a coupled manner (neglecting thermal and viscous dissipative effects) within the fluid domain, which includes the tube and the external volume outside the hole, alongside the linearized Navier–Stokes equations within the fluid domain of the pore where thermoviscous losses are considered non-negligible (in Figure 6, the blue and the red domain, respectively). The axial symmetry of the problem was exploited to scale the geometry into a 2D axisymmetric model, significantly reducing the number of mesh elements and, consequently, the number of degrees of freedom (DoFs) to be solved compared to a 3D model [35,36]. At the boundary of the external domain, sufficiently far from the outlet hole (approximately 20 times the tube radius, ), a domain layer known as a Perfectly Matched Layer (PML) was implemented. This absorbing domain approximates the condition of the free field outside the hole, preventing any contribution from reflections of potential confining walls of the global domain.
In meshing the fluid domain, particular attention was given to the orifice zone, where the thermoviscous losses cannot be neglected. In this region, a mesh refinement near the wall to catch the boundary layer was applied. It consists of 20 layers of thickness based on 1/10 times the viscous boundary layer thickness , as reported in Figure 7. Mesh parameters for thermoviscous physics have been thoroughly explored and validated in the literature, as highlighted by Zielinski et al. [36].
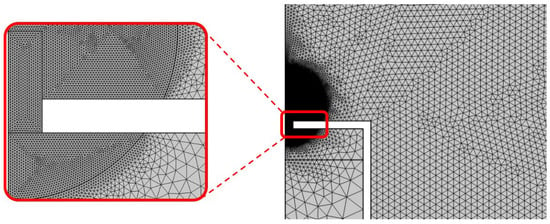
Figure 7.
Mesh used in the numerical simulations. On the left, the refined grid of the narrow region of the orifice is highlighted.
At the boundary where the acoustic source is located, the boundary condition was set to an acoustic volume velocity with a unit value. In Figure 8, the colormap of the acoustic pressure and acoustic velocity are reported for an operating frequency of 400 Hz. From the analyses of the velocity field near the wall region of the orifice, we can highlight the region of greatest viscous stress for the fluid which will be responsible for triggering the nonlinear phenomena (Figure 8, left). Meanwhile, the right panel of Figure 8 highlights the spherical shape of the acoustic pressure field, providing a clear indication of monopole-like radiation outside the hole. This behaviour becomes more pronounced at lower frequencies.
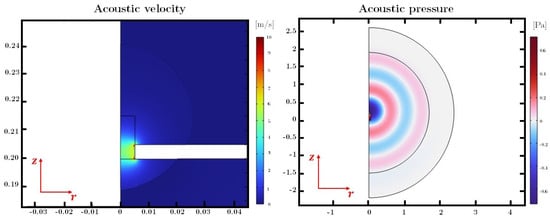
Figure 8.
On the (left), the colormap of the acoustic velocity near the orifice region. On the (right), the colormap of the acoustic pressure all over the fluid domain.
Figure 9 and Figure 10 report a comparison of the sound pressure outside the orifice in more than one point of the external domain placed on a different angle and radius. One can also note a perfect spherical wave shape (Figure 9). The theoretical–numerical agreement is also evident in the spreading of a spherical wave with distance r, which follows the well-known decay law, as in Figure 10. These results prove that the assumption of a point monopole made above well suits the problem without suffering losses in accuracy.
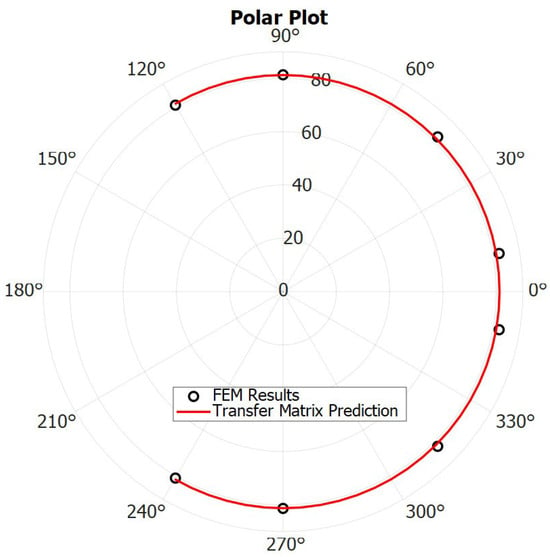
Figure 9.
Comparison between numerical simulations and the Transfer Matrix Approach reported in terms of polar plot of the acoustic pressure at a distance of 1 m from the orifice.
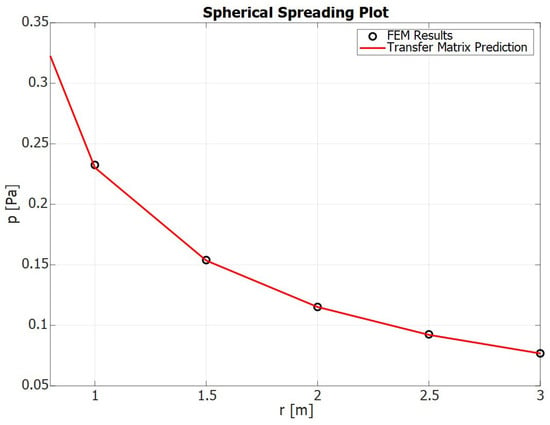
Figure 10.
Comparison between numerical simulations and the Transfer Matrix Approach reported in terms of acoustic pressure for the same angle (90°) at different distances from the orifice.
Figure 11 highlights the differences between theoretical and numerical trends for the Sound Pressure Level evaluated in (, with ) whereby the theoretical model was developed and validated. This is especially important because it allows us to predict the linear behaviour of the acoustic fields through an orifice, and, as a consequence, to verify when the linearity no longer maintained.
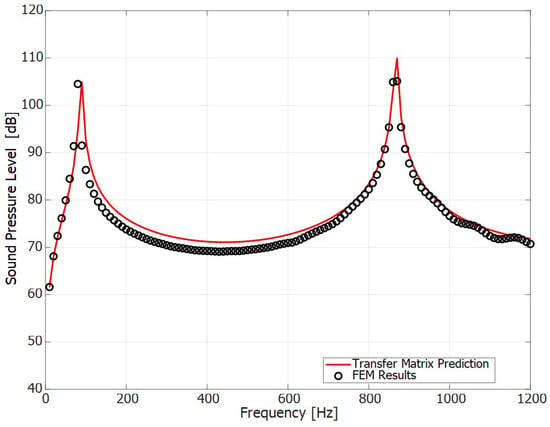
Figure 11.
Comparison between numerical simulations and the Transfer Matrix Approach reported in terms of Sound Pressure Level (1 m, 90°) against the frequency axis.
4. Results and Discussion
The experimental campaign began by setting the frequency to the resonance frequency of the speaker’s back cavity (189 Hz) to maximize the volume velocity output. In Appendix C, the procedure to assess the resonance frequency is reported. Subsequently, additional tests were conducted at 100 Hz to demonstrate the effective functionality of the model. The amplifier gain was then adjusted to enable the speaker to output a pure tone at the set operating frequency, varying between 0.1 and 54 mV. The two microphones detected the pressure within the speaker cavity, allowing the volume velocity and the acoustic pressure in the external field to be determined, as shown in Equation (2). The latter measurement was crucial for analyzing and observing nonlinear phenomena induced by the interaction between the increasingly intense acoustic field (as the amplifier gain increased) and the narrow region created by the presence of the hole. In the first cycle of the test, the pressure in the back cavity was measured to check if nonlinear effects related to the speaker (such as possible distortion) occur when the pressure amplitude increases. As reported in Figure 12, a perfect linear behaviour of the speaker with the supply voltage was found. The high level of acoustic pressure achieved is justified by the fact that the back cavity of the speaker is characterized by a volume of . Therefore, important considerations can be made looking to the graph in Figure 13. Here, the experimental acoustic pressure is reported against the acoustic particle velocity . This latter parameter was assessed through the Transfer Matrix Approach once the boundary conditions of the system were known . This parameter serves as a reference for assessing the onset of nonlinear phenomena. As highlighted by Ingård, when the velocity within the hole becomes significantly higher (), nonlinear effects begin to play a substantial role. The aim of this work has been to develop a setup that allows for the experimental evaluation of the speaker velocity and the resulting velocity within the hole using a completely acoustic-based system (a speaker and two microphones, without PIV or other instruments). Additionally, nonlinearities are observed here for the first time in a free-field environment within a semi-anechoic chamber, thus eliminating the influence of reflections from external surfaces. As demonstrated in numerical simulations, it is also possible to rule out the contribution of reflections from the metal plate surrounding the hole, since the predicted acoustic field exhibits a monopole distribution, supporting the validity of this assumption. As it can be seen from Figure 13, good agreement was found between experimental data and the prediction in the linear regime. Furthermore, Ingård’s formulation of the velocity threshold, Equation (2), was verified through the experiments for both the selected frequencies, 100 Hz and 189 Hz. The measurements were repeated four times for each frequency, allowing the experimental data to be represented with error plots that account for both the mean and the standard deviation of the four measurements. Notably, in the nonlinear regime, the data dispersion shows greater deviation. This increased variability is attributed to the high sensitivity to fluid dynamic conditions, such as local vortex formation and unidirectional flow, which can vary stochastically. In contrast, in the linear regime, where no phenomena alter the wave propagation in the free field, the data dispersion is considerably more controlled, as expected. Therefore, the discrepancy between the theoretical model and the experimental results in the nonlinear regime can provide an indication of the acoustic energy that is partially converted into rotational kinetic energy, forming vortices exiting the orifice and partially entering translational kinetic energy associated with the flow velocity, which will be referred to as a synthetic jet.
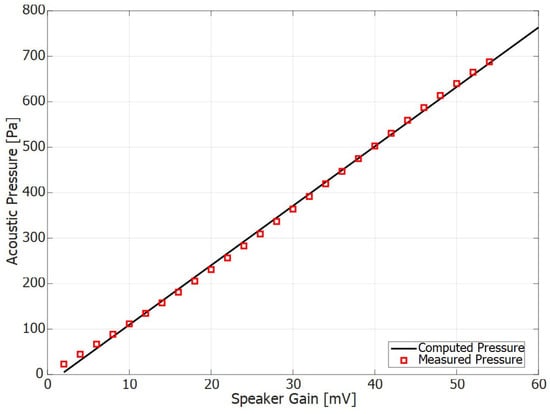
Figure 12.
Experimental acoustic pressure in the speaker back cavity against the Voltage Gain.
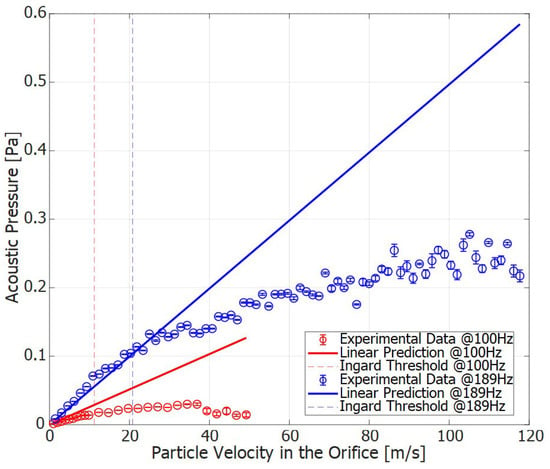
Figure 13.
Error plot showing the mean and standard deviation of measurements repeated four times for each frequency. The experimental results report the acoustic pressure against the acoustic velocity in the orifice.
5. Conclusions
In this study, a comprehensive theoretical model to predict the acoustic behaviour both within and outside an orifice under linear conditions was developed. By integrating numerical simulations and experimental analysis, the model effectively characterizes the complex interactions of synthetic jets, specifically the nonlinear acoustic effects generated when sound waves traverse an orifice. The experimental setup, which included an impedance tube with a plate and orifice, allowed for precise measurements using a single-microphone acoustic method. This setup validated the theoretical model and demonstrated a strong correlation between the predicted and observed data in linear regime. The ability to predict wave velocity and the onset of nonlinear phenomena using Ingård’s formulation further strengthens the model’s robustness. Future work could explore the impact of different orifice geometries and varying acoustic source conditions to further refine the model. Additionally, investigating the integration of synthetic jets into more complex systems could provide valuable insights into their broader applicability and efficiency. In conclusion, this study provides a robust framework for observing, characterizing nonlinear acoustic effects in orifices, and predicting the onset conditions.
Author Contributions
Conceptualization, E.D.G., R.D.L. and R.D.; methodology, E.D.G., R.D.L. and R.D.; software, R.D.; validation, E.D.G., R.D.L. and R.D.; formal analysis, E.D.G., R.D.L. and R.D.; investigation, E.D.G., R.D.L. and R.D.; resources, R.D.; data curation, E.D.G.; writing—original draft preparation, E.D.G.; writing—review and editing, E.D.G., R.D.L. and R.D.; visualization, E.D.G., R.D.L. and R.D.; supervision, R.D. All authors have read and agreed to the published version of the manuscript.
Funding
This research received no external funding.
Data Availability Statement
The data presented in this study are available in the article.
Conflicts of Interest
The authors declare no conflicts of interest.
Appendix A. Ingård’s Considerations on Critical Velocity in Acoustic Orifices
The critical velocity equation, given by Equation (2), can be derived from Ingard’s assumption that, at high amplitudes, the Sound Pressure Level and the volume velocity in the orifice are approximately [28]
with a corresponding orifice resistance:
This relationship is based on Bernoulli’s Law and the assumption that the sound pressure in the orifice is a fraction of the sound pressure in the cavity. Thus,
where and since the pressure in the orifice will be nearly the average of the sound pressure on both sides of the orifice. This yields
and
This result aligns with the case where . However, for a more general expression of the resistance, R should be multiplied by . Experimentally, it is observed that is valid when , which corresponds to approximately at 200 Hz. From a physical perspective, this relation can be interpreted as the condition under which the kinetic force dominates over the viscous force.
Appendix B. Radiating Piston Model
The sound radiation propagating in the free field is modelled in spherical coordinates by the following relation [34]:
In the limit , , and the result corresponds to
with . The term containing the Bessel function is a far-field directivity factor, which can be physically explained as interference between the fields radiated by the distributed elementary sources. Briefly, when , the sound pressure is nearly independent of , and the radiation is omnidirectional; for , the sound field is much stronger along and near the polar axis, with minimal radiation in the lateral direction.
Appendix C. Assessment of Back Cavity Resonance in a Speaker System
The cavity resonance of the speaker’s back cavity refers to the volume of the speaker’s enclosure (Figure 5). To determine this resonance, a measurement was performed using a logarithmic sweep signal. The acoustic pressure inside the cavity was recorded by a microphone synchronized with the signal generated by the speaker. By applying an FFT to the recorded signal, the resonance frequency of this coupled cavity–speaker system was identified. As shown in Figure A1, the frequency corresponding to the highest acoustic pressure within the cavity is 189 Hz. Consequently, according to Equation (2), at this frequency, the volumetric velocity generated by the speaker reaches its maximum.
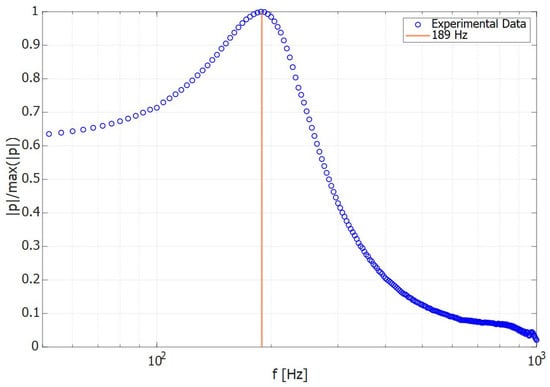
Figure A1.
Frequency response of the speaker’s back cavity showing the resonance peak.
References
- Vainshtein, P. Rayleigh streaming at large Reynolds number and its effect on shear flow. J. Fluid Mech. 1995, 285, 249–264. [Google Scholar] [CrossRef]
- Riley, N. Acoustic streaming. Theor. Comput. Fluid Dyn. 1998, 10, 349–356. [Google Scholar] [CrossRef]
- Di Giulio, E.; Di Meglio, A.; Massarotti, N.; Romano, R.A.; Dragonetti, R. Oriented fibers stacks for thermoacoustic devices. Appl. Energy 2024, 373, 123959. [Google Scholar] [CrossRef]
- Eckert, E.R. Cross transport of energy in fluid streams. WäRme- Stoffübertragung 1987, 21, 73–81. [Google Scholar] [CrossRef]
- Swift, G.W.; Ward, W.C. Simple harmonic analysis of regenerators. J. Thermophys. Heat Transf. 1996, 10, 652–662. [Google Scholar] [CrossRef]
- Di Meglio, A.; Massarotti, N. CFD Modeling of Thermoacoustic Energy Conversion: A Review. Energies 2022, 15, 3806. [Google Scholar] [CrossRef]
- Di Meglio, A.; Massarotti, N.; Rolland, S.; Nithiarasu, P. Analysis of non-linear losses in a parallel plate thermoacoustic stack. Int. J. Numer. Methods Heat Fluid Flow 2024, 34, 353–377. [Google Scholar] [CrossRef]
- Didden, N. On the formation of vortex rings: Rolling-up and production of circulation. Z. Angew. Math. Phys. ZAMP 1979, 30, 101–116. [Google Scholar] [CrossRef]
- Lighthill, S.J. Acoustic streaming. J. Sound Vib. 1978, 61, 391–418. [Google Scholar] [CrossRef]
- Levine, H.; Schwinger, J. On the Radiation of Sound from an Unflanged Circular Pipe. Phys. Rev. 1948, 73, 383. [Google Scholar] [CrossRef]
- Holman, R.; Utturkar, Y.; Mittal, R.; Smith, B.L.; Cattafesta, L. Formation Criterion for Synthetic Jets. AIAAJ 2012, 43, 2110–2116. [Google Scholar] [CrossRef] [PubMed]
- Trávníček, Z.; Broučková, Z.; Kordík, J. Formation Criterion for Axisymmetric Synthetic Jets at High Stokes Numbers. AIAA J. 2012, 50, 2012–2017. [Google Scholar] [CrossRef]
- Calise, F.; Cappiello, F.L.; Cimmino, L.; d’Accadia, M.D.; Vicidomini, M. Integration of photovoltaic panels and solar collectors into a plant producing biomethane for the transport sector: Dynamic simulation and case study. Heliyon 2023, 9, e14681. [Google Scholar] [CrossRef] [PubMed]
- Chiatto, M.; Palumbo, A.; de Luca, L. Design approach to predict synthetic jet formation and resonance amplifications. Exp. Therm. Fluid Sci. 2019, 107, 79–87. [Google Scholar] [CrossRef]
- Utturkar, Y.; Holman, R.; Mittal, R.; Carroll, B.; Sheplak, M.; Cattafesta, L. A jet formation criterion for synthetic jet actuators. In Proceedings of the 41st Aerospace Sciences Meeting and Exhibit, Reno, NV, USA, 6–9 January 2003. [Google Scholar] [CrossRef]
- Kewalramani, J.A.; Zou, Z.; Marsh, R.W.; Bukiet, B.G.; Meegoda, J.N. Nonlinear Behavior of High-Intensity Ultrasound Propagation in an Ideal Fluid. Acoustics 2020, 2, 147–163. [Google Scholar] [CrossRef]
- Komkin, A.; Bykov, A.; Saulkina, O. Evaluation of the Oscillation Velocity in the Neck of the Helmholtz Resonator in Nonlinear Regimes. Acoustics 2022, 4, 564–573. [Google Scholar] [CrossRef]
- Gesteira, L.G.; Uche, J.; Cappiello, F.L.; Cimmino, L. Thermoeconomic Optimization of a Polygeneration System Based on a Solar-Assisted Desiccant Cooling. Sustainability 2023, 15, 1516. [Google Scholar] [CrossRef]
- Mayer, A.P.; Mayer, E.A.; Mayer, M.; Ruile, W.; Chauhan, V.; Forster, T.; Wagner, K.C. FEM Modeling of Electro-Acoustic Nonlinearities in Surface Acoustic Wave Devices: A Methodological Review. Acoustics 2023, 5, 759–787. [Google Scholar] [CrossRef]
- Sergeev, D.; V’yushkina, I.; Eremeev, V.; Stulenkov, A.; Pyalov, K. Investigations into the Approaches of Computational Fluid Dynamics for Flow-Excited Resonator Helmholtz Modeling within Verification on a Laboratory Benchmark. Acoustics 2023, 6, 18–34. [Google Scholar] [CrossRef]
- Férand, M.; Livebardon, T.; Moreau, S.; Sanjosé, M. Numerical Prediction of Far-Field Combustion Noise from Aeronautical Engines. Acoustics 2019, 1, 174–198. [Google Scholar] [CrossRef]
- Geyer, T.F.; Sarradj, E. Self Noise Reduction and Aerodynamics of Airfoils with Porous Trailing Edges. Acoustics 2019, 1, 393–409. [Google Scholar] [CrossRef]
- Horner, J.L.; Hu, Y. Investigation into higher-order mode propagation through orifice plates in circular ducts. Appl. Acoust. 2013, 74, 728–739. [Google Scholar] [CrossRef]
- Gaeta, R.J.; Ahuja, K.K. Effect of orifice shape on acoustic impedance. Int. J. Aeroacoust. 2016, 15, 474–495. [Google Scholar] [CrossRef]
- Han, K.; Ji, Z.; Fan, Y. Extraction and characteristic analysis of the nonlinear acoustic impedance of circular orifices. Phys. Fluids 2023, 35, 093606. [Google Scholar] [CrossRef]
- Komkin, A.; Bykov, A.; Mironov, M. Experimental study of nonlinear acoustic impedance of circular orifices. J. Acoust. Soc. Am. 2020, 148, 1391–1403. [Google Scholar] [CrossRef]
- Ingard, U.; Labate, S. Acoustic Circulation Effects and the Nonlinear Impedance of Orifices. J. Acoust. Soc. Am. 1950, 22, 211–218. [Google Scholar] [CrossRef]
- Ingard, U.; Ising, H. Acoustic Nonlinearity of an Orifice. J. Acoust. Soc. Am. 1967, 42, 6–17. [Google Scholar] [CrossRef]
- Anthony, D.K.; Elliott, S.J. A Comparison of Three Methods of Measuring the Volume Velocity of an Acoustic Source. J. Audio Eng. Soc. 1991, 9, 355–366. [Google Scholar]
- Salava, T. Acoustic Load and Transfer Functions in Rooms at Low Frequencies. J. Audio Eng. Soc. 1988, 36, 763–775. [Google Scholar]
- Jimenéz, N.; Umnova, O.; Groby, J.P. Acoustic Waves in Periodic Structures, Metamaterials, and Porous Media; Springer: Berlin/Heidelberg, Germany, 2021; Volume 143. [Google Scholar] [CrossRef]
- Di Giulio, E.; Nguyen, C.T.; Gloria, A.; Perrot, C.; Dragonetti, R. Three-dimensional cellular structures for viscous and thermal energy control in acoustic and thermoacoustic applications. Int. J. Heat Mass Transf. 2024, 234, 126076. [Google Scholar] [CrossRef]
- Di Giulio, E.; Perrot, C.; Dragonetti, R. Transport parameters for sound propagation in air saturated motionless porous materials: A review. Int. J. Heat Fluid Flow 2024, 108, 109426. [Google Scholar] [CrossRef]
- Fahy, F.; Gardonio, P. Section 3.4: The Baffled Piston. In Sound and Structural Vibration: Radiation, Transmission and Response; Academic Press: Cambridge, MA, USA, 2007; pp. 143–145. [Google Scholar] [CrossRef]
- Di Giulio, E.; Di Meglio, A.; Massarotti, N.; Dragonetti, R. Effective Thermal Conductivity Model for Tetragonal Pin Array Stack. J. Fluid Flow Heat Mass Transf. 2022, 9, 38–42. [Google Scholar] [CrossRef]
- Zieliński, T.G.; Venegas, R.; Perrot, C.; Červenka, M.; Chevillotte, F.; Attenborough, K. Benchmarks for microstructure-based modelling of sound absorbing rigid-frame porous media. J. Sound Vib. 2020, 483, 115441. [Google Scholar] [CrossRef]
Disclaimer/Publisher’s Note: The statements, opinions and data contained in all publications are solely those of the individual author(s) and contributor(s) and not of MDPI and/or the editor(s). MDPI and/or the editor(s) disclaim responsibility for any injury to people or property resulting from any ideas, methods, instructions or products referred to in the content. |
© 2024 by the authors. Licensee MDPI, Basel, Switzerland. This article is an open access article distributed under the terms and conditions of the Creative Commons Attribution (CC BY) license (https://creativecommons.org/licenses/by/4.0/).