Article

Effects of Varying Levels of Background Noise on Room Acoustic Parameters, Measured with ESS and MLS Methods

by
Nikolaos M. Papadakis
1,2,*,
Smaro Antoniadou
1 and
Georgios E. Stavroulakis
1
1
Institute of Computational Mechanics and Optimization (Co.Mec.O), School of Production Engineering and Management, Technical University of Crete, 73100 Chania, Greece
2
Department of Music Technology and Acoustics, Hellenic Mediterranean University, 74100 Rethymno, Greece
*
Author to whom correspondence should be addressed.
Acoustics 2023, 5(2), 563-574; https://doi.org/10.3390/acoustics5020034
Submission received: 19 May 2023 / Revised: 5 June 2023 / Accepted: 7 June 2023 / Published: 12 June 2023
(This article belongs to the Special Issue Noise Control for Healthy and Enhanced Acoustic Environments)

Abstract

:
Typically, background noise of different types and levels is present during the measurement of the impulse response in spaces. The two methods that are, in practice, most frequently used in the measurement of the impulse response, are the exponential sine sweep (ESS), and the maximum length sequence (MLS). This study’s objective was to estimate the impact of background noise (white noise, tonal noise) on the acoustic parameters (T30, EDT, C80, and D50) for ESS and MLS measurements, by introducing artificial background noise, employing an external sound source. For this purpose, measurements were performed with varying levels of external noise (in steps of 2 dB), and the effect was assessed, using the relative error compared to measurements without artificial background noise. According to the findings for white noise (as background noise), in the case of T30 and EDT, the difference between the two methods, as well as the relative error, for the initial levels of added background noise, was small. However, for higher levels of added background noise, there was a sharp increase in the relative error, which was greater for the ESS method, both for T30 and EDT. Regarding C80 and D50, while initially the differences between the ESS and MLS methods were small, cumulatively, as the background noise increased, the relative error increased for both methods, with the ESS method showing the largest error. In the case of tonal noise (as background noise), the results were consistent with those observed in the case of white noise. The study’s findings contribute to a better understanding of the ESS and MLS methods, and suggest the expected relative error of acoustic parameters when various types and levels of background noise are present. Additionally, the study suggests, based on background noise and level, the optimum method to conduct impulse response measurements.

1. Introduction

As we are all, consciously or unconsciously, aware of the sounds and acoustic environment we are exposed to every day, satisfactory acoustics are crucial for quality of life. Modeling techniques, in both enclosed [1,2] and open spaces [3,4], as well as related acoustic theories for the accurate calculation of the sound field, have been the subject of numerous significant recent developments. However, sound measurement techniques in existing spaces will always be relevant, as they provide an accurate description of the acoustic field, as well as the information needed for its assessment and optimization.
The impulse response can be used to obtain most of the acoustic parameters that define a space, which in turn are useful for providing guidance for possible improvements. ISO 3382-1 [5] addresses the proper measurement of the impulse response and acoustic parameters in performance spaces. Other standards, such as ISO 3382-2 [6], cover the measurement of ordinary rooms, and ISO 3382-3 [7] of open plan offices. The measurement of impulse responses is useful in other standards, such as ISO 354:2003 [8], which specifies a method of measuring the sound absorption coefficient, or the equivalent sound absorption area, in a reverberation room. In various domains, including virtual and augmented reality, impulse response measurements are also required for the estimation of head-related transfer functions (HRTFs), which are crucial for auralization applications [9].
In order to simulate the omnidirectional radiation characteristics of a monopole as a sound source for acoustic measurements [10], a dodecahedron speaker is frequently employed, with other sources being available [11]. Alternative excitation signals are used in practice, because impulsive signals applied directly to dodecahedron speakers cannot produce enough acoustic output. The use of these signals ensures that the speaker can produce enough acoustic energy for an extended period of time, without exceeding its peak power limit. Postprocessing can be applied to obtain the impulse responses with high time resolution. In addition, the repeatability of the measurements is improved by the accurate reproduction of these deterministic excitation signals. Some of the most well-known signals are the maximum length sequence (MLS), exponential sine sweep (ESS), inverse repeated sequence (IRS), and time-stretched pulses.
The MLS method was introduced by Schroeder [12]. The method is based on the excitation of the acoustic space by a “periodic pseudorandom signal having almost the same stochastic properties as a pure white noise” [13], and also demonstrating excellent immunity to distortion [14]. It has been demonstrated that the signal-to-noise ratio for the technique increases by 3 dB when the period length of the MLS sequence is doubled [15]. The MLS signal was quite popular in the 1990s, with the use of the first laptops [16]. Some of the method’s practical facets are detailed in [17,18]. With the advantage of lowering distortion peaks, the IRS method was created as an alternative approach to the MLS [19]. The method’s drawback is the lengthier computation time for the deconvolution employing high-order FFT and IFFT filters [20]. Another approach for the measurement of impulse responses is the time-stretched pulses [21]. With the intention of reducing peak distortions, this approach seeks to raise the sound-to-noise ratio. Last but not least, the ESS method [22,23] is based on the notion of using an exponential time-growing frequency sweep, which enables the simultaneous deconvolution of the system’s linear impulse response, and selective separation of each impulse response corresponding to the harmonic distortion orders taken into account. With an ideal excitation signal for the quick measurement of an acoustical impulse response, and even without averaging, the ESS approach aims to solve the majority of the shortcomings in conventional measurement techniques.
Of the above methods, the most commonly used in practice are the MLS and ESS, which are likewise included in Annex A and B of ISO 18233 [24]. Various studies have attempted to compare these two methods. In a study by Stan et al. [13], it is demonstrated that the MLS (or IRS) approach is susceptible to producing superior results than the other methods (ESS) in a (nonrandom) noisy environment. In the study, it was also found that, contrary to expectations, in the case of impulsive noise, the results favored the ESS method. The ESS approach appears to be the most suitable in a quiet environment. In a study by Guidorzi et al. [25], differences and advantages among impulse response measurements by the MLS and ESS methods were thoroughly analyzed and discussed. In addition, measurements were performed using the ESS and MLS methods in the presence of a hum, an impulsive noise, and with ideal conditions. The reverberation times (T10, T15, T20, T30) were measured and compared for MLS and ESS. Some of the conclusions were that the ESS method has a weak rejection for steady tonal disturbances, and that impulsive noise was the cause of differences in the reverberation times, especially T10 and T15. In a study by Torras-Rosell et al. [26] comparing the measurement of impulse responses between pseudorandom sequences (MLS, IRS) and sweep signals, it was stated that for MLS, background noise contaminates the measured signal along the time domain in a more-or-less uniform manner, because circular cross-correlation between the background noise and the excitation signal spreads the noise artifacts across the measured impulse response. However, the noise artifacts are not evenly distributed in the retrieved impulse response when using the sweep technique. All of the frequency components of the impulsive noise above the sweep’s instantaneous frequency are pushed into the impulse response’s non-causal part by the sweep technique, whilst all of the frequency components below the sweep’s instantaneous frequency are drawn into the causal part. However, it is stated in the study [26] that: “unlike what is claimed in the literature, sweep signals cannot reject all distortion artifacts from the causal part of the estimated impulse response”. Other studies including comparisons of the methods can be found in [20,27,28].
This study focused on further extending the current knowledge of ESS and MLS measurements, by performing the methods in the presence of artificial background noise (white noise, tonal noise) of various levels. Therefore, the aim of this study was to estimate how background noise affects acoustic parameters, by comparing the relative error of measurements with and without artificial background noise.
For this purpose, this paper has been structured as follows: the methodology used in this study is described in Section 2. The results of this study are presented in Section 3. In Section 4, the data are analyzed, the research question is addressed, and the research’s limitations, and areas for future research, are noted. The conclusion provides a concise overview, and places the work in context.

2. Methods

2.1. Acoustic Parameters

The impulse response can be used to obtain most of the acoustic parameters that define a space. A room’s acoustical parameters are defined in ISO 3382-1 [5], along with methods for estimating these parameters from the measured impulse response. For this research, some of the most important and widely used acoustic parameters were selected: reverberation time (T), early decay time (EDT), clarity (C80), and definition (D50).

2.1.1. Reverberation Time (T)

Reverberation time (T) is the most significant and well-known room acoustic parameter. According to ISO 3382-1, it is defined as [5], “the duration required for the space-averaged sound energy density in an enclosure to decrease by 60 dB after the source emission has stopped”. For the estimation of T, the decay curve must be measured, which is defined, according to ISO 354 [8], as the “graphical representation of the decay of the sound pressure level in a room as a function of time after the sound source has stopped”. Typically, the decay curve, or r(t), is an irregular curve that can be roughly approximated by a linear decay (Figure 1).
The decay curve can be calculated with the interrupted noise method (the direct recording of the decay of the sound-pressure level after exciting a room with broadband or band-limited noise), or with the integrated impulse response method (the reverse-time integration of the squared impulse responses) [5]. For this study, as the goal was the measurement of the impulse responses using the ESS and MLS methods, the integrated impulse response method was utilized. The generation of the decay curve for each octave band can be obtained from the backward integrated squared impulse response h(t) [12]:
r t t h 2 τ d τ
This expression can be applied in more practical, normalized logarithmic form:
10 log r t = 10 log t h 2 t d t 0 h 2 t d t
In this expression, the denumerator represents the total energy. Again, as stated in [5], “T can be evaluated based on a smaller dynamic range than 60 dB and extrapolated to a decay time of 60 dB”. For example, if decay values from 5 dB to 35 dB below the initial level are used, it is labelled T30.

2.1.2. Early Decay Time (EDT)

The early decay time (EDT) is defined as [29], “the time interval required for the sound energy level to decay 10 dB after the excitation has stopped”. It is evaluated from the slope of the integrated impulse response curves (as the conventional reverberation time). The slope of the decay curve is determined from the slope of the best-fit linear regression line of the initial 10 dB (between 0 dB and −10 dB) of the decay [5]. The outcome is multiplied by a factor of six, to allow for direct comparison with the T. The human perception of a room’s reverberation is more closely correlated with EDT than with T [30].

2.1.3. Clarity (C80)

The balance between early- and late-arriving energy is important for room acoustics. An early-to-late-arriving sound-energy ratio, “can be calculated for either a 50 ms or an 80 ms early time limit, depending on whether the results are intended to relate to conditions for speech or music, respectively” [5], using Equation (4). C80 is usually defined as clarity [5]. A low clarity value denotes an unclear, highly reverberant sound. On the contrary, a high clarity value indicates a significant portion of early energy, which is equivalent to a subjective sensation of clarity.
C 80 = 10 log 0 80   ms h 2 t d t 80   ms h 2 t d t

2.1.4. Definition (D50)

The acoustic parameter of “definition” (D50) is used for speech conditions as per Equation (5), and is a measure of the speech definition [31]. It can be used as a measurement of the early-to-total sound-energy ratio.
D 50 = 100 0 50   ms h 2 t d t 0 h 2 t d t     %

2.2. Measurements

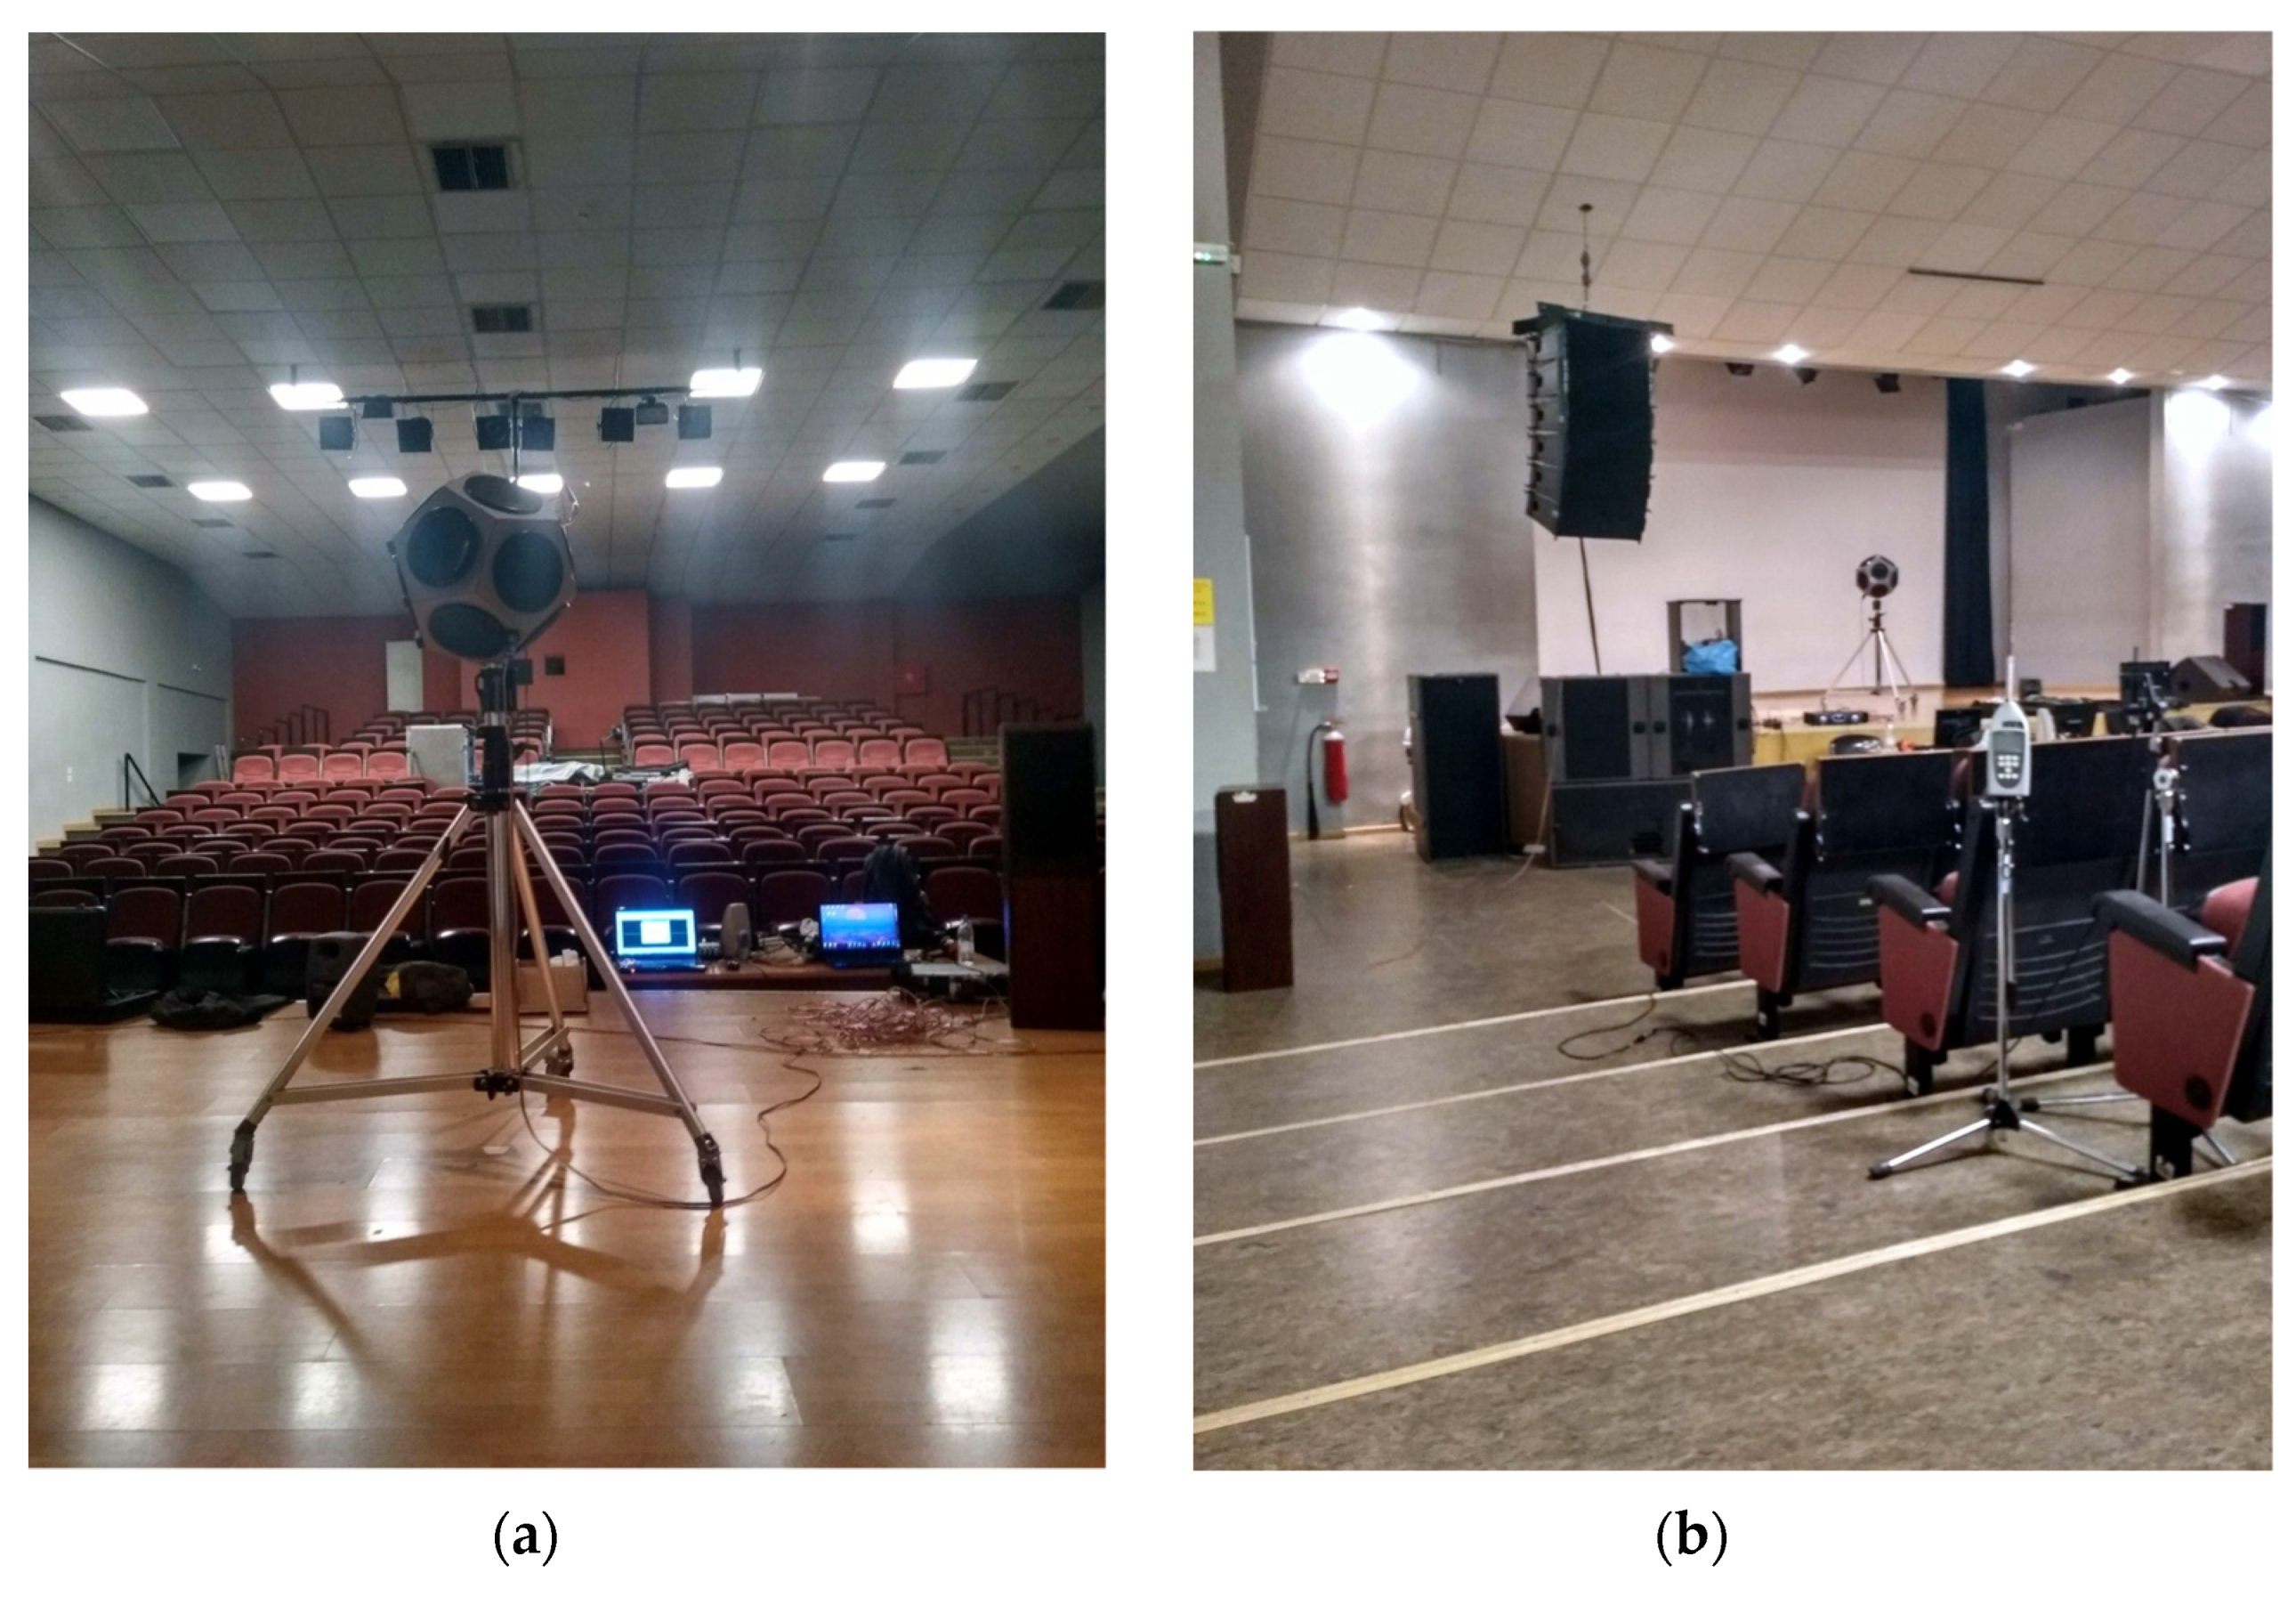
For the measurements, an amphitheater at the Hellenic Mediterranean University, Department of Music Technology and Acoustics, Crete, Greece was used. Impulse responses were measured with the use of a dodecahedron loudspeaker (Type DO12, 01 dB-Stell). The dodecahedron loudspeaker’s directivity characteristics meet ISO 3382-1 requirements. Before the measurements were conducted, the loudspeaker was evaluated by the authors to ensure that everything was in order with its operation [5]. Although a dodecahedron speaker is typically employed, alternative acoustic sources are also accessible for a variety of reasons (e.g., high cost, transportation difficulties, availability) [32,33,34]. For both methods, the same source and microphone positions were used, according to ISO 3382-1 [5]. In order to compare the properties of the impulse response objectively, the sound levels of the ESS and MLS signals in the measurement positions were set to approximately 84 dB for both methods. This level was preferred because it corresponds with a value between the optimum levels for the MLS and ESS signals, as proposed by Stan et al. [13]. Precautions were taken in order that the background-sound level would be approximately the same for every measurement. For the measurements, the 63 Hz octave band was excluded, due to variations observed in the background-noise levels. The measurements of the impulse response had a sampling frequency of 44.1 kHz. According to the anticipated T, an acceptable sequence length and time constant for the methods was selected. A single iteration was performed for each of the measurement points for each method. Consequently, no stepwise rotation of a dodecahedron sound source was used to increase the precision of the acoustic measurements in the room [35]. An omnidirectional microphone (Type 4190, Earthworks) was used for each of the measurements. The dodecahedron loudspeaker was placed in the center of the amphitheater stage (Figure 2). For all the measurements, as a noise compensation method, according to ISO 3382, the truncation method was used, which truncates (removes) the part of the impulse response tail that is close to, or below, the noise level.
With the aid of a second sound source (Tower V8, JWS, Falkenberg, Sweden), measurements were conducted with background-noise levels that varied in 2 dB steps. The sound source was directed toward the wall, in order to achieve the diffusion of the artificial background noise. Sound level measurements were made at the microphone position, using a sound-level meter (01dB-Steel SdB02). The maximum acceptable deviation from the expected sound level was 0.1 dB. Tonal noise and white noise were the two types of background noise that were employed.
The acoustic parameters that were calculated from the impulse responses were T30, early decay time (EDT), clarity (C80), and definition (D50). In order to form an objective comparison of the measuring methods, all the room acoustics parameters were computed using the ARTA software (version 1.9.5, ARTALABS, Croatia). In each case, the mean relative error was used for the comparison of the results. In general, relative error is defined as the ratio of the absolute error of a measurement to the actual measurement. For this study, the actual measurement was considered the measurement without artificial background noise. The absolute error was considered the absolute difference between the measurement with the artificial background noise (for each case of background noise, and each measurement method), and the measurement without artificial background noise (the actual measurement). The mean relative error for all the octave bands was considered the average of all relative errors for the octave bands that were used.

3. Results

Impulse response measurements were performed as described in the methods section. Initially, the measurements were made without the addition of noise, in order to measure the impulse response and the acoustic parameters in the room.
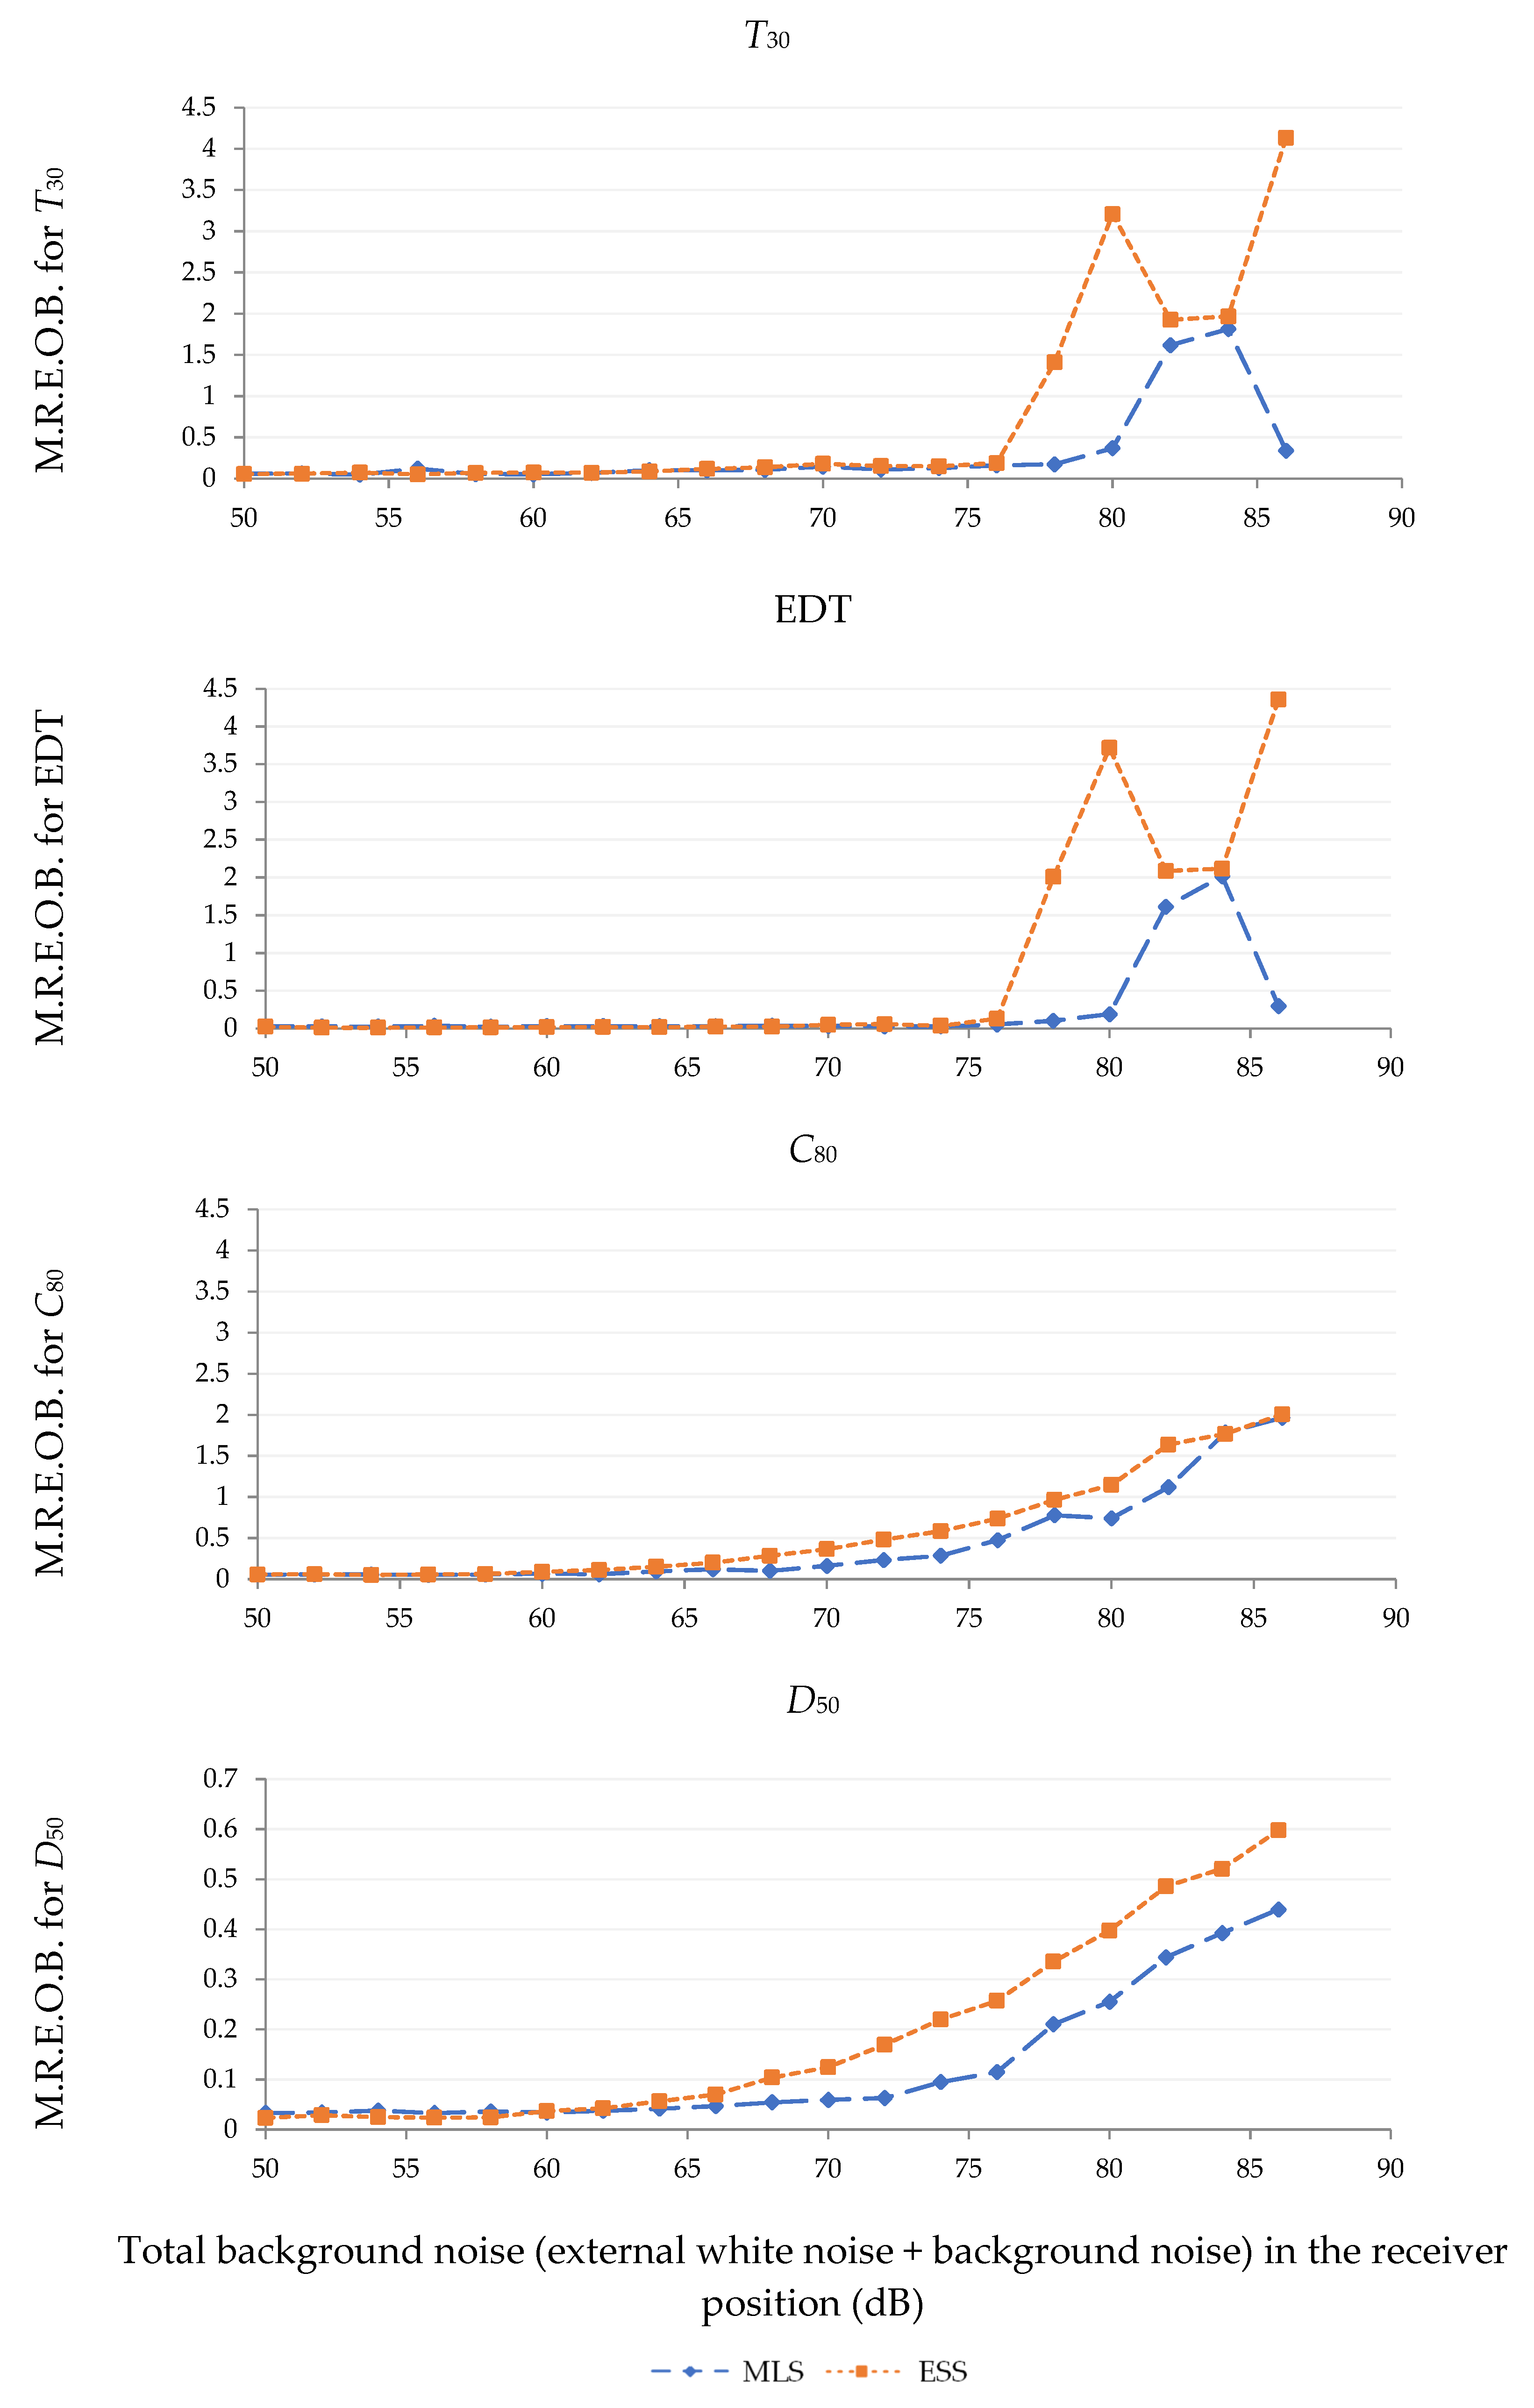
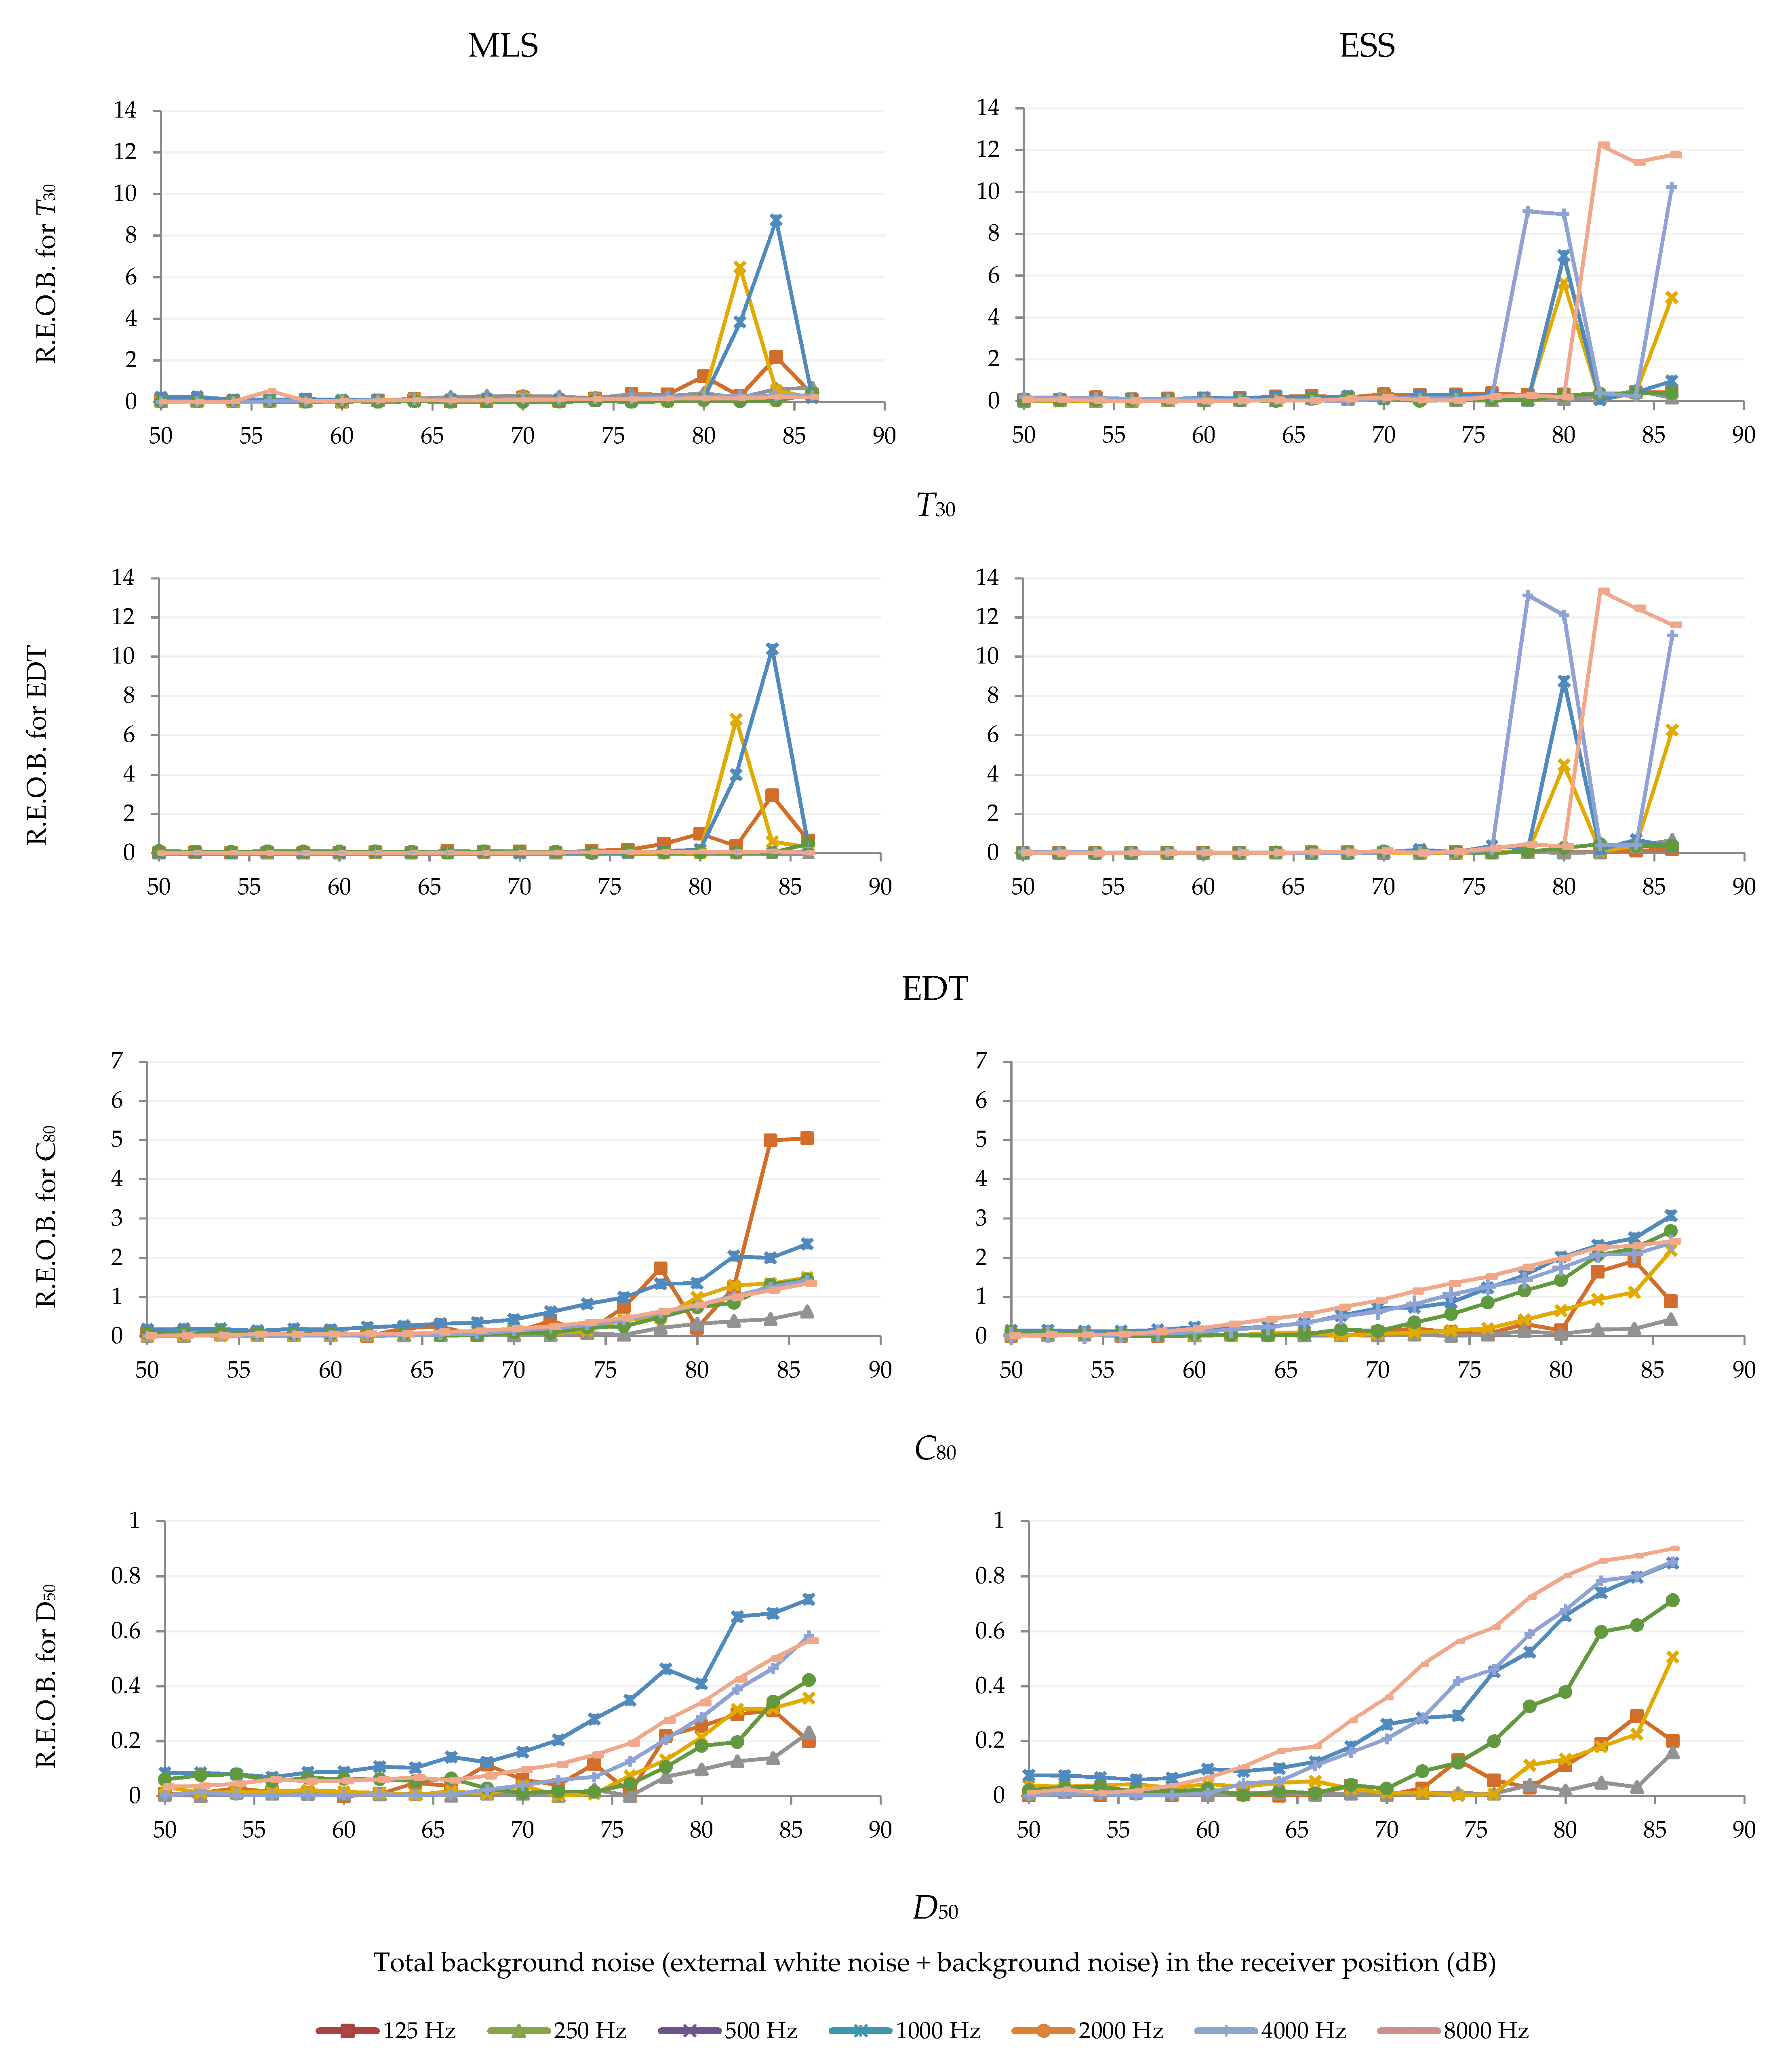
Then, using an extra sound source and varied background-noise levels, impulse response measurements were made. The increments for the experiments were 2 dB. The acoustic parameters that were calculated from the impulse responses were T30, EDT, C80, and D50, and are presented in Figure 3. The acoustic parameters were calculated for eight octave bands, from 125 to 8 KHz. Figure 3 presents the mean relative error for each acoustic parameter, and for each step of additional varying background noise. Figure 4 presents the results for the relative error for each octave band in the case of white noise as background noise, for T30, EDT, C80, and D50 (in the graphs, there is a common y-axis limit per acoustic parameter).
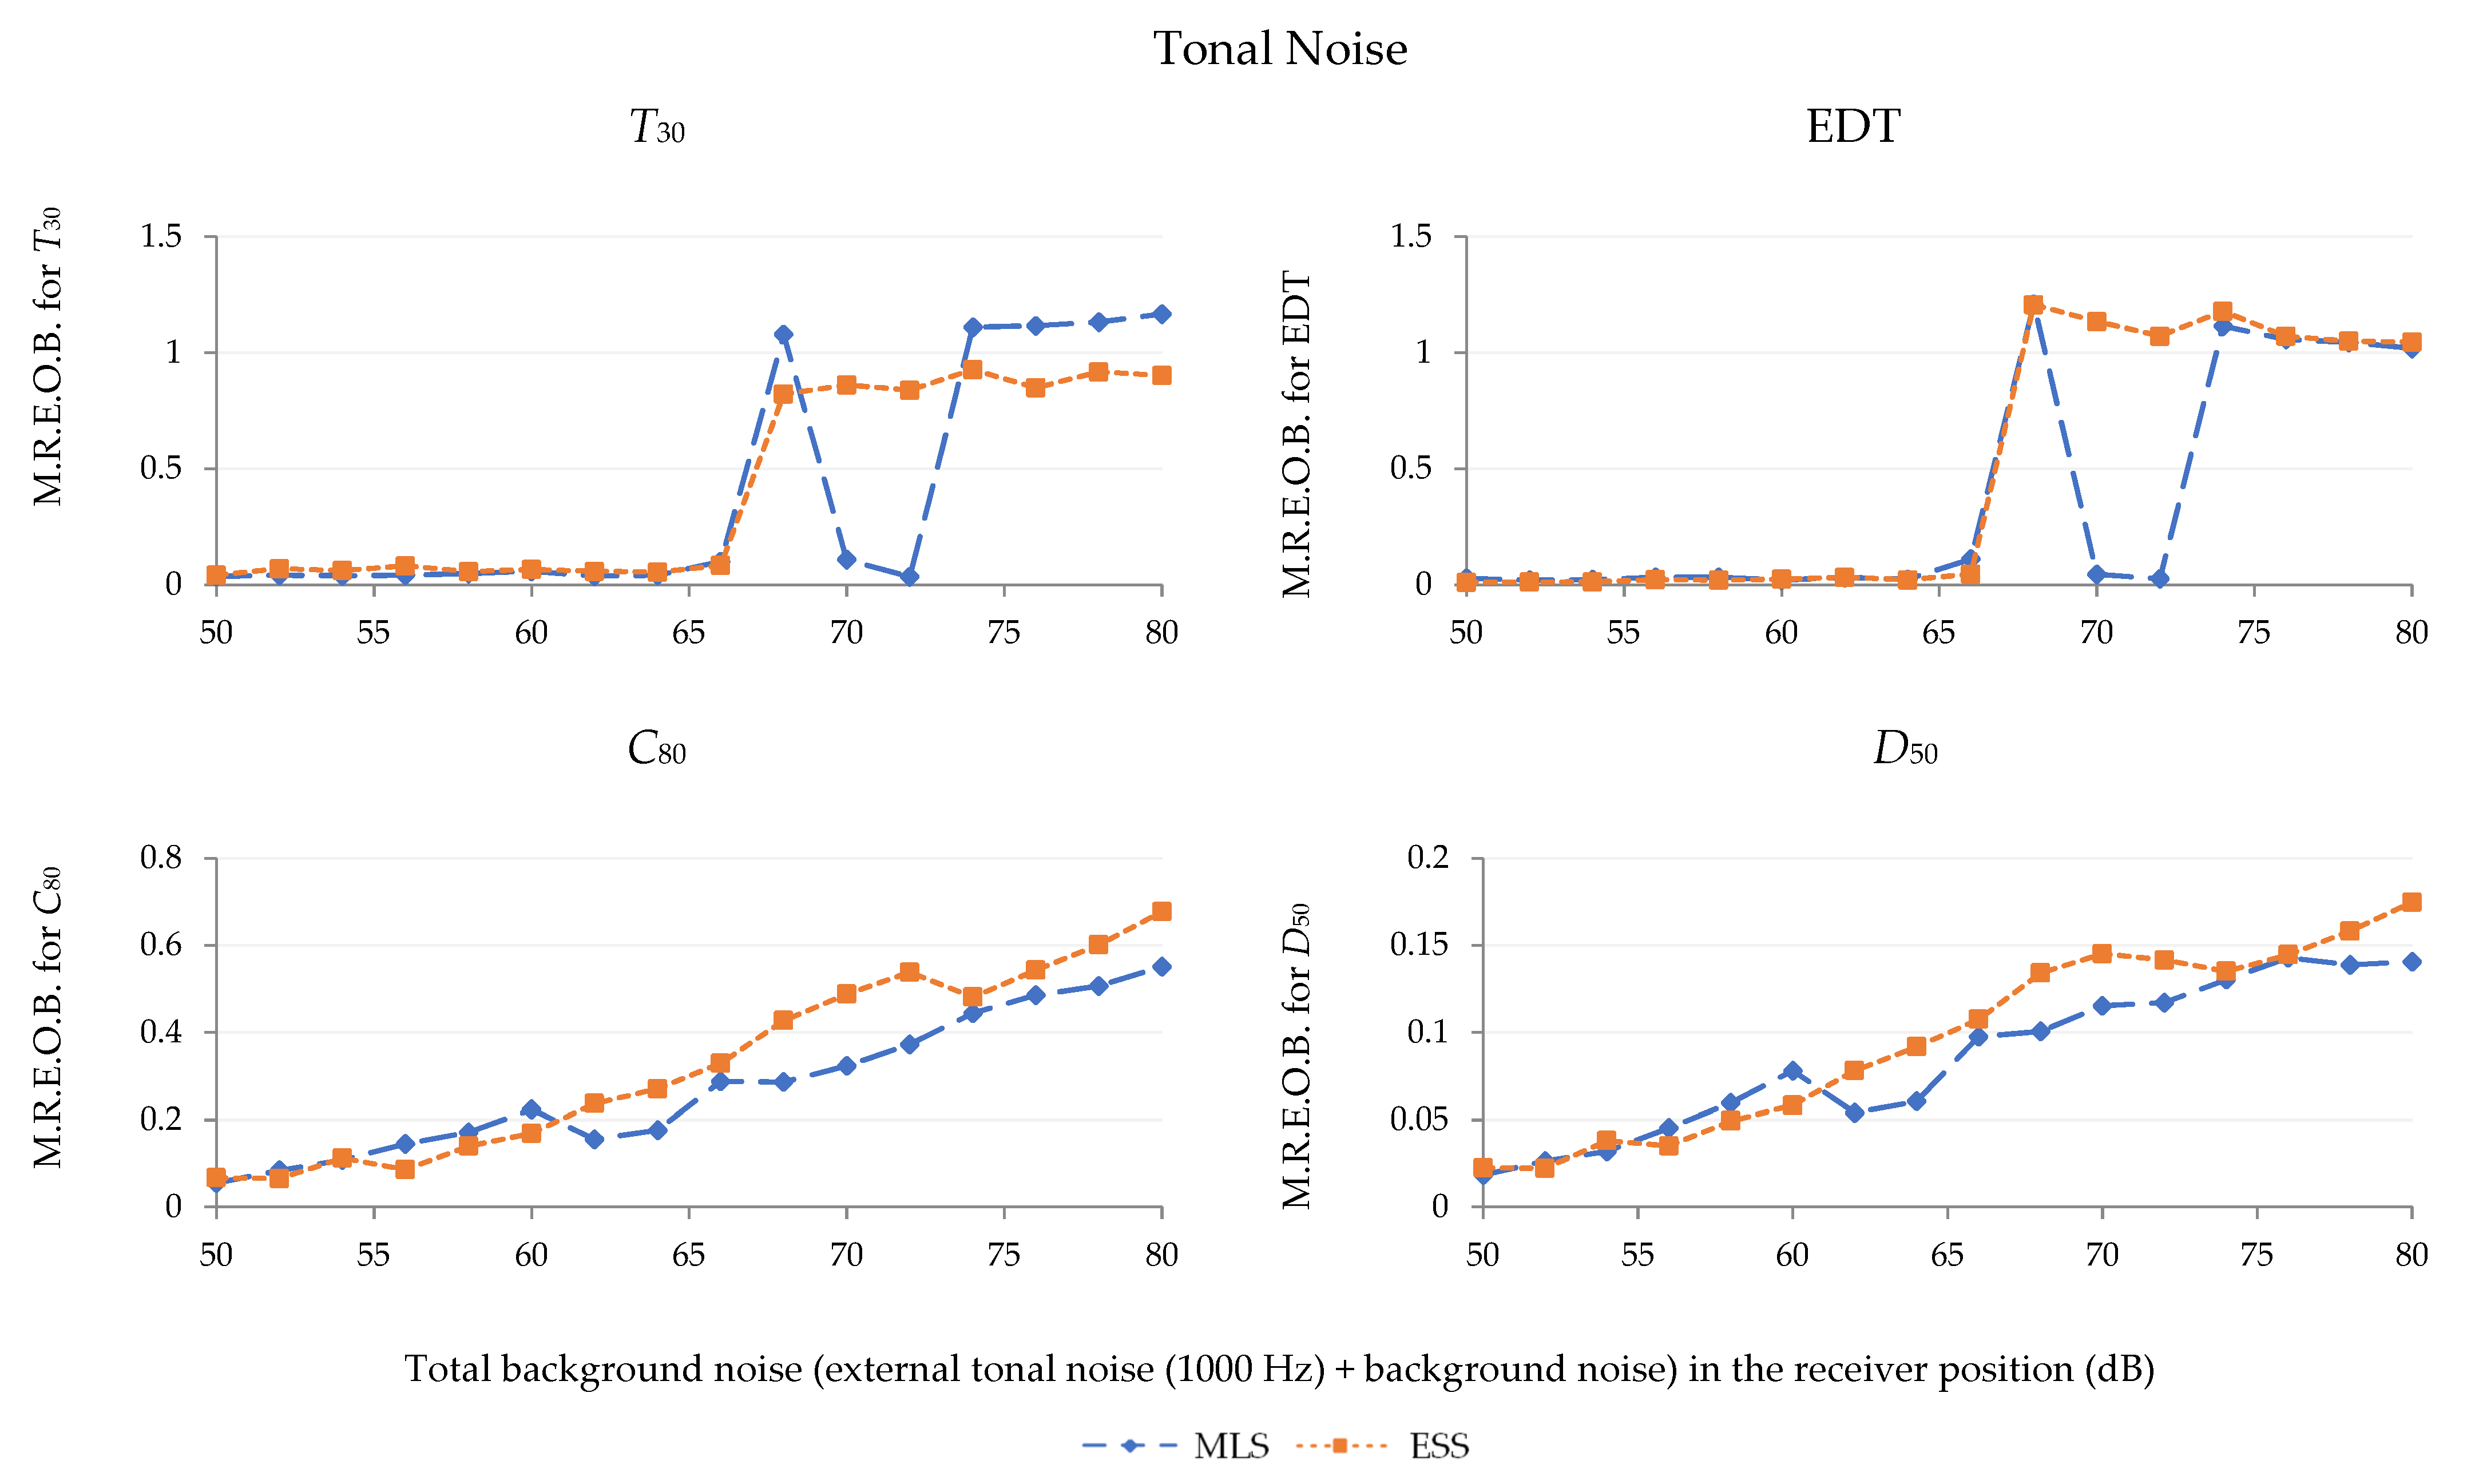
A second set of measurements was performed, in which tonal noise was added as background noise. With the aid of a second sound source, impulse response measurements were carried out with different background-noise levels, and steps of 2 dB. The acoustic parameters that were calculated from the impulse responses were again T30, EDT, C80, and D50, and are presented in Figure 5. The acoustic parameters were calculated for eight octave bands from 125 to 8 KHz. Figure 5 presents the mean relative error for each acoustic parameter, and for each step of additional varying background noise.

4. Discussion

In the results section, according to the type of artificial background sound added in the space (white noise, tonal noise), the relative error for the four acoustic parameters (T30, EDT, C80, and D50), and for the ESS and MLS methods, was measured and presented. In the case of white noise (Figure 3) as background noise, the results suggest that, in the case of T30 and EDT, the difference between the two methods, as well as the mean relative error for the initial levels of added background noise is relatively small. However, for higher levels of added background noise, it seems that there is a sharp increase in the mean relative error, which is greater for the ESS method, both for T30 and EDT. This is likely due to sharp changes in the distribution of energy in the energy decay curve, as the methods could not possibly effectively handle the excessive levels of the added noise. Regarding C80 and D50, while initially the differences between the ESS and MLS methods are again small, cumulatively, as the background noise increases, the error increases, with the ESS method seeming to have a greater error. Since both C80 and D50 (Equations (4) and (5), respectively) express a ratio of the impulse response’s energy before time te, and its energy after time te (te = 80 ms, and te = 0 ms, respectively), cumulatively, as the background noise increases, the denominator increases (and the numerator, also, to a lesser extent), thus increasing the relative error.
In addition, the mean relative error for each individual octave band in the case of white noise as background noise for T30, EDT, C80, and D50 is presented in Figure 4. In the case of T30 and EDT, it seems that the sharp changes occur in more octave bands for the ESS method, compared to the MLS method, while they also occur at a lower added-background-noise level. Regarding C80 and D50, cumulatively, as the background noise increases, the error increases for the octave bands, with the ESS method presenting a greater error in comparison to the MLS method. Again, for the ESS method, the relative error seems to increase noticeably at lower background-noise levels.
In the case of tonal noise as background noise, the results are consistent with those observed in the general case of white noise. Again, regarding C80 and D50, it seems that cumulatively, as the background noise increases, the error increases, with the ESS method presenting a greater error. Regarding T30 and EDT for higher levels of added background noise, it seems that there is a sharp increase in the relative error, with the MLS method being less sensitive to these changes.
Our findings appear to be continent with the expected results in the cases of white and tonal background noise, according to previous studies. As presented in the introduction, in a previous study by Stan et al. [13], it is stated that, “in a noisy environment the MLS method is subject to giving better results than the ESS, since the MLS method possess the ability of randomizing the phase of any component in the recorded signal that is not correlated to the input signal emitted in the acoustical space”. Thus, any additional noise (white or even impulsive) will be distributed uniformly along the deconvolved impulse response. It is also stated in the study by Guidorzi et al. [25], for tonal disturbances, that the ESS method has a weak rejection. Moreover, in the study by Torras-Rosell et al. [26], it is mentioned that the noise artifacts are not evenly distributed in the retrieved impulse response when using the sweep technique.
In general, the overall direction of the results shows that in the cases of white and tonal noise, the MLS method performs better than the ESS method. Therefore, the MLS is to be preferred in noisy environments indoors, as well as outdoors (e.g., measurements of noise barriers in situ [36]). However, the ESS method is generally more suitable than the MLS method for use in architectural acoustics [25], and the perfect and complete rejection of the harmonic distortions prior to the impulse response, their individual measurement, and the excellent signal-to-noise ratio make it the best impulse response measurement technique in an unoccupied and quiet room [13]. Furthermore, developments are constantly emerging for the improvement of ESS-method measurements in the presence of non-stationary noise [37].

Limitations

We acknowledge that our research may have some limitations. Some of those limitations stem from the fact that there are many variations on how to perform acoustic measurements with the different methods.
The first limitation is that this study has only investigated the performance of the ESS and MLS signal qualities in the case where the signals in the measurement position had the same excitation level. However, optimum signal levels have been proposed for the ESS and MLS [13], which are different for each method. Consequently, additional measurements are needed in the case of optimum signal levels for both methods.
Secondly, we used a single noise compensation method (the truncation method), as presented in the methods section. It has been stated that, “when these (noise compensation) methods are used to suppress noise effects, their performances differ significantly” [38].
In addition, we used a single software implementation, as presented in the methods section. Again, it has been shown that there are some (relatively small) differences in the results among software implementations [39]. However, the differences for measuring the Τ30 from the impulse response were found to increase for smaller peak-to-noise ratios [39].

5. Conclusions

In this study, we assessed the effect of background noise (white noise, tonal noise) on acoustic parameters (T30, EDT, C80, and D50) for ESS and MLS measurements, by introducing artificial background noise, employing an external sound source. In the case of white noise (as background noise), the results suggest that, in the case of T30 and EDT, the difference between the two methods, as well as the mean relative error for the initial levels of added background noise, is small. However, for higher levels of added background noise, there is a sharp increase in the relative error, which is greater for the ESS method, both for T30 and EDT. Regarding C80 and D50, while initially the differences between the ESS and MLS methods are again small, cumulatively, as the background noise increases, the error increases, with the ESS method presenting a greater error. In the case of tonal noise, the results are consistent with those observed in the general case of white noise.
The findings presented in this study make several contributions to the current literature, by adding to our understanding of the ESS and MLS methods for impulse response measurements. The findings support the idea that the MLS method for white and tonal background noise can provide better results in cases of high background-noise levels. However, in cases of low background noise, the results of the two methods are similar. These results are in agreement with the literature. This work also contributes to existing knowledge by suggesting the expected relative error of acoustic parameters when various types and levels of background noise are present. Finally, the study suggests, based on background noise and level, the optimum method to conduct impulse response measurements.

Author Contributions

Conceptualization, N.M.P. and S.A.; methodology, N.M.P. and S.A.; software, N.M.P. and S.A.; formal analysis, N.M.P. and S.A.; investigation, N.M.P. and S.A.; resources, N.M.P.; data curation, N.M.P., S.A. and G.E.S.; writing—original draft preparation, N.M.P.; writing—review and editing, G.E.S.; visualization, N.M.P.; supervision, N.M.P. and G.E.S.; project administration, N.M.P. All authors have read and agreed to the published version of the manuscript.

Funding

This research received no external funding.

Data Availability Statement

The data presented in this study are available on request from the corresponding author.

Acknowledgments

We would like to thank everyone who helped in the measurement sessions. We would also like to thank the anonymous reviewers for their thoughtful observations and comments.

Conflicts of Interest

The authors declare no conflict of interest.

References

  1. Vorländer, M. Computer simulations in room acoustics: Concepts and uncertainties. J. Acoust. Soc. Am. 2013, 133, 1203–1213. [Google Scholar] [CrossRef] [PubMed]
  2. Papadakis, N.M.; Stavroulakis, G.E. Time domain finite element method for the calculation of impulse response of enclosed spaces. Room acoustics application. AIP Conf. Proc. 2015, 1703, 100002. [Google Scholar] [CrossRef]
  3. Hornikx, M. Ten questions concerning computational urban acoustics. Build. Environ. 2016, 106, 409–421. [Google Scholar] [CrossRef] [Green Version]
  4. Papadakis, N.M.; Stavroulakis, G.E. Finite Element Method for the Estimation of Insertion Loss of Noise Barriers: Comparison with Various Formulae (2D). Urban Sci. 2020, 4, 77. [Google Scholar] [CrossRef]
  5. ISO 3382-1: 2009; Measurement of Room Acoustic Parameters–Part 1: Performance Spaces. ISO: Geneva, Switzerland, 2009.
  6. ISO 3382-2: 2008; Measurement of Room Acoustic Parameters–Part 2: Reverberation Time in Ordinary Rooms. ISO: Geneva, Switzerland, 2009.
  7. ISO 3382-3: 2012; Measurement of Room Acoustic Parameters–Part 3: Open Plan Offices Rooms. ISO: Geneva, Switzerland, 2009.
  8. ISO 354: 2003; Acoustics–Measurement of Sound Absorption in a Reverberation Room. ISO: Geneva, Switzerland, 2003.
  9. Yu, G.-Z.; Xie, B.-S.; Rao, D. Directivity of spherical polyhedron sound source used in near-field HRTF measurements. Chin. Phys. Lett. 2010, 27, 124302. [Google Scholar] [CrossRef]
  10. Kleiner, M. Acoustics and Audio Technology; J. Ross Publishing, Inc.: Fort Lauderdale, FL, USA, 2011. [Google Scholar]
  11. Papadakis, N.M.; Stavroulakis, G.E. Review of Acoustic Sources Alternatives to a Dodecahedron Speaker. Appl. Sci. 2019, 9, 3705. [Google Scholar] [CrossRef] [Green Version]
  12. Schroeder, M.R. Integrated-impulse method measuring sound decay without using impulses. J. Acoust. Soc. Am. 1979, 66, 497–500. [Google Scholar] [CrossRef]
  13. Stan, G.-B.; Embrechts, J.-J.; Archambeau, D. Comparison of different impulse response measurement techniques. J. Audio Eng. Soc. 2002, 50, 249–262. [Google Scholar]
  14. Dunn, C.; Hawksford, M.J. Distortion immunity of MLS-derived impulse response measurements. J. Audio Eng. Soc. 1993, 41, 314–335. [Google Scholar]
  15. Bleakley, C.; Scaife, R. New formulas for predicting the accuracy of acoustical measurements made in noisy environments using the averaged m-sequence correlation technique. J. Acoust. Soc. Am. 1995, 97, 1329–1332. [Google Scholar] [CrossRef]
  16. Rife, D.D. MLSSA Reference Manual; DRA Laboratories, 4587 Cherrybark Court: Sarasota, FL, USA, 1996. [Google Scholar]
  17. Vorländer, M.; Kob, M. Practical aspects of MLS measurements in building acoustics. Appl. Acoust. 1997, 52, 239–258. [Google Scholar] [CrossRef]
  18. Vanderkooy, J. Aspects of MLS measuring systems. J. Audio Eng. Soc. 1994, 42, 219–231. [Google Scholar]
  19. Ream, N. Nonlinear identification using inverse-repeat sequences. In Proceedings of the Institution of Electrical Engineers; IET Digital Library, 1970; pp. 213–218. [Google Scholar] [CrossRef]
  20. Farcas, A.C.; Topa, M.D. On the Choice of the Method for Obtaining the Room Impulse Response. Acta Tech. Napoc. 2013, 54, 34. [Google Scholar]
  21. Aoshima, N. Computer-generated pulse signal applied for sound measurement. J. Acoust. Soc. Am. 1981, 69, 1484–1488. [Google Scholar] [CrossRef]
  22. Farina, A. Simultaneous measurement of impulse response and distortion with a swept-sine technique. In Proceedings of the Audio Engineering Society Convention 108, Audio Engineering Society, the 108th Convention, Paris, France, 19–22 February 2000. [Google Scholar]
  23. Müller, S.; Massarani, P. Transfer-function measurement with sweeps. J. Audio Eng. Soc. 2001, 49, 443–471. [Google Scholar]
  24. ISO 18233-2006; Acoustics–Application of New Measurement Methods in Building and Room Acoustics. ISO: Geneva, Switzerland, 2006.
  25. Guidorzi, P.; Barbaresi, L.; D’Orazio, D.; Garai, M. Impulse responses measured with MLS or Swept-Sine signals applied to architectural acoustics: An in-depth analysis of the two methods and some case studies of measurements inside theaters. Energy Procedia 2015, 78, 1611–1616. [Google Scholar] [CrossRef] [Green Version]
  26. Torras-Rosell, A.; Jacobsen, F. Measuring long impulse responses with pseudorandom sequences and sweep signals. In Proceedings of the 39th International Congress Noise Control Eng. (INTER-NOISE 2010), Lisbon, Portugal, 13–16 June 2010. [Google Scholar]
  27. Mateljan, I.; Ugrinović, K. The comparison of room impulse response measuring systems. In Proceedings of the First Congress of Alps Adria Acoustics Association, Čudina, Mirko, Portorož, Slovenija, 1–2 September 2003. [Google Scholar]
  28. Holters, M.; Corbach, T.; Zölzer, U. Impulse response measurement techniques and their applicability in the real world. In Proceedings of the 12th International Conference on Digital Audio Effects (DAFx-09), Como, Italy, 1–4 September 2009; pp. 108–112. [Google Scholar]
  29. Jordan, V.L. Acoustical criteria for auditoriums and their relation to model techniques. J. Acoust. Soc. Am. 1970, 47, 408–412. [Google Scholar] [CrossRef]
  30. Rossing, T.D. Springer Handbook of Acoustics; Springer: New York, NY, USA, 2007. [Google Scholar]
  31. Thiele, R. Richtungsverteilung und zeitfolge der schallrückwürfe in räumen. Acta Acust. United Acust. 1953, 3, 291–302. [Google Scholar]
  32. Papadakis, N.M.; Stavroulakis, G.E. Low Cost Omnidirectional Sound Source Utilizing a Common Directional Loudspeaker for Impulse Response Measurements. Appl. Sci. 2018, 8, 1703. [Google Scholar] [CrossRef] [Green Version]
  33. Papadakis, N.M.; Stavroulakis, G.E. Handclap for Acoustic Measurements: Optimal Application and Limitations. Acoustics 2020, 2, 224–245. [Google Scholar] [CrossRef]
  34. de Vos, R.; Papadakis, N.M.; Stavroulakis, G.E. Improved Source Characteristics of a Handclap for Acoustic Measurements: Utilization of a Leather Glove. Acoustics 2020, 2, 803–811. [Google Scholar] [CrossRef]
  35. Martellotta, F. Optimizing stepwise rotation of dodecahedron sound source to improve the accuracy of room acoustic measures. J. Acoust. Soc. Am. 2013, 134, 2037–2048. [Google Scholar] [CrossRef] [PubMed]
  36. Guidorzi, P.; Garai, M. A Low-Cost System for Quick Measurements on Noise Barriers in Situ. IEEE Trans. Instrum. Meas. 2022, 71, 1–14. [Google Scholar] [CrossRef]
  37. Prawda, K.; Schlecht, S.J.; Välimäki, V. Robust selection of clean swept-sine measurements in non-stationary noise. J. Acoust. Soc. Am. 2022, 151, 2117–2126. [Google Scholar] [CrossRef]
  38. Guski, M.; Vorländer, M. Comparison of noise compensation methods for room acoustic impulse response evaluations. Acta Acust. United Acust. 2014, 100, 320–327. [Google Scholar] [CrossRef]
  39. Cabrera, D.; Xun, J.; Guski, M. Calculating reverberation time from impulse responses: A comparison of software implementations. Acoust. Aust. 2016, 44, 369–378. [Google Scholar] [CrossRef]
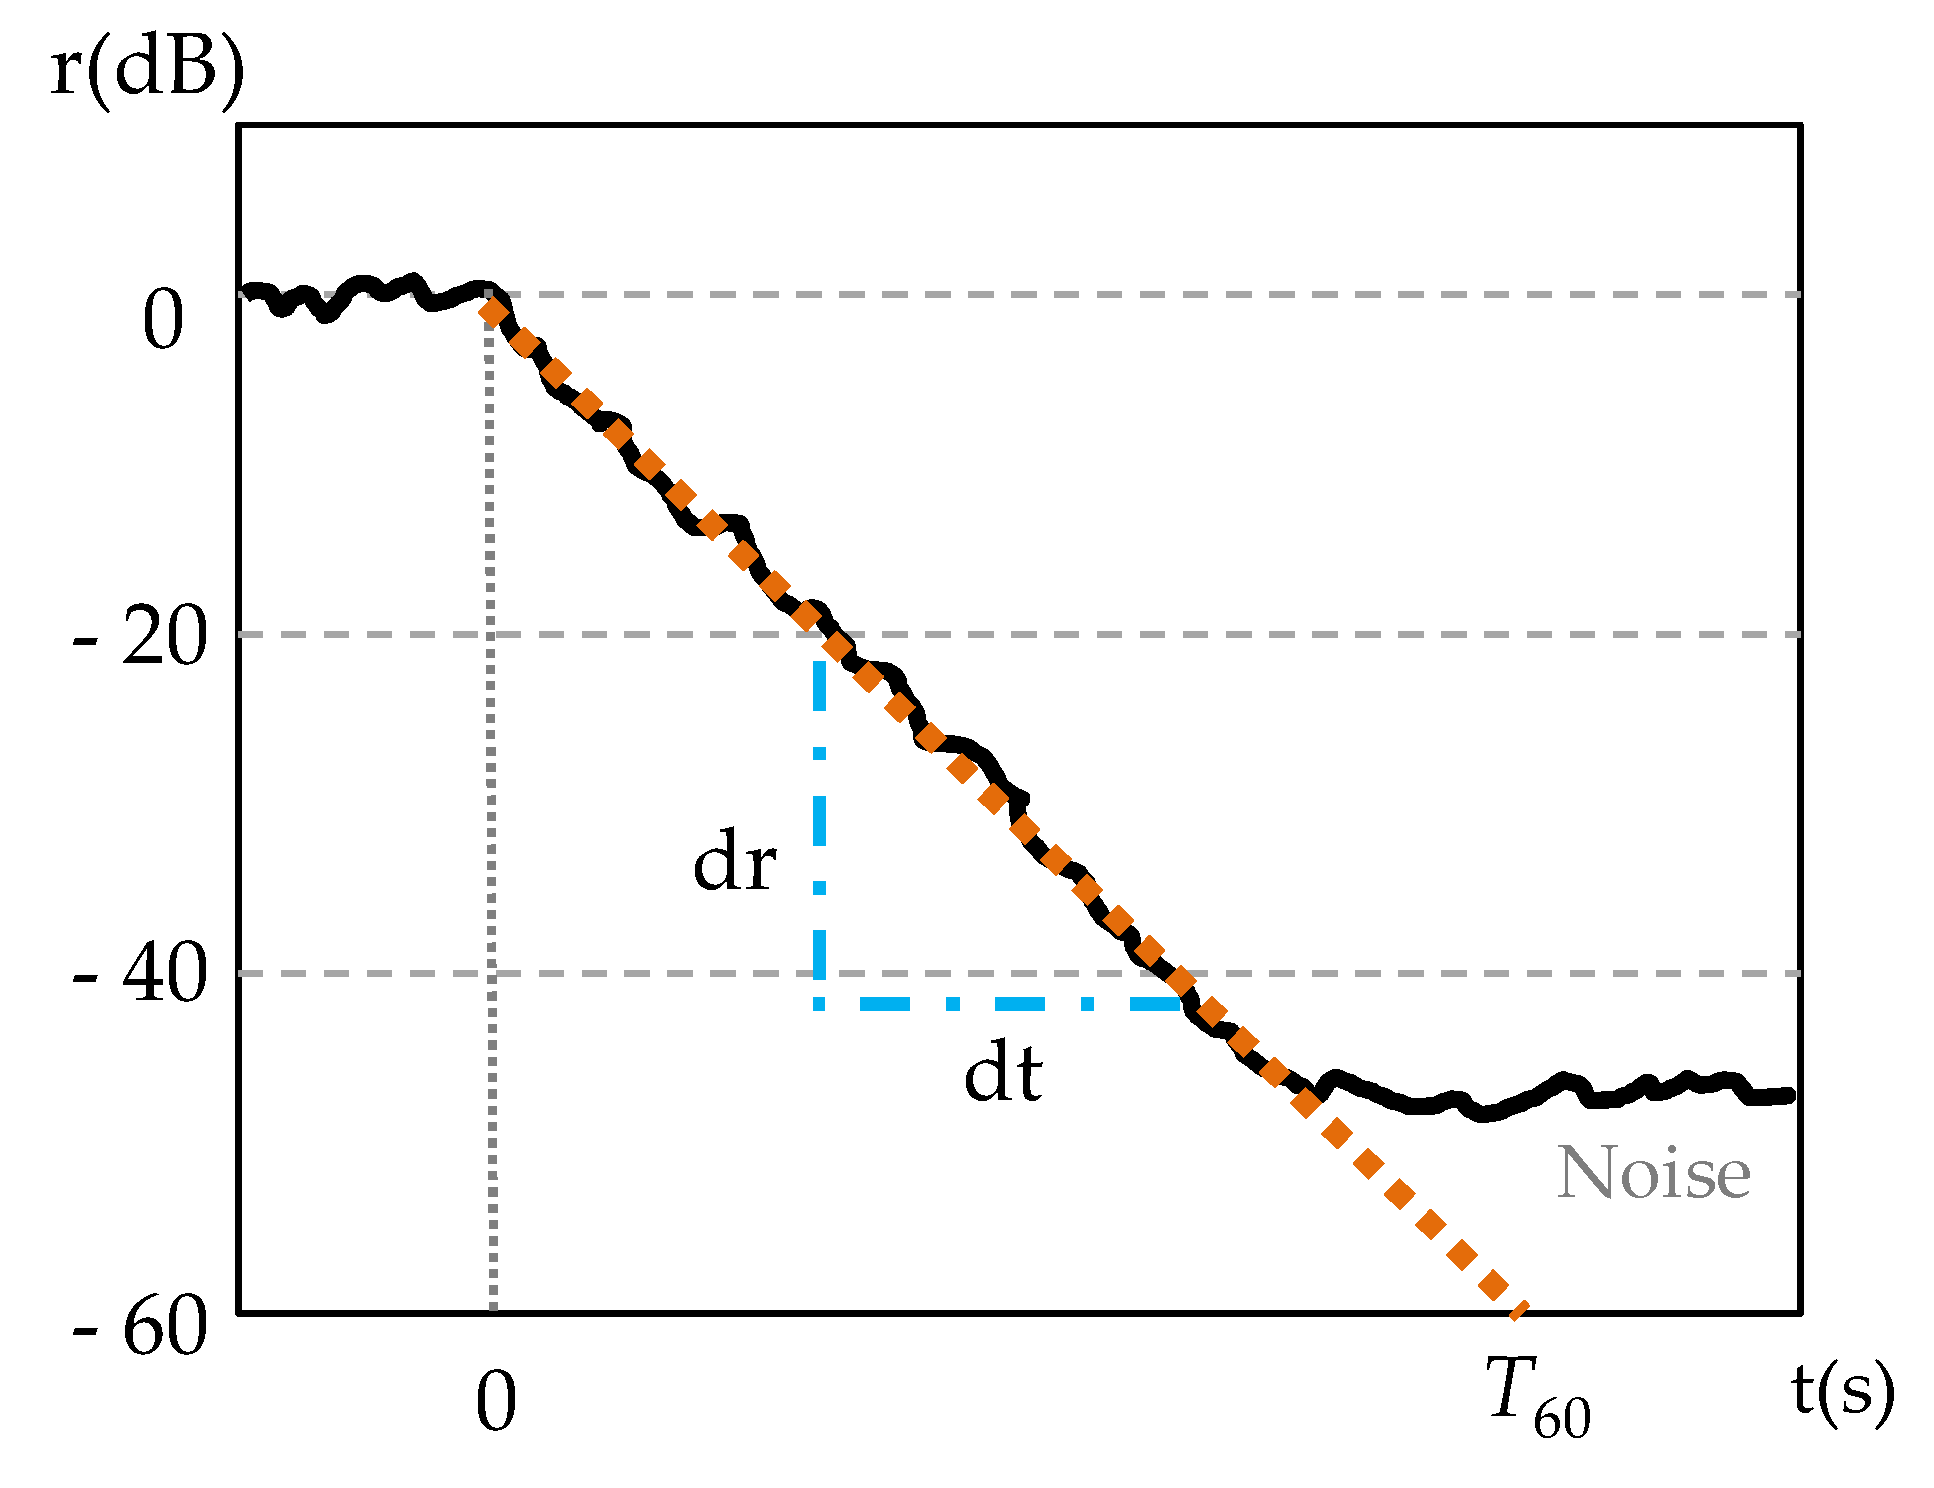
Figure 1. Typical decay curve.
Acoustics 05 00034 g001
Figure 2. (a) Dodecahedral loudspeaker placed in the center of the stage of the amphitheater. (b) Dodecahedral loudspeaker, additional sound source, omnidirectional microphone, sound-level meter.
Acoustics 05 00034 g002
Figure 3. The mean relative error for all octave bands (M.R.E.O.B.) (125–8000 Hz) in the case of white noise as external background noise for T30, EDT, C80, and D50.
Acoustics 05 00034 g003
Figure 4. Relative error for each octave band (R.E.O.B.) (125–8000 Hz) in the case of white noise as background noise for T30, EDT, C80, and D50 (in the graphs, there is a common y-axis limit per acoustic parameter).
Acoustics 05 00034 g004
Figure 5. Mean relative error for all octave bands (M.R.E.O.B.) (125–8000 Hz) in the case of tonal noise (1000 Hz) as external background noise for T30, EDT, C80, and D50.
Acoustics 05 00034 g005
Disclaimer/Publisher’s Note: The statements, opinions and data contained in all publications are solely those of the individual author(s) and contributor(s) and not of MDPI and/or the editor(s). MDPI and/or the editor(s) disclaim responsibility for any injury to people or property resulting from any ideas, methods, instructions or products referred to in the content.