Article

Investigation of the Change of Acoustic Pressure in an Element of Acoustic Barrier with an Elliptical Shape

1
Department of Mechanics, Technical University of Sofia, 1000 Sofia, Bulgaria
2
Department of Microelectronics, Technical University of Sofia, 1000 Sofia, Bulgaria
*
Author to whom correspondence should be addressed.
Acoustics 2023, 5(1), 46-56; https://doi.org/10.3390/acoustics5010003
Submission received: 14 November 2022 / Revised: 16 December 2022 / Accepted: 27 December 2022 / Published: 31 December 2022
(This article belongs to the Special Issue Vibration and Noise)

Abstract

:
In the presented article we have investigated the variation of the sound pressure level in characteristic areas around an element of an acoustic barrier with an elliptical shape at different frequencies (from 100 Hz to 2000 Hz). The variation of the sound pressure level in four characteristic areas located on the axis of symmetry of the acoustic barrier element is investigated. The purpose of the research is to determine in which of the areas it is most efficient to place devices for generating electrical energy from acoustic noise. The results were analyzed and relevant conclusions were drawn.

1. Introduction

From research [1,2,3,4,5,6,7,8,9] it is known that the energy generated by noise is of low power. However, due to the large area of acoustic barriers that are used around transport infrastructures, the total energy that can be generated can power street or additional lighting, as well as various signaling and communication devices, thus becoming energy independent from the central power grid. In practice, two such projects have been implemented so far [10,11,12,13,14]. It can be seen from them that in order to have a relatively high energy efficiency [15,16,17,18], the acoustic barriers need to be of a special construction/shape on the side of the transport flow. The structure is built in such a way as to create areas of high acoustic pressure, in which the piezoelectric generators of electrical energy are placed [19,20,21,22,23,24,25,26,27].
For example, in an article [3], a summary of devices for harvesting energy from sound waves is presented. The devices themselves are categorized and listed in tables. The criteria for the comparison are described, such as transducer type, device sizes, sound pressure level, and others. In the article, a detailed classification of the devices and an analysis of their various applications is made, and the problem with the environmental impact and how to solve it is also considered. The authors conclude that real-world application studies should be sought. In other articles [11,27], a tunable, low-frequency acoustic energy harvesting barrier is presented, which contains the following four parts: the noise acquisition input module, the Helmholtz resonator optimization module, the resonant frequency tuning module, and the electricity generation module. The results presented for it are based on both model and experiment, and show its applicability in different environments and under different conditions.
Also in article [11], a noise barrier for energy harvesting in high speed applications is presented. Researches in this article and in the presented one have been done at different frequencies; we are researching in a frequency range, in order to find the most optimal application. The goal is in future to replace conventional noise protection barriers in a residential environment with ones that can generate energy from sound or noise and can be used for lighting, powering various devices or equipment that would be useful and necessary for the people. All these studies are based on the use of Helmholtz resonators (closed structure) as the main element providing conditions for generating electrical energy from acoustic noise. The study shows that devices for generating electrical energy from acoustic noise consist of three main elements [3,11,27]: a guiding element, an element providing high acoustic pressure, and an element converting acoustic energy into electrical energy. In all the works reviewed by the team, it can be seen that, at the moment, there are no publications on optimizing the shape of the element providing high acoustic pressure values. This has only been done in a few previous studies; in them, the influence of the different geometrical shape of the cross-section of an acoustic barrier element on its ability to generate high acoustic pressure in certain areas was studied [3,11,27]. Three types of geometric shapes were studied: circular sector [24], circular sector with an additional element [23], and logarithmic spiral [25]. It can be seen that by an appropriate choice of semi-open geometric shape and element dimensions, areas with increased acoustic pressure can be created in them. These areas are suitable for placing piezoelectric or other elements for generating electrical energy from acoustic noise.
The purpose of this research is to track the change in the sound pressure level inside an ellipse-shaped pipe sector in areas with increased sound pressure at different central angles of the element opening and relationships of the major and minor axes of the ellipse.

2. COMSOL Model

2.1. Model Description

The modelling of the investigated acoustic barrier element is implemented with the acoustics module of the COMSOL Multiphysics® software version 5.6 [26]. The study was implemented with a 2D “Acoustic-Structural Interaction, Frequency Domain” model of the object. Figure 1 shows a diagram of the studied object with its main dimensions. In the study, only the distance LR3 was changed, which is the distance between the centers of the main pipe sector (p. C), the values of which are given in Table 1.

2.2. Model Parameters

Numerical study of the acoustic barrier sample was performed, with parameters as described in Table 1.
The mesh of the model is shown in Figure 2. When meshing the model, the mesh of the pipe object with rectangular finite elements was first manually defined. The mesh of the acoustic space is then automatically generated with triangular finite elements, with the Element Size ”General physics” mesh setting selected during the automatic meshing.
Figure 3 shows the boundary conditions under which the studies were carried out: Area 1—measuring area 1; Area 2—measuring area 2; Area 3—measuring area 3 and Area 4—measuring area 4; Area 5—measuring area 5 (in front of the source);

2.3. Methodology

The examination was carried out in the following sequence:
  • Modelling of the studied object.
    o
    Selection of the study type/simulation analysis/;
    o
    Modelling of the acoustic barrier element;
    o
    Modelling of the acoustic space;
    o
    Defining the material characteristics of objects;
    o
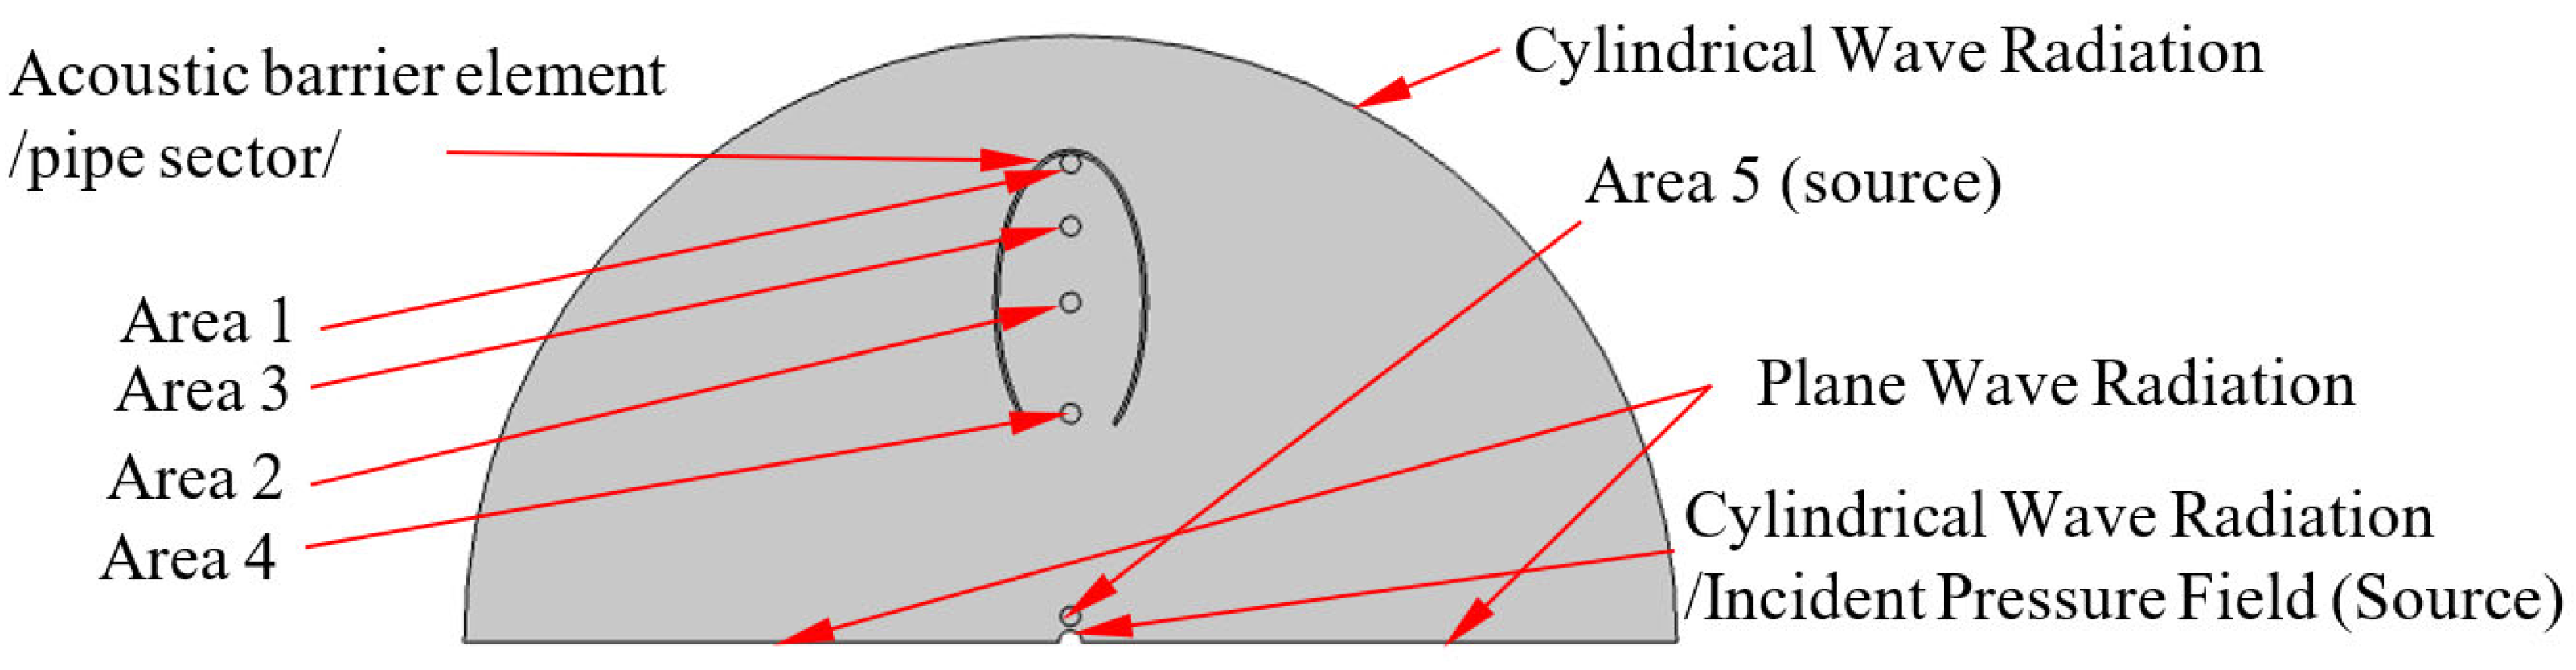
    Setting the boundary conditions of the acoustic space;
    o
    Selection of the type of acoustic pressure source;
    o
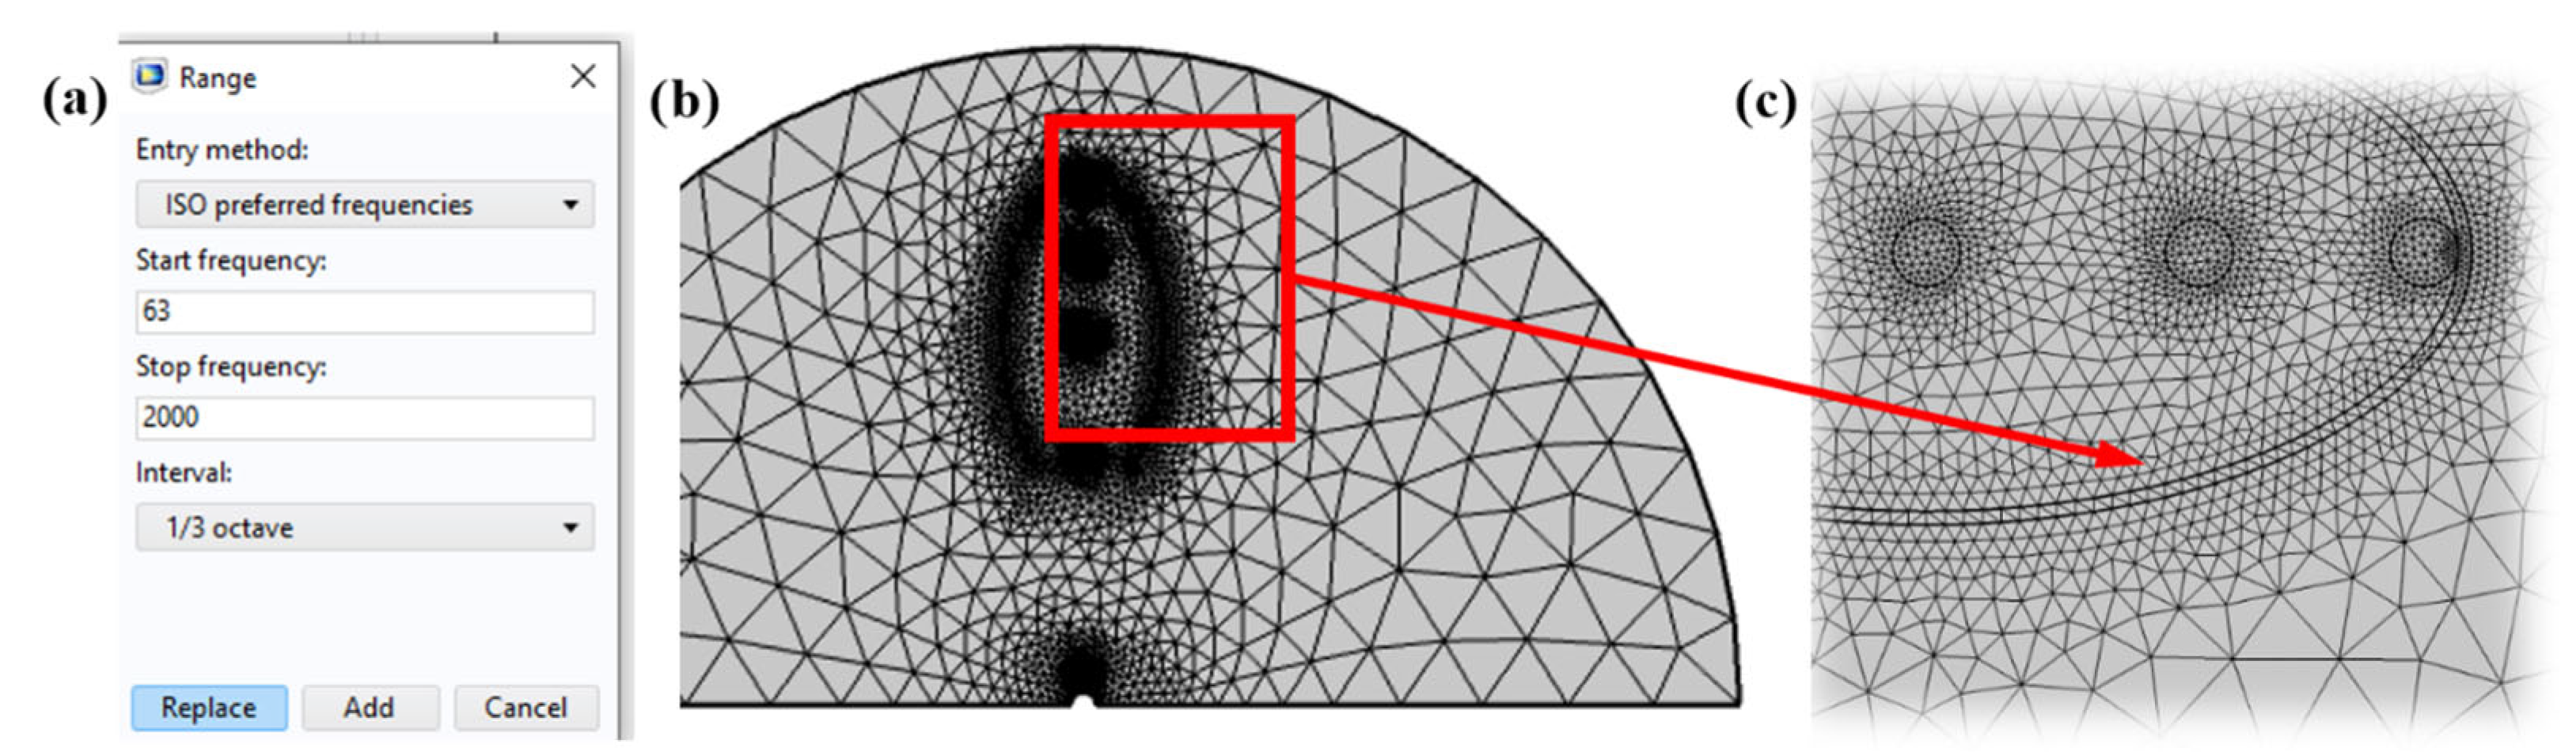
    Defining the meshing of the model (Figure 2);
    o
    Selection of a third-octave frequency range for research from 63 Hz to 2000 Hz ({63, 80, 100, 125, 160, 200, 250, 315, 400, 500, 630, 800, 1 × 10³, 1.25 × 10³, 1.6 × 10³, 2 × 10³} Hz, Figure 2).
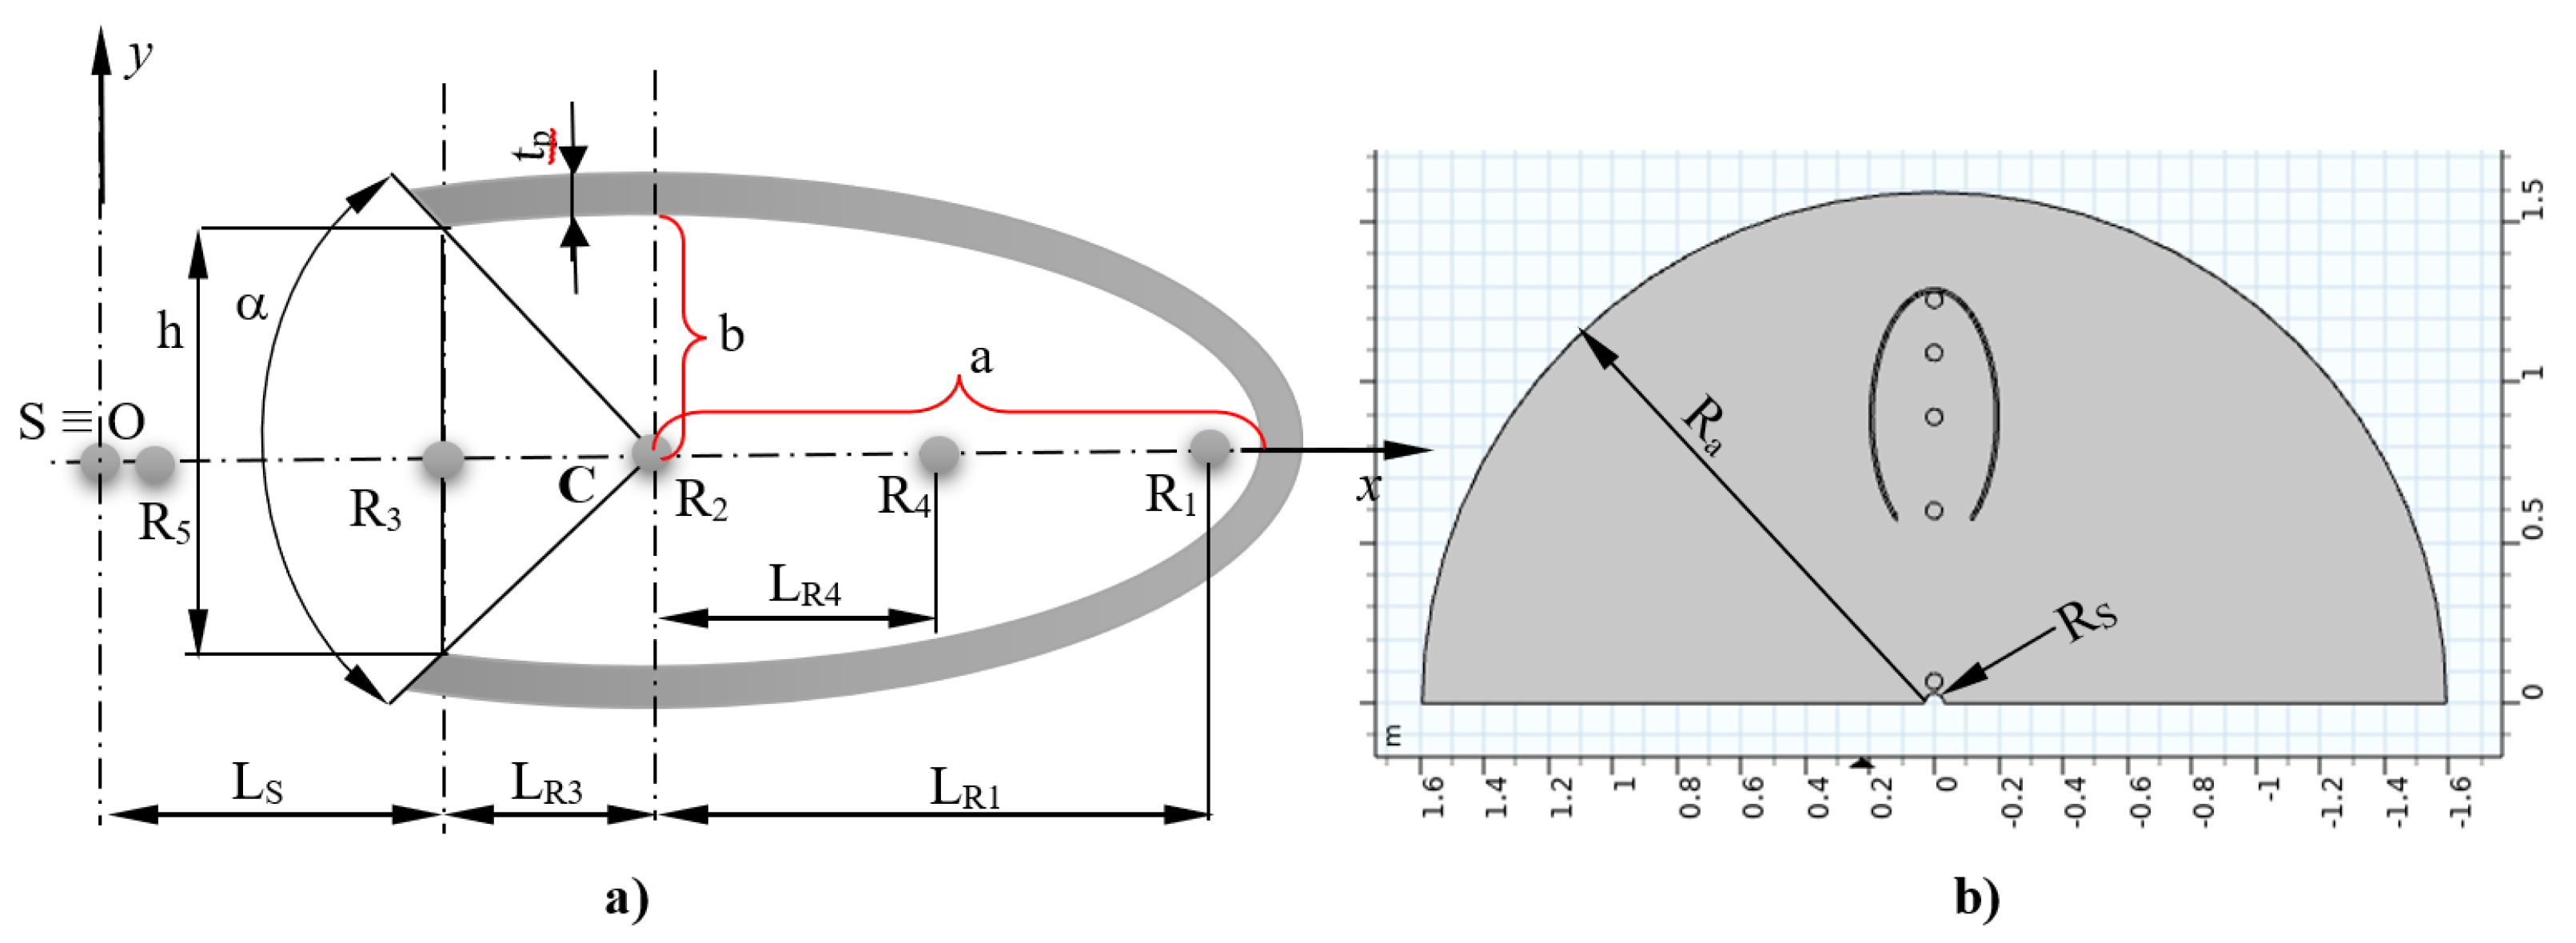
  • It is accepted Ls = const = 0.6 m, for all study options;
  • The dimension for r2 = b = 200 mm is selected;
  • The options for changing the opening of the cross-section of the acoustic element are selected /h = 2·b·sin(α/2), α = 180, 112, 90, 71, 58, 48, 40, 33°/; (a/b = 2);
  • The distance between the center of the element and the opening is determined (Lc);
  • The variants of the relative change of a/b are selected: 1.0; 1.2, 1.4, 1.6, 2.0, 2.2, 2.4, 2.6, 2.8, and 3.0;
  • Defining the areas where the change in the sound pressure level will be tracked when the frequency of the acoustic noise changes:
    • The number of areas is determined;
    • The location of the areas is determined;
    • The size of the areas is determined.
Note: Prior to the study, preliminary control simulation studies were performed to determine the control areas in which the sound pressure level will be measured. The measurement areas must be in the geometry of all the studies variants and visually have a relatively high sound pressure level at all investigated frequencies. For the defined measurement areas, the average value was calculated, which was used as an evaluation parameter;
8.
Defining the areas and parameters for assessment (Domain Probe 1, Domain Probe 2, Domain Probe 3, Domain Probe 4, and Domain Probe 5).
9.
The results of simulation studies for the different sizes of h and a/b are recorded in a table. The following are determined with them:
  • The sound pressure level in area 3 without an acoustic element in third octaves;
  • The sound pressure level by third octaves in the defined areas with an acoustic element (Figure 1);
10.
Processing of results.
  • The results of simulation studies for the different variants of the sector angle and the different sizes of the elliptical sector are recorded in a table. The difference is determined:
ΔL1 = L1,hL3,b, dB
where ΔL1 is the difference in sound pressure level between area 1 and area 3 (without acoustic element) in dB; L1,h is the sound pressure level in area 1 at different values of the central angle of the cut part of the section, L3,b is the sound pressure level in area 3 (in front of the profile) in a simulation study without an profile; Lave is the arithmetic mean of the third-octave values of ΔL1; and Leq is the equivalent value of the third-octave frequencies of ΔL1;
11.
Analysis of the results and conclusions of the research.

3. Results

The results of the simulation studies are presented in tabular (Table 2, Table 3 and Table 4) and graphical form (Figure 4, Figure 5 and Figure 6).

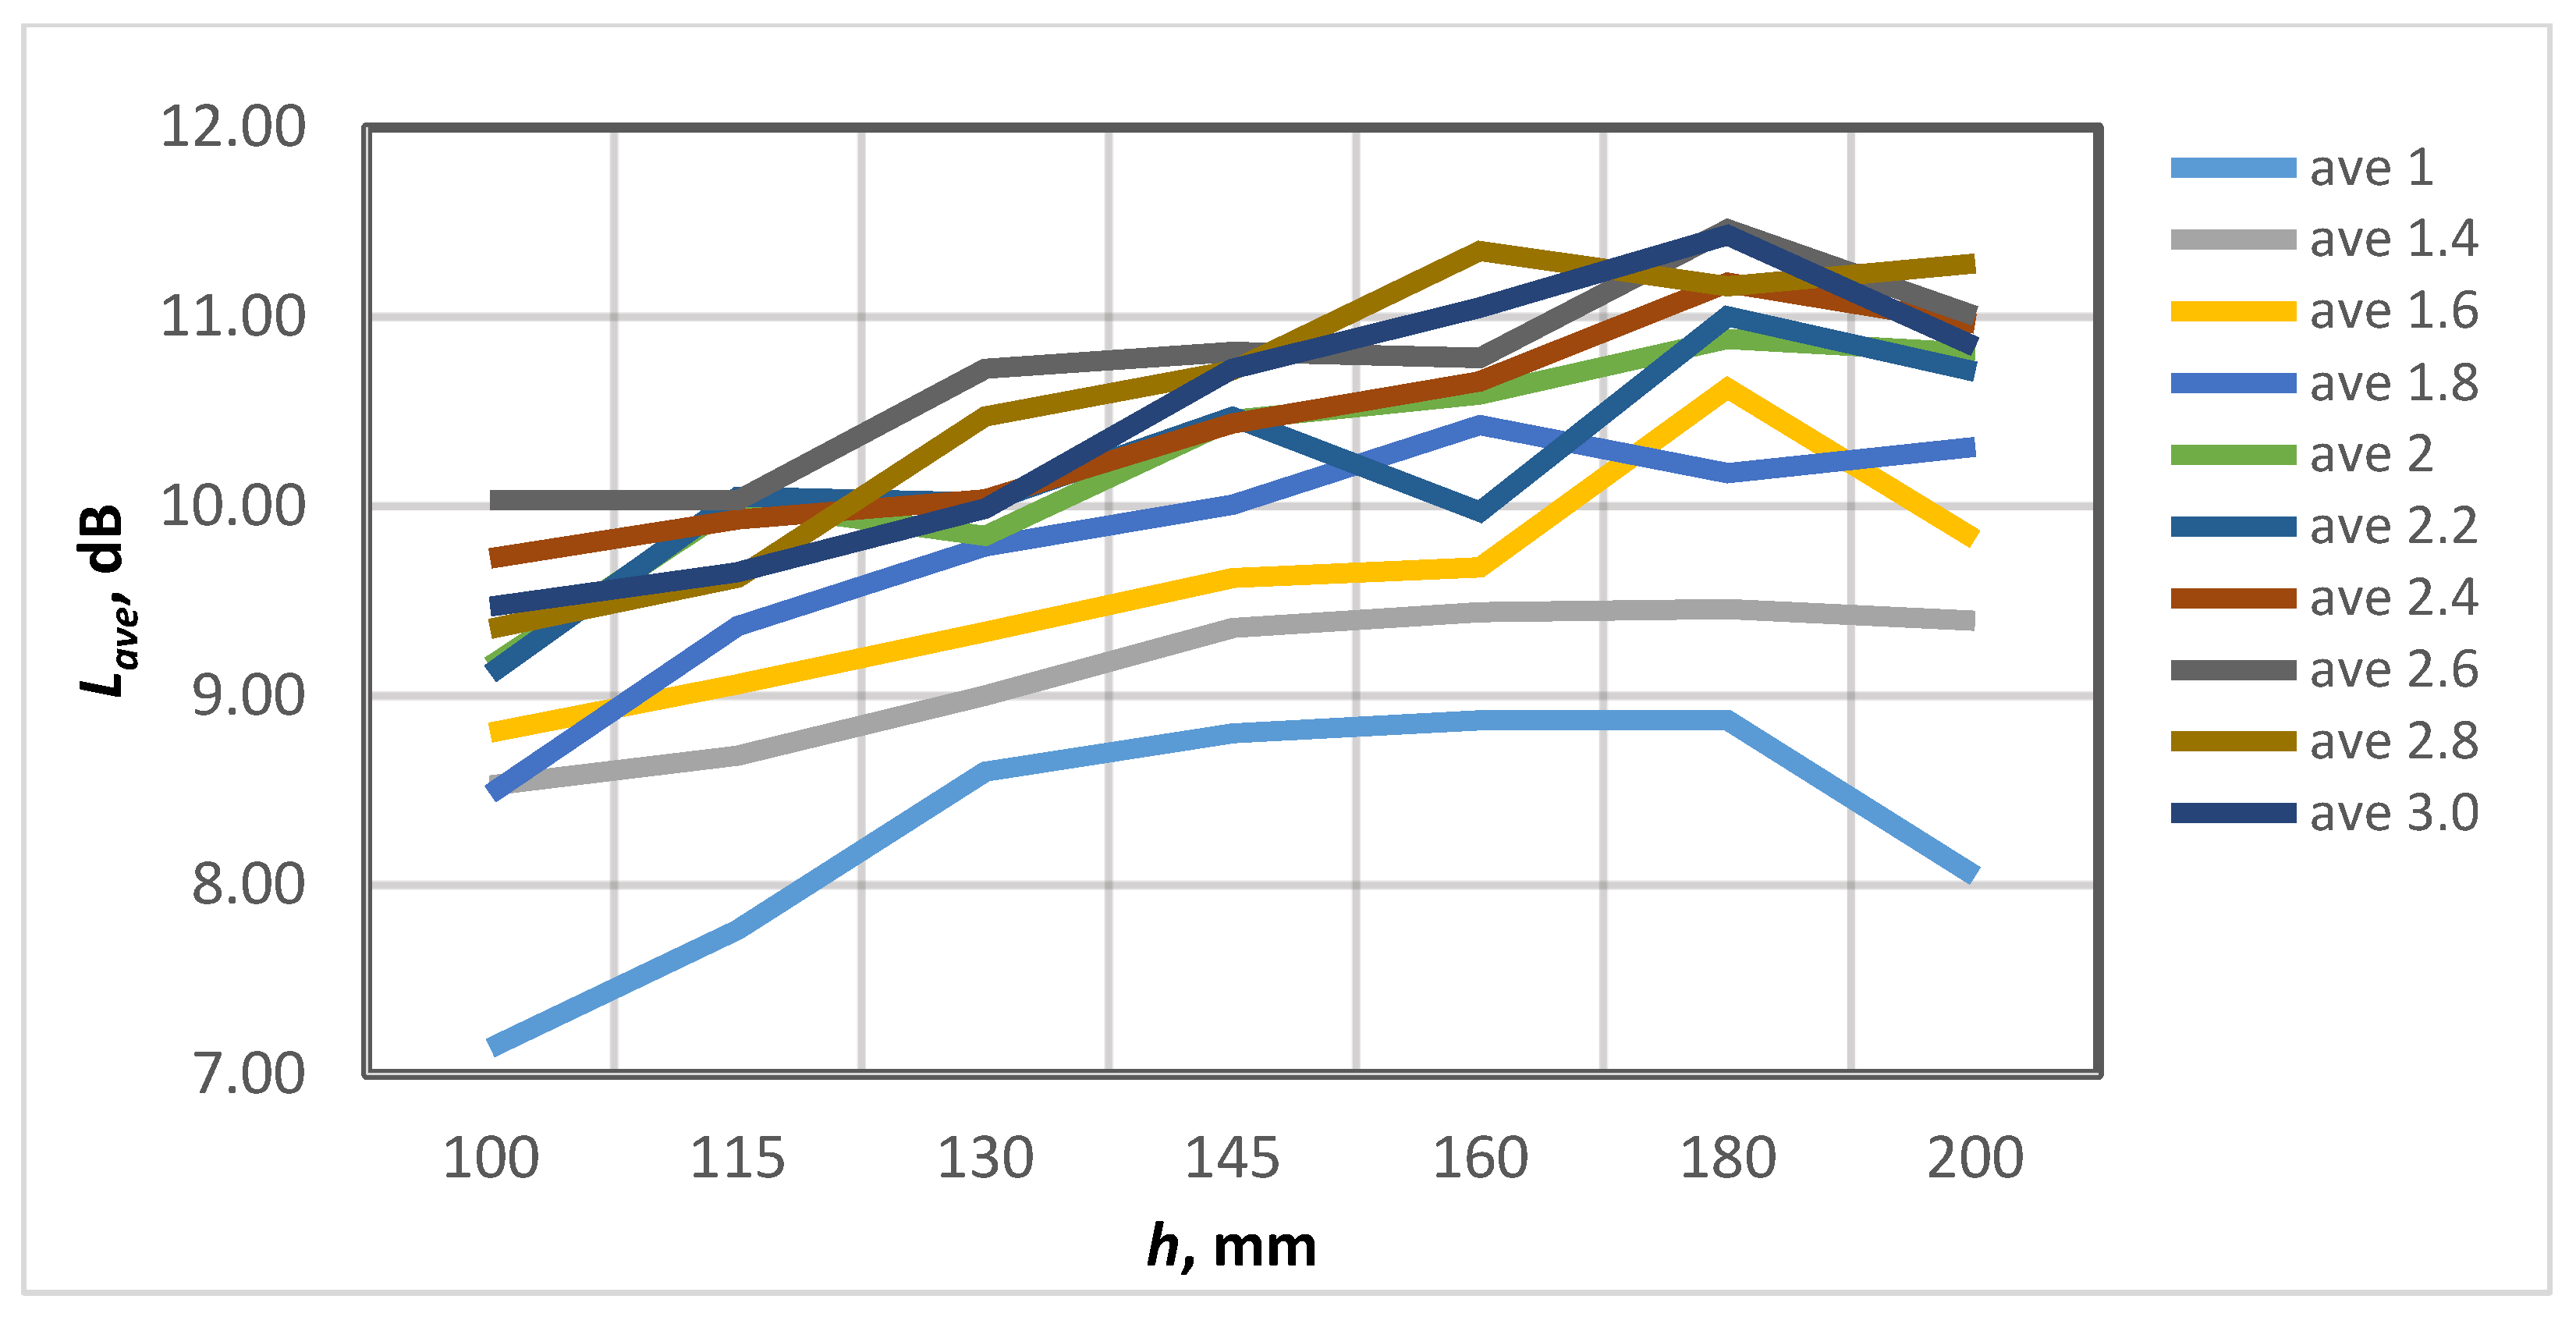
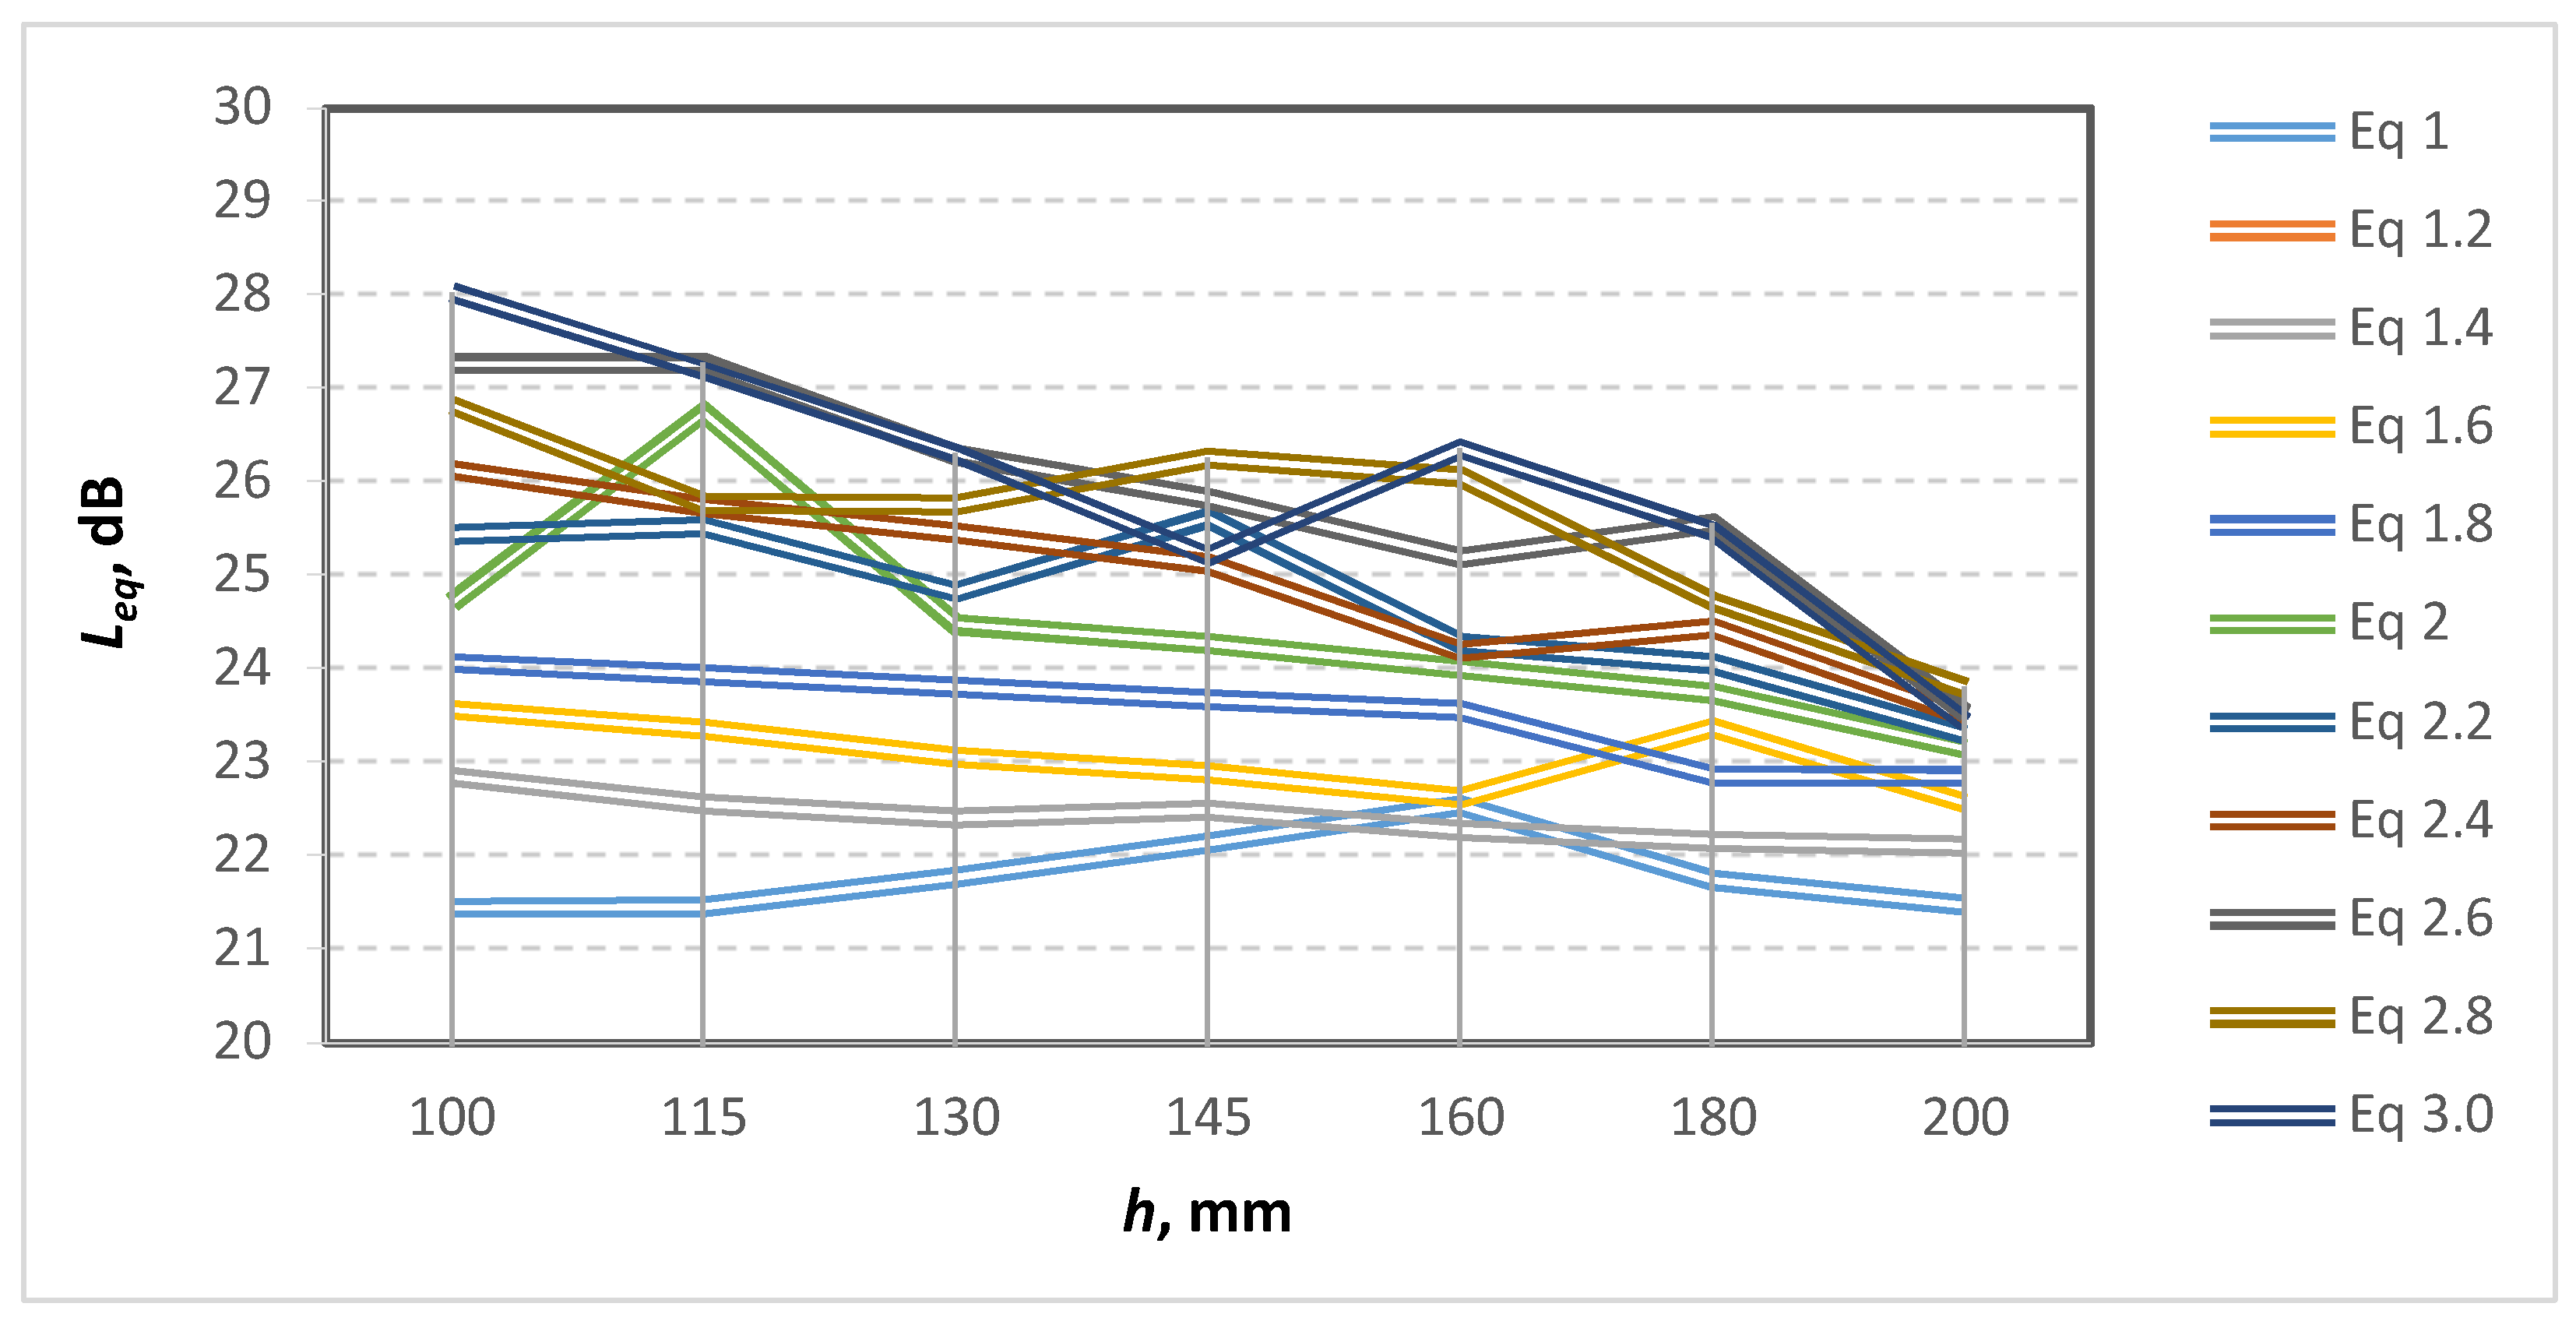
3.1. Average Sound Pressure Level in Four Characteristics Areas at Third-Octave Frequencies

From the conducted studies, only a part of the obtained results is presented in Table 2, Table 3 and Table 4.
Table 2 presents the results of the study of an acoustic barrier element with a circular cross-section (a/b = 1) at different values of the central angle represented by the parameter h. The results of the study with this cross-section are used as a basis for comparison with elliptical cross-sections with different a/b ratios.
Table 3 and Table 4 present the results of the studies for cross-sections (a/b = 2.6 and 3.0), where the highest values of the sound pressure level are obtained.

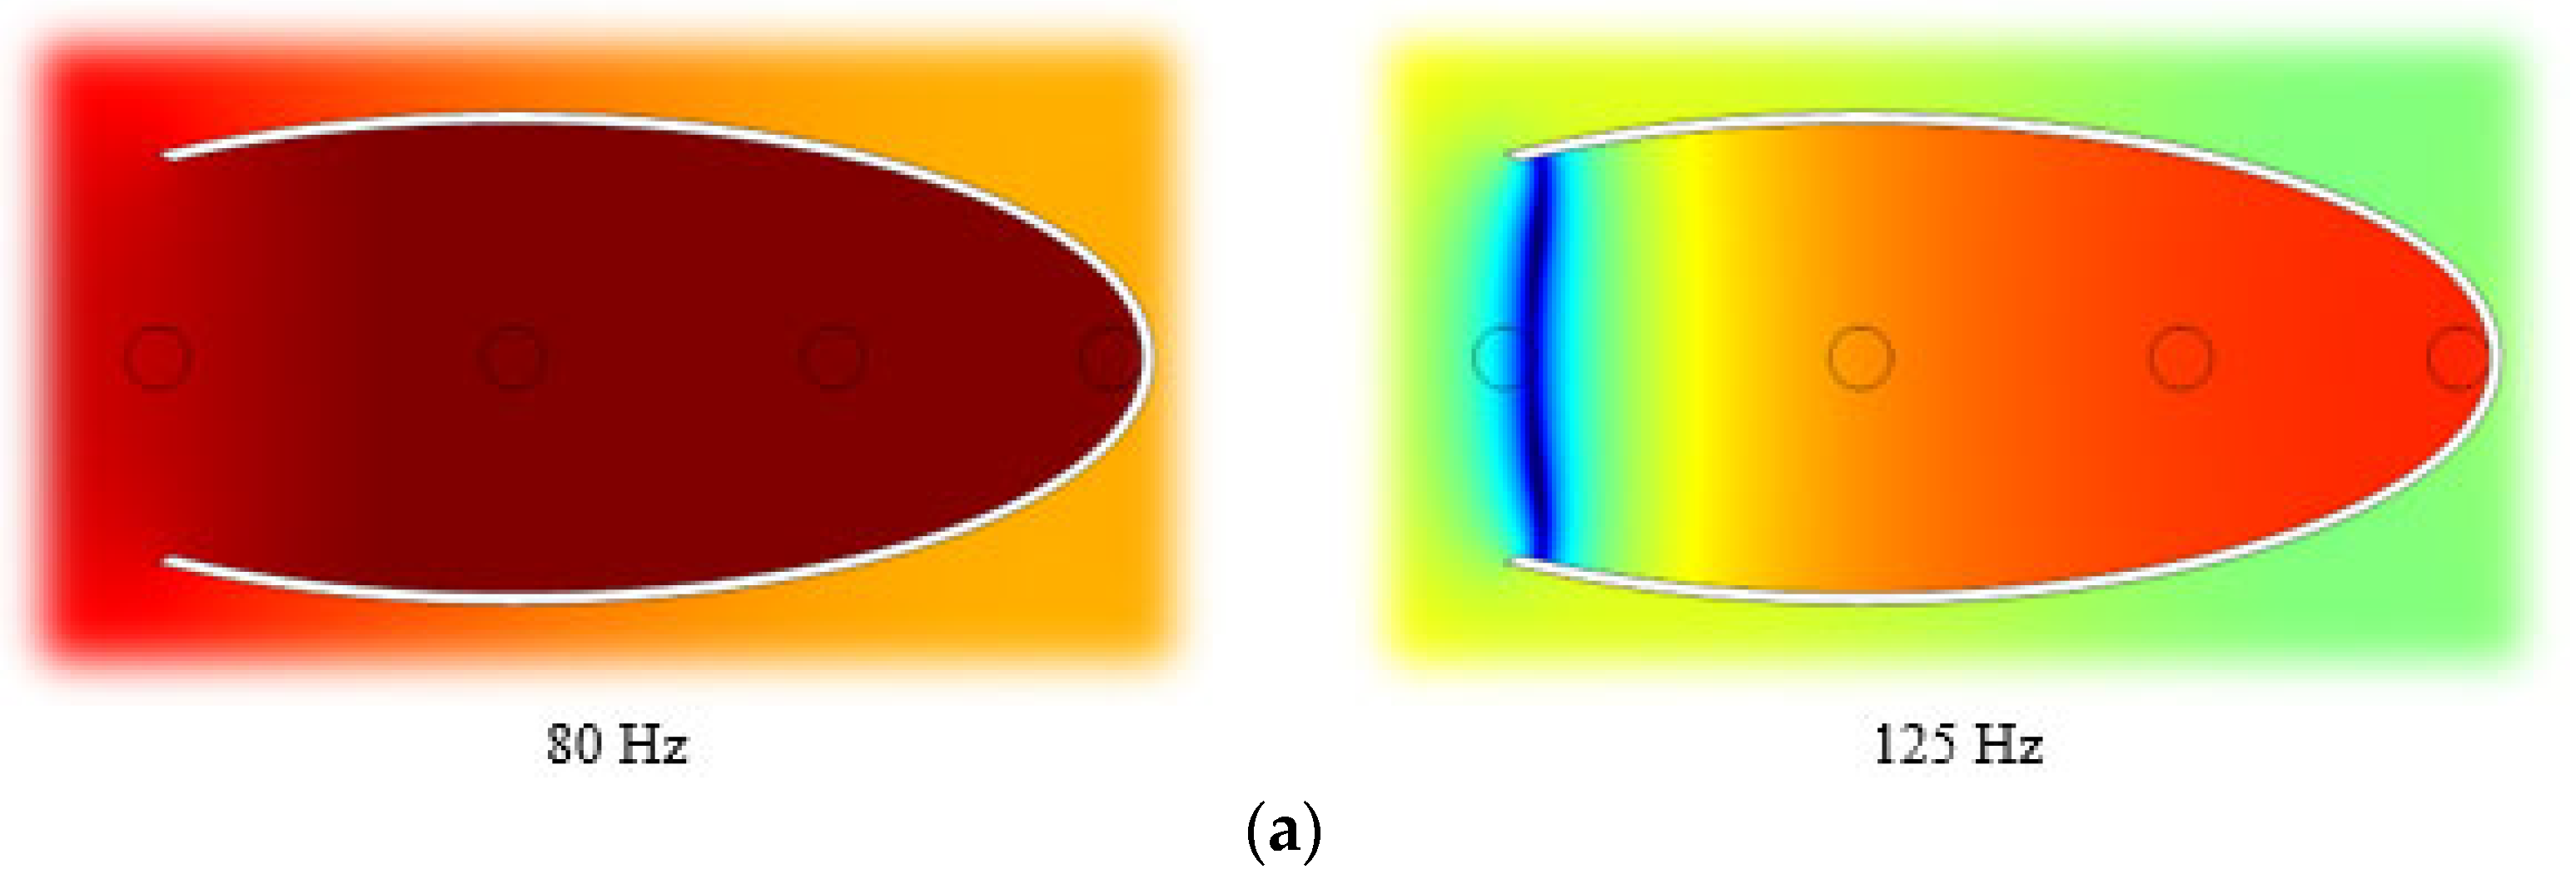
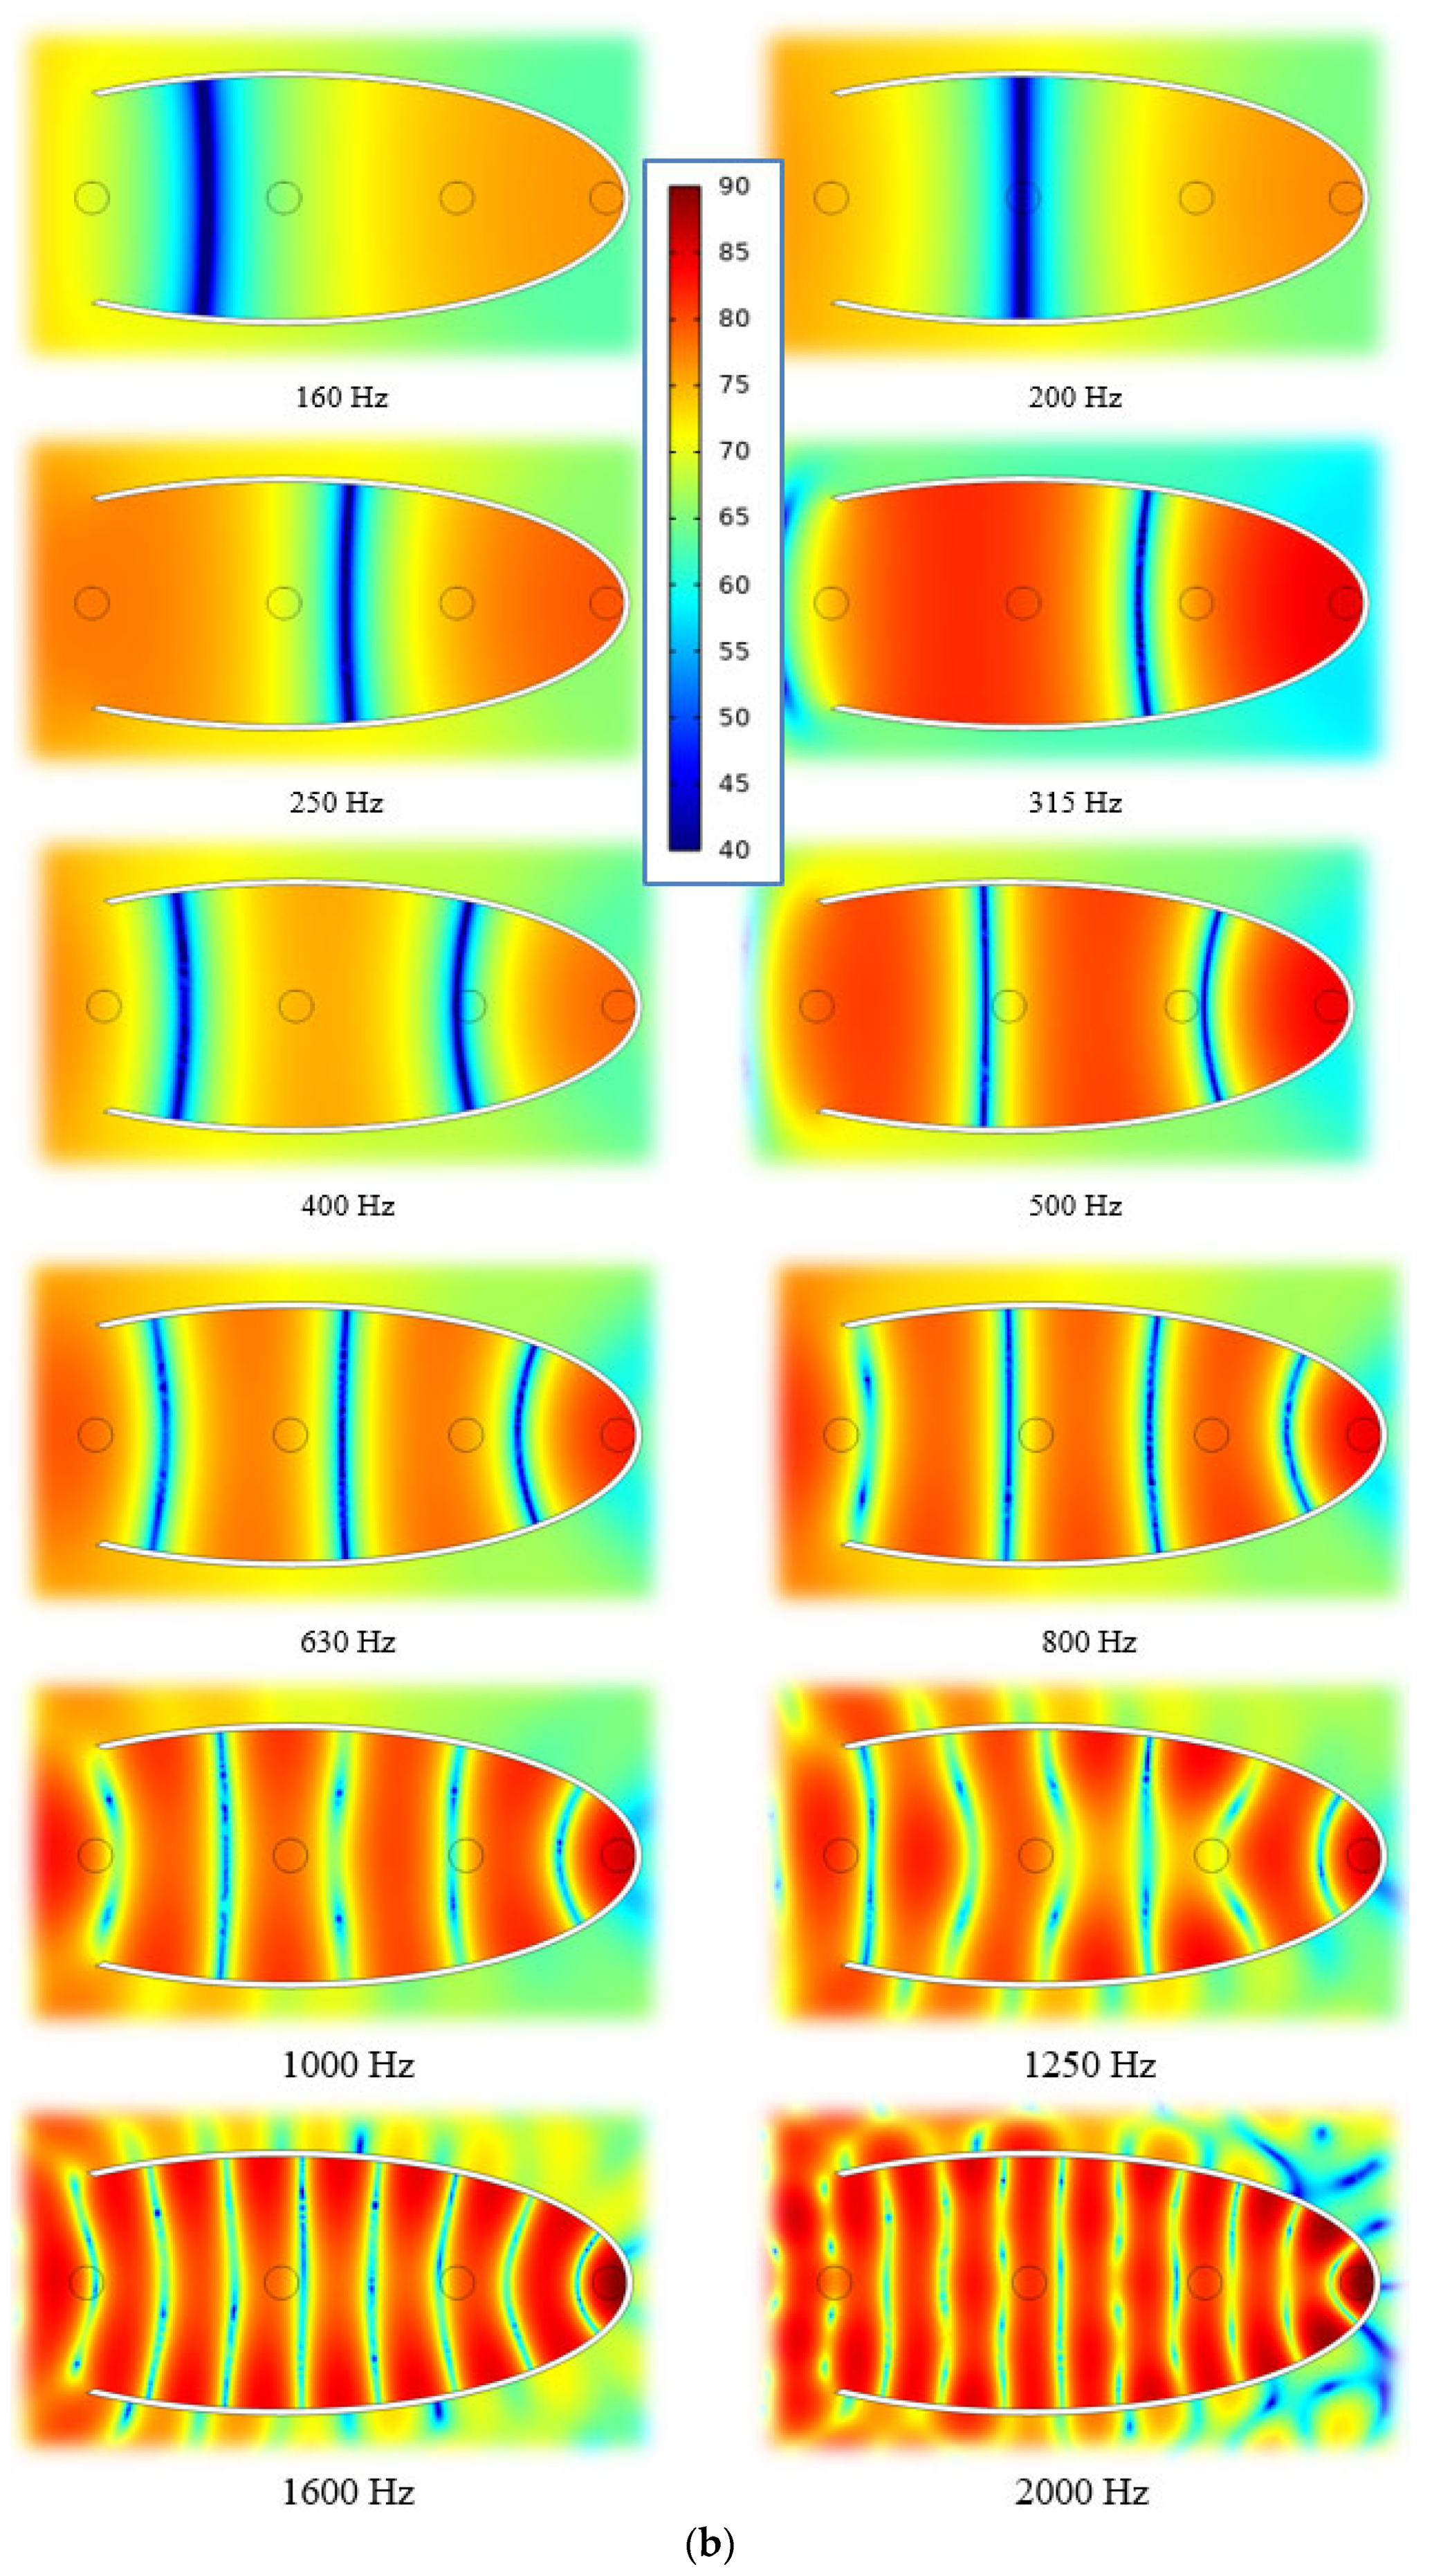
3.2. Sound Pressure Level Distrbution inside the Acoustic Barrier Element with Additional Element at Different Frequencies

Figure 4 show the distribution of the sound pressure level inside the elliptical sector at one value of a/b = 2.6. The figures show where the most favorable areas are for placing devices for generating electrical energy from acoustic noise (highest pressure areas at a given third-octave frequency).

3.3. Analysis of the Results

The largest average values of ΔL1 are obtained in area 1 of the elliptical sector. In this area, the change in the sound pressure level is monitored, when the size of the elliptical acoustic elements is varied.
From the results obtained in the simulation studies, it can be seen that the highest values of the sound pressure level are obtained in area 1. The arithmetic mean value of the sound pressure level for all variants with an elliptical sector is 82.5 dB, while an average value without a profile/sector is 72.2 dB (ΔL1 = 10.3 dB). The value of 82.5 dB is the mean value of the different variants of the central angles at ratio a/b = 2.6. It varies from 80.5 (at a/b = 1.2) to 83.06 (at a/b = 2.6) for different ratios of a/b. When comparing ΔL1 by third octaves for the different variants of central angles and determining their average value (ΔLave), it can be seen that the sound pressure level varies from 7.09 to 11.46 dB (Figure 5). The largest values of ΔLave are obtained at the ratio a/b = 2.6 for all central angles of the cut part of the section (from 10.03 to 11.46 dB), as it can be seen from Table 3 and Figure 5.
The results show that the highest values of the sound pressure level in third octave are obtained at low frequencies (80, 100, and 125 Hz), and the highest value (≈ 27 dB, Table 4) is obtained at the frequency of 80 Hz. It can be seen that as the hole size h increases, ΔL1 decreases. In addition, an increase in ΔL1 at 63 Hz frequency is observed for all variants of h, at the expense of a decrease in ΔL1 at 125 Hz frequency (from 3 dB to 15 dB), and the trend of change is the same as for the following third-octave frequencies.
Regarding the uniform distribution of the efficiency of using the profile in the considered frequency range, the most uniform distribution is observed at the largest values of h (central angle 180°). They do not have very large values of ΔL1 (up to 14 dB), but there are relatively equal values at all third-octave frequencies except for one or two of them. In all variants one of these frequencies is 63 Hz and the other varies depending on the a/b ratio (at 1 it is 2000 Hz, from 1.2 to 2 and above 3 is not observed, but from 2.2 to 2.8 at 315 Hz). The most uneven distribution of the magnitude of ΔL1 (Table 3 and Table 4) is observed at the small values of the central ones (the first three angles). However, with them, the highest values of ΔL1 of 25 to 27 dB are obtained at a real sound pressure level of 90.7 dB to 92.7 dB in the respective variants.
As h increases, a decrease in ΔL1 is observed at third-octave frequencies 80 and 100 Hz, and at 125 Hz only up to the ratio a/b = 1.6. At other third-octave frequencies as h increases, an increase in ΔL1 is observed at third-octave frequencies: 125, 160, 200, 315, and 500 Hz (at certain a/b ratios).
The results show that the elliptical sector acoustic elements are very suitable for generating power from low frequency sources in the range of 63 to 160 Hz.
The largest values of ΔL1 are obtained at a constant value of h = 100 mm at the low third-octave frequencies: 63, 80, 100, 125, 160 Hz, and the magnitude and frequency distribution vary depending on the ratio a/b.
A comparison of the circular cross section (Table 2) with an elliptical one shows that a higher average sound pressure level by up to 3 dB is obtained, as well as higher sound pressure level values at different third octaves. With a circular cross-section, the maximum value of the sound pressure level per third octave that is obtained is 15.07 dB (at a third octave band of 160 Hz), and with an elliptical cross section, values up to 29.96 dB are obtained (at a third octave band of 80 Hz). The geometrically more complex elliptical profile gives a greater number of shape options and hence results (i.e., possibilities to amplify the sound pressure level at certain frequency ranges). For a circular cross-section, seven variants of the distribution of the sound pressure level in third octaves, and 70 variants for an elliptical cross-section are obtained.
From the results presented in Figure 6, it can be seen that for an elliptical sector with a ratio of a/b = 2.6 and 3.0 (Table 3 and Table 4), the highest values of the equivalent sound pres-sure level (Leq) are obtained for all examined variants except one. At a value of the central angle corresponding to h = 145 mm, the highest value of the equivalent sound pressure lev-el is obtained at a/b = 2.8 (Figure 6).
From Figure 5 and Figure 6 it can be seen that the use of an elliptical sector results in ob-taining higher average (Lave) and equivalent (Leq) sound pressure level values for all acous-tic barrier elements with an elliptical shape compared to circular form. This determines a higher efficiency of the acoustic barrier elements with an elliptical shape in terms of the generated electrical energy from acoustic noise.

4. Conclusions

The results show that at small sector angles of the acoustic elements a relatively narrow operating frequency band (in third-octaves) is observed from 63 to 160 Hz with high values of the sound pressure level in area 1. These acoustic elements are suitable for building acoustic barriers for transport flows (road and rail). It has been established that by appropriate selection of the ratio a/b and the sector angle, a wider effective frequency range of the acoustic elements can be provided, which is necessary for noise isolation equipment subjected to the influence of broadband acoustic sources. An increase in the width of the effective frequency range leads to a decrease in the equivalent pressure along the individual third-octaves.
From the research done, it can be seen that by changing the ratio a/b and the sector angle of the elliptical sector acoustic elements, the effective frequency range and the value of the resulting acoustic pressure in area 1 can be influenced. The obtained data show that the use of elliptical sectors as acoustic barrier elements for transport flows are suitable for placing elements for generating electrical energy from acoustic noise.

Author Contributions

Conceptualization, K.N. and I.K.; methodology, E.G. and I.K.; software, E.G. and I.R.; validation, K.N. and E.G.; formal analysis, I.R.; resources, I.K.; data curation, I.R.; writing—original draft, I.R.; writing—review & editing, E.G. and I.K.; visualization, I.R.; supervision, K.N and I.K.; project administration, E.G.; funding acquisition, I.K. All authors have read and agreed to the published version of the manuscript.

Funding

European Regional Development Fund within the Operational Programme “Science and Education for Smart Growth 2014–2020” under the Project CoE “National center of mechatronics and clean technologies“ BG05M2OP001-1.001-0008, 2018–2023.

Institutional Review Board Statement

Not applicable.

Informed Consent Statement

Not applicable.

Data Availability Statement

The data presented in this study are available on request from the corresponding author. The data are not publicly available due to the large volume of data.

Acknowledgments

This work has been financial supported by the European Regional Development Fund within the Operational Programme “Science and Education for Smart Growth 2014–2020” under the Project CoE “National center of mechatronics and clean technologies“ BG05M2OP001-1.001-0008.

Conflicts of Interest

The authors declare no conflict of interest.

References

  1. Yuan, M.; Zioing, C.; Luo, J.; Chou, X. Recent Developments of Acoustic Energy Harvesting: A Review. Micromachines 2019, 10, 48. [Google Scholar] [CrossRef] [PubMed] [Green Version]
  2. Song, C.; Zhao, J.; Ma, X.; Zhang, M.; Yuan, W.; Yang, F.; Wang, Z.; Zhang, X.; Pan, Y. Multi-frequency sound energy harvesting using Helmholtz resonators with irradiated cross-linked polypropylene ferroelectret films. AIP Adv. 2021, 11, 115002. [Google Scholar] [CrossRef]
  3. Choi, J.; Jung, I.; Kang, C.-Y. A brief review of sound energy harvesting. Nano Energy 2019, 56, 169–183. [Google Scholar] [CrossRef]
  4. Kralov, I.; Terzieva, S.; Ignatov, I. Analysis of methods and MEMS for acoustic energy harvesting with application in railway noise reduction. Rom. Rev. Precis. Mech. Opt. Mechatron. 2011, 3, 56–62. [Google Scholar]
  5. Kralov, I. New solution for transport and industrial noise protection through reflective noise barriers. In Proceedings of the 9th International Scientific Conference on Aeronautics, Automotive and Railway Engineering and Technologies, BulTrans, Sozopol, Bulgaria, 11–13 September 2017; Volume 133. [Google Scholar]
  6. Kralov, I.; Nedelchev, K. Lowering the noise level in the transport flows through reduction of the traffic barrier reflected noise. IOP Conf. Ser. Mater. Sci. Eng. 2019, 618, 012051. [Google Scholar] [CrossRef]
  7. Liang, H.; Hao, G.; Olszewski, O. A review on vibration-based piezoelectric energy harvesting from the aspect of compliant mechanisms. Sens. Actuators A Phys. 2021, 331, 112743. [Google Scholar] [CrossRef]
  8. Hu, Z.; Yang, C.; Cheng, L. Acoustic resonator tuning strategies for the narrowband noise control in an enclosure. Appl. Acoust. 2018, 134, 88–96. [Google Scholar] [CrossRef]
  9. Zhang, H.; Zhu, Y. Omnidirectional Ventilated Acoustic Barrier. Appl. Phys. Lett. 2017, 111, 203502. [Google Scholar] [CrossRef] [Green Version]
  10. Noh, H. Acoustic energy harvesting using piezoelectric generator for railway environmental noise. Adv. Mech. Eng. 2018, 10, 1–9. [Google Scholar] [CrossRef] [Green Version]
  11. Wang, Y.; Zhu, X.; Zhang, T.; Bano, S.; Pan, H.; Qi, L.; Zhang, Z.; Yuan, Y. A renewable low-frequency acoustic energy harvesting noise barrier for high-speed railways using a Helmholtz resonator and a PVDF film. Appl. Energy 2018, 230, 52–61. [Google Scholar] [CrossRef]
  12. Hosseinkhani, A.; Younesian, D.; Eghbali, P.; Moayedizadeh, A.; Fassih, A. Sound and vibration energy harvesting for railway applications: A review on linear and nonlinear techniques. Energy Rep. 2021, 7, 852–874. [Google Scholar] [CrossRef]
  13. Qi, S.; Oudich, M.; Li, Y.; Assouar, B. Acoustic energy harvesting based on a planar acoustic metamaterial. Appl. Phys. Lett. 2016, 108, 263501. [Google Scholar] [CrossRef]
  14. Guo, H.; Wang, Y.S.; Wang, X.; Xu, C. Investigation on acoustic energy harvesting based on quarter-wavelength resonator photonic crystals. Adv. Mech. Eng. 2018, 10, 1–13. [Google Scholar] [CrossRef]
  15. Ji, X.; Yang, L.; Xue, Z.; Deng, L.; Wang, D. Enhanced Quarter Spherical Acoustic Energy Harvester Based on Dual Helmholtz Resonators. Sensors 2020, 20, 7275. [Google Scholar] [CrossRef] [PubMed]
  16. Li, B.; You, J.H.; Kim, Y.-J. Low frequency acoustic energy harvesting using PZT piezoelectric plates in straight-tube resonator. Smart Mater. Struct. 2013, 22, 55013. [Google Scholar] [CrossRef]
  17. Li, B.; Laviage, A.J.; You, J.H.; Kim, Y.-J. Harvesting low-frequency acoustic energy using quarter-wavelength straight-tube acoustic resonator. Appl. Acoust. 2013, 74, 1271–1278. [Google Scholar] [CrossRef]
  18. Liu, G.-S.; Peng, Y.-Y.; Liu, M.-H.; Zou, X.-Y.; Cheng, J.-C. Broadband acoustic energy harvesting metasurface with coupled Helmholtz resonators. Appl. Phys. Lett. 2018, 113, 153503. [Google Scholar] [CrossRef] [Green Version]
  19. Kumar, S.; Lee, H.P. The Present and Future Role of Acoustic Metamaterials for Architectural and Urban Noise Mitigations. Acoustics 2019, 3, 590–607. [Google Scholar] [CrossRef] [Green Version]
  20. Yuan, T.; Chen, F.; Yang, J.; Song, R.; Kong, Y. Novel Circular Plate Acoustic Energy Harvester for Urban Railway Noise. Shock Vib. 2021, 2021, 1–13. [Google Scholar] [CrossRef]
  21. Nedelchev, K.; Kralov, I. Efficiency improvement of a vibration energy harvesting generator by using additional vibrating system. In Proceedings of the 43rd International Conference on Applications of Mathematics in Engineering and Economics, AMEE 2017, AIP Conference Proceedings, Sozopol, Bulgaria, 8–13 June 2017. [Google Scholar]
  22. Aleksandrova, M. Spray deposition of piezoelectric polymer on plastic substrate for vibrational harvesting and force sensing applications. AIMS Mat. Sci. 2018, 5, 1214–1222. [Google Scholar] [CrossRef]
  23. Nedelchev, K.; Kralov, I.; Gieva, E.; Ruskova, I. Modeling of acoustic barrier for energy harvesting applications having placed additional element having circle shape with COMSOL. J. Balk. Tribol. Assoc. 2022, 28, 1–14. [Google Scholar]
  24. Gieva, E.; Ruskova, I.; Nedelchev, K.; Kralov, I. COMSOL modelling of acoustic barrier for energy harvesting applications. J. Environ. Prot. Ecol. 2022, 23, 20–29. [Google Scholar]
  25. Nedelchev, K.; Kralov, I. Study of the change of acoustic pressure in an acoustic barrier element in the form of a logarithmic spiral. J. Balk. Tribol. Assoc. 2022, 28, 51–63. [Google Scholar]
  26. COMSOL. Available online: www.comsol.com (accessed on 1 May 2022).
  27. Li, D.; Hu, M.; Wu, F.; Liu, K.; Gao, M.; Ju, Z.; Zhao, J.; Bao, A. Design of tunable low-frequency acoustic energy harvesting barrier for subway tunnel based on an optimized Helmholtz resonator and a PZT circular plate. Energy Rep. 2022, 8, 8108–8123. [Google Scholar] [CrossRef]
Figure 1. Schematic of the model of the 2D studied object and the acoustic space: (a) scheme of the studied elliptical sector with the basic dimensions and location of the control areas, (b) scheme of the acoustic space with the location of the elliptical sector and the acoustic source.
Acoustics 05 00003 g001
Figure 2. Meshed model: (a) menu for defining the studied frequency range at third-octaves; (b) general view of the model mesh; (c) model mesh in the area of the elliptical sector.
Acoustics 05 00003 g002
Figure 3. Boundary conditions and objects in the model.
Acoustics 05 00003 g003
Figure 4. (a) Sound pressure level at a/b = 2.6, and octave = 80, 125Hz. (b) Sound pressure level at a/b = 2.6, and octave = 160, 200, 250, 315, 400, 500, 630, 800, 1000, 1250, 1600, and 2000 Hz.
Acoustics 05 00003 g004aAcoustics 05 00003 g004b
Figure 5. Average value of Lave (on the ordinate) for the different values of the central opening/inlet at the different values of a/b (on the abscissa are the different variants of a/b in ascending order).
Acoustics 05 00003 g005
Figure 6. Equivalent value of the sound pressure level Leq (on the ordinate) for the different values of the central opening/inlet at the different values of a/b (on the abscissa are the different variants of a/b in ascending order).
Acoustics 05 00003 g006
Table 1. COMSOL Model Parameters.
ParameterSymbolValue
Distance between the source and the opening part of the ellipse along the X-axisLS0.6 m.
Distance between p. C (area 2) and the center of area 1LR1a-(tp+ rM) m
Distance between p. C (area 2) and the center of area 3LR3h/tan(α) m
Distance between p. C (area 2) and the center of area 4LR4LR1/2 m
Radius of measurement areasrM0.025 m.
Relative length of the major axlea/b1.0; 1.2; 1.4; 1.6; 2.0; 2.2; 2.4; 2.6; 2.8 and 3.0 m
Length of the small axleb0.2 m.
Location of measuring area 2 relative to point C/coincides with point C/-0 m.
Wall thickness of the pipestp10 mm.
Central corner of the cut part of the sectionα180, 112, 90, 71, 58, 48, 40, 33°.
Height of the cut part of the sectionhb·sin(α/2) m.
Radius of the acoustic spaceRa1.5Ls+LR3+LR1 m
Radius of the sourceRs0.03 m.
Sound pressure of the noise source-1 Pa
Table 2. Results for calculations for ΔL1 at third-octaves for area 1 at a/b = 1.
h, mm100115130145160180200
f, HzΔL1, dBΔL1, dBΔL1, dBΔL1, dBΔL1, dBΔL1, dBΔL1, dB
633.493.353.153.022.822.522.13
8010.8910.5610.209.809.338.506.33
10010.6510.149.639.108.517.535.08
12513.0912.2211.4410.709.958.796.05
16015.0714.5013.7112.8612.0110.848.54
2009.7711.1112.2613.0913.4412.9510.46
2507.298.409.4510.4411.3712.4712.48
3151.612.804.045.376.829.0411.48
4001.542.373.163.954.765.999.29
5004.905.395.856.276.707.318.63
63013.2212.8012.1311.3710.609.669.34
8006.978.329.6010.6911.5012.0010.80
10006.326.686.927.247.9610.1014.15
12508.8710.0411.9314.8116.9012.346.96
1600-0.962.608.939.097.285.059.51
20001.512.945.203.011.946.84-2.46
Lave7.147.768.608.808.878.878.05
Leq21.4521.4621.7722.1322.5421.7521.46
Table 3. Results for calculations for ΔL1 at third-octaves for area 1 at a/b = 2.6.
h, mm100115130145160180200
f, HzΔL1, dBΔL1, dBΔL1, dBΔL1, dBΔL1, dBΔL1, dBΔL1, dB
6314.2014.2012.9711.9510.888.095.49
8025.0925.0922.7321.0919.4619.9214.36
10018.8018.8019.5020.4420.0419.0312.52
1254.814.816.338.5910.4314.3113.28
1601.101.101.722.463.365.4113.34
2003.943.944.304.675.306.319.92
25013.6013.6011.9210.449.178.019.98
3154.924.926.849.2512.0712.746.69
4008.088.087.396.976.917.9812.00
5006.776.778.5110.4811.9711.1611.12
63012.5512.5512.8111.6610.1910.7410.87
80011.5711.5711.3710.7410.5611.5611.94
100010.5810.5811.8511.5310.8712.3811.68
12509.629.6210.9312.5011.2314.6811.64
16008.218.2112.4410.209.8610.6110.51
20006.686.6810.0310.0810.2510.4910.77
Lave10.0310.0310.7310.8210.7811.4611.01
Leq27.2727.2726.2925.8225.2025.5523.52
Table 4. Results for calculations for ΔL1 at third-octaves for area 1 at a/b = 3.0.
h, mm100115130145160180200
f, HzΔL1, dBΔL1, dBΔL1, dBΔL1, dBΔL1, dBΔL1, dBΔL1, dB
6315.3114.3012.8113.8313.8911.287.19
8026.9625.7023.9219.9023.4819.6014.30
10010.1713.5715.5917.7516.0819.7710.59
1251.192.133.264.666.5910.537.14
1601.111.462.012.462.984.1111.38
2007.426.883.416.186.066.358.74
25010.2512.4514.6815.8914.6911.069.06
3152.953.384.025.006.6811.048.32
4008.4111.0113.3413.3011.018.4013.24
5009.828.728.138.108.8411.4910.18
6308.007.718.399.9812.4511.8412.66
80010.609.089.1110.3911.7011.6311.79
100010.3112.6111.4010.2011.4111.7214.07
125010.4110.4711.3811.6211.4213.1613.09
160010.585.989.7211.289.7511.0310.67
20008.069.028.6711.079.789.9411.06
Lave9.479.659.9910.7311.0511.4310.84
Leq28.0327.1926.3025.2126.3525.4723.43
Disclaimer/Publisher’s Note: The statements, opinions and data contained in all publications are solely those of the individual author(s) and contributor(s) and not of MDPI and/or the editor(s). MDPI and/or the editor(s) disclaim responsibility for any injury to people or property resulting from any ideas, methods, instructions or products referred to in the content.

