Article

Effectiveness of MP3 Coding Depends on the Music Genre: Evaluation Using Semantic Differential Scales

by
Nikolaos M. Papadakis
1,2,*,
Ioanna Aroni
3 and
Georgios E. Stavroulakis
2
1
Institute of Computational Mechanics and Optimization (Co.Mec.O), School of Production Engineering and Management, Technical University of Crete, 73100 Chania, Greece
2
Department of Music Technology and Acoustics, Hellenic Mediterranean University, 74100 Rethymno, Greece
3
School of Applied Arts and Sustainable Design, Hellenic Open University, 26335 Patra, Greece
*
Author to whom correspondence should be addressed.
Acoustics 2022, 4(3), 704-719; https://doi.org/10.3390/acoustics4030042
Submission received: 14 June 2022 / Revised: 24 July 2022 / Accepted: 22 August 2022 / Published: 27 August 2022
(This article belongs to the Special Issue Acoustics, Speech and Signal Processing)

Abstract

:
MPEG-1 Layer 3 (MP3) is one of the most popular compression formats used for sound and especially for music. However, during the coding process, the MP3 algorithm negatively affects the spectral and dynamic characteristics of the audio file being compressed. The aim of this study is to evaluate the effect the MP3 coding format for different music genres and different bitrates via listening tests in which the original uncompressed files and the compressed files are compared. For this purpose, five different music genres were selected (rock, jazz, electronic, classical and solo instrument), and the files were compressed in three different bitrates (96 kbps, 160 kbps and 320 kbps). The semantic differential method was used, and ten bipolar scales were selected for the listening tests (e.g., better–worse, more distortion–less distortion, etc.). The following are the most important findings of this study: classical music was negatively affected the most among the genres due to the MP3 compression (lowest ratings in 8 out of 10 bipolar scales), the solo instrument was least affected among the genres (highest rating in 7 out of 10 bipolar scales), and for higher bit rates, the differences in ratings were small for all music genres. The findings of this study could be used to optimize and adapt the standard, depending on the music genre and the musical piece that needs to be encoded.

1. Introduction

MPEG-1 Layer 3 (MP3) is one of the most widely used sound compression methods. Its small storage space requirement (which enables fast distribution over the Internet), along with its compatibility with every audio player, makes it ideal for audio sharing, streaming and online entertainment. Big streaming services, such as Amazon Music, Google Play Music and various others, offer the majority of their content in MP3 form [1]. Audiobook platforms (Audible, Amazon, Scribd, etc.) sell their books exclusively in MP3 form [2]. Even forensic analysis and investigation make use of the algorithm [3,4] for detecting forgeries, etc.
MP3’s build takes advantage of our hearing’s inability to perceive all the information contained in a complex audio signal (perceptual audio coding). All perceptual coding algorithms contain a filterbank, a perceptual model, quantization and coding elements. The encoder contains a hybrid filterbank (polyphase and modified discrete cosine transform (MDCT)) through which the audio signal passes and becomes divided into sub-bands [5]. The polyphase filterbank divides the signal into 32 equal sub-bands, and the MDCT splits those sub-bands into 18 smaller ones, creating a total of 576 frequency lines [6]. Simultaneously, the signal passes through the FFT block that transforms the signal in the frequency domain. The output of the FFT block feeds the psychoacoustic model. The psychoacoustic model uses the critical bands of human hearing [7,8] to determine which part of the information contained can be discarded as inaudible. Next comes the distortion control loop, where the quantization of the signal takes place and the Huffman encoding block encodes the quantized values, producing the final audio signal. More details on the MP3’s encoding process can be found in [9].
MP3 is a lossy compression algorithm. As the term “lossy” implies, when the compression takes place, parts of the information contained in the audio signal are lost. As stated in [10], the person performing the encoding can specify how many bits should be allotted to storing each second of music, which in effect sets a “tolerance” level—the lower the data storage allotment, the more data will be discarded and the worse the resulting music will sound. This specification determines the bitrate of an MP3 file. The bitrate can range from 8 kbps to 320 kbps [6], and the recommended bitrate is at least 128 kbps [11]. Two more features that the user can control and affect the size and quality are the sampling rate, which is determined by the MPEG-1 protocol at 32 kHz, 44.1 kHz and 48 kHz [12], and the channel mode, with four supported choices: monophonic mode, stereo mode, dual-monophonic mode (identical to stereo mode) and joint stereo mode [13]. Some studies have suggested improvements on the MP3 algorithm, in terms of encryption [14], prevention of multiple compression [15], improved over-the-Internet transmission [16] and also for improving the quality of low bitrate files [17].
The MP3 algorithm, however, has some disadvantages regarding the quality of the audio files, due to its lossy nature. The usage of lossy, perceptual compression alters the sound being compressed. According to [18,19], the most common artifacts are the birdie effect, pre-echo effect, spectral clipping in the high frequencies, spatial distortions and temporal smearing. Most of the previous work carried out focuses on the objective evaluation of the MP3 algorithm [20,21,22], the comparison of the algorithm with high resolution audio [23] and the comparison among different compression algorithms (in terms of quality) for a variety of music genres [24], rather than the comparison between the MP3 and WAV formats [25,26]. Although these studies have identified and described in detail the nature of the MP3 artifacts and the impact these have on the audio signal, the human factor is almost absent in the majority of them. The MP3 algorithm is a product addressed to humans, and humans perceive sound through a non-linear mechanism that renders some features more or less audible than objective measurements can reveal. Moreover, there are hundreds of musical genres, each with their own unique sound characteristics. The MP3 algorithm is applied on all of them; thus, it is of great importance to subjectively evaluate the impact it has on as many genres as possible.
In order to study the artifacts produced by the algorithm, questionnaires were created, according to the semantic differential method [27]. The aim of this research is to study the alterations introduced by the MP3 algorithm in five musical genres (rock, jazz, electronic, classical and solo) using three different bitrates (96 kbps, 160 kbps and 320 kbps). The alterations are going to be evaluated with the use of questionnaires including ten bipolar scales.
This paper has been organized as follows: Section 2 presents the methodology employed. Section 3 includes the findings of the research, while the discussion section analyzes the data, addresses the research questions and identifies areas for further research. Finally, the conclusion section gives a brief summary of this research and contextualizes the study.

2. Methods

2.1. Musical Excerpts

Five music genres were used in this study: rock, jazz, electronic, classical and solo instrument. The genres examined where chosen based on their popularity in various music-linked studies [28,29,30], in music genre classification studies [31,32,33] and in similar studies (rock and classical) [25,26], with the exception of “solo instrument”, which is not a music genre but possesses unique features, as mentioned later. Table 1 shows the pieces selected for each music genre and additional information. Short audio clips of each piece (in WAV format) were chosen, with durations ranging from 8 to 11 s. This was carried out for two reasons: to make sure that all participants would rate the exact same audio excerpt and to keep the duration of the listening tests to a minimum and avoid participants’ fatigue.
The audio clips were carefully selected so they would contain all the unique characteristics that represent each music genre. Rock music’s features usually are distinct vocals, electric guitars, electric bass and intense drum line. Jazz’s features are complicated melodic lines (often without the presence of vocals), dynamic fluctuations, use of wind instruments (trumpet, saxophone, etc.), distinct rhythmic patterns that come from string instruments (guitars, double-bass, electric bass) and piano. Electronic music’s features are exclusively electronic instruments (samplers, pads, etc.), simple, repeating melodic patterns and fast tempo. Classical music’s features are wide variety of acoustic instruments (wind instruments, chordophones, percussions, piano) in big numbers, multiple and complex melodic lines and significant dynamic fluctuations. The category of the “solo instrument” is not a music genre in itself. However, its characteristics are widely different from any music genre. The frequency range of the sound is limited to the instrument’s capabilities, a very small number of melodic lines can be present (one or two), the timbre of the sound is constant and the masking effect taking place in such an audio excerpt is different from any specific music genre.
Out of these WAV audio clips selected, three MP3 files were created for each genre, in three bitrates: 96 kbps, 160 kbps and 320 kbps. In total, for each music genre, four audio files were used: one WAV (44.1 kHz, 16-bit) and three MP3’s (96 kbps, 160 kbps and 320 kbps). All files were encoded with the LAME MP3 encoder (sampling frequency 44.1 kHz).
The bitrate 96 kbps is one step below the recommended 128 kbps bitrate of the standard and is very popular for streaming, while 320 kbps is the highest available bitrate and is thus the one that produces the highest quality. These two bitrates have been used in similar studies [25,34] and the 96 kbps bitrate in one study [26]. On the other hand, 160 kbps is not a very popular bitrate amongst studies but is one step above the recommended bitrate and has a good compression/quality ratio. Some suggest that 160 kbps should be the minimum bitrate used for the compression of all audio files [35]. It is also the lowest bitrate used in some download and streaming applications, such as audiobook platforms. Spectrographs of the original and compressed files, as well as their dynamic ranges, can be found in Figure 1 and in Appendix A, respectively.

2.2. Participants

In total, 30 persons participated in the listening tests (Mage = 23.8 years, SDage = 2.5 years). According to Heise [36], the minimum number of participants for conducting tests using the semantic differential method is 30. They comprised 15 male participants (Mage = 24.0 years, SDage = 3.0 years) and 15 female participants (Mage = 23.5 years, SDage = 2.0 years). Participants’ ages ranged from 18 to 29 years. This particular age range was chosen in order to avoid age-related hearing loss [37]. In order to achieve a homogenous group, a qualified majority of participants were university students, self-reporting normal hearing. The participants were recruited through an ad posted in a university campus. During recruitment, participants were told that the study involved listening tests on several perceptual attributes. All participants are users of MP3 audio files on a daily basis. All participants, self-reported, were not professional musicians. In total, five participants reported being amateur musicians. No participants reported possessing a technical knowledge regarding the algorithm’s function. Participants were not reimbursed for their time and took part voluntarily. Informed consent was obtained from all participants before the experiment.

2.3. Questionnaire

In order to form the questionnaire for this study, various other approaches and questionnaires from other audio-linked studies were taken into account [24,25,38,39,40,41,42]. For this study, the semantic differential method [27] was selected in order to evaluate various aspects of the MP3 compression effects. This method allows the measurement of objective sound characteristics (amplitude, frequency, etc.) by using easily perceived, bipolar subjective scales.
The three criteria for selecting the bipolar scales used in semantic differential method were compliance with the EPA (Evaluation, Potency, Activity) structure, the nature of the subject examined [43] (in this case, the evaluation of the audio files’ compression) and the easy and common interpretation by the participants. Each scale belongs to one of three categories (Evaluation, Potency, Activity), called factors. The Evaluation and Activity factors contain three scales each, and the Potency factor contains four scales. All scales are linear and semantically stable. Linearity is a characteristic associated with the integers appointed to each interval of a scale. According to the method [44], all intervals are assumed to be equal, so consecutive integers are appointed to each interval, ranging from −3 (negative pole) up to 3 (positive pole). Semantic stability is associated with the ability of the participants to interpret the meaning of the scale in the exact same way [45]. Table 2 shows the bipolar scales used for each factor.

2.4. Experimental Design and Procedure
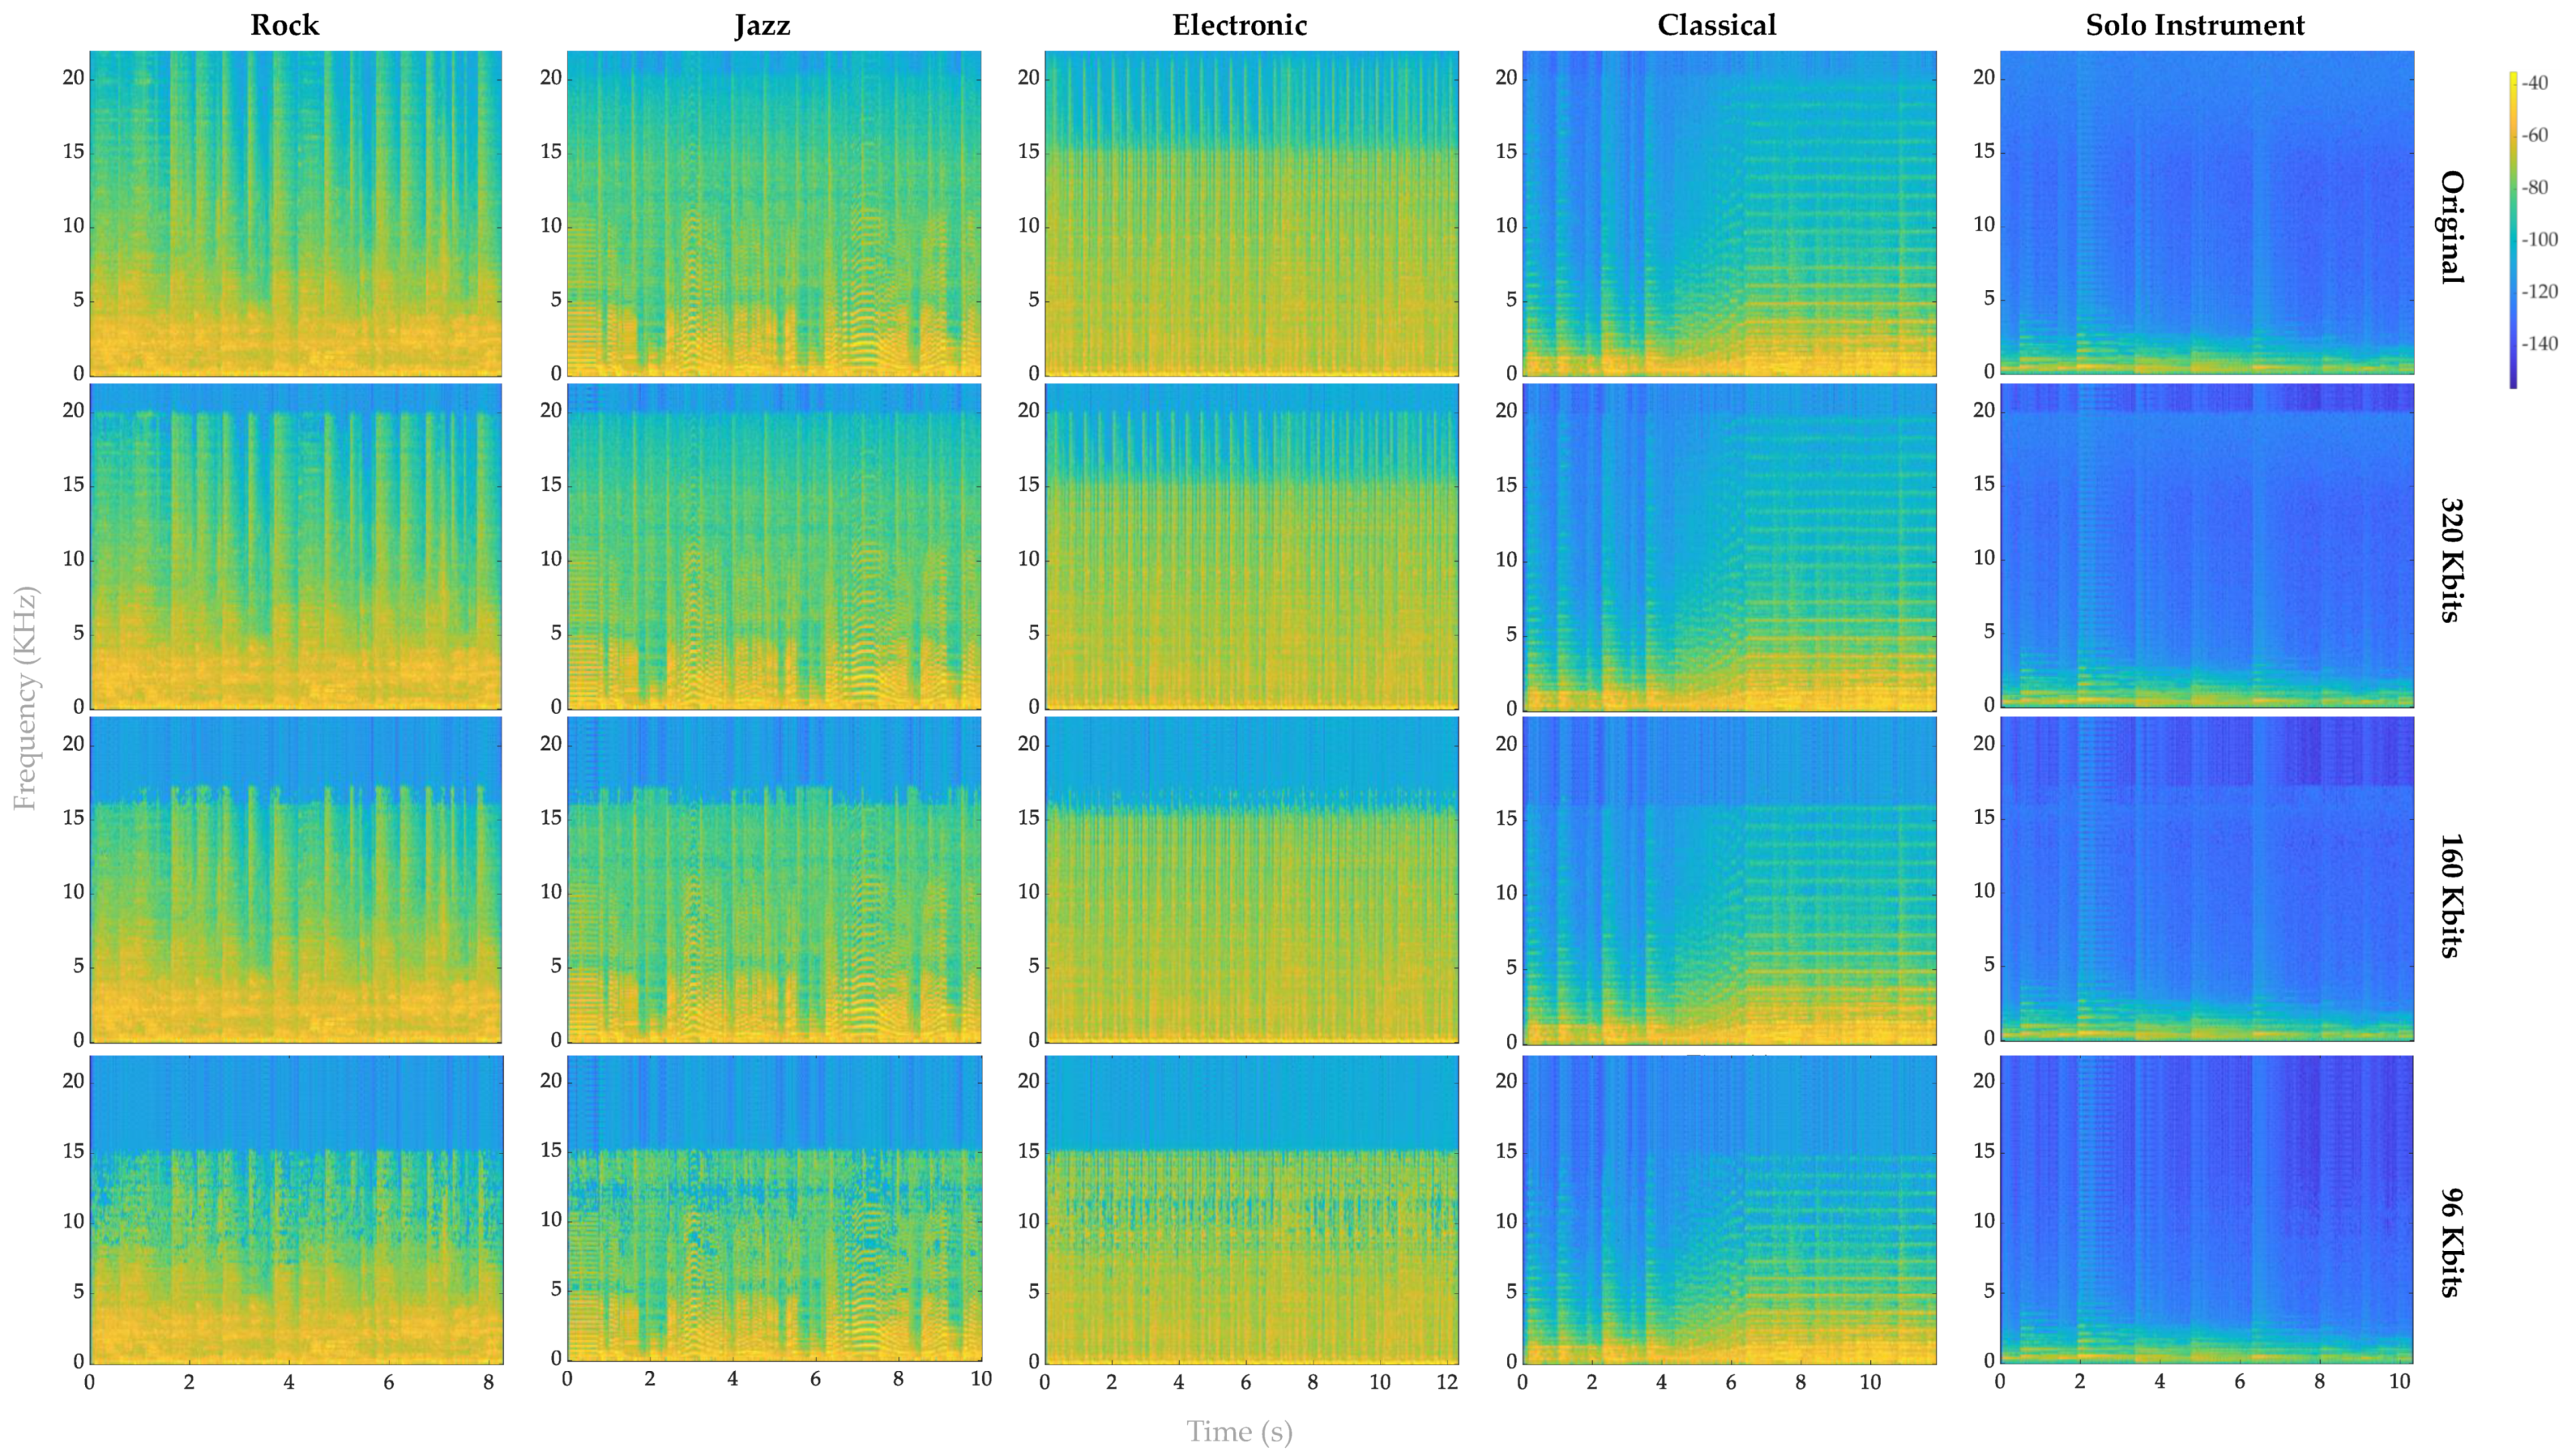
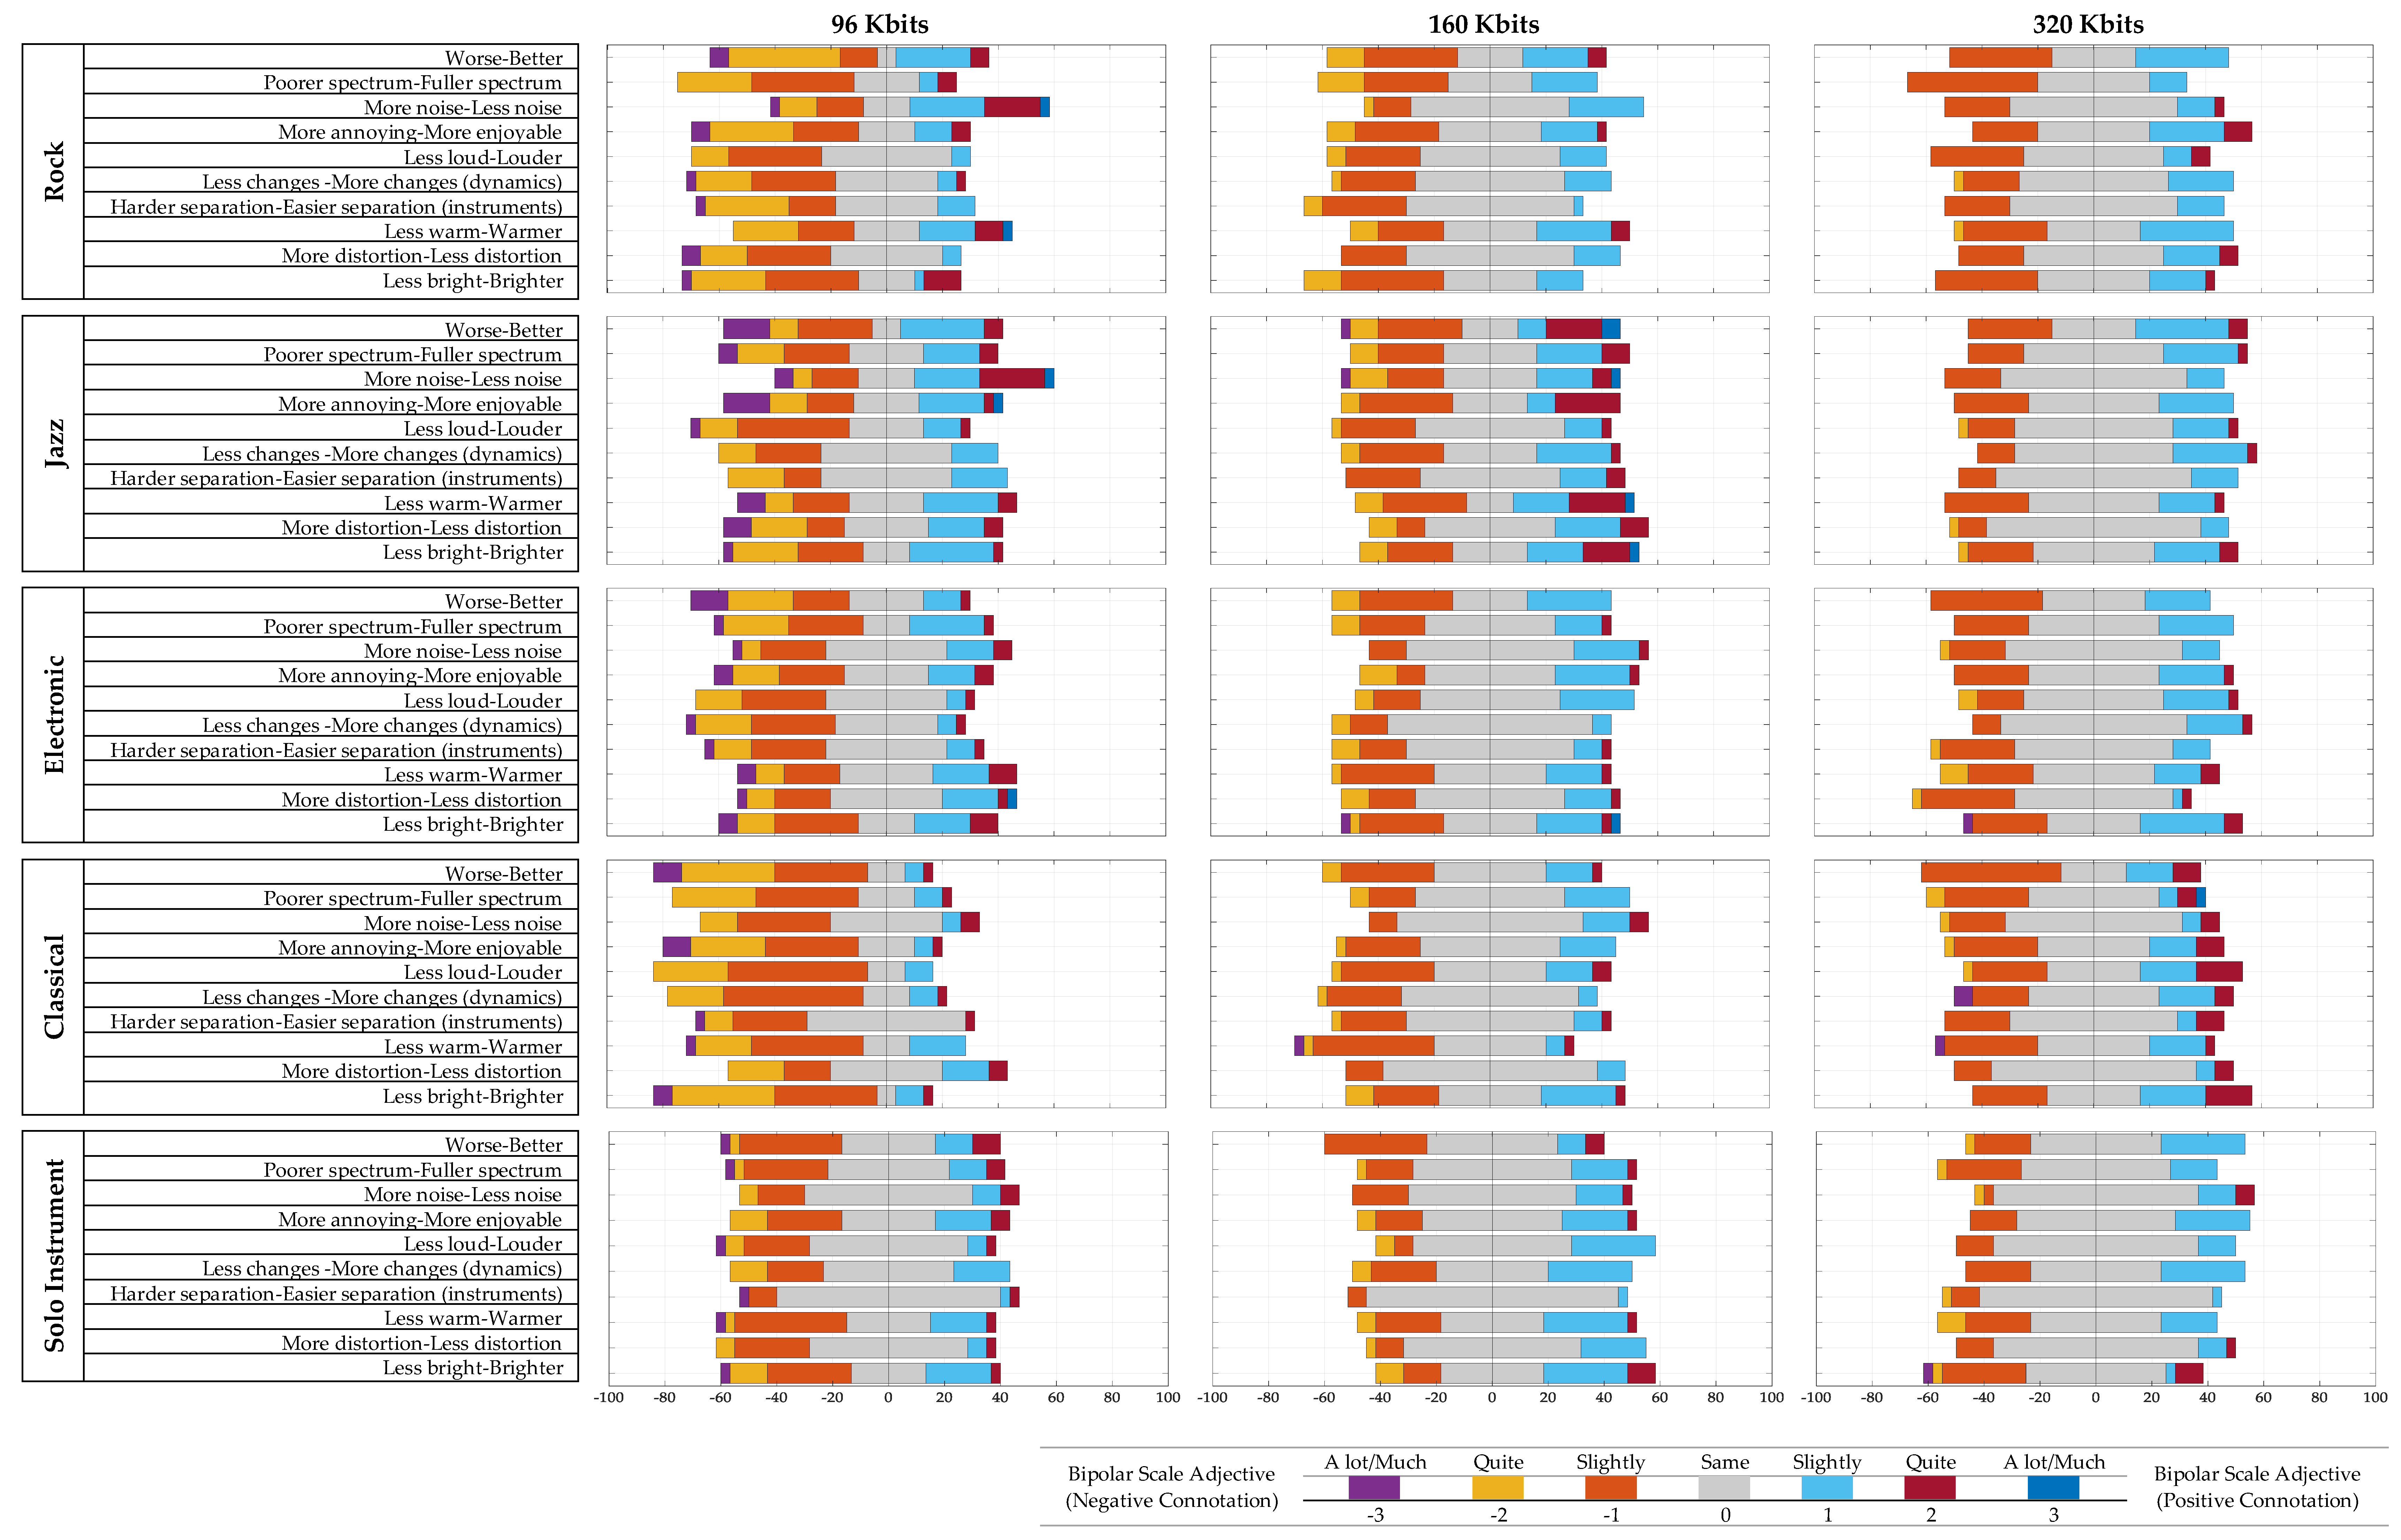
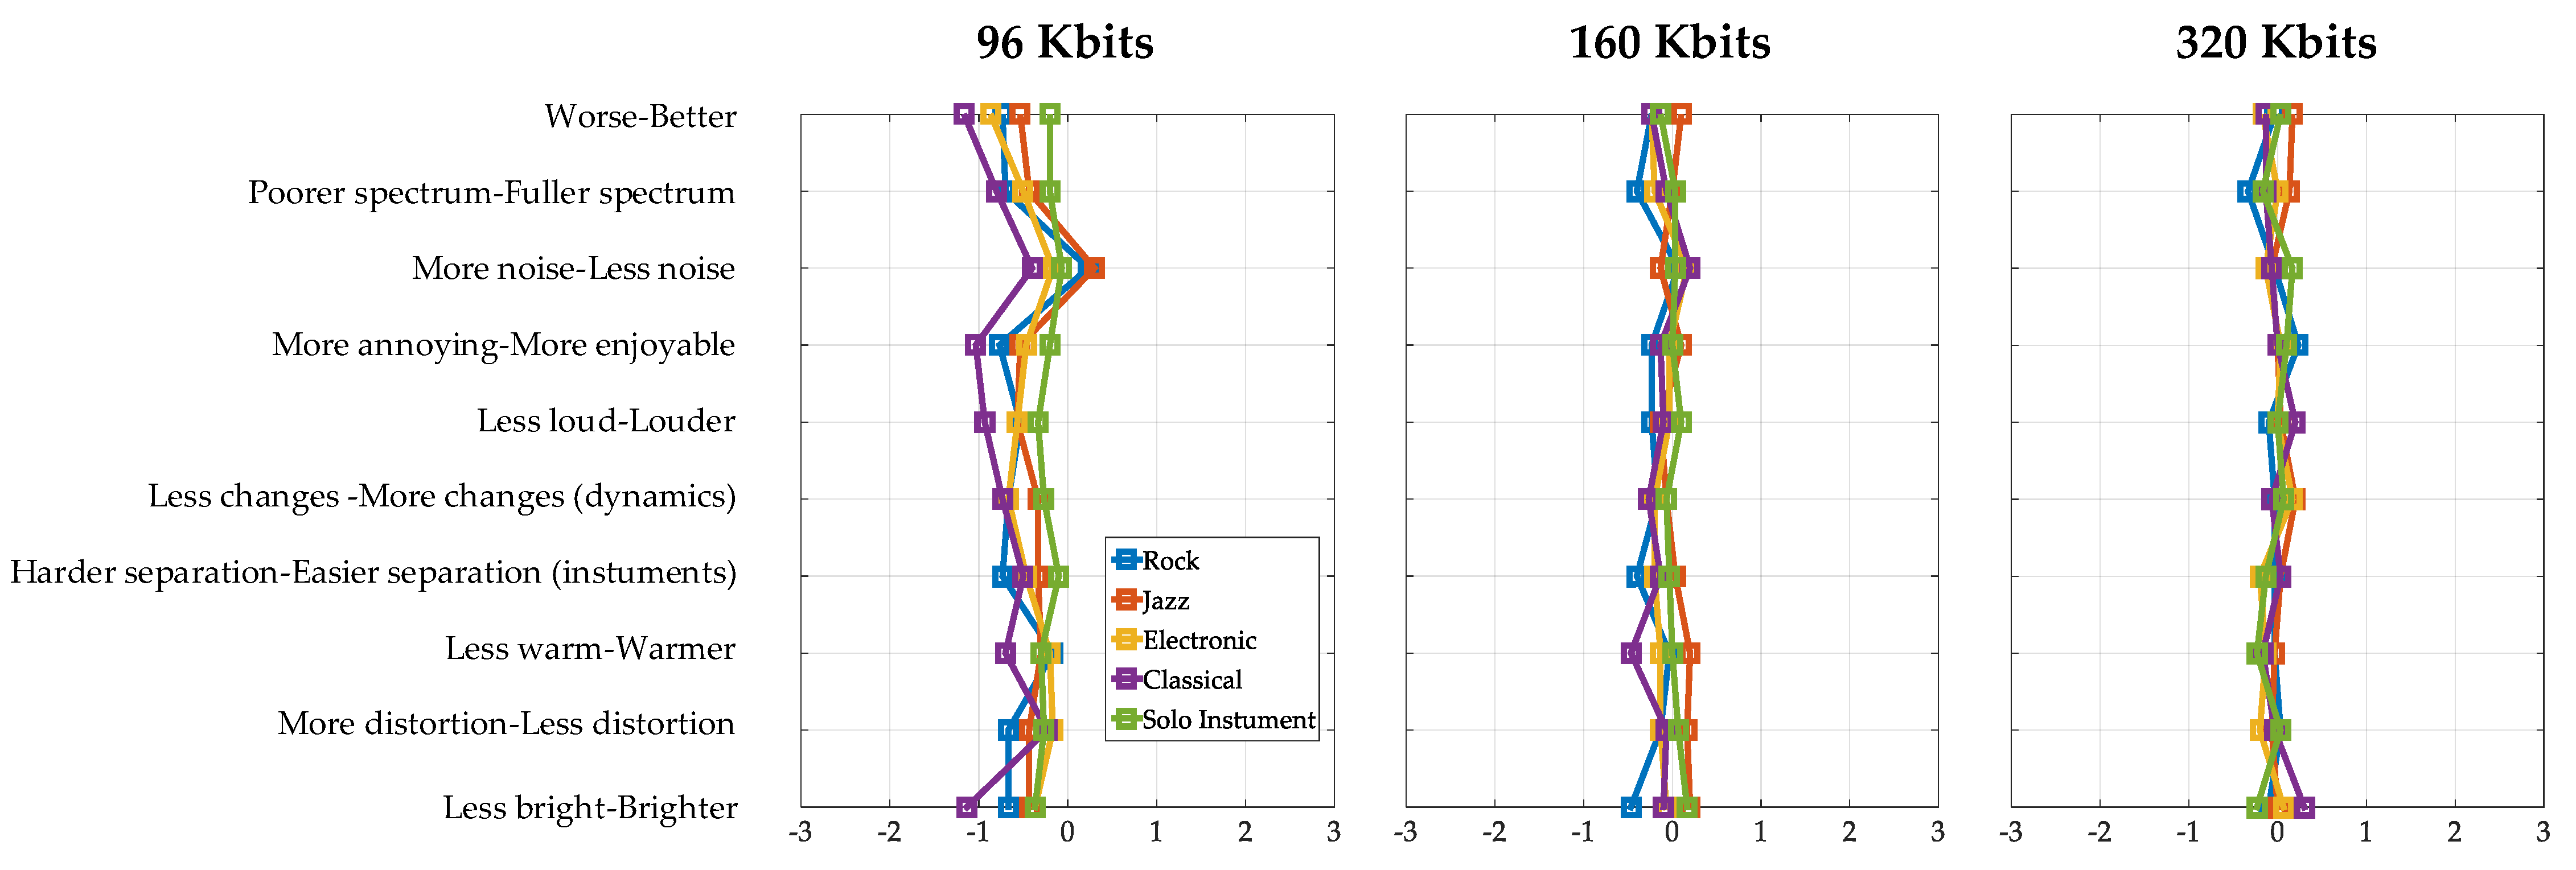
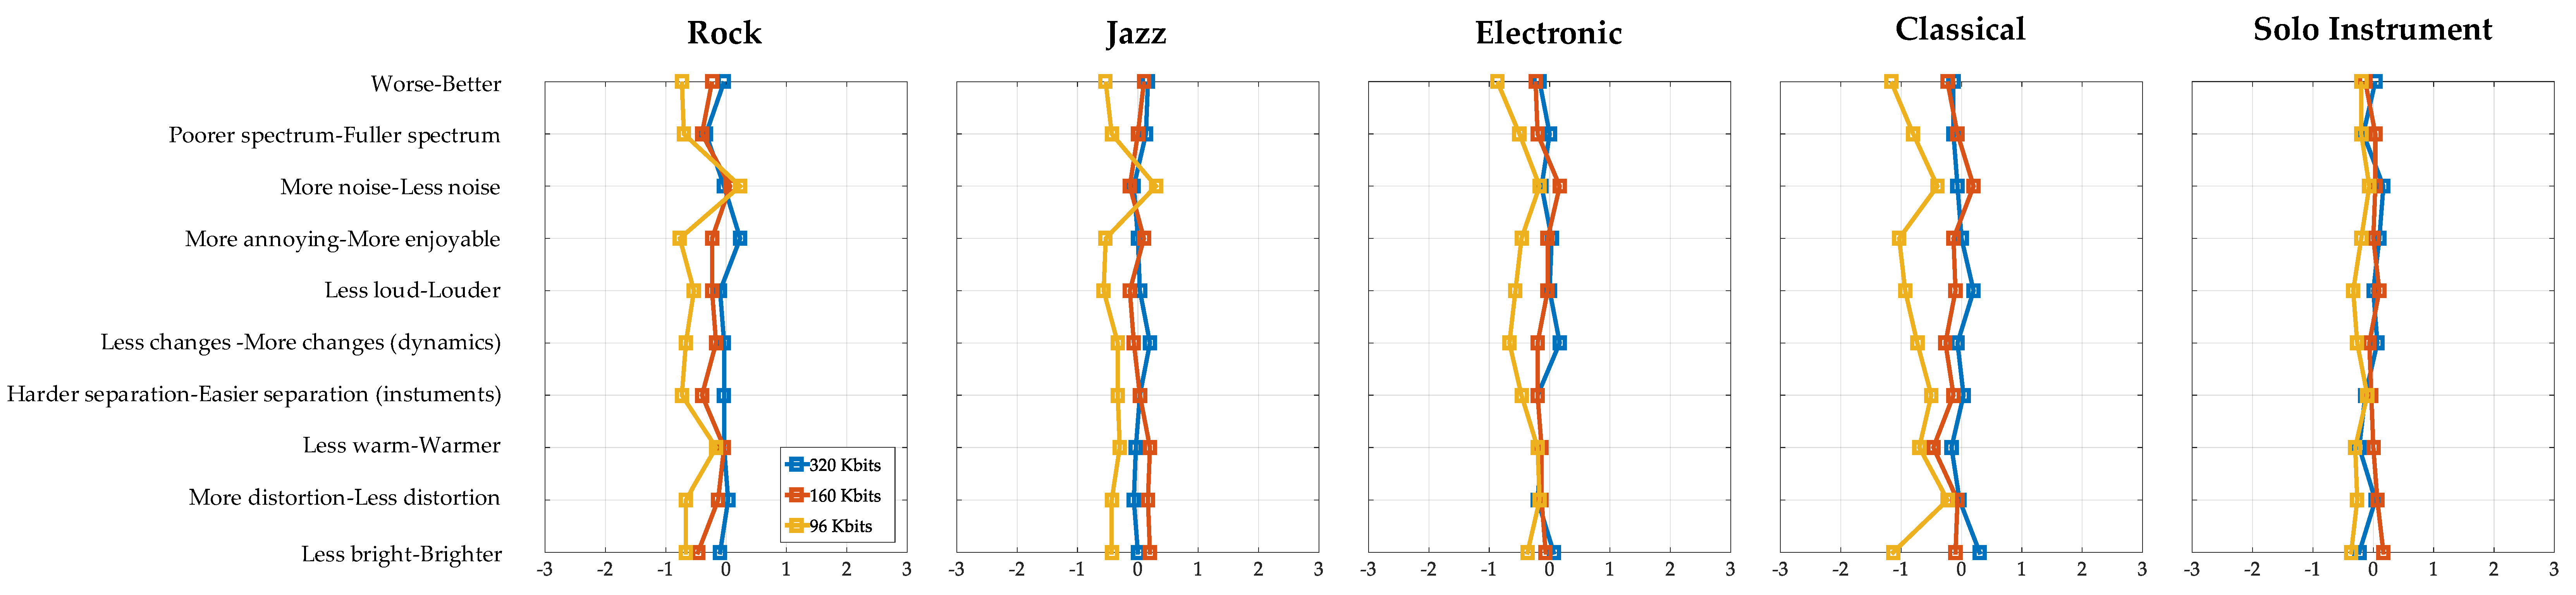
The experiment was conducted in a sound-proof test room in university facilities. The participants were seated in the middle of the test room behind a desk, and the questionnaires were presented. The listening sessions were carried out with headphones, Sennheiser HD-215 (Sennheiser, Wedemark, Germany). The values of the sound levels used in the listening tests were in accordance with the reference level typically recommended by the ITU-R [46,47], since listening to music on headphones can be annoying [48,49,50]. The headphones were calibrated with a dummy head “Artificial head-John” (Soundman, Berlin, Germany). Possible effects of the headphones due to irregularities in the frequency response were minimal due to the nature of the specific listening tests. Listening tests included pair comparison of the original and the compressed audio and the evaluation of the differences through bipolar scales. Therefore, the effects on the frequency responses due to headphones would be the same for both sound samples (original and compressed), thus minimizing the alteration of the result. In the listening tests, written instructions were given to the participants which informed them that they would be presented with pairs of audio files for different music genres. Their task was to compare the audio files of each pair and rate them for ten characteristics, presented in ten scales. The participants were instructed to submit their opinion for each comparison by placing one “X” mark on each scale. The participants were advised to make sure they rated all ten scales for each audio pair before proceeding to the next one in the questionnaire. Participants were tested individually.
At the beginning of each session, a short training sequence was inserted consisting of 5 stimulus combinations, one for each music genre, at random bitrate. The participants were asked to rate the training sequence’s stimulus as if they were part of the listening test. After the practice sequence, the participants were presented with the 15 pair comparisons in random order. Each comparison was presented for approximately 8–11 s, and there was no time limit for giving a response. Each audio pair was evaluated via a 7-point bipolar scale, such as the one demonstrated in Table 3. Since the study was in Greek, the original scale is presented in Appendix B. This resulted in 15 ratings per subject per session. The whole experiment lasted approximately 50 min. After the experiment, the participants were informed about the nature of the study and were allowed to ask questions. The study was approved by the Committee on Ethics and Deontology of Research (C.E.D.R), Technical University of Crete, Greece (project identification code: protocol number 38/5.5.2022).

3. Results

Comparisons of results between genres for different bitrates are presented in Figure 2. Diverging stacked bar charts [51] are used, which are suggested to be appropriate for the presentation of rated scales such as semantic differential [52,53]. The advantages of diverged stacked bars over other graphical forms for rating scales are presented in [53]. The percentages of respondents who agree with the statement are shown to the right of the zero line; the percentages who disagree are shown to the left. The percentages for respondents who neither agree nor disagree are split down the middle and are shown in a neutral color. Results are presented for different bitrates (96 kbps, 160 kbps and 320 kbps) and for different genres (rock, jazz, electronic, classical and solo instrument).
In addition, for convenience, average evaluation scores are also presented in Figure 3 and Figure 4. The data of the rating for the semantic differential method are ordinal; however, it is common practice to average the evaluation results to be presented in similar studies (e.g., [54,55]). Average evaluation scores are presented in Figure 3 for different bitrates (96 kbps, 160 kbps and 320 kbps) and in Figure 4 for different genres (rock, jazz, electronic, classical and solo instrument). Additionally, average evaluation scores are presented in Appendix C in tables for different bitrates. The reason for the additional presentation is that the differences in the case of higher bitrates (e.g., 320 Kbits) are very small and difficult to distinguish in Figure 3 and Figure 4.
In order to evaluate the reliability of the ten bipolar scales, Cronbach’s alpha was calculated (Table 4) [56]. In general, Cronbach’s alpha produced internal consistencies of more than 0.7 for almost all of the ten scales. However, a value smaller than 0.7 was reported for the scale “More noise-Less noise”. Regarding the acceptable values of alpha, there are different reports ranging from 0.70 to 0.95 [57]. However, according to Hair et al. [58], a good standardized loading factor of each measurement’s latent variable, which is quantified from a manifest variable, should be above 0.5 and ideally 0.7 or higher. A low value of alpha could be due to a low number of questions [59], poor inter-relatedness between items or heterogeneous constructs [60]. Possibly, a score below 0.7 suggests that the items within the tool may not be measuring the same underlying construct. In the case of the bipolar scale “More noise-Less noise”, there is a possibility that the participants estimated the underlying construct of the effect of the MP3 coding format differently, and there was an interaction due to another underlying concept (e.g., endogenous noise of music). However, since the value is not far from the recommended and above 0.5 [58], we decided to keep this result in this section and also as a reference for future studies. Further experimental studies are needed to estimate the effect and extent of this possible interaction.

4. Discussion

4.1. Impact of MP3 Compression on Classical Music

Perhaps the most striking result of this study is the impact of MP3 compression on classical music. Among all genres, classical music was affected the most and especially for the lowest bitrate. It can be seen in Figure 2 and Figure 3 that in 8 out of the 10 bipolar scales, classical music had the lowest ratings among all genres (can also be seen in Appendix D (Table A3)). Therefore, the application of the MP3 standard caused the classical music sample to have the lowest ratings amongst all genres and therefore was the most assessed as being (in comparison with the original file): worse, with poorer spectrum, with more noise, to be more annoying, to be less loud, to have fewer dynamic changes and to be less warm.
A possible explanation for this phenomenon is likely due to the very nature of the MP3 algorithm. As mentioned in detail in the introduction, the audio signal is divided into sub-bands [5], which are later split into 18 smaller ones, creating a total of 576 frequency lines [6]. Thereafter, the psychoacoustic model uses the critical bands of human hearing [7,8] to determine which part of the information contained can be discarded as inaudible. Therefore, a musical signal that has a large amount of musical information that spans the entire auditory spectrum is likely to have the greatest negative impact from the application of the MP3 algorithm. Classical music (orchestral) contains a great variety and number of music instruments. Its long term average spectra have differences from other music genres [61].
Additionally, although the note range of the typical orchestra instruments does not exceed 3520 Hz, the harmonic overtones that are created can reach up to 20,000 Hz, especially in the violins [62]. When an MP3 file is encoded with a bitrate of 96 kbps, all frequencies above 15 kHz are discarded, so all the instrument harmonics above that limit are lost, resulting in the perception of poorer spectrum and loss of brightness.
Dynamic changes in classical music are in general more prominent than other genres such as rock or rap [63]. As opposed to some other genres examined, classical music is a genre that rarely becomes dynamically compressed during the mixing and mastering processes; therefore, the dynamic compression applied by the MP3 algorithm is easily perceived, degrading the quality of the audio file. Similar effects regarding the dynamic range of the orchestral excerpt were observed in another study [25].

4.2. Impact of MP3 Compression on Solo Instrument

Another important finding of this research, related to the previous case, is that the solo instrument was least affected by the encoding of the MP3 standard for the lowest bitrate. It can be seen in Figure 2 and Figure 3 that in 7 out of the 10 bipolar scales, the solo instrument had the highest ratings among all the genres (this can also be seen in Appendix D (Table A3)).
Again, a possible explanation, presented previously in Section 4.1, is likely due to the very nature of the MP3 algorithm. Since the audio signal is divided into sub-bands and a large number of frequency lines, of which part of them is discarded as inaudible according to the psychoacoustic model, a signal which has a relatively small amount of sound information (relative to a signal with a large number of instruments and harmonics) is likely to experience the least quality reduction from the MP3 compression. Given that the excerpt of this genre (solo instrument) contains audio information that comes from just one instrument, with the spectrum limitations that accompany it, it is possible that the MP3’s compression affects it the least.
Additionally, the limit of 15 kHz, for the 96 kbps bitrate, takes away very little audible information. Although the piano is the acoustic instrument with the biggest note range (A0/27.5 Hz—C8/4168 Hz) and produces a lot of harmonic overtones, the majority of the frequencies that are loud enough to be easily perceived are from 70 Hz–4000 Hz. The algorithm’s encoding process does not heavily affect this range, since it functions on a psychoacoustic basis and is aware of a human’s sensitivity in the range of 1000–5000 Hz. Moreover, lower frequencies need fewer bits to become encoded than higher frequencies, so the algorithm’s bit allocation method does not affect them widely.

4.3. Impact of MP3 Compression on Electronic, Rock and Jazz Music

Regarding the impact of MP3 compression on electronic, rock and jazz music, it seems that the results for these genres are somewhere in between the results for classical music and the solo instrument. This can be seen in Figure 2 and Figure 3 and Appendix C. As mentioned in Section 4.1, it seems that quality reduction from the MP3 compression depends on the amount of sound information that is spread across the audible spectrum for each music genre and music piece.
Additionally, the algorithm’s impact on electronic music appears to be also related a lot to its dynamics and loudness characteristics. The two worst scores in terms of specific music attributes for the lowest bitrate examined belong to the scales “Less changes-More changes (dynamics)” and “Less loud-Louder”. The scores of these two scales combined with the “Worse-Better” score (which has the lowest score amongst all scales) point to the assumption that the electronic music’s likeability is heavily connected to its loudness characteristics.
The results for rock music genre revealed a possible correlation between noise perception and overall satisfaction for this genre. Surprisingly, although at 96 kbps the MP3 audio clip was perceived as less noisy compared to the WAV clip, the scales “Worse-Better” and “More annoying-More enjoyable” had the worst ranking for the MP3 clip amongst all scales.
Interestingly, the algorithm seemed to have a similar effect on jazz regarding noise as the one stated for rock music. Again, for the 96 kbps bitrate, the MP3 clip was perceived as less noisy than the WAV file, but the scales “Worse-Better” and “More annoying-More enjoyable” received the worst scores.

4.4. General Remarks

The findings of this study confirm the fact that MP3’s lossy nature produces audible artifacts that people can perceive, thus affecting the quality of the compressed audio signal compared to its uncompressed form. The findings share a big number of similarities with Pras et al.’s [25] and Ruzanski’s [26] findings. Although differences can be spotted among them (music genres, bitrates and population), it becomes apparent that one must take under consideration the music genre of the audio file that needs to be encoded, in order to achieve the best quality/size ratio. In both [25,26], the listeners’ overall preference for the CD quality audio is clear, just like in the present study. Regarding higher bitrates, participants of these studies could not discriminate CD quality over MP3. Similarly, in this study, the differences between the MP3 files and the original are very small for all the music genres.
The results of this study support the idea that MP3’s lossy nature affects a wide range of audio characteristics. More specifically, bitrates below 160 kbps are not recommended for any of the music genres studied. Lower bitrates introduce artifacts that can be easily perceived and thus lower the audio quality drastically. However, this research has given rise to many questions and possibilities for future work in need of further investigation. Those are going to be discussed in the next section.

4.5. Future Work

Subjective evidence from this study supports the idea that the effectiveness of MP3 coding depends on the music genre. The authors find that the results reported here are encouraging but also should be validated by a larger sample size and for more music genres. Additionally, the results of this study could possibly have some implications for research into improving the efficiency of the algorithm.
One possible application could be the utilization of various music genre classification techniques that could be incorporated into the MP3 algorithm to improve its efficacy. For music genre classification, machine learning techniques could be used [64,65,66] that would automatically recognize the music genre of the audio file to be compressed. Classification through machine learning could be applied with the use of spectrograms [67] or even with the use of deep neural networks [68]. The outcome of this step could potentially be used in a number of ways. For example, suggestions could be given by the algorithm for a minimum recommended coding quality according to the music genre of the audio file.
The next and most important step after using the algorithm to identify the musical genre of the audio file that is going to be compressed is how the MP3 encoding could be improved according to the music genre. Various directions could possibly be explored. For example, the results of this study show that there are differences in the evaluation scores for the bipolar scales for each music genre. Compression has a different effect between genres for scales such as “Poorer spectrum-Fuller spectrum”, “Less changes -More changes (dynamics)” and “More distortion-Less distortion”. Therefore, improvement of the algorithm for lower bitrates could focus so that there is the least possible alteration of scales at which each music genre has the greatest sensitivity. Future work will concentrate on this problem. We hope that our study will serve as a base for future studies on this important issue.

5. Conclusions

The main aim of this research was to evaluate the effect of the MP3 coding format for different music genres and different bitrates via listening tests in which the original uncompressed files and the compressed files are compared. The semantic differential method was used, and ten bipolar scales were utilized for the listening tests. For this purpose, five different music genres were selected (rock, jazz, electronic, classical and solo instrument), and the files were compressed in three different bitrates (96 kbps, 160 kbps and 320 kbps).
The most important findings of this research are:
  • Classical music had the greatest negative impact due to MP3 compression, among the genres (lowest ratings in 8 out of 10 bipolar scales).
  • The solo instrument was least affected by the MP3 encoding, among the genres (highest rating in 7 out of 10 bipolar scales).
  • For electronic, rock and jazz music, it seems that the results for these genres are somewhere in between the results for classical music and the solo instrument.
The conclusions and implications of this research are:
  • A musical signal that has a large amount of musical information that spans the entire auditory spectrum is likely to be negatively affected the most from the application of the MP3 algorithm. The music genre is of great importance when choosing the compression bitrate.
  • The findings of this study can be used to optimize and adapt the MP3 standard, depending on the music genre and the music piece that needs to be encoded.

Author Contributions

Conceptualization, N.M.P. and I.A.; methodology, I.A. and N.M.P.; software, I.A. and N.M.P.; validation, I.A., N.M.P. and G.E.S.; formal analysis, I.A. and N.M.P.; investigation, I.A. and N.M.P.; resources, I.A.; data curation, I.A., N.M.P. and G.E.S.; writing—original draft preparation, I.A. and N.M.P.; writing—review and editing, G.E.S.; visualization, I.A. and N.M.P.; supervision, I.A., N.M.P. and G.E.S.; project administration, I.A. and N.M.P. All authors have read and agreed to the published version of the manuscript.

Funding

This research received no external funding.

Institutional Review Board Statement

The study was conducted in accordance with the Declaration of Helsinki, and approved by the Committee on Ethics and Deontology of Research (C.E.D.R) of Technical University of Crete, Greece (Project identification code: Protocol number 38/5.5.2022 ).

Informed Consent Statement

Informed consent was obtained from all subjects involved in the study.

Data Availability Statement

The data presented in this study are available on request from the corresponding author.

Acknowledgments

We would like to thank everyone that participated in the listening tests. We are also grateful to the anonymous reviewers for their valuable suggestions and constructive comments.

Conflicts of Interest

The authors declare no conflict of interest.

Appendix A

Table A1. Dynamic ranges of original and compressed audio files.
Dynamic Range (dB)
Music GenreOriginal320 kbps160 kbps96 kbps
Rock12.011.811.811.9
Jazz10.310.310.210.6
Electronic6.46.96.86.3
Classical8.58.68.68.7
Solo instrument9.99.99.99.9

Appendix B

Frequency response of the Sennheiser HD 215 headphones retrieved from [69].
Figure A1. Frequency response of the Sennheiser HD 215 headphones.
Acoustics 04 00042 g0a1

Appendix C

Since the study was in Greek, the original seven-point bipolar scale is presented in Table A2. More about an appropriate translation of scales and attributes can be found in [70].
Table A2. Seven-point bipolar scale (Greek).
ΠολύAρκετάΛίγοΤο ίδιοΛίγοAρκετάΠολύ
Bipolar Scale Adjective (Negative Connotation) Bipolar Scale Adjective (Positive Connotation)
−3−2−10123

Appendix D

Table A3. Average evaluation scores for the bipolar scales for 96 Kbits.
Rock (96)Jazz (96)Electronic (96)Classical (96)Solo (96)
Worse–Better−0.733−0.533−0.867−1.167−0.200
Poorer spectrum–Fuller spectrum−0.700−0.433−0.500−0.800−0.200
More noise–Less noise0.2330.300−0.167−0.400−0.067
More annoying–More enjoyable−0.767−0.533−0.467−1.033−0.200
Less loud–Louder−0.533−0.567−0.567−0.933−0.333
Less changes–More changes (dynamics)−0.667−0.333−0.667−0.733−0.267
Harder separation–Easier separation (instuments)−0.733−0.333−0.467−0.500−0.100
Less warm–Warmer−0.167−0.300−0.200−0.700−0.300
More distortion–Less distortion−0.667−0.433−0.167−0.233−0.267
Less bright–Brighter−0.667−0.433−0.367−1.133−0.367
Table A4. Average evaluation scores for the bipolar scales for 160 Kbits.
Rock (160)Jazz (160)Electronic (160)Classical (160)Solo (160)
Worse–Better−0.2330.100−0.233−0.233−0.133
Poorer spectrum–Fuller spectrum−0.4000.000−0.200−0.0670.033
More noise–Less noise0.067−0.1330.1670.2000.033
More annoying–More enjoyable−0.2330.100−0.033−0.1330.000
Less loud–Louder−0.233−0.133−0.033−0.1000.100
Less changes–More changes (dynamics)−0.167−0.067−0.200−0.267−0.067
Harder separation–Easier separation (instuments)−0.4000.033−0.200−0.133−0.033
Less warm–Warmer−0.0330.200−0.133−0.4670.000
More distortion–Less distortion−0.1330.167−0.133−0.0670.067
Less bright–Brighter−0.4670.200−0.067−0.1000.167
Table A5. Average evaluation scores for the bipolar scales for 320 Kbits.
Rock (320)Jazz (320)Electronic (320)Classical (320)Solo (320)
Worse–Better−0.0330.167−0.167−0.1330.033
Poorer spectrum–Fuller spectrum−0.3330.1330.000−0.133−0.167
More noise–Less noise−0.033−0.067−0.133−0.0670.167
More annoying–More enjoyable0.2330.0000.0330.0000.100
Less loud–Louder−0.1000.0330.000.2000.000
Less changes–More changes (dynamics)−0.0330.2000.167−0.0670.067
Harder separation–Easier separation (instuments)−0.0330.033−0.2000.033−0.133
Less warm–Warmer−0.033−0.033−0.133−0.167−0.233
More distortion–Less distortion0.033−0.067−0.200−0.0330.033
Less bright–Brighter−0.1000.0000.0670.300−0.233

References

  1. Falkowski-Gilski, P. On the consumption of multimedia content using mobile devices: A year to year user case study. Arch. Acoust. 2020, 45, 321–328. [Google Scholar]
  2. Crawford, W. MP3 Audiobooks: A New Library Medium? Am. Libr. 2001, 32, 64–66. [Google Scholar]
  3. Xiang, Z.; Bestagini, P.; Tubaro, S.; Delp, E.J. Forensic Analysis and Localization of Multiply Compressed MP3 Audio Using Transformers. arXiv 2022, arXiv:2203.16499. [Google Scholar]
  4. Yang, R.; Qu, Z.; Huang, J. Detecting digital audio forgeries by checking frame offsets. In Proceedings of the 10th ACM Workshop on Multimedia and Security, Oxford, UK, 22–23 September 2008; pp. 21–26. [Google Scholar]
  5. Pan, D.Y. Digital audio compression. Digit. Tech. J. 1993, 5, 28–40. [Google Scholar]
  6. Raissi, R. The Theory behind MP3. MP3’Tech 2002. Available online: http://www.mp3-tech.org/programmer/docs/mp3_theory.pdf (accessed on 25 June 2022).
  7. Zwicker, E. Subdivision of the audible frequency range into critical bands (Frequenzgruppen). J. Acoust. Soc. Am. 1961, 33, 248. [Google Scholar] [CrossRef]
  8. Greenwood, D.D. Critical bandwidth and the frequency coordinates of the basilar membrane. J. Acoust. Soc. Am. 1961, 33, 1344–1356. [Google Scholar] [CrossRef]
  9. Brandenburg, K. MP3 and AAC explained. In Proceedings of the Audio Engineering Society Conference: 17th International Conference: High-Quality Audio Coding, Florence, Italy, 2–5 September 1999. [Google Scholar]
  10. Hacker, S. MP3: The Definitive Guide; O’Reilly: Sebastopol, CA, USA, 2000. [Google Scholar]
  11. Musmann, H.G. Genesis of the MP3 audio coding standard. IEEE Trans. Consum. Electron. 2006, 52, 1043–1049. [Google Scholar] [CrossRef]
  12. Vaseghi, S.V. Multimedia Signal Processing: Theory and Applications in Speech, Music and Communications; John Wiley & Sons: Hoboken, NJ, USA, 2007. [Google Scholar]
  13. Pan, D. A tutorial on MPEG/audio compression. IEEE Multimed. 1995, 2, 60–74. [Google Scholar] [CrossRef]
  14. Yen, C.-H.; Wei, H.-Y.; Wu, B.-F. New Encryption Approaches to MP3 Compression; Department of Electrical and Controling Engineering, National Chiao Tung University: Hsinchu, Taiwan, 2003. [Google Scholar]
  15. Yang, Y.; Yi, X.; Zhao, X.; Zhang, J. A Robust MP3 Steganographic Method against Multiple Compressions Based on Modified Discrete Cosine Transform. Secur. Commun. Netw. 2021, 2021, 4471117. [Google Scholar] [CrossRef]
  16. Ito, A.; Konno, K.; Ito, M.; Makino, S. Robust Transmission of Audio Signals over the Internet: An Advanced Packet Loss Concealment for MP3-Based Audio Signals. Interdiscip. Inf. Sci. 2012, 18, 99–105. [Google Scholar] [CrossRef]
  17. Cantzos, D.; Kyriakakis, C. Quality enhancement of low bit rate MPEG1-layer 3 audio based on audio resynthesis. In Proceedings of the Audio Engineering Society Convention 119, New York, NY, USA, 8 October 2005. [Google Scholar]
  18. Liu, C.-M.; Hsu, H.-W.; Lee, W.-C. Compression artifacts in perceptual audio coding. IEEE Trans. Audio Speech Lang. Process. 2008, 16, 681–695. [Google Scholar] [CrossRef]
  19. Marins, P.; Rumsey, F.; Zielinski, S.K. The relationship between selected artifacts and basic audio quality in perceptual audio codecs. In Proceedings of the Audio Engineering Society Convention 120, Paris, France, 20–23 May 2006. [Google Scholar]
  20. D’Alessandro, B.; Shi, Y.Q. MP3 bit rate quality detection through frequency spectrum analysis. In Proceedings of the 11th ACM Workshop on Multimedia and Security, Princeton, NJ, USA, 7–8 September 2009; pp. 57–62. [Google Scholar]
  21. Luo, D.; Luo, W.; Yang, R.; Huang, J. Identifying compression history of wave audio and its applications. ACM Trans. Multimed. Comput. Commun. Appl. (TOMM) 2014, 10, 1–19. [Google Scholar] [CrossRef]
  22. Nishimura, A.; Unoki, M.; Kondo, K.; Ogihara, A. Objective evaluation of sound quality for attacks on robust audio watermarking. In Proceedings of the Meetings on Acoustics ICA2013, Montreal, QC, Canada, 2–7 June 2013; p. 030052. [Google Scholar]
  23. Kanetada, N.; Yamamoto, R.; Mizumachi, M. Evaluation of sound quality of high resolution audio. In Proceedings of the IEEE/IIAE International Conference on Intelligent Systems and Image Processing, Kitakyushu, Japan, 26–27 September 2013. [Google Scholar]
  24. Cunningham, S.; McGregor, I. Subjective evaluation of music compressed with the ACER codec compared to AAC, MP3, and uncompressed PCM. Int. J. Digit. Multimed. Broadcast. 2019, 2019, 8265301. [Google Scholar] [CrossRef]
  25. Pras, A.; Zimmerman, R.; Levitin, D.; Guastavino, C. Subjective evaluation of mp3 compression for different musical genres. In Proceedings of the Audio Engineering Society Convention 127; Audio Engineering Society: New York, NY, USA, 2009. [Google Scholar]
  26. Ruzanski, E.P. Effects of MP3 encoding on the sounds of music. IEEE Potentials 2006, 25, 43–45. [Google Scholar] [CrossRef]
  27. Osgood, C.E.; Suci, G.J.; Tannenbaum, P.H. The Measurement of Meaning; University of Illinois press: Chicago, IL, USA, 1957. [Google Scholar]
  28. North, A.C.; Hargreaves, D.J.; O’Neill, S.A. The importance of music to adolescents. Br. J. Educ. Psychol. 2000, 70, 255–272. [Google Scholar] [CrossRef]
  29. Schäfer, T.; Sedlmeier, P. From the functions of music to music preference. Psychol. Music 2009, 37, 279–300. [Google Scholar] [CrossRef]
  30. Pilgrim, L.; Norris, J.I.; Hackathorn, J. Music is awesome: Influences of emotion, personality, and preference on experienced awe. J. Consum. Behav. 2017, 16, 442–451. [Google Scholar] [CrossRef]
  31. Costa, Y.M.; Oliveira, L.; Koerich, A.L.; Gouyon, F.; Martins, J.G. Music genre classification using LBP textural features. Signal Process 2012, 92, 2723–2737. [Google Scholar] [CrossRef]
  32. Li, T.; Ogihara, M.; Li, Q. A comparative study on content-based music genre classification. In Proceedings of the 26th Annual International ACM SIGIR Conference on Research and Development in Informaion Retrieval, Toronto, ON, Canada, 28 July 2003–1 August 2003; pp. 282–289. [Google Scholar]
  33. Li, T.; Ogihara, M. Music genre classification with taxonomy. In Proceedings of the IEEE International Conference on Acoustics, Speech, and Signal Processing, Philadelphia, PA, USA, 23 March 2005; Volume 195, pp. v/197–v/200. [Google Scholar]
  34. Vercellesi, G.; Zerbini, M.; Vitali, A.L. Objective and subjective evaluation MPEG layer III perceived quality. In Proceedings of the 2006 14th European Signal Processing Conference, Florence, Italy, 4–8 September 2006; pp. 1–5. [Google Scholar]
  35. Salovarda, M.; Bolkovac, I.; Domitrovic, H. Estimating perceptual audio system quality using PEAQ algorithm. In Proceedings of the 2005 18th International Conference on Applied Electromagnetics and Communications, Dubrovnik, Croatia, 12–14 October 2005; pp. 1–4. [Google Scholar]
  36. Heise, D.R. Some methodological issues in semantic differential research. Psychol. Bull. 1969, 72, 406. [Google Scholar] [CrossRef]
  37. Takeda, S.; Morioka, I.; Miyashita, K.; Okumura, A.; Yoshida, Y.; Matsumoto, K. Age variation in the upper limit of hearing. Eur. J. Appl. Physiol. Occup. Physiol. 1992, 65, 403–408. [Google Scholar] [CrossRef]
  38. Dal Palù, D.; Buiatti, E.; Puglisi, G.E.; Houix, O.; Susini, P.; De Giorgi, C.; Astolfi, A. The use of semantic differential scales in listening tests: A comparison between context and laboratory test conditions for the rolling sounds of office chairs. Appl. Acoust. 2017, 127, 270–283. [Google Scholar] [CrossRef]
  39. Guski, R. Psychological methods for evaluating sound quality and assessing acoustic information. Acta Acust. United Acust. 1997, 83, 765–774. [Google Scholar]
  40. Schütte, M.; Müller, U.; Sandrock, S.; Griefahn, B.; Lavandier, C.; Barbot, B. Perceived quality features of aircraft sounds: An analysis of the measurement characteristics of a newly created semantic differential. Appl. Acoust. 2009, 70, 903–914. [Google Scholar] [CrossRef]
  41. Vieira, J.; Santos, J.A.; Noriega, P. Using semantic differential scales to assess the subjective perception of auditory warning signals. In Proceedings of the 21st International Conference on Digital Audio Effects (DAFx-18), Aveiro, Portugal, 4–8 September 2018; pp. 126–132. [Google Scholar]
  42. Hülsmeier, D.; Schell-Majoor, L.; Rennies, J.; van de Par, S. Perception of sound quality of product sounds a subjective study using a semantic differential. In Proceedings of the International Congress on Noise Control Engineering, Melbourne, Australia, 16–19 November 2014; pp. 843–851. [Google Scholar]
  43. Al-Hindawe, J. Considerations when constructing a semantic differential scale. La Trobe Pap. Linguist. 1996, 9, 1–9. [Google Scholar]
  44. Messick, S.J. Metric properties of the semantic differential. Educ. Psychol. Meas. 1957, 17, 200–206. [Google Scholar] [CrossRef]
  45. Norman, W.T. Stability-characteristics of the semantic differential. Am. J. Psychol. 1959, 72, 581–584. [Google Scholar] [CrossRef] [PubMed]
  46. ITU-R. General Methods for the Subjective Assessment of Sound Quality. In Proceedings of the International Telecommunication Union Recommendation; 2003. Available online: https://www.itu.int/rec/R-REC-BS.1284/en (accessed on 25 June 2022).
  47. ITU-R. Methods for the Subjective Assessment of Small Impairments in Audio Systems. In Proceedings of the International Telecommunication Union Recommendation; 2015. Available online: https://www.itu.int/rec/R-REC-BS.1116 (accessed on 25 June 2022).
  48. Okabe, D.; Nakatoh, Y. Study on headphone hearing loss prevention methods based on the melody structure of music on portable music player. In Proceedings of the 2018 IEEE International Conference on Consumer Electronics (ICCE), Las Vegas, NV, USA, 12–14 January 2018; pp. 1–2. [Google Scholar]
  49. Higashi, T.; Tanaka, Y.; Nakatoh, Y. Study of volume limit for headphone hearing loss prevention on portable music player. In Proceedings of the 2016 IEEE International Conference on Consumer Electronics (ICCE), Las Vegas, NV, USA, 7–11 January 2016; pp. 397–398. [Google Scholar]
  50. Iannace, G.; Ciaburro, G.; Trematerra, A. Video games noise exposure in teenagers and young adults. Noise Vib. Worldw. 2020, 51, 3–11. [Google Scholar] [CrossRef]
  51. Heiberger, R.; Robbins, N. Design of diverging stacked bar charts for Likert scales and other applications. J. Stat. Softw. 2014, 57, 1–32. [Google Scholar] [CrossRef]
  52. Gratzl, S.; Lex, A.; Gehlenborg, N.; Pfister, H.; Streit, M. Lineup: Visual analysis of multi-attribute rankings. IEEE Trans. Vis. Comput. Graph. 2013, 19, 2277–2286. [Google Scholar] [CrossRef]
  53. Robbins, N.B.; Heiberger, R.M. Plotting Likert and other rating scales. In Proceedings of the 2011 Joint Statistical Meeting, Miami Beach, FL, USA, 30 July–4 August 2011. [Google Scholar]
  54. Kang, J.; Zhang, M. Semantic differential analysis of the soundscape in urban open public spaces. Build. Environ. 2010, 45, 150–157. [Google Scholar] [CrossRef]
  55. Jeon, J.Y.; Lee, P.J.; You, J.; Kang, J. Acoustical characteristics of water sounds for soundscape enhancement in urban open spaces. J. Acoust. Soc. Am. 2012, 131, 2101–2109. [Google Scholar] [CrossRef] [PubMed]
  56. Cronbach, L.J. Coefficient alpha and the internal structure of tests. Psychometrika 1951, 16, 297–334. [Google Scholar] [CrossRef]
  57. Bland, J.M.; Altman, D.G. Statistics notes: Cronbach’s alpha. BMJ 1997, 314, 572. [Google Scholar] [CrossRef]
  58. Hair, J.F.; Black, W.C.; Babin, B.J.; Anderson, R.E.; Tatham, R.L. Multivariate Data Analysis; Cengage: Hampshire, UK, 2006; Volume 6. [Google Scholar]
  59. Streiner, D.L. Starting at the beginning: An introduction to coefficient alpha and internal consistency. J. Personal. Assess. 2003, 80, 99–103. [Google Scholar] [CrossRef] [PubMed]
  60. Tavakol, M.; Dennick, R. Making sense of Cronbach’s alpha. Int. J. Med. Educ. 2011, 2, 53. [Google Scholar] [CrossRef] [PubMed]
  61. Borch, D.Z.; Sundberg, J. Spectral distribution of solo voice and accompaniment in pop music. Logop. Phoniatr. Vocology 2002, 27, 37–41. [Google Scholar] [CrossRef] [PubMed]
  62. Yokoyama, M.; Awahara, Y.; Yagawa, G. Relation between violin timbre and harmony overtone. In Proceedings of the Meetings on Acoustics, Honolulu, HI, USA, 28 November–2 December 2016; p. 035001. [Google Scholar]
  63. Kirchberger, M.; Russo, F.A. Dynamic range across music genres and the perception of dynamic compression in hearing-impaired listeners. Trends Hear. 2016, 20, 2331216516630549. [Google Scholar] [CrossRef]
  64. Silla, C.N.; Koerich, A.L.; Kaestner, C.A. A machine learning approach to automatic music genre classification. J. Braz. Comput. Soc. 2008, 14, 7–18. [Google Scholar] [CrossRef] [Green Version]
  65. Bahuleyan, H. Music genre classification using machine learning techniques. arXiv 2018, arXiv:1804.01149. [Google Scholar]
  66. Chillara, S.; Kavitha, A.; Neginhal, S.A.; Haldia, S.; Vidyullatha, K. Music genre classification using machine learning algorithms: A comparison. Int. Res. J. Eng. Technol. 2019, 6, 851–858. [Google Scholar]
  67. Costa, Y.M.; Oliveira, L.S.; Koericb, A.L.; Gouyon, F. Music genre recognition using spectrograms. In Proceedings of the 2011 18th International Conference on Systems, Signals and Image Processing, Sarajevo, Bosnia and Herzegovina, 16–18 June 2011; pp. 1–4. [Google Scholar]
  68. Ghosal, D.; Kolekar, M.H. Music Genre Recognition Using Deep Neural Networks and Transfer Learning. In Proceedings of the Interspeech, Hyderabad, India, 2–6 September 2018; pp. 2087–2091. [Google Scholar]
  69. Analyzer, R.A. Sennheiser HD 215 (Report for a Pro). Available online: https://reference-audio-analyzer.pro/en/report/hp/sennheiser-hd-215.php#gsc.tab=0 (accessed on 18 July 2022).
  70. Papadakis, N.M.; Aletta, F.; Kang, J.; Oberman, T.; Mitchell, A.; Stavroulakis, G.E. Translation and Cross-Cultural Adaptation Methodology for Soundscape Attributes—A study with Independent Translation Groups from English to Greek. Appl. Acoust. 2022. [Google Scholar]
Figure 1. Spectrographs of the original and compressed audio files for all the music genres. Scale is common for every audio file and is presented as power/frequency (dB/Hz).
Acoustics 04 00042 g001
Figure 2. Diverging stacked bar charts for different bitrates and for different genres.
Acoustics 04 00042 g002
Figure 3. Average evaluation scores for the bipolar scales for different bitrates.
Acoustics 04 00042 g003
Figure 4. Average evaluation scores for the bipolar scales for each music genre.
Acoustics 04 00042 g004
Table 1. Related information about the music excerpts used in this study.
Music GenrePieceArtist/ComposerMusic Sample (s)
RockPoisonAlice Cooper1:52–2:00 (8 s)
JazzBlue TrainJohn Coltrane0:52–1:03 (10 s)
ElectronicTrafficDJ Tiesto1:15–1:25 (12 s)
ClassicalSymphony No. 3Ludwig van Beethoven0:42–0:53 (11 s)
Solo instrumentPiano Sonata No. 14Ludwig van Beethoven1:15–1:25 (10 s)
Table 2. Correspondence between factors (Evaluation, Potency, Activity) and the ten bipolar scales used in this study for the application of the semantic differential method.
EvaluationPotencyActivity
Better–WorseFuller spectrum–
Poorer spectrum
More changes in dynamics–
Less changes in dynamics
More enjoyable–More annoyingLouder–Less loudLess noise–More noise
Easier instrument separation–
Harder instrument separation
Warmer–
Less warm
Less distortion–
More distortion
Brighter–Less bright
Table 3. Seven-point bipolar scale.
A Lot/MuchQuiteSlightlySameSlightlyQuiteA Lot/Much
Bipolar Scale Adjective (Negative Connotation) Bipolar Scale Adjective (Positive Connotation)
−3−2−10123
Table 4. Reliability of the ten bipolar scales.
ScalesCronbach’s Alpha
Worse–Better0.782
Poorer spectrum–Fuller spectrum0.760
More noise–Less noise0.612
More annoying–More enjoyable0.744
Less loud–Louder0.713
Less changes–More changes (dynamics)0.734
Harder separation–Easier separation (instruments)0.705
Less warm–Warmer0.739
More distortion–Less distortion0.720
Less bright–Brighter0.741
Publisher’s Note: MDPI stays neutral with regard to jurisdictional claims in published maps and institutional affiliations.

