Article

Horizontal and Vertical Voice Directivity Characteristics of Sung Vowels in Classical Singing

Institute of Electronic Music and Acoustics, University of Music and Performing Arts Graz, 8010 Graz, Austria
*
Author to whom correspondence should be addressed.
Acoustics 2022, 4(4), 849-866; https://doi.org/10.3390/acoustics4040051
Submission received: 27 July 2022 / Revised: 24 September 2022 / Accepted: 27 September 2022 / Published: 1 October 2022
(This article belongs to the Special Issue Acoustics, Speech and Signal Processing)

Abstract

:
Singing voice directivity for five sustained German vowels /a:/, /e:/, /i:/, /o:/, /u:/ over a wide pitch range was investigated using a multichannel microphone array with high spatial resolution along the horizontal and vertical axes. A newly created dataset allows to examine voice directivity in classical singing with high resolution in angle and frequency. Three voice production modes (phonation modes) modal, breathy, and pressed that could affect the used mouth opening and voice directivity were investigated. We present detailed results for singing voice directivity and introduce metrics to discuss the differences of complex voice directivity patterns of the whole data in a more compact form. Differences were found between vowels, pitch, and gender (voice types with corresponding vocal range). Differences between the vowels /a:, e:, i:/ and /o:, u:/ and pitch can be addressed by simplified metrics up to about d2/D5/587 Hz, but we found that voice directivity generally depends strongly on pitch. Minor differences were found between voice production modes and found to be more pronounced for female singers. Voice directivity differs at low pitch between vowels with front vowels being most directional. We found that which of the front vowels is most directional depends on the evaluated pitch. This seems to be related to the complex radiation pattern of the human voice, which involves a large inter-subjective variability strongly influenced by the shape of the torso, head, and mouth. All recorded classical sung vowels at high pitches exhibit similar high directionality.

1. Introduction

Studies on voice directivity have been investigating several aspects and generally agree about the factors that influence voice directivity the most. Voice directivity is determined by the morphology of a person, posture, vocal tract shape and the effective mouth opening. Investigations on voice directivity have been undertaken for verification, auralization, or performance analysis of the human voice. Previous studies have included measurements of sound radiation from artificial mouths, human talkers [1,2,3,4,5,6,7], and singers [8,9,10,11,12,13,14,15] with various approaches in regard to spoken or sung content and microphone array setups.
Voice directivitiy is reported to be affected by different vowels which are exhibiting unique radiation characteristics according to [5,7] and showed highest directionality for the vowel /a/ in [11] or /ɑ/ in [6], followed by /e/, /i/, /o/, and /u/, although for singers in [8] the vowel /e/ is reported to be most directional. In general, the effective difference is shown to be rather subtle for speech but expected to be larger in classical singing due to larger mouth openings. However, in singing the inter-subjective variability is reported to be substantially large [12] which could diminish a clear effect of differences in voice directivity for vowels for a specific subject group.
Voice directivity characteristics can be calculated from measured sound pressure levels at fixed distances from a defined center position along a circle or sphere around a person. The levels can be acquired by time domain or frequency domain analysis. These characteristics inform about how sound is radiated from a singer or talker. The most common metric, and usually used for loudspeaker or antenna characteristics, is the directivity index [16,17]. Recently, we also introduced the beam width and direction of the energy vector metric [15,18] and discussed its usefulness as a descriptor for voice directivity, since the focus of this metric is not front-centered compared to the directivity index. This is especially useful along the vertical axis. The metrics can be computed from long-term averaged spectra (LTAS) or from levels computed from bandpassed signals for each spoken or sung phoneme or phrase. It is also possible to calculate and discuss voice directivity characteristics from impulse responses of sung glissandi (vocal sweeps) [7,15] or from the LTAS of a sung glissandi directly [9]. This approach needs a reference microphone in front of the mouth and a training phase for the subjects to keep their vocal tract configuration constant during the recording of the glissandi.
An important factor for the analysis of voice directivity is the spectral distribution of a single phoneme. Therefore, the mode of voice production in terms of level [5,11] and vocal fold vibration (phonation mode at the vocal folds [19]) influence the energy in different frequency bands and hereby the effective measurable radiated sound. The phonation mode defines the degree of impulsiveness during vocal fold closure of the source signal at the vocal folds and introduces a certain spectral tilt [20]. General differences in phonation modes are described by the terms breathy, modal, and pressed phonation, although other phonation modes especially in pathological voices exist, which are not addressed within this study. The phonation mode implies an effect on the effective sound radiated from the mouth due to spectral changes. However, for classical singing, there is a secondary factor worthwhile investigating, namely the directivity of the voice. The phonation mode may introduce a change in the mouth opening used by the singer which has not yet been investigated in previous studies.
We previously demonstrated that mouth opening and body size have an effect on the voice directivity characteristics of singers [15]. These findings imply that singers of different voice types (e.g. soprano, tenor, etc.) and therefore with different vocal ranges should exhibit different voice directivity characteristics for the same vowel identity. In previous studies, gender differences have been addressed but the results for an effect of gender on voice directivity disagree [5]. For singing, it would make more sense to discuss this in terms of vocal range rather than gender, as we expect the effective mouth opening to increase with pitch for each voice type. However, in this study, the vocal range criterion again separates singers by gender as well.
In the current study we investigate the following:
  • the effects of vocal range (voice type) on voice directivity characteristics,
  • the effects of mouth opening in regard to pitch and vowel,
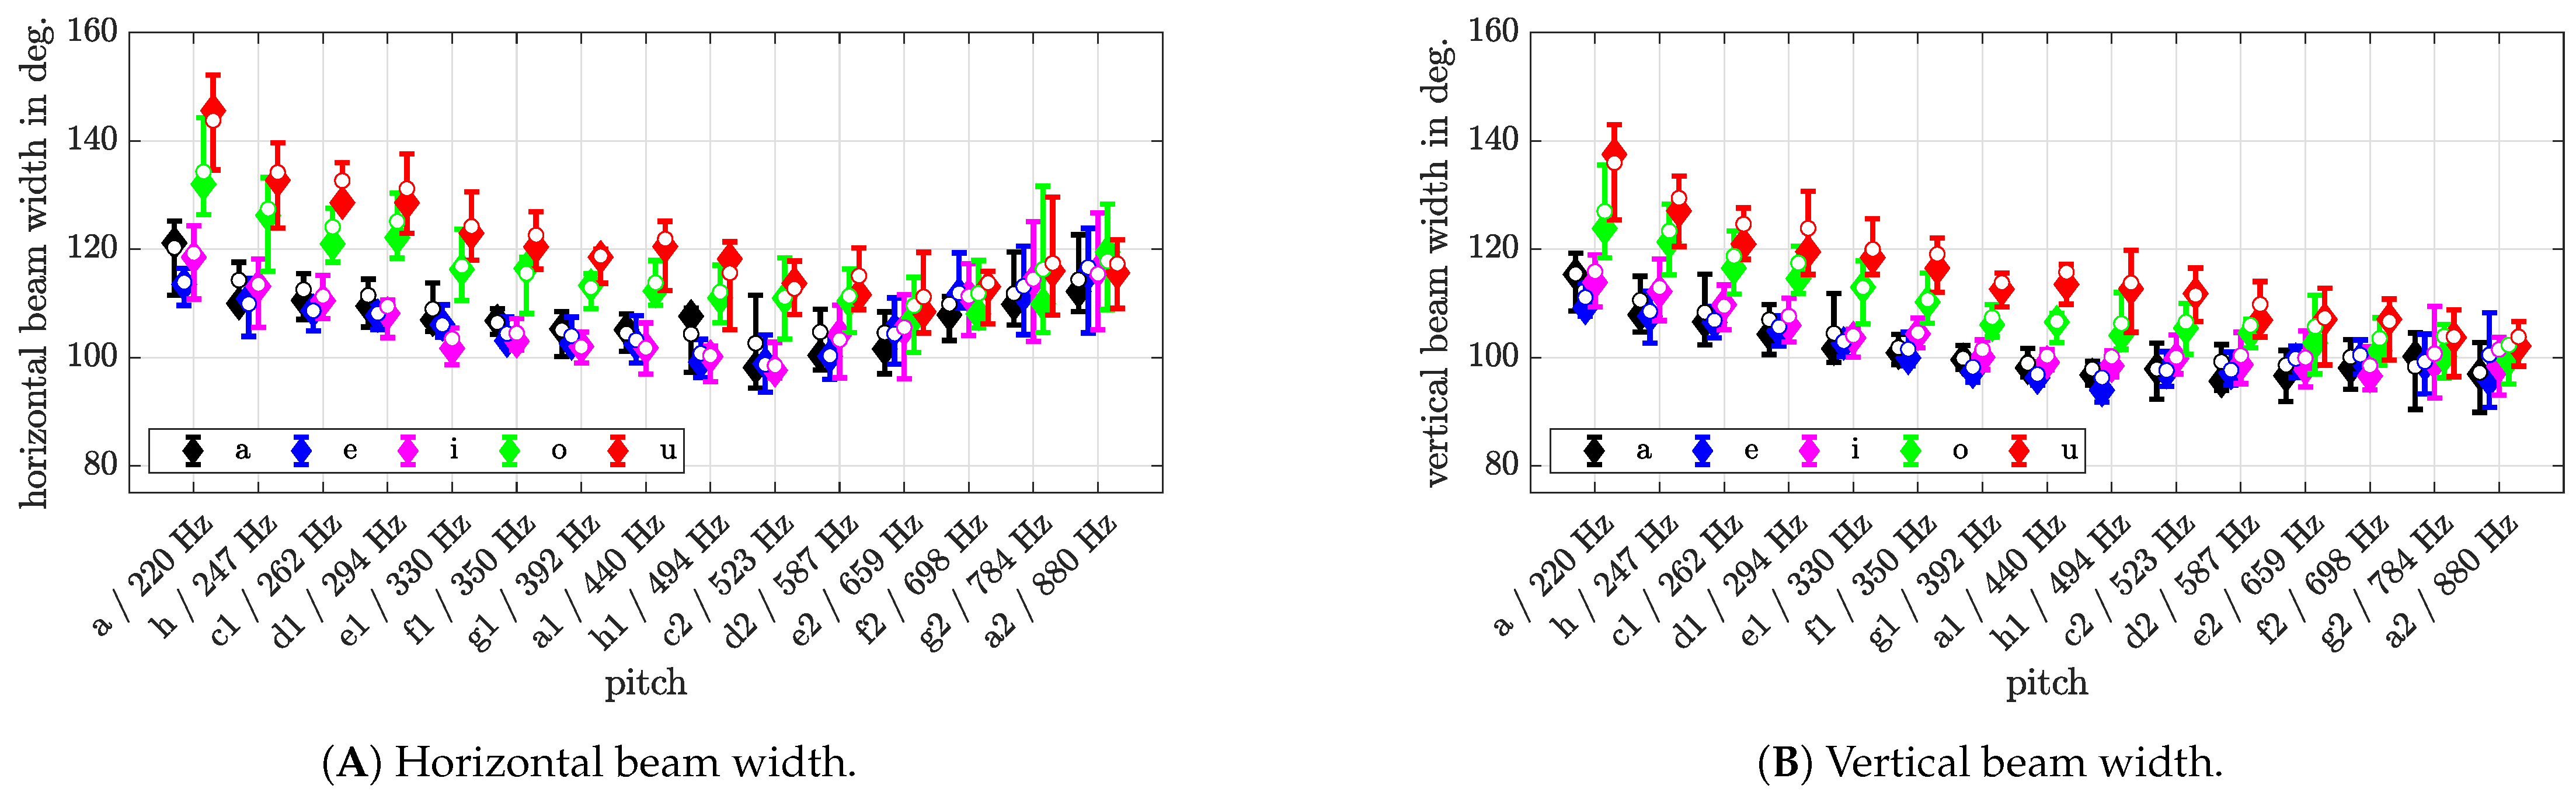
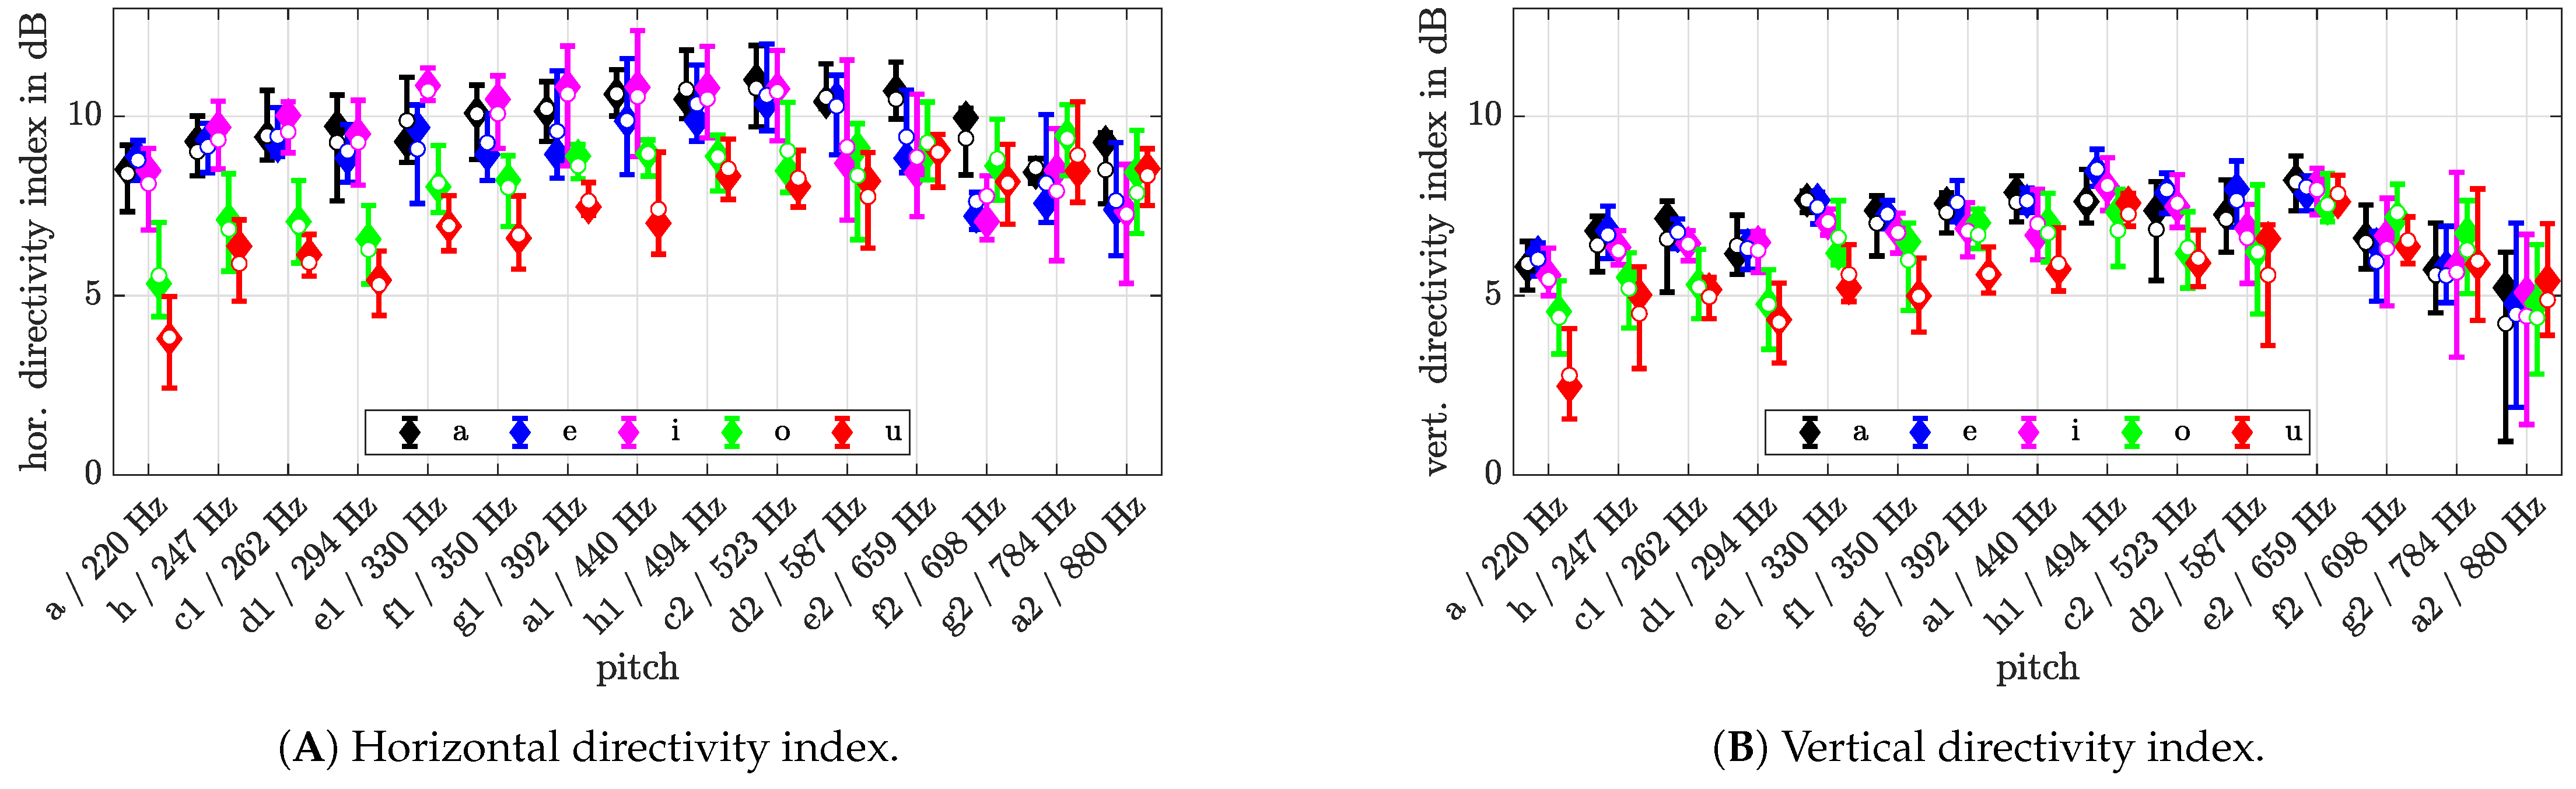
  • vowel specific radiation characteristics for classical singers in the horizontal and vertical plane,
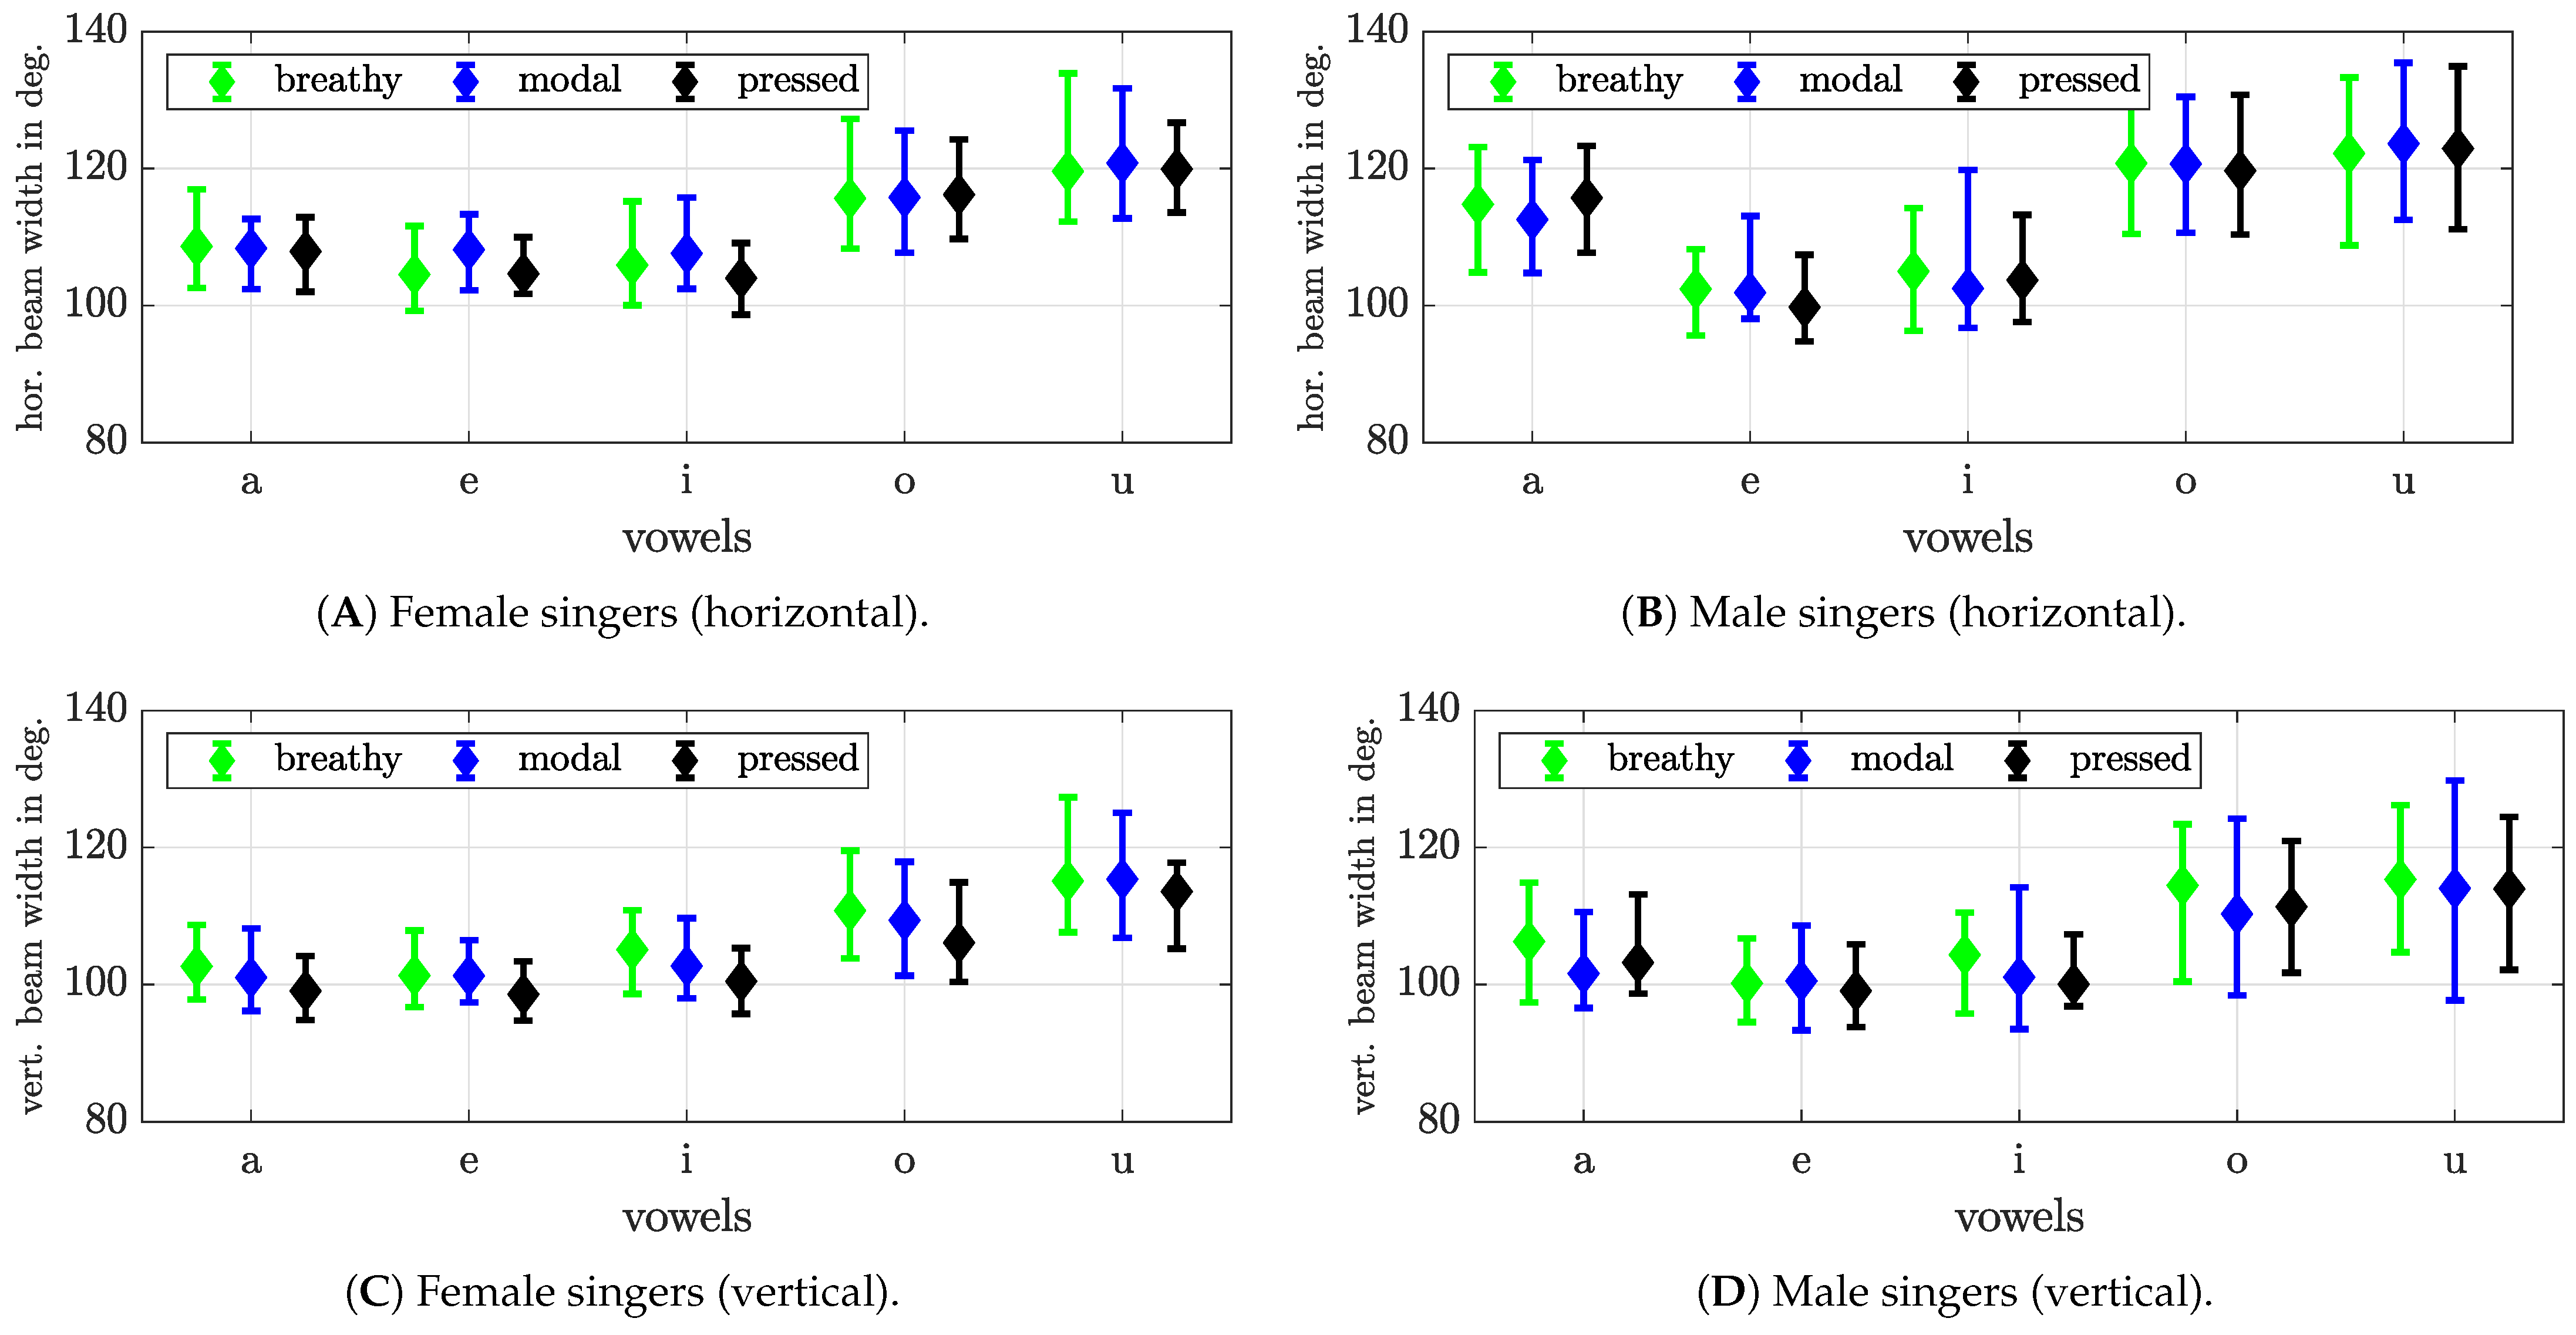
  • the influence of the phonation mode on voice directivity characteristics.
This contribution explains the employed measurement system, the newly generated dataset, and the methods used to process the measurement data. We present results from the acoustic data as polar patterns, and simple broadband or frequency-dependent metrics. Furthermore, we present tracking and video data that allows us to investigate the influence of the mouth opening more rigorously. The findings of the work are interesting for the fields of performance analysis, musical applications, audio recording, virtual and augmented reality systems.

2. Materials and Methods

2.1. Measurement System

A measurement system in an anechoic chamber for the determination of singing voice directivity was set up using the double circle microphone array (DCMA) [21], ten optical tracking sensors and a video camera in order to measure the mouth opening and center position of the singer. The video camera allows to validate the measurement results from the tracking system, to show exemplary mouth openings, and opens the possibility to calculate the mouth opening from video directly. The measurement software was implemented in Pure Data (freely available under http://puredata.info/, accessed on 26 July 2022).

2.2. Room Conditions

Measurements were carried out in a sound treated measurement room with absorptive material on the walls and floor at the Institute of Electronic Music and Acoustics. The mean room reverberation between 400 Hz and 1 kHz is below 75 ms and above 1 kHz below 50 ms. The volume of the room is approximately 50 m3 with a floor area of 22.50 m2.

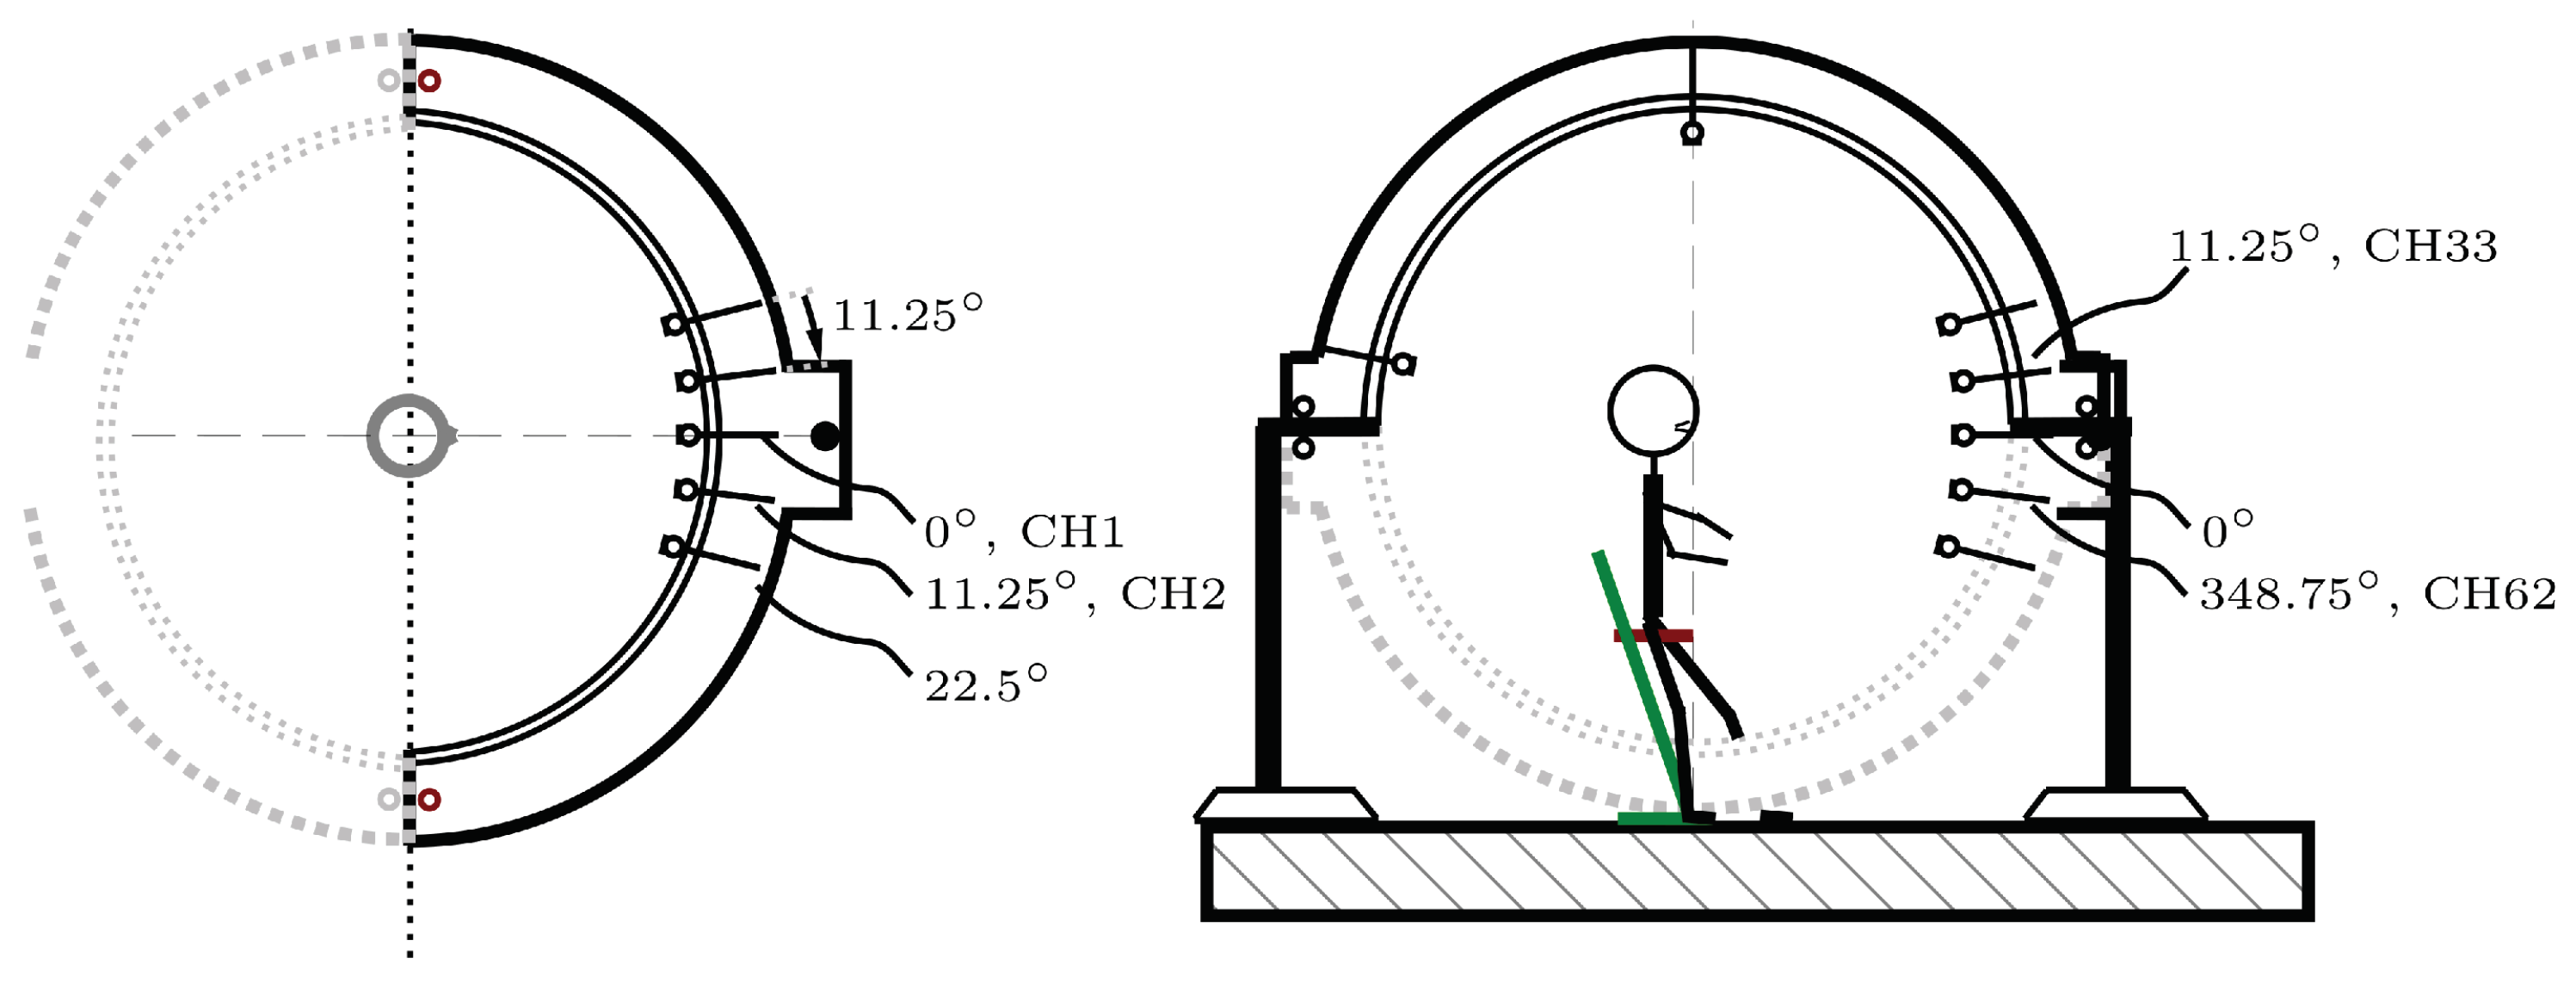
2.3. Double Circle Microphone Array
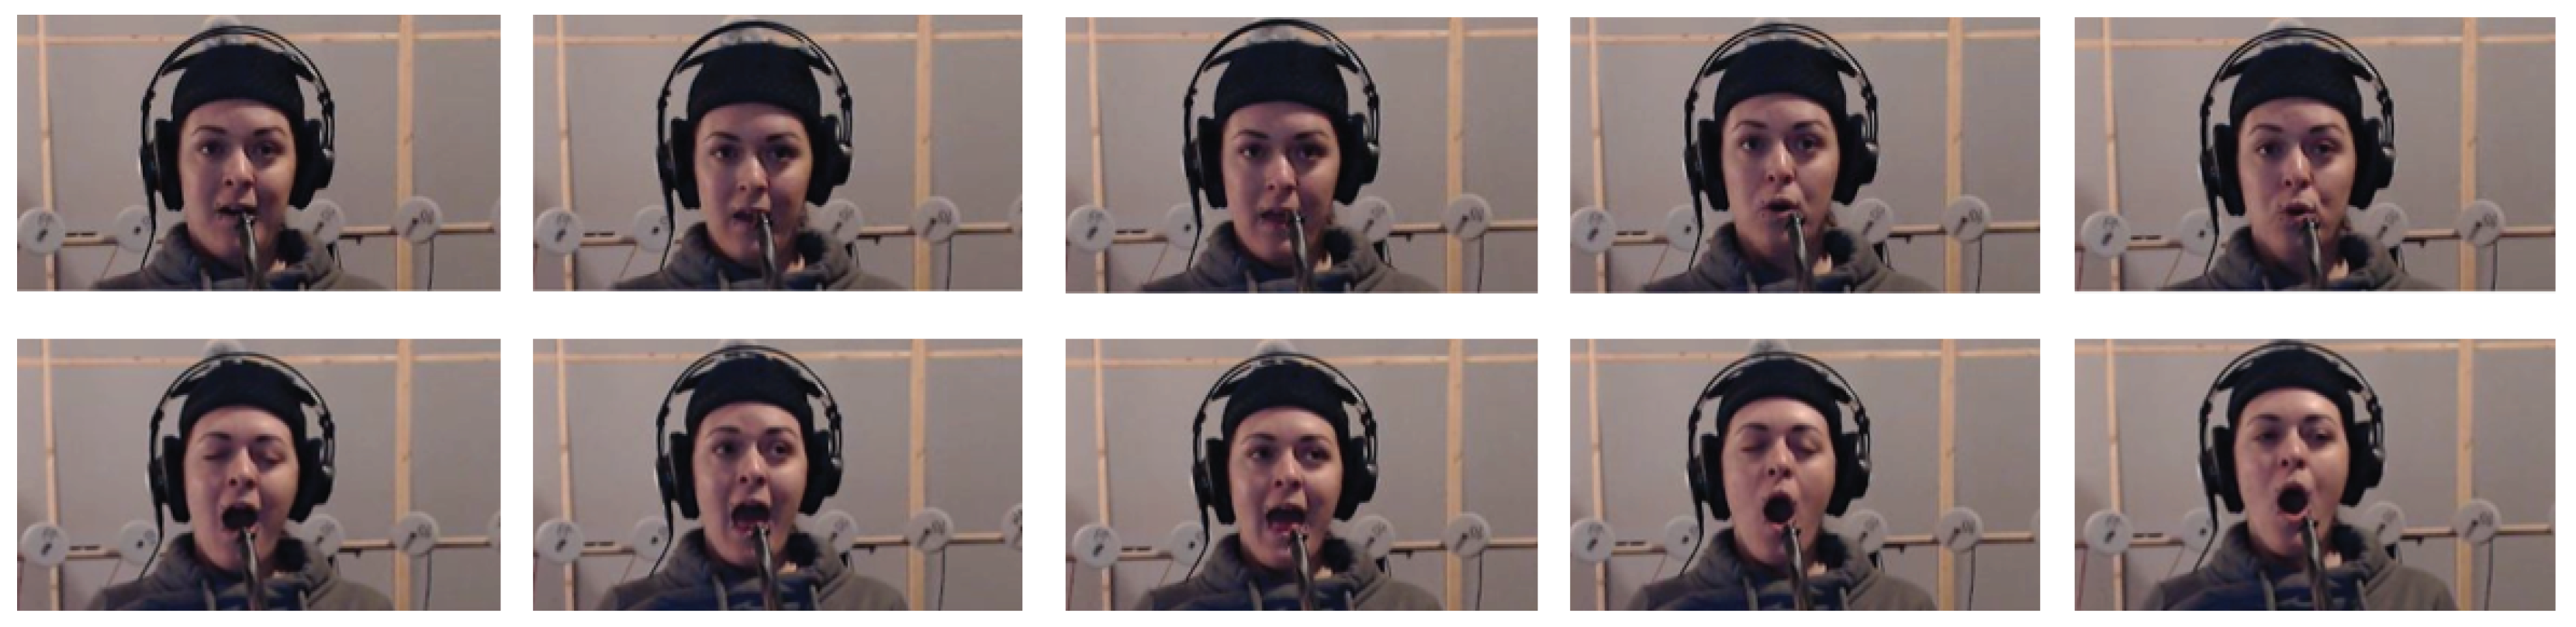
The used microphone array has a radius of 1 m and consists of two circular rings, one placed in the horizontal plane and one in the vertical plane [21]. Each ring holds up to 32 microphones (Omnidirectional pattern, NTI M2230, Schaan, Liechtenstein) resulting in an angular spacing of 11.25 and a total number of 62 microphones (see Figure 1). In addition, a reference microphone (NTI M2230) is used, which is located at the exact center of the microphone array, but not considered in the current calculations.

2.4. Mouth Tracking

The mouth opening and absolute position of the singer inside the microphone array is captured by a tracking system (Optitrack (https://www.optitrack.com/)). The tracking system uses ten cameras (Flex 13), six of them are positioned in the corners of the ceiling in the anechoic chamber and four closer in front of the singer (in 1 m distance). The closer cameras increase the localization accuracy for the mouth tracking. The absolute position is used to prevent large positioning errors during measurements. The conductor of the measurements and the participant have both a visual feedback of the current position, which indicates larger deviations than 5 cm from the center with a warning. If such a warning should occur, the measurement is repeated. The distance of 5 cm has been found to be acceptable [15] and the largest expected error for the sound pressure level at a single microphone position is 0.72 dB. The tracking data is then used to calculate the mouth opening area. Therefore, the tracking data of the single facial markers around the mouth are put in order by calculating the convex hull for each time frame. The resulting polygons are used to calculate the average area that gives the effective mouth opening area. Note that the positioning of the facial markers as close as possible to the lips leads to a minor individual offset, which is expected to be constant for each singer during the measurements. However, as we are interested in the relative change due to pitch and vowel, we do not compensate for this constant offset in the further analysis.

2.5. Augmented Acoustics

For the acoustic analysis, dry signals are measured in an anechoic environment. However, in singing, room acoustics support the voice, which is a necessity in a longer recording session. Therefore, we use an augmented acoustic system with zero latency [22,23] that only gives the singer natural room acoustics via transparent headphones [24] while creating no reverberation on the microphone signals. The augmented acoustic system is fed by the microphone in front of the singer and employs a static, however frequency-dependent directivity to excite the virtual room. The virtual room simulates a shoe-box-like concert hall with a size of roughly 30 m × 24 m × 20 m and a reverberation time of 2.2 s. Typical reverberation times of concert halls are in the range between 1.5 s and 3 s [25,26].

2.6. Dataset

For the purpose of this study we created a newly dataset of 5 sustained German vowels /a:/, /e:/, /i:/, /o:/, /u:/ sung by 4 male singers (3 tenors, 1 baritone) over the pitch range on a whole-tone scale from H/B2/123 Hz to a1/A4/440 Hz, except for the baritone only up to e1/E4/330 Hz, and from six female singers (3 soprano and 3 mezzo-soprano) from a/A3/220 Hz to a2/A5/880 Hz. All singers were trained classical singers except for the baritone (jazz), who said to have the ability to mimic the classical singing technique due to his teaching experience at the music conservatory. The average age was 29.6 years; the youngest 24 years old, the oldest 34. The classical trained singers were 4 graduate (at the end of their current master studies), 5 post-graduate students (with one master’s degree ore more), and 1 undergraduate (bachelor’s degree). Six of them were also teaching. The singers were asked to sing the vowels, starting on the consonant /m/ and sustaining the vowel for 2 seconds. The vowels were repeated three times each with different provoked voice phonation modes (modal, breathy, and pressed), which gives a total number of 2145 audio samples. The singers were asked to sing at a comfortable loudness level (mezzo-forte). All participants were well trained for the task due to their extensive practice during their classical vocal studies. The dataset is publicly available under https://phaidra.kug.ac.at/o:127031 (accessed on 26 September 2022).

2.7. Calculation of Directivity Characteristics

For the current study, a large dataset with multiple variables was created, which means that simplified metrics may be beneficial for discussing potential differences in directivity between vowels, gender, pitch, and phonation modes. For our simplified metrics for the whole data, we opted for a broadband approach. Directivity characteristics can be computed in the frequency domain or time domain. The general difference between these two calculation methods lies in the different consideration of frequency components. As mentioned above, the spectral components differ depending on the vowel identity and phonation mode and therefore influence the effectively radiated sound. In our investigation, we want to focus on the maximum separability of the data. Therefore, we compute directivity characteristics for a sung vowel at a single pitch (i) from frequency data calculated using Welch’s method (averaged periodogram method) [27] to discuss general differences between the female and male singers (see Section 3.1), and (ii) from levels from frequency domain data extracted only at the harmonics (see Section 3.3). Averaging of metrics calculated from frequency domain data means a stronger weighting of spectral components at higher frequencies that usually exhibit lower sound pressure levels, whereas these components would have only a smaller influence on metrics calculated broadband in the time domain. Nevertheless, including the frequency components equally will allow a better discrimination between vowels, for example. The audio signals for the frequency analysis are segmented with a frame length of 93 ms and 50% overlap at a sampling frequency of 44.1 kHz. Then, the spectrum of each segment is calculated with a frequency resolution of approx. 10.7 Hz. The estimated averaged frequency responses are then third-octave smoothed. The segments extracted from the recordings for further analysis exclude the consonant at the beginning of each vowel. The resulting data allows to investigate differences of voice directivity between sung vowels, which exhibit complex radiation patterns if analyzed in detail, with simplified metrics.

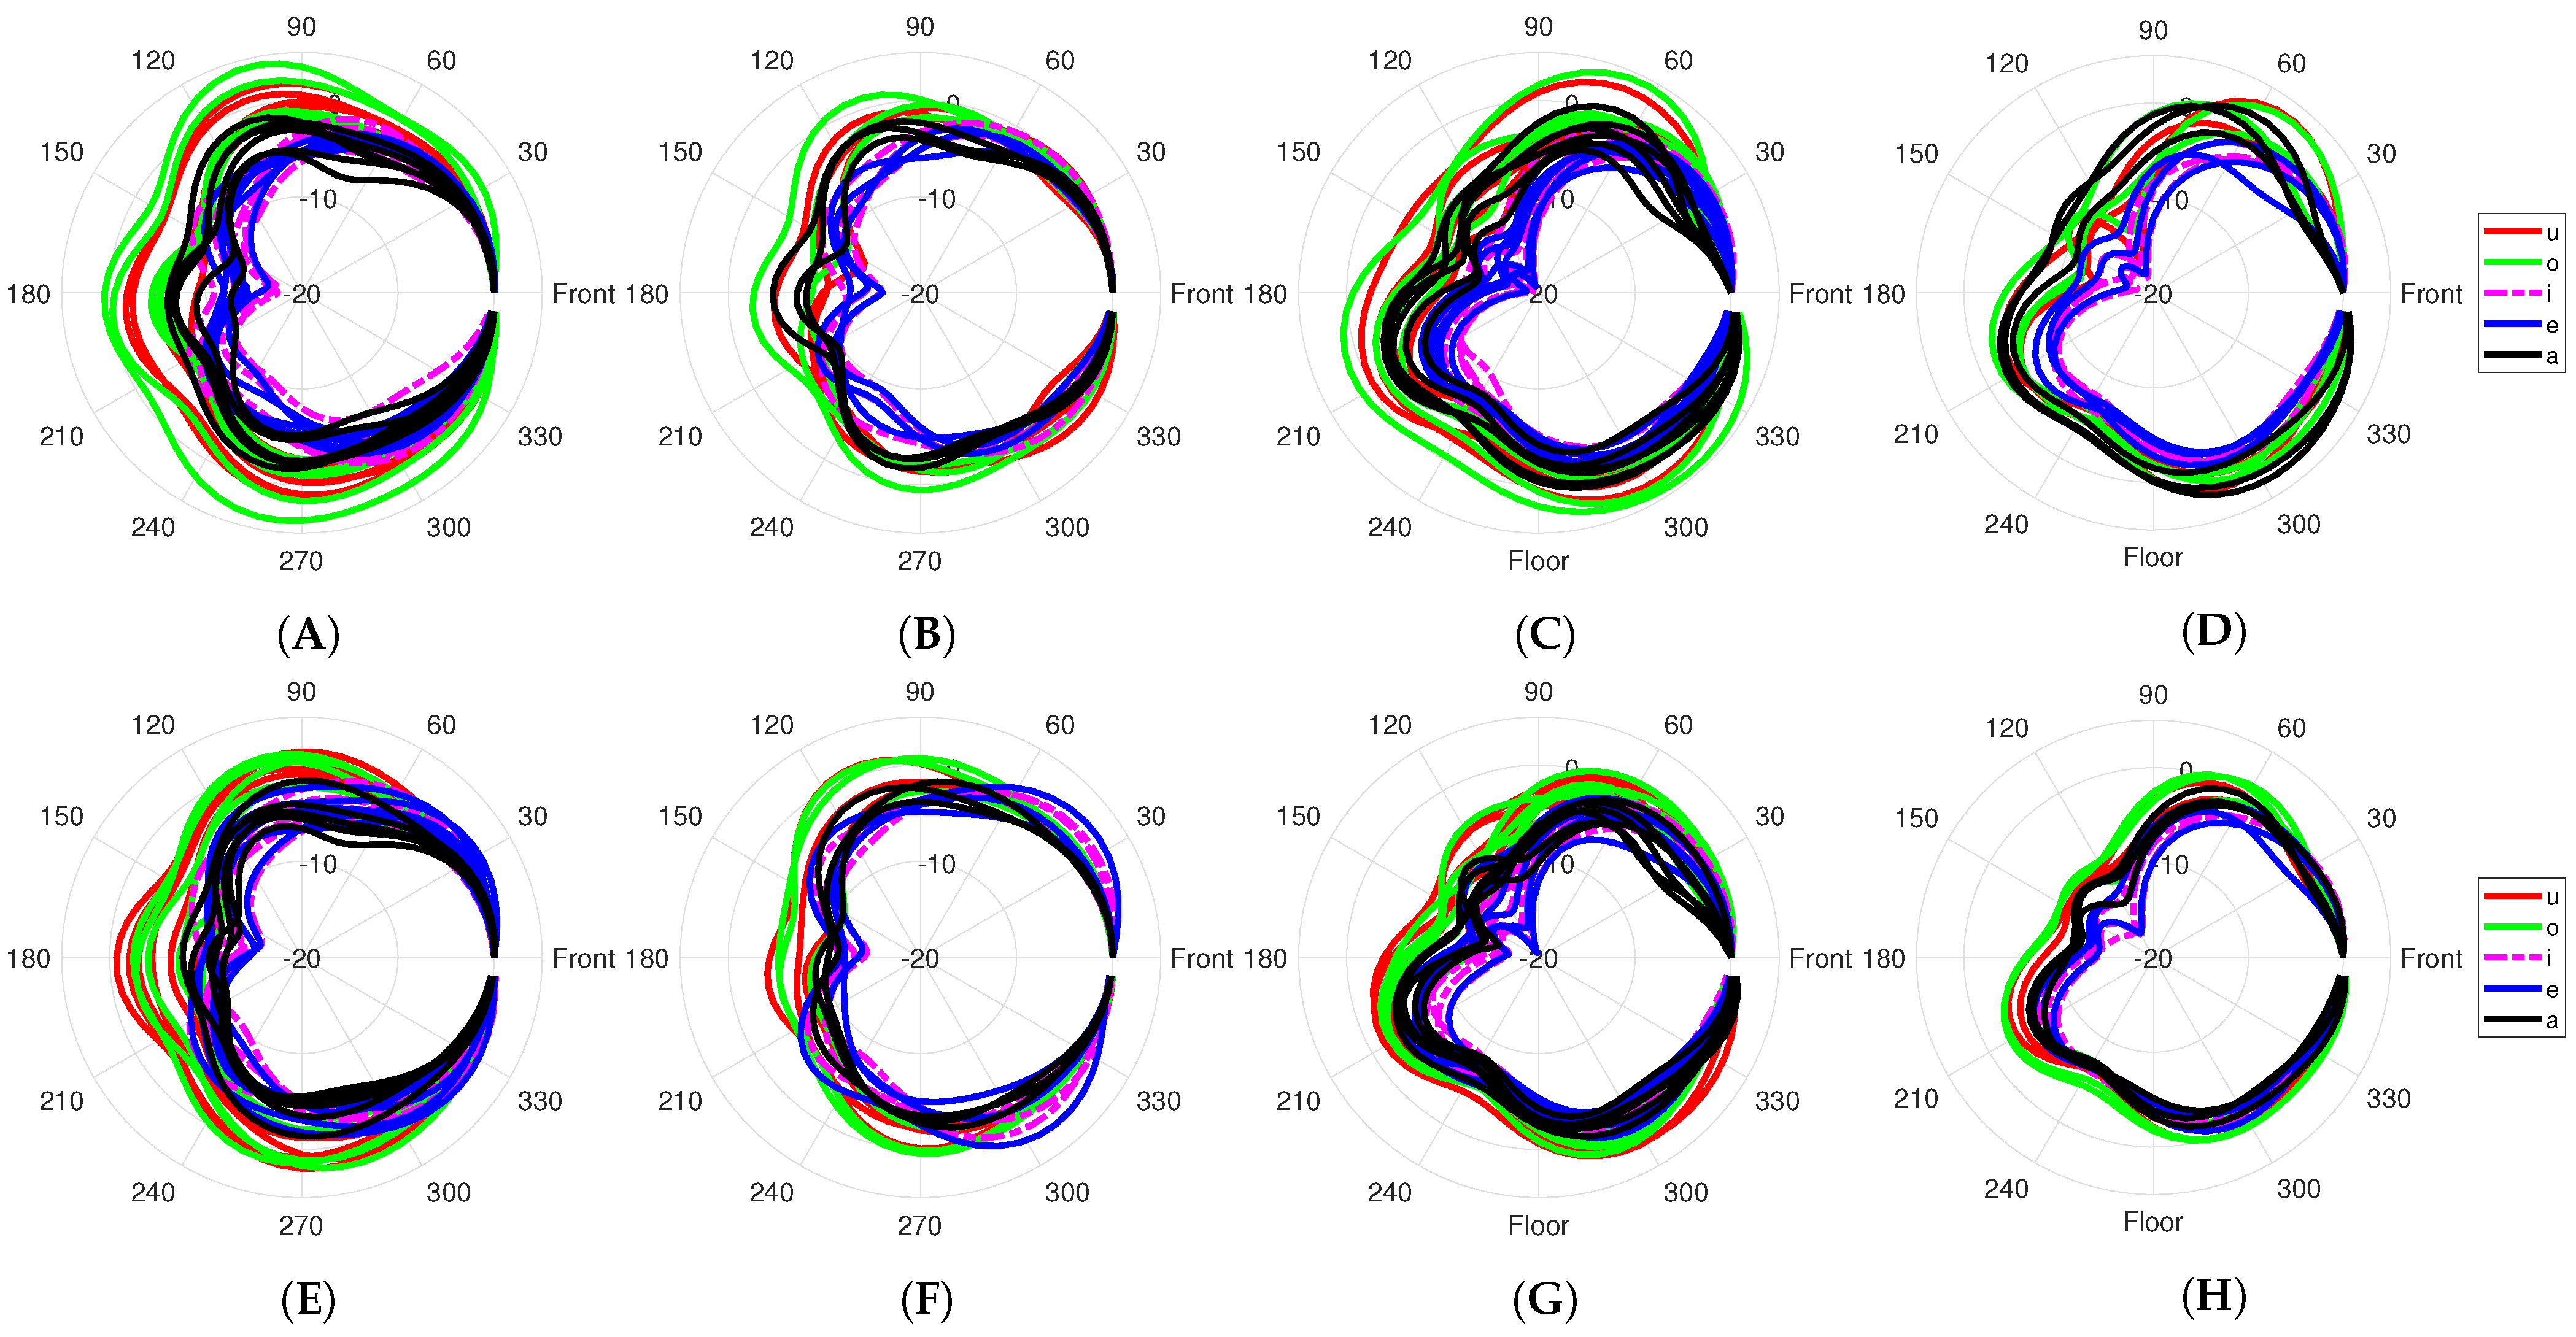
2.8. Directivity Patterns

Instead of neglecting a signal analysis focusing only on components of high sound pressure level, we present compact results from high-passed signals (1 kHz, 4th-order Butterworth) as polar patterns evaluated in both planes for female and male singers. The cutoff frequency of the high-pass filter is chosen according to the findings in Section 3.1. A quasi-continuous representation of arbitrary radiation directions for the azimuth angle ϕ can be rendered from given discrete measurement positions by applying the circular harmonic transform [28]. The polar patterns are displayed logarithmically and show a dynamic range of 25 dB in each plane.

2.9. Directivity Index

The directivity factor γ p ( ω ) = P o n a x i s P m e a n , the most common metric in directivity analysis [16], in each plane is defined by the ratio of the on-axis power P o n a x i s to the average power P m e a n of all sampling positions on the respective plane. The horizontal and vertical directivity index (HDI, VDI), evaluated at an angular frequency ω is defined in dB as follows:
D I ( ω ) = 10 log 10 ( γ p ( ω ) ) .
However, due to its definition the directivity index is front centric and has been shown to decrease strongly at frequencies around 550 to 1000 Hz for the human voice [7,15]. This decrease is dependent on the shape and size of the torso, head size, and vowel. The effect of reduced frontal radiated energy also occurs at odd multiples of the first strong valley in the directivity index when investigated over frequency [15]. However, in order to perform a comparative analysis with previous studies, we include the directivity index results in the current study.

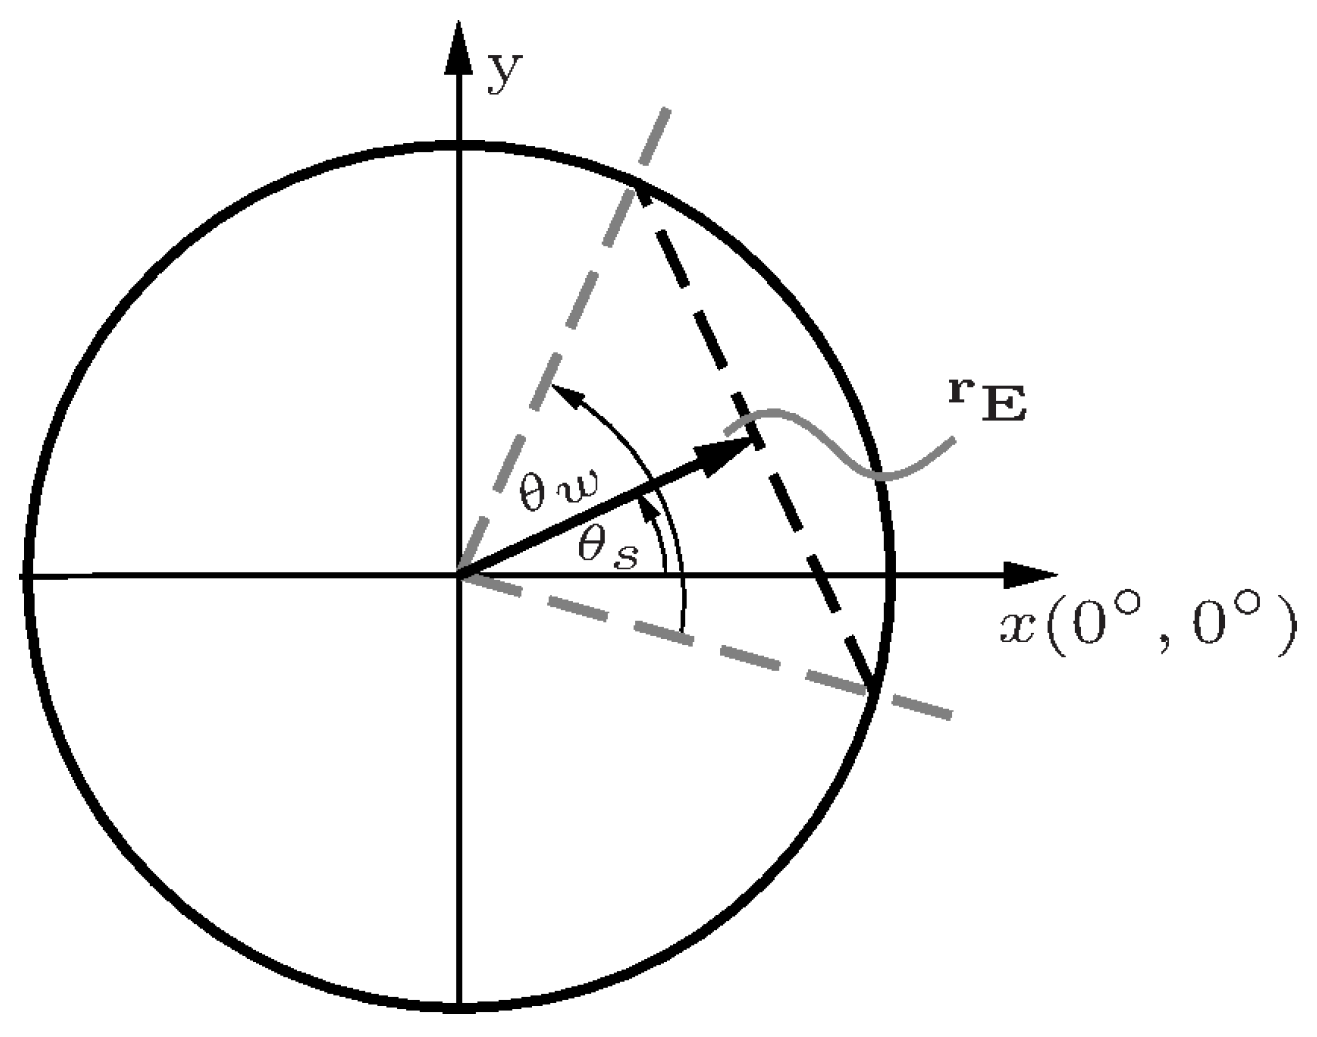
2.10. Beam Width of the Energy Vector

The energy vector is commonly used in the context of 3D loudspeaker playback, but is as well useful in the description of the characteristics of any arbitrary sound source radiation [18] and avoids the directivity index problem of frontal fixation on a single measurement point. This is especially useful for the vertical plane, because previous studies report a more downward radiating voice at higher frequencies [8,15]. The energy vector r E in Equation (2) can be utilized to describe the main radiating direction and its corresponding width of an acoustic source.
r E ( ω ) = i = 1 L | H ( ω , ϕ i ) | 2 m i i = 1 L | H ( ω , ϕ i ) | 2 .
The frequency-dependent magnitudes H ( ω , ϕ i ) at the measurement angles ϕ i are multiplied by the vectors m i = [ cos ( ϕ i ) , sin ( ϕ i ) ] T of each measurement position i, i = 1 , 2 , . . . , L in each respective plane, and normalized by the sum of the energy, yielding a normalization of the vector between the limits 0 (omni-directional) to 1 (maximum focus to one direction). As a non-front-centered metric in comparison to the directivity index we use the main beam width in each plane in Equation (3):
θ w = 2 arccos r E .
The beam width θ w will measure the broadness of the beam towards the direction of highest intensity (see Figure 2). In the case of two side-lobes with similar strength and a decrease towards the front, the energy vector r E will be still centered towards the front but exhibit a broader beam width. In the case of a single side-lobe being stronger than the other, the direction of r E will change more towards the direction of the competing side-lobe dependent on its level.

3. Results and Discussion

3.1. Effects of Vocal Range

The first analysis aims on the relationship of vocal range on voice directivity. Therefore, we present the results for HDIs and VDIs averaged over the pitches a/A3/220 Hz to g1/G4/392 Hz for the female and male singers separately. The singers have an overlapping pitch range from a/A3/220 Hz to a1/A4/440 Hz. We present the mean values and standard deviations of the HDIs averaged over the overlapping pitch range in Figure 3A,B for each vowel. The results agree well with the voice directivity study of 13 talkers in [7], but most strikingly the classical singers show an overall higher directivity above 2.5 kHz compared to the talkers. Furthermore, in the figures is shown that the first prominent decrease in HDIs starts around 650 Hz for female and male singers, but only the female singers exhibit a distinct decrease around 1 kHz. This could be linked to the influence of the torso size [15] in combination with the effective mouth opening used by the singers. The effective mouth opening differs for the same vocal range between the singer groups, which is also shown by the results presented in the next section. The larger used mouth openings of the male singers (cf. Section 3.2) explain the smaller differences between HDIs and VDIs for the front vowels /a:, e:, i:/, and back vowels /o:, u:/, compared to the female results. Another interesting aspect is that in the vertical plane, the vowels /e:, i:/ are more directional on average above 1.3 kHz. This could be due to stronger reflections of the upper body in regard to the used mouth opening for these vowels.
In addition and as alternative to the directivity index, we present the beam width metric, which does not exhibit extreme decreases due to its mathematical definition, but shows similar pronounced differences to discuss effects on voice directivity and can be found in Table A1. In Figure 4 we plot the directivity patterns at low (a/A3/220 Hz) and high (a1/A4/440 Hz)) pitch computed from high-pass signals at 1 kHz with a 4th-order Butterworth filter to exclude torso influences and include only frequency components with high sound pressure levels and to see if this already reduces the differences between the genders (voice range). Most striking in the figures is that the gender or voice range difference is still quite visible for the horizontal plane with more pronounced backward radiation for the female singers at both pitches. It is also shown that the male singers exhibit less variability between vowels, which was already seen by the metrics presented in Figure 3. The male singers exhibit broader patterns in the horizonal plane for /e:, i:/ compared to the female singers. In general we see large variability in the data and a dependence on pitch. Again, the differences in the data between female and male singers seems to be related to the mouth opening, which is discussed in the next section in more detail.

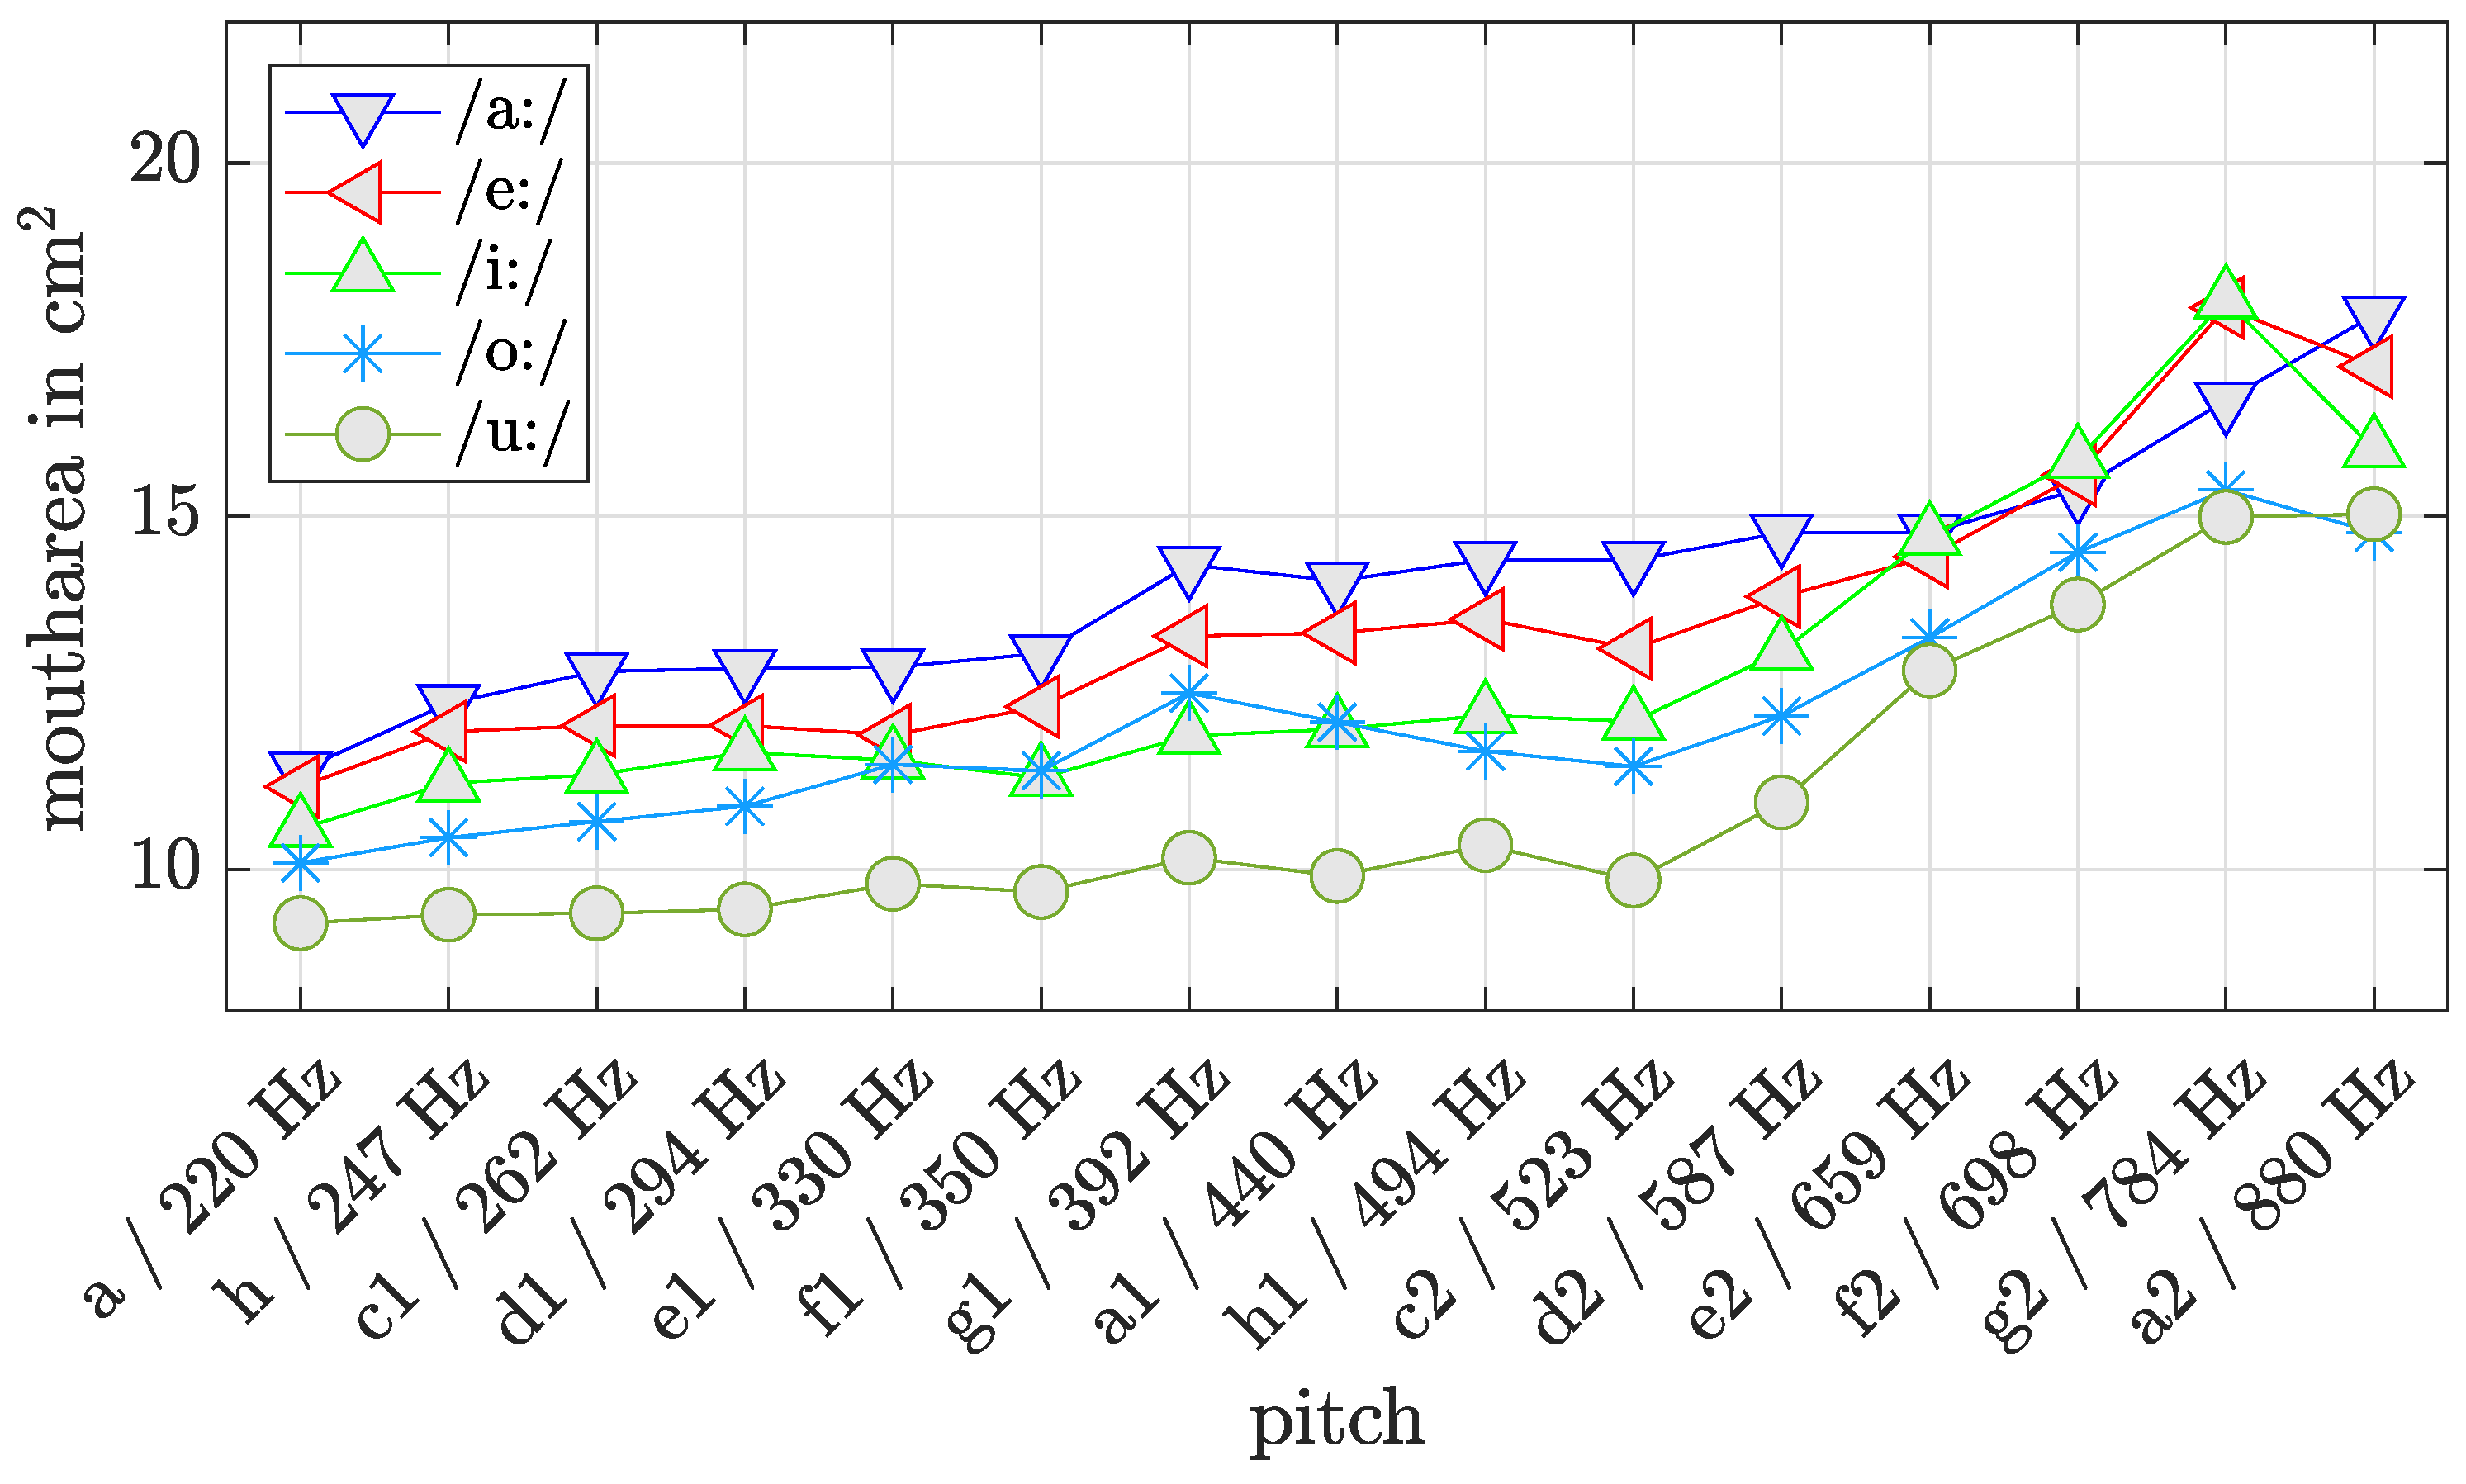
3.2. Effects of Pitch on Mouth Opening

The measurement setup allows to track the effective mouth opening by using facial markers and a motion tracking system (The tracking of single markers proved to be problematic for some of the male singers, so the tracking data is omitted for the male singers and video extracts are presented instead.). The effective mouth opening is computed by calculating the convex hull [29] of the positions of the facial markers in a Cartesian coordinate system. Figure 5 shows that the average mouth opening areas for the vowels of the six female singers differ. The average difference between all vowels up to d2/D5/587 Hz lies at 0.98 cm2 with average differences between each vowel pairs: Δ ¯ a e = 0.95 cm2, Δ ¯ e i = 1.59 cm2, Δ ¯ i o = 0.21 cm2, and Δ ¯ o u = 1.58 cm2. Above d2/D5/587 Hz, a general increase in mouth opening is observed, rising to a maximum of about 15 cm2. At the highest pitch a2/A5/880 Hz the mouth opening area decreases slightly for the front vowels /e/ and /i/. Figure 6 shows how differently the mouth opening is shaped for all vowels at low (c/C3/196 Hz) and high pitch (a1/A4/440 Hz) for one male singer and in Figure 7 for one female singer. Here, the expected difference due to the classical singing style between mouth openings for female and male singers (singers of different vocal range) is already apparent. The male singers already reach their highest pitch at a1/A4/440 Hz and use larger mouth openings for all vowels, while the female singers still use moderate mouth openings at the same pitch with visible differences shown in Figure 7.

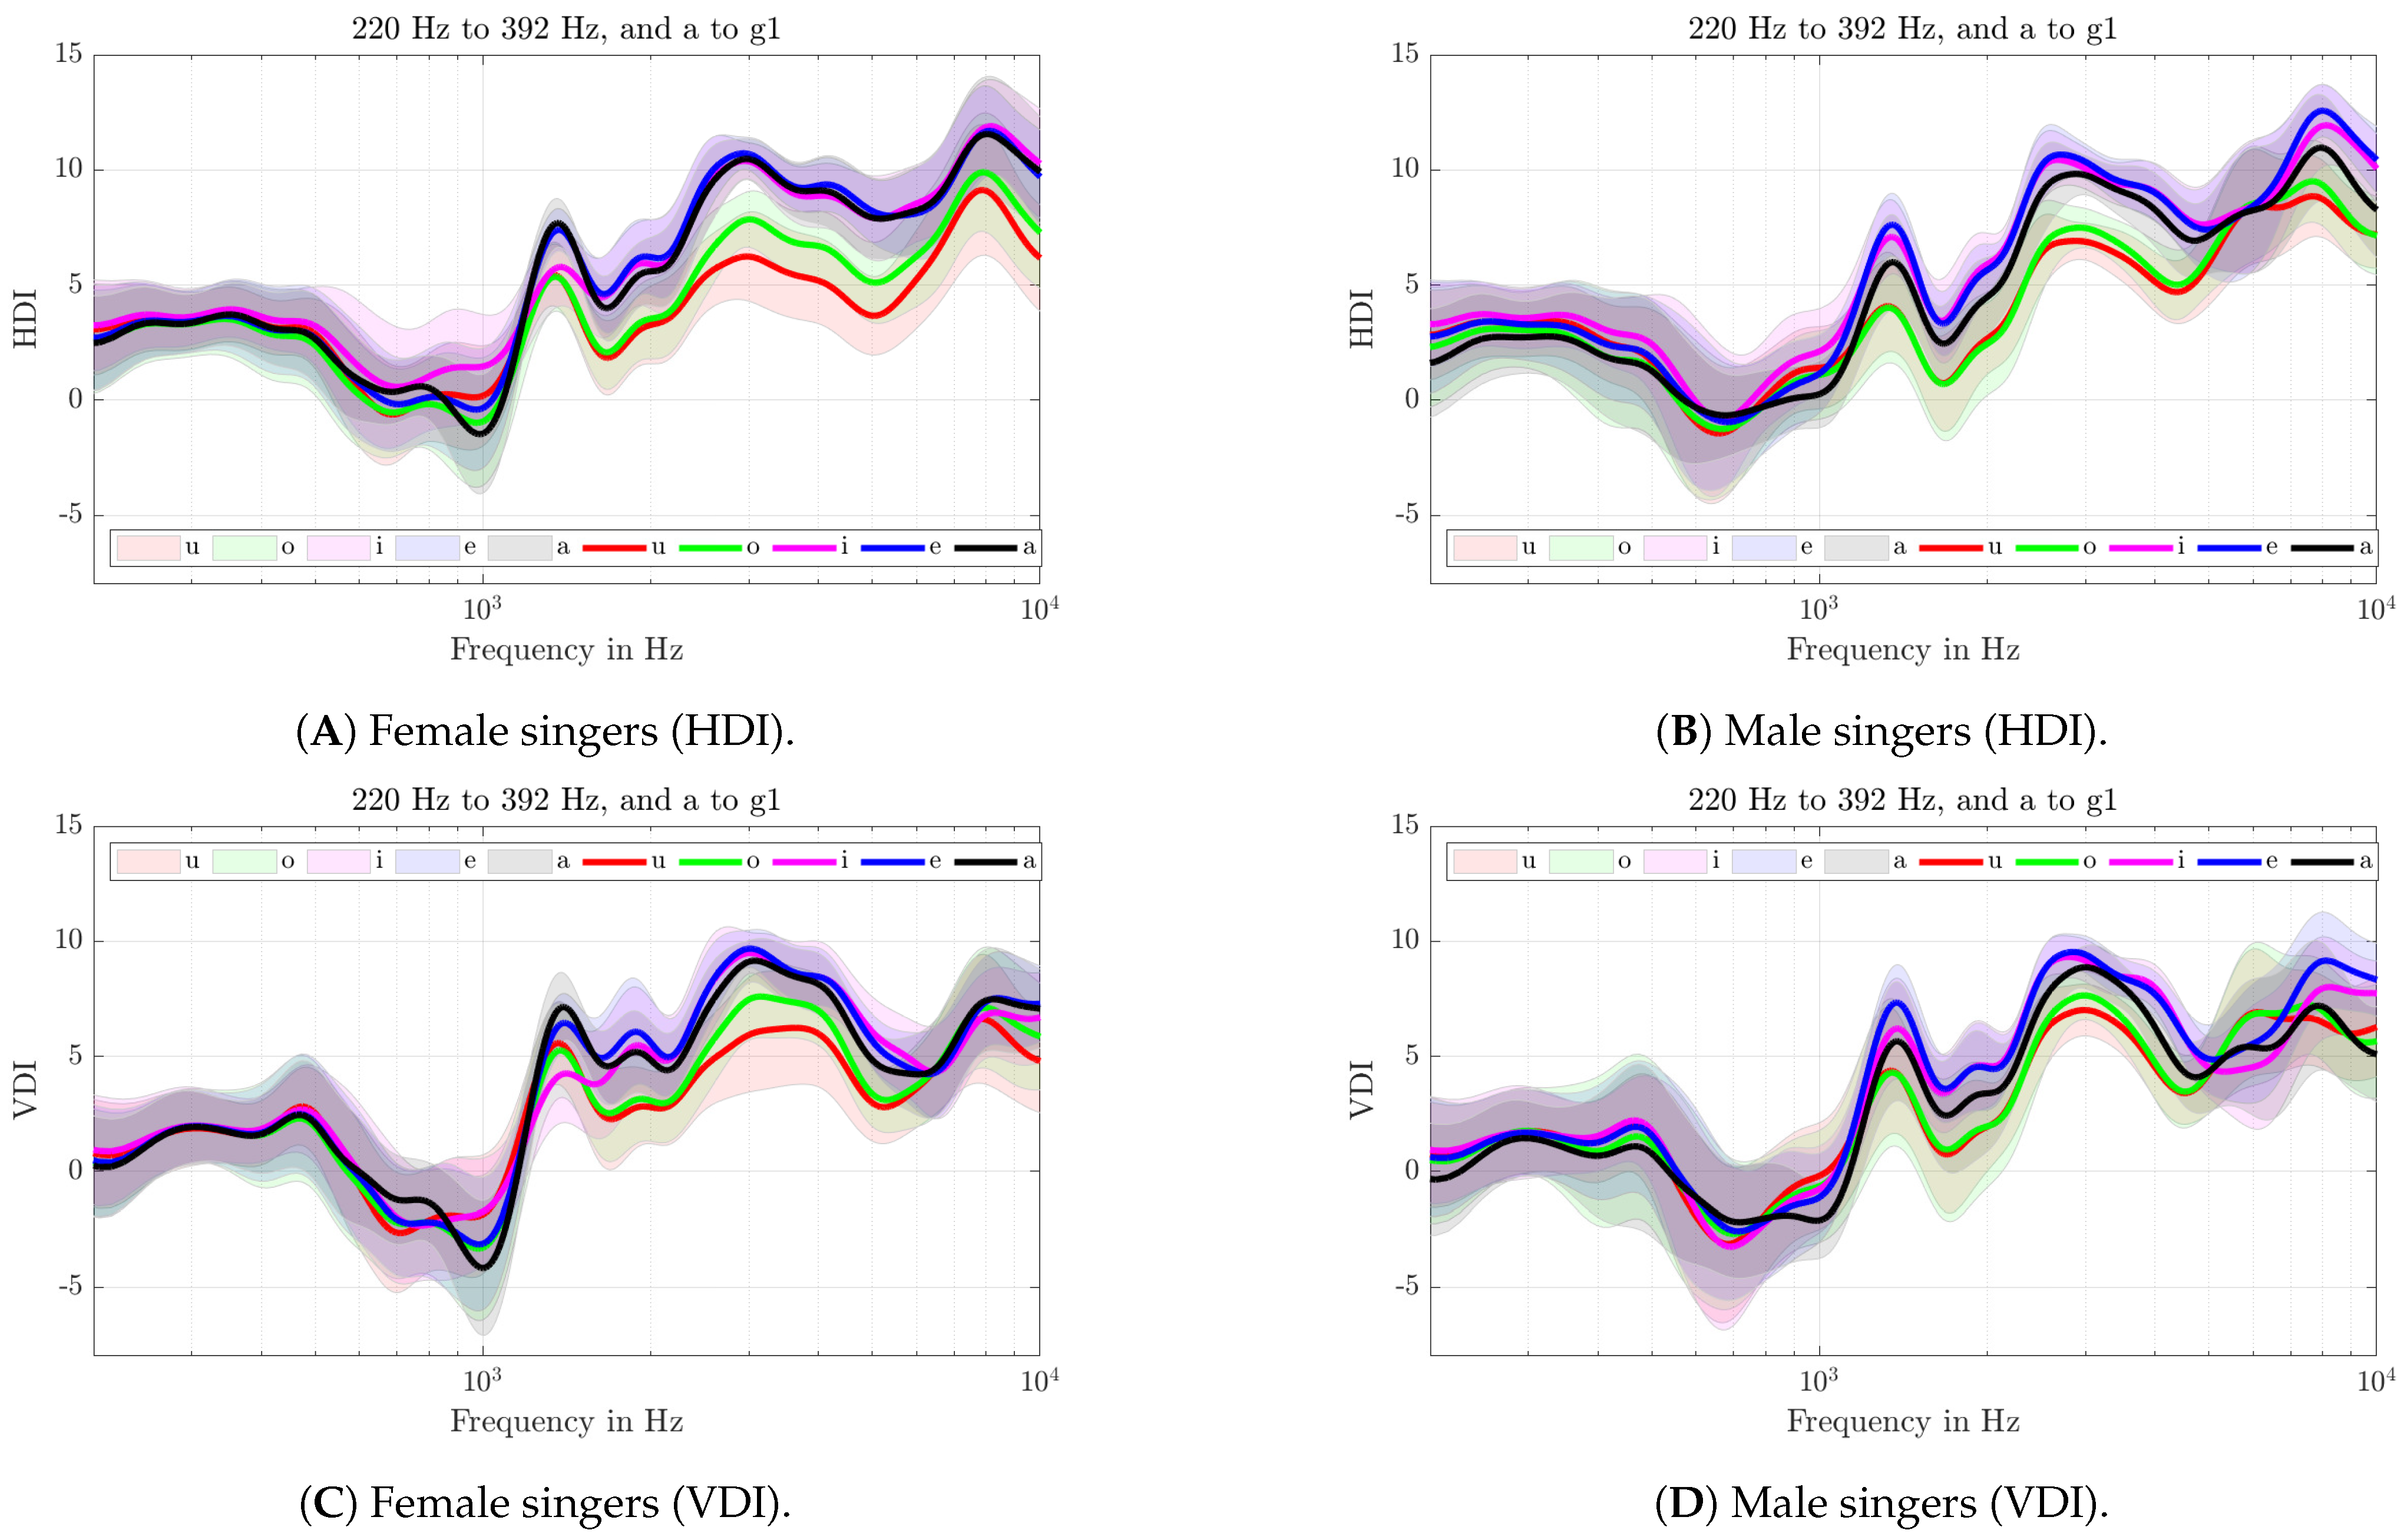
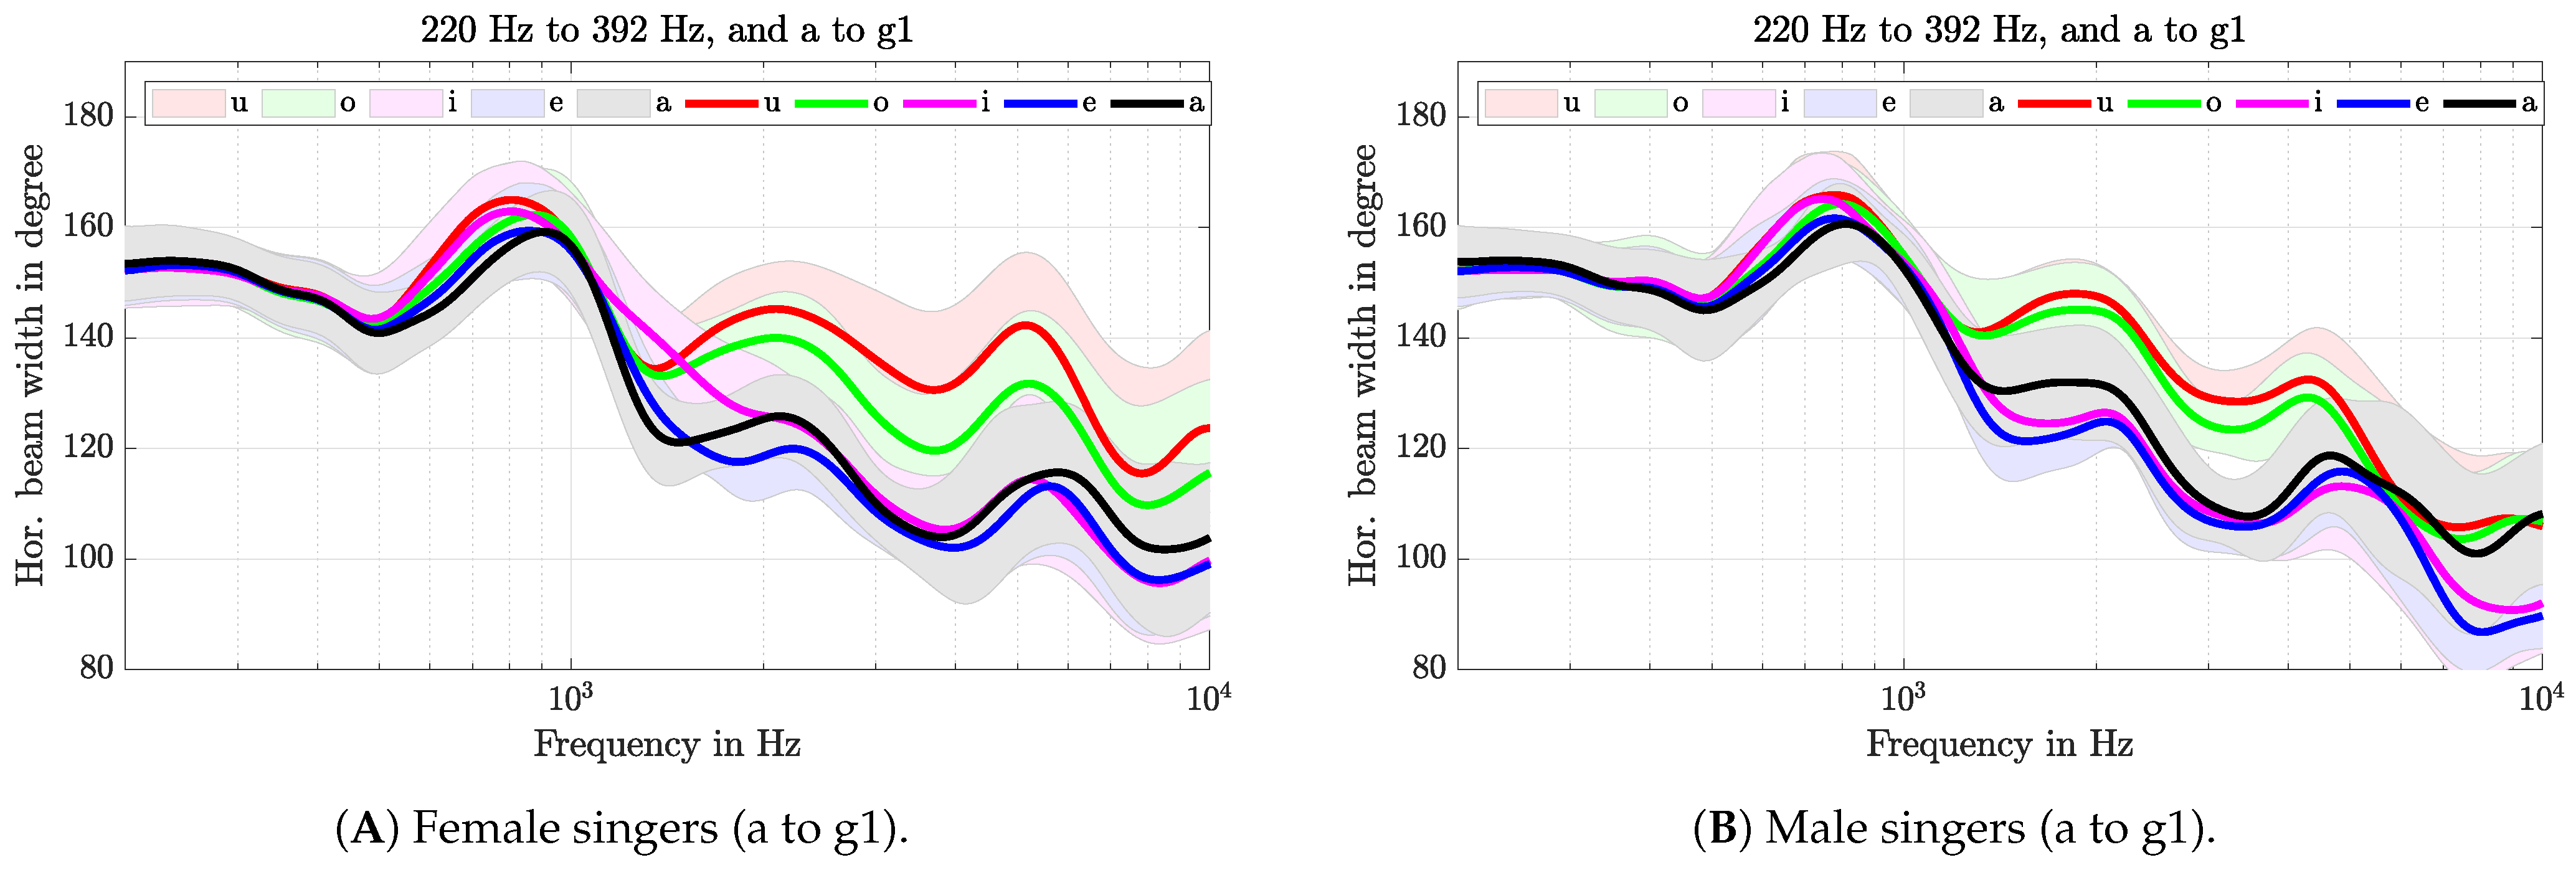
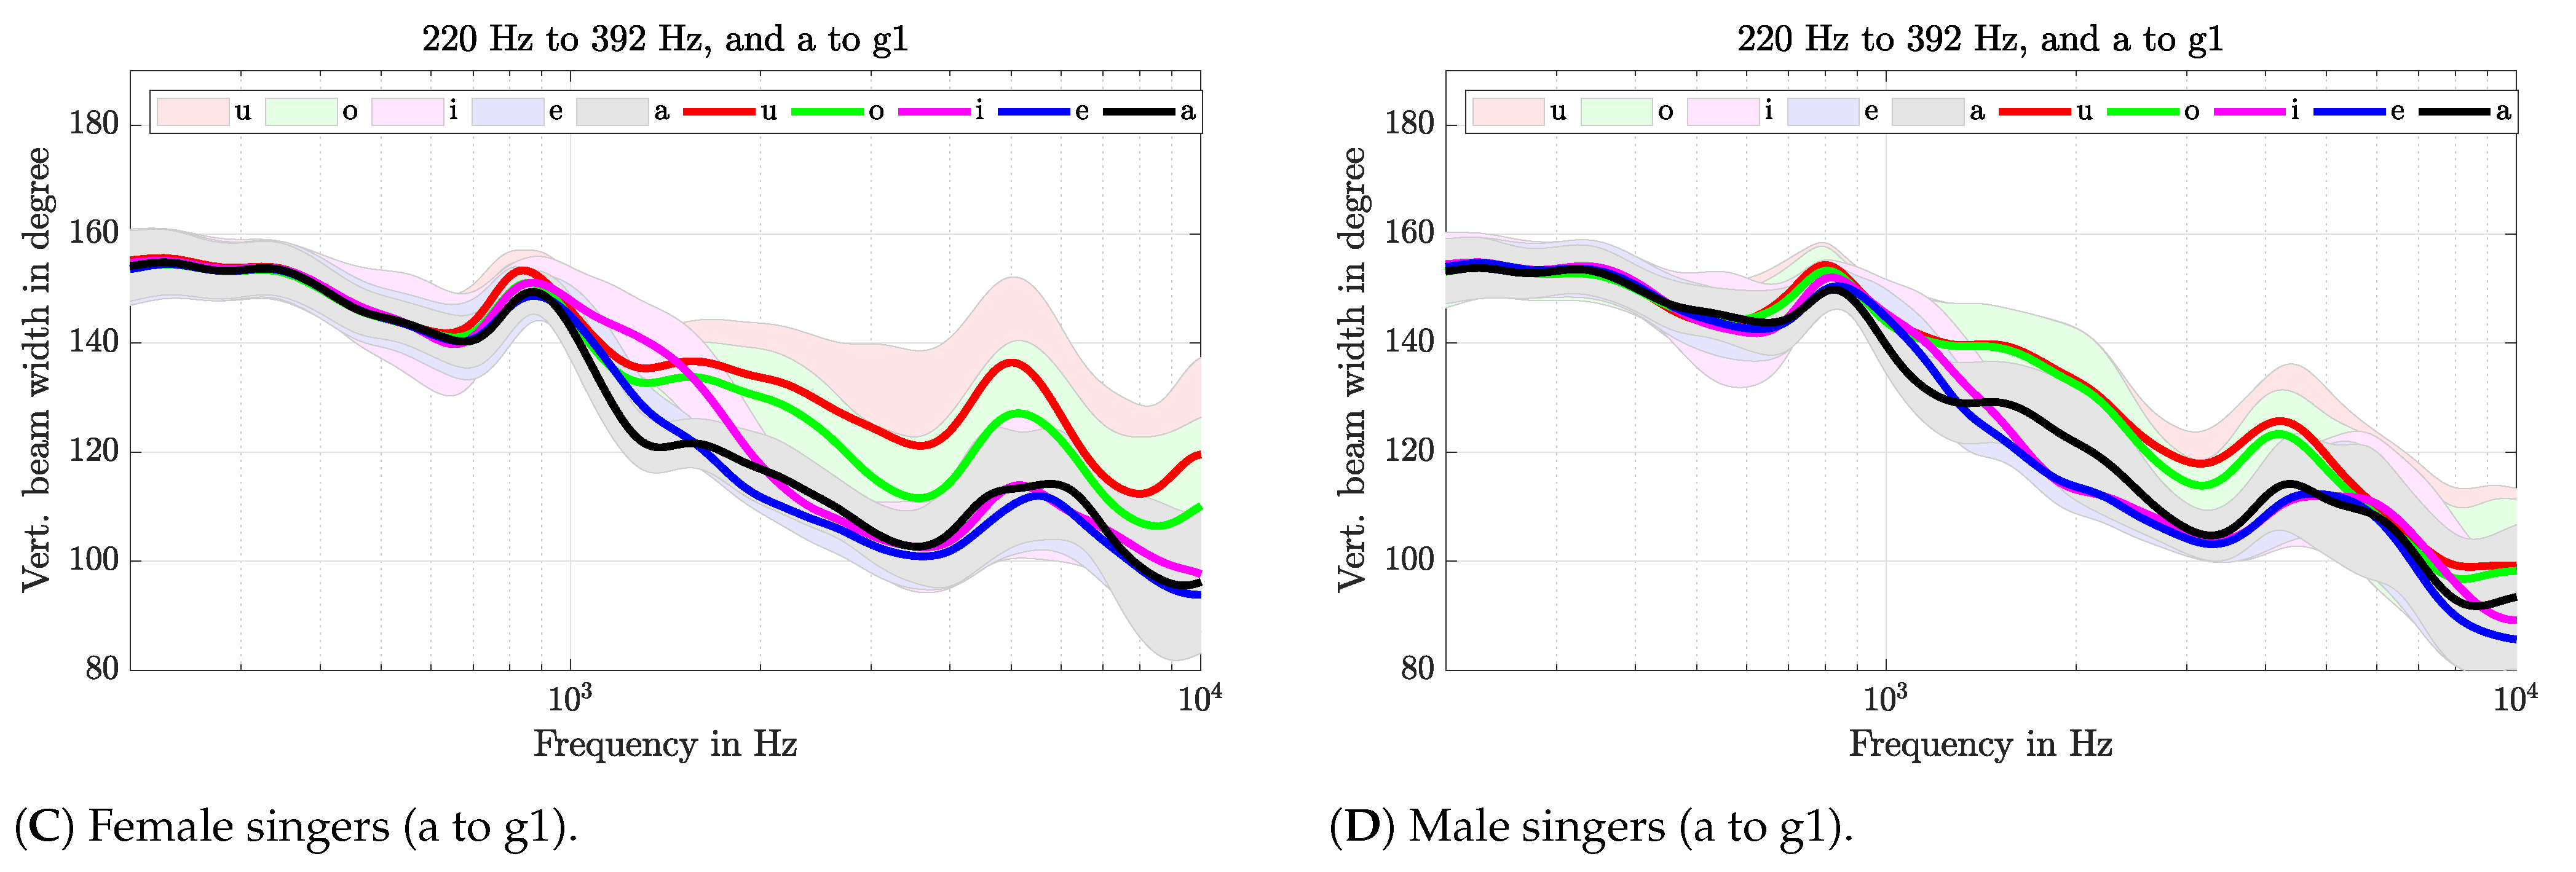
3.3. Beam Width and Directivity Index for Female Singers

In this and the next section, we present detailed results for our simplified metrics calculated from levels extracted from frequency domain data only at the harmonics. A short discussion on the trade-off between calculation methods of simplified metrics can be found in Section 2.7. Figure 8 shows the means, medians, and IQRs (inter-quartile ranges) of the beam width in the horizontal and vertical plane. The data presents the vowel sequence /a:/, /e:/, /i:/, /o:/, and /u:/ over all pitches sung by the female singers (a/A3/220 Hz to a2/A5/880 Hz). As each vowel is sung in three voice phonation modes, we get a total number of 18 measurements per pitch for the female singers (6 singers, 5 vowels, 3 voice phonation modes). As the data is paired (the singers sung multiple vowels at different phonation modes) and the distributions are not normally distributed (Lilliefors test, p > 0.05), we test the differences by using the Wilcoxon signed rank test [30] and use a Bonferroni-Holm correction [31] to account for the five groups. We underpin our findings by using the biserial correlation coefficient [32,33] (effect size) to measure the practical significance, whereas detailed results are provided in Table A1 for the horizontal and vertical beam width (As a general rule of thumb effect sizes are considered for an r = 0.10 as small, r = 0.30 as medium and r ⩾ 0.50 as large effect sizes [34].).
We find differences at a significance level of p < 0.05 for the front vowels /a:/, /e:/, /i:/ and the back vowels /o:/, and /u:/ until pitch d2/D5 for the beam width, except for the pair /i:/ and /o:/ (biserial correlation coefficient of 0.6 in both planes). In the horizontal and vertical plane, the beam width decreases over pitch (cf. Figure 8A,B). This can be explained by the fact, that with increasing pitch the overall human voice directivity is sampled differently by the harmonics (cf. Figure 3). Interestingly, the decrease ends at about d2/D5 and indicates a migration of all vowels towards a similar directivity at high pitch. Most striking in the figures is the decrease of the horizontal beam widths at higher pitch. These results are likely to be related to two factors, namely (i) a reduction of the mouth width and more focus on lowering of the jaw of the singers at high pitch and (ii) a more downward focused voice at higher pitch, which has already been discussed in [15]. In contrast, the vertical beam width increases steadily with increasing pitch. Closer inspection of the figures shows that, depending on the pitch, different front vowels are most directional. This result supports the various findings from previous studies about which vowel is most directional.
Figure 9 shows the voice directivity analyzed by the directivity index metric in the horizontal and vertical plane. We find differences (p < 0.05) for the front vowels and the back vowels below pitch c2/C5/523 Hz (see detailed results in Table A2). In general, the directivity index of the different vowels becomes similar towards higher pitch and tends to decrease for pitches higher than d2/D5/587 Hz with a stronger decrease in the vertical plane above f2/F5/698 Hz (cf. Figure 9A,B). The general trend of the directivity index in both planes is very similar to the beam width, increasing towards higher pitch, and then decreasing slightly above d2/D5/587 Hz. The data for the directivity index show less statistical and practical significance at higher pitches between vowels (cf. Table A2) compared to the beam width metric.

3.4. Beam Width and Directivity Index for Male Singers

Figure 10 shows the means, medians, and IQRs of the beam width in the horizontal and vertical plane for the male singers. The presented data include all four male singers for the pitch range H/B2/123 Hz to e1/E4/330 Hz and include the three tenors up to a1/A4/440 Hz. Again, each vowel is sung in three voice phonation modes, giving us a total number of 12 measurements per pitch up to e1/E4/330 Hz and 9 measurements per pitch above. Again, the distributions for the male singers are not normally distributed (Lilliefors test, p > 0.05) and the data is paired. Therefore, we test the differences with the Wilcoxon signed rank test and use a Bonferroni-Holm correction. The biserial correlation coefficient in detail is shown in Table A3.
We find differences at a significance level of (p < 0.05) for the beam width of the front vowels /a:/, /e:/, /i:/ and the back vowels /o:/, and /u:/ for the horizontal and vertical beam width above pitch d1/D4/294 Hz (cf. Table A3). Similar as for the female singers, a steady decrease for all the vowels is shown with increasing pitch (cf. Figure 10A). This decrease ends in the horizontal plane around d1/D4/294 Hz and remains around the same level for higher pitches in contrast to the slight decrease for the female singers (cf. Figure A1). In the horizontal plane, the beam width of the front vowels at a1/A4/220 Hz (lowest pitch of the female singers) are about 100 to 120 and therefore a magnitude of 20 lower than for the female singers. This may be related to the larger mouth openings used by the male singers, which has been discussed in Section 3.2. In the vertical plane, the beam width of the front vowels decrease more steadily with increasing pitch compared to the results shown in the horizontal plane (cf. Figure 10B). This indicates a more prominent vertical mouth opening for the male singers with increasing pitch. Nevertheless, the results in Figure 3 in Section 3.1 show a difference between gender below 1 kHz, suggesting that this also has an effect on the metric and is a cause of the more even decrease in beam width for the male singers.
Furthermore, we find differences at a significance level of (p < 0.05) for the front vowels /a:, e:, i:/ and the back vowels /o:, u:/ up to pitch c1/C4/262 Hz for the horizontal and vertical directivity index (cf. Figure 11 and Table A4). Again, the statistical results attest the directivity index almost the same quality to distinguish between front and back vowels as the beam width metric.

3.5. Voice Directivity Characteristics and Phonation Mode

To investigate whether voice directivity characteristics are affected by phonation modes, we present results for the beam width for the female and male singers analyzed by their medians and IQRs over all pitches for each vowel and phonation mode (see Figure 12). The means of the medians of the female group for the horizontal plane in Figure 12A lie at 107 for the front vowels and at 118 for the back vowels. In the vertical plane, the beam width is slightly lower (101 for front vowels, 110 for back vowels) for all vowels (Figure 12C) with a trend to decrease from breathy to pressed phonation mode. This effect is larger when evaluated only at higher pitches, which can be also seen in the tracking data. Higher variance is shown for the back vowels /o:, u:/ and slightly higher for breathy compared to the other phonation modes. This can be explained by a tendency of the singers to prefer larger mouth openings for the back vowels over intelligible articulation. The medians for the male group are smaller for the vowels /e:, i:/ and higher for the vowels /a:, o:, u:/ compared to the female singers as shown in Figure 12B. Phonation modes for the male singers reveal no clear difference or trend for the beam width in the vertical plane (cf. Figure 12D), but overall show higher variances compared to the female singers.
The averaged metrics over pitch indicate a slightly trend of increased mouth openings from breathy to pressed. This is also linked to an increased effort at the vocal folds (breathy, modal, pressed) which could be noticed in the audio and during the recording session. Furthermore, the general difference between front /a:, e:, i:/ and back vowels /o:, u:/ can be made visible by the metrics. Most striking is the result for the male group of lower beam widths in the horizontal plane for the vowel /e:, i:/ indicating broader mouth openings for the male singers than the female singers. However, the generalisability of this result seems to be rather limited due to the small sample size.

4. Conclusions

The present study investigates voice directivity in classical singing and its dependence on vowel, pitch, and gender (vocal range). In general, we exhibit higher directivity for classical singers when compared to voice directivity in speech. The current data show that mouth opening increases for classical singers of different vocal ranges (gender) and that this is also linked to pitch. We found subtle differences between the female and male singers (vocal ranges) at lower frequencies from 650 Hz to 1 kHz and minor differences at higher frequencies. The differences at higher frequencies can be explained by the different used mouth openings within the respective vocal range (larger for male singers), whereas at lower frequencies the differences are most likely linked to the size of the torso. The simplified metrics calculated from frequency data showed the capability of separating the front vowels /a:, e:, i:/ and the back vowels /o:, u:/, which was underpinned with a statistical analysis. Nevertheless, the discrimination between vowels is limited due to pitch dependence and at higher pitch due to a vowel migration of classical singing, which has been discussed in literature on vowel intelligibility [35,36]. This and the high variability in the data limits the applicability of simplified metrics for vowel identification in performance analysis, however the results give valuable insight on singing voice directivity. The voice directivity characteristics indicate a minor trend of increased voice directivity for the singers from breathy to pressed phonation mode. The current results show that the singing voice directivity is strongly influenced by the following components: mouth opening, singers morphology, pitch (spectral composition) and its interpretation also depends on the chosen method of analysis.

Author Contributions

Conceptualization, M.B. and M.F.; methodology, M.B. and M.F.; validation, M.B. and M.F.; formal analysis, M.B., M.F. and A.S.; investigation, M.B. and M.F.; data curation, M.B; writing—original draft preparation, M.B.; writing—review and editing, M.B.; visualization, M.B.; supervision, M.F. and A.S. All authors have read and agreed to the published version of the manuscript.

Funding

This research received no external funding.

Institutional Review Board Statement

The study was conducted in accordance with the Declaration of Helsinki, and approved by the Ethics Committee of University of Music and Performing Arts, Graz.

Informed Consent Statement

Informed consent was obtained from all subjects involved in the study. Singers were payed an expense allowance.

Data Availability Statement

Data is available under https://phaidra.kug.ac.at/o:127031, accessed on 26 September 2022.

Acknowledgments

Special thanks to Thomas Musil for his work on the pd patch for the enhanced measurement system and to Stefan Warum for the help designing the DCMA.

Conflicts of Interest

The authors declare no conflict of interest.

Abbreviations

The following abbreviations are used in this manuscript:
HDIHorizontal directivity index
VDIVertical directivity index
IQRInter-quartile range
DCMADouble circle microphone array
LTASLong-term averaged spectra
pdPure Data
r E Energy vector

Appendix A

In addition to the results for the directivity metrics in Section 3.1, we present the corresponding results for the introduced beam width metric in Figure A1. Furthermore, we present the biserial correlation coefficients (effect size) for the vowel pairs for each plane for the beam width and directivity index for each pitch in Table A1, Table A2, Table A3 and Table A4.
Table A1. Biserial correlation coefficients for the horizontal and vertical beamwidths at each pitch for the female singers (samples n = 18). Horizontal and vertical biserial correlation coefficients are listed at the top and bottom in each cell. Bold letters indicate that there is a significant difference (p > 0.05) between the vowel groups listed in the first and second column.
v1v2ahc1d1e1f1g1a1h1c2d2e2f2g2a2
ae0.9
0.9
0.9
0.8
0.7
0.5
0.6
0.4
0.5
0.4
0.4
0.1
0
0.5
0.1
1
0.8
0.5
0.9
0.2
0.8
0.6
0.2
0.1
0.3
0
0.1
0.2
0.4
0.5
ai0.4
0.1
0.6
0.2
0.5
0
0.3
0.1
0.9
0.1
0.3
0.6
0.7
0.5
0.7
0
0.7
0.4
0.6
0.5
0.3
0.1
0.1
0.3
0.1
0.1
0.4
0.4
0.3
0.8
ao1
1
1
1
0.9
1
0.9
1
0.9
1
0.9
1
0.9
1
0.8
0.8
0.4
0.9
0.6
0.9
0.7
0.9
0.4
0.8
0.1
0.3
0.5
0.5
0.3
0.7
au1
1
1
1
1
1
1
1
1
1
1
1
1
1
1
1
0.9
1
0.8
1
0.9
1
0.7
1
0.2
0.5
0.4
0.5
0.2
0.8
ei0.9
1
0.4
0.9
0.3
0.9
0.2
0.3
0.5
0.1
0.1
0.8
0.6
0.9
0.6
0.6
0.2
0.7
0
0.5
0.4
0.6
0.3
0.5
0.1
0.1
0.4
0.2
0.1
0.3
eo1
1
1
1
1
1
1
1
0.9
1
0.9
1
0.7
1
0.8
1
0.8
0.9
1
1
0.9
1
0.6
0.9
0.3
0.4
0.3
0.4
0.3
0.2
eu1
1
1
1
1
1
1
1
1
1
1
1
1
1
1
1
1
1
1
1
1
1
0.6
0.9
0.1
0.5
0.4
0.4
0.3
0.3
io1
1
1
1
1
1
1
1
1
1
1
1
1
0.9
1
1
0.7
0.7
0.9
0.6
0.6
0.6
0.4
0.7
0.2
0.3
0.5
0.3
0.2
0
iu1
1
1
1
1
1
1
1
1
1
1
1
1
1
1
1
1
1
1
1
0.8
1
0.4
0.8
0
0.6
0.5
0.3
0
0.2
ou1
1
1
0.9
0.9
0.9
0.9
1
0.9
0.9
0.9
0.9
0.8
1
0.8
0.9
0.6
1
0.4
0.9
0.6
0.9
0.1
0.1
0.1
0.6
0.1
0.2
0.1
0.4
Figure A1. Mean and standard deviation for the horizontal and vertical beam width in degree averaged over pitch for the female singers and male singers for all five vowels and all phonation modes.
Acoustics 04 00051 g0a1aAcoustics 04 00051 g0a1b
Table A2. Biserial correlation coefficients for the horizontal and vertical directivity indexes at each pitch for the female singers (samples n = 18). Horizontal and vertical biserial correlation coefficients are listed at the top and bottom in each cell. Bold letters indicate that there is a significant difference (p > 0.05) between the vowel groups listed in the first and second column.
v1v2ahc1d1e1f1g1a1h1c2d2e2f2g2a2
ae0.3
0.1
0.1
0.4
0.2
0.2
0.1
0.1
0.3
0.3
0.6
0.3
0.3
0.2
0.5
0
0.3
0.7
0.1
0.6
0.1
0.6
0.6
0.2
0.7
0.6
0.2
0.1
0.6
0.1
ai0.2
0.6
0.2
0.2
0
0.2
0
0.2
0.3
0.4
0.1
0.3
0.3
0.6
0
0.2
0.1
0.3
0.1
0.5
0.5
0.4
0.7
0.2
0.6
0.3
0.3
0.1
0.6
0.1
ao1
0.9
0.9
1
1
1
0.9
0.9
0.5
0.5
0.9
0.8
0.9
0.6
0.9
0.7
0.9
0.7
0.9
0.4
1
0.5
0.7
0.3
0.4
0.4
0.5
0.3
0.4
0.1
au1
1
1
1
1
0.9
1
1
0.6
0.6
1
1
1
1
1
1
1
0.5
1
0.6
1
0.9
0.8
0.4
0.8
0.1
0.1
0
0.2
0.2
ei0.7
0.9
0.2
0.8
0.1
0.5
0.2
0.1
0.5
0.4
0.6
0.7
0.5
0.7
0.5
0.6
0.1
0.1
0.1
0.3
0.5
0.7
0.7
0.2
0.1
0.2
0.4
0.2
0.2
0.1
eo1
1
1
0.9
1
0.9
1
0.8
0.3
0.4
0.5
0.7
0.4
0.7
0.5
0.7
0.8
0.9
0.9
0.8
1
0.8
0.1
0.3
0.7
0.7
0.6
0.4
0.3
0
eu1
1
1
1
1
1
1
1
0.5
0.6
1
1
0.9
1
1
1
1
1
1
0.9
1
0.9
0.3
0
0.4
0.5
0.4
0.1
0.4
0.1
io1
1
1
0.8
1
0.8
0.9
0.8
0.6
0.2
1
0.5
0.9
0.1
0.9
0.1
0.8
0.6
0.9
0.8
0.2
0.1
0.2
0.2
0.7
0.7
0.6
0.3
0.4
0
iu1
1
1
1
1
1
1
1
0.6
0.5
1
1
1
0.8
1
0.9
0.9
0.8
1
0.9
0.5
0.6
0.1
0.1
0.3
0.3
0.4
0
0.4
0.3
ou0.9
0.8
0.9
0.9
0.8
0.3
0.8
0.5
0.4
0.4
0.9
0.6
0.9
0.9
0.8
0.6
0.2
0.3
0.8
0.3
0.5
0.2
0.3
0.4
0.7
0.6
0.3
0.2
0.2
0.5
Table A3. Biserial correlation coefficients for the horizontal and vertical beamwidths at each pitch for the male singers (samples nH–e1 = 12, samples nf1–a1 = 9). Horizontal and vertical biserial correlation coefficients are listed at the top and bottom in each cell. Bold letters indicate that there is a significant difference (p > 0.05) between the vowel groups listed in the first and second column.
v1v2Hcdefgahc1d1e1f1g1a1
ae0.8
1
0.7
0.6
0.8
1
0.9
1
1
1
0.8
1
1
0.8
0.8
1
0.6
1
0.8
1
0.7
1
0.4
0.6
0.5
0.5
0.3
0.4
ai0.7
0.9
0.4
0.2
0.5
0.7
0.5
0.3
0.6
0.8
0.2
0.4
0.5
0.6
0.3
0.7
0.3
1
0.7
1
0.8
1
0.6
0.6
0.5
0.4
0.2
0.3
ao1
0.6
1
0.9
1
0.6
1
0.5
0.9
0.4
1
0.7
1
0.5
0.9
0.4
0.9
0.3
0.8
0.2
0.6
0.1
0.1
0.2
0.2
0.4
0
0.4
au1
0.8
1
0.8
1
0.7
1
0.9
0.9
0.7
1
0.7
1
0.4
0.9
0.4
0.9
0
0.8
0.4
0.5
0.1
0
0.3
0
0.3
0.3
0.1
ei0.9
0.9
0.6
0.2
0.6
0.5
0.6
0.8
0.5
0.8
0.7
0.7
0.8
0.7
0.5
0.9
0.4
0.7
0.5
0.5
0.2
0.8
0.2
0.2
0.1
0
0.2
0.1
eo1
1
1
1
1
1
1
1
1
1
1
1
1
1
1
0.9
1
1
1
1
1
1
0.6
0.5
0.4
0.4
0.3
0.1
eu1
1
1
1
1
1
1
1
1
1
1
1
1
1
1
0.9
1
0.7
1
1
1
1
0.6
0.4
0.6
0.4
0.4
0.2
io1
1
1
1
1
1
1
0.5
1
0.8
1
0.9
1
0.7
0.9
0.6
0.9
0.8
0.9
0.8
1
0.7
0.6
0.5
0.6
0.3
0.2
0.2
iu1
1
1
0.9
1
1
1
1
1
1
1
0.9
1
0.7
1
0.5
0.8
0.4
1
0.9
1
0.9
0.6
0.3
0.6
0.5
0.4
0.1
ou0.5
0.6
0.8
0.4
0.7
0.4
0.7
0.7
0.8
0.7
0.1
0
0.8
0
0.5
0
0.2
0
0.3
0.5
0.3
0.1
0
0.1
0.4
0
0.4
0.2
Table A4. Biserial correlation coefficients for the horizontal and vertical directivity indexes at each pitch for the male singers (samples nH–e1 = 12, samples nf1–a1 = 9). Horizontal and vertical biserial correlation coefficients are listed at the top and bottom in each cell. Bold letters indicate that there is a significant difference (p > 0.05) between the vowel groups listed in the first and second column.
v1v2Hcdefgahc1d1e1f1g1a1
ae1
0.9
1
0.8
0.9
0.6
1
0.9
1
0.7
1
0.8
1
0.7
1
0.8
1
0.7
1
0.6
0.9
0.8
0.6
0.3
0.6
0.4
0.6
0.1
ai0.8
0.8
0.3
0.4
0.5
0.1
0.4
0.2
0.6
0.6
0.5
0.3
0.6
0.4
0.8
0.2
0.9
0.6
1
0.4
0.9
0.4
0.6
0.2
0.6
0.1
0.6
0.2
ao1
1
1
1
1
1
1
1
1
1
1
1
0.9
0.9
0.5
0.9
0.3
0.8
0.4
0.8
0.4
0.6
0.3
0.1
0.4
0.1
0.2
0.2
au1
1
1
1
1
1
1
1
1
1
1
1
1
1
0.8
0.9
0.5
0.8
0.2
0.6
0.2
0.6
0.3
0.1
0.4
0.1
0.1
0.5
ei0.9
0.8
0.9
0.9
0.8
0.7
0.8
0.9
0.8
0.8
0.6
0.8
0.7
0.5
0.5
0.6
0.4
0.3
0.1
0.6
0
0.7
0.3
0.3
0.1
0.6
0
0.4
eo1
1
1
1
1
1
1
1
1
1
1
1
1
1
1
1
1
1
1
1
1
1
0.6
0.5
0.5
0.4
0.3
0.3
eu1
1
1
1
1
1
1
1
1
1
1
1
1
1
1
1
1
1
1
1
1
1
0.5
0.5
0.5
0.4
0.3
0.4
io1
1
1
1
1
1
0.9
1
0.9
1
1
1
0.9
0.9
0.9
1
1
0.9
1
0.9
1
1
0.6
0.2
0.5
0.3
0.2
0.1
iu1
1
1
1
1
1
1
1
1
1
1
1
1
1
1
1
1
0.9
1
0.9
1
1
0.6
0.3
0.5
0.2
0.3
0.3
ou0.9
1
0.9
0.8
0.9
0.8
0.7
0.6
0.8
0.8
0.4
0.6
0.6
0.7
0.7
0.3
0.3
0.2
0.2
0
0.2
0.3
0.2
0.4
0.1
0.1
0.2
0.6

References

  1. Flanagan, J.L. Analog Measurements of Sound Radiation from the Mouth. J. Acoust. Soc. Am. 1960, 32, 1613–1620. [Google Scholar] [CrossRef]
  2. Huopaniemi, J.; Kettunen, K.; Rahkonen, J. Measurement and modeling techniques for directional sound radiation from the mouth. In Proceedings of the 1999 IEEE Workshop on Applications of Signal Processing to Audio and Acoustics, WASPAA’99 (Cat. No.99TH8452), New Paltz, NY, USA, 20–20 October 1999; pp. 183–186. [Google Scholar]
  3. Halkosaari, T.; Vaalgamaa, M.; Karjalainen, M. Directivity of Artificial and Human Speech. J. Audio Eng. Soc. 2005, 53, 620–631. [Google Scholar]
  4. Chu, W.T.; Warnock, A.C. Detailed Directivity of Sound Fields Around Human Talkers; Technical report-NRC-CNRC Publications Archive; National Research Council Canada: Ottawa, ON, Canada, 2002.
  5. Monson, B.B.; Hunter, E.J.; Story, B.H. Horizontal directivity of low- and high-frequency energy in speech and singing. J. Acoust. Soc. Am. 2012, 132, 433–441. [Google Scholar] [CrossRef] [PubMed] [Green Version]
  6. Kocon, P.; Monson, B.B. Horizontal directivity patterns differ between vowels extracted from running speech. J. Acoust. Soc. Am. 2018, 144, EL7–EL12. [Google Scholar] [CrossRef] [Green Version]
  7. Pörschmann, C.; Arend, J.M. Investigating phoneme-dependencies of spherical voice directivity patterns. J. Acoust. Soc. Am. 2021, 149, 4553–4564. [Google Scholar] [CrossRef]
  8. Marshall, A.H.; Meyer, J. The directivity and auditory impressions of singers. Acta Acust. United Acust. 1985, 58, 130–140. [Google Scholar]
  9. Kob, M.; Jers, H. Directivity measurement of a singer. J. Acoust. Soc. Am. 1999, 105, 1003. [Google Scholar] [CrossRef]
  10. Cabrera, D.; Davis, P.J. Vocal directivity measurements of eight opera singers. In Proceedings of the 18th International Congress on Acoustics, Kyoto, Japan, 4–9 April 2004; pp. 505–506. [Google Scholar]
  11. Katz, B.; D’Alessandro, C. Directivity Measurements of the Singing Voice. In Proceedings of the 19th International Congress on Acoustics, Madrid, Spain, 2–7 September 2007; pp. 45–50. [Google Scholar]
  12. Cabrera, D.; Davis, P.J.; Connolly, A. Long-term horizontal vocal directivity of opera singers: Effects of singing projection and acoustic environment. J. Voice 2011, 25, e291–e303. [Google Scholar] [CrossRef]
  13. Boren, B.B.; Roginska, A. Sound radiation of trained vocalizers. Proc. Meet. Acoust. 2013, 19, 035025. [Google Scholar]
  14. Blandin, R.; Brandner, M. Influence of the vocal tract on voice directivity. In Proceedings of the 2019 23rd International Congress on Acoustics—ICA, Aachen, Germany, 9–13 September 2019; Deutsche Gesellschaft für Akustik e.V.: Berlin, Germany, 2019; pp. 1795–1801. [Google Scholar]
  15. Brandner, M.; Blandin, R.; Frank, M.; Sontacchi, A. A pilot study on the influence of mouth configuration and torso on singing voice directivity. J. Acoust. Soc. Am. 2020, 148, 1169–1180. [Google Scholar] [CrossRef]
  16. Molloy, C.T. Calculation of the Directivity Index for Various Types of Radiators. J. Acoust. Soc. Am. 1948, 20, 387–405. [Google Scholar] [CrossRef]
  17. Tylka, J.G.; Sridhar, R.; Choueiri, E. A database of loudspeaker polar radiation measurements. In Proceedings of the Audio Engineering Society Convention 139, New York, NY, USA, 29 October–1 November 2015. [Google Scholar]
  18. Gerzon, M.A. General metatheory of auditory localisation. In Audio Engineering Society Convention; Audio Engineering Society: New York, NY, USA, 1992. [Google Scholar]
  19. Kadiri, S.R.; Alku, P.; Yegnanarayana, B. Analysis and classification of phonation types in speech and singing voice. Speech Commun. 2020, 118, 33–47. [Google Scholar] [CrossRef]
  20. Zhang, Z. Mechanics of human voice production and control. J. Acoust. Soc. Am. 2016, 140, 2614–2635. [Google Scholar] [CrossRef] [Green Version]
  21. Brandner, M.; Frank, M.; Rudrich, D. DirPat—Database and viewer of 2D/3D directivity patterns of sound sources and receivers. In Proceedings of the Audio Engineering Society Convention 144, Milan, Italy, 23–26 May 2018. [Google Scholar]
  22. Frank, M.; Rudrich, D.; Brandner, M. Augmented practice-room—Augmented acoustics in music education. In Fortschritte der Akustik, DAGA; Deutsche Gesellschaft für Akustik: Berlin, Germany, 2020; pp. 151–154. [Google Scholar]
  23. Klanjscek, N.; David, L.; Frank, M. Evaluation of an e-learning tool for augmented acoustics in music education. Music Sci. 2021, 4, 20592043211037511. [Google Scholar] [CrossRef]
  24. Meyer-Kahlen, N.; Rudrich, D.; Brandner, M.; Wirler, S.; Windtner, S.; Frank, M. Diy modifications for acoustically transparent headphones. In Audio Engineering Society Convention 148; Audio Engineering Society: New York, NY, USA, 2020. [Google Scholar]
  25. Beranek, L.L. Concert hall acoustics—1992. J. Acoust. Soc. Am. 1992, 92, 1–39. [Google Scholar] [CrossRef]
  26. Skålevik, M. Reverberation Time—The mother of all room acoustic parameters. In Proceedings of the 20th International Congress on Acoustic, ICA, Sydney, Australia, 23–27 August 2010; Volume 10. [Google Scholar]
  27. Welch, P.D. The use of fast Fourier transform for the estimation of power spectra: A method based on time averaging over short, modified periodograms. IEEE Trans. Audio Electroacoust. 1967, 15, 70–73. [Google Scholar] [CrossRef] [Green Version]
  28. Zotter, F. Analysis and Synthesis of Sound-Radiation with Spherical Arrays. Ph.D. Thesis, University of Music and Performing Arts, Institute of Electronic Music and Acoustics, Graz, Austria, 2009. [Google Scholar]
  29. Barber, C.B.; Dobkin, D.P.; Huhdanpaa, H. The quickhull algorithm for convex hulls. ACM Trans. Math. Softw. 1996, 22, 469–483. [Google Scholar] [CrossRef] [Green Version]
  30. Wilcoxon, F. Individual comparisons by ranking methods. Biometrics 1945, 1, 196–202. [Google Scholar]
  31. Holm, S. A simple sequentially rejective multiple test procedure. Scand. J. Stat. 1979, 6, 65–70. [Google Scholar]
  32. Glass, G.V. Note on rank biserial correlation. Educ. Psychol. Meas. 1966, 26, 623–631. [Google Scholar] [CrossRef]
  33. Kerby, D.S. The Simple Difference Formula: An Approach to Teaching Nonparametric Correlation. Compr. Psychol. 2014, 3, 11-IT. [Google Scholar] [CrossRef]
  34. Cohen, J. Statistical Power Analysis for the Behavioral Sciences, 2nd ed.; Routledge: New York, NY, USA, 1988. [Google Scholar]
  35. Gregg, J.W.; Scherer, R.C. Vowel intelligibility in classical singing. J. Voice Off. J. Voice Found. 2006, 20, 198–210. [Google Scholar] [CrossRef] [PubMed]
  36. Ophaug, W. The diminished vowel space in classical singing and the tug of war between "speech-true" and modified vowel qualities. J. Sing. 2017, 73, 293–303. [Google Scholar]
Figure 1. (Left): Top view on the microphone array (horizontal plane). (Right): Side view on the microphone array (vertical plane). The singer is seated on a chair of adjustable height. Microphone positions and angular spacing are indicated.
Acoustics 04 00051 g001
Figure 2. Schematic of the energy vector and its corresponding source angle θ s and source width θ w .
Acoustics 04 00051 g002
Figure 3. Mean and standard deviation for the horizontal and vertical directivity index in dB averaged over pitch (a/A3/220 Hz to g1/G4/392 Hz) for the female singers (A,C) and male singers (B,D) for all five vowels and all phonation modes.
Acoustics 04 00051 g003
Figure 4. Directivity patterns for female and male singers in the horizontal and vertical plane at low (a/A3/220 Hz) and high (a1/A4/440 Hz) pitch for all five vowels of high-passed signals (1 kHz). The multiple lines of the same color represent the results for each singer for a specific vowel. The vowel data is averaged over all phonation modes. (A) Female singers (horizontal, a/A3/220 Hz), (B) Male singers (horizontal, a/A3/220 Hz), (C) Female singers (vertical, a/A3/220 Hz), (D) Male singers (vertical, a/A3/220 Hz), (E) Female singers (horizontal, a1/A4/440 Hz), (F) Male singers (horizontal, a1/A4/440 Hz), (G) Female singers (vertical, a1/A4/440 Hz), (H) Male singers (vertical, pitch a1/A4/440 Hz).
Acoustics 04 00051 g004
Figure 5. Mean effective mouth opening calculated from tracking data for the five vowels from six female singers.
Acoustics 04 00051 g005
Figure 6. Exemplary mouth openings extracted from video for one male singer for the vowels /a:/, /e:/, /i:/, /o:/, /u:/ (left to right) at c/C3/131 Hz in the top row and a2/A4/440 Hz in the bottom row.
Acoustics 04 00051 g006
Figure 7. Exemplary mouth openings extracted from video for one female singer for the vowels /a:/, /e:/, /i:/, /o:/, /u:/ (left to right) at a1/A4/440 Hz in the top row and a2/A5/880 Hz in the bottom row.
Acoustics 04 00051 g007
Figure 8. Means (diamonds), medians (dots), IQRs (whiskers) of the horizontal and vertical beam width in degree over pitch for the female singers for the five vowels and all phonation modes.
Acoustics 04 00051 g008
Figure 9. Means (diamonds), medians (dots), IQRs (whiskers) of the horizontal and vertical directivity index in dB over pitch for the female singers for the five vowels and all phonation modes.
Acoustics 04 00051 g009
Figure 10. Means (diamonds), medians (dots), IQRs (whiskers) of the horizontal and vertical beam width in degree over pitch for the male singers for the five vowels and all phonation modes.
Acoustics 04 00051 g010
Figure 11. Means (diamonds), medians (dots), IQRs (whiskers) of the horizontal and vertical directivity index in dB over pitch for the male singers for the five vowels and all phonation modes.
Acoustics 04 00051 g011
Figure 12. Medians and inter-quartile ranges for the beam width over all pitches in the horizontal (A,B) and vertical (C,D) plane for each vowel and phonation mode for the female and male singers.
Acoustics 04 00051 g012
Publisher’s Note: MDPI stays neutral with regard to jurisdictional claims in published maps and institutional affiliations.

