Article

Sideband Peak Count in a Vibro-Acoustic Modulation Method for Crack Detection

Department of Civil, Environmental & Ocean Engineering, Stevens Institute of Technology, Hoboken, NJ 07030, USA
*
Author to whom correspondence should be addressed.
Acoustics 2022, 4(1), 74-86; https://doi.org/10.3390/acoustics4010005
Submission received: 16 December 2021 / Revised: 16 January 2022 / Accepted: 19 January 2022 / Published: 24 January 2022
(This article belongs to the Special Issue Elastic Wave Scattering in Heterogeneous Media)

Abstract

:
This paper presents a new method of signal processing for vibro-acoustic modulation (VAM) methods in order to detect damage accumulation in steel samples. Damage in the tested samples was produced by cycle loading, which, with a small amplitude, was used as a pump wave to modulate an ultrasonic probe wave. Multiple sideband peaks were observed, which were used to characterize the modulation effect. We propose the effectiveness sideband peak number (SPN) method as an indicator of any damage accumulation when the load cycle is applied. Moreover, after comparing the SPN with the previously used modulation index (MI), we concluded that, for some of the samples, the SPN provided better damage indication than the MI. The presented results can be explained by a simple model of bilinear crack nonlinearity. This model demonstrates that the amplitude dependences of the sideband components on the pump and the probe wave amplitudes are very different from the quadratic crack model that is usually used for MI test explanation.

1. Introduction

In many nondestructive evaluation (NDE) methods, nonlinear acoustics (NA) has a higher sensitivity for crack detection than linear acoustic methods. Several thousand publications describe various modifications of these approaches. Examples of current publications that discuss NA NDE techniques are listed in [1,2,3,4,5,6,7,8].
Among the numerous NA approaches, one of the most investigated is the vibro-acoustic modulation (VAM) technique that is also referred to as nonlinear wave modulation spectroscopy and dynamic acoustic–elastic testing (DAET) [9]. This method is based on the modulation of high-frequency probe acoustic waves by low-frequency vibration pump waves. One explanation of this modulation is that a low-frequency wave changes the sound speed in the tested material, leading to a change in the amplitude and phase modulation of the probe wave. This phenomenon of sound speed change in a solid material under applied pressure is called acoustoelasticity. The first paper on this subject was published in 1958 [10]. Toupin and Bernstein later presented the theory of this effect on solid material [11].
The two kinds of approaches to VAM differ by way of low-frequency vibration generation. The first approach is that vibrations are excited by harmonic sources. The first paper on this matter was [12], while one of the newest papers is [13]. The other sources of harmonic vibration excitation are piezoceramic transducers [14,15], speakers [16,17], lasers [18], and loading machines [19]. The second and simpler VAM approach of low-frequency excitation by applying mechanical impact was first suggested by Korotkov and Sutin [20] (see also [21,22,23]). This impact excitation does not require additional equipment and can avoid additional nonlinearity produced by contact between low-frequency sources and the tested material. The majority of VAM techniques consider the level of sideband components with sum and difference frequencies as an indicator of nonlinearity. In many publications [24,25,26], the ratio of sideband peaks to the probe wave amplitude is used as a modulation indicator. This approach is based on the assumption of the quadratic type of nonlinearity due to a crack presence.
In many VAM experiments, the generation of multiple sideband components was observed. These sideband components have frequencies f ± n F , where f is the probe frequency, F is the pump frequency, and n is the integer number. Hu et al. [14] demonstrated the generation of multiple sideband peaks in VAM experiments in order to detect fatigue cracks in aluminum. The authors did not count the sideband peaks but used Hilbert–Huang transforms to demodulate the received signal. The generation of multiple sideband peaks in the VAM method was presented in [27]. This paper investigated the VAM application for delamination detection in glass-fiber-reinforced polymer laminates, and sideband peak amplitudes were used as features in a machine learning classification algorithm.
In the work presented here, we investigated multiple sideband peak generation using cycled loads for the damage accumulation and for modulation of the ultrasonic wave, according to how it was made in [19]. As a result, there was an increase in the number of sideband peaks due to damage accumulation, allowing the peak numbers to be utilized as damage indicators. The result was compared with the more commonly used modulation index (MI).
In previously conducted VAM experiments [19,24,25,26,28,29,30,31], the MI was calculated on the basis of first sideband peaks with frequencies f ± F and numerous sideband peaks with n > 1 were not taken into account. The goal of our work is to investigate multiple sideband peak generation and to consider whether these peaks can provide more information about damage accumulation for the same A108 samples that were investigated in [19,29,30].
It is worth mentioning that a slightly different sideband peak count method was used earlier [8,28,32,33]. In this method, the excitation of the samples was conducted with multifrequency signals, and frequency components generated due to crack nonlinearity were counted. These results were explained by the quadratic nonlinearity that is not applicable to our experiments. Instead, the multiple sideband peak generation that we observed can be explained by the simple bilinear model, which predicts the unusual dependence of sideband peaks on the amplitudes of the probe and pump waves.

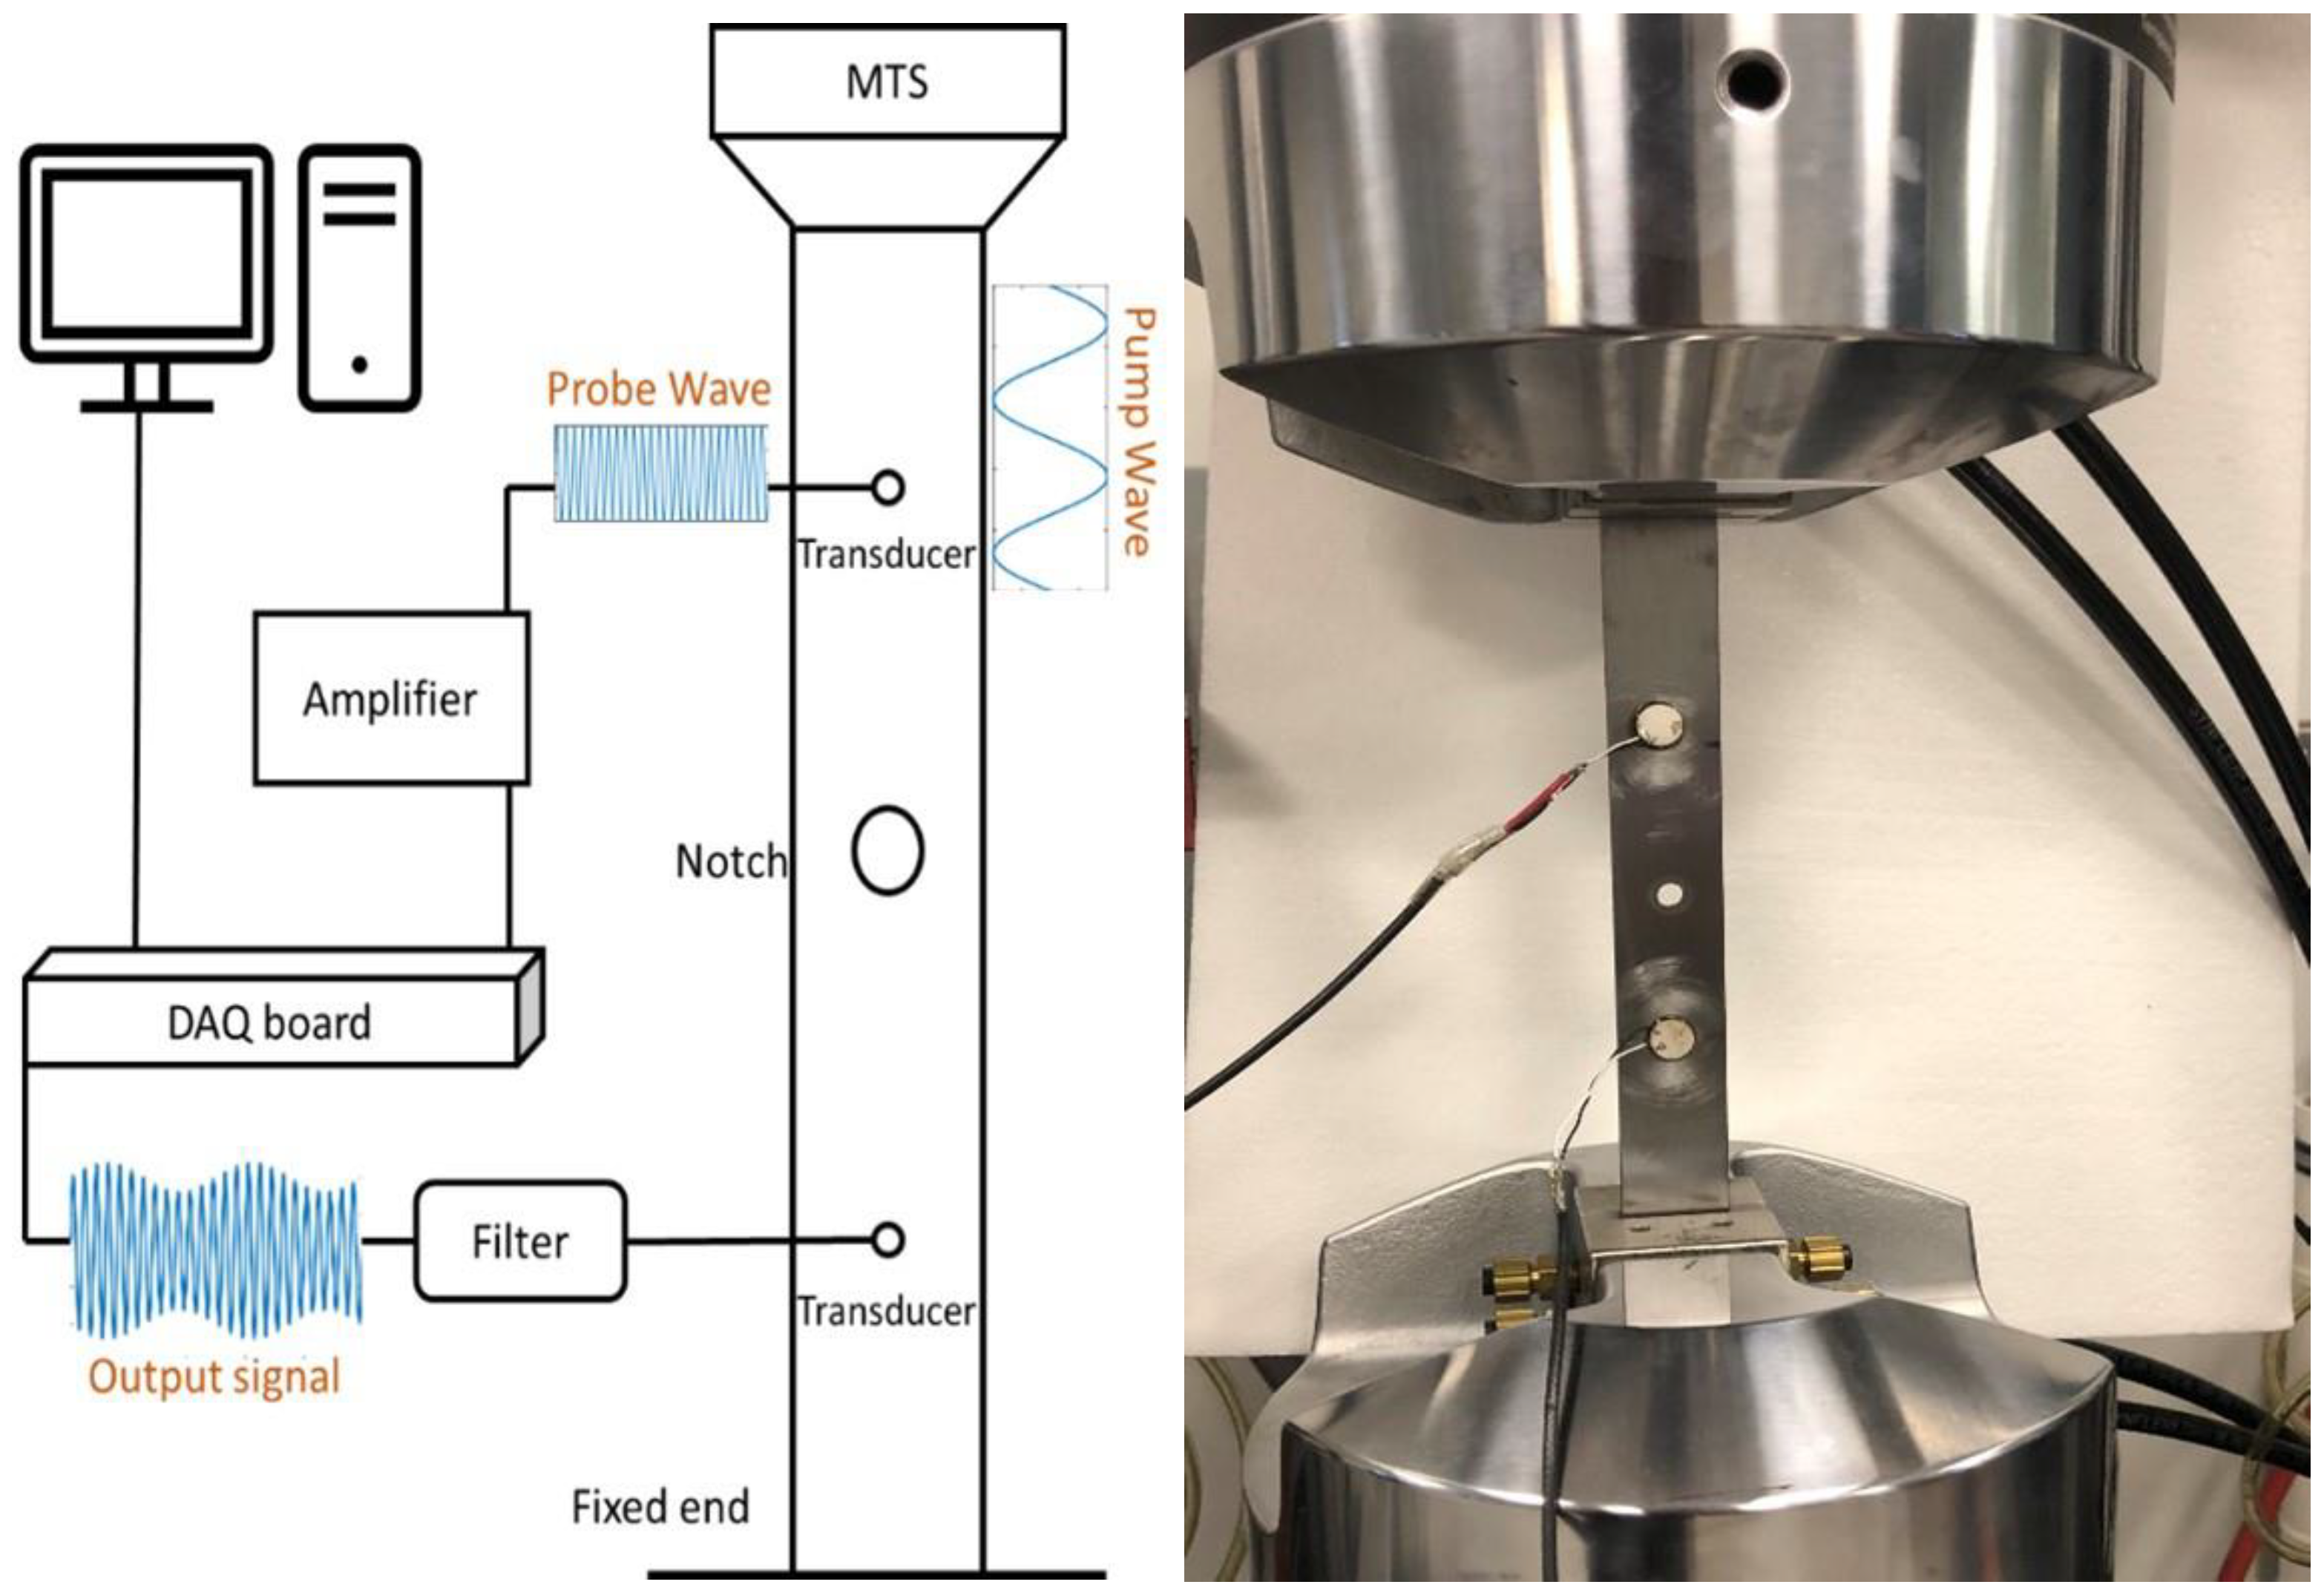
2. Configuration of the Experimental Setup
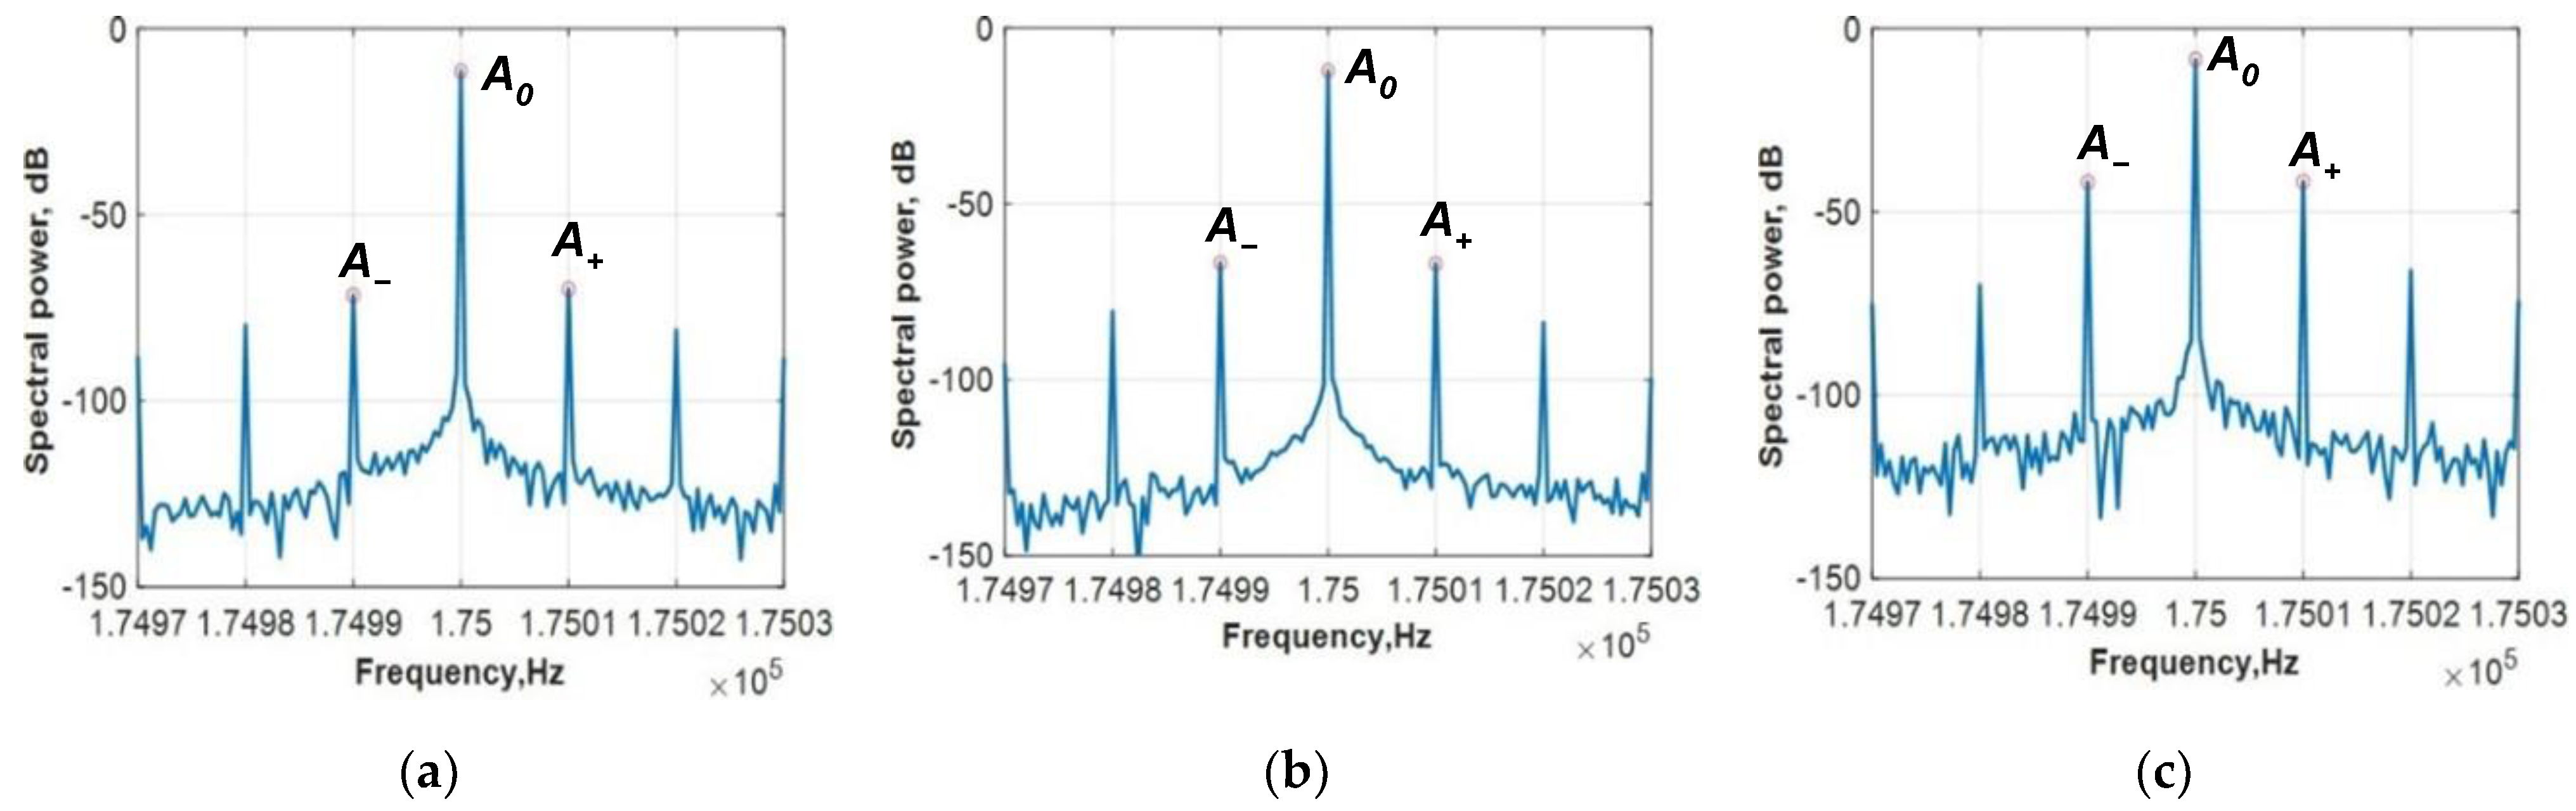
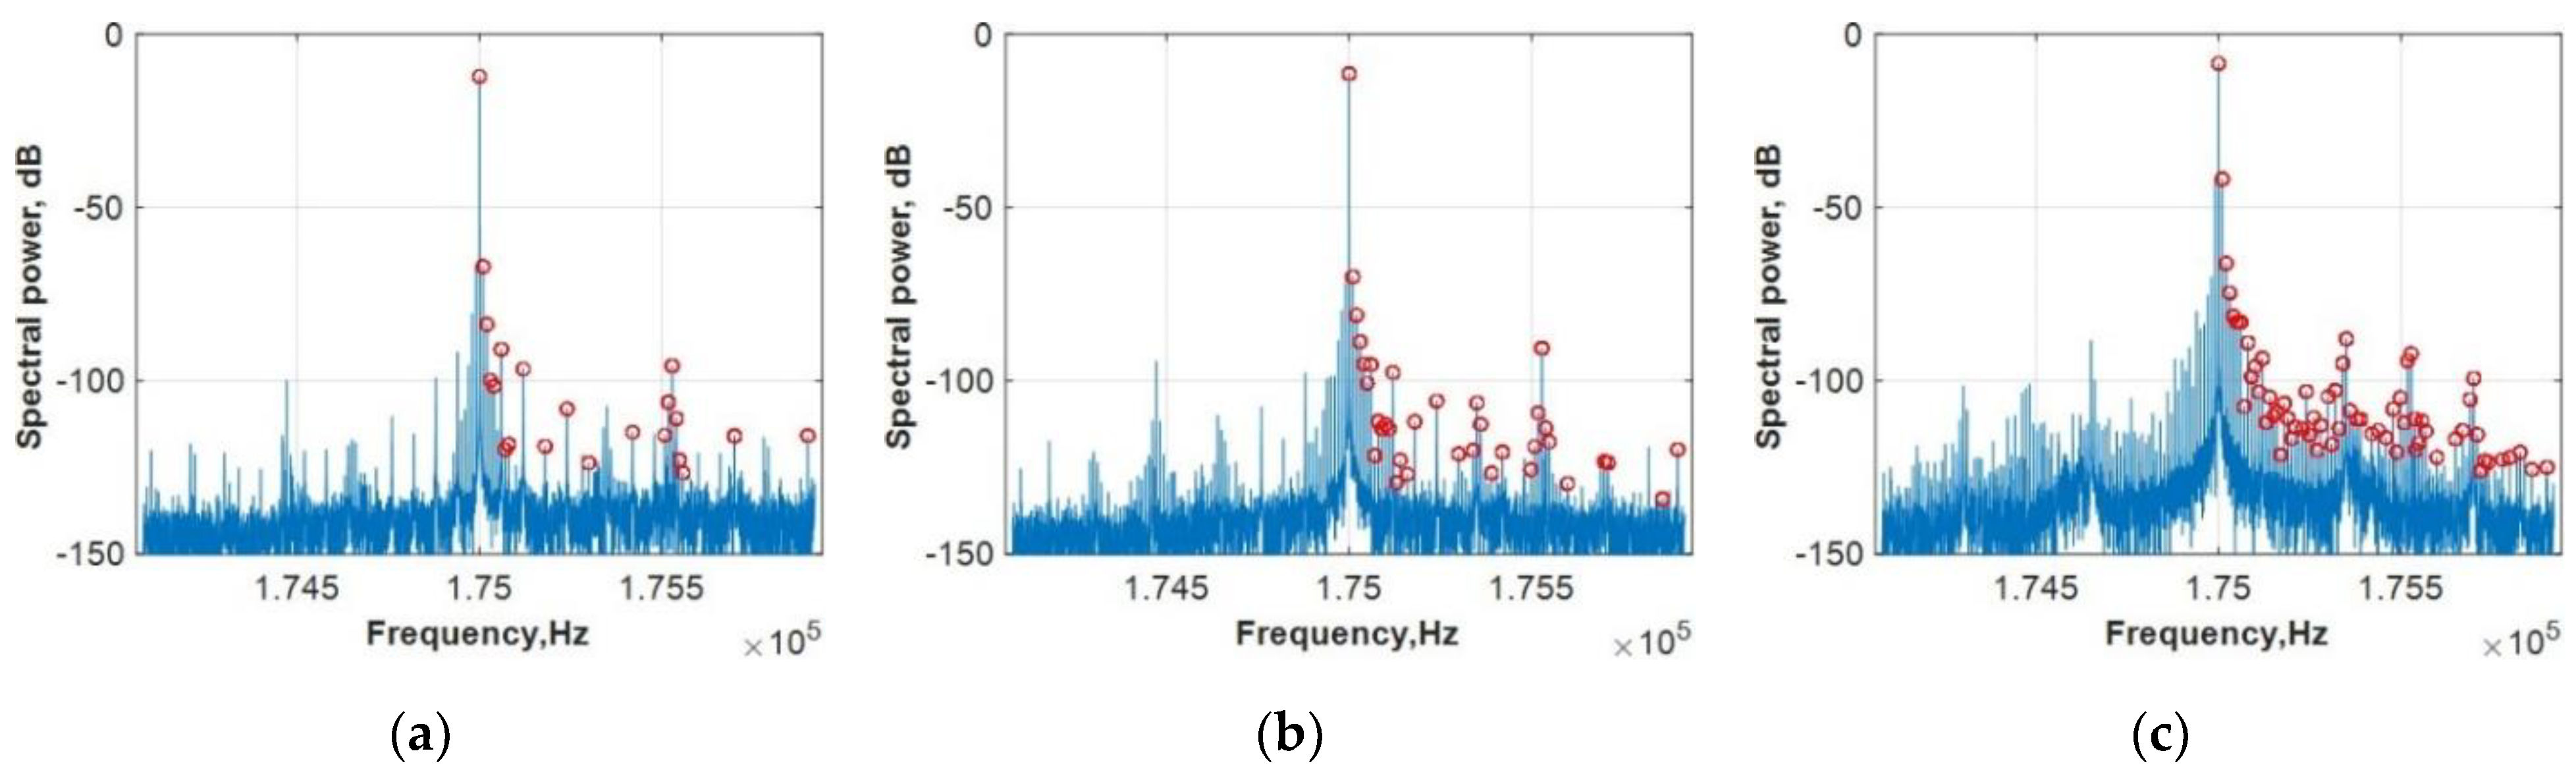
The experimental scheme is the same as that described in [19], which is illustrated in Figure 1. The tested samples of our VAM experiment were 10 inch A108 steel bars with a cross-section 1 × inch cross-section. The same samples were used in earlier tests [19,29,30] that allowed a comparison of our SPN method with the previous MI method. The sample mechanical properties are illustrated in Table 1. At the center of each specimen, a circular notch with a ¼ inch diameter was drilled to control the location of the expected fatigue crack. The specimen was installed in a material test system (MTS), and two piezoelectric discs were attached to the samples as ultrasonic transmitters and signal receivers.
Two processes, namely, damaging and measuring, were performed alternatively on the tested samples until each sample came to a complete break. During the degradative process, the cyclic tensile loads, with a target setpoint of 10.5 kN and amplitude of 10 kN, were applied to the sample by the MTS. The lifetime of the six tested samples varied from 45,000 to 120,000 cycles of such fatigue loads.
The MTS was utilized during the VAM measuring process to generate the pump wave with a frequency of 10 Hz and an amplitude of 0.6 kN. The probe wave was generated by an NI USB 6361 data acquisition (DAQ) board amplified 50 times by a piezo driver power amplifier and was sent to the sample by one of the piezoelectric discs illustrated in Figure 1. Thus, in the presence of damage in the sample, the probe and pump wave interact with each other at the notch area.
Another piezoceramic disc, which received a modulated signal, went through a bandpass filter with a passband of 110–220 kHz and was sent back to the DAQ board. Finally, the digital signal was sent to the computer, where spectral signal analysis was conducted.
Because of the dependence of the modulation on the probe frequency wave, we conducted tests for five probe waves frequencies. Since single frequency use does not provide reliable results, the frequency response is acquired by a sweeping frequency test of the sample at its intact stage with the pump wave applied [31,34]. Several criteria need to be considered when choosing the probe wave frequency. Firstly, the magnitude of the carrier should be strong enough on an excellent signal-to-noise ratio. Secondly, the magnitude of the sidebands in the intact sample should be lower than −50 dB for the minimum influence of structural nonlinearity and maximum sensitivity of the VAM. Thirdly, in order to avoid the node or the antinode of the modes of the sample, the frequency should be selected from peaks or troughs of the frequency response curve.

3. Results

The MI was computed according to the VAM technique described in [35] in order to evaluate the remaining fatigue life using VAM signals. The MI was usually calculated from the level of probe frequency ( A 0 ) and both side components A + and A having frequencies f + F and f F , where f is the probe frequency and F is the pump frequency. The VAM signals were recorded at every cycle point for five probe frequencies in the range of 150 to 210 kHz and a pump frequency of 10 Hz. The recorded signals were studied in the frequency domain by applying the frequency Fourier transform (FFT).
Examples of the signal spectra for Sample #3 for the frequencies around the probe frequency f = 175 kHz are presented in Figure 2. These spectra are shown for different numbers of cycles, including the level of sideband peaks that were observed with cycle number increase.
The nonlinear effects in VAM are usually described by the following equation:
MI   = A + A + 2 A 0 .
Representative results of the MI were averaged for five tested probe frequencies. The tested samples had a different number of cycles to failure and we used this number for normalization of load cycles in the figures below. This normalized load cycle number can be considered as the sample lifetime.
The MI dependences for three samples are shown in Figure 3.
There are three stages apparent in the diagram of the MI measurement that are depicted by a change of inclination in the trend. At the first stage, the MI starts with a slight difference between −60 dB and −45 dB with increasing cyclic load. At this stage, there is no visible crack. The second stage is the trending line before growing, where invisible damage occurs in the samples. We refer to this stage as “initial damage accumulation”. Figure 2a,b display the spectra of Sample #3. These spectra of MI signals remain unchanged until the cycle load ratio achieves an approximate 0.9 MI increase that is evidenced in the spectrum in Figure 2c due to the presence of a crack. This MI increase is the third stage, where the damage becomes visible until the end of the measurement.
Figure 2 demonstrates changes in the sideband peak in the frequency band of 60 Hz. The same spectra in a wider frequency band of 2000 Hz are shown in Figure 4, where it is clearly seen that the number of sideband peaks increases with the number of load cycles.
The sideband peaks were counted for frequencies f + nF, where n is an integer number. Red dots mark the counted peaks for these frequencies. Sideband peak numbers (SPNs) were calculated on the right side of the sideband because the spectrum is symmetrical regarding the probe frequency f. As a result, the SPN expanded due to damage accumulation, as seen in Figure 5.
Notably, from a comparison of Figure 3 and Figure 5, both techniques, namely, MI and SPN, reflect damage accumulation in a similar way. Hence, both parameters can be used for damage and crack assessment.
However, unlike Samples #1–3, the tests with Samples #4–6 showed an MI and SPN behavior difference. The examples of the modulation spectra in Figure 6 show that the level of sideband peaks was not increased with damage accumulation, but the number of sideband peaks was increased, as seen in Figure 7.
In the tests of these samples, the SPN demonstrated much better performance for damage detection than the MI. The dependence of MI for this case in Figure 8 does not display a significant improvement compared to the MI method with crack accumulation.
Figure 9 shows an evaluation of Samples #4–6 using the SPN method. The result presents a noticeable trend toward an increase during the fatigue test. After 80% of their lifetime, a significant increase was observed in the sideband values. The results of a robustness test confirm that the SPN method can provide a consistent measure of minor damage to the specimens.
Another advantage of an SPN calculation compared to MI is that the SPN is less dependent on the choice of probe frequency. Figure 10 shows the MI and SPN measured for Sample #3 for all five tested frequencies. It is clearly seen that the SPN has significantly fewer fluctuations for different frequencies compared to the MI.

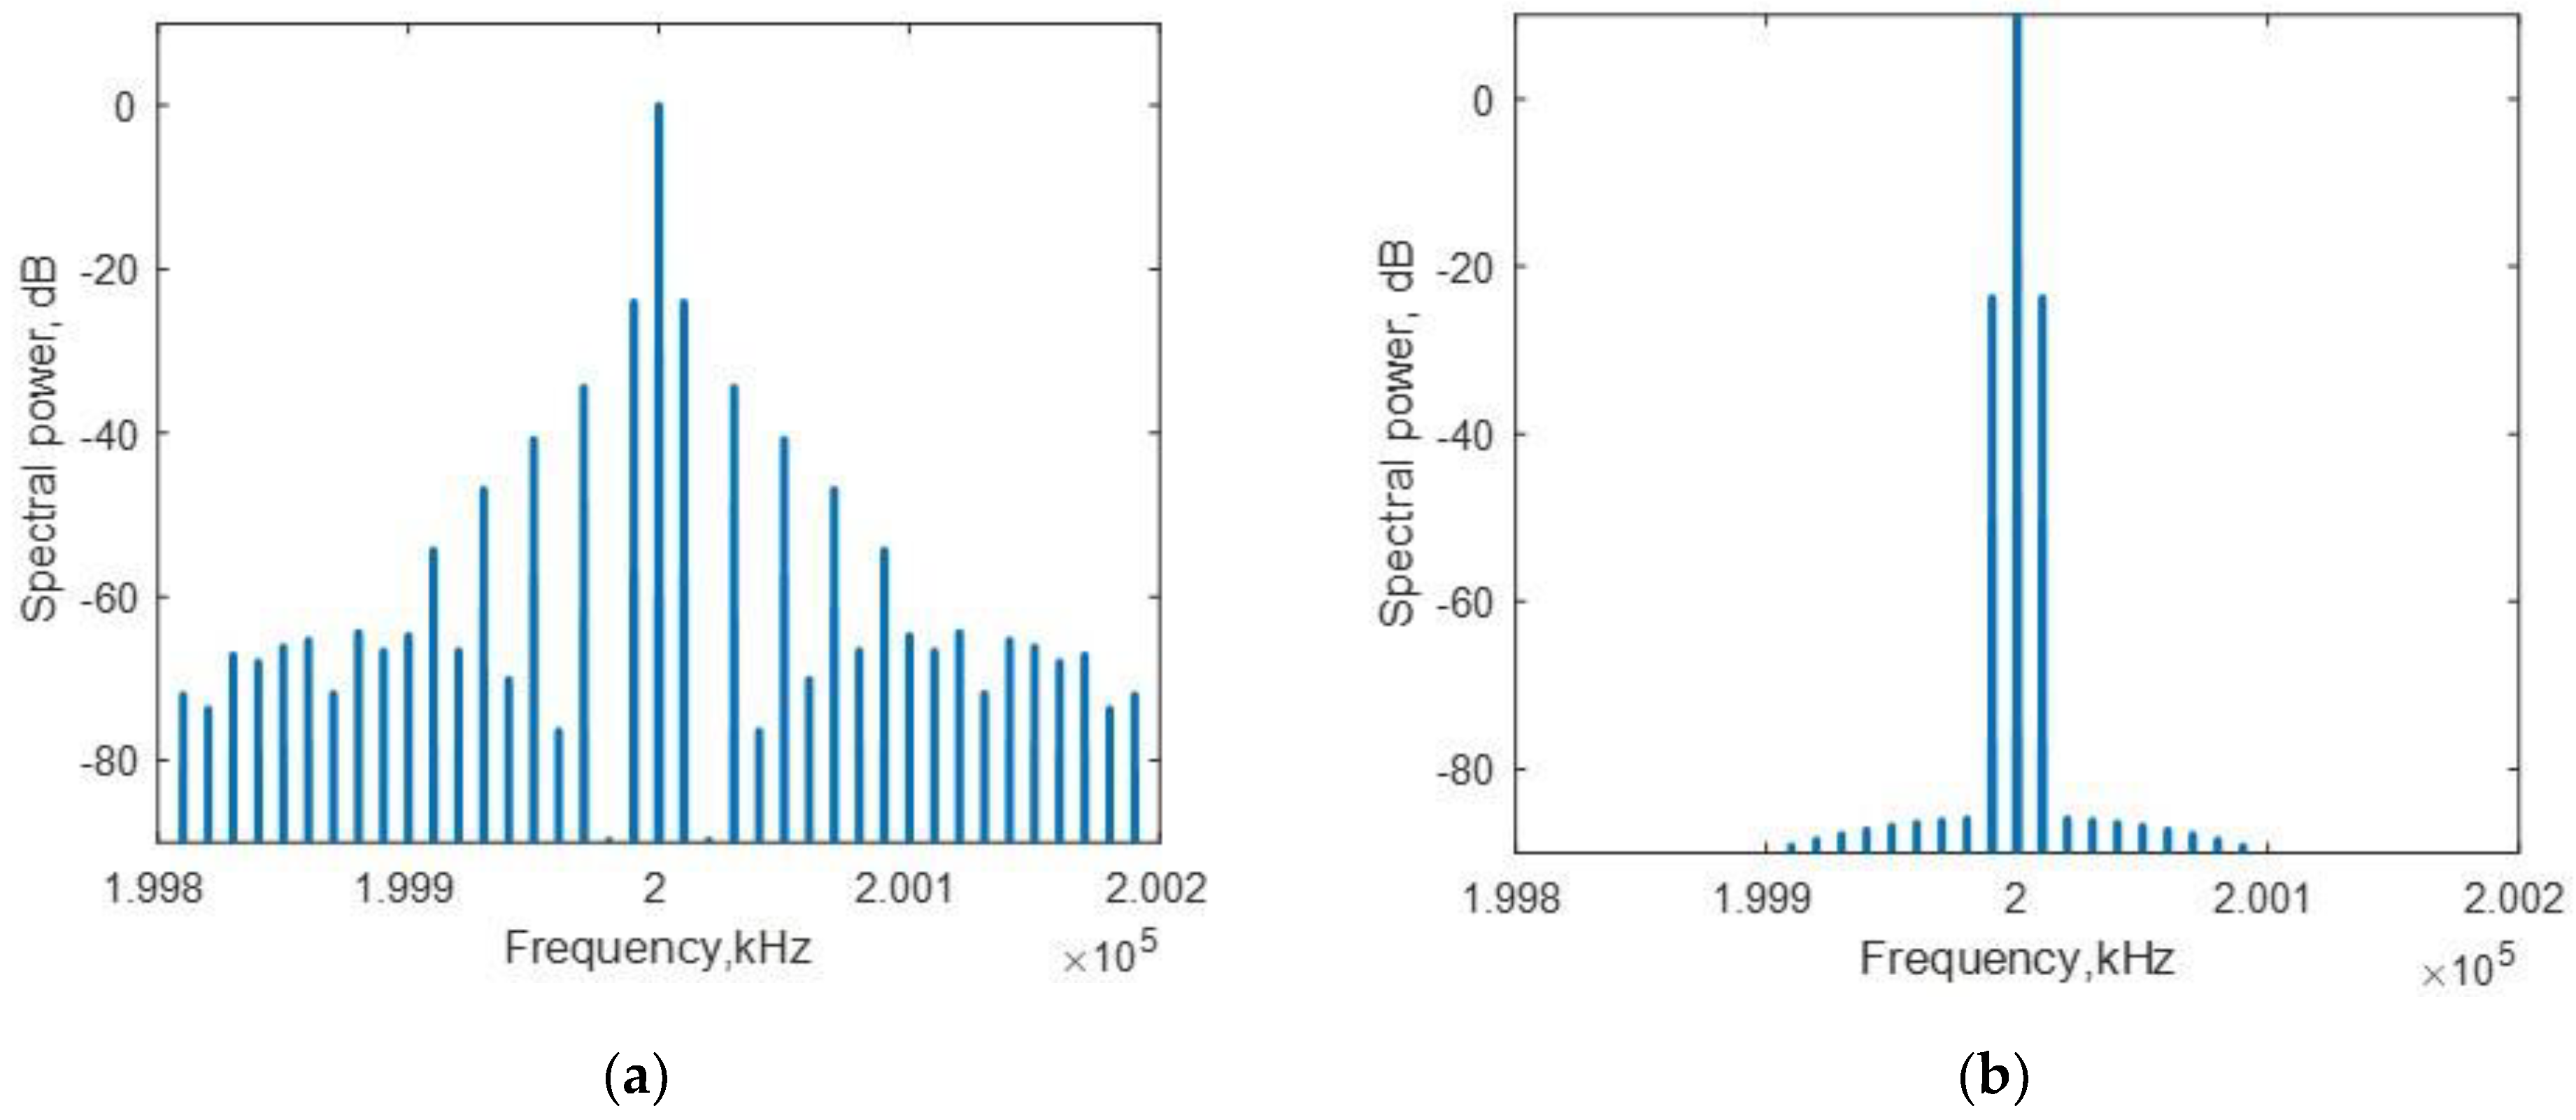
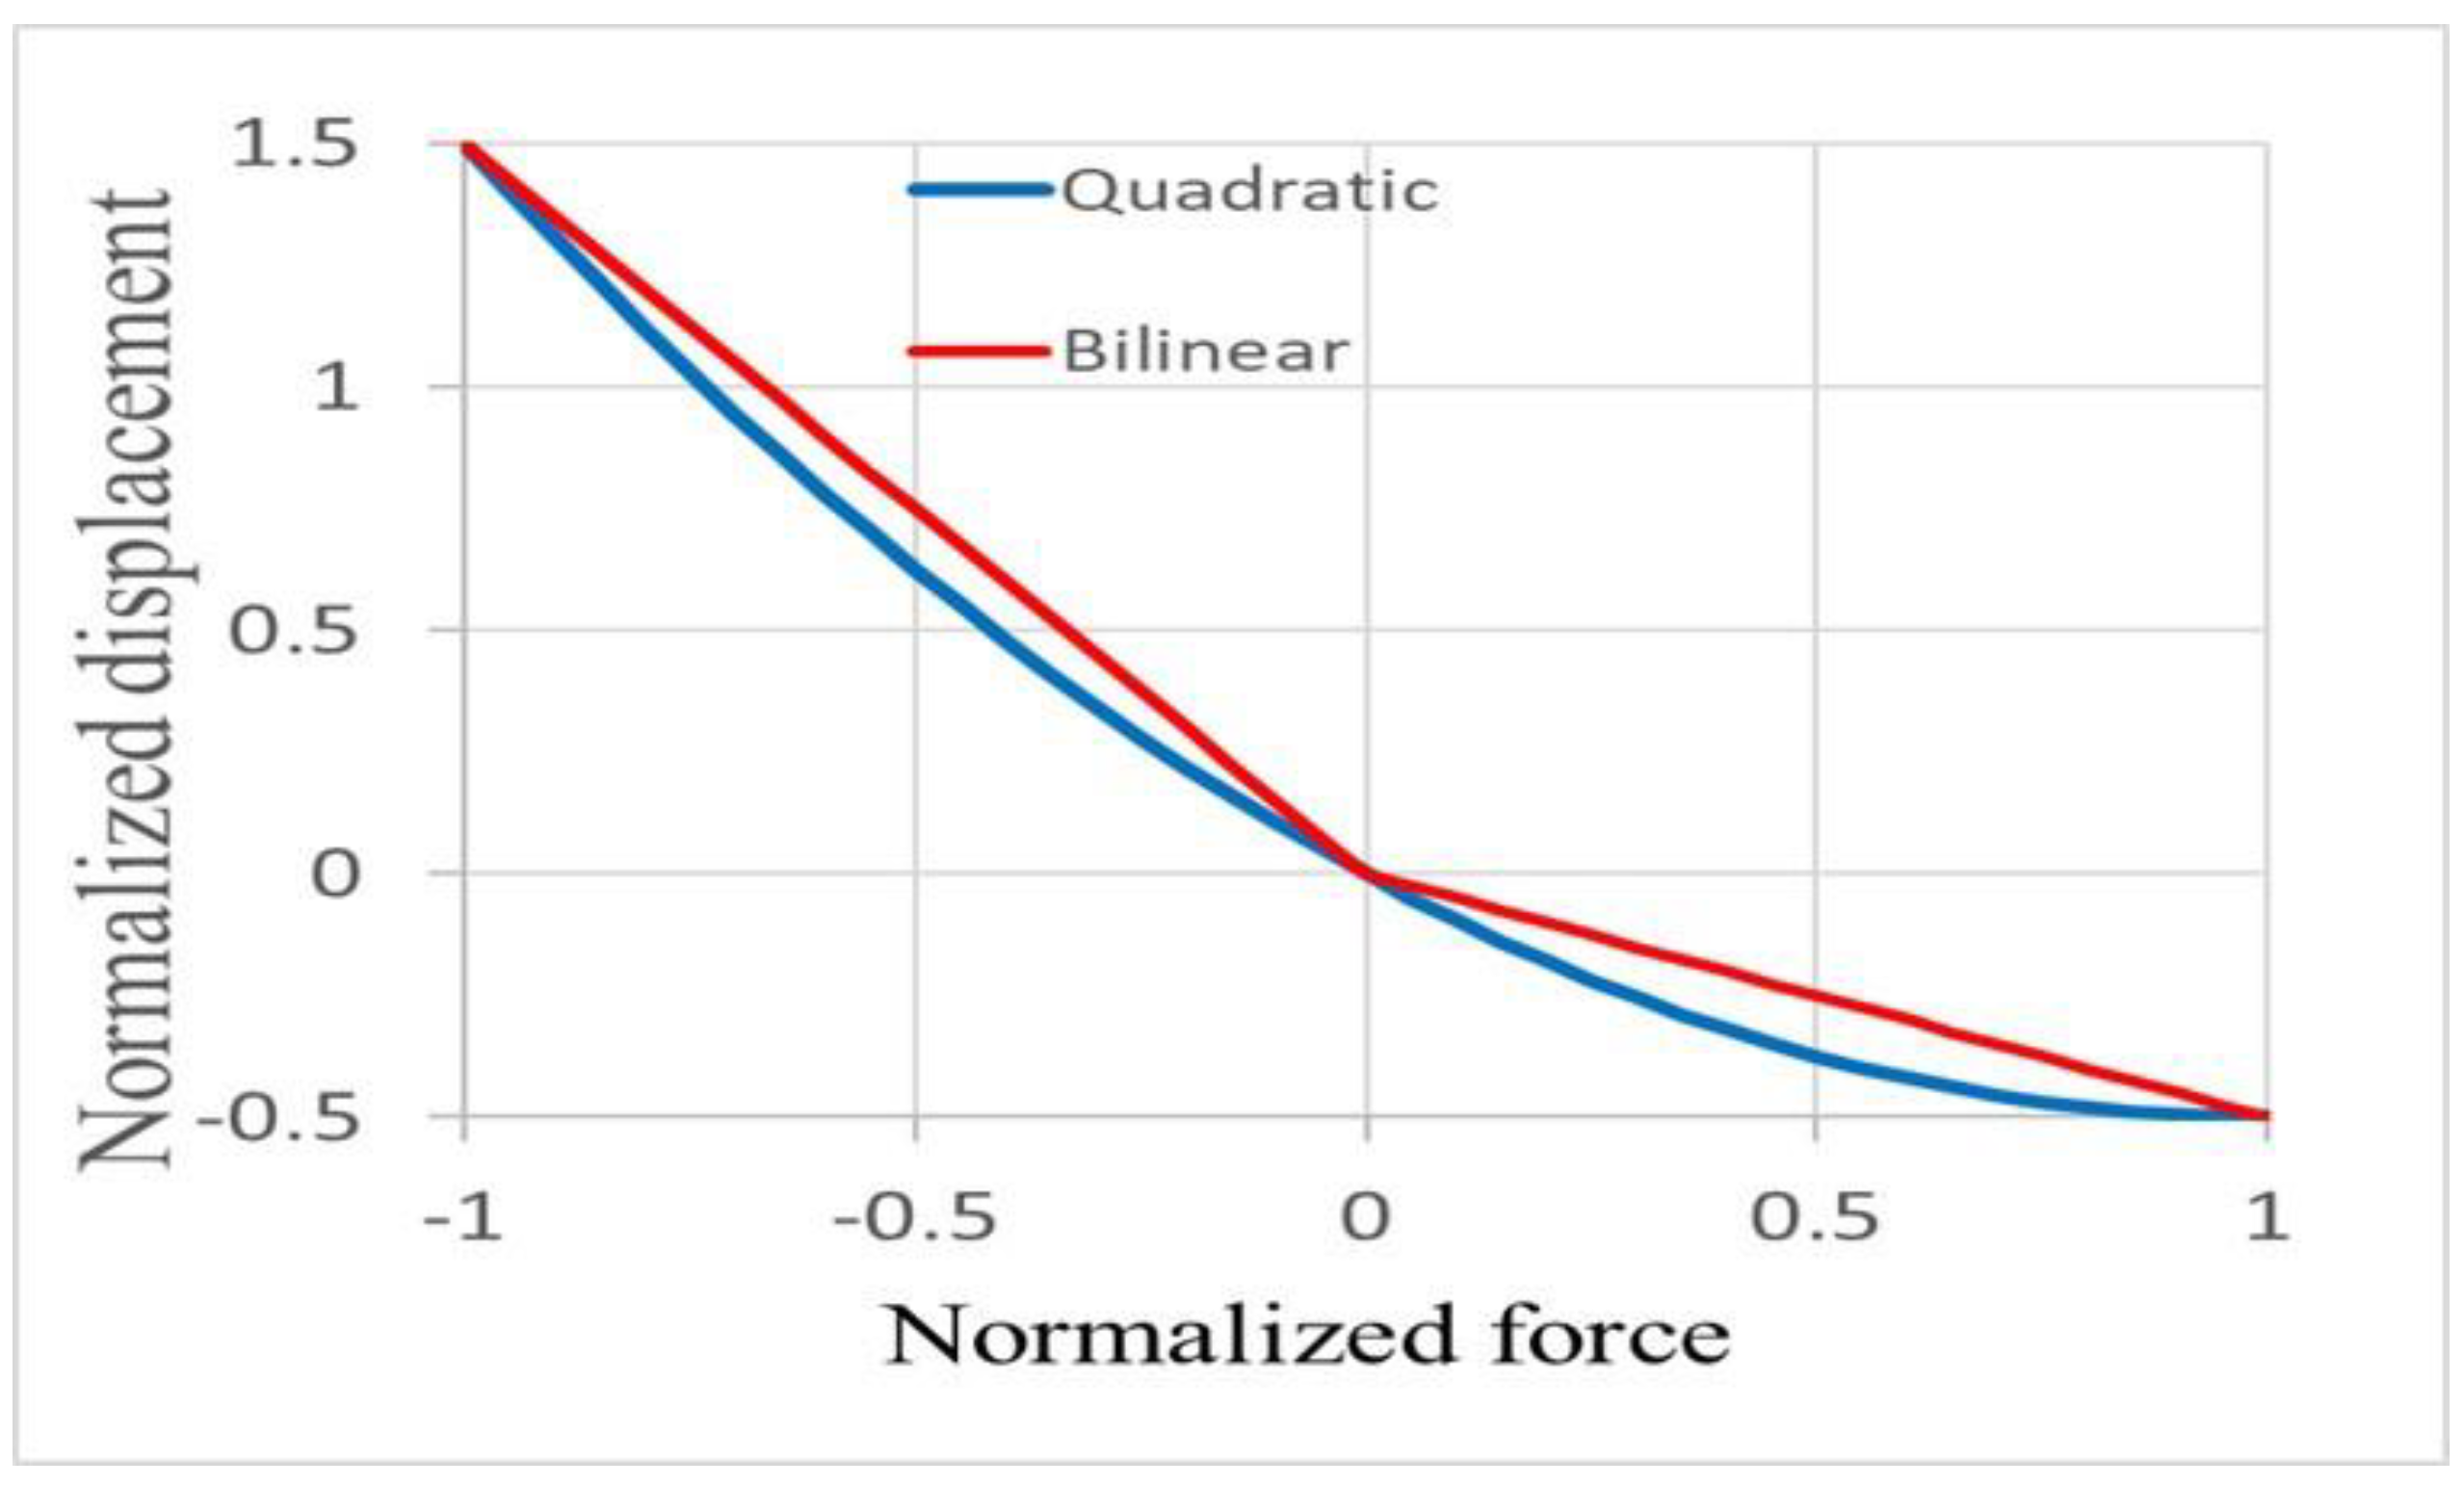
4. Bilinear Crack Model of Multiple Sideband Peak Interpretation

As mentioned in the introduction, various VAM research studies have observed the presence of multiple sideband peaks. These multiple sideband peaks can be explained by complex (nonquadratic) crack nonlinearity and/or higher-order interactions [36].
A much simpler and more reliable explanation can be made on the basis of a bilinear crack model. Many publications consider the nonlinear acoustic effect in the structures with closing (breathing) cracks, and some examples are presented in [3,37,38,39]. The bilinear model in [40] displayed multiple sideband peaks in a cracked beam due to the simulated effect of stochastic vibrations [41].
In this work, we considered the generation of sideband peaks according to the simplest crack model. Figure 11 shows the force-displacement spring relationship of a bilinear model in a section medium. Thus, the crack is closed by positive applied force (compression) and opened by negative applied force (extension), which increases the stiffness coefficient.
The relationship of the normalized displacement on the normalized applied force is shown in Figure 12.
Some essential features of the multifrequency sideband peak generation can be explained by the simple bilinear crack model, which has various stiffnesses for positive and negative force.
m q ¨ + c q ˙ + k ( q ) q = σ ( t ) .  
Consider excitation frequencies, which are much lower than resonance frequencies, and small nonlinearity k(q) = K0 + Dk(q), where the nonlinear part of the stiffness coefficient Dk(q) << K0.
Equation (2) can then be written in the following form:
[ K 0 ( 1 + Δ k ( q ) ] q = σ ( t ) .  
For the bilinear case, we consider the variation of the stiffness as follows:
Δ k = { α   i f   σ > 0 α   i f   σ < 0 .
Figure 12 shows the case for α = 0.5. This strong nonlinearity is only used for the visibility of the stiffness variation. For demonstration of multiple sideband peak generation, α = 0.1 was used.
Illustration of the sideband components for both models was conducted for the case where the input stress is the sum of the probe wave and the pump wave with the same amplitudes P1 and P2.
σ = P 1 cos ω t + P 2 cos Ω t ,
where the ω = 2 π f   and Ω = 2 π F .
Figure 13 represents the sideband component for the bilinear and quadratic model, calculated using the following parameters and values: frequency of the pump wave, 10 Hz; frequency of the probe wave, 200 kHz; nonlinear parameter, a = 0.1; P1 = P2 = 1.
The dependences of the first sideband components on the probe and pump wave amplitudes are presented in Figure 14. The solid curved line represents the bilinear model in both figures, while the straight dashed line represents the quadratic model. Interestingly, both dependences are practically the same and reveal a difference with regard to the quadratic model. Figure 15 reveals examples of the spectra calculated from the bilinear crack models.
A significant difference in variation of sideband components was observed for high-order components. Figure 15 shows examples of the calculated spectra.
Analysis of the simple bilinear crack model shows that this model can explain the multiple sideband peak generation. In addition, this model demonstrates that the strong dependence of the sideband peaks on the probe and pump wave amplitudes could be a topic of future experimental investigations.

5. Conclusions

In this study, a new method based on sideband peak count was suggested for estimating the nonlinear effects of the vibro-acoustic modulation technique of crack detection. This method allows for the consideration of the multiple peaks generated in VAM due to nonquadratic crack nonlinearities. An experimental comparison between the earlier developed modulation index and the new sideband peak number parameters demonstrates that, in some of the tests, the latter reflects damage more effectively than the classical MI. A simple bilinear crack model was applied for an interpretation of multiple sideband peak generation This model indicates the effect of the unusual dependence of the sideband peaks on the probe and pump wave amplitudes, which is a potential topic for future experimental investigations.

Author Contributions

Conceptualization, S.H. and A.A.; experimental methodology, D.L. and A.A.; signal processing software, A.A. and A.S.; validation, A.A., S.H. and A.S.; formal analysis, A.A. and A.S.; writing—original draft preparation, A.A. and D.L.; writing—review and editing, A.A. and A.S.; visualization, A.A.; supervision, A.S. and S.H. All authors have read and agreed to the published version of the manuscript.

Funding

The work of Abdullah Alnutayfat was financially supported by Prince Sattam Bin Abdulaziz University, Saudi Arabia.

Acknowledgments

We would like to express our respect and gratitude to Sophia Hassiotis. Her sudden death in June 2021 shocked and saddened the Stevens community. Sophia, a dedicated professor in the Department of Civil, Environmental, and Ocean Engineering at the Stevens Institute of Technology, was passionate about research and teaching. She was honored with numerous awards and recognitions for her teaching and research. Sophia initiated this work and led this research until her death. The memory of Sophia will always be in our hearts.

Conflicts of Interest

The authors declare no conflict of interest.

References

  1. Buck, O. Nonlinear Acoustic Properties of Structural Materials—A Review. In Review of Progress in Quantitative Nondestructive Evaluation; Thompson, D.O., Chimenti, D.E., Eds.; Springer: Boston, MA, USA, 1990; pp. 1677–1684. ISBN 978-1-4684-5774-2. [Google Scholar]
  2. Zheng, Y.; Maev, R.G.; Solodov, I.Y. Review/Sythèse Nonlinear Acoustic Applications for Material Characterization: A Review. Can. J. Phys. 2000, 77, 927–967. [Google Scholar] [CrossRef]
  3. Broda, D.; Staszewski, W.J.; Martowicz, A.; Uhl, T.; Silberschmidt, V.V. Modelling of Nonlinear Crack–Wave Interactions for Damage Detection Based on Ultrasound—A Review. J. Sound Vib. 2014, 333, 1097–1118. [Google Scholar] [CrossRef]
  4. Sutin, A.M.; Salloum, H. Interaction of Acoustic and Electromagnetic Waves in Nondestructive Evaluation and Medical Applications. Radiophys. Quantum Electron. 2020, 63, 40–54. [Google Scholar] [CrossRef]
  5. Klepka, A.; Pieczonka, L.; Dziedziech, K.; Staszewski, W.J.; Aymerich, F.; Uhl, T. Structural Damage Detection Based on Nonlinear Acoustics: Application Examples. In Nonlinear Ultrasonic and Vibro-Acoustical Techniques for Nondestructive Evaluation; Kundu, T., Ed.; Springer International Publishing: Cham, Switzerland, 2019; pp. 139–174. ISBN 978-3-319-94476-0. [Google Scholar]
  6. Krohn, N.; Pfleiderer, K.; Stoessel, R.; Solodov, I.; Busse, G. Nonlinear Acoustic Imaging: Fundamentals, Methodology, and NDE-Applications. In Proceedings of the Acoustical Imaging; Arnold, W., Hirsekorn, S., Eds.; Springer: Dordrecht, The Netherlands, 2004; pp. 91–98. [Google Scholar]
  7. Guyer, R.A.; Johnson, P.A. Nonlinear Mesoscopic Elasticity: The Complex Behaviour of Rocks, Soil, Concrete; John Wiley & Sons: Hoboken, NJ, USA, 2009; ISBN 978-3-527-40703-3. [Google Scholar]
  8. Kundu, T.; Eiras, J.N.; Li, W.; Liu, P.; Sohn, H.; Payá, J. Fundamentals of Nonlinear Acoustical Techniques and Sideband Peak Count. In Nonlinear Ultrasonic and Vibro-Acoustical Techniques for Nondestructive Evaluation; Kundu, T., Ed.; Springer International Publishing: Cham, Switzerland, 2019; pp. 1–88. ISBN 978-3-319-94476-0. [Google Scholar]
  9. Jin, J.; Rivière, J.; Ohara, Y.; Shokouhi, P. Dynamic Acousto-Elastic Response of Single Fatigue Cracks with Different Microstructural Features: An Experimental Investigation. J. Appl. Phys. 2018, 124, 075303. [Google Scholar] [CrossRef]
  10. Bergman, R.H.; Shahbender, R.A. Effect of Statically Applied Stresses on the Velocity of Propagation of Ultrasonic Waves. J. Appl. Phys. 1958, 29, 1736–1738. [Google Scholar] [CrossRef]
  11. Toupin, R.A.; Bernstein, B. Sound Waves in Deformed Perfectly Elastic Materials. Acoustoelastic Effect. J. Acoust. Soc. Am. 1961, 33, 216–225. [Google Scholar] [CrossRef]
  12. Korotkov, A.S.; Slavinskij, M.M.; Sutin, A.M. Variations of acoustic nonlinear parameters with the concentration of defects in steel. Akust. Zurnal 1994, 40, 84–87. [Google Scholar]
  13. Klepka, A.; Dziedziech, K.; Mrówka, J.; Górski, J. Experimental Investigation of Modulation Effects for Contact-Type Interfaces in Vibro-Acoustic Modulation Tests. Struct. Health Monit. 2021, 20, 917–930. [Google Scholar] [CrossRef]
  14. Hu, H.F.; Staszewski, W.J.; Hu, N.Q.; Jenal, R.B.; Qin, G.J. Crack Detection Using Nonlinear Acoustics and Piezoceramic Transducers—Instantaneous Amplitude and Frequency Analysis. Smart Mater. Struct. 2010, 19, 065017. [Google Scholar] [CrossRef]
  15. Li, N.; Wang, F.; Song, G. New Entropy-Based Vibro-Acoustic Modulation Method for Metal Fatigue Crack Detection: An Exploratory Study. Measurement 2020, 150, 107075. [Google Scholar] [CrossRef]
  16. Ballad, E.M.; Vezirov, S.Y.; Pfleiderer, K.; Solodov, I.Y.; Busse, G. Nonlinear Modulation Technique for NDE with Air-Coupled Ultrasound. Ultrasonics 2004, 42, 1031–1036. [Google Scholar] [CrossRef] [PubMed]
  17. Lee, S.E.; Lim, H.J.; Sohn, H.; Hong, J.W. Excitation Conditions for Nonlinear Ultrasonic Wave Modulation Technique. In KKHTCNN; Chulalongkorn University: Bangkok, Thailand, 2015. [Google Scholar]
  18. Dziedziech, K.; Klepka, A.; Roemer, J.; Pieczonka, L. Experimental Study of Thermo-Acoustic Wave Modulation in a Cracked Plate. J. Sound Vib. 2021, 498, 115970. [Google Scholar] [CrossRef]
  19. Golchinfar, B.; Ramezani, M.G.; Donskoy, D.; Saboonchi, H. Vibro-Acoustic Modulation Technique Comparison with Conventional Nondestructive Evaluation Methods. In Health Monitoring of Structural and Biological Systems XIV; SPIE: Bellingham, WC, USA, 2020; Volume 11381, pp. 187–198. [Google Scholar]
  20. Korotkov, A.S.; Sutin, A.M. Modulation of Ultrasound by Vibrations in Metal Constructions with Cracks. Acoust. Lett. 1994, 18, 59–62. [Google Scholar]
  21. Sutin, A.M.; Donskoy, D.M. Vibro-Acoustic Modulation Nondestructive Evaluation Technique. In Nondestructive Evaluation of Aging Aircraft, Airports, and Aerospace Hardware II; SPIE: Bellingham, WC, USA, 1998; Volume 3397, pp. 226–237. [Google Scholar]
  22. Duffour, P.; Morbidini, M.; Cawley, P. Comparison between a Type of Vibro-Acoustic Modulation and Damping Measurement as NDT Techniques. NDT E Int. 2006, 39, 123–131. [Google Scholar] [CrossRef]
  23. Meyer, J.J.; Adams, D.E. Theoretical and Experimental Evidence for Using Impact Modulation to Assess Bolted Joints. Nonlinear Dyn. 2015, 81, 103–117. [Google Scholar] [CrossRef]
  24. Donskoy, D.; Zagrai, A.; Chudnovsky, A.; Golovin, E.; Agarwala, V. Damage Assessment with Nonlinear Vibro-Acoustic Modulation Technique. In In American Society of Mechanical Engineers Digital Collection, Proceedings of the International Design Engineering Technical Conferences and Computers and Information in Engineering Conference, Las Vegas, NV, USA, 4–7 September 2007; ASME: New York, NY, USA, 2009; pp. 1949–1956. [Google Scholar]
  25. Liu, B.; Luo, Z.; Gang, T. Influence of Low-Frequency Parameter Changes on Nonlinear Vibro-Acoustic Wave Modulations Used for Crack Detection. Struct. Health Monit. 2018, 17, 218–226. [Google Scholar] [CrossRef]
  26. Jia, J.; Hu, H.; Tao, L.; Yang, D. Analysis of Load Effect on Nonlinear Vibro-Acoustic Modulation Used in on-Line Monitoring of Fatigue Cracks. Smart Mater. Struct. 2017, 26, 095048. [Google Scholar] [CrossRef]
  27. Boll, B.; Willmann, E.; Fiedler, B.; Meißner, R.H. Weak Adhesion Detection—Enhancing the Analysis of Vibroacoustic Modulation by Machine Learning. Compos. Struct. 2021, 273, 114233. [Google Scholar] [CrossRef]
  28. Castellano, A.; Fraddosio, A.; Piccioni, M.D.; Kundu, T. Linear and Nonlinear Ultrasonic Techniques for Monitoring Stress-Induced Damages in Concrete. J. Nondestruct. Eval. Diagn. Progn. Eng. Syst. 2021, 4, 041001. [Google Scholar] [CrossRef]
  29. Donskoy, D.; Golchinfar, B.; Ramezani, M.; Rutner, M.; Hassiotis, S. Vibro-acoustic amplitude and frequency modulations during fatigue damage evolution. In AIP Conference Proceedings; AIP Publishing LLC: Melville, NY, USA, 2019; Volume 2102, p. 040004. [Google Scholar]
  30. Ramezani, M.G.; Golchinfar, B.; Donskoy, D.; Hassiotis, S.; Venkiteela, G. Steel Material Degradation Assessment via Vibro-Acoustic Modulation Technique. Transp. Res. Rec. 2019, 2673, 579–585. [Google Scholar] [CrossRef]
  31. Donskoy, D.M. Nonlinear Acoustic Methods. In Encyclopedia of Structural Health Monitoring; John Wiley & Sons, Ltd.: Hoboken, NJ, USA, 2009; ISBN 978-0-470-06162-6. [Google Scholar]
  32. Liu, P.; Sohn, H. Damage Detection Using Sideband Peak Count in Spectral Correlation Domain. J. Sound Vib. 2017, 411, 20–33. [Google Scholar] [CrossRef]
  33. Alnuaimi, H.; Amjad, U.; Park, S.; Russo, P.; Lopresto, V.; Kundu, T. An Improved Nonlinear Ultrasonic Technique for Detecting and Monitoring Impact Induced Damage in Composite Plates. Ultrasonics 2022, 119, 106620. [Google Scholar] [CrossRef] [PubMed]
  34. Frau, A.; Aymerich, F.; Porcu, M.; Pieczonka, L.; Klepka, A.; Staszewski, W. Probing WaveFrequency Selection for the Nonlinear Vibro-Acoustic Wave Modulation Tests. AIAS–Assoc. Ital. L’analisi Sollecitazioni 2014, 43, 9–12. [Google Scholar]
  35. Zagrai, A.; Donskoy, D.; Lottiaux, J. N-Scan®: New Vibro-Modulation System for Crack Detection, Monitoring and Characterization. In AIP Conference Proceedings; AIP Publishing LLC: Melville, NY, USA, 2004; Volume 700, pp. 1414–1421. [Google Scholar] [CrossRef]
  36. Zaitsev, V.Y.; Matveev, L.A.; Matveyev, A.L. Elastic-Wave Modulation Approach to Crack Detection: Comparison of Conventional Modulation and Higher-Order Interactions. NDT E Int. 2011, 44, 21–31. [Google Scholar] [CrossRef]
  37. Dimarogonas, A.D. Vibration of Cracked Structures: A State of the Art Review. Eng. Fract. Mech. 1996, 55, 831–857. [Google Scholar] [CrossRef]
  38. Bovsunovsky, A.; Surace, C. Non-Linearities in the Vibrations of Elastic Structures with a Closing Crack: A State of the Art Review. Mech. Syst. Signal Processing 2015, 62–63, 129–148. [Google Scholar] [CrossRef]
  39. Wauer, J. On the Dynamics of Cracked Rotors: A Literature Survey. Appl. Mech. Rev. 1990, 43, 13–17. [Google Scholar] [CrossRef]
  40. Chu, Y.C.; Shen, M.-H.H. Analysis of Forced Bilinear Oscillators and the Application to Cracked Beam Dynamics. AIAA J. 1992, 30, 2512–2519. [Google Scholar] [CrossRef]
  41. Ostrovsky, L.A.; Starobinets, I.M. Transitions and Statistical Characteristics of Vibrations in a Bimodular Oscillator. Chaos 1995, 5, 496–500. [Google Scholar] [CrossRef]
Figure 1. Schema of the experimental VAM setup (left) and a picture of the sample with glued transducers (right).
Acoustics 04 00005 g001
Figure 2. Spectra in the frequency window of 60 Hz around the probe frequency f = 175 kHz for Sample #3: (a) after 11,252 load cycles, no damage initiation; (b) after 47,139 cycles, initial damage accumulation; (c) after 51,219 cycles, visible crack. The number of cycles to failure was 52,106 (see Table 2).
Acoustics 04 00005 g002
Figure 3. Measured dependence of the MI on the number of normalized load cycles/lifetime.
Acoustics 04 00005 g003
Figure 4. Spectra in the frequency window of 2000 Hz around the probe frequency f = 175 KHz for Sample #3: (a) after 11,252 load cycles, no damage initiation; (b) after 47,139 cycles, initial damage accumulation; (c) after 51,219 cycles, visible crack. The number of cycles to failure was 52,106 (see Table 2).
Acoustics 04 00005 g004
Figure 5. SPN versus the number of normalized cycles.
Acoustics 04 00005 g005
Figure 6. Spectra in the frequency window of 60 Hz around the probe frequency f = 195 kHz for Sample #5: (a) after 0 normalized cycles, no visible crack; (b) after 0.69 normalized cycles, initial damage accumulation; (c) after 0.9 normalized cycles, visible crack.
Acoustics 04 00005 g006
Figure 7. Spectra in the frequency window of 2000 Hz around the probe frequency f = 195 kHz for Sample #5: (a) after 0 normalized cycles, no visible crack; (b) after 0.69 normalized cycles, initial damage accumulation; (c) after 0.9 normalized cycles, visible crack.
Acoustics 04 00005 g007
Figure 8. Three specimens failed after being examined by the MI versus the number of cycles ratio for average frequencies.
Acoustics 04 00005 g008
Figure 9. Three specimens were successfully examined by the SPN versus the number of cycles ratio for average frequencies.
Acoustics 04 00005 g009
Figure 10. Variations of parameter MI (upper) and SPN (lower) for Sample #4 for different probe frequencies.
Acoustics 04 00005 g010
Figure 11. Schematic illustration of opening–closing action of cracks in beams.
Acoustics 04 00005 g011
Figure 12. Examples of bilinear (red line) and quadratic (blue line) force–displacement spring relationship. The nonlinear parameter here is α = 0.5 , which is much larger than for the considered case.
Acoustics 04 00005 g012
Figure 13. Simulation spectrum (a) of the bilinear and (b) quadratic crack models.
Acoustics 04 00005 g013
Figure 14. Dependence of the first sideband peak (A+) on (a) the probe wave amplitude and (b) the pump wave amplitude calculated from the bilinear model. The dotted lines show the same dependences from the quadratic model.
Acoustics 04 00005 g014
Figure 15. Examples of the spectra calculated from the bilinear crack models: (a) probe wave 0 dB and pump wave 10 dB; (b) probe wave 10 dB and pump wave 0 dB.
Acoustics 04 00005 g015
Table 1. Properties of the A108 steel used in the experiment.
Mechanical PropertiesValue
Density0.284 Ib/in3
Ultimate Tensile Strength63,800 psi
Yield Tensile Strength53,700 psi
Shear Strength43,500 psi
Melting Point2590–2670 °F
Table 2. The number of cycles to failure for the six tested samples.
SampleNumber of Cycles to Failure
Sample #146,102
Sample #2120,074
Sample #352,106
Sample #467,637
Sample #567,712
Sample #670,603
Publisher’s Note: MDPI stays neutral with regard to jurisdictional claims in published maps and institutional affiliations.

