1. Introduction
In ordinary public rooms, the typical acoustic treatment is a suspended absorbent ceiling. Examples of ordinary public rooms are classrooms, offices, health care premises and restaurants. Many people spend their working days in those spaces performing a variety of different activities. The acoustical conditions are crucial for people’s wellbeing and while supporting their activities.
1.1. Room Acoustic Parameters in Classrooms
The importance of good acoustical conditions in schools, with classrooms that support speech communication, as well as concentrated work, is well documented. Several surveys in school environments have emphasized the detrimental effects of insufficient acoustic treatment in classrooms [
1,
2]. The effect on cognitive functions, such as working memory, have been investigated [
3], as well as on academic attainment [
4]. Acoustical treatment in classrooms should not only secure good listening conditions; it has been reported that teachers suffer from voice disorders to a greater degree than the rest of the population [
5]. Objective measures for voice support in medium-sized classrooms have therefore been developed [
6,
7,
8].
The most common way to specify room acoustical target values in standards and regulations is to use reverberation time T
60 [
9]. The reverberation time is often evaluated as T
20, i.e., evaluating the range −5 to −25 dB of the decay curve. Validation is defined in ISO 3382-2 [
10]. Due to the procedure for evaluation of T
20, early reflections are ignored. As stated in textbooks on acoustics [
11,
12], it is known that two rooms with the same reverberation time can still be perceived as different, and that the reverberation is not solely enough to characterize room acoustical conditions. The fact that early reflections are ignored in evaluating T
20 is a plausible explanation for the occasionally bad correlation between the perceived condition. Furthermore, in rooms with ceiling treatment, the decay curve is often double-sloped, with a steep slope at the start of the decay and a less steep slope towards the end of the decay [
13]. Thus, there is an ambiguity in the evaluation of the reverberation time, due to the non-linear behavior of the decay curve. Consequently, complementary room acoustic parameters are needed, in order to capture the subjective experience of the acoustical conditions.
Lochner and Burger [
14] emphasized the importance of early reflections for the subjective impression of an auditorium, stating that it is the sound field and pattern of reflections that will affect how the sound environment is experienced, rather than one single parameter. The early reflections will contribute to the direct sound and thereby to the clarity of speech. The importance of parameters including early reflections, such as speech clarity C
50, have also been investigated in several studies [
15,
16,
17,
18,
19,
20]. Another parameter for speech intelligibility is the Speech Transmission Index (STI). The parameters C
50 and STI have been introduced in some national standards [
21,
22]. STI is defined in IEC60268-16 [
23] and C
50 in ISO 3382-1 [
24]. C
50 is an energy ratio for early-to-late arriving energy expressed in dB. The time limit between early and late energy is set at 50 ms for speech. Another parameter describing the relation between early and late reflections is definition, D
50, which is expressed as a percentage. These two parameters, C
50 and D
50, are exactly related. In this study C
50 has been investigated.
In a recent study [
25], the reading speed for Italian second graders was investigated. The study indicates a relation between reading speed and C
50. No correlation to reverberation time was identified.
Bradley et al. [
26] investigated speech intelligibility in classrooms, examining the relation between signal-to-noise ratio and room acoustic parameters. The results from [
26] show that the effect on signal-to-noise ratio is very important for speech intelligibility, and useful-to-detrimental ratios are proposed and recommended, instead of only focusing on the reverberation time. Further, they concluded that an increase in early reflections could improve signal-to-noise ratio by up to 9 dB [
27].
The non-linear decay curve in a room with absorbent ceiling treatment also implies that there is a difference in the character of the sound field at steady-state and during the latter part of the decay. It is therefore also of interest to use the parameter sound strength G defined in ISO 3382-1. This parameter is measured during steady state, and relates to how sound reflections in a room contribute to the sound pressure level. Sound strength has mainly been used for concert halls and other performance spaces [
28,
29], but also for the evaluation of acoustical conditions in classrooms [
15].
1.2. Room Acoustic Treatment in Classrooms
The most common acoustic treatment in ordinary public rooms is a sound absorbent ceiling and traditionally, as mentioned above, the required target values are defined by the reverberation time. When most of the absorption in ordinary rooms is predominately located at the ceiling, the scattering properties of furniture and other interior equipment will affect the acoustical conditions [
30]. In fact, even the directional characteristics of sound scattering objects in a room with a suspended absorbent ceiling will be significant. If the sound scattering objects redirect the energy up onto the absorbent ceiling or in a direction towards other sound reflecting surfaces, such as walls, the outcome will be different. This circumstance also presents the possibility of using sound scattering objects in order to fine tune acoustical conditions. Diffusers have long been used and applied in concert halls and studios [
31]. The purpose of diffusers is to avoid flutter echoes and to decrease the grazing sound field, but this type of treatment can also be used to direct the sound in preferable directions [
32]. Absorbers reduce echoes but also decrease the sound energy levels, which can be negative in rooms such as classrooms.
The influence of the location of sound absorbing materials on room acoustical parameters has been studied by Cucharero et al. [
32]. The effect on reverberation time, speech clarity and STI of sound absorbing material, and its placements in educational rooms, was calculated in a study by Berardi et al. [
33]. Choi has studied the combination of diffusers and absorbers on a 1/10 scale, testing different placements of absorbers and diffusers [
34,
35]. Evaluating the room acoustic parameters of reverberation time, speech clarity and sound strength showed that a combination of those two different types of acoustic treatment was the most preferable when considering several acoustic parameters.
Another aspect of classroom acoustics is the absorption of low frequencies. Listening tests show preferences for configurations with good low frequency absorption, especially in cases where a high ratio of low frequency sound is emitted [
36].
1.3. Study Objective and Principal Conclusion
The findings in the references cited above imply that the acoustic treatment in a room needs to deal with different acoustics parameters in order to achieve good acoustic quality, both for the speaker and listener. The objective of this study is to investigate the effect of different types of acoustic treatment on several room acoustic parameters. The investigation was made as a series of experiments in a mock-up of a classroom. Configurations with porous absorbers and diffusers both in the ceilings and on the walls have been evaluated. Combinations of resonant absorbers and diffusers were also tested, in order to further investigate the possibility of improving classroom acoustics. The effect on the room acoustic parameters T20, C50 and G is evaluated.
2. Materials and Methods
2.1. Room Mock-Up
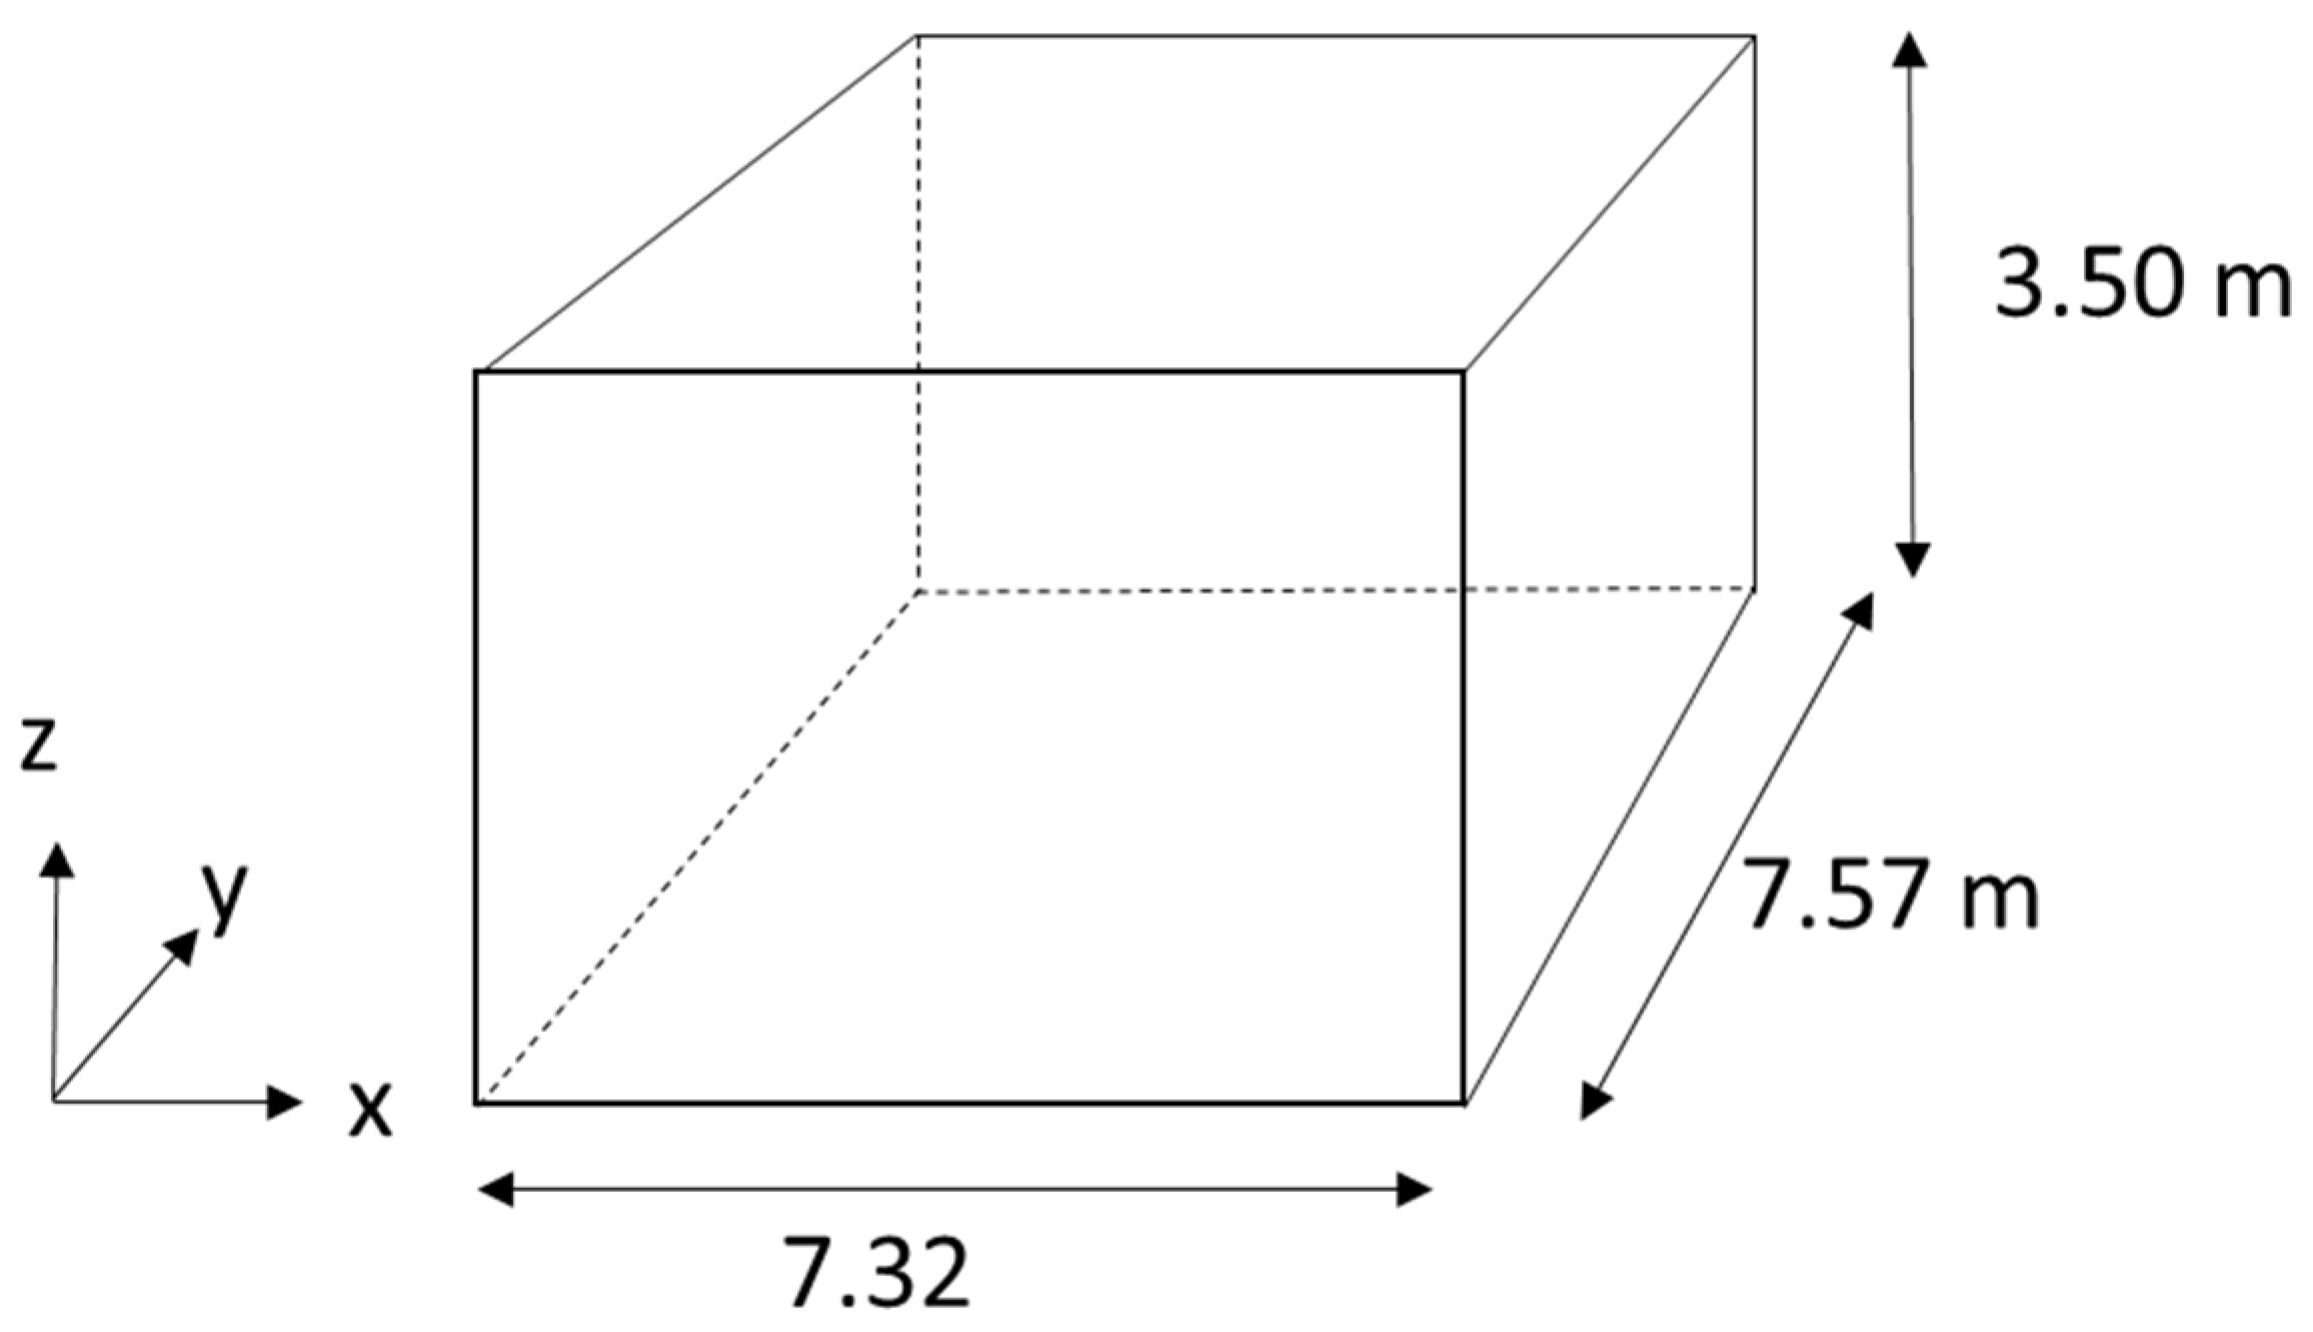
The experiments were conducted in a mock-up of a classroom with dimensions 7.32 m × 7.57 m × 3.5 m. The ceiling covers 7.2 m × 7.2 m and was installed at height 2.70 m. Dimensions and coordinate system are shown in
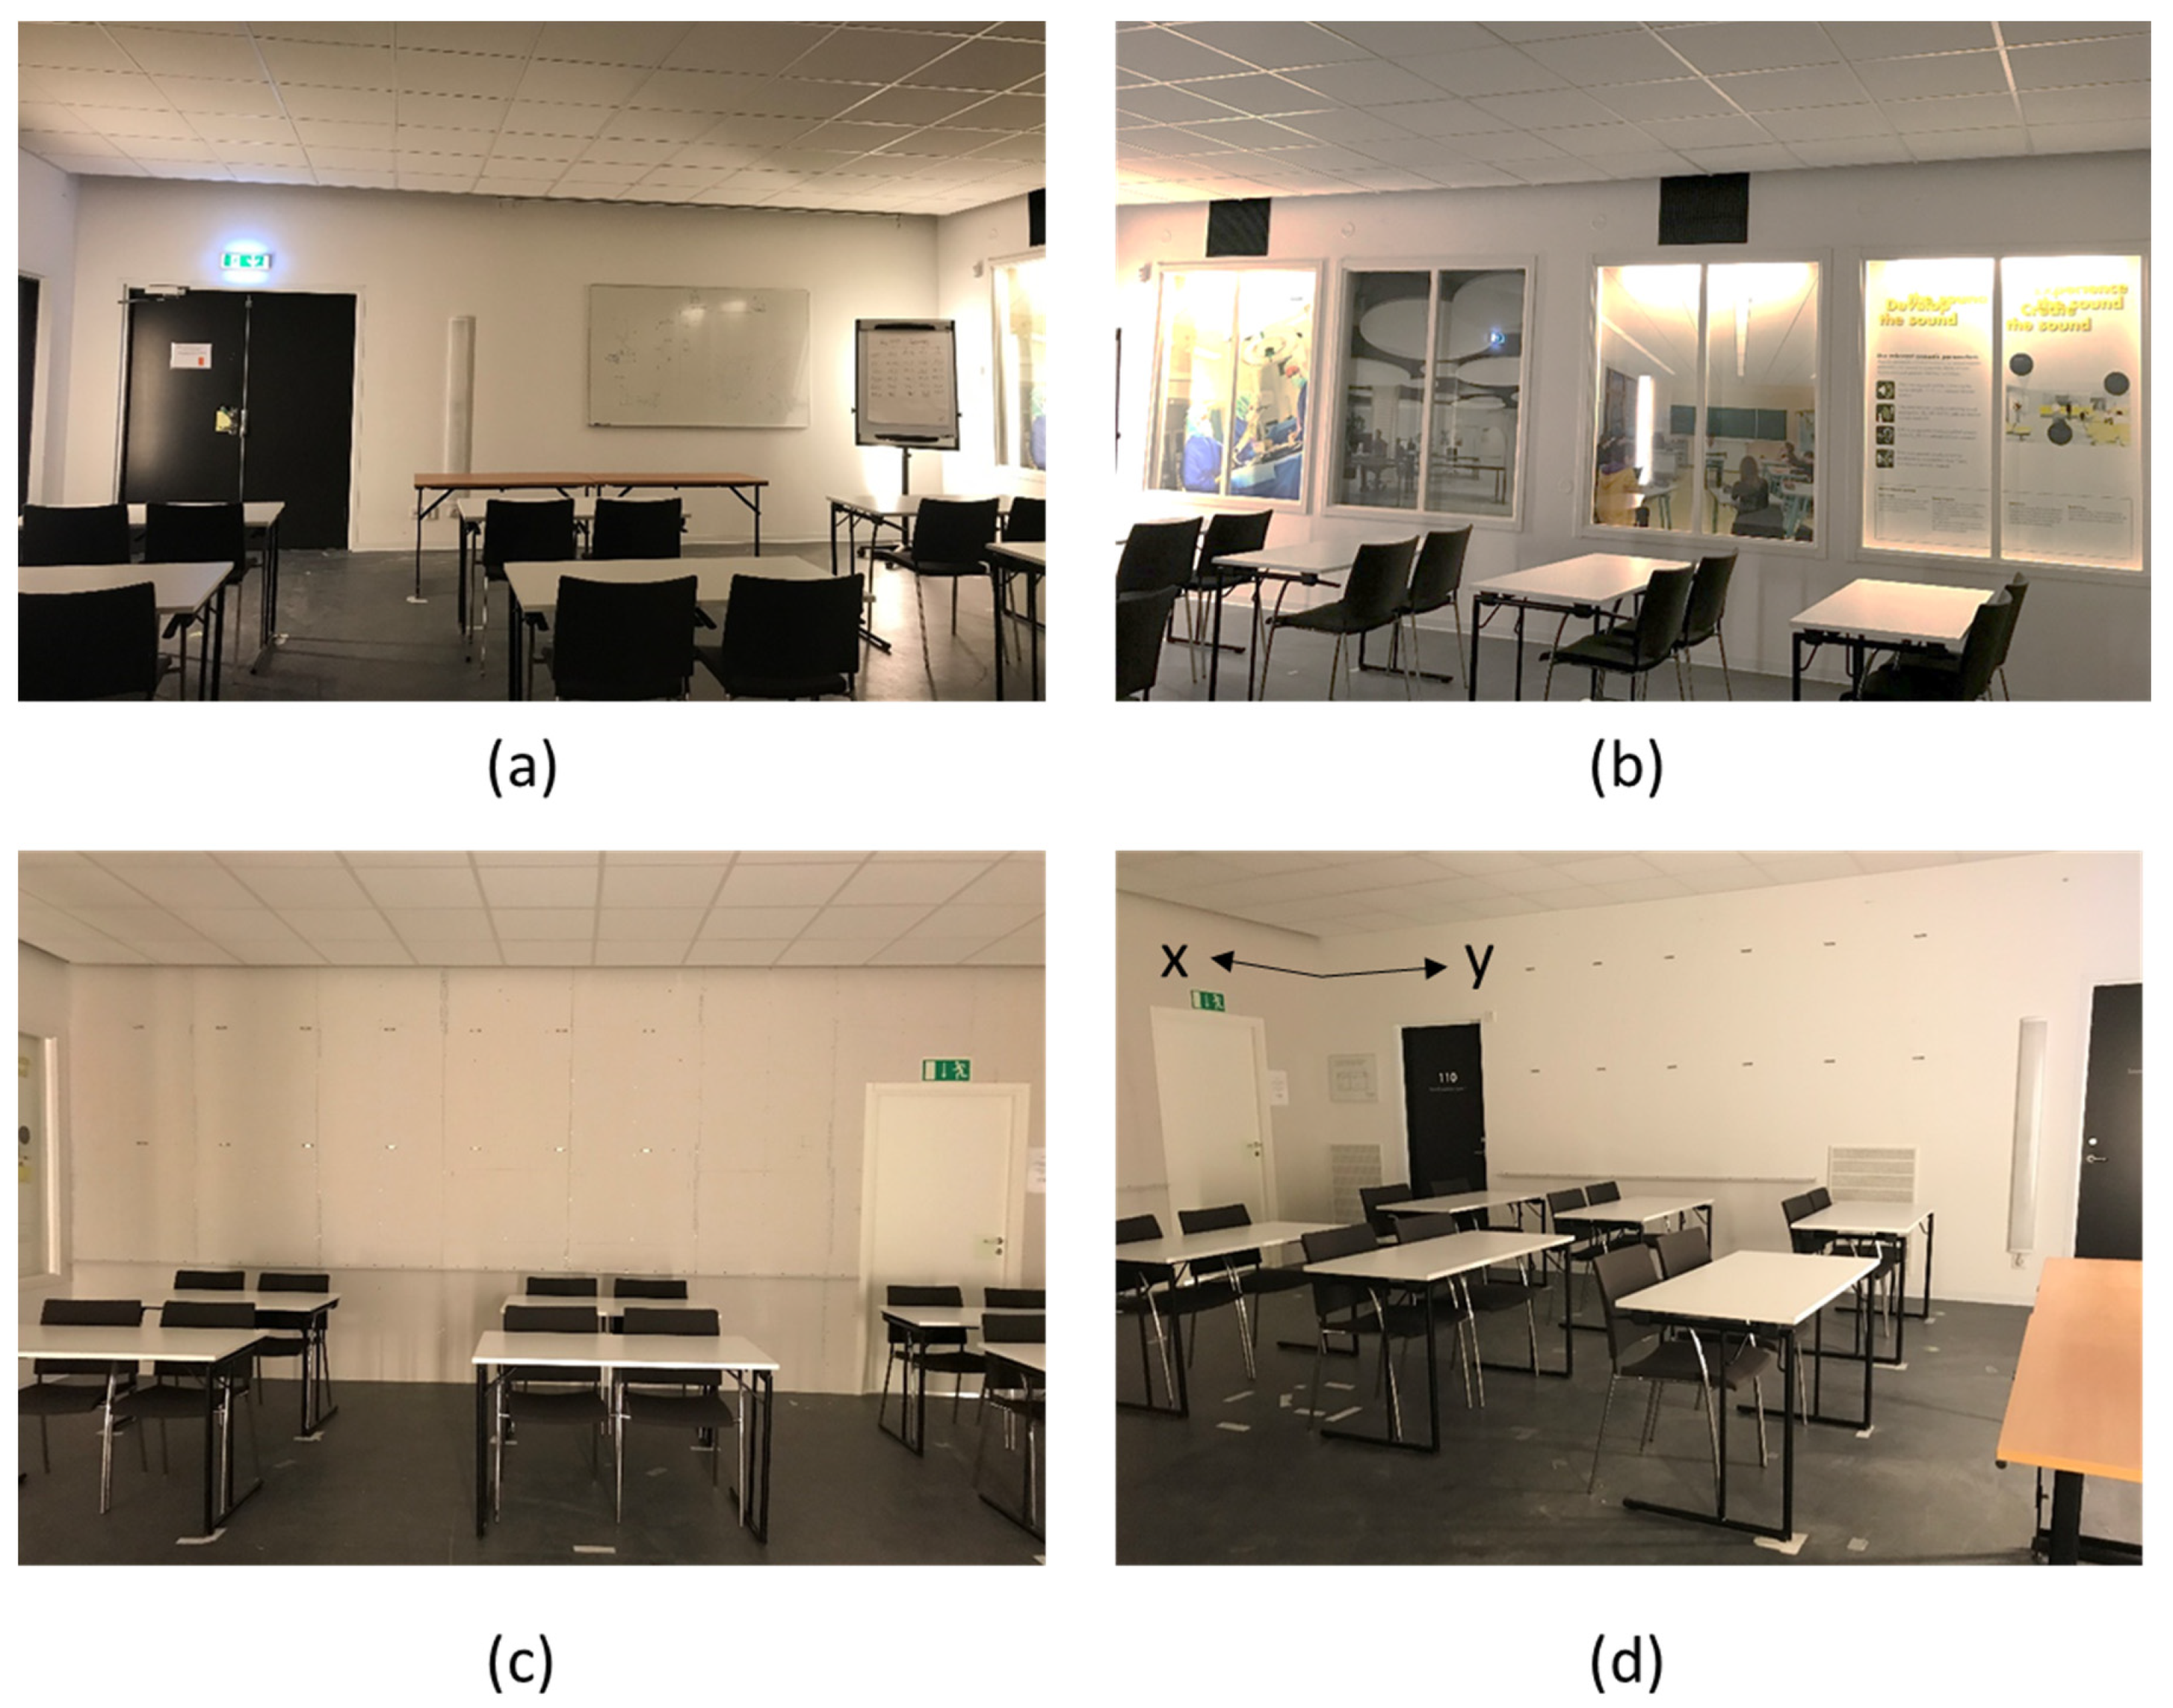
Figure 1. The room has a concrete soffit, linoleum floor and gypsum walls. One of the walls represents a facade with three windows included. There are doors on the other walls, see
Figure 2.
The room of 55 m
2 was furnished with 11 tables and 18 slightly upholstered chairs, but no other furniture. The room was equipped with a whiteboard, a flip board screen and luminaires on the walls (see
Figure 2).
2.2. Room Acoustic Parameters and Measurements
The room acoustic parameters evaluated are sound strength (G) Equation (1), speech clarity (C
50), Equation (2) and reverberation time (T
20). Measurements were performed using the DIRAC system (DIRAC type 7841, v.6.0). G was measured using a constant sound power source placed on the floor. An exponential sweep signal was used as excitation for evaluation of C
50 and T
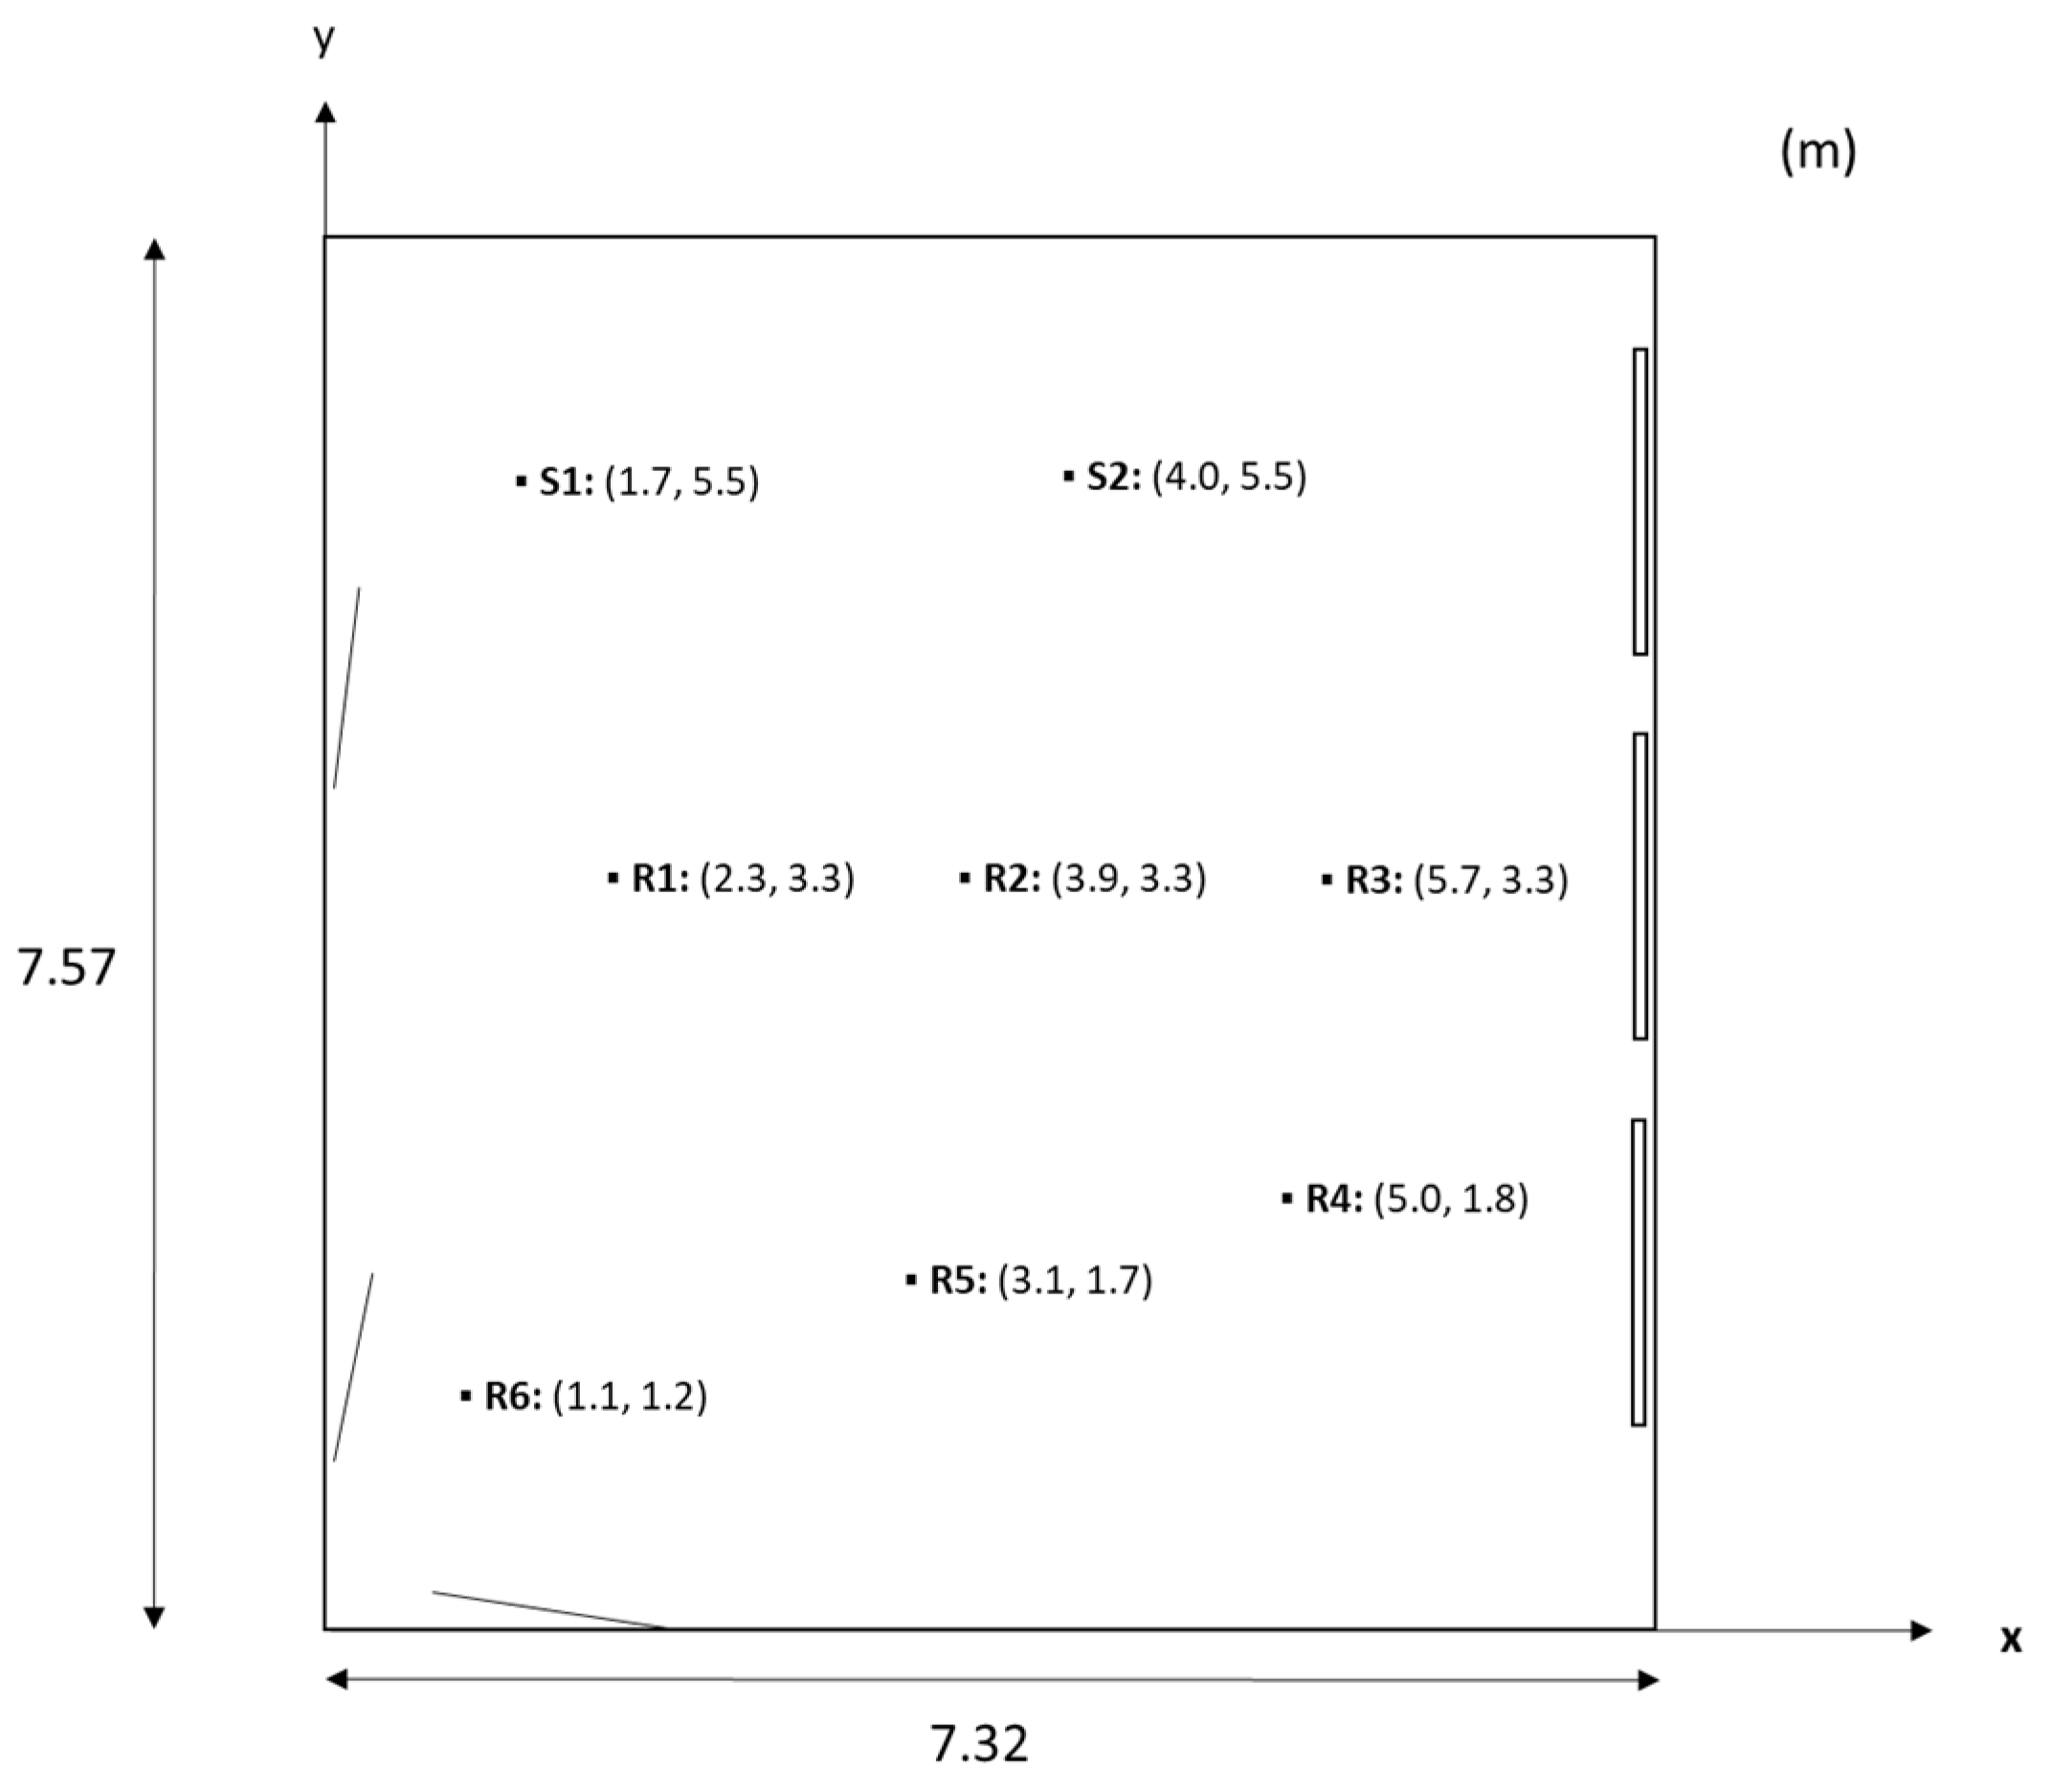
20. In the latter, an omnidirectional loudspeaker with dodecahedron geometry was used. The center of the loudspeaker was at 1.55 m from the floor. An omnidirectional microphone was used as a receiver at 1.20 m from the floor. Two source positions and six receiver positions have been used; for positions see
Figure 3.
Sound strength G is defined as
Speech clarity C
50 is defined as
where
h(
t) is the impulse response; h
10m is the impulse response at 10 m in a free field.
In both speech clarity and sound strength, the early reflections are included. When evaluating T20, according to ISO 3382-2, the evaluation interval is −5 to −25 dB, given that the early reflections are excluded. The evaluation concerns octave bands in range 125–4000 Hz averaged over source and microphone positions.
The measurements were performed over the course of two days, with stable temperature and humidity conditions. It was secured that there was no influence of background noise in the measurements.
2.3. Repeatability Test of Measurement Method
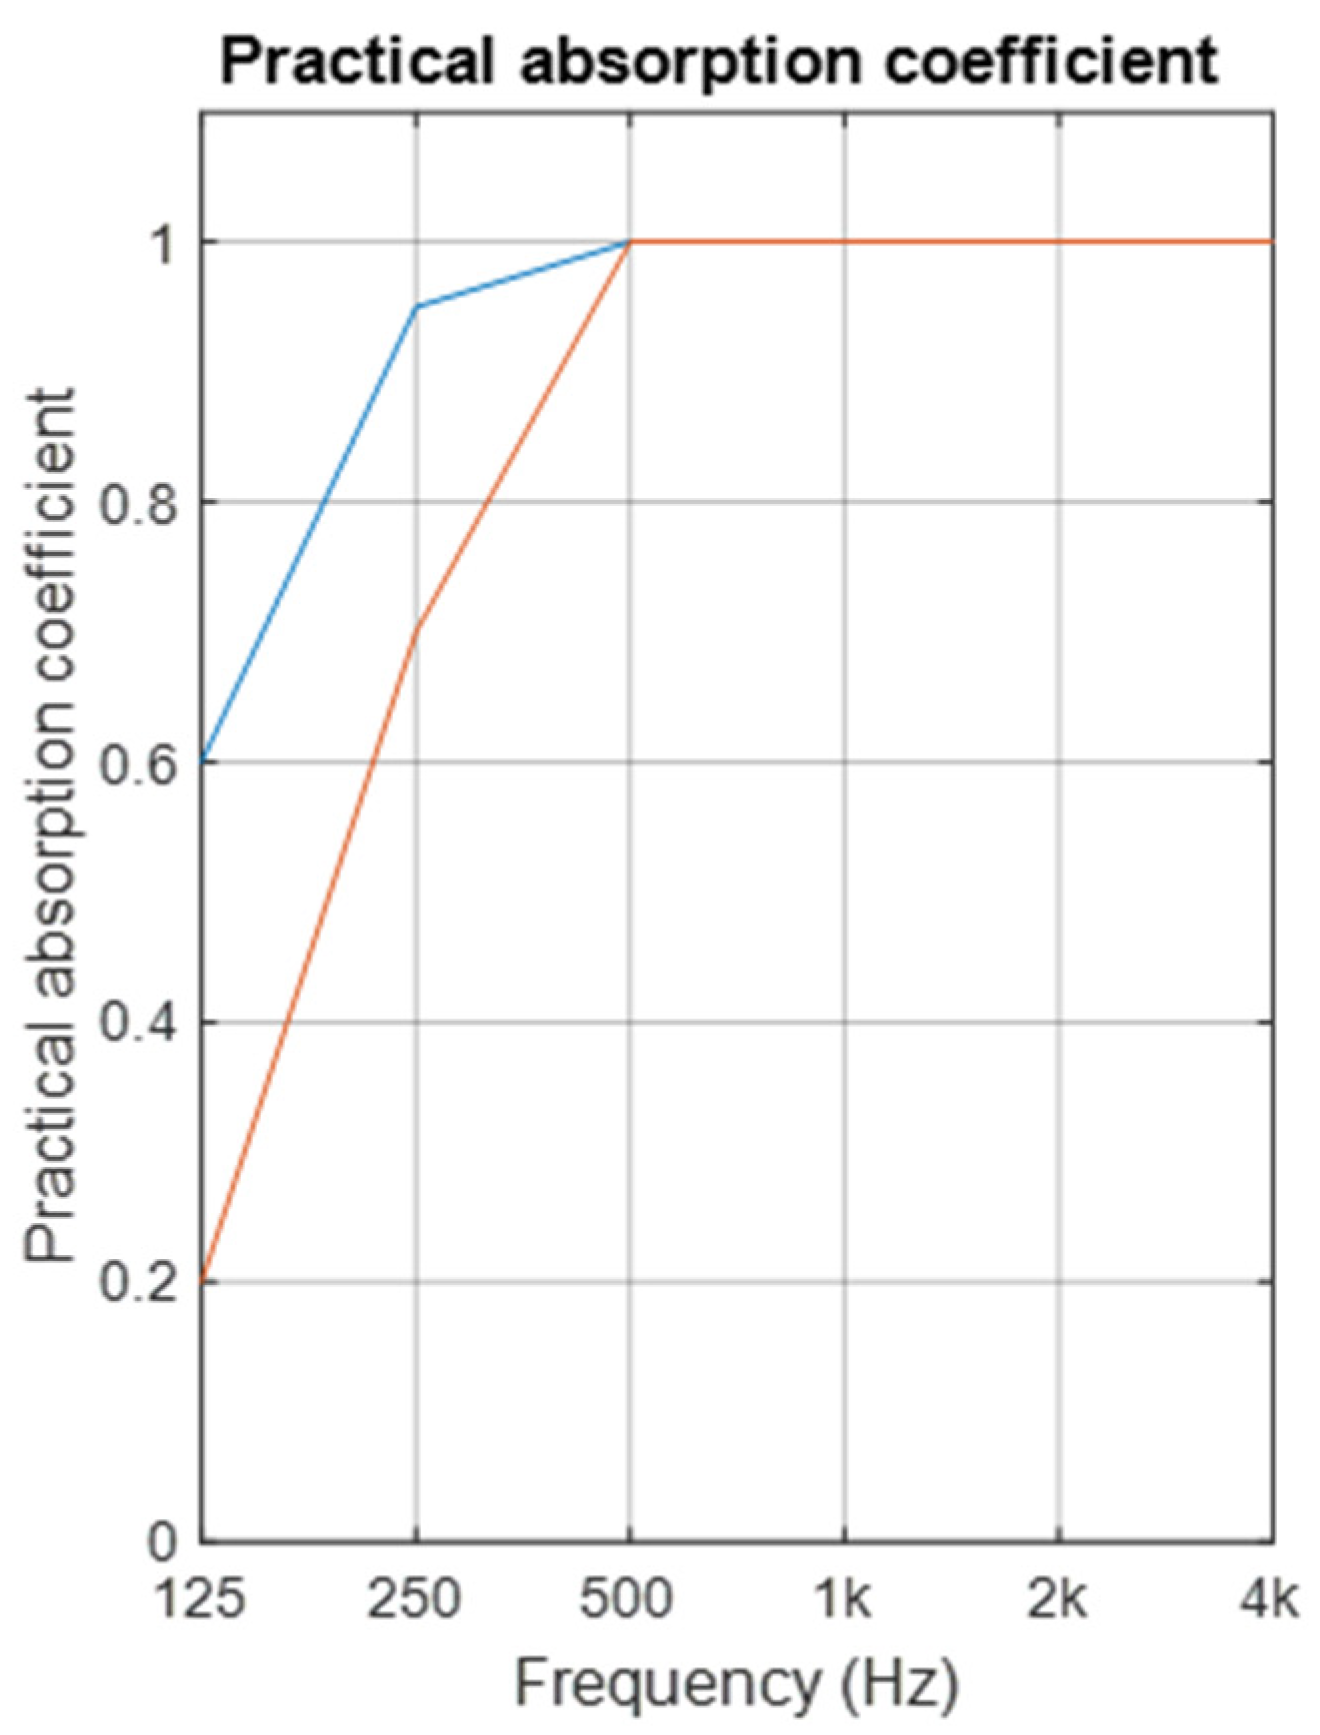
A repeatability test for the measurement procedure used was performed. Impulse response measurements in the classroom mock-up, shown in
Figure 2 were repeated five times. The room was furnished and had a suspended absorbent a ceiling. The practical absorption coefficients for the ceiling are shown in
Figure 4. Between each measurement, the equipment i.e., the loudspeaker and the microphone, was taken out from the room and reinstalled at different positions. Further, the loudspeaker was rotated, as this too can influence the measurements [
37]. The measurement was performed during the course of one day. Temperature and humidity were kept stable during the measurement procedures. However, with regards to the loudspeaker, it was always located at the front of the room in the vicinity of the teacher’s desk. Two loudspeaker positions and six receiver positions for each loudspeaker position were used. Thus, a total of twelve observations were collected for each measurement. The loudspeaker and microphone were always at least one meter from the surrounding walls, and the receiver positions were no less than two meters from the loudspeaker.
The purpose of the repeatability test was to establish the variation in the
averaged room acoustical parameters reverberation time T
20, speech clarity C
50 and sound strength G, when averaged over the twelve combinations of loudspeaker and receiver positions. Knowing this variation gives an indication of the measurement procedure’s influence when comparing different scenarios of acoustical treatment and the significance of the results. The spatial variation over positions, see
Appendix A, are naturally much larger than the variation of the averaged values in the repeatability test. It can, however, be noted that the spatial variation in rooms with ceiling treatment probably differ from what is expected under diffuse field conditions [
38].
The repeatability test was performed for the basic configuration, i.e., the classroom with the furniture and ceiling treatment in
Figure 4. The results of the five measurements of T
20, C
50 and G are presented in
Table 1. The standard deviation for each pair of possible combinations, i.e., ten different combinations, from the five measurements was calculated and averaged. These results are also shown in
Table 1 with the relative standard deviation is presented in the last column. Assuming normal distribution, an approximate uncertainty limit corresponding to a 95% confidence interval is presented in
Table 2.
It is concluded that the variations in repeated measurements are less than just noticeable differences (JND), according to ISO 3382-1. This supports the discussion of significant differences in the measurements.
2.4. Acoustic Treatment
2.4.1. Absorbing Material
The absorbing material used in the form of ceiling panels and wall panels is a glass wool product with a thickness of 40 mm and air flow resistivity of 40 kPa*s/m
2. The practical absorption coefficient, α
p, for the material according to ISO 11654 [
39] can be seen in
Figure 4 below. The absorption performance is shown for overall depth (ODS) 200 mm, according to specification in standard as well as for ODS of 50 mm, which represents the behavior of the material when mounted directly on the wall. This will be explained in a further section on configurations. The weighted absorption coefficient α
w is equal to 1 for both ODS set-ups.
For evaluation of the effect of low frequency absorption, experiments were carried out with added absorption on top of the suspended ceiling. The product used was a 50 mm glass wool product with air flow resistivity of 10 kPa*s/m2 encapsulated in a plastic foil.
2.4.2. Diffusers
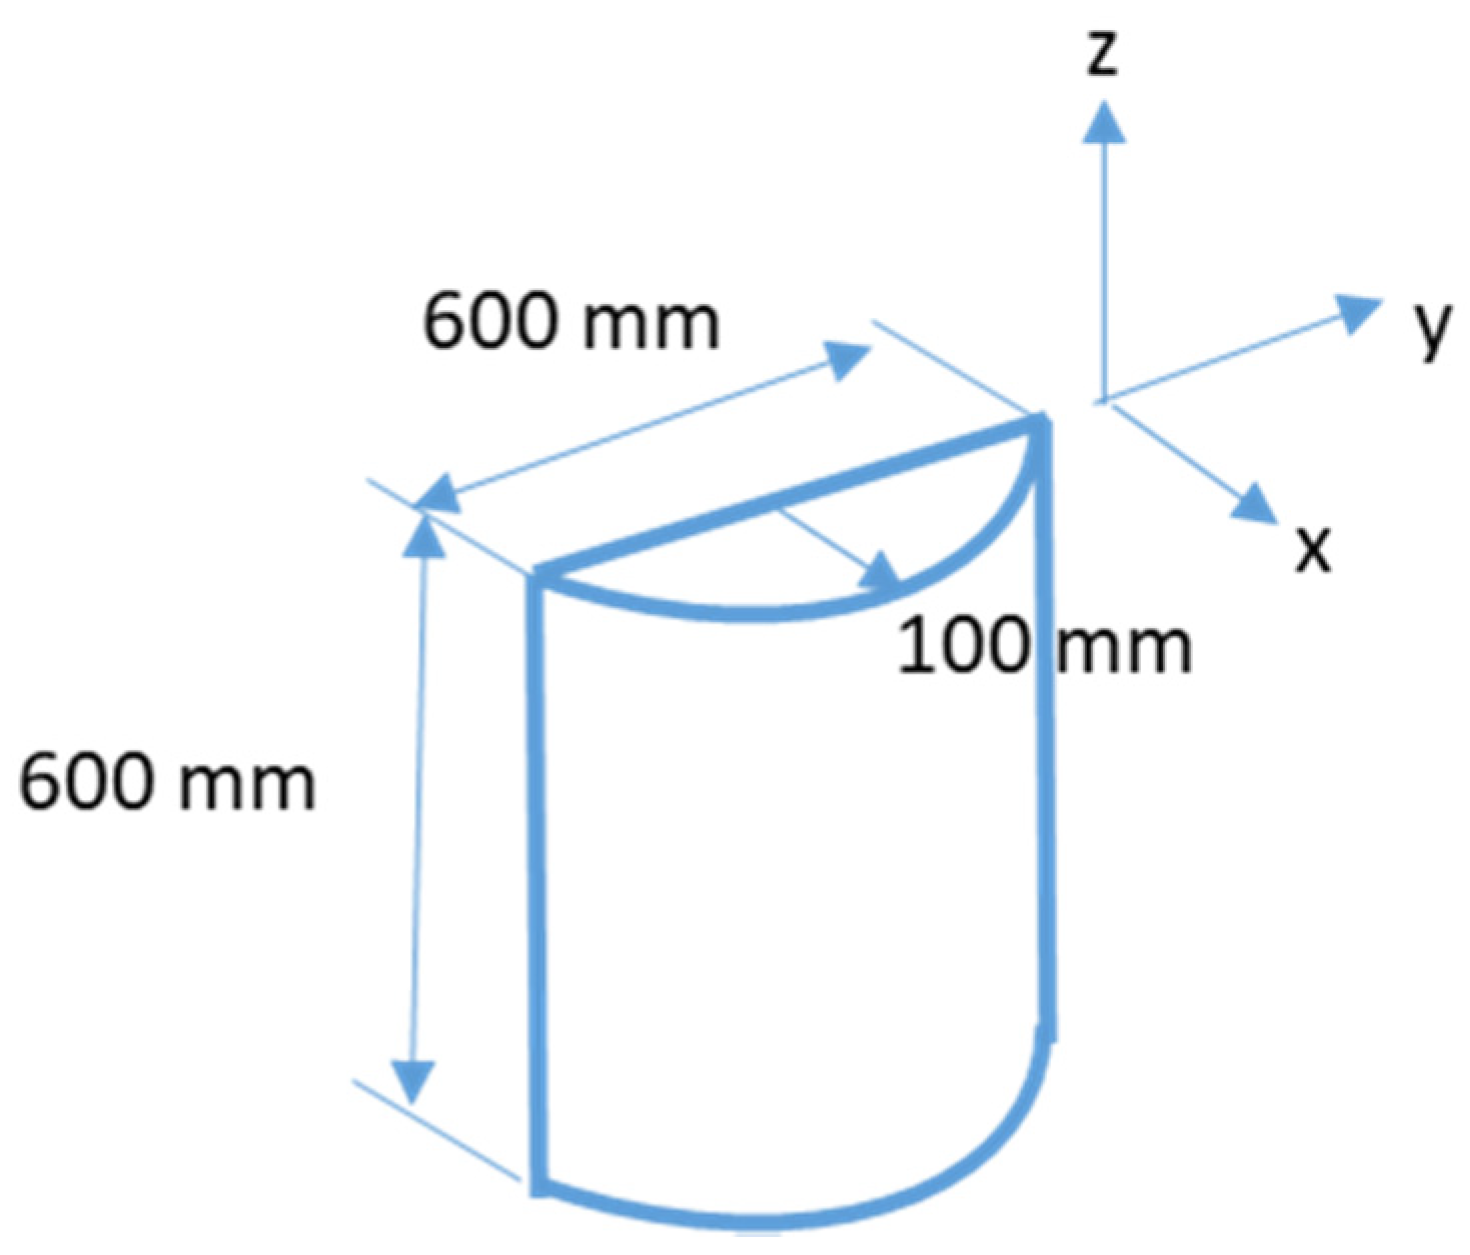
The diffusers used were made of a wood frame with a surface of a curved hardboard. All diffusers tested had the same geometry and dimensions 600 mm × 600 mm × 100 mm, see
Figure 5. Air gaps on the sides in combination with the enclosed volume gives the diffuser a Helmholtz resonance in the frequency range of 125–250 Hz.
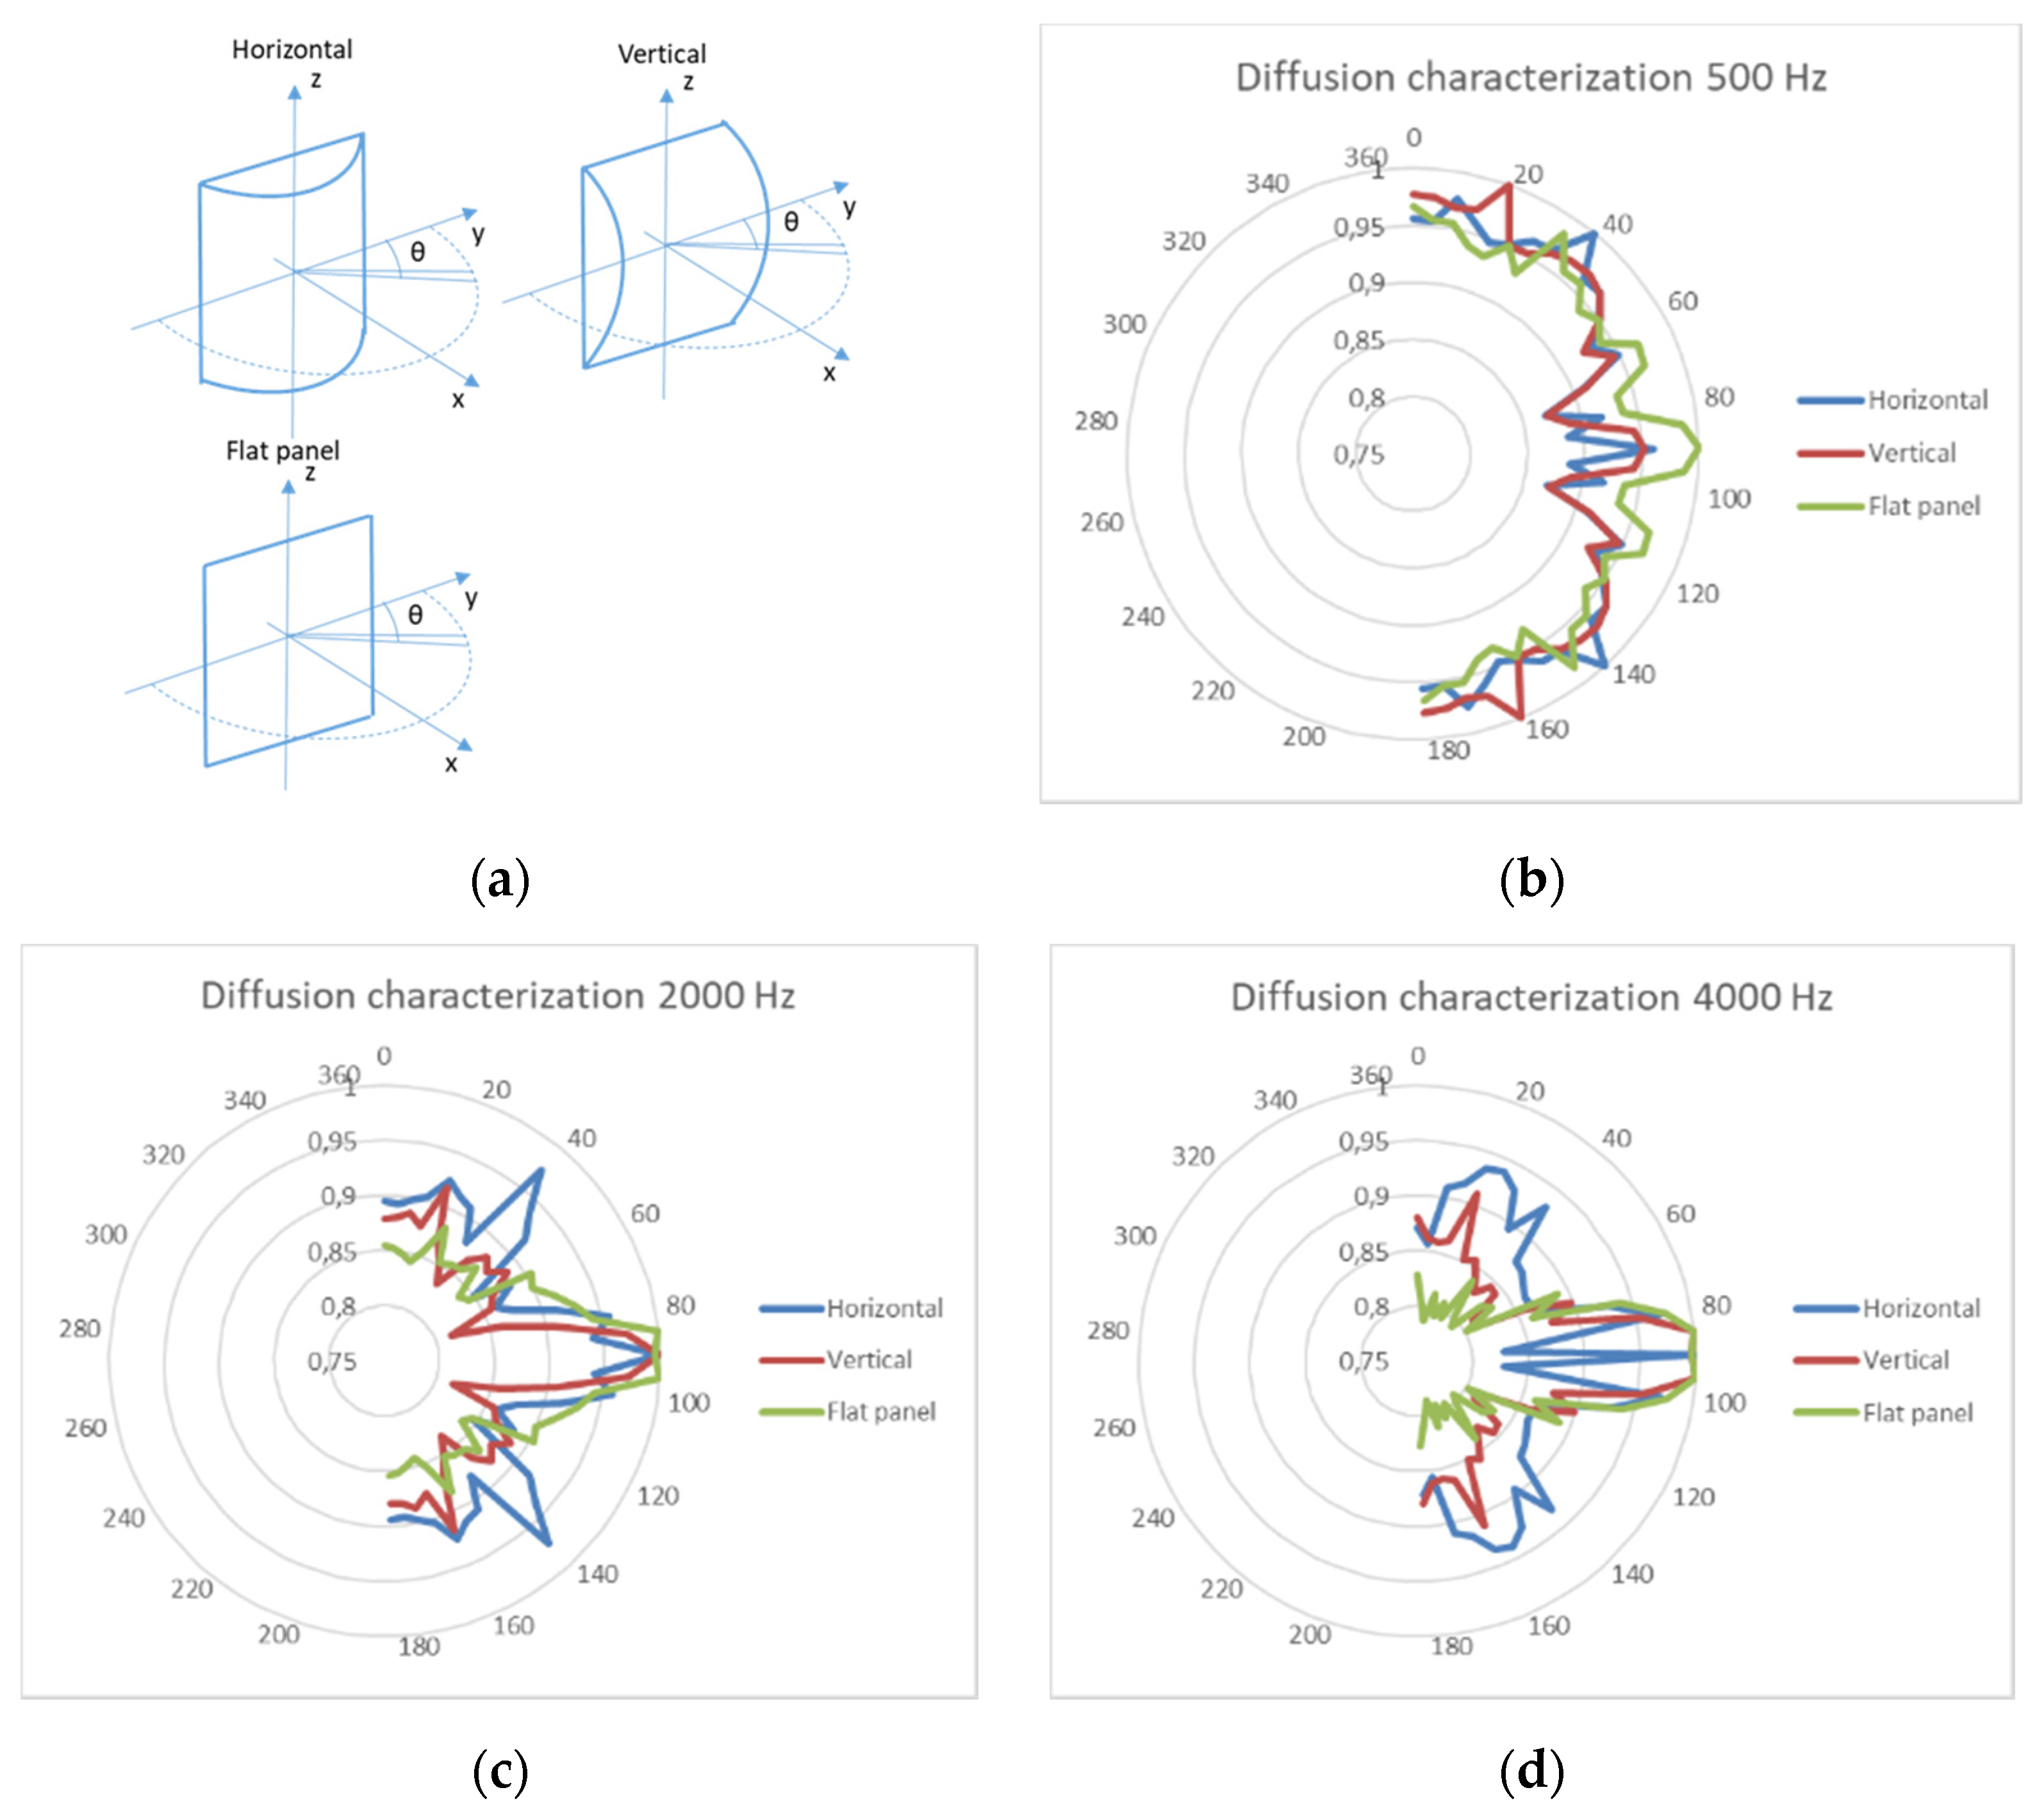
Diffusion characteristics were measured in a semi-anechoic chamber. The energy in the reflections were estimated from impulse responses using windowing techniques, excluding the direct sound. The reflections were measured for azimuthal angles (θ) 0–90 degrees.
Figure 6 presents the diffusion characteristics for 500, 2000 and 4000 Hz, and the assumption of symmetrical properties has been applied.
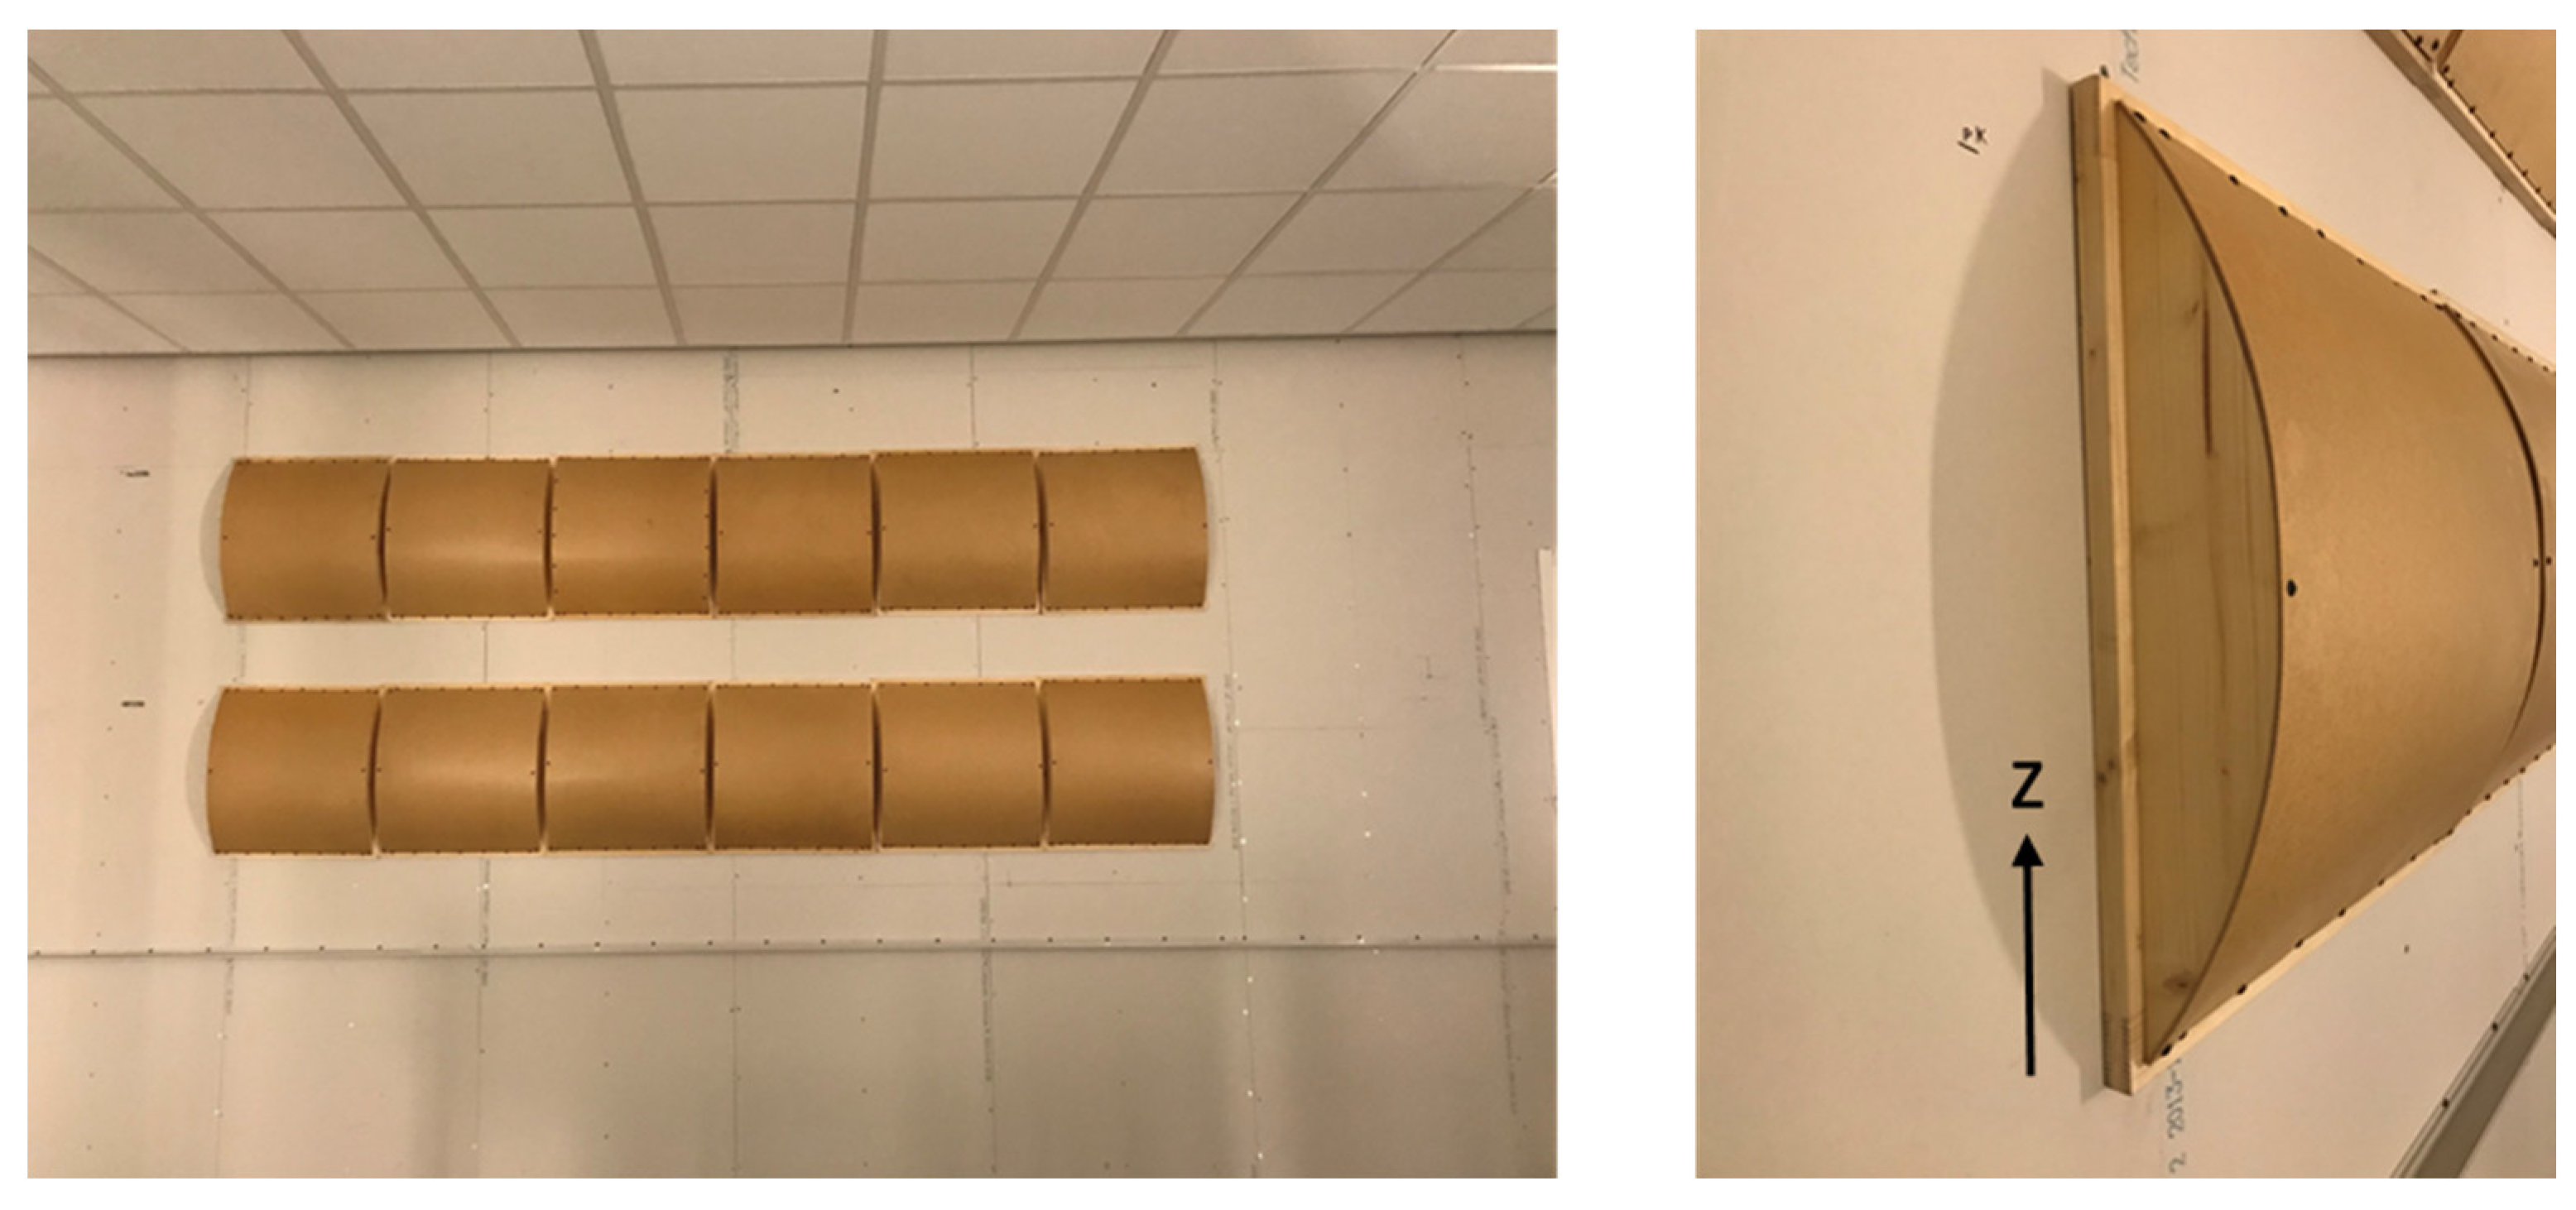
The diffusers were tested in a vertical and a horizontal direction. In the vertical the majority of sound waves were directed in z-direction,
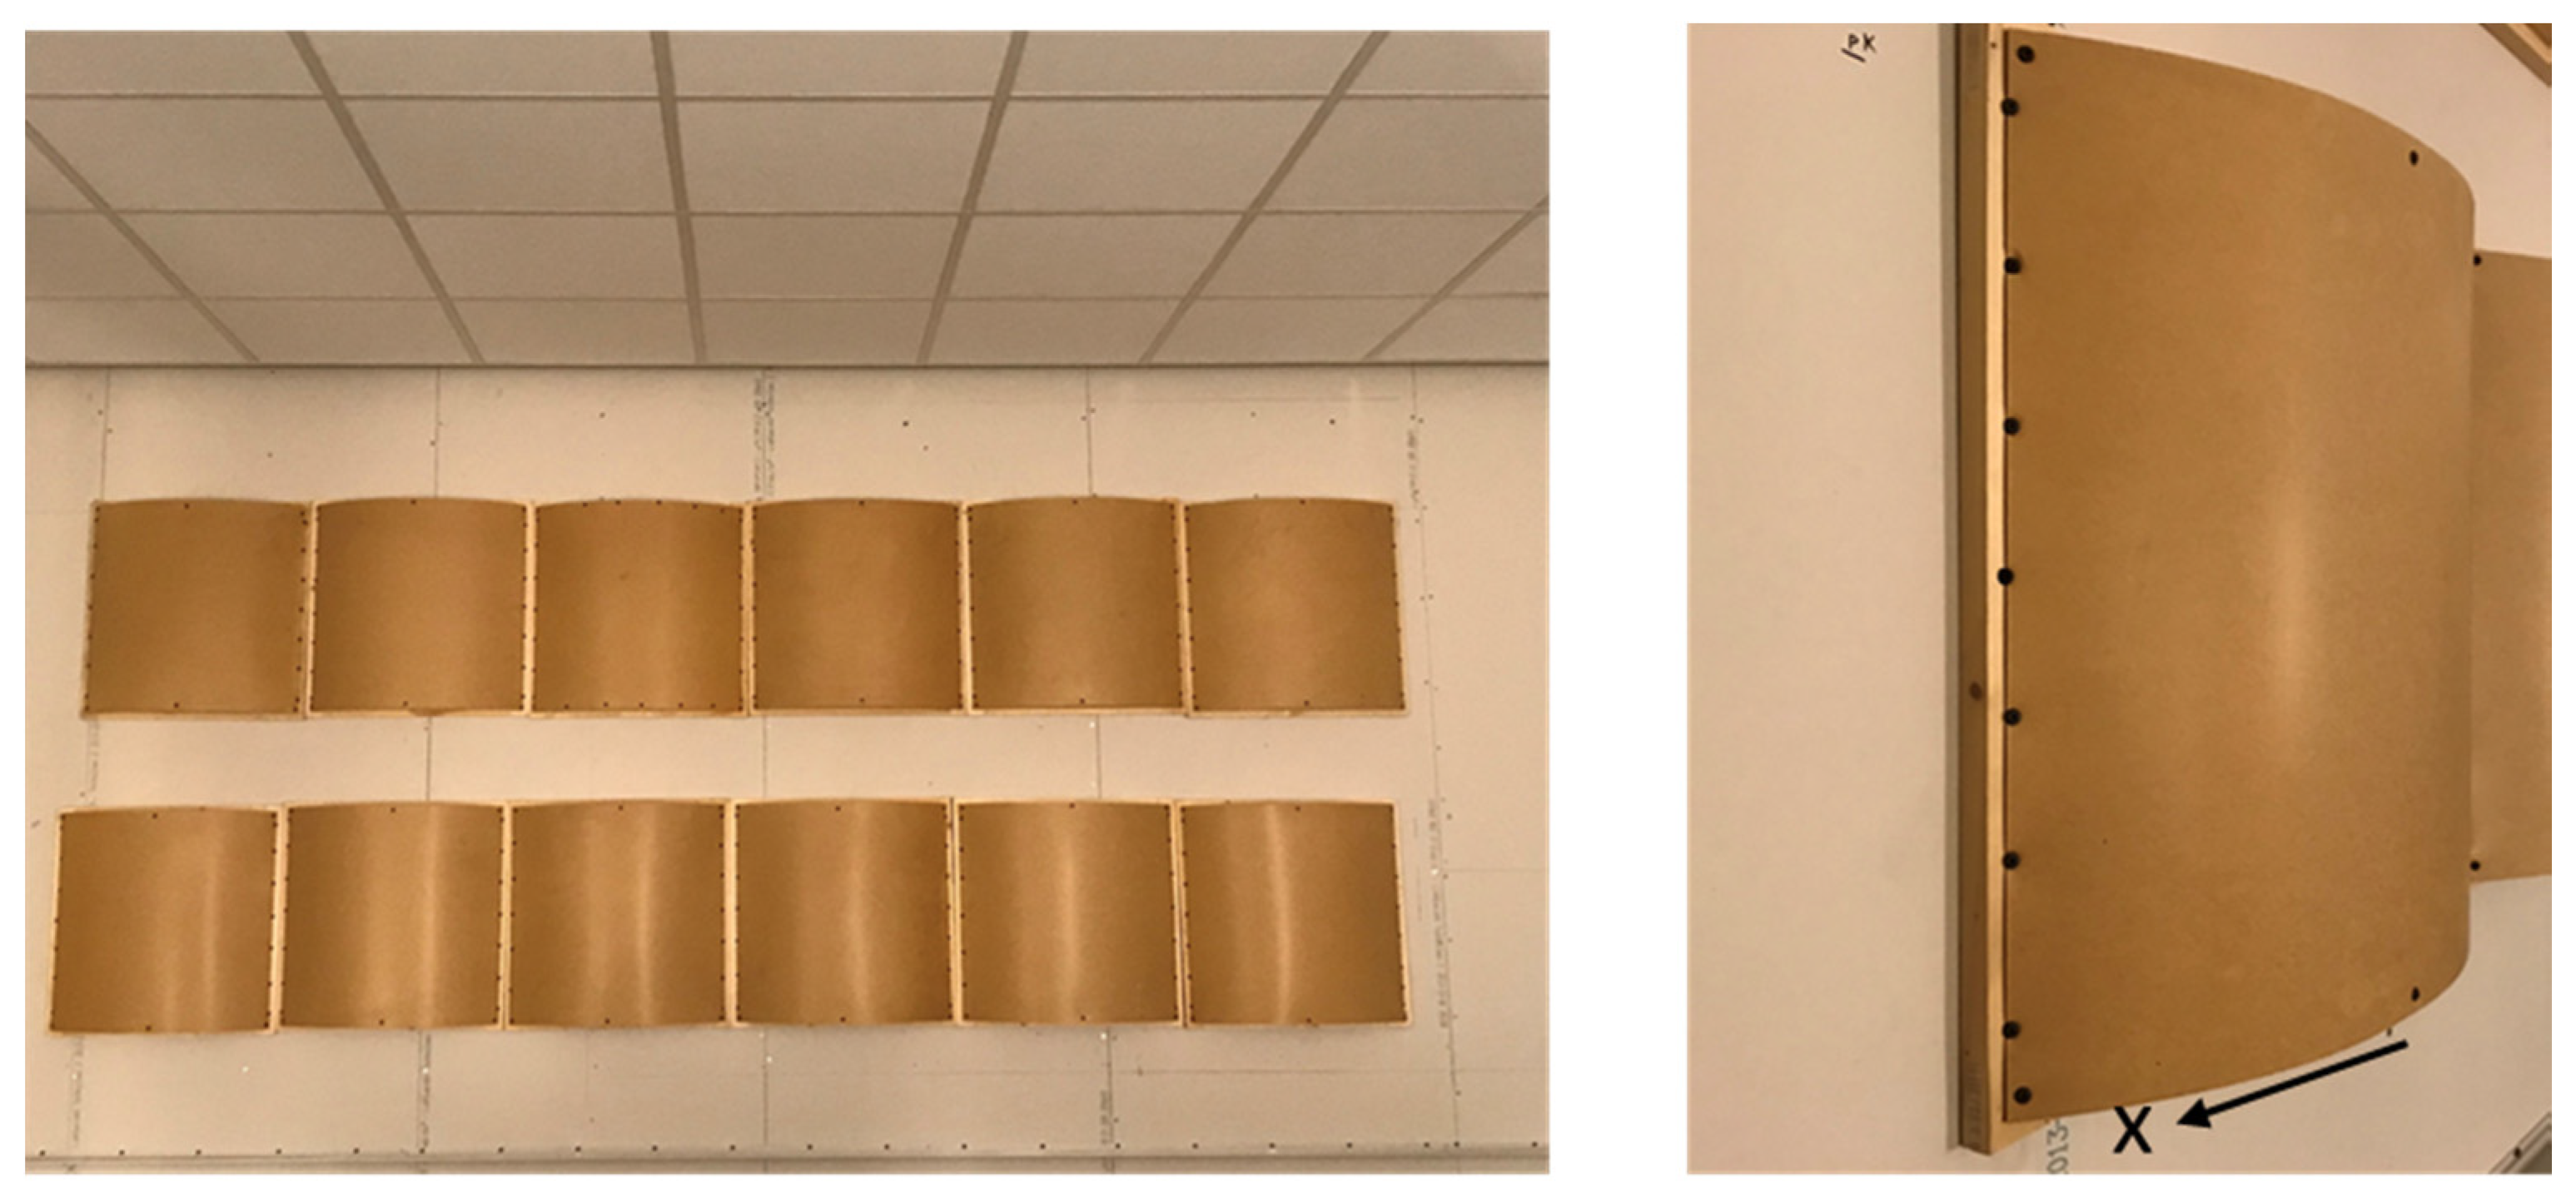
Figure 7. while for horizontal is the majority of waves directed in x-y plane,
Figure 8.
2.5. Configurations
For this experimental series, nine different configurations were tested, starting from the empty room. Thereafter, there was an absorbent ceiling, with properties according to
Section 2.4.1. added and further was the room furnished. From this configuration was different type of wall treatment added, three different configurations: absorbing material, according to
Section 2.4.1; vertically oriented diffusers, as in
Figure 7; and horizontally oriented diffusers, as in
Figure 8. Additional diffusers were installed in the ceiling. These diffusers were located in the front area of the room, i.e., in a typical speaker position. In the last configurations, low frequency absorption was investigated; Helmholtz resonance absorption by diffusers, compared to a porous absorber with properties for good absorption properties in this frequency range (see the last section of
Section 2.4.1). All configurations are described in
Table 3. For full abbreviations and definitions see Abbreviations.
3. Results
The following section is divided into four different subsections, presenting the room acoustic parameters for different configurations.
Section 3.1. represents the effect of traditional acoustic treatment and furniture.
Section 3.2. includes the effect of acoustic treatment, absorbers and diffusers, on the walls, using the diffusers in different orientations.
Section 3.3 describes how the diffusers were placed on the ceiling and
Section 3.4. includes the effect of additional low frequency absorption. The results are presented in the form of diagrams, evaluated over octave frequency bands. All values for the room acoustic parameters with the corresponding standard deviation are presented in
Appendix A.
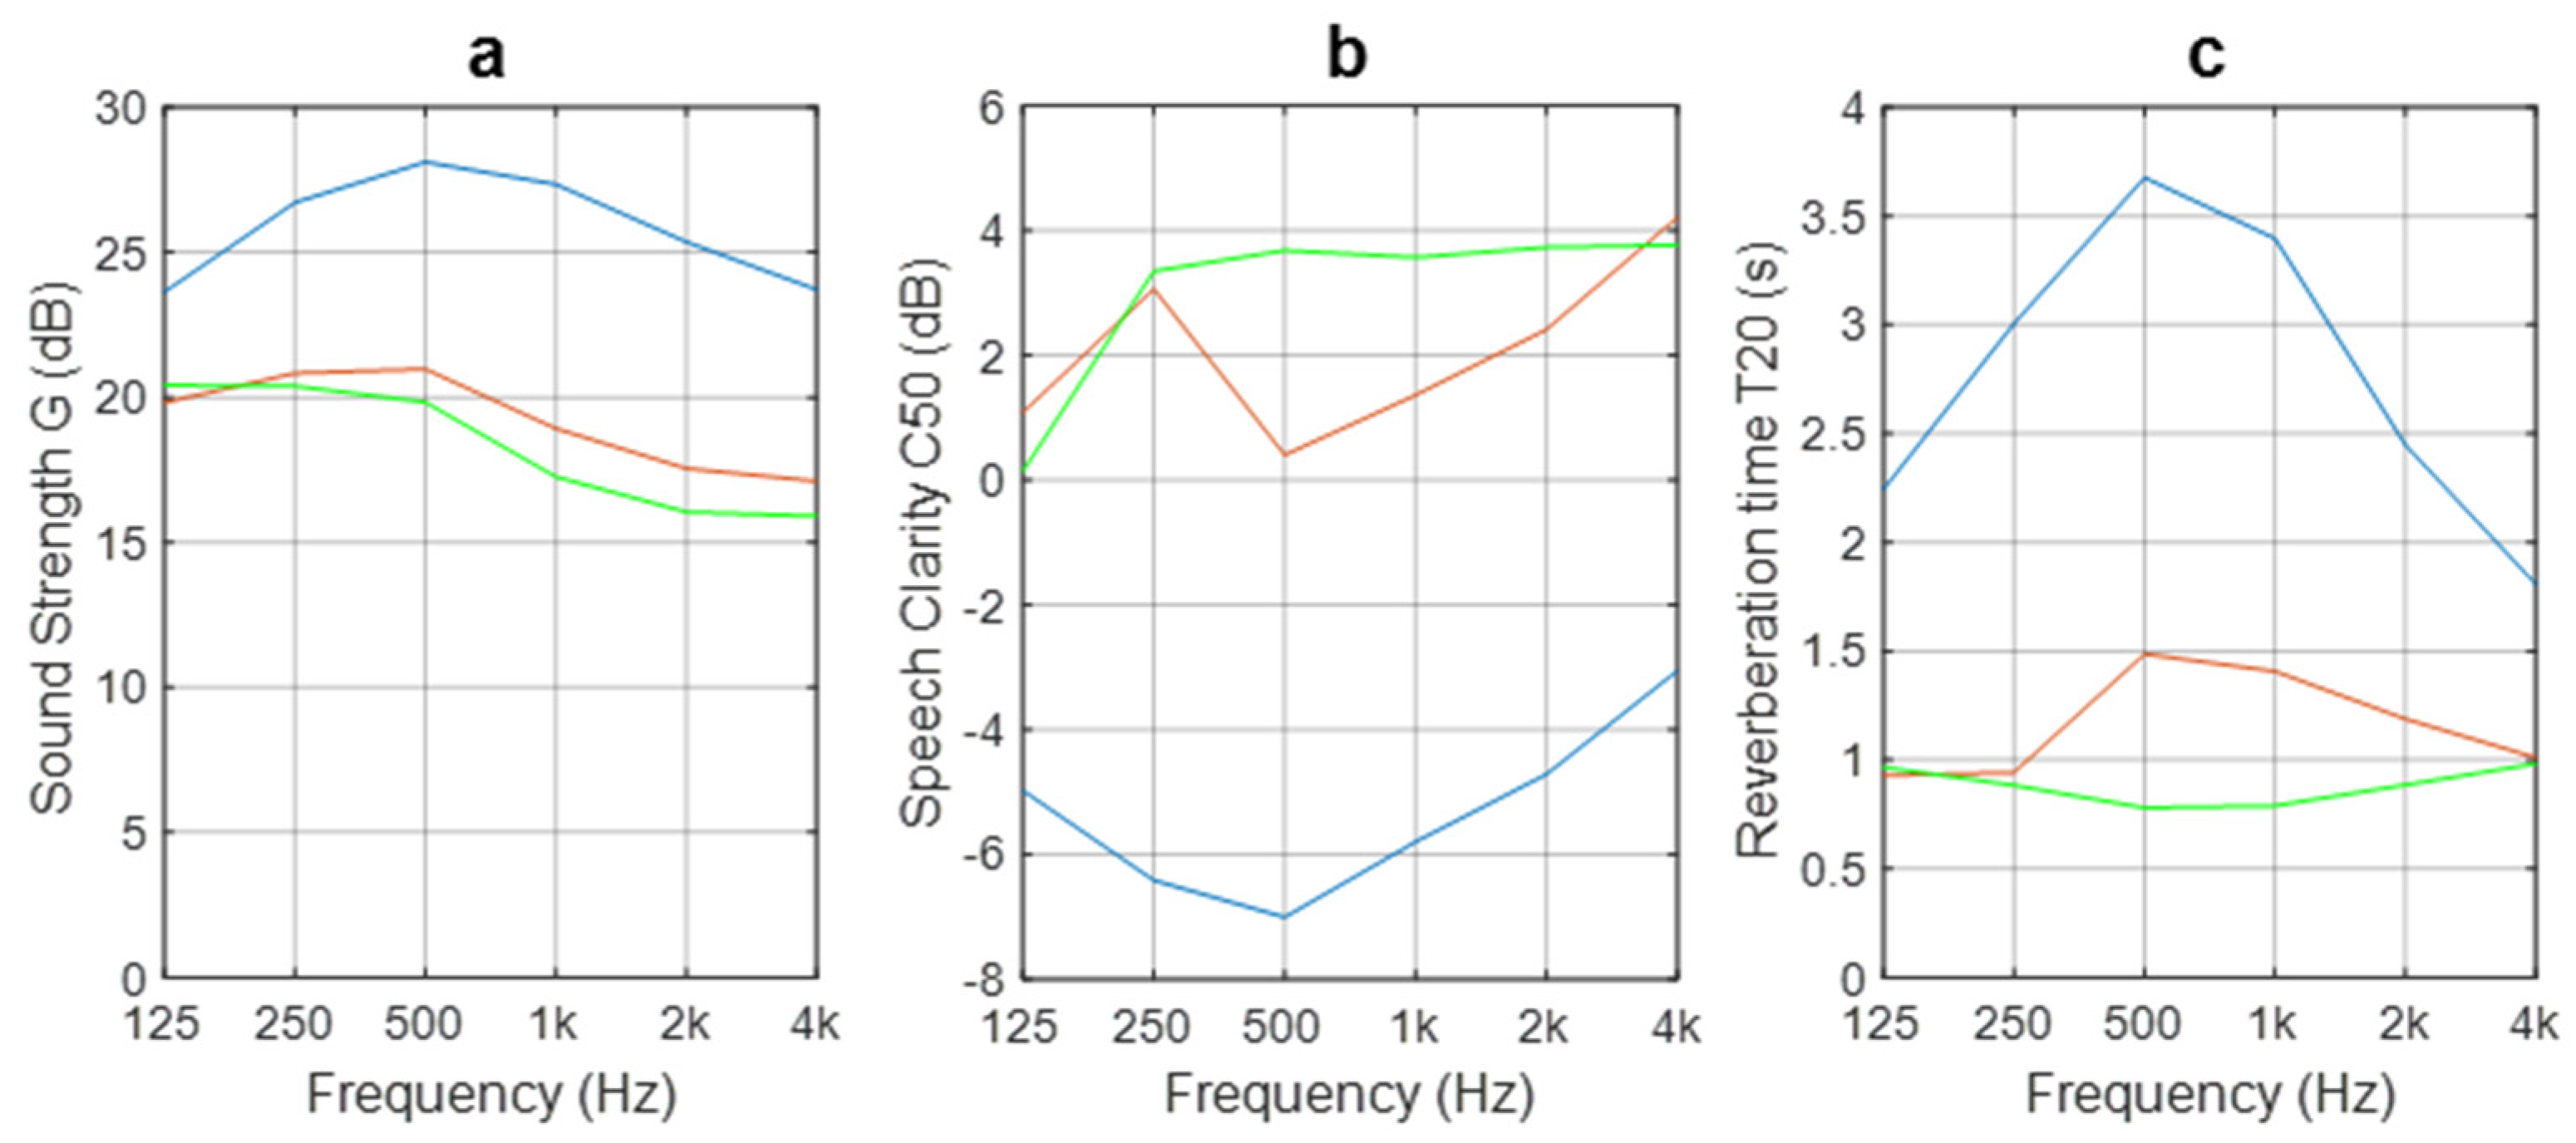
3.1. Effect of Absorbent Ceiling and Furniture
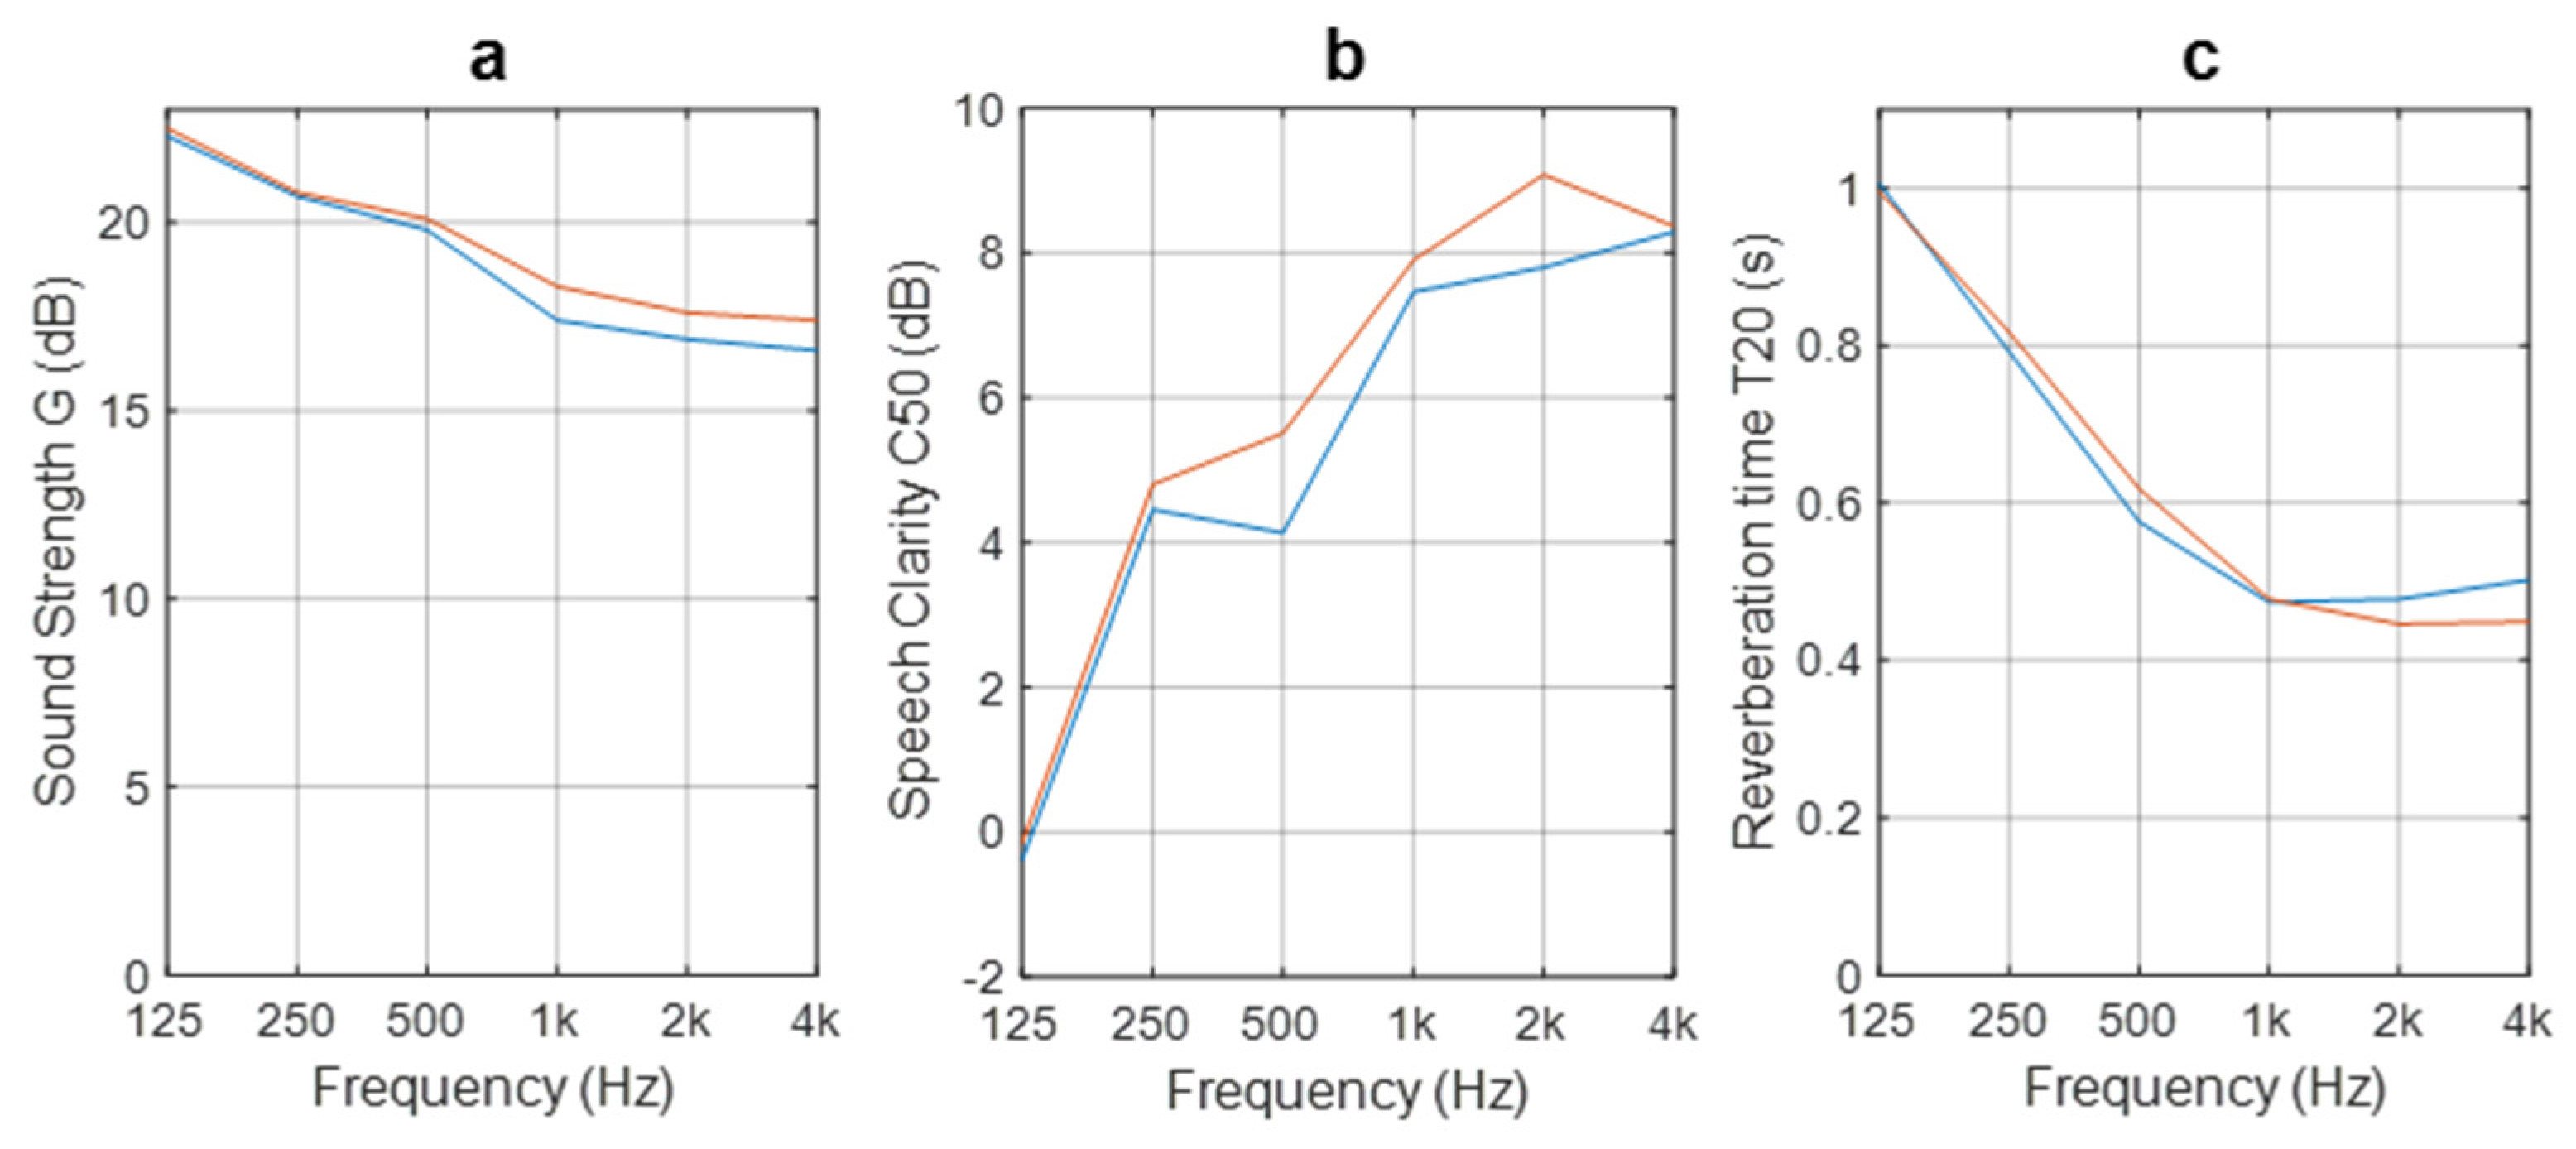
The graphs presented in
Figure 9 show the room acoustic parameters for a room without treatment (Empty), a room with absorbent ceiling (51.8CA) and a room with absorbent ceiling and furniture (51.8CA_F). For description of furnishing see
Section 2.1. Room mock-up. Comparing the empty room with a configuration using acoustic ceiling shows a clear difference for all acoustic parameters over the entire frequency range, with the strongest change from 500 Hz and upwards, which can be correlated to the acoustic performance of the ceiling (see
Figure 4). The sound strength in
Figure 9a decreases by as much as 8 dB at these frequencies, and speech clarity, in
Figure 9b, by 7 dB. The reverberation time, in
Figure 9c, decreases to approximately half the value. The reason for the short reverberation times at low frequencies, in an already empty room, is due to the fact that the surrounding walls in the classroom were lightweight walls of plaster board.
Adding furniture contributes by scattering the sound and is effective from 500–2000 Hz, with the largest differences at 500–1000 Hz, resulting in an additional change in curve shapes for the room acoustic parameters. The sound strength value is mainly dependent on the absorption area, but a decrease of about 1 dB for the frequencies 500–4000 Hz can still be found for this parameter, due to scattering and minor absorption from the upholstered chairs. It should be noted that 1 dB is considered a just noticeable difference (JND) for sound strength, according to ISO 3382-1 [
24]. The speech clarity and reverberation time is affected in a more limited frequency range, 500–1000 Hz, with significant differences. Regarding speech clarity, an increase of 3 dB is achieved at 500 Hz, and 2 dB at 1000 Hz. As for sound strength, 1 dB difference in speech clarity is considered to be JND, according to [
24]. The reverberation time decreased by nearly half at 500 Hz, from 1.5 s to 0.8 s, with less reduction at 1000 Hz and 2000 Hz, although still a noticeable difference, a decrease of 0.6 s at 1000 Hz, and 0.3 s at 2000 Hz. JND for a reverberation time is a change of 5% [
24].
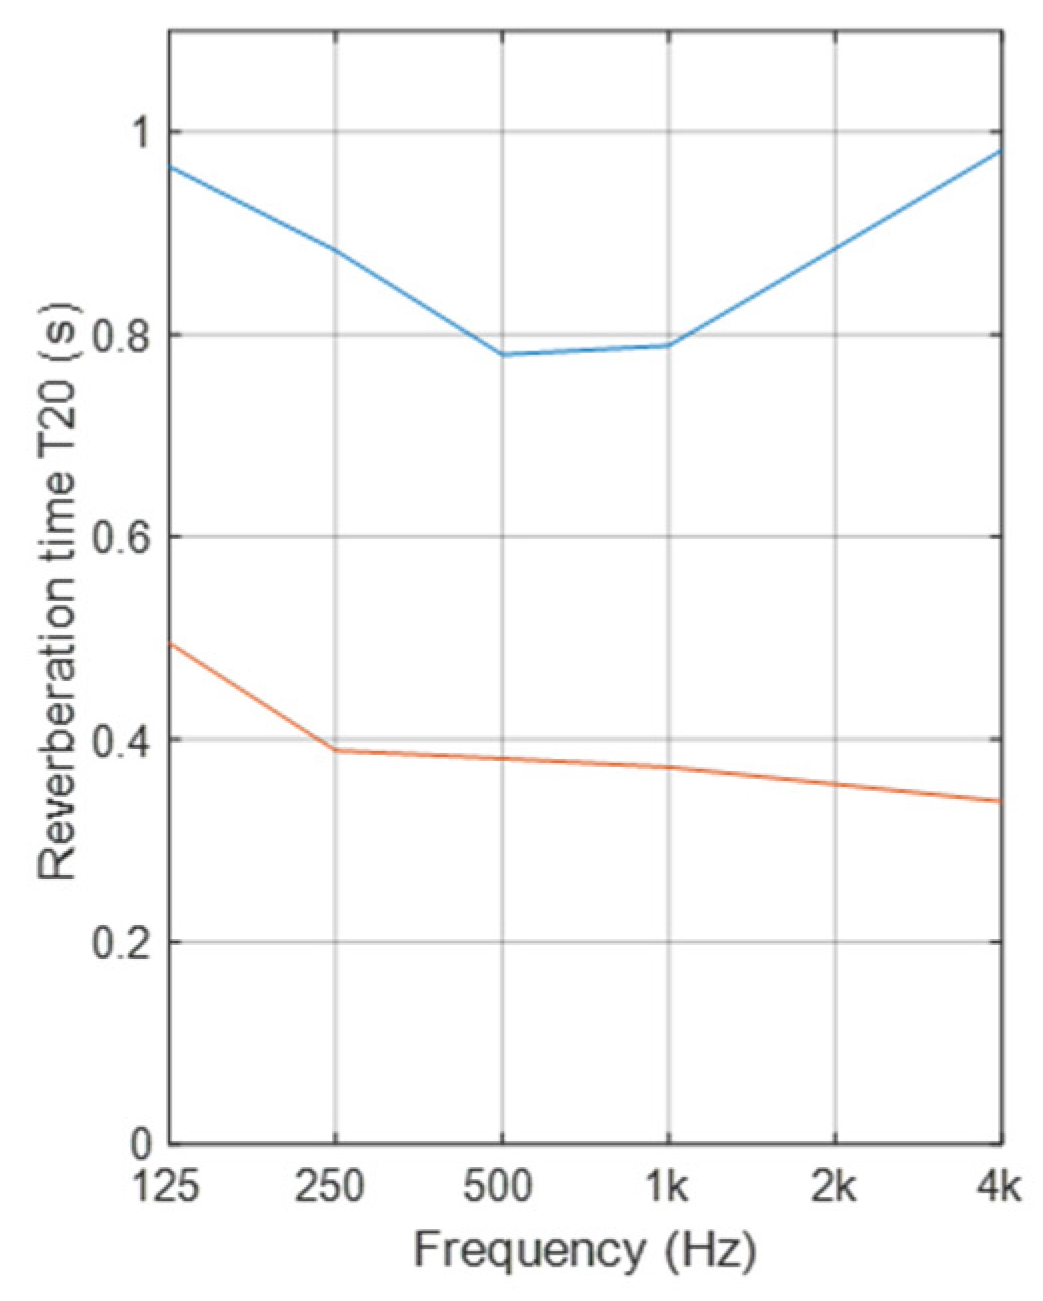
Comparing the measured value to calculation with assumption of diffuse sound field using Sabine’s formula shows substantially lower values for calculation over the entire frequency range compared to the measurement, see
Figure 10. Note also that the shape of the two curves differs. The slight increase at higher frequencies in the measured curve often appears in sparsely furnished rooms, due to the lateral reflections from walls. The frequency-dependent effect of scattering is not included in the Sabine calculation, but appears as a valley in the measured curve. Measured absorption from furniture is taken into account in the calculation.
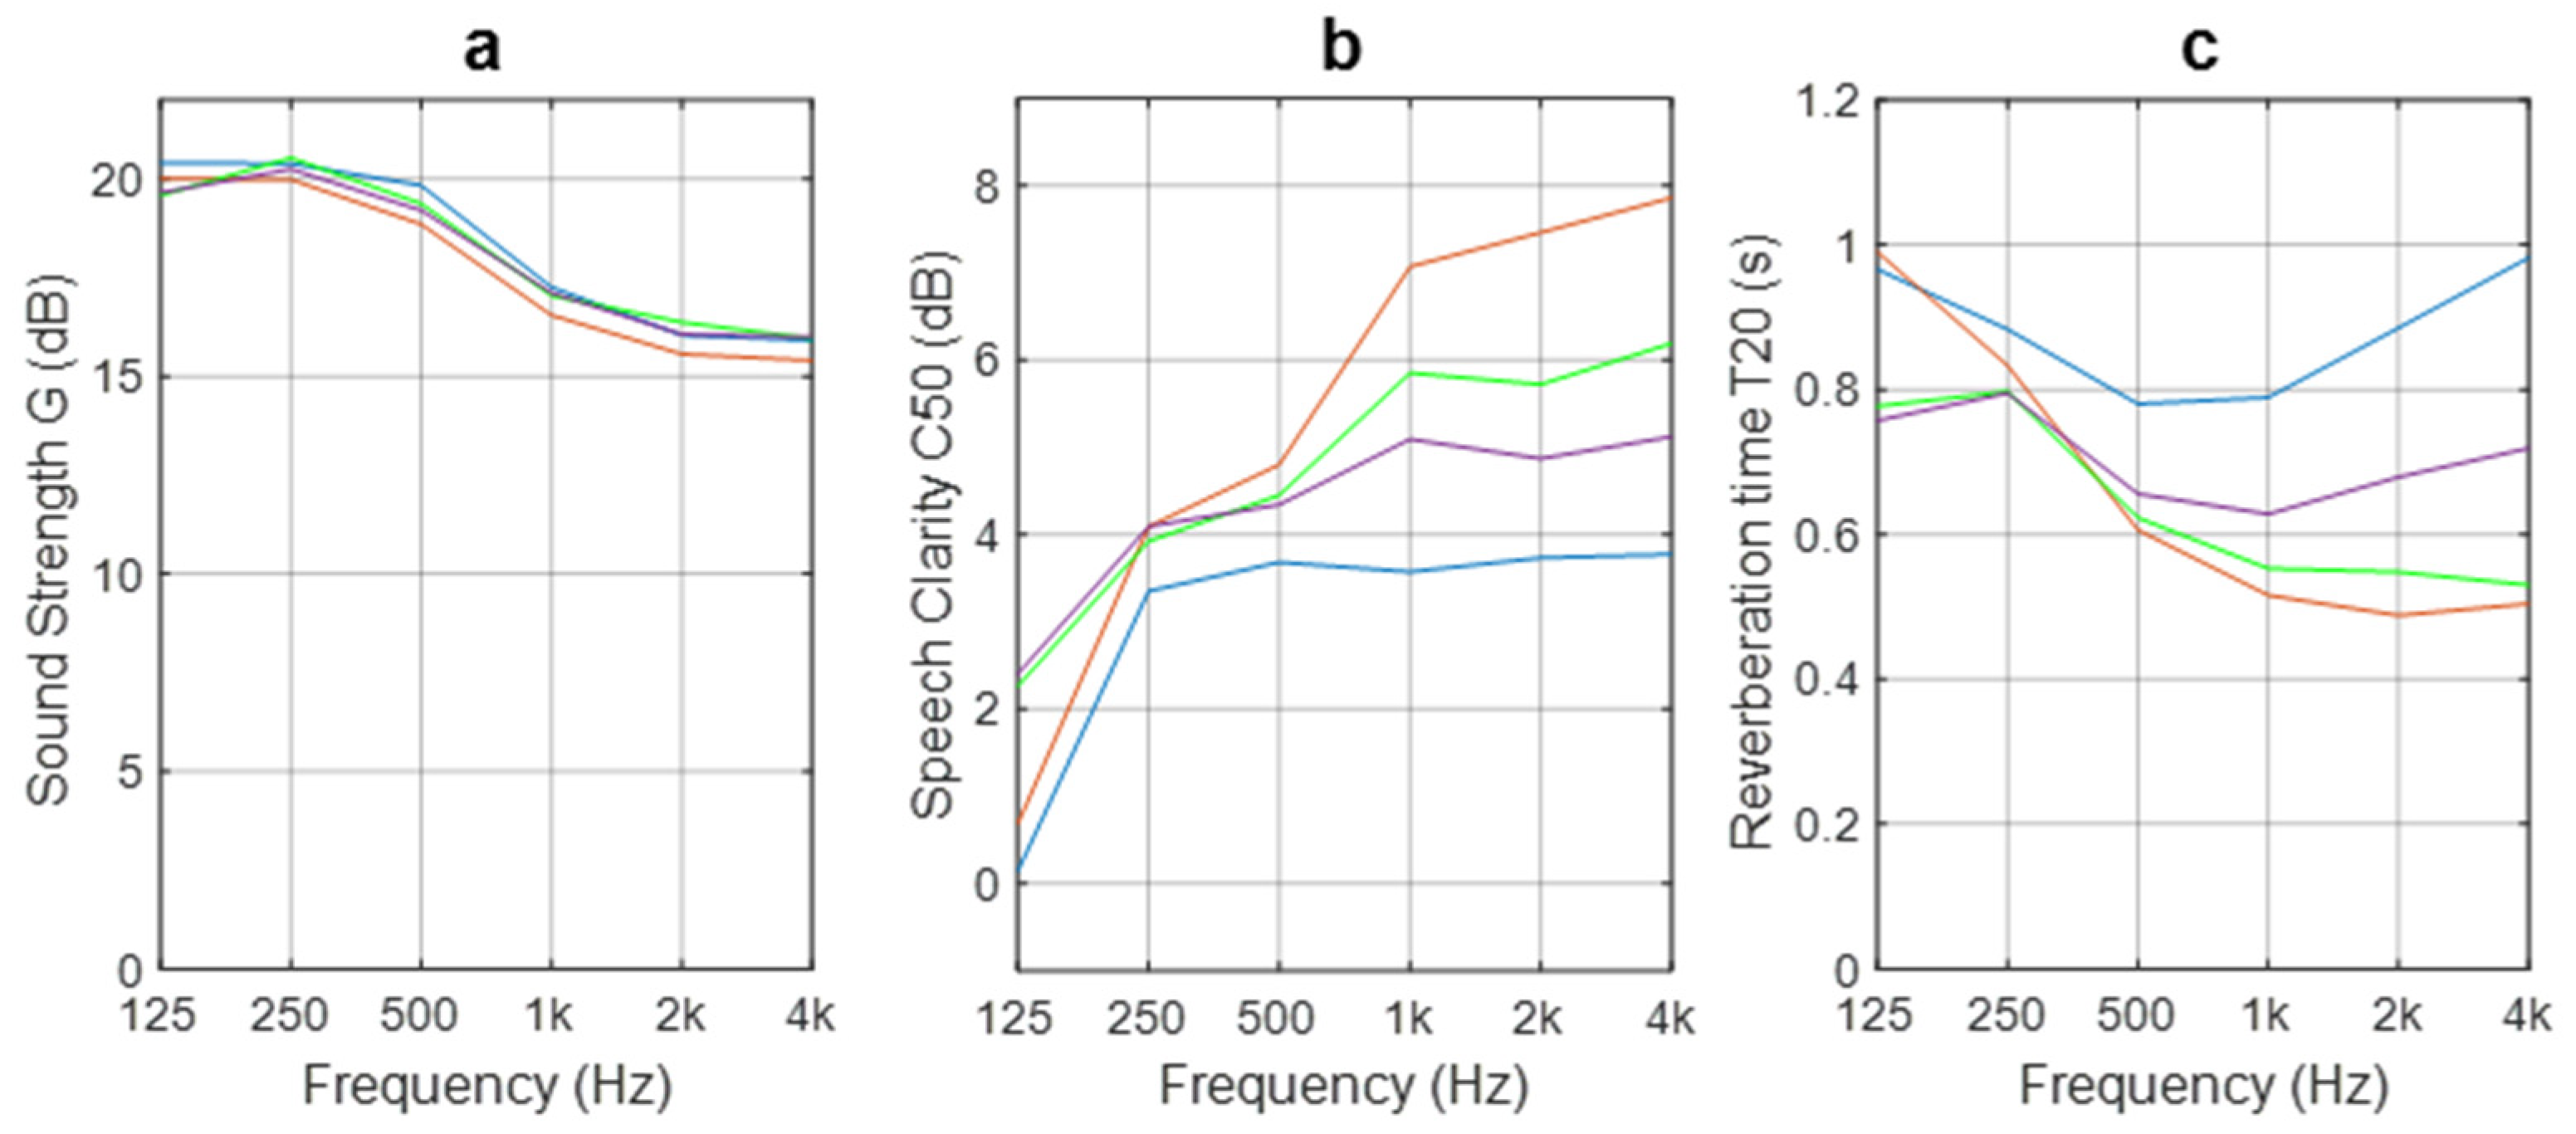
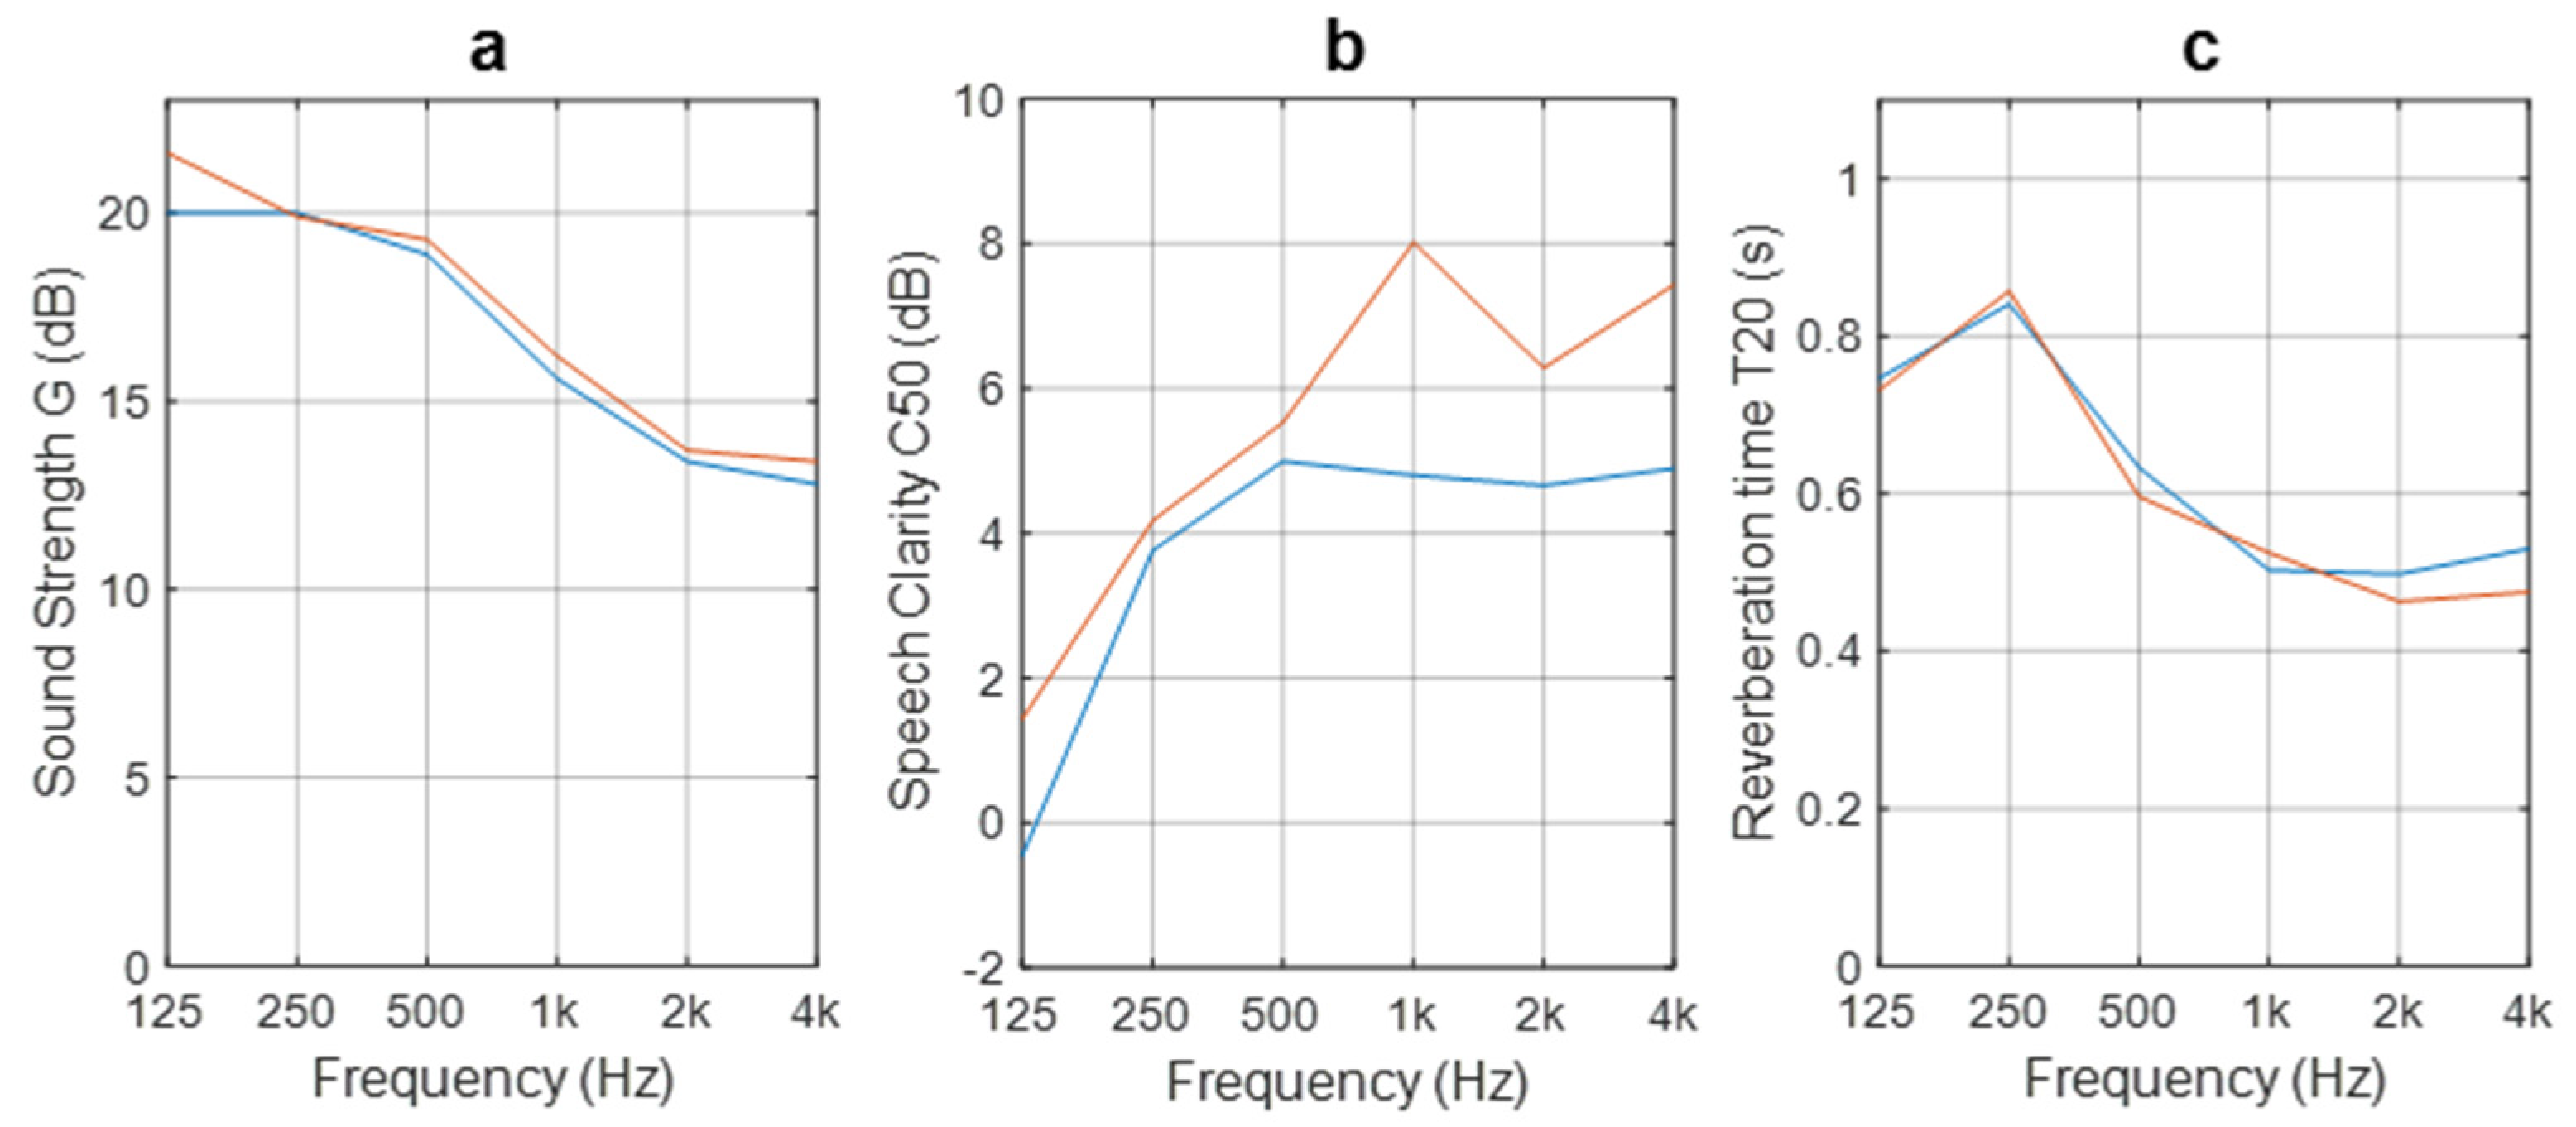
3.2. The Effect of Acoustic Treatments on the Walls
The following graphs in
Figure 11. present the room acoustic parameters for configurations with acoustic treatment placed on the adjacent walls. Two walls are used, 4.3 m
2 is covered with the treatment on each wall for all three configurations presented in this section, i.e., coverage of 8.6 m
2 in total. The configurations are with wall absorption (51.8CA_F_8.6WA), vertically oriented wall diffusers (51.8CA_F_8.6VWD) and horizontally oriented wall diffusers (51.8CA_F_8.6HWD) (see
Figure 7 and
Figure 8). For all configurations in this section, a full covering absorbent ceiling is installed and the room is sparsely furnished, as in configuration 51.8CA_F, which is also included in graphs below for comparison.
The configuration with wall absorbers results in lower sound strength values in a frequency range of 250 Hz to 4000 Hz, both in comparison with diffuser configurations, as well as with configurations with no wall treatment; a decrease is seen for the entire frequency range in this comparison. The differences are small, but a clear trend is apparent (see the graph in
Figure 11). Up to 0.8 dB, lower values are obtained for the configuration with absorbing wall treatment and the diffusing wall treatment within the frequency range of 250–4000 Hz. Thus, G is still lower for configurations with diffusers, compared to no wall treatment (51.8CA_F). Further, a similar G is obtained for configurations with diffuser treatment (51.8CA_F_8.6VWD) and (51.8CA_F_8.6HWD), i.e., the values for this parameter are independent of the direction of diffusers. Note also from this graph, that the lower values in G for configurations with diffusers is at a frequency of 125 Hz. This decrease is not correlated to scattering, but it is due to the resonance absorption for this frequency included in the design of the diffusers used in the study. This is shown further in
Section 3.4.
Speech clarity increases for all configurations with any type of wall treatment. The largest increase is seen for configuration with wall absorbers (51.8CA_8.6WA) at a frequency of 500–4000 Hz. In comparison with diffusers, the change is largest at 4000 Hz, with a 1.7 dB and 2.8 dB difference for vertically oriented and horizontally oriented, respectively.
The two configurations with diffusers have similar C50 values in octave bands 125 Hz to 500 Hz, i.e., in the range where these diffusers are not designed to be effective. However, at 1000 Hz to 4000 Hz, clearly higher C50 values are obtained for the vertically oriented diffusers—about 0.8–1.0 dB higher, compared to horizontally oriented diffusers. This is a frequency range where the diffusers are effective, but the vertically oriented diffusers, to a greater degree, distract the lateral sound field and redirect the sound to the absorbent ceiling. The same behavior between the different configurations is seen for reverberation time. In addition to this, for the higher frequencies, similar results are achieved in T20 for configuration with vertical diffusers and wall absorbers. A change in the behavior is obtained for frequency 125 Hz for both C50 and T20 in configurations with diffusers. As for sound strength, this is due to resonance absorption in the diffusers.
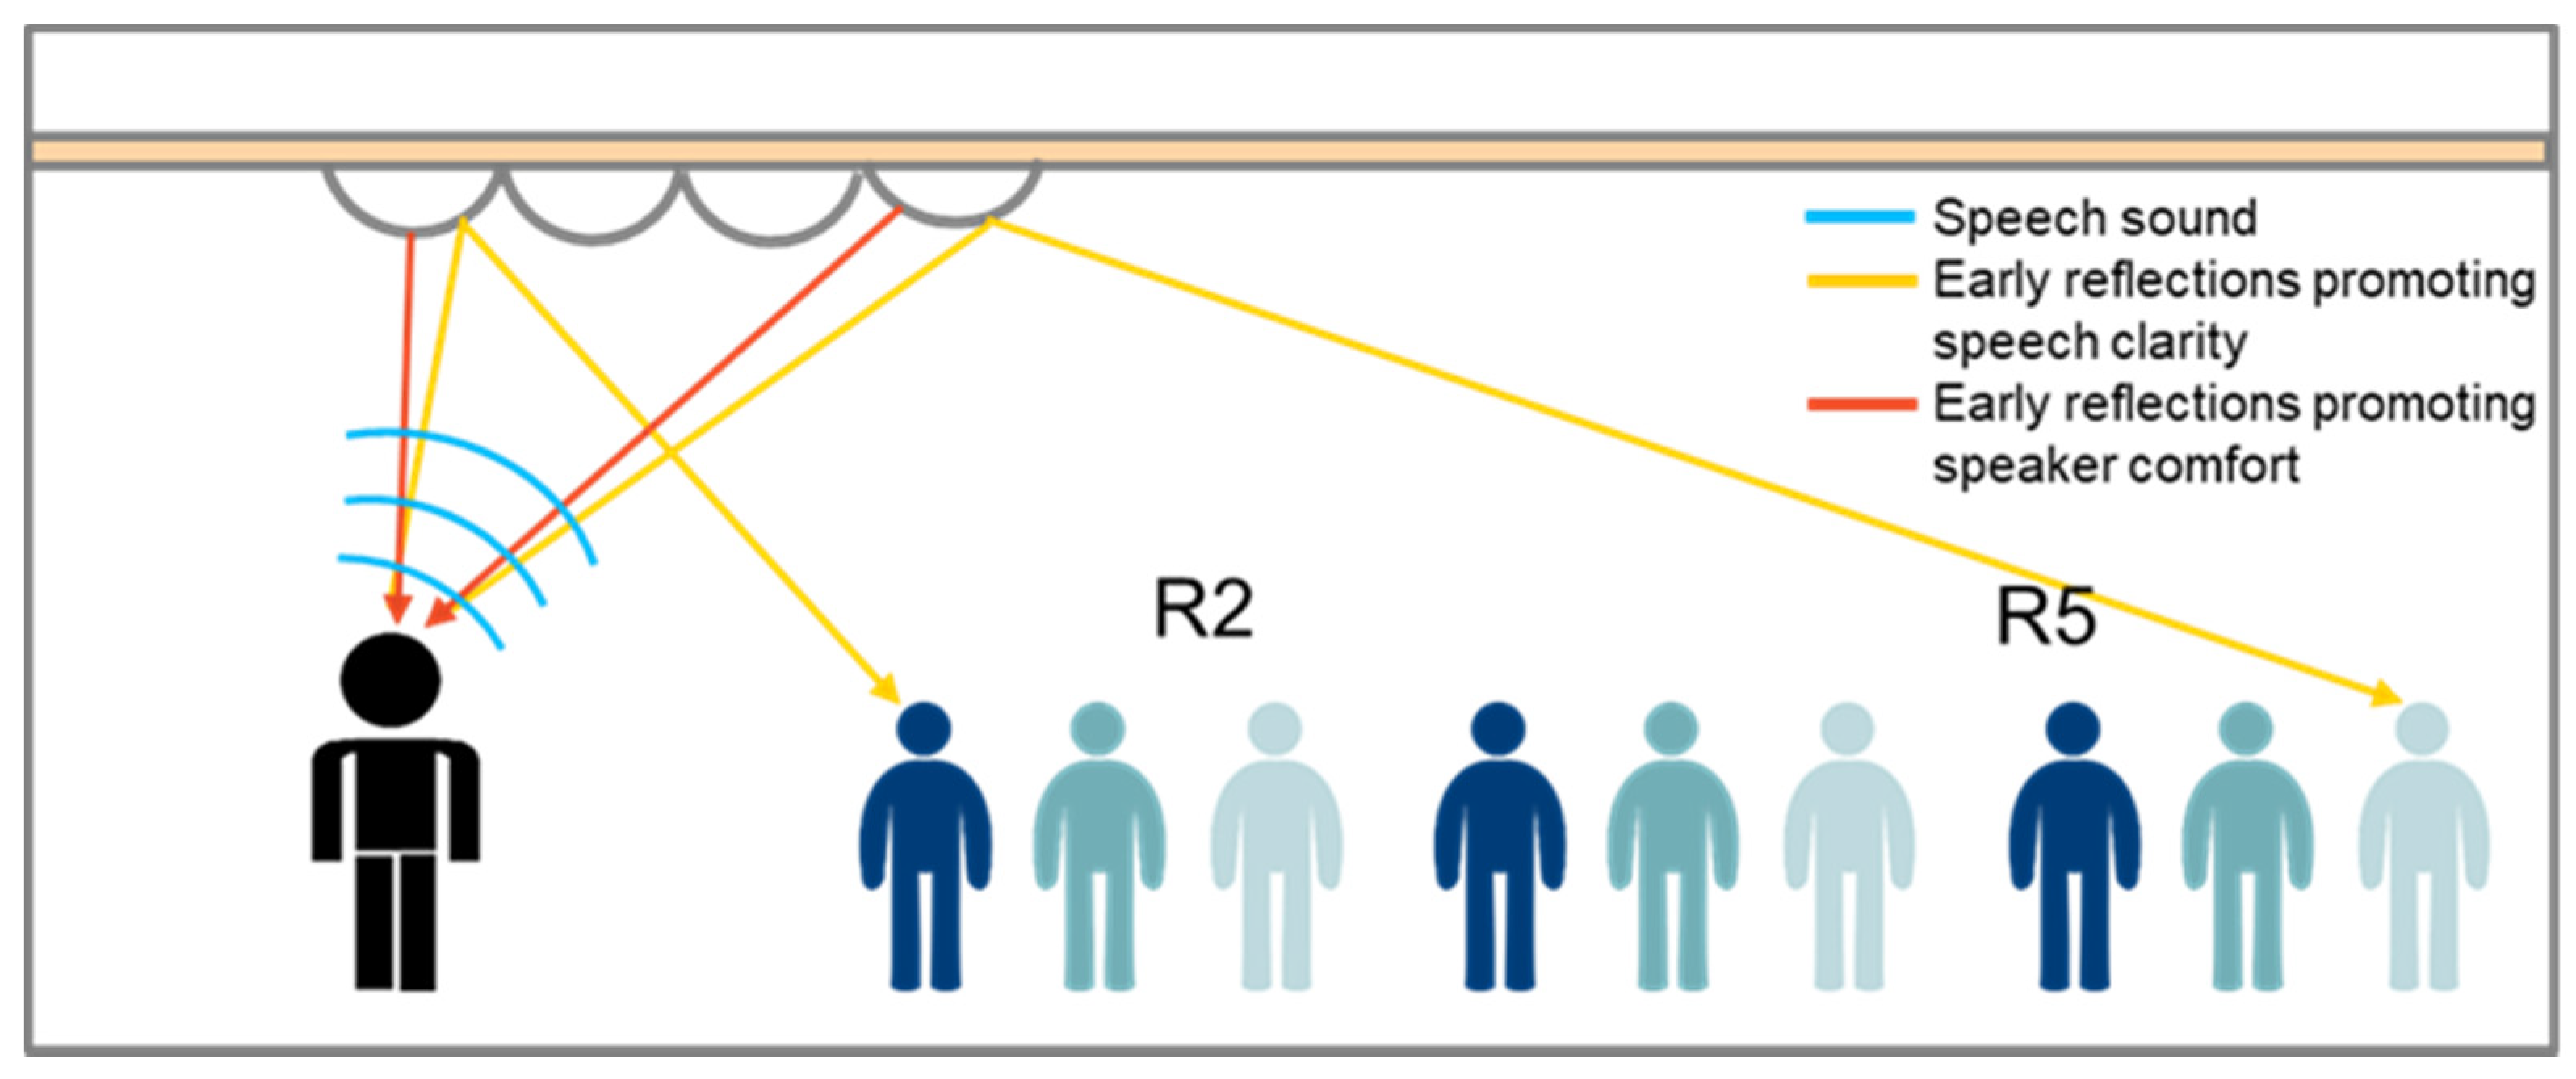
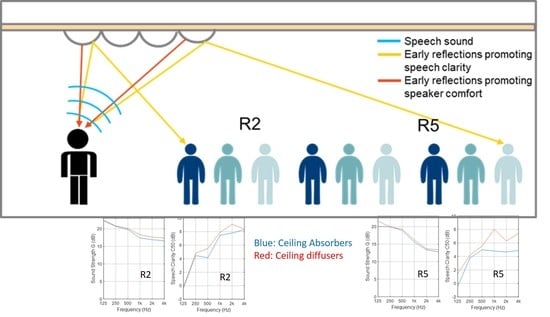
3.3. Ceiling Diffusers
The following section presents the effect of diffusers installed in the ceiling. Six of the absorbent panels in the front of the room, typical speaker position, were replaced with diffusers, corresponding to 4.3 m
2, see
Figure 12. The walls are covered with 8.6 m
2 of absorbers and the room is sparsely furnished (47.5CA_4.3CD_F_8.6WA).
The results for the average values over the twelve measurements show a general decrease in G and T
20, and an increase of C
50. The difference is small but a clear trend is obtained, see
Figure 13. Ceiling diffuser configurations were also tested with no wall treatment or wall diffusers, with equivalent trends being obtained (for the results, see
Appendix A).
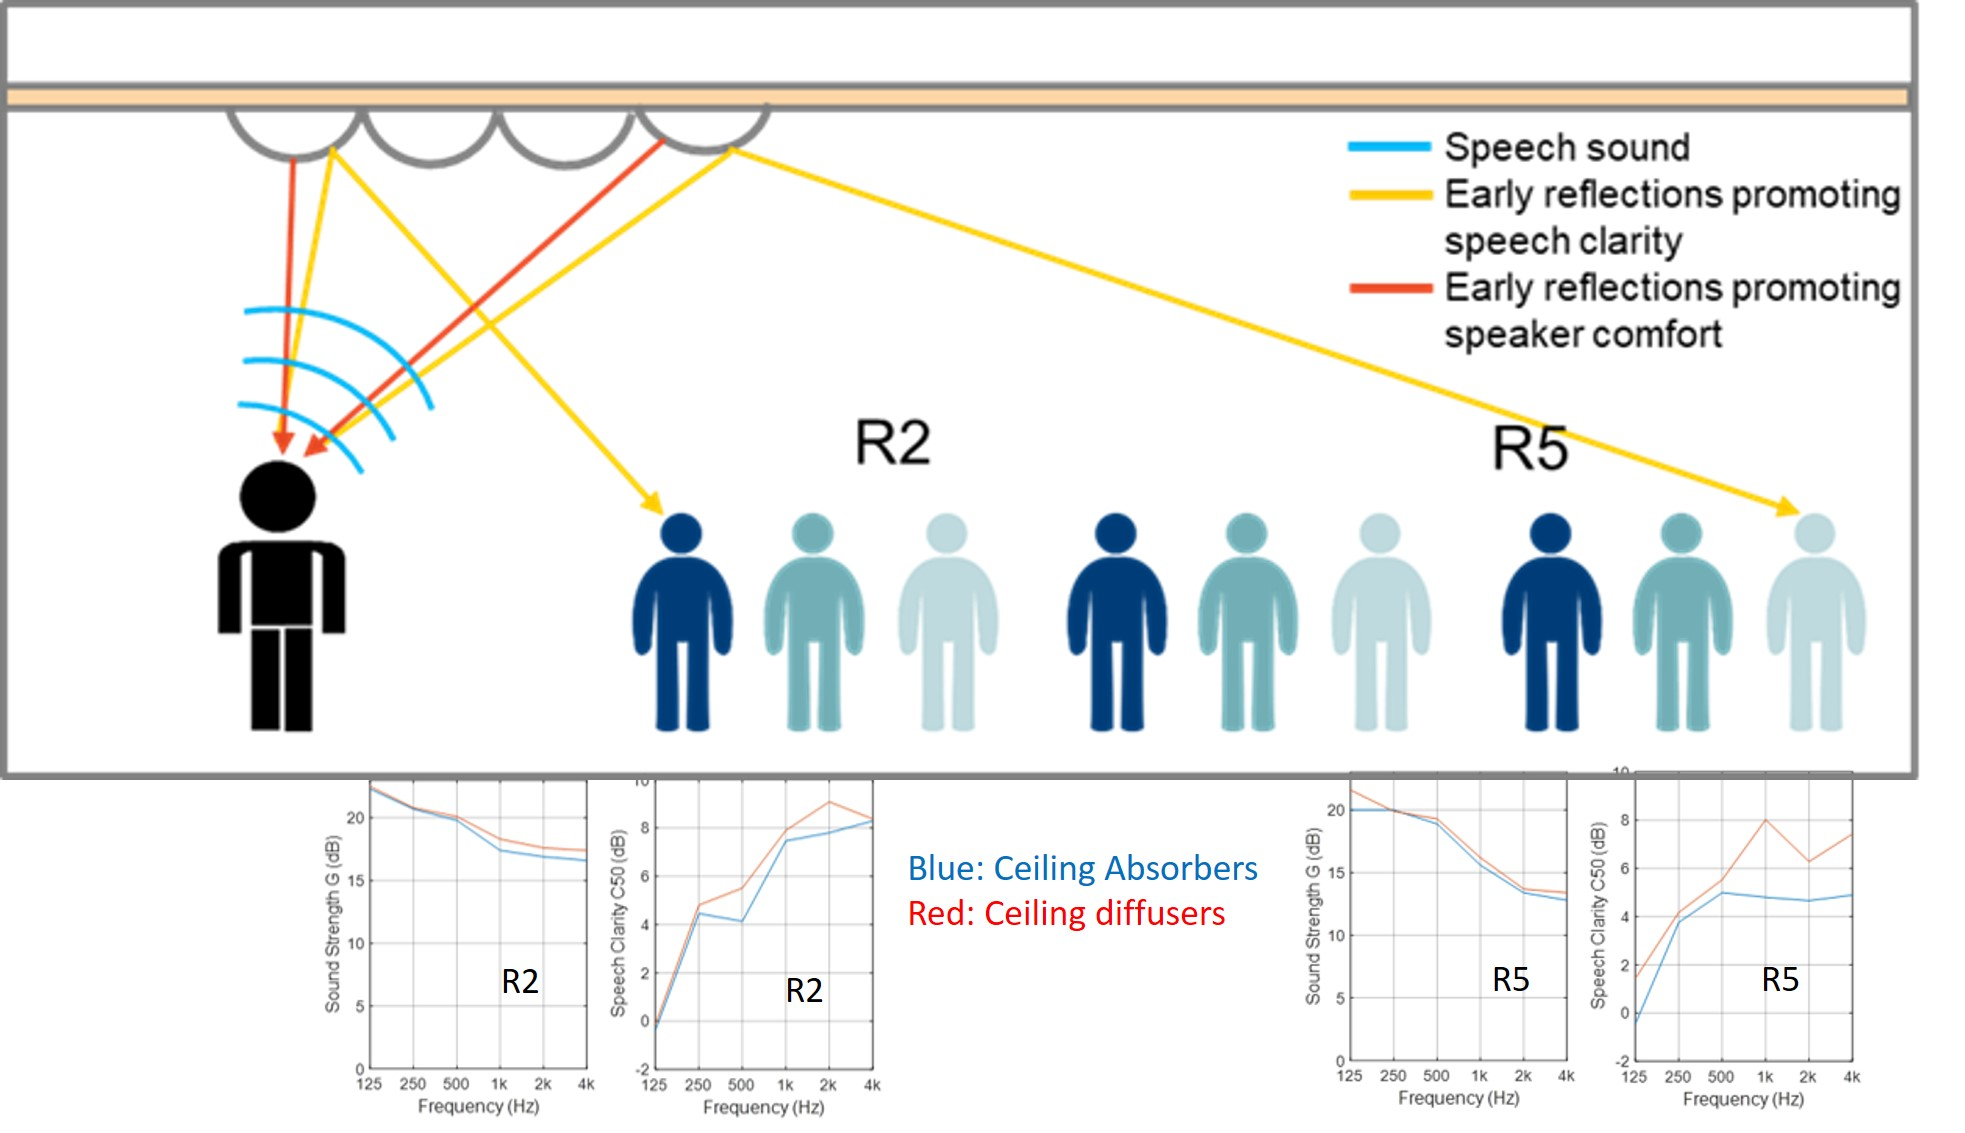
The effect of ceiling diffusers was further evaluated for different positions in the room by comparing the room acoustic parameters for receiver positions R2 and R5, source position S2. Positions are described in
Figure 3 and further visualized in
Figure 12.
Sound strength decreases with distance from the source, but a comparison to 51.8CA_F_8.6WA show higher values for configuration with ceiling diffusers 47.5CA_4.3CD_F_8.6WA. In addition to the increased energy level, a significant increase is obtained for C
50. In R5, i.e., in the back of the room, a difference can be seen for the entire frequency range, with strongest effect at 1000–4000 Hz, an increase of 1.5–3.2 dB. The reverberation time is also affected, mainly in the higher frequency range. Results are shown in
Figure 14 and
Figure 15.
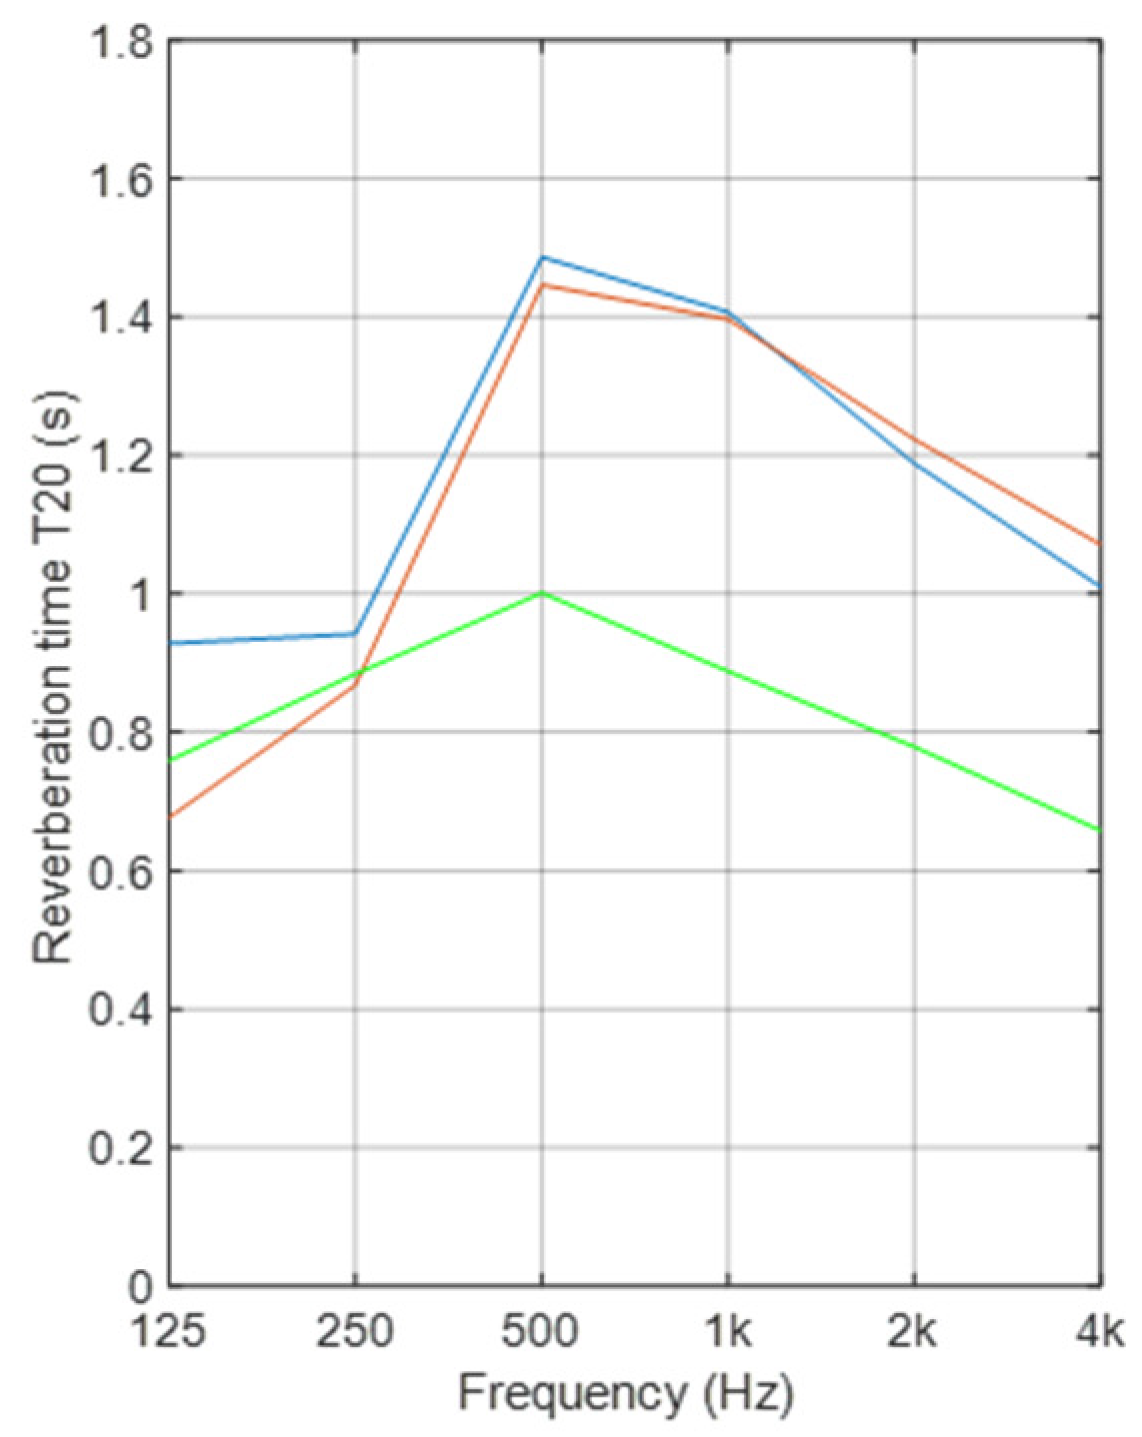
3.4. Combining Diffusers with Helmholtz Absorption
One way to obtain good absorption in a certain frequency is to use resonance absorbers. The diffusers used in this study were designed to operate as Helmholtz resonator at frequencies 125–250 Hz. The result of its effect in configuration 51.8CA_F_8.6VWD is compared with configuration with a porous low frequency absorber, configuration 51.8CA_25.0LFMA, described in
Section 2.4.1. Evaluation of reverberation time shows a clear effect for both configurations at low frequencies. It could be noted that 8.6 m
2 diffusers were used while the area of porous low frequency absorber was 25 m
2. Additionally, the diffusers affect the higher frequency range to a greater extent. The results are presented in
Figure 16.
4. Discussion
Installing the fully covering absorbent ceiling in the empty room, as a first step, affected all the room acoustic parameters. This treatment can be seen as a good baseline for a classroom, since it significantly decreases the sound strength and reverberation time, and increases the speech clarity. The addition of furniture also affected the results, mainly due to increased scattering, as only a small amount of absorption is involved. The furniture affects the parameters particularly at frequencies of 500–1000 Hz. This configuration, an absorbent ceiling and a sparsely furnished room, could be seen as a normal classroom situation. It is important to note the difference in result between measurement and calculated T20 by using diffuse sound field theory for this configuration. The much lower values achieved in calculation demonstrate that the lateral sound field must be considered in acoustic models dealing with ordinary, furnished rooms.
The additional acoustic treatment in different configurations using absorbers and diffusers contributed important effects for fine-tuning the acoustics. The general finding was that higher sound energy levels were obtained for configurations with diffusers, and lower energy levels for configurations with absorbers. Both types of treatment affected speech clarity and reverberation time.
With the diffusers, the energy is conserved, compared to the absorbers where the energy is reduced, explaining why both horizontally oriented and vertically oriented diffusers have similar values in terms of sound strength. A reason for the effect on speech clarity and reverberation time is the scattering of the diffusers. Significant differences are found between the vertically and horizontally directing diffusers, where the vertical affected C50 and T20 to a greater extent. The vertically oriented diffusers reduced the sound waves in the horizontal plane and directed the sound into the ceiling, showing the importance of directional scattering in rooms with ceiling treatment, which correlates well to the diffusion characteristics of the diffusing elements.
In the experiments using diffusers in the ceiling, important improvements for receivers located outside the direct sound field could be achieved. Keeping the sound energy level, a significant increase in speech clarity was found for the receiver at the back. This is an important application for use in classrooms where a teacher gives instructions at the front of the room. An interesting finding with all the ceiling diffuser configurations was that a decrease in T20 was obtained while G increased, and this finding also applied when evaluating the results on an average basis for the twelve different measurements. This raises, again, the question of the importance of considering the effect of scattering.
It should be observed that C50 only gives information about the early-to-late ratio of the reflections, and does not explain anything about the sound energy. This means that high C50 can be achieved without guaranteeing sound energy will be sufficiently high for the listener, or supporting the speaker. A case with high C50 and low sound energy can result in:
- (1)
Too low a sound level reaching listeners in the rear area of the classroom;
- (2)
Greater voice effort for the speaker.
In the configurations with diffusers, an increase in C50 could retain the sound strength, i.e., the sound energy.
In choosing the acoustic treatment, it is important to consider the type of room acoustic properties required for the specific room. With diffusers, reverberation time can be lowered and the ratio of early reflections increase with sound energy conserved. Thus, for environments where complex tasks requiring concentration are performed or in a very noisy environment, sound energy reducing treatment should be used. It is thus of importance to define the activity taking place in the room when choosing the acoustic treatment.
In the discussion of acoustic design, it is important to note that the diffusers used in this study were designed to operate as scattering objects for the higher frequency range, which is important for speech, and for absorption at low frequencies. It is possible to design the diffusers to operate at the requested frequencies.
It has been mentioned above that only small effects were seen for some configurations. It should be noted that only a small part of the wall area was covered, for example, the ceiling diffusers covered 8% of the ceiling area. An increased area of acoustic treatment would, to a certain degree, affect the values further. However, realistic conditions must be considered, e.g., a real classroom can have more furniture affecting the scattering properties. Other factors that can influence the perception of the acoustics, not studied in this investigation, are background noise, the people and their activities.
An observation from the results is the importance of using several room acoustic parameters to characterize a specific acoustic environment (see e.g.,
Figure 15). For example, T
20 and C
50 can be varied with diffusers, but still maintain the sound strength. However, using absorbers, the sound strength can be varied as well. The outcome of these two scenarios will be different experienced, and needs to be considered to obtain the correct acoustic balance for low and high frequencies in ordinary public rooms.
5. Conclusions
A clear trend in how different types of acoustic treatment affect room acoustic parameters has been demonstrated where, as a baseline, an acoustic ceiling should be used to decrease the energy level, increase the ratio of early-to-late reflections and lower the reverberation time. However, in a sparsely furnished room, it can still be difficult to achieve a high-quality sound environment with only an absorbent ceiling. The room acoustic parameters can be fine-tuned by using diffusers and absorbers on the walls and/or in the ceiling. The two different types of treatment operate differently and create distinctive experiences for the people in the room. With additional porous absorbers, G and T20 are decreased and C50 is increased, while diffusers affect C50 and T20, keeping G stable or increased, depending on placement and amount.
The diffusers used in this study where efficient in absorbing sound at the frequency of 125–250 Hz, but the frequency range within which it operates as a resonant absorber can easily be adopted. Additionally, the frequency ranges for which it operated most efficiently as a scattering object can be adjusted, depending on the demands.
This study provides information on how different acoustic treatments can be used to obtain different room acoustic qualities, and can be used to improve the sound environment in ordinary public rooms. However, the target values of the room acoustic parameters must be defined for the specific environment and activity, in order to use this information for correct the fine-tuning of acoustic environments.
6. Patents
Patent pending, European Patent Office, 20170667.8.


