Acoustic Simulation of Julius Caesar’s Battlefield Speeches


Abstract
:
1. Introduction
Under such circumstances it must have been impossible for a general, even if he had had the voice of a Stentor, to deliver a speech that could be heard by all the soldiers simultaneously.[6]
2. Background
2.1. Benjamin Franklin’s Experiment
⋯[Whitefield] might well be heard by more than Thirty Thousand. This reconciled me to the newspaper accounts of his having preached to twenty five thousand people in the fields and to the ancient histories of generals haranguing whole armies of which I had sometimes doubted.[18]
2.2. Caesar the Orator
Do you know any man who can speak better than Caesar, even if he has concentrated on the art of oratory to the exclusion of all else?[33]
3. Simulation Method and Results
3.1. Dyrrachium
3.1.1. Environmental Factors
Caesar was now forced to abandon his previous plans and believed that he needed to change his entire strategy for this war. Accordingly, he simultaneously withdrew his troops from all their fortified positions, thus ending the siege. He gathered his entire army in one place and addressed the troops in assembly, urging them not to be discouraged by what had happened: they should neither be frightened by their present experience nor consider this single setback–which, at any rate, was relatively minor–as equivalent to their many successful battles.[13]
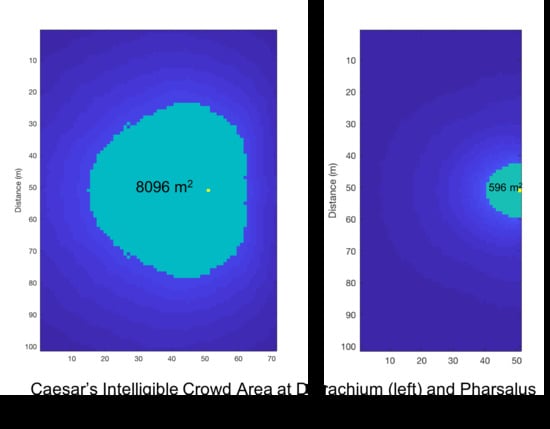
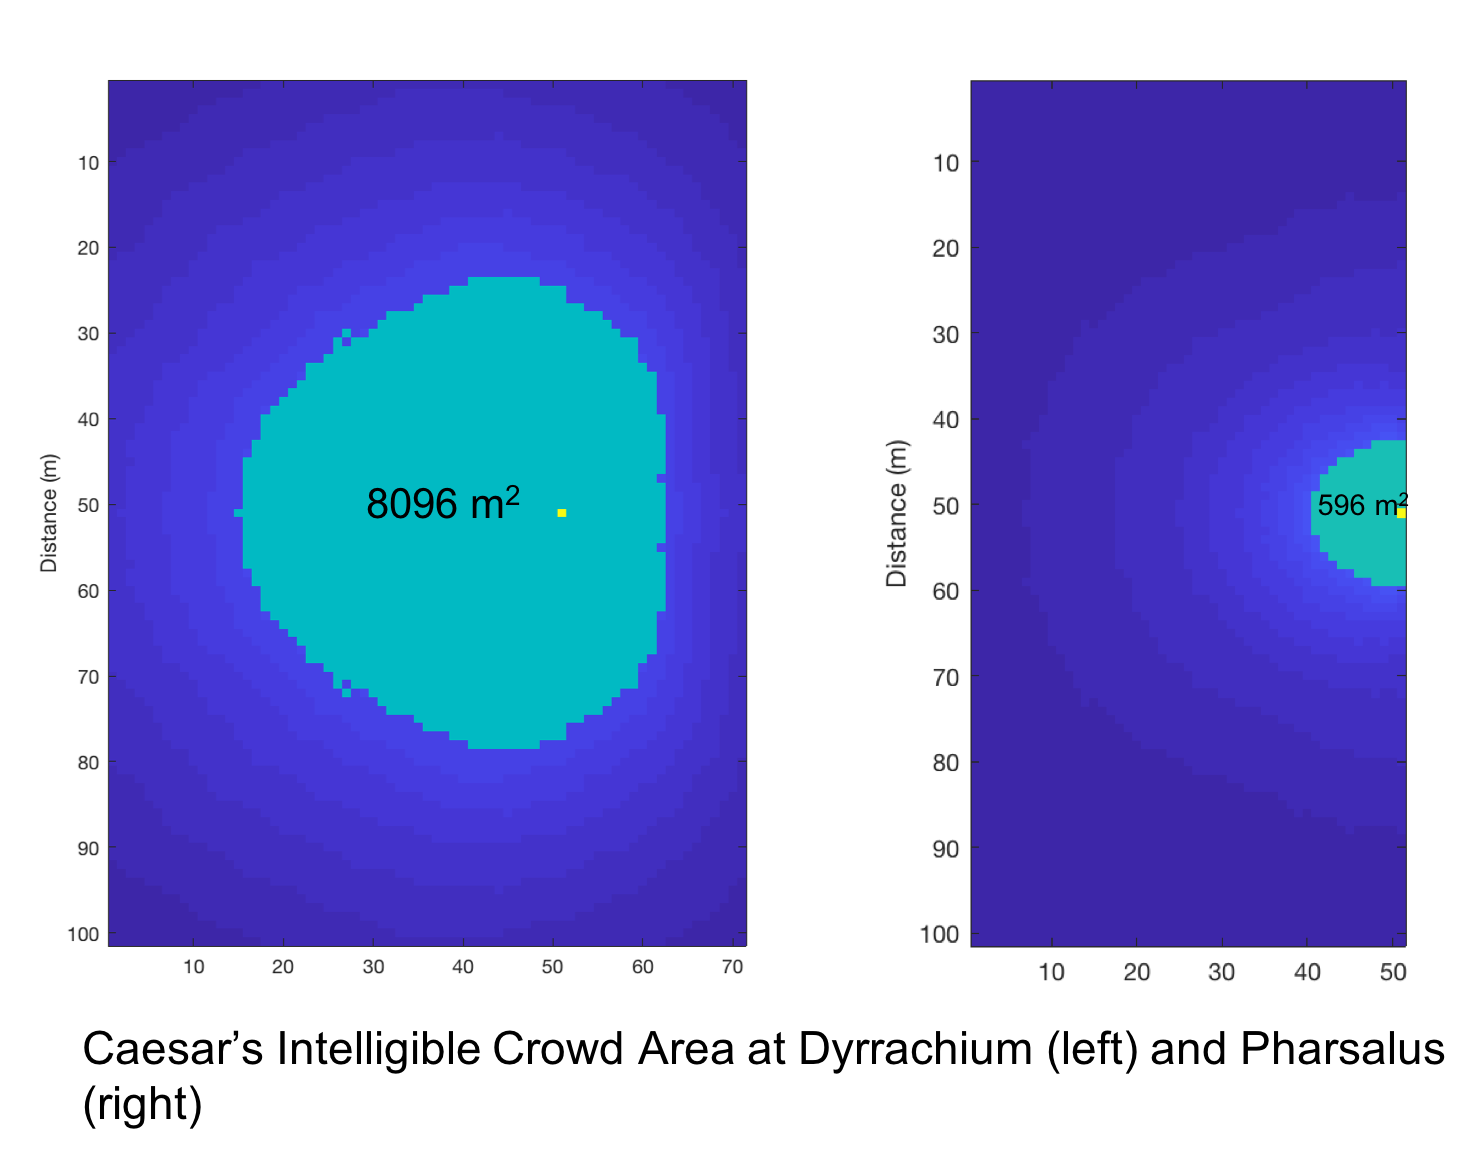
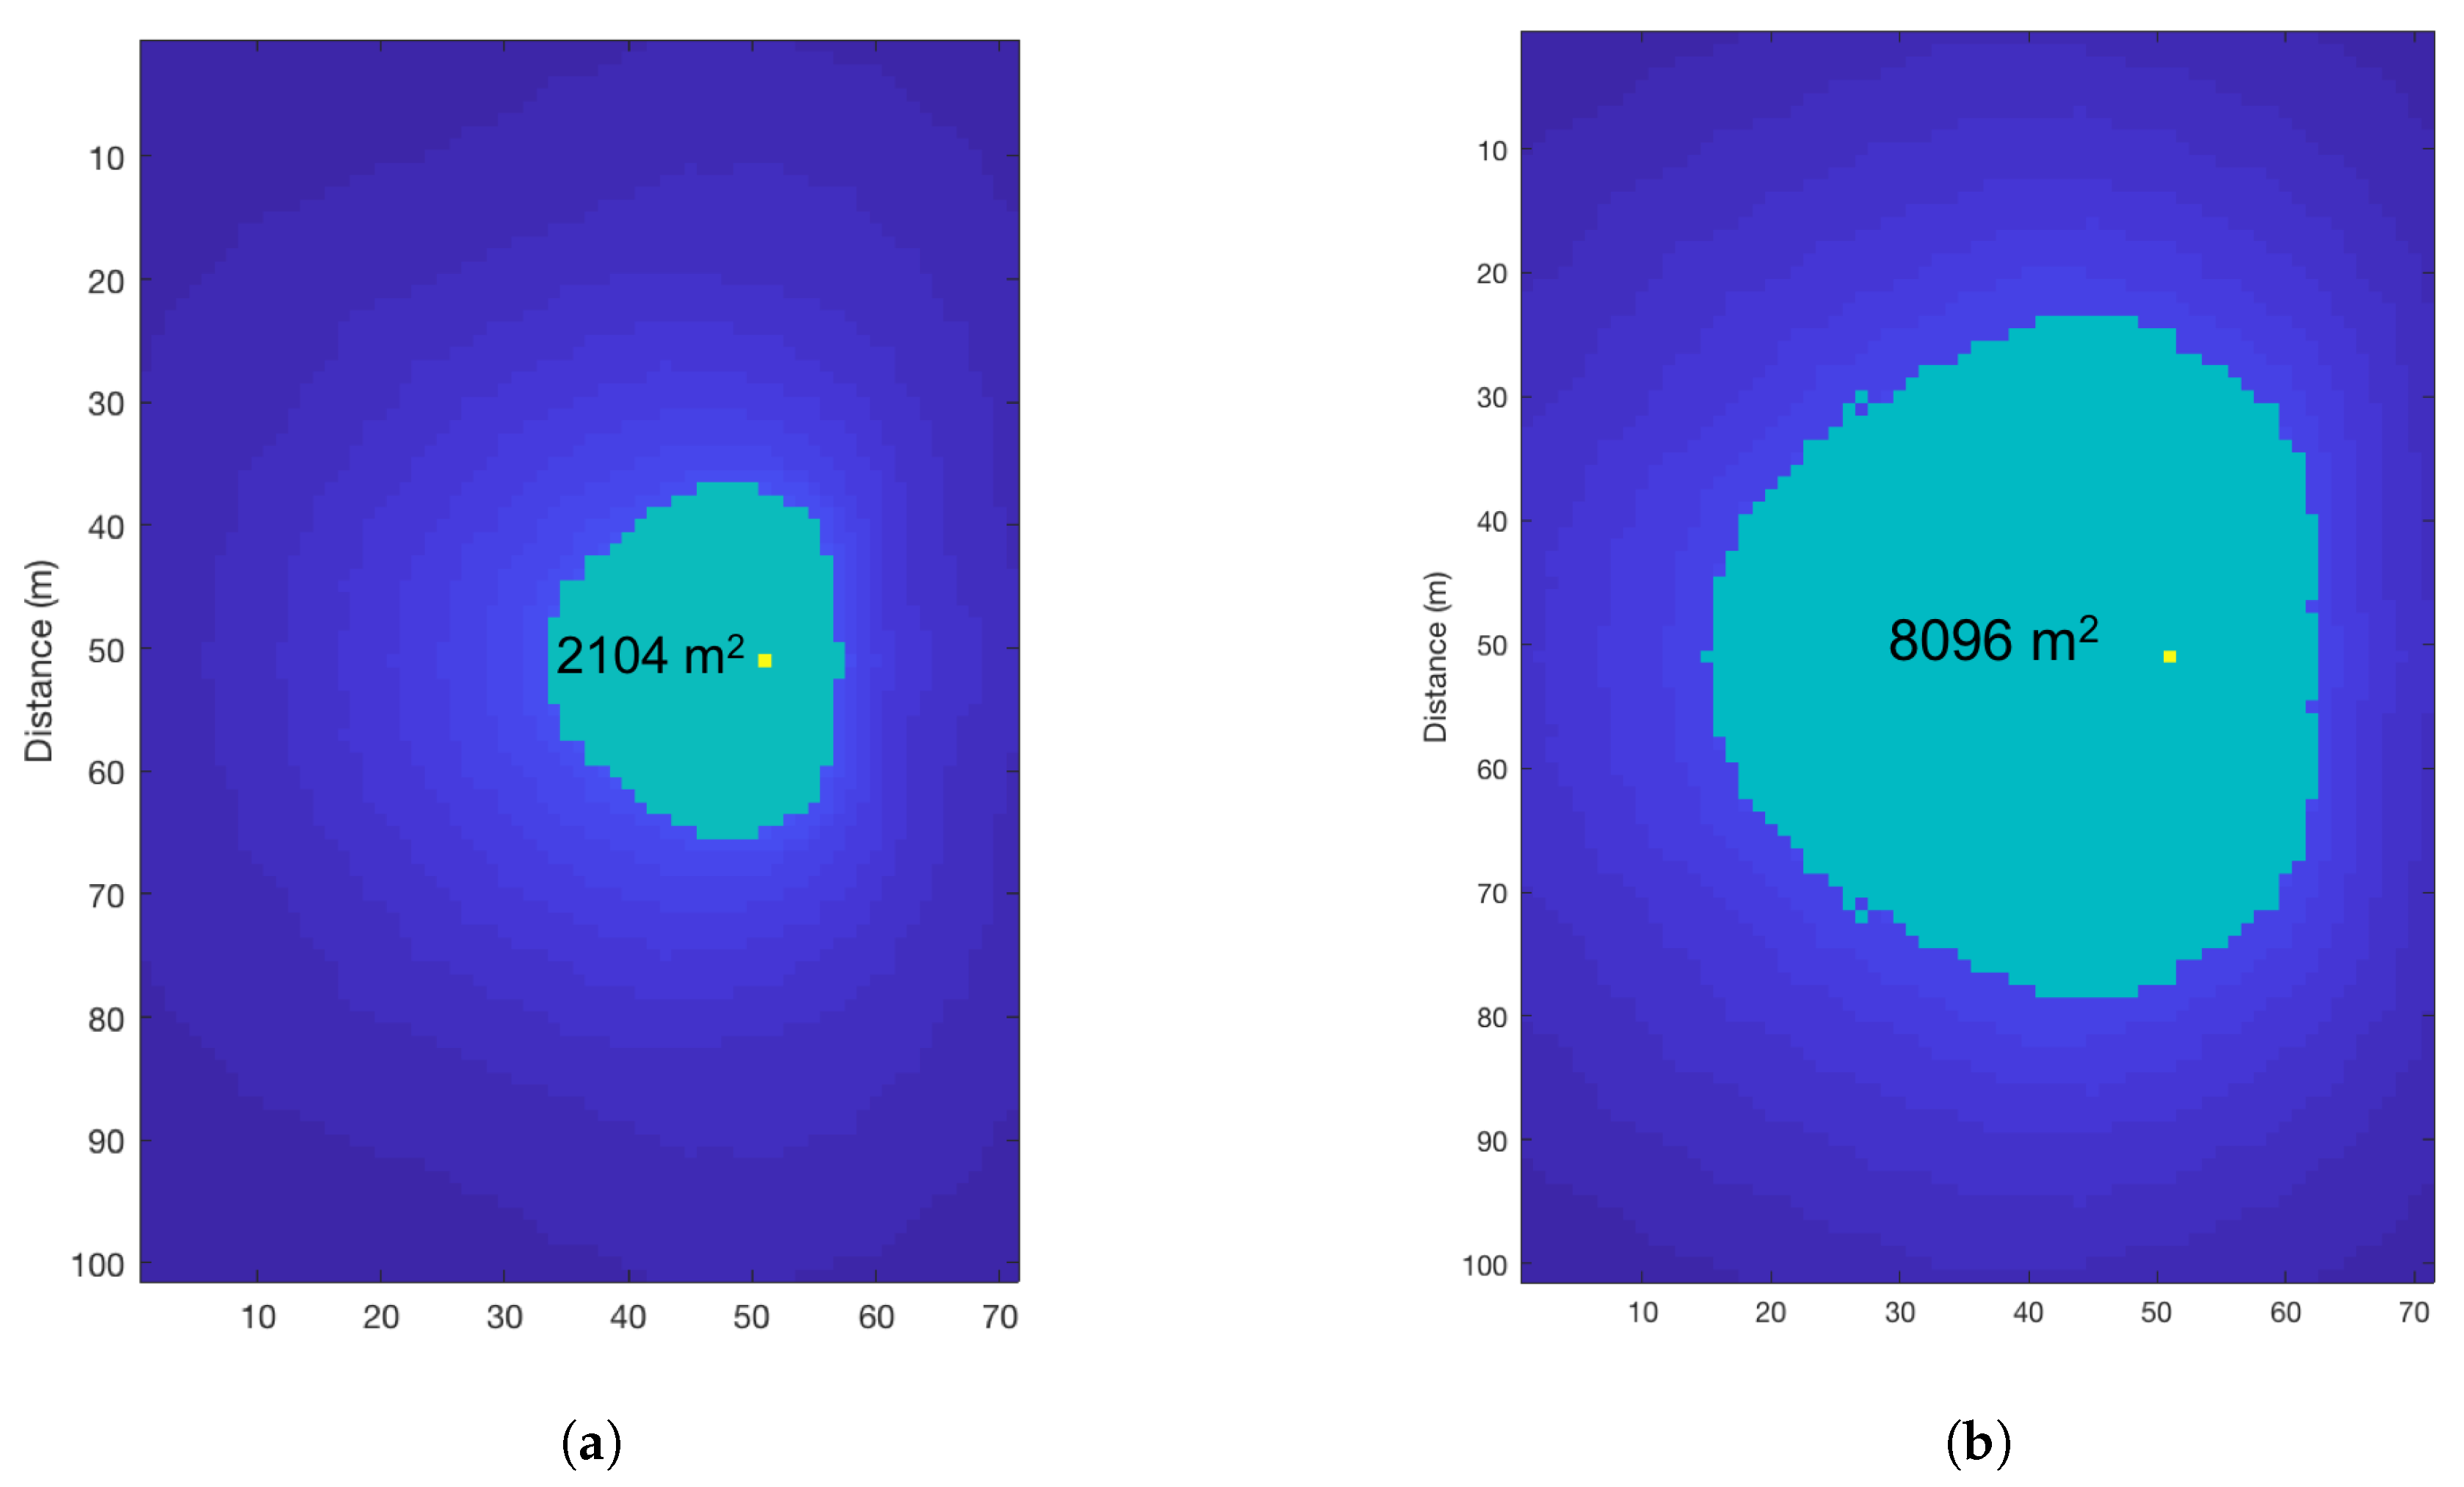
3.1.2. Simulation
3.2. Pharsalus
3.2.1. Environmental Factors
After⋯the signal for departure had already been given and the tents struck, it was noticed that a little earlier Pompey’s battle line, exceeding what it had been used to doing each day, had moved forward farther from their rampart, so that it appeared possible to fight on ground that would not be unfavorable. Then Caesar, who was with his men as they were about to march out of the gate in formation, said to them, “We need to put off our march for now and turn our thoughts to battle, which is what we have been demanding all this time. Let’s take courage and be prepared to fight. It will not be easy to find another chance later.” Then he immediately led out his troops, unencumbered and ready to fight.[13]
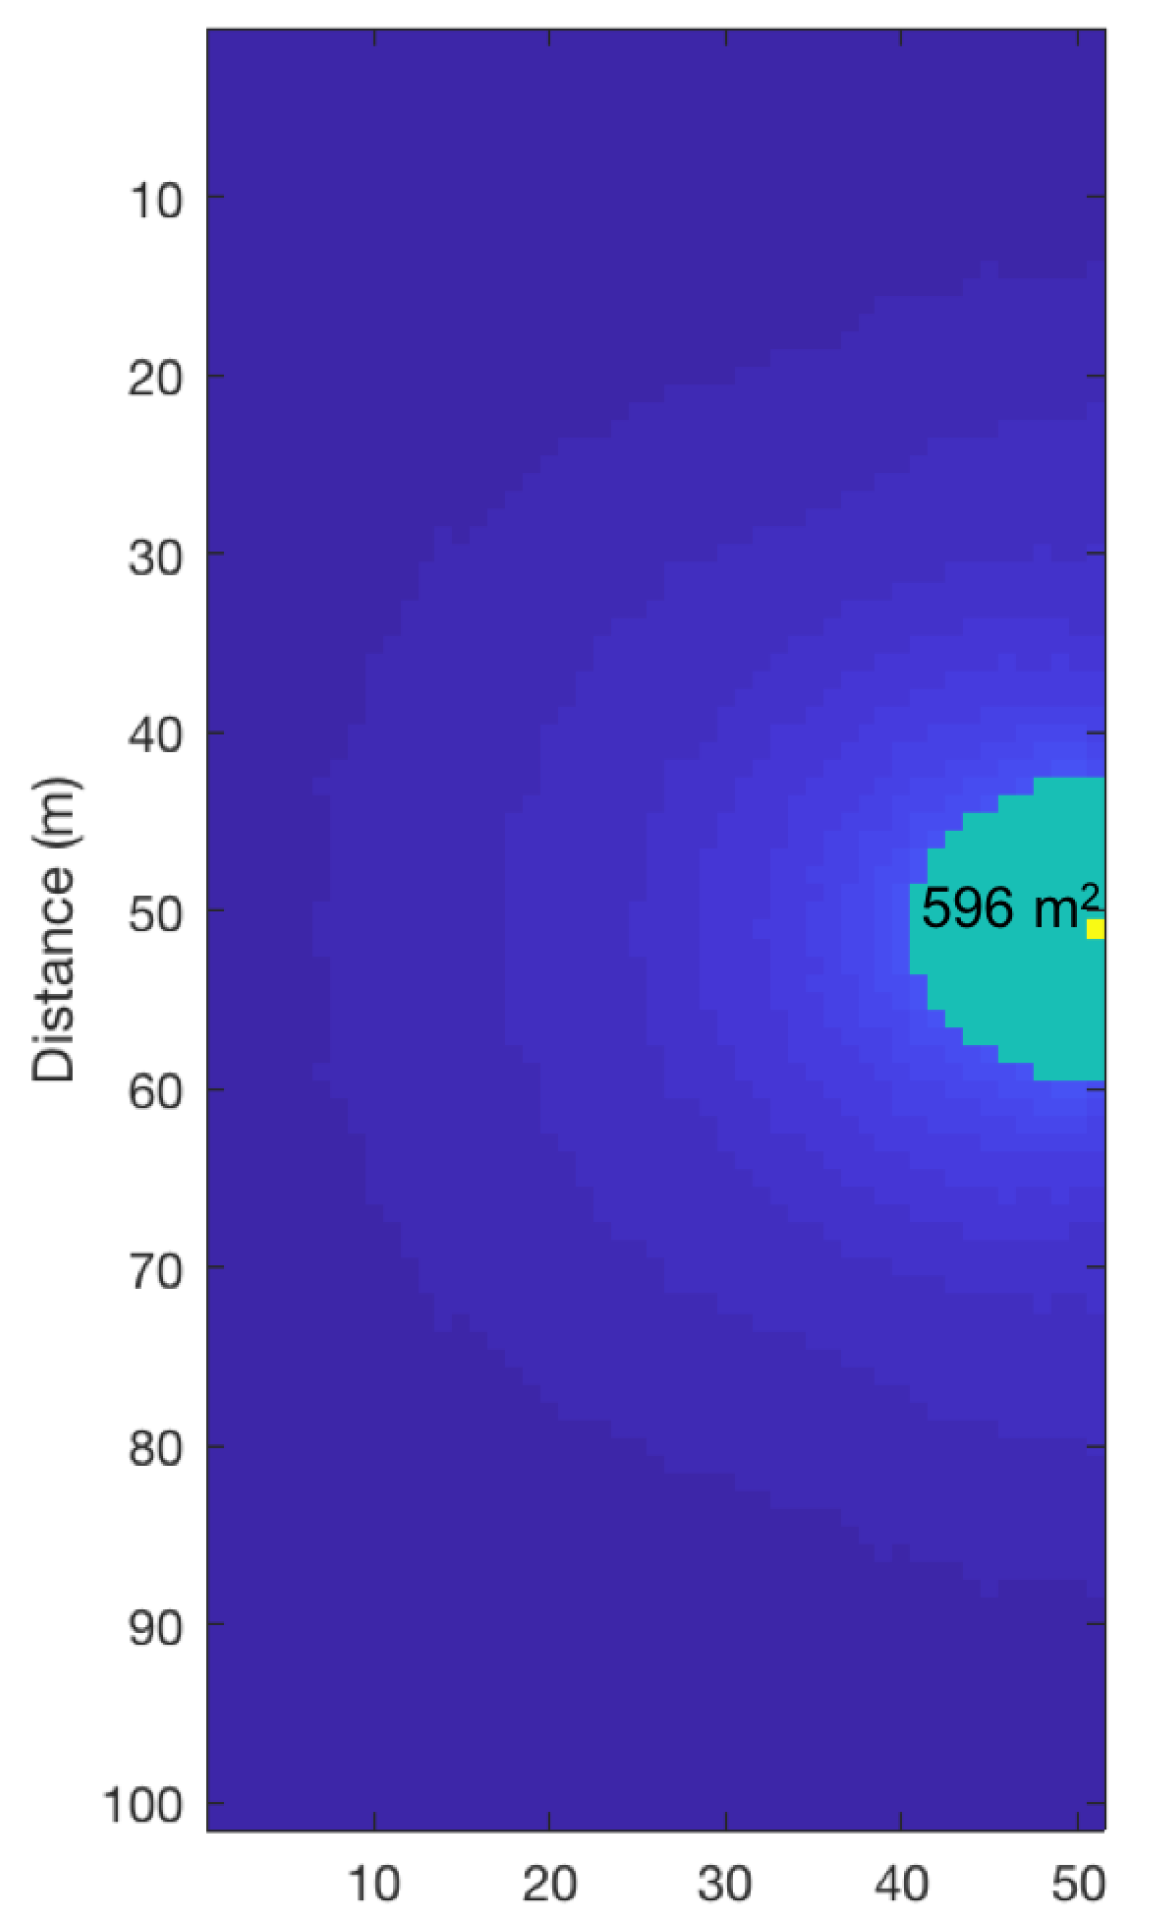
3.2.2. Simulation
4. Discussion
However, once [Caesar] had a look at the enemy formation described above, he feared a flanking attack by the mass of enemy cavalry circling around his right wing; he therefore rapidly drew individual cohorts out of the third line of his formation, placed them as a fourth line to oppose Pompey’s cavalry, and explained to them what he wanted them to do, making it clear that this day’s victory would depend on the bravery of these cohorts. At the same time he commanded the third line not to move forward and engage with the enemy without explicit orders from himself: when he wanted this to happen, he would give the signal with a flag.[13]
5. Conclusions
Funding
Conflicts of Interest
References
- Thucydides. History of the Peloponnesian War; Bohn: London, UK, 1843. [Google Scholar]
- Jacobs, H.A. To count a crowd. Columbia Journal. Rev. 1967, 5, 37–40. [Google Scholar]
- Seidler, J.; Meyer, K.; Gillivray, L.M. Collecting Data on Crowds and Rallies: A New Method of Stationary Sampling. Soc. Forces 1976, 55, 507–519. [Google Scholar] [CrossRef]
- Murphy, C.T. The Use of Speeches in Caesar’s Gallic War. Class. J. 1949, 45, 120–127. [Google Scholar]
- Miller, N.P. Dramatic Speech in the Roman Historians. Greece Rome 1975, 22, 45–57. [Google Scholar] [CrossRef]
- Hansen, M.H. The battle exhortation in ancient historiography: Fact or fiction? Historia 1993, 42, 161–180. [Google Scholar]
- Pritchett, W.K. The General’s Exhorations in Greek Warfare. In Essays in Greek History; J. C. Gieben: Amsterdam, The Netherlands, 1994; pp. 27–109. [Google Scholar]
- Rufus, Q.C. History of Alexander; Harvard University Press: Cambridge, MA, USA, 1946. [Google Scholar]
- Wesley, J. The Journal of John Wesley; Moody Press: Chicago, IL, USA, 1951. [Google Scholar]
- Watson, R.; Yip, P. How many were there when it mattered? Significance 2011, 8, 104–107. [Google Scholar] [CrossRef] [Green Version]
- O’Neill, T. The Great Myths 5: The Destruction of The Great Library of Alexandria. 2017. Available online: https://historyforatheists.com/2017/07/the-destruction-of-the-great-library-of-alexandria/ (accessed on 8 February 2018).
- Bordes, N.; Pailthorpe, B.; Hall, J.; Loy, T.; Williams, M.; Ulm, S.; Zhou, X.; Fletcher, R. Computational Archaeology. In Proceedings of the WACE 2004: Workshop on Advanced Collaborative Environments, Nice, France, 23 September 2004. [Google Scholar]
- Raaflaub, K.A. (Ed.) The Landmark Julius Caesar; Pantheon Books: New York, NY, USA, 2017. [Google Scholar]
- Ehrhardt, C.T.H.R. Speeches before Battle? Hist. Z. Alte Gesch. 1995, 44, 120–121. [Google Scholar]
- Nordling, J.G. Caesar’s Pre-Battle Speech at Pharsalus (B.C. 3.85.4): Ridiculum Acri Fortius ⋯ Secat Res. Class. J. 2005, 101, 183–189. [Google Scholar]
- Zoido, J.C.I. The Battle Exhortation in Ancient Rhetoric. Rhetorica 2007, 25, 141–158. [Google Scholar] [CrossRef]
- Dallimore, A. George Whitefield: The Life and Times of the Great Evangelist of the Eighteenth–Century Revival; Banner of Truth Trust: London, UK, 1970. [Google Scholar]
- Franklin, B. The Autobiography of Benjamin Franklin, 2nd ed.; Yale University Press: New Haven, CT, USA; London, UK, 1964. [Google Scholar]
- Stout, H. The Divine Dramatist: George Whitefield and the Rise of Modern Evangelicalism; William B. Eerdmans Publishing Company: Grand Rapids, MI, USA, 1991. [Google Scholar]
- Boren, B.B.; Roginska, A. Analysis of noise sources in colonial Philadelphia. Internoise 2012, 9, 7543–7553. [Google Scholar]
- Boren, B.B.; Roginska, A. Maximum Averaged and Peak Levels of Vocal Sound Pressure. In Proceedings of the 135th Audio Engineering Society Convention, New York, NY, USA, 17–20 October 2013. [Google Scholar]
- Boren, B.B.; Roginska, A. Sound Radiation of Trained Vocalizers. In Proceedings of the Meetings on Acoustics: 21st International Congress on Acoustics, New York, NY, USA, 4 May 2013. [Google Scholar]
- Boren, B.B. George Whitefield’s Voice. In George Whitefield: Life, Context and Legacy; Jones, D.C., Hammond, G., Eds.; Oxford University Press: Oxford, UK, 2015. [Google Scholar]
- American National Standards Institute. American National Standard: Methods for Calculation of the Speech Intelligibility Index; Acoustical Society of America: New York, NY, USA, 1997. [Google Scholar]
- Rindel, J.H. Odeon Application Note–Calculation of Speech Transmission Index in Rooms; Odeon A/S: Lyngby, Denmark, 2014. [Google Scholar]
- International Organization for Standardization. ISO 9921: 2003 Ergonomics–Assesment of Speech Communication; International Organization for Standardization: Geneva, Switzerland, 2003. [Google Scholar]
- Forrest, T.G.; Raspet, R. Models of female choice in acoustic communication. Behav. Ecol. 1994, 5, 293–303. [Google Scholar] [CrossRef]
- Mendes, A.P.; Rothman, H.B.; Sapienza, C.; Brown, W. Effects of vocal training on the acoustic parameters of the singing voice. J. Voice 2003, 17, 529–543. [Google Scholar] [CrossRef]
- Kahn, A. The Education of Julius Caesar; Schocken Books: New York, NY, USA, 1986. [Google Scholar]
- Plutarch. The Parallel Lives; Loeb Classical Library: Cambridge, MA, USA; London, UK, 1919. [Google Scholar]
- Sallust. Conspiracy of Catiline; Harper and Brothers: New York, NY, USA; London, UK, 1899. [Google Scholar]
- Cicero, M.T. De Oratore; Harvard University Press: Cambridge, MA, USA, 1967. [Google Scholar]
- Suetonius, G. The Twelve Caesars; Penguin Books: London, UK, 1957. [Google Scholar]
- Dobson, J.F. The Greek Orators; Methuen and Co.: London, UK, 1919. [Google Scholar]
- Kent, R.; Kent, J.; Rosenbek, J. Maximum Performance Tests of Speech Production. J. Speech Hear. Disord. 1987, 52, 367–387. [Google Scholar] [CrossRef] [PubMed]
- Dalenbäck, B.I.L. Room Acoustic Prediction Based on a Unified Treatment of Diffuse and Specular Reflection. J. Acoust. Soc. Am. 1996, 100, 899–909. [Google Scholar] [CrossRef]
- Dalenback, B. CATT-Acoustic v9; CATT: Gothenburg, Sweden, 2011. [Google Scholar]
- Rindel, J. The Use of Computer Modeling in Room Acoustics. J. Vibroeng. 2000, 3, 219–224. [Google Scholar]
- Siltanen, S.; Lokki, T.; Savioja, L. Rays or Waves? Understanding the Strengths and Weaknesses of Computational Room Acoustics Modeling Techniques. In Proceedings of the International Symposium on Room Acoustics, Melbourne, Australia, 29–31 August 2010. [Google Scholar]
- Forrest, T.G. From Sender to Receiver: Propagation and Environmental Effects on Acoustic Signals. Am. Zool. 1994, 34, 644–654. [Google Scholar] [CrossRef] [Green Version]
- Adelman-Larsen, N.W.; Thompson, E.R.; Gade, A.C. Suitable reverberation times for halls for rock and pop music. J. Acoust. Soc. Am. 2010, 127, 247–255. [Google Scholar] [CrossRef] [PubMed] [Green Version]
- Steeneken, H.J.M.; Houtgast, T. Basics of the STI measuring method. In Past, Present and Future of the Speech Transmission Index; van Wijngaarden, S.J., Ed.; TNO Human Factors: Soesterberg, The Netherlands, 2002; pp. 13–43. [Google Scholar]
- Lucas, F.L. The Battlefield of Pharsalos. Annu. Br. Sch. Athens Suppl. 1921, 24, 34–53. [Google Scholar] [CrossRef]
- Morgan, J.D. Palaepharsalus–The Battle and the Town. Am. J. Archaeol. 1983, 87, 23–54. [Google Scholar] [CrossRef]
- James, S. 48 BC: The Battle of Pharsalus. In Rome’s Legions: Decoding Their Pythagorean Organization 753 BC to 410 AD; Academia: Prague, Czechoslovakia, 2010. [Google Scholar]
- Martellotta, F.; D’Alba, M.; Crociata, S.D. Laboratory measurement of sound absorption of occupied pews and standing audiences. Appl. Acoust. 2011, 72, 341–349. [Google Scholar] [CrossRef]
- Bo, E.; Kostara-Konstantinou, E.; Lepore, F.; Shtrepi, L.; Puglisi, G.; Astolfi, A.; Barkas, N.; Mangano, B.; Mangano, F. Acoustic characterization of the ancient theatre of Tyndaris: Evaluation and proposals for its reuse. In Proceedings of the ICSV 2016–23rd International Congress on Sound and Vibration: From Ancient to Modern Acoustics, Atene, Greece, 10–14 July 2016. [Google Scholar]


| Surface | 125 | 250 | 500 | 1000 | 2000 | 4000 |
|---|---|---|---|---|---|---|
| Audience area (dense) | 0.24 | 0.47 | 0.94 | 0.99 | 0.99 | 0.99 |
| Vocal SPL (dB) | Background Noise Level (dB) | MIA (m2) | Density (Persons/m2) | Crowd Size |
|---|---|---|---|---|
| 74 | 45 | 2104 | 2.7 | 5,681 |
| 80 | 45 | 8096 | 2.7 | 21,859 |
| Surface | 125 | 250 | 500 | 1000 | 2000 | 4000 |
|---|---|---|---|---|---|---|
| Audience area (dense) | 0.20 | 0.35 | 0.70 | 0.99 | 0.99 | 0.99 |
| Vocal SPL (dB) | Background Noise Level (dB) | MIA (m2) | Density (Persons/m2) | Crowd Size |
|---|---|---|---|---|
| 80 | 55 | 596 | 1.17 | 697 |
© 2018 by the author. Licensee MDPI, Basel, Switzerland. This article is an open access article distributed under the terms and conditions of the Creative Commons Attribution (CC BY) license (http://creativecommons.org/licenses/by/4.0/).
Share and Cite
Boren, B. Acoustic Simulation of Julius Caesar’s Battlefield Speeches. Acoustics 2019, 1, 3-13. https://doi.org/10.3390/acoustics1010002
Boren B. Acoustic Simulation of Julius Caesar’s Battlefield Speeches. Acoustics. 2019; 1(1):3-13. https://doi.org/10.3390/acoustics1010002
Chicago/Turabian StyleBoren, Braxton. 2019. "Acoustic Simulation of Julius Caesar’s Battlefield Speeches" Acoustics 1, no. 1: 3-13. https://doi.org/10.3390/acoustics1010002
APA StyleBoren, B. (2019). Acoustic Simulation of Julius Caesar’s Battlefield Speeches. Acoustics, 1(1), 3-13. https://doi.org/10.3390/acoustics1010002