Article

Corrosion of Studsvik R2 AlMg3.5 Alloy Under Simulated Cementitious Repository Conditions in Fly Ash Concrete Compared to Ordinary Portland Cement Concrete


1
Nuclear Engery, Department of Chemistry and Chemical Engineering, Chalmers University of Technology, 412 96 Gothenburg, Sweden
2
Fraunhofer Institute for Integrated Circuits IIS, 90768 Fürth, Germany
3
AB SVAFO, 611 82 Nyköping, Sweden
*
Author to whom correspondence should be addressed.
Corros. Mater. Degrad. 2026, 7(3), 56; https://doi.org/10.3390/cmd7030056
Submission received: 30 July 2026 / Revised: 11 September 2026 / Accepted: 15 September 2026 / Published: 17 September 2026

Abstract

Decommissioning of research reactors leads to significant amounts of low- and intermediate-level radioactive waste that is planned to be stored under cementitious conditions in Swedish repositories. These materials contain important amounts of aluminum and its alloys which are reactive under alkaline conditions found in concrete pore water. The corrosion produces hydrogen that can lead to cracks in the concrete which can be pathways for radioactive ions. As an attempt to optimize repository conditions for aluminum-based reactor waste, parts of the ordinary Portland cement I in the concrete were replaced by fly ash. This addition may reduce pH and alkali–carbonate reactions increase the durability of the concrete. Testing of fly ash concretes is also of interest from a future availability perspective given the potential phase out of ordinary Portland cement in favor of formulations such as fly ash variants with lower CO2 emissions. Decreased corrosion rates, more uniform corrosion accompanied by ATR-FTIR (Attenuated Total Reflectance—Fourier Transform Infrared Spectroscopy) spectra and µCT (Micro computed tomography) as well as SEM-EDX (Scanning Electron Microscopy with Energy Dispersive X-ray analysis) images suggest less aggressive corrosion of the Al alloy from the decommissioned Studsvik R2 reactor in concrete with varying amount of fly ash replacement.

1. Introduction

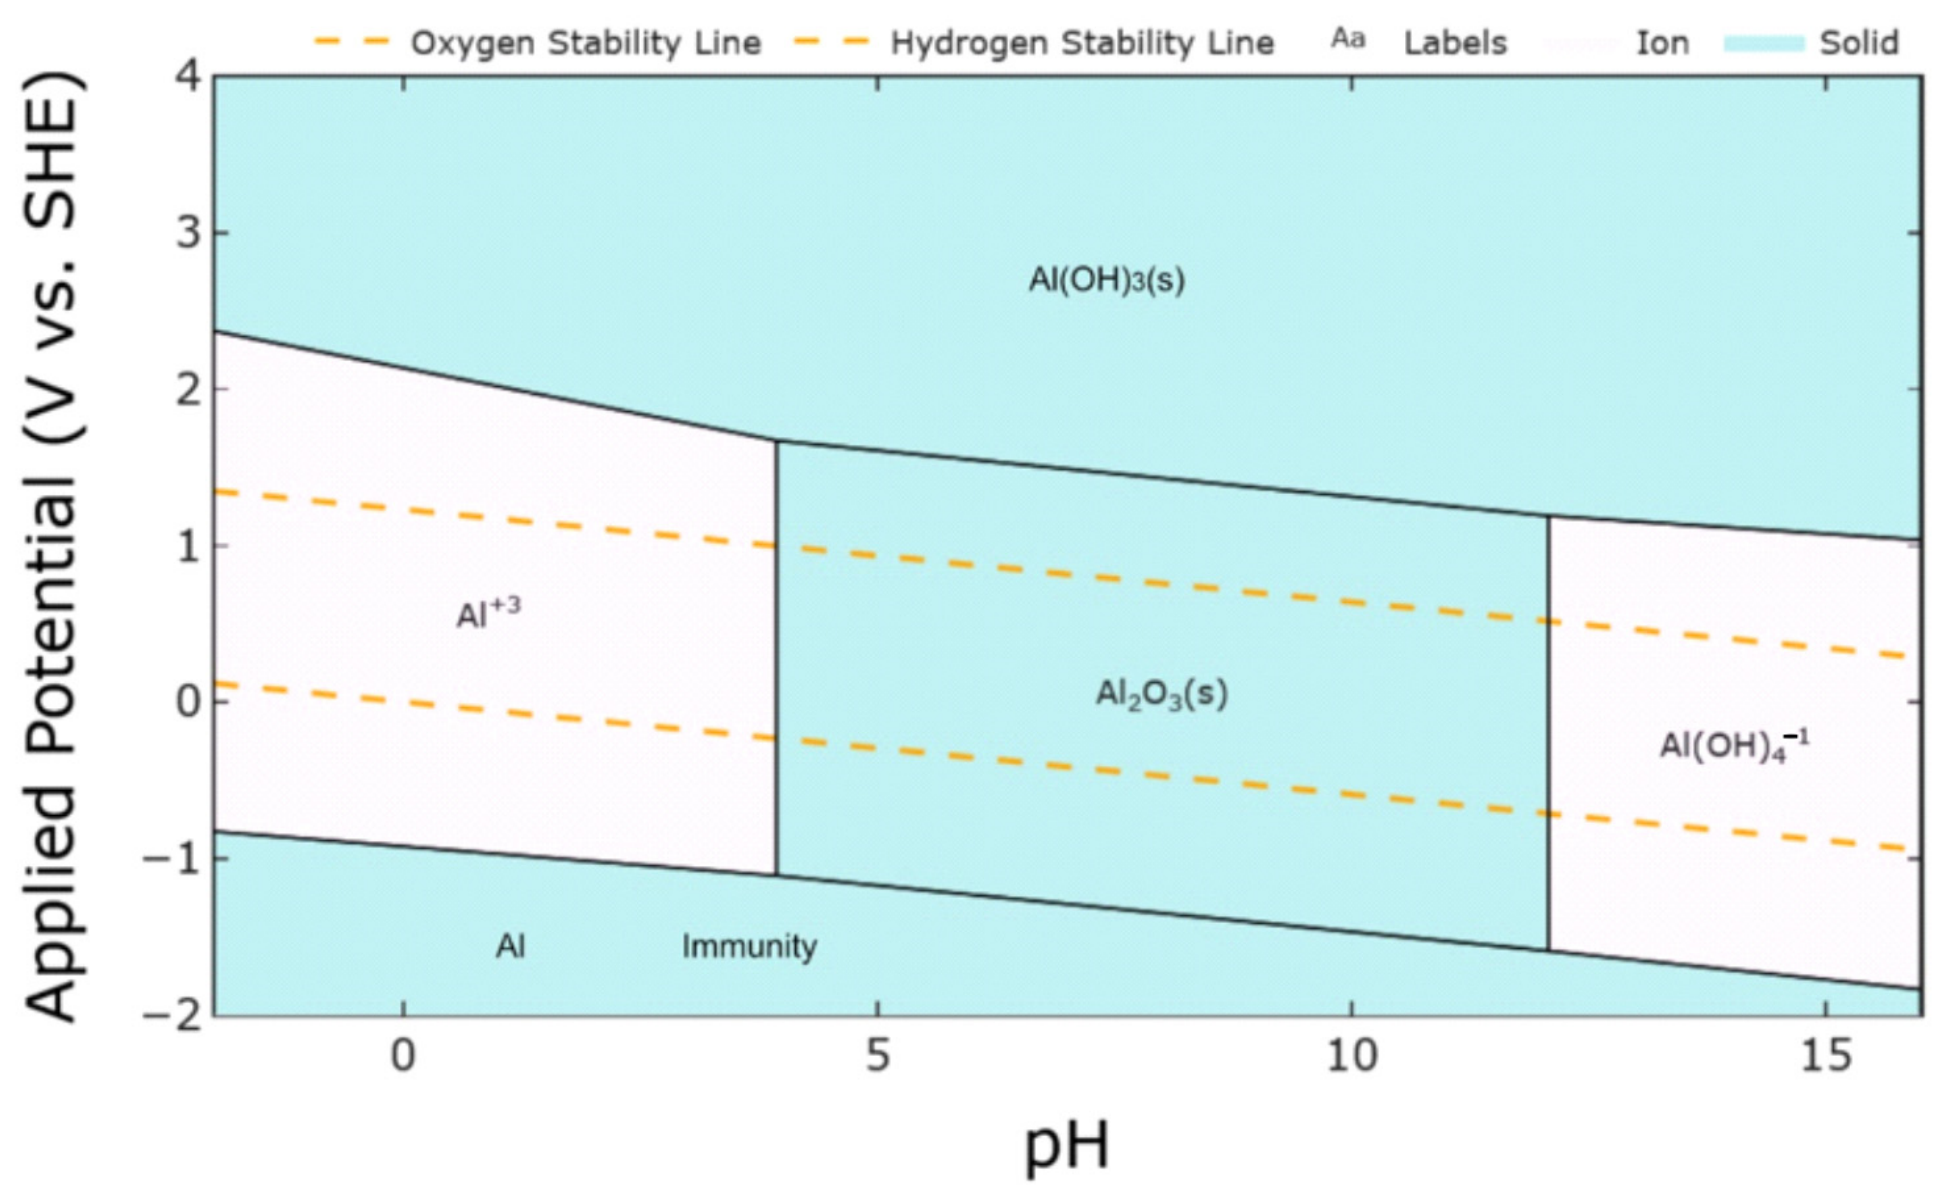
The decommissioning of nuclear research reactors generates significant amounts of low- and intermediate-level radioactive waste, which must be safely managed to protect both the environment and public health [1,2]. Long-term disposal solutions require repositories that can endure natural degradation and chemical alteration induced by the waste itself for extended life-times [2]. In the Swedish repository strategy, the waste is encapsulated in concrete which acts as an effective barrier due to its high pH and low permeability which enhances radionuclide retention through sorption and reduced solubility [3,4,5]. However, the initial pH of the pore water of up to 14 compromises the corrosion resistance of reactive metals such as aluminum and its alloys which are frequently used in nuclear research reactors [1,4,6]. Aluminum-based alloys and aluminum metals are prone to rapid initial corrosion in alkaline environments. This process slows after a short time due to the corrosion-induced formation of a protective oxide layer. While the layer does not completely prevent further corrosion, it reduces the corrosion rate significantly within a timescale ranging from seconds to weeks depending on surface properties [1,6]. The solid corrosion products formed during this process include the amorphous Al2O3 (Equation (1)) in early stages, the metastable AlOOH (Equation (2)) and crystalline Al(OH)3 in chronic corrosion (Equation (3)) [1,6,7,8]. In the aqueous phase, the dominant species is the [Al(OH)4] ion (Equation (4)), which is believed to be the main contributor to the gradual dissolution of the oxide layer under alkaline conditions [8]. A Pourbaix diagram is shown in Figure 1.
2 A l + 3 H 2 O A l 2 O 3 + 3 H 2
2 A l + 4 H 2 O 2 A l O O H + 3 H 2
2 A l + 6 H 2 O 2 A l O H 3 + 3 H 2
2 A l + 6 H 2 O + 2 O H 2 A l O H 4 + 3 H 2
The generation of hydrogen as seen in Equations (1)–(4) can build up pressure, potentially causing cracks in the concrete which form the channels and can be pathways for the migration of radionuclides due to groundwater ingress and therefore harm the long-term integrity of the repository [1,2,4,6,9,10].
Figure 1. Pourbaix diagram of aluminum with a concentration of 10−3 mol, pH ranging from 0 to 16 and potential from −2 to 4. Ions are shown in gray, solid products in green. Dashed lines show the oxygen stability (top) and hydrogen stability lines [11,12,13,14].
Cmd 07 00056 g001
The decommissioned Studsvik R2 reactor utilized an AlMg3.5 alloy for its core internals and reactor tank which closely resembles the composition of the 5154 aluminum alloy. Although limited research has been conducted on the Studsvik R2 alloy corrosion under repository or simulated repository conditions, our previous study reported initial high corrosion rates of 104 µm/y that slow down to rates in the magnitude of 103 after six months [15]. Previous investigations have utilized H2-induced pressure measurements, as well as mass loss evaluation, to determine the corrosion rates of the alloy [15,16]. It is also well-established that the presence or absence of oxygen does not significantly affect aluminum corrosion [17].
The partial substitution of Portland cement with fly ash (FA) is a known strategy to produce more ecofriendly concrete. This approach reduces the required amount of Portland cement, which contributes largely to the global CO2 emissions in concrete production, while FA is a waste by-product and can be recycled into a valuable material when utilized in concrete production [18]. The incorporation of fly ash can lower the compressive strength of the concrete; however, it significantly mitigates alkali–carbonate reactions which are a primary cause of expansion cracking [18,19]. Moreover, FA-containing concretes show reduced carbonation rates that limit the release of K+ and Na+ ions due to fewer alkali-carbonation reactions and, hence, contribute to lower pH values which can slow down the Al corrosion [18,19,20,21]. A noticeable reduced pH to 12.25 in concrete with 30% FA replacement has been observed after just 21 days by Ren et al. [19].
To examine the effect of FA replacement of cement in encapsulating concrete for the R2 alloy, samples have been immersed in FA concrete with 15, 30 and 45% replacement of cement and an elevated water–cement ratio of 0.7 and exposed for up to 1 year. The experiments have been conducted at room temperature (approximately 19 °C). Based on mass loss measurements, the corrosion rates were calculated and compared to previous data for ordinary Portland cement (OPC) concrete [15] under identical experimental conditions. Scanning electron microscopy with energy dispersive X-ray analysis (SEM-EDX) and Attenuated Total Reflectance—Fourier Transform Infrared Spectroscopy (ATR-FTIR) have been conducted on FA concrete and on separately exposed ordinary Portland cement concrete samples.

2. Materials and Methods

2.1. Sample Preparation

Rod-shaped samples of 15 mm length and 5 mm diameter were produced from unirradiated reference samples of the same materials as the Studsvik R2 reactor tank. The average roughness factor, caused by the machining of the samples, is not expected to impact the results significantly, especially considering the continuous corrosion-induced evolution of the surface area.

2.2. Concrete Production

2.2.1. Ordinary Portland CEM 1 Concrete

A total of 65.8 g of CEM 1 Portland cement (Chalmers Building Materials Lab, Gothenburg, Sweden), 13.2 g of calcium carbonate (Limus 40, Nordkalk, Köping, Sweden), 132 g of standard sand (EN 196-1 [22]) and 46.1 mL of ultrapure water (Milli-Q, Merck Life Science AB, Solna, Sweden, 18.2 MΩ·cm at 25 °C) were mixed to produce 250 g of concrete. A water–cement ratio of 0.7 was used to facilitate corrosion continuation throughout the experiment by increasing pore water availability.

2.2.2. Fly Ash Concrete

The FA concrete was produced iteratively; however, 15, 30 or 45% of the CEM 1 Portland cement was replaced by class F fly ash (Microsit M10 hard coal, Backstein Engineering GmbH, Idstein, Germany).

2.3. Mass Loss Evaluation

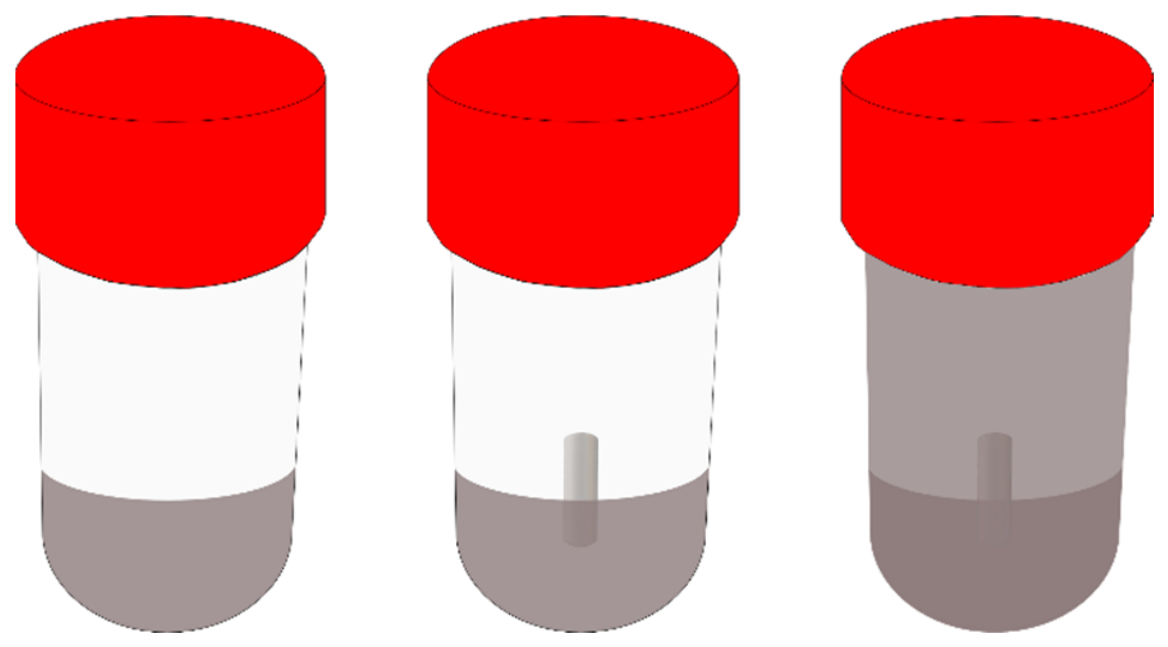
Approximately 20 mL of concrete or FA concrete were filled in unpressurized PP containers with LDPE screw caps (VWR, Radnor, PA, USA). The rod-shaped samples were weighed, then immersed centered into the concrete, and subsequently, the containers were filled with (FA) concrete as seen in Figure 2. After the required exposure time, the concrete was cracked open, and the samples were removed. For a full removal of the oxide layer and concrete residues, the alloy was pickled in an ultrasonic bath (Thermo Fisher Scientific, Waltham, MA, USA) for 20 min in 20% nitric acid. Afterwards, to soften and loosen the residues, the samples were soaked in silicon oil for approximately 24 h before carefully scraping them and repeating the pickling process. The samples were cleaned, dried and weighed. Most experiments were conducted in triplicates. To exclude the risk of corrosion due to the cleaning process, an as-fabricated sample was treated under the same pickling conditions leading to no mass loss.

2.4. Modeling of pH Evolution

A model showing pH evolution and associated mineralogical alterations of the OPC and FA concrete systems was simulated using PHREEQC 3.8.6 based on present concrete compositions and previous studies [23,24,25,26,27,28]. It was run as an evolving system evaluating carbonation over a 6-month period including a simulation of a buffering capacity provided by a Portlandite and C-S-H buffer phase. These phases were considered to describe the gradual decrease in pH associated with carbonation and mineralogical changes such as the dissolution of Portlandite, the decalcification of C-S-H phases and the formation of calcite and other carbonate phases. Several limitations should be considered: the simplified representation of C-S-H phases and the concrete pore structure may not fully display carbonation processes in their actual complexity; the six-month simulation does not provide information about long-term carbonation behavior. However, the model shows a representation of the investigated system based on relevant concrete compositions and kinetic principles reported in the previously mentioned studies [23,24,25,26,27,28].

2.5. Calculation of Corrosion Rates

By calculating the mass loss of the samples from before exposure to after cleaning of the surfaces, the corrosion rates were calculated. By including the density of aluminum, the volume of the corroded aluminum could be determined. Thehe potential for localized corrosion (pitting) and the likely continuously increasing true surface area of the samples with time can lead to a fairly large uncertainty concerning the actual surface area of the corroding samples. Initial tests with krypton BET did not produce a reliable surface area for the corroded samples. It was therefore decided to use the same initial geometrical surface area of the samples as the basis for calculating the µm/y corrosion rates of the samples.

2.6. Micro Computed Tomography (µCT)

µCT has been conducted at Fraunhofer Institute for Integrated Circuits IIS (Fürth, Germany). A microtomography machine with a 225 kV microfocus X-ray source and granite-based construction was used. To analyze the images, the software myVGL 2025.4 (Volume Graphics GmbH, Heidelberg, Germany) was employed.

2.7. Attenuated Total Reflectance—Fourier Transform Infrared Spectroscopy (ATR-FTIR)

Loose concrete was removed and the oxide layer was carefully scraped off from the surface. The FTIR (Spectrum 3, PerkinElmer, Waltham, MA, USA) was equipped with an ATR cell (GladiATR™, Pike Technologies, Fitchburg, WI, USA) and the spectra were measured from 400 cm−1 to 4000 cm−1 with a resolution of 4 cm−1 and 32 scans. The spectra were recorded with the blank ATR cell as background.

2.8. Scanning Electron Microscopy with Energy Dispersive X-Ray Analysis (SEM-EDX)

SEM images and EDX spectra were obtained using 15 kV on a Phenom ProX Desktop SEM (Thermo Fisher Scientific, Waltham, MA, USA).

3. Results

3.1. Mass Loss Evaluation

Cleaning of Surfaces

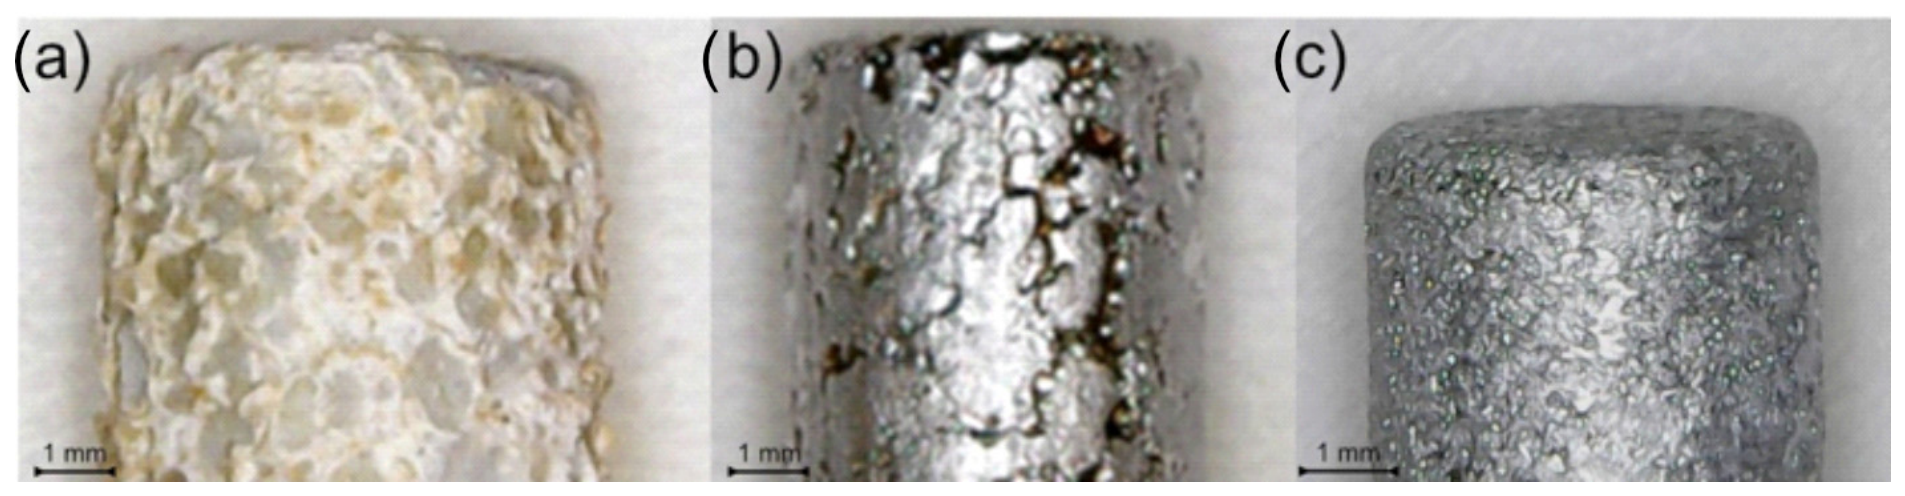
Full removal was confirmed with microscopic pictures as seen in Figure 3. Figure 3a shows a sample before and Figure 3b after the cleaning procedure at 1 year of exposure in OPC concrete whereas Figure 3c shows the same type of sample that was immersed in 30% FA concrete for 1 year. The sample immersed in FA concrete shows a more uniform corrosion while the sample in OPC shows more pronounced pits.

3.2. Model: pH Evolution and Mineralogical Alterations

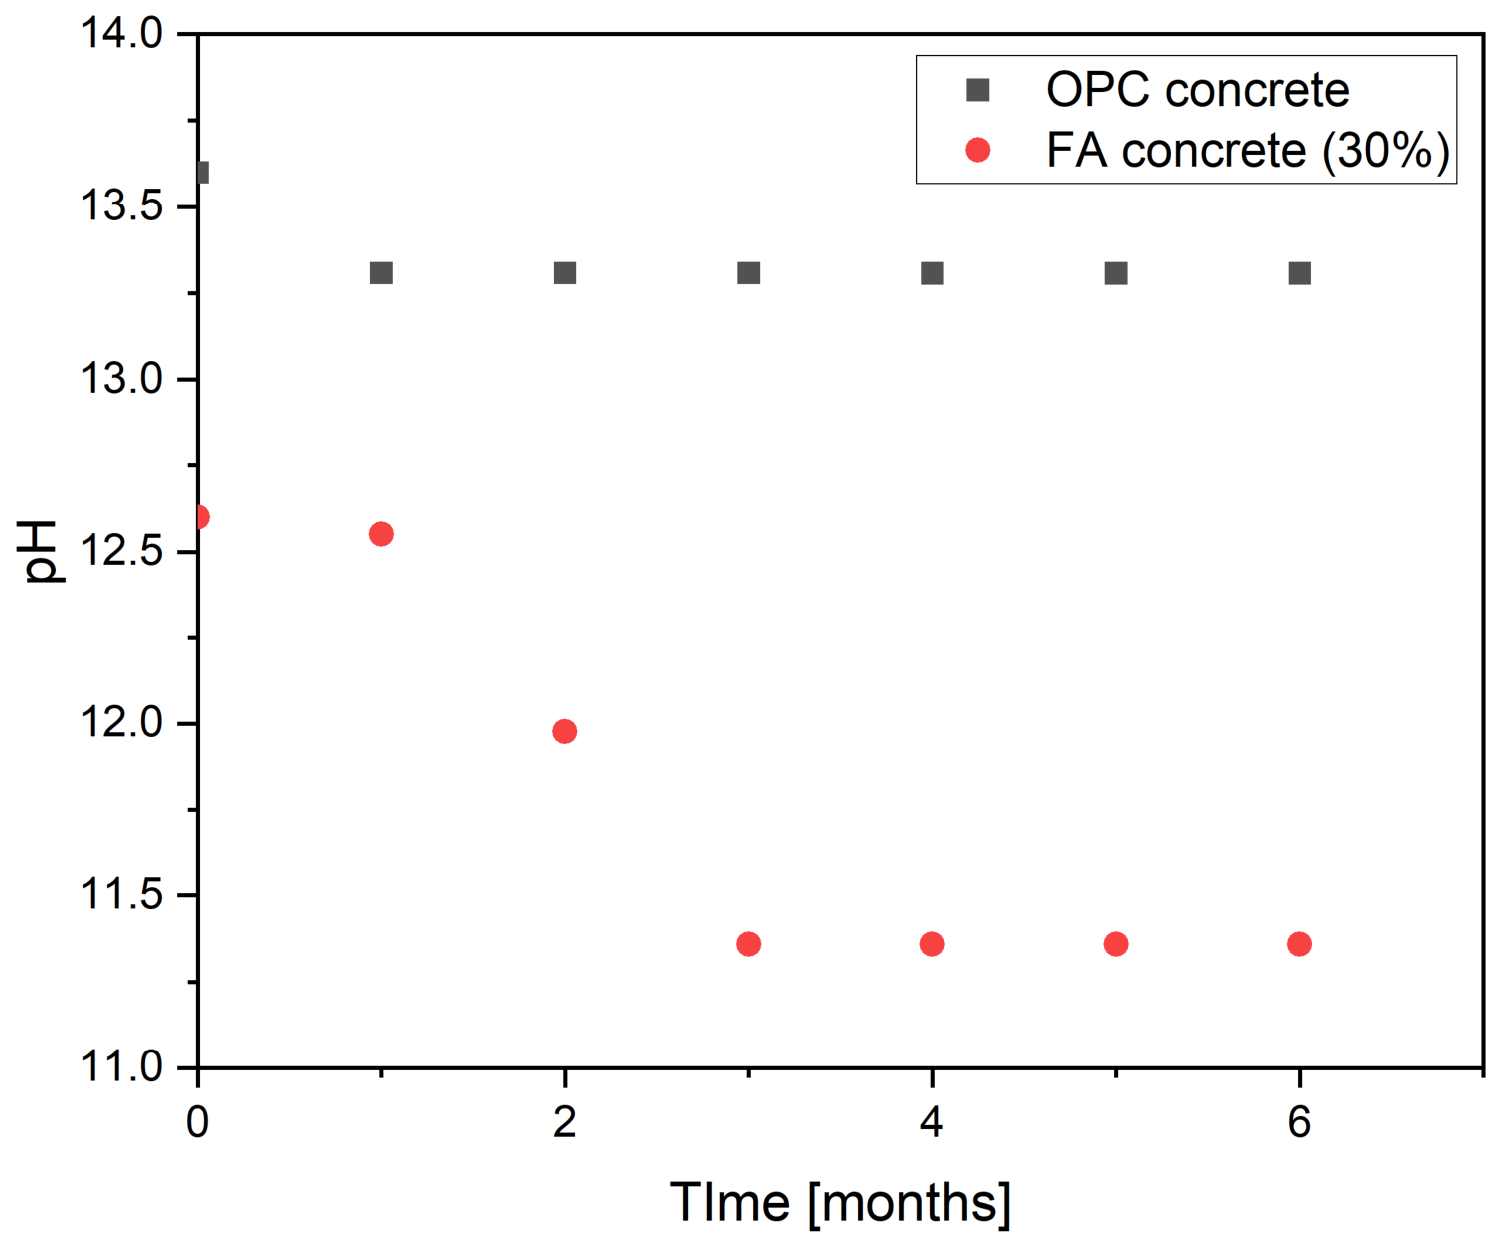
The simulation of the pH evolution and mineralogical alterations in OPC concrete compared to FA concrete shows a slight drop in pH from the initial 13.6 to 13.31 in OPC after 6 months. In FA concrete, the pH drops slightly from 12.6 to 12.55 within the first month and then more rapidly to 11.36 after 6 months, as shown in Figure 4.

3.3. Corrosion Rates

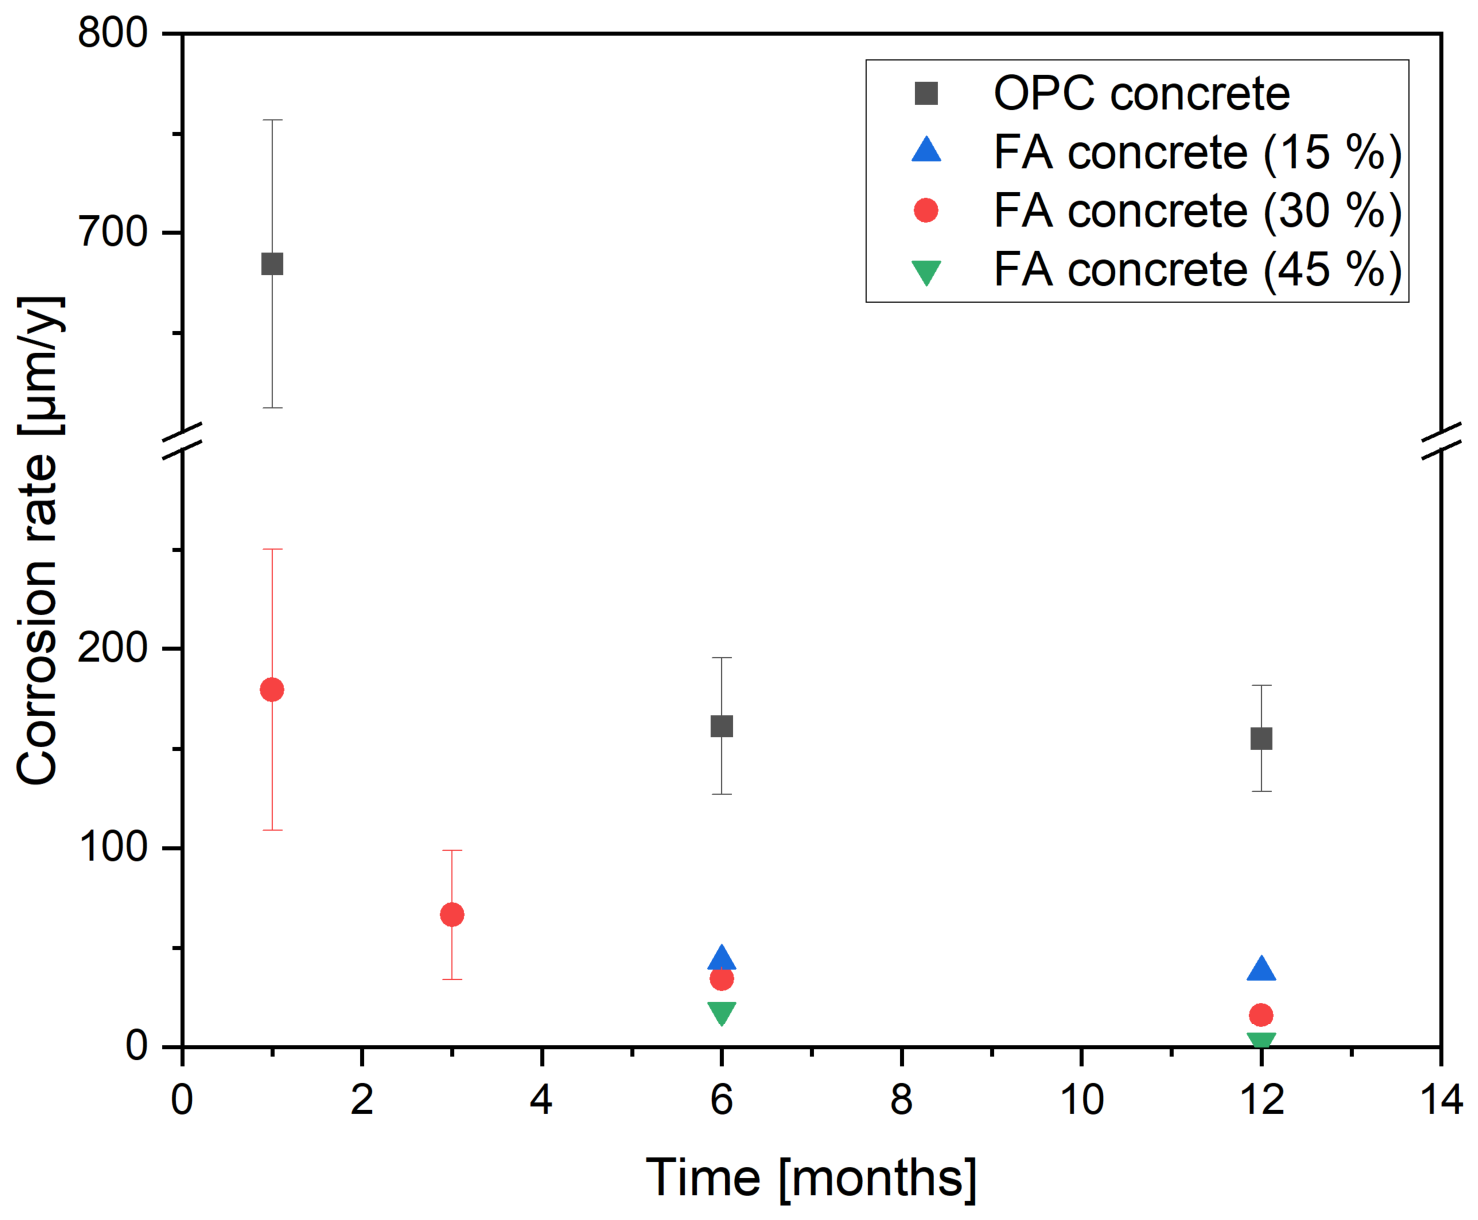
The corrosion rates of the R2 alloy in concrete in µm/y during a time span of up to 12 months are shown in Figure 5. The largest share of datapoints was selected for 30% FA concrete, as this composition was assumed to offer the best trade-off between pH-induced benefits and only modest influence on the concrete’s physical properties due to the CEM replacement by FA. Seen in black (square) is the corrosion rates in OPC concrete starting with high values of 684 ± 73 µm/y after 1 month and then decreasing strongly to 166 ± 34 µm/y after 6 months and 155 ± 26 µm/y after 1 year. Seen in blue (north triangle) is the corrosion rate of the R2 alloy in 15% FA concrete after 6 months at 44 µm/y and after 12 months at 38 µm/y. The corrosion rate in 30% FA concrete in red (circle) shows corrosion rates of 179 ± 71 µm/y after 1 month, 66 ± 32 µm/y after 3 months, 35 ± 3 µm/y after 6 months and 16 µm/y after 12 months. In 45% FA concrete, shown in green (south triangle), the corrosion rate after 6 months was 19 µm/y and 3 µm/y after 12 months.

3.4. Micro Computed Tomography (µCT)

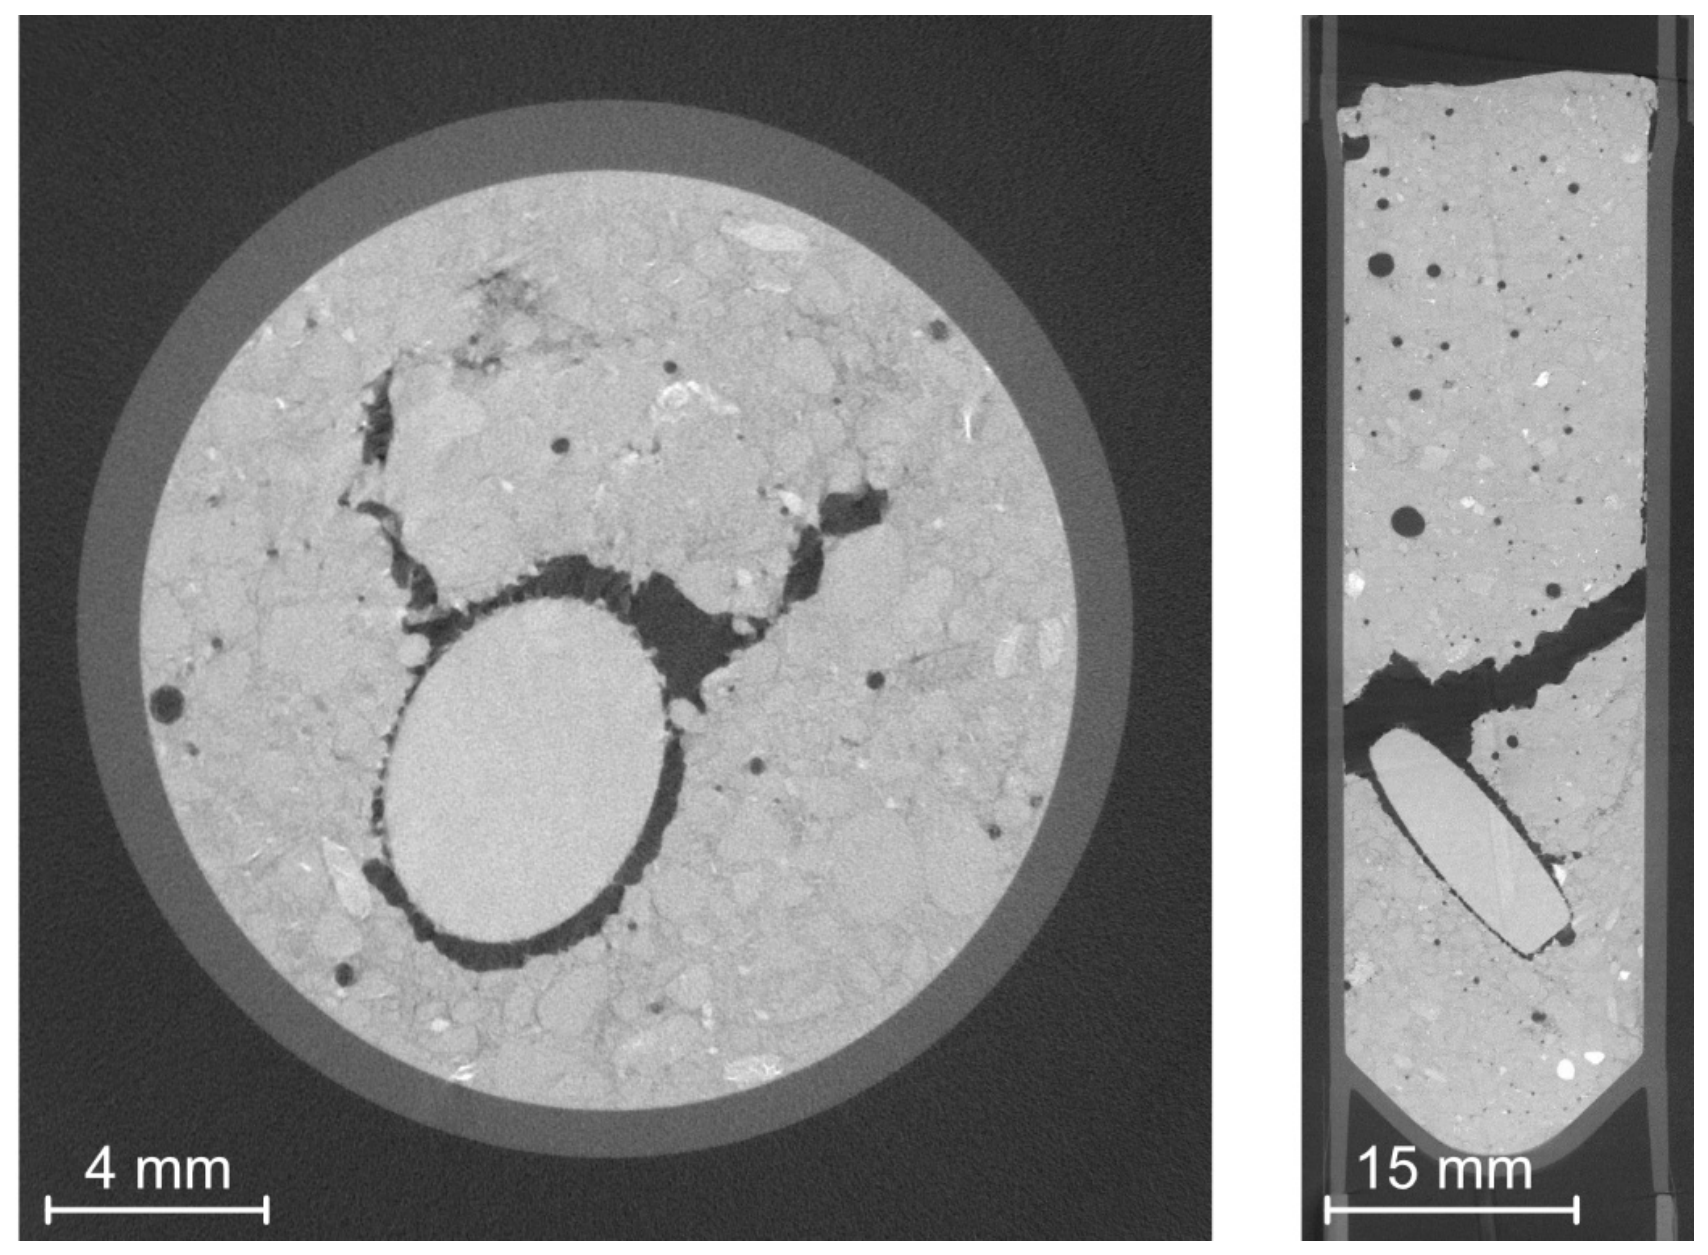
Figure 6 shows µCT images of an R2 alloy sample immersed in OPC after 3 months of exposure. These conditions have been selected since significant cracks could be seen without further analysis. It clearly shows the separation of the sample from its matrix in the form of dendritic gas channeling that led to a crack throughout the concrete with a maximum width of 7.68 mm. A slight separation of the sample from the concrete could also be seen in 30% FA concrete with 0.59 mm after 6 months of exposure.

3.5. Attenuated Total Reflectance—Fourier Transform Infrared Spectroscopy (ATR-FTIR)

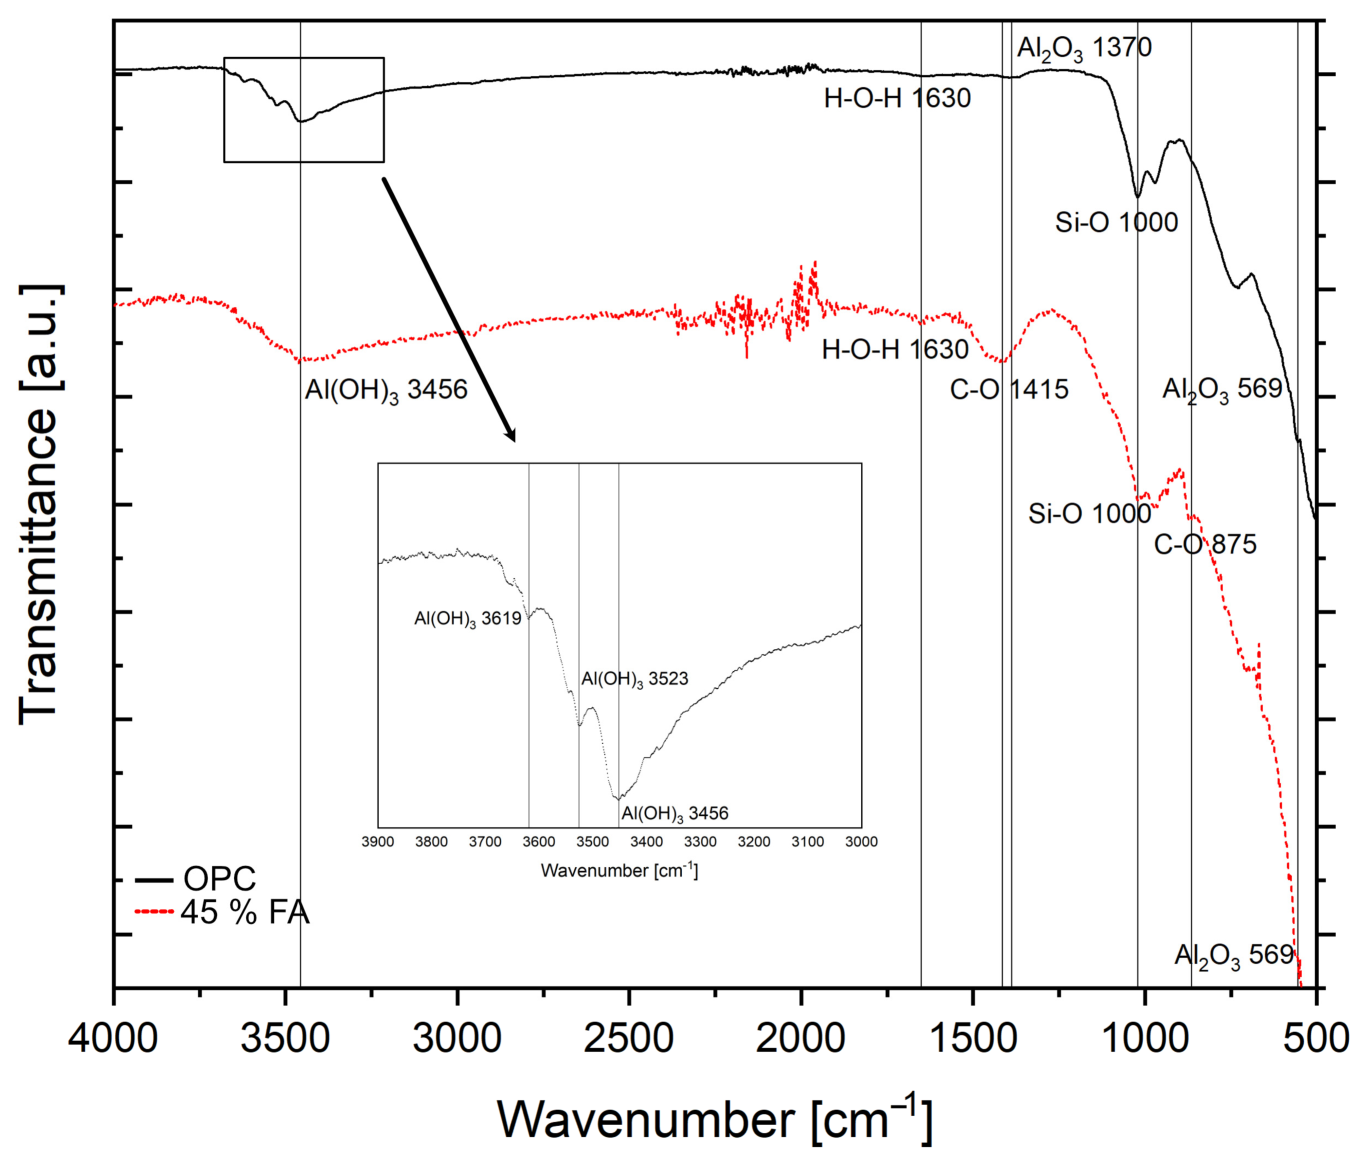
The infrared spectrum of the surface material of the R2 alloy after 6 months of exposure in 45% FA concrete (red, lower spectrum) and OPC concrete (black, upper spectrum) are shown in Figure 7. These conditions have been chosen to represent the strongest effect of the CEM replacement by FA. The transmittance is shown from 500 to 4000 cm−1. In OPC, bands were detected at 569, 1000, 1370, 1630, 3456, 3523 and 3619 cm−1. In FA-containing concrete, bands were detected at 569, 875, 1000, 1415, 1630 and 3456 cm−1. The resolution of the spectrum in FA-containing concrete is noticeably worse than in OPC concrete.

3.6. Scanning Electron Microscopy with Energy Dispersive X-Ray Analysis (SEM-EDX)

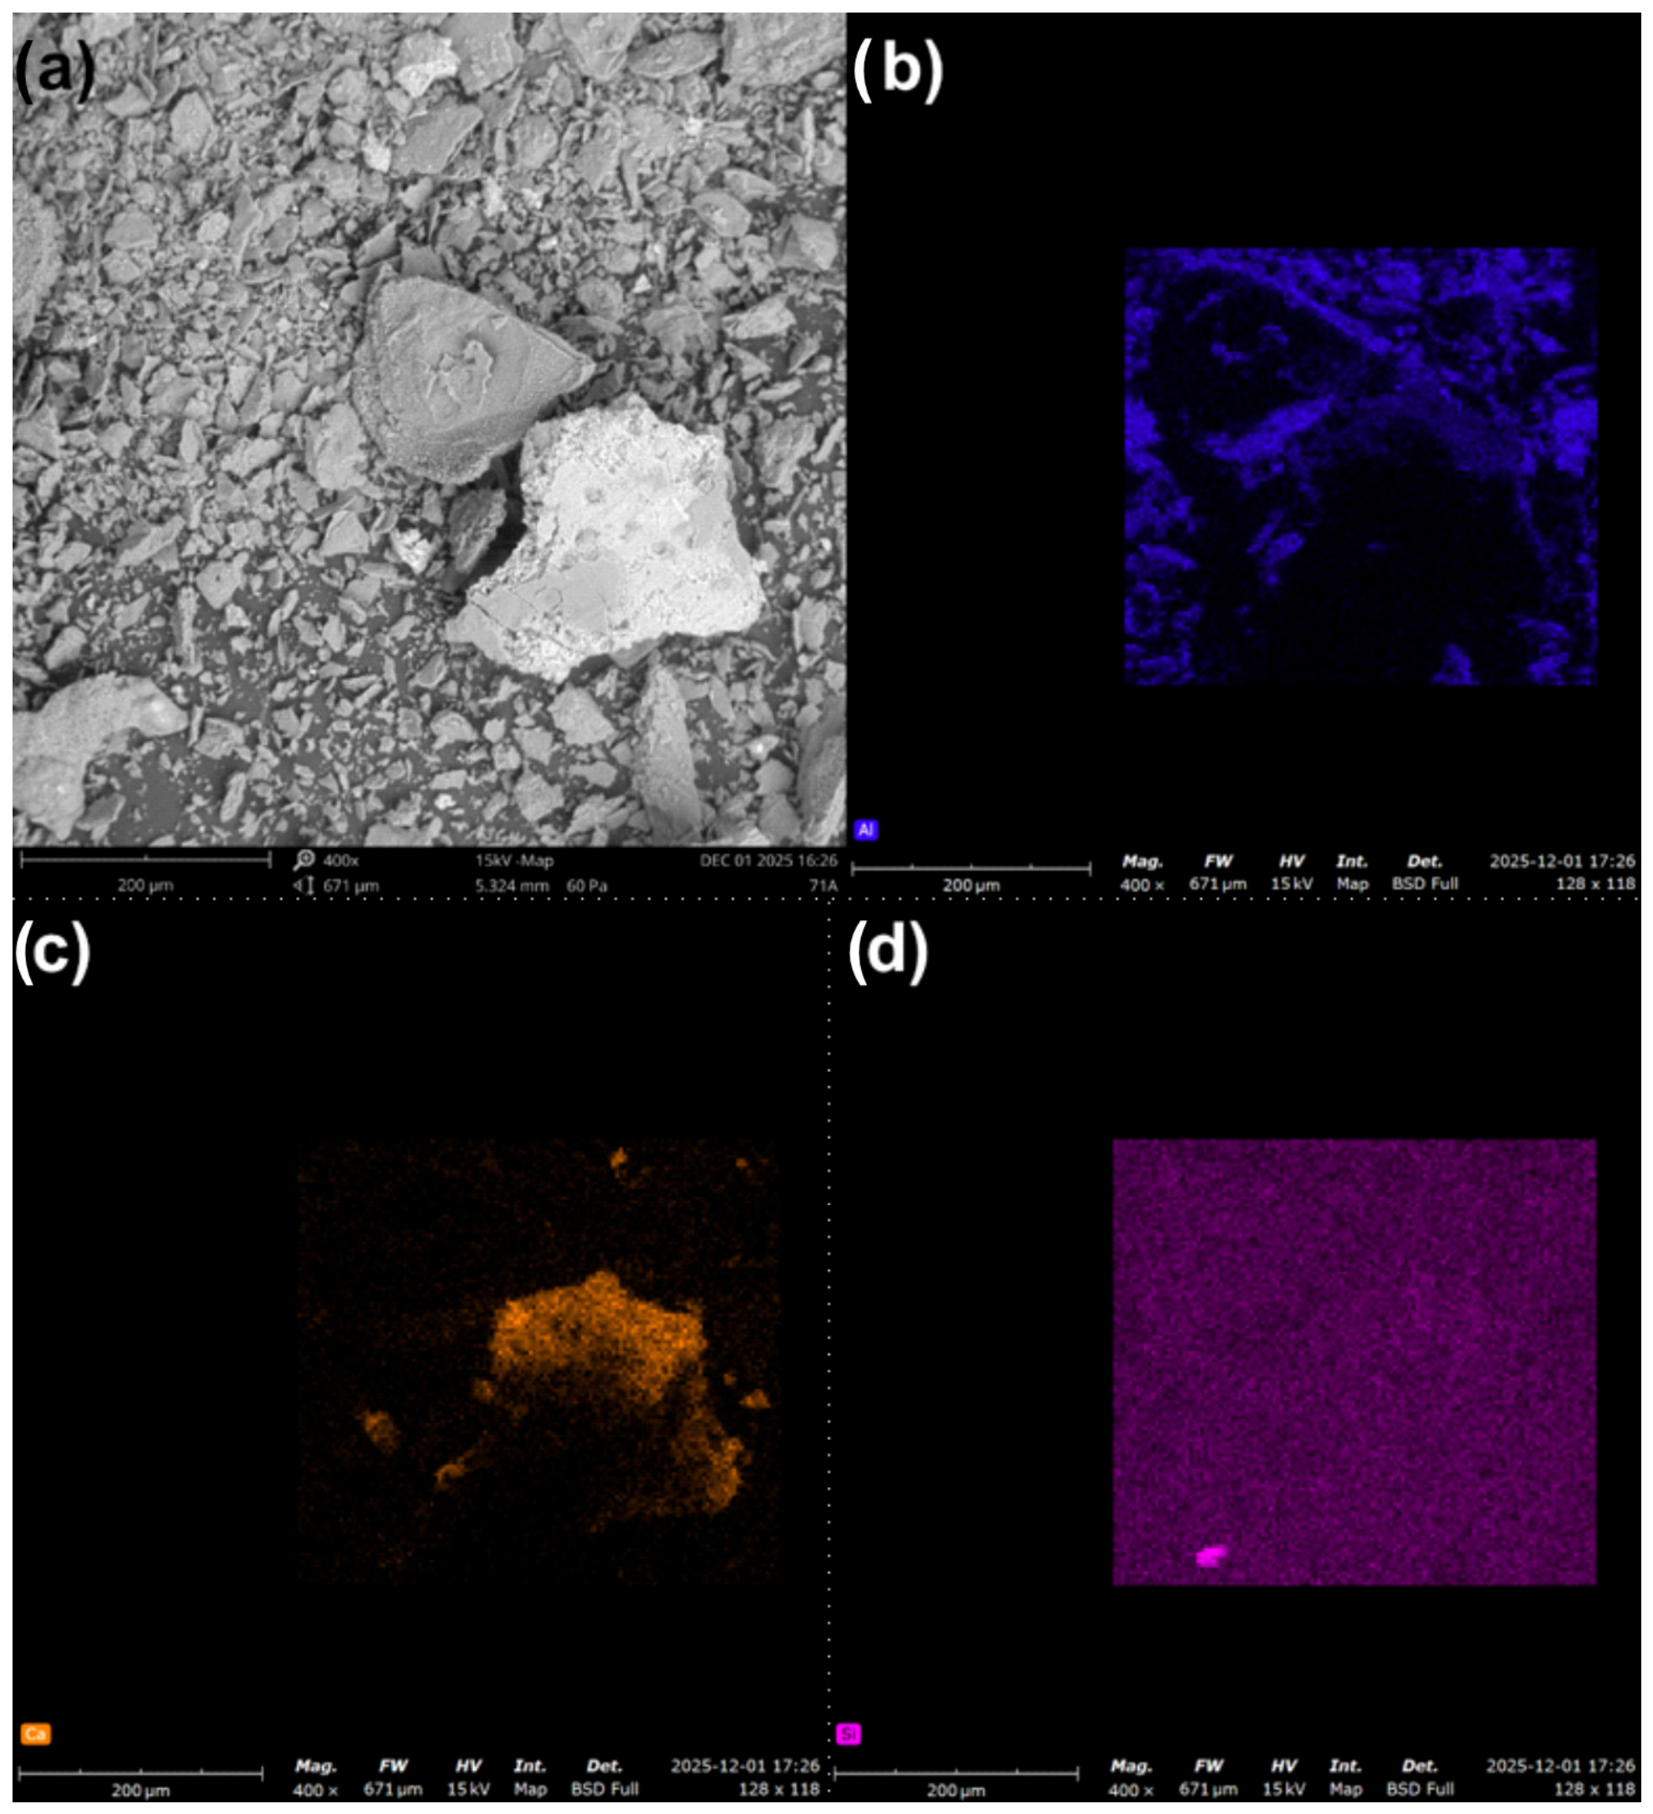
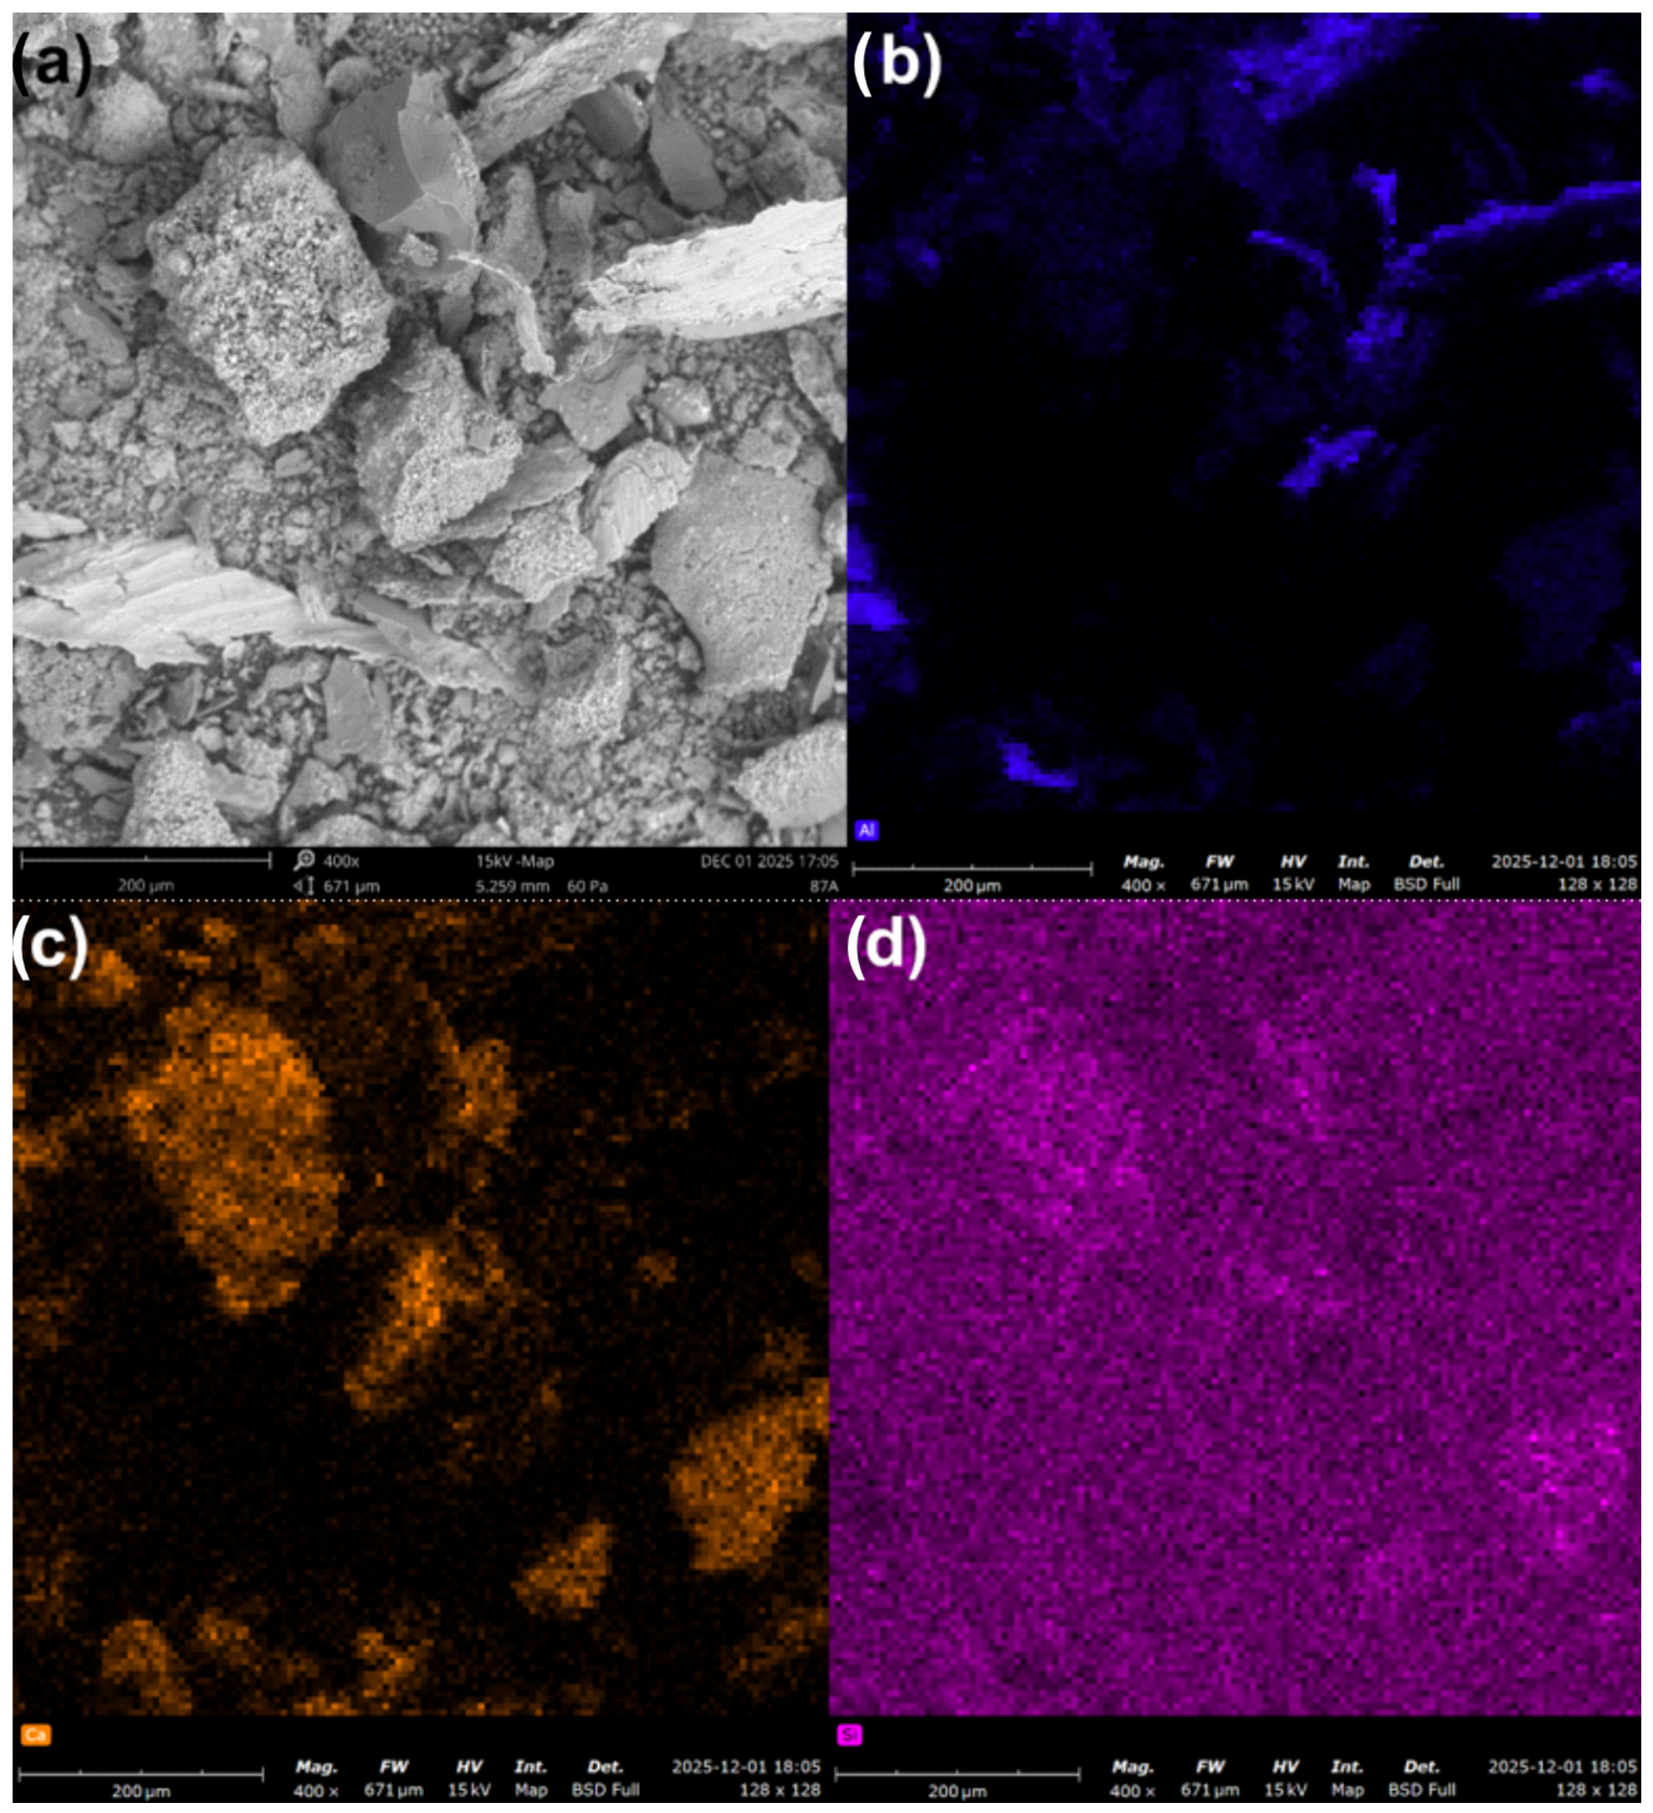
The surface material of a sample that was exposed for six months in OPC concrete is seen in Figure 8. The overview of different phases in Figure 8 also contains the mapped section (Figure 8a). The elementary composition was at 65% O, 33% Al and only low amounts of Ca and Si. The materials size is between 10 and 200 µm. The mapping in Figure 8b–d shows that Al and Ca are enriching in different areas while Si only occurs very rarely.
Microscopic images of the surface material of a sample after exposure in 45% FA for six months are shown in Figure 9. This condition has been chosen to display the differences induced to the CEM replacement by FA. Figure 9 shows an overview of different phases in the sample with grain sizes between 10 and 200 µm as a secondary electron image with Figure 9a as the mapped section. The elementary composition of this area was 54% O, 30% Al, 8% Ca, 4% Si and other metals. Figure 9b–d shows the mapping of Al, Ca and Si. Al and Ca are enriched separately. Si seems to be enriched in the same position as Ca.

4. Discussion

4.1. Mass Loss Evaluation

The corrosion rates in concrete with FA replacement were significantly lower than the R2 alloy in OPC as seen in Figure 5. Replacing 30% of the Portland cement with FA caused a decrease in the corrosion rate from 161 µm/y in OPC to 35 µm/y after 6 months. A 15% FA replacement also reduced the rate significantly to 44 µm/y after 6 months. The highest reduction could be seen with 45% FA replacement with a 6-month rate of 19 µm/y. This trend continued after 12 months of corrosion. It can be explained by a lower pH value, given through an initially lower alkali content and enhanced alkali binding capacity through C-S-H phases in the FA concrete; hence, a reduction in K+ and Na+ ions in pore solution leads to less alkali–carbonate reactions [19]. Another factor lowering the pH of the FA concrete is the limited carbonation due to partial replacement of the cement. FA-containing concrete is known to have a reduced compressive strength which, however, is assumed to be tolerable at lower FA concentrations considering a reduced expansion cracking due to the decrease in alkali-carbonation reactions. Porosity should be considered at higher FA concentrations [18,19]. These factors can also be seen in the extent of pitting corrosion in Figure 3. While the sample that was exposed to OPC concrete shows a higher extent of corrosion and many pits, the corrosion of the sample exposed in FA concrete appears to have corroded more uniformly. In the higher-pH environment of the OPC concrete, a thicker and more stable surface layer was formed which then confined chloride attack to discrete weak points commonly at Al-Mg grain boundary areas or intermetallic particles that act as local anodes. With decreasing pH as in the FA concrete, the oxide layer will be thinner, less stable and more likely to break down uniformly [29,30,31]. The high corrosion rates are also supported by µCT images, seen in Figure 6, showing the channeling in the concrete caused by hydrogen-induced pressure due to extensive corrosion of the alloy [1,2,4,6,9,10]. Lower corrosion rates in FA concrete compared to OPC are also consistent with the simulation of pH evolution based on initial pore solution chemistry, impact of CO2 ingress and carbonation processes as seen in Figure 4 [23,24,25,26,27]. Potential effects of FA on physical concrete properties such as porosity, pore-size distribution and microstructure should be considered However, based on previous studies, these were considered secondary compared to effects induced by changes in pH environment with given concrete compositions [28].

4.2. Attenuated Total Reflectance—Fourier Transform Infrared Spectroscopy (ATR-FTIR)

Both spectra, R2 alloy immersed in OPC concrete and FA concrete, showed bands at 569 cm−1, as seen in Figure 7. These are common for Al2O3 due to the Al-O bending [32] which is also consistent with the formation of the oxidation layer [1,6,7,8]. Another band common for Al2O3 in the spectrum of the sample immersed in OPC was seen at 1370 cm−1 and is caused by Al-O-H stretching vibrations [32]. A band at 1000 cm−1 was found in both spectra and suggests asymmetric Si-O vibrations due to the formation of C-S-H phases [33]. The formation of C-S-H phases is also suggested by a band in both spectra at 1630 cm−1 and is common for H-O-H stretching [33]. While observed C-S-H phases could also be induced by unreacted FA particles, it has been considered to be negligible due to the prior removal of loose concrete on the surface. The spectrum from the OPC concrete exposure shows bands at 3456, 3523, 3619 cm−1 which are common for Al(OH)3 due to interlayer OH groups [34]. While only one of those bands (3456 cm−1) was found after exposure in FA concrete, this spectrum showed bands at 875 and 1415 cm−1 which proposes CO32− vibrations and asymmetric stretching, respectively [33]. Those bands suggest higher extent of carbonation which is consistent with early-stage higher carbonation depth due to the addition of FA which leads to a carbonation resistance in later stages [35]. Less peaks consistent with the formation of Al(OH)3 and Al2O3 suggest an inhibited corrosion with the addition of FA. This is also consistent with a higher noise and less distinct peaks in this sample since it suggests lower crystallinity [36].

4.3. Scanning Electron Microscopy with Energy Dispersive X-Ray Analysis (SEM-EDX)

The SEM-EDX images showed a higher percentage of Al concentration in the mapping of the sample that was exposed to OPC concrete (Figure 8). The mapping was chosen to be representative for the sample. Lower concentration of Al in the surface materials suggests that the corrosion was more aggressive compared to FA concrete which is consistent with the results of this study and the literature [18,19,20,21]. This is also supported by the ATR-FTIR spectra showing FTIR bands of the Al oxidation products. Al and Ca were enriched mostly in different regions due to the formation of Al2O3, Al(OH)3 and Ca(OH)2 [1,6,7,8,20]. However, in the sample that was exposed to FA concrete for 6 months (Figure 8), the overall Al concentration is lower accompanied by higher Ca and Si concentrations. Moreover, Ca and Si seem to be enriched in the same phases which suggests a higher extent in the formation of C-S-H phases which also suggests a lower pH value due to the consumption of Ca2+ ions and incorporating of alkali ions in these phases [37,38].

5. Conclusions

The addition of FA to the concrete composition in cementitious repository conditions was assumed to be advantageous concerning pH and an inhibited corrosion of aluminum-containing reactor materials. Studies on corrosion rates and surface characteristics showed significantly decreased corrosion rates in FA-containing concrete with decreasing values for increasing FA concentrations. Images of the sample surface also suggested less aggressive conditions leading to a more uniform corrosion when adding FA. The aggressive conditions of the OPC are supported by µCT images showing cracks in the concrete through hydrogen-induced pressure. ATR-FTIR spectra showed less distinct bands in FA concrete which could indicate lower crystallinity of oxidation products compared to OPC concrete which is consistent with a lower pH environment. SEM-EDX results supported the other examinations made through the FTIR spectrum by suggesting an increased formation of C-S-H phases which is most likely accompanied by decreased pH values. Whether progressive carbonation eventually lowers the FA pore solution pH past the passivation threshold will be examined in future studies with alternative concrete compositions and longer exposure times. Moreover, future studies on FA concrete will be conducted with 30% FA replacement to reduce the effects on physical concrete properties compared to 45% replacement, and to achieve a more significant pH effect compared to 15% replacement.

Author Contributions

Conceptualization, M.S. and A.P.; methodology, M.S. and A.P.; software, M.S. and C.K.; validation, M.S. and A.P.; formal analysis, M.S. and C.K.; investigation, M.S.; resources, M.S.; data curation, M.S.; writing—original draft preparation, M.S.; writing—review and editing, A.P.; visualization, M.S.; supervision, A.P.; project administration, A.P.; funding acquisition, A.P. All authors have read and agreed to the published version of the manuscript.

Funding

AB Svafo as well as the Swedish Nuclear Fuel and Waste Management Co. (SKB) are greatly acknowledged for funding this research.

Data Availability Statement

The raw data supporting the conclusions of this article will be made available by the authors on request.

Acknowledgments

AB Svafo as well as the Swedish Nuclear Fuel and Waste Management Co. (SKB) are greatly acknowledged for funding this research. Chalmers Building Materials Lab is acknowledged for providing material for concrete. The authors want to thank Daniel Hoffmann and Simon Duda for their help.

Conflicts of Interest

Author Anders Puranen was employed by the company AB SVAFO. Christian Kretzer was employed by Fraunhofer IIS. The remaining authors declare that the research was conducted in the absence of any commercial or financial relationships that could be construed as a potential conflict of interest.

References

  1. Herting, G.; Odnevall, I. Corrosion of aluminium and zinc in concrete at simulated conditions of the repository of low active waste in Sweden. Corros. Mater. Degrad. 2021, 2, 150–162. [Google Scholar] [CrossRef] [Scilit]
  2. Santana, L.P. Management of radioactive waste: A review. Proc. Int. Acad. Ecol. Environ. Sci. 2016, 6, 38. [Google Scholar]
  3. SSM (The IAEA Integrated Review Service for Radioactive Waste and Spent Fuel Management, Decommissioning and Remediation (ARTEMIS)). Kingdom of Sweden—ARTEMIS. Self-Assessment Report 2023; The IAEA Integrated Review Service for Radioactive Waste and Spent Fuel Management, Decommissioning and Remediation (ARTEMIS): Stockholm, Sweden, 2023. [Google Scholar]
  4. Kinoshita, H.; Swift, P.; Utton, C.; Carro-Mateo, B.; Marchand, G.; Collier, N.; Milestone, N. Corrosion of aluminium metal in OPC- and CAC-based cement matrices. Cem. Concr. Res. 2013, 50, 11–18. [Google Scholar] [CrossRef] [Scilit]
  5. Atkins, M.; Glasser, F. Application of Portland cement-based materials to radioactive waste immobilization. Waste Manag. 1992, 12, 105–131. [Google Scholar] [CrossRef] [Scilit]
  6. Tabrizi, M.; Lyon, S.; Thompson, G.; Ferguson, J. The long-term corrosion of aluminium in alkaline media. Corros. Sci. 1991, 32, 733–742. [Google Scholar] [CrossRef] [Scilit]
  7. Ezuber, H.; El-Houd, A.; El-Shawesh, F. A study on the corrosion behavior of aluminum alloys in seawater. Mater. Des. 2008, 29, 801–805. [Google Scholar] [CrossRef] [Scilit]
  8. Xiao, F.; Yang, R.; Liu, Z. Active aluminum composites and their hydrogen generation via hydrolysis reaction: A review. Int. J. Hydrogen Energy 2022, 47, 365–386. [Google Scholar] [CrossRef] [Scilit]
  9. Pyun, S.-I.; Moon, S.-M. Corrosion mechanism of pure aluminium in aqueous alkaline solution. J. Solid State Electrochem. 2000, 4, 267–272. [Google Scholar] [CrossRef] [Scilit]
  10. Jana, D.; Tepke, D.G. Corrosion of aluminum metal in concrete–a case study. In Proceedings of the 32nd International Conference on Cement Microscopy, New Orleans, LA, USA, 28–31 March 2010; pp. 33–65. [Google Scholar]
  11. Jain, A.; Ong, S.P.; Hautier, G.; Chen, W.; Richards, W.D.; Dacek, S.; Cholia, S.; Gunter, D.; Skinner, D.; Ceder, G. Commentary: The Materials Project: A materials genome approach to accelerating materials innovation. APL Mater. 2013, 1, 011002. [Google Scholar] [CrossRef] [Scilit]
  12. Patel, A.M.; Nørskov, J.K.; Persson, K.A.; Montoya, J.H. Efficient Pourbaix diagrams of many-element compounds. Phys. Chem. Chem. Phys. 2019, 21, 25323–25327. [Google Scholar] [CrossRef] [Scilit] [PubMed]
  13. Singh, A.K.; Zhou, L.; Shinde, A.; Suram, S.K.; Montoya, J.H.; Winston, D.; Gregoire, J.M.; Persson, K.A. Electrochemical stability of metastable materials. Chem. Mater. 2017, 29, 10159–10167. [Google Scholar] [CrossRef] [Scilit]
  14. Persson, K.A.; Waldwick, B.; Lazic, P.; Ceder, G. Prediction of solid-aqueous equilibria: Scheme to combine first-principles calculations of solids with experimental aqueous states. Phys. Rev. B Condens. Matter Mater. Phys. 2012, 85, 235438. [Google Scholar] [CrossRef] [Scilit]
  15. Schobel, M.; Ekberg, C.; Retegan Vollmer, T.; Wennerlund, F.; Hedström, S.; Puranen, A. Study of corrosion characteristics of AlMg3. 5 alloy by hydrogen-induced pressure and mass loss evaluation under simulated cementitious repository conditions. Corros. Mater. Degrad. 2025, 6, 27. [Google Scholar] [CrossRef] [Scilit]
  16. Schobel, M.; Ekberg, C.; Retegan Vollmer, T.; Puranen, A. Corrosion characteristics of Studsvik R2 Al-alloy by hydrogen evolution under simulated repository conditions. In Proceedings of the WM2025 Conference, Phoenix, AZ, USA, 9–13 March 2025. [Google Scholar]
  17. Mauret, P.; Lacaze, P. Water corrosion studies of AlMg (5154) and AlCuMg (2024) aluminium alloys by gas chromatography. Corros. Sci. 1982, 22, 321–329. [Google Scholar] [CrossRef] [Scilit]
  18. Ganapathy, G.P.; Kaliyappan, S.P.; Ramamoorthy, V.L.; Shanmugam, S.; AlObaid, A.; Warad, I.; Velusamy, S.; Achuthan, A.; Sundaram, H.; Vinayagam, M. Low alkaline vegetation concrete with silica fume and nano-fly ash composites to improve the planting properties and soil ecology. Nanotechnol. Rev. 2024, 13, 20230201. [Google Scholar] [CrossRef] [Scilit]
  19. Ren, X.; Li, W.; Mao, Z.; Deng, M. Inhibition of the alkali-carbonate reaction using fly ash and the underlying mechanism. Crystals 2020, 10, 484. [Google Scholar] [CrossRef] [Scilit]
  20. Shafigh, P.; Yousuf, S.; Ibrahim, Z.; Alsubari, B.; Asadi, I. Influence of fly ash and GGBFS on the pH value of cement mortar in different curing conditions. Adv. Concr. Constr. 2021, 11, 419–428. [Google Scholar]
  21. Sequeira, L.; Forero, J.; Bravo, M.; Evangelista, L.; de Brito, J. Durability of concrete with partial replacement of Portland cement by incorporating reactive magnesium oxide and fly ash. Materials 2023, 16, 2670. [Google Scholar] [CrossRef] [Scilit] [PubMed]
  22. EN DIN 196-1: 2016-11; Prüfverfahren für Zement_-Teil_1: Bestimmung der Festigkeit; Deutsche Fassung EN_196-1: 2016. DIN Media GmbH: Berlin, Germany, 2016.
  23. Bary, B.; Sellier, A. Coupled moisture—Carbon dioxide–calcium transfer model for carbonation of concrete. Cem. Concr. Res. 2004, 34, 1859–1872. [Google Scholar] [CrossRef] [Scilit]
  24. Lothenbach, B.; Matschei, T.; Möschner, G.; Glasser, F.P. Thermodynamic modelling of the effect of temperature on the hydration and porosity of Portland cement. Cem. Concr. Res. 2008, 38, 1–18. [Google Scholar] [CrossRef] [Scilit]
  25. Pu, Q.; Jiang, L.; Xu, J.; Chu, H.; Xu, Y.; Zhang, Y. Evolution of pH and chemical composition of pore solution in carbonated concrete. Constr. Build. Mater. 2012, 28, 519–524. [Google Scholar] [CrossRef] [Scilit]
  26. Yu, Y.; Zhang, T.; Wang, Q.; Chen, X.; Wu, D.; Gao, W.; Liu, A. Sensitivity of solidification hydration model in estimating carbonation of fly ash cement system. Constr. Build. Mater. 2021, 282, 122582. [Google Scholar] [CrossRef] [Scilit]
  27. von Greve-Dierfeld, S.; Lothenbach, B.; Vollpracht, A.; Wu, B.; Huet, B.; Andrade, C.; Medina, C.; Thiel, C.; Gruyaert, E.; Vanoutrive, H. Understanding the carbonation of concrete with supplementary cementitious materials: A critical review by RILEM TC 281-CCC. Mater. Struct. 2020, 53, 136. [Google Scholar] [CrossRef] [Scilit]
  28. Lu, C.-F.; Wang, W.; Li, Q.-T.; Hao, M.; Xu, Y. Effects of micro-environmental climate on the carbonation depth and the pH value in fly ash concrete. J. Clean. Prod. 2018, 181, 309–317. [Google Scholar] [CrossRef] [Scilit]
  29. Frankel, G. Pitting corrosion of metals: A review of the critical factors. J. Electrochem. Soc. 1998, 145, 2186–2198, Errata in J. Electrochem. Soc. 1998, 145, 2970a. [Google Scholar] [CrossRef] [Scilit]
  30. Vargel, C. Corrosion of Aluminium; Elsevier: Amsterdam, The Netherlands, 2020. [Google Scholar]
  31. Nişancioĝlu, K. Corrosion and protection of aluminum alloys in seawater. In Corrosion Behaviour and Protection of Copper and Aluminium Alloys in Seawater; Elsevier: Amsterdam, The Netherlands, 2007; pp. 145–155. [Google Scholar]
  32. Boumaza, A.; Favaro, L.; Lédion, J.; Sattonnay, G.; Brubach, J.; Berthet, P.; Huntz, A.; Roy, P.; Tétot, R. Transition alumina phases induced by heat treatment of boehmite: An X-ray diffraction and infrared spectroscopy study. J. Solid State Chem. 2009, 182, 1171–1176. [Google Scholar] [CrossRef] [Scilit]
  33. Kole, K.K.; Gautham, S.; Khan, P.; Biswas, R.K.; Dasgupta, K.; Mandal, A.K.; Anoop, M.B.; Ghosh, J.; Sasmal, S. Effect of fly ash on the atomic scale structure of C–S–H during Portland cement hydration. Mag. Concr. Res. 2023, 75, 1097–1116. [Google Scholar] [CrossRef] [Scilit]
  34. Wang, S.-L.; Johnston, C.T. Assignment of the structural OH stretching bands of gibbsite. Am. Mineral. 2000, 85, 739–744. [Google Scholar] [CrossRef] [Scilit]
  35. Ding, Z.; Quy, N.X.; Kim, J.; Hama, Y. Evaluations of frost and scaling resistance of fly ash concrete in terms of changes in water absorption and pore structure under the accelerated carbonation conditions. Constr. Build. Mater. 2022, 345, 128273. [Google Scholar] [CrossRef] [Scilit]
  36. Hossain, M.S.; Ahmed, S. FTIR spectrum analysis to predict the crystalline and amorphous phases of hydroxyapatite: A comparison of vibrational motion to reflection. RSC Adv. 2023, 13, 14625–14630. [Google Scholar] [CrossRef] [Scilit] [PubMed]
  37. Natkunarajah, K.; Masilamani, K.; Maheswaran, S.; Lothenbach, B.; Amarasinghe, D.; Attygalle, D. Analysis of the trend of pH changes of concrete pore solution during the hydration by various analytical methods. Cem. Concr. Res. 2022, 156, 106780. [Google Scholar] [CrossRef] [Scilit]
  38. National Academies of Sciences, Engineering, and Medicine. Alkali-Silica Reactivity Potential and Mitigation: Test Methods and State of Practice; National Academies Press: Washington, DC, USA, 2023. [Google Scholar]
Figure 2. Preparation of sample exposure in (fly ash (FA)) concrete in PP cups with LDPE caps.
Cmd 07 00056 g002
Figure 3. R2 alloy after exposure in ordinary Portland cement (OPC) concrete before (a) and after removal of oxide layer and concrete residues (b) after 1 year exposure [15]. (c) The cleaned surface after 1 year of exposure in 30% FA concrete.
Cmd 07 00056 g003
Figure 4. Simulation of pH evolution and mineralogical alterations of OPC and FA concrete over 6 months.
Cmd 07 00056 g004
Figure 5. Corrosion rate in µm/y of R2 alloy in OPC concrete (black) and FA concrete (15 (red), 30 (blue) and 45% (green)) up to 12 months. R2 in OPC from our previous study under identical conditions [15].
Cmd 07 00056 g005
Figure 6. Micro computed tomography (µCT) images showing R2 alloy in OPC after 3 months exposure time.
Cmd 07 00056 g006
Figure 7. Attenuated Total Reflectance—Fourier Transform Infrared Spectroscopy (ATR-FTIR) transmittance spectra of surface material from R2 alloy immersed in OPC concrete (black) and FA concrete (red) after 6 months. Vertical lines indicate significant bands.
Cmd 07 00056 g007
Figure 8. Scanning Electron Microscopy with Energy Dispersive X-ray analysis (SEM-EDX) images of surface material of a sample that was exposed in OPC concrete for 6 months. (a) A secondary electron image of the mapped area. (bd) EDX mappings of Al, Ca and Si, respectively.
Cmd 07 00056 g008
Figure 9. SEM-EDX images of surface material of a sample that was exposed in 45% FA concrete for 6 months. (a) A secondary electron image of the mapped area. (bd) EDX mappings of Al, Ca and Si, respectively.
Cmd 07 00056 g009
Disclaimer/Publisher’s Note: The statements, opinions and data contained in all publications are solely those of the individual author(s) and contributor(s) and not of MDPI and/or the editor(s). MDPI and/or the editor(s) disclaim responsibility for any injury to people or property resulting from any ideas, methods, instructions or products referred to in the content.