Article

Influence of Thermally Grown Steel Oxides on Hydrogen Permeation Flux

1
Department of Engineering and Applied Sciences, University of Bergamo, 24044 Dalmine, BG, Italy
2
ENEA—Italian National Agency for New Technologies, Energy and Sustainable Economic Development, 80055 Portici, NA, Italy
3
National Interuniversity Consortium of Materials Science and Technology (INSTM), 50121 Firenze, FI, Italy
4
Research Unit of Bergamo, CSGI—Centre of Colloid and Surface Science, 24044 Dalmine, BG, Italy
*
Author to whom correspondence should be addressed.
Corros. Mater. Degrad. 2026, 7(3), 42; https://doi.org/10.3390/cmd7030042
Submission received: 4 June 2026 / Revised: 26 June 2026 / Accepted: 1 July 2026 / Published: 2 July 2026

Abstract

Hydrogen–steel interactions remain a critical concern for the safe deployment of hydrogen–natural gas mixtures in pipeline infrastructures. Thermally grown iron oxides may be a good barrier to hydrogen ingress into the crystalline lattice of pipeline steels, but their actual effectiveness depends strongly on their composition and stability under service conditions. Several experimental approaches have been proposed to investigate the correlation between thermally grown oxides and hydrogen permeation. Among these, electrochemical permeation testing offers a more complex but safer methodology compared to pressurized hydrogen gas tests. However, when the oxide is directly exposed to the charging side (cathodic charging conditions), permeation behaviour often appears comparable to that of bare steel, and rapid oxide degradation occurs. This study introduces an alternative permeation testing configuration that enables direct assessment of thin thermally grown oxides while preserving their structural integrity. By deliberately placing the oxide on the anodic detection side, mechanical removal during hydrogen evolution is suppressed, allowing the intrinsic resistance of the oxide to hydrogen transport to be evaluated. Carbon steel samples were thermally oxidized at 250 °C for controlled exposure times, and the resulting oxide scales were characterized by Raman spectroscopy, revealing variations in hematite and magnetite fractions. Hydrogen permeation was evaluated using a Devanathan–Stachurski cell by positioning the oxidized surface either on the cathodic charging side or on the anodic detection side. Under these conditions, significant variations in apparent steady-state permeation current density were observed as a function of oxidation time and oxide composition.

1. Introduction

The interaction between hydrogen and metallic materials is governed by a combination of bulk transport phenomena and surface-controlled processes that determine the entry of hydrogen into the metal lattice. In hydrogen permeation experiments, the measured response is therefore not solely related to diffusion through the bulk material, but is also strongly affected by the surface condition and by interfacial equilibria established at both the charging and detection sides of the specimen [1,2,3,4,5]. This aspect is particularly relevant for steels, where surface oxides are commonly formed as a consequence of processing, thermal exposure, or service conditions. Such oxide layers can modify hydrogen flux by altering surface reactivity, blocking active adsorption sites, and changing the kinetics of hydrogen absorption and recombination reactions [6,7]. In recent years, this topic has attracted increasing attention because of the growing interest in hydrogen transport, storage, and pipeline applications, where the control of hydrogen uptake by steels is a key requirement for safe and reliable operation [8,9]. This renewed interest provided the main motivation for the present study, which aims to clarify how thermally formed oxide layers influence hydrogen permeation through carbon steel. Among the various oxides that may develop on carbon steels, thermally grown iron oxides represent relatively simple and technologically relevant systems. They form when steel is exposed to elevated temperatures and can be encountered both during manufacturing processes and under service conditions. Their widespread occurrence, together with the possibility of producing them under controlled and reproducible laboratory conditions, makes them suitable for a systematic investigation of their influence on hydrogen transport. Previous studies have generally reported a reduction in hydrogen permeation flux in the presence of thermally grown oxide layers, suggesting a barrier effect associated with changes in surface reactions and transport processes [10]. Nevertheless, despite this general trend, the relationship between oxide thickness, oxide composition, and barrier efficiency remains only partially understood [10]. For carbon steels, thermal oxidation at moderate temperatures in air typically promotes the formation of iron oxides such as magnetite, Fe3O4, and hematite, Fe2O3, with relative amounts depending on the oxidation conditions [11]. In particular, controlled treatments at 250 °C allow the formation of thin and generally compact oxide layers with a reproducible phase composition, as reported in the literature [11]. In the present work, hydrogen permeation was investigated using the electrochemical technique introduced by Devanathan and Stachurski [12], which remains one of the most established and standardized methods for quantifying hydrogen diffusion in metals. The study evaluates the effect of oxide layers located either on the charging, or entry, side or on the detection, or exit, side of the sample [13,14]. In addition, the role of the phase composition of thermally grown oxides, mainly magnetite and hematite, was assessed by Raman spectroscopy and related to the observed hydrogen transport behavior. Although gas-phase hydrogen permeation tests would better reproduce pipeline service conditions, because hydrogen entry differs between gas-phase exposure and electrochemical charging, the detection principle remains the same: permeated hydrogen is oxidized at the exit side and measured as an anodic current. The present electrochemical charging results still provide meaningful comparative information; nevertheless, future gas-phase tests are needed to fully assess pipeline-relevant conditions.

2. Materials and Methods

2.1. Samples

The samples consisted of C-steel coupons which chemical composition is reported in Table 1, and ferrite–pearlite microstructure (Figure 1). Each sample measured 70 mm × 80 mm with an average thickness of 1.4 mm. All samples underwent a surface preparation protocol involving progressive mechanical polishing with abrasive papers up to 1200 grit to achieve a uniform finish. The final thickness of each coupon was measured at a minimum of five locations using a mechanical dial gauge, as suggested by the international standards ISO 17081 and ASTM G148 [15,16]. The samples were cleaned and washed in ultrasonic bath. To form a controlled thermal oxide layer, the samples were exposed in the furnace at 250 ± 5 °C in air for different times as shown in Table 2. After thermal oxidation, the samples were removed from the furnace, air-cooled to room temperature and stored in a desiccator. For all samples, one side was cleaned from thermal oxides using abrasive papers up to 1200 grit. For comparison, some samples without any thermal oxide layer (“blank samples”) were prepared following the same procedure described above, except for the furnace thermal treatment. Before and after the permeation test, a Raman analysis of the thermally oxidized surface of the samples was performed in order to characterize it.

2.2. Devanathan–Stachurski Permeation Cell

The hydrogen permeation experiments were conducted using a modified Devanathan–Stachurski diffusion cell comprising a charging compartment and a detection compartment [12]. The charging electrolyte consisted of a modified parkins solution of carbonate–bicarbonate (26.5 gl−1 Na2CO3 and 42 gl−1 NaHCO3) [17], which was deaerated with nitrogen to ensure that hydrogen evolution constituted the primary cathodic reaction. Continuous recirculation of the electrolyte was employed to mitigate local alkalisation at the sample surface on the charging side. The detection solution was 0.1 M NaOH (pH = 15). This was selected as it promotes the formation of a passive film on the steel surface, thereby reducing the corrosion current and allowing stable detection of hydrogen permeation current, as suggested by the international standards ISO 17081 and ASTM G148 [15,16]. Recirculation and degassing were not required in this compartment.
On the charging side, cathodic polarization was applied by means of a galvanostat. The potential in the charging compartment was monitored using a double-junction saturated calomel reference electrode (AMEL 390 TCG, +243 mV vs. SHE) placed 3 mm from the sample surface. Hydrogen detection in the anodic compartment was carried out by applying a constant anodic potential using a potentiostat. The metal sample was short-circuited to the working electrode terminals of both instruments, acting as the common working electrode. The potential in the anodic compartment was measured with an Ag/AgCl reference electrode (AMEL 373 SCG, +223 mV vs. SHE). The surface area exposed to the charging side was 4.52 cm2, whereas the detection side area was reduced to 4.05 cm2 as recommended by ISO 17081 and ASTM G148. The cell was maintained at 23 ± 1 °C throughout the tests.

2.3. Experimental Procedure

Prior to the beginning of each test, the permeation cell was thermostatically controlled and the charging solution was degassed. All samples (except for the T48 charging side sample) were mounted in the permeation cell with the thermally grown oxide layer facing the detection compartment and the clean surface facing the charging compartment. The T48 charging side sample was mounted in the opposite configuration, with the thermal oxide facing the charging compartment and the clean surface facing the detection compartment. Each test was conducted in two consecutive stages. During the first stage, only the detection compartment was filled with 0.1 M NaOH solution, and an anodic potential of +0.340 V vs. Ag/AgCl was applied. The anodic current was subsequently monitored up to threshold value of 0.1 µA cm−2 (typically reached within 24 h from the beginning of the test). Under these conditions, the passivation current is considered negligible compared to the hydrogen permeation current. Thus, the second stage involved maintaining the detection compartment under the same conditions as in the first stage, while the charging compartment was filled with deaerated carbonate–bicarbonate solution. A constant cathodic current density of −0.5 mA cm−2 was imposed on the charging side, whereas the anodic potential on the detection side was kept at +0.340 V vs. Ag/AgCl. During charging, the potential on the charging side was continuously monitored to ensure stable and reproducible conditions. Current and potential signals in both compartments were recorded every 30 s throughout the experiment. Strict steady-state conditions were not always fully achieved for each sample, even after several hours from the start of the permeation test; in these cases, the test was terminated when the variations in the detection current over time became negligible relative to its magnitude, which was deemed sufficient to ensure reliable comparison among the different samples. The cell was then disassembled, and the sample was rinsed with distilled water and stored in a desiccator.

2.4. Instruments and Software Used

The digital microscope utilized in this study was a KEYHENCE VHX-7000 (KEYENCE, Osaka, Japan). Samples were also analyzed using a HORIBA XploRA PLUS Raman spectroscopy system (HORIBA, Kyoto, Japan) with a 638 nm laser; the acquired spectra are the result of 5 accumulations with 35 s of acquisition time, performed in a backscattering configuration using a 100× lens. To avoid overheating the deposit, the laser power was kept at 8.75 mW. The data were processed and subsequently represented in the graphs of this article by means of MATLAB® R2025a elaborations.

3. Theory and Calculations

The hydrogen permeation current density ( i p e r m ) was calculated as the difference between the total current density ( i t o t ) and the passivation background current density ( i p a s s ) as shown in Equation (1).
i p e r m = i t o t i p a s s = I t o t I p a s s A d e t  
where I t o t represents the total current measured on the detection side during hydrogen permeation, I p a s s is the passivation background current measured on the detection side after 24 h of passivation and prior to the onset of hydrogen charging, and A d e t is the exposed surface area on the detection side.
The apparent diffusion coefficient was determined using a mean square error minimization procedure applied to the analytical expression describing the permeation rise transient through a thin metal layer (Equation (2)), obtained through the Laplace transformation method as proposed by McBreen et al. [18].
i t i 0 i i 0 = 2 L π D a p p t n = 0 e 2 n + 1 2 L 2 4 D t
In this formulation, i t represents the measured hydrogen permeation current density at time t , i 0 is the initial steady-state hydrogen permeation current density at the onset of charging, i is the steady-state hydrogen permeation current density as t and L is the sample thickness. MATLAB® was employed to fit each experimental permeation transient using the corresponding analytical solution, allowing determination of the apparent hydrogen diffusion coefficient ( D a p p ) .
In an ideal permeation experiment, the hydrogen concentration on the entry side is proportional to the steady-state permeation current density and can be calculated using Equation (3) [18], where F is the Faraday’s constant.
C 0 = i   L F D

4. Results

4.1. Thermally Grown Steel Oxides Caracterisation

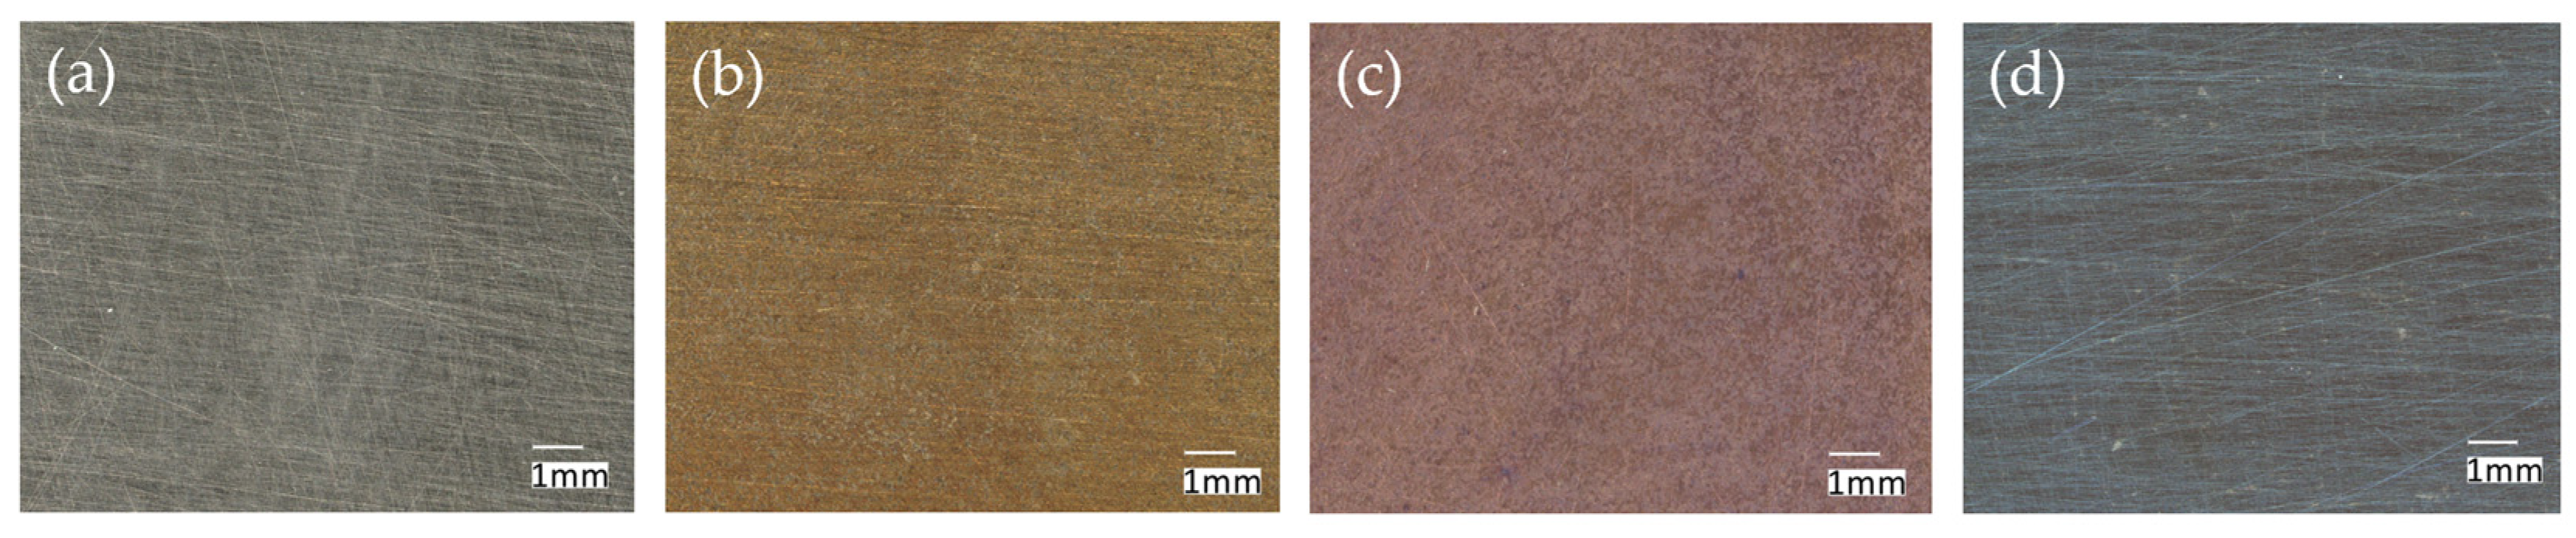
Optical microscopy of the oxidized samples reveals clear colour variations as a function of oxidation time (Figure 2). These changes reflect the evolution of the oxide composition and thickness during thermal exposure at 250 °C [11]. The thickness of these thermally grown oxide layers was not measured directly due to its very limited scale, but was instead estimated based on the correlations reported in the work of Wielant et al. [11] as a function of oxidation temperature and exposure time.
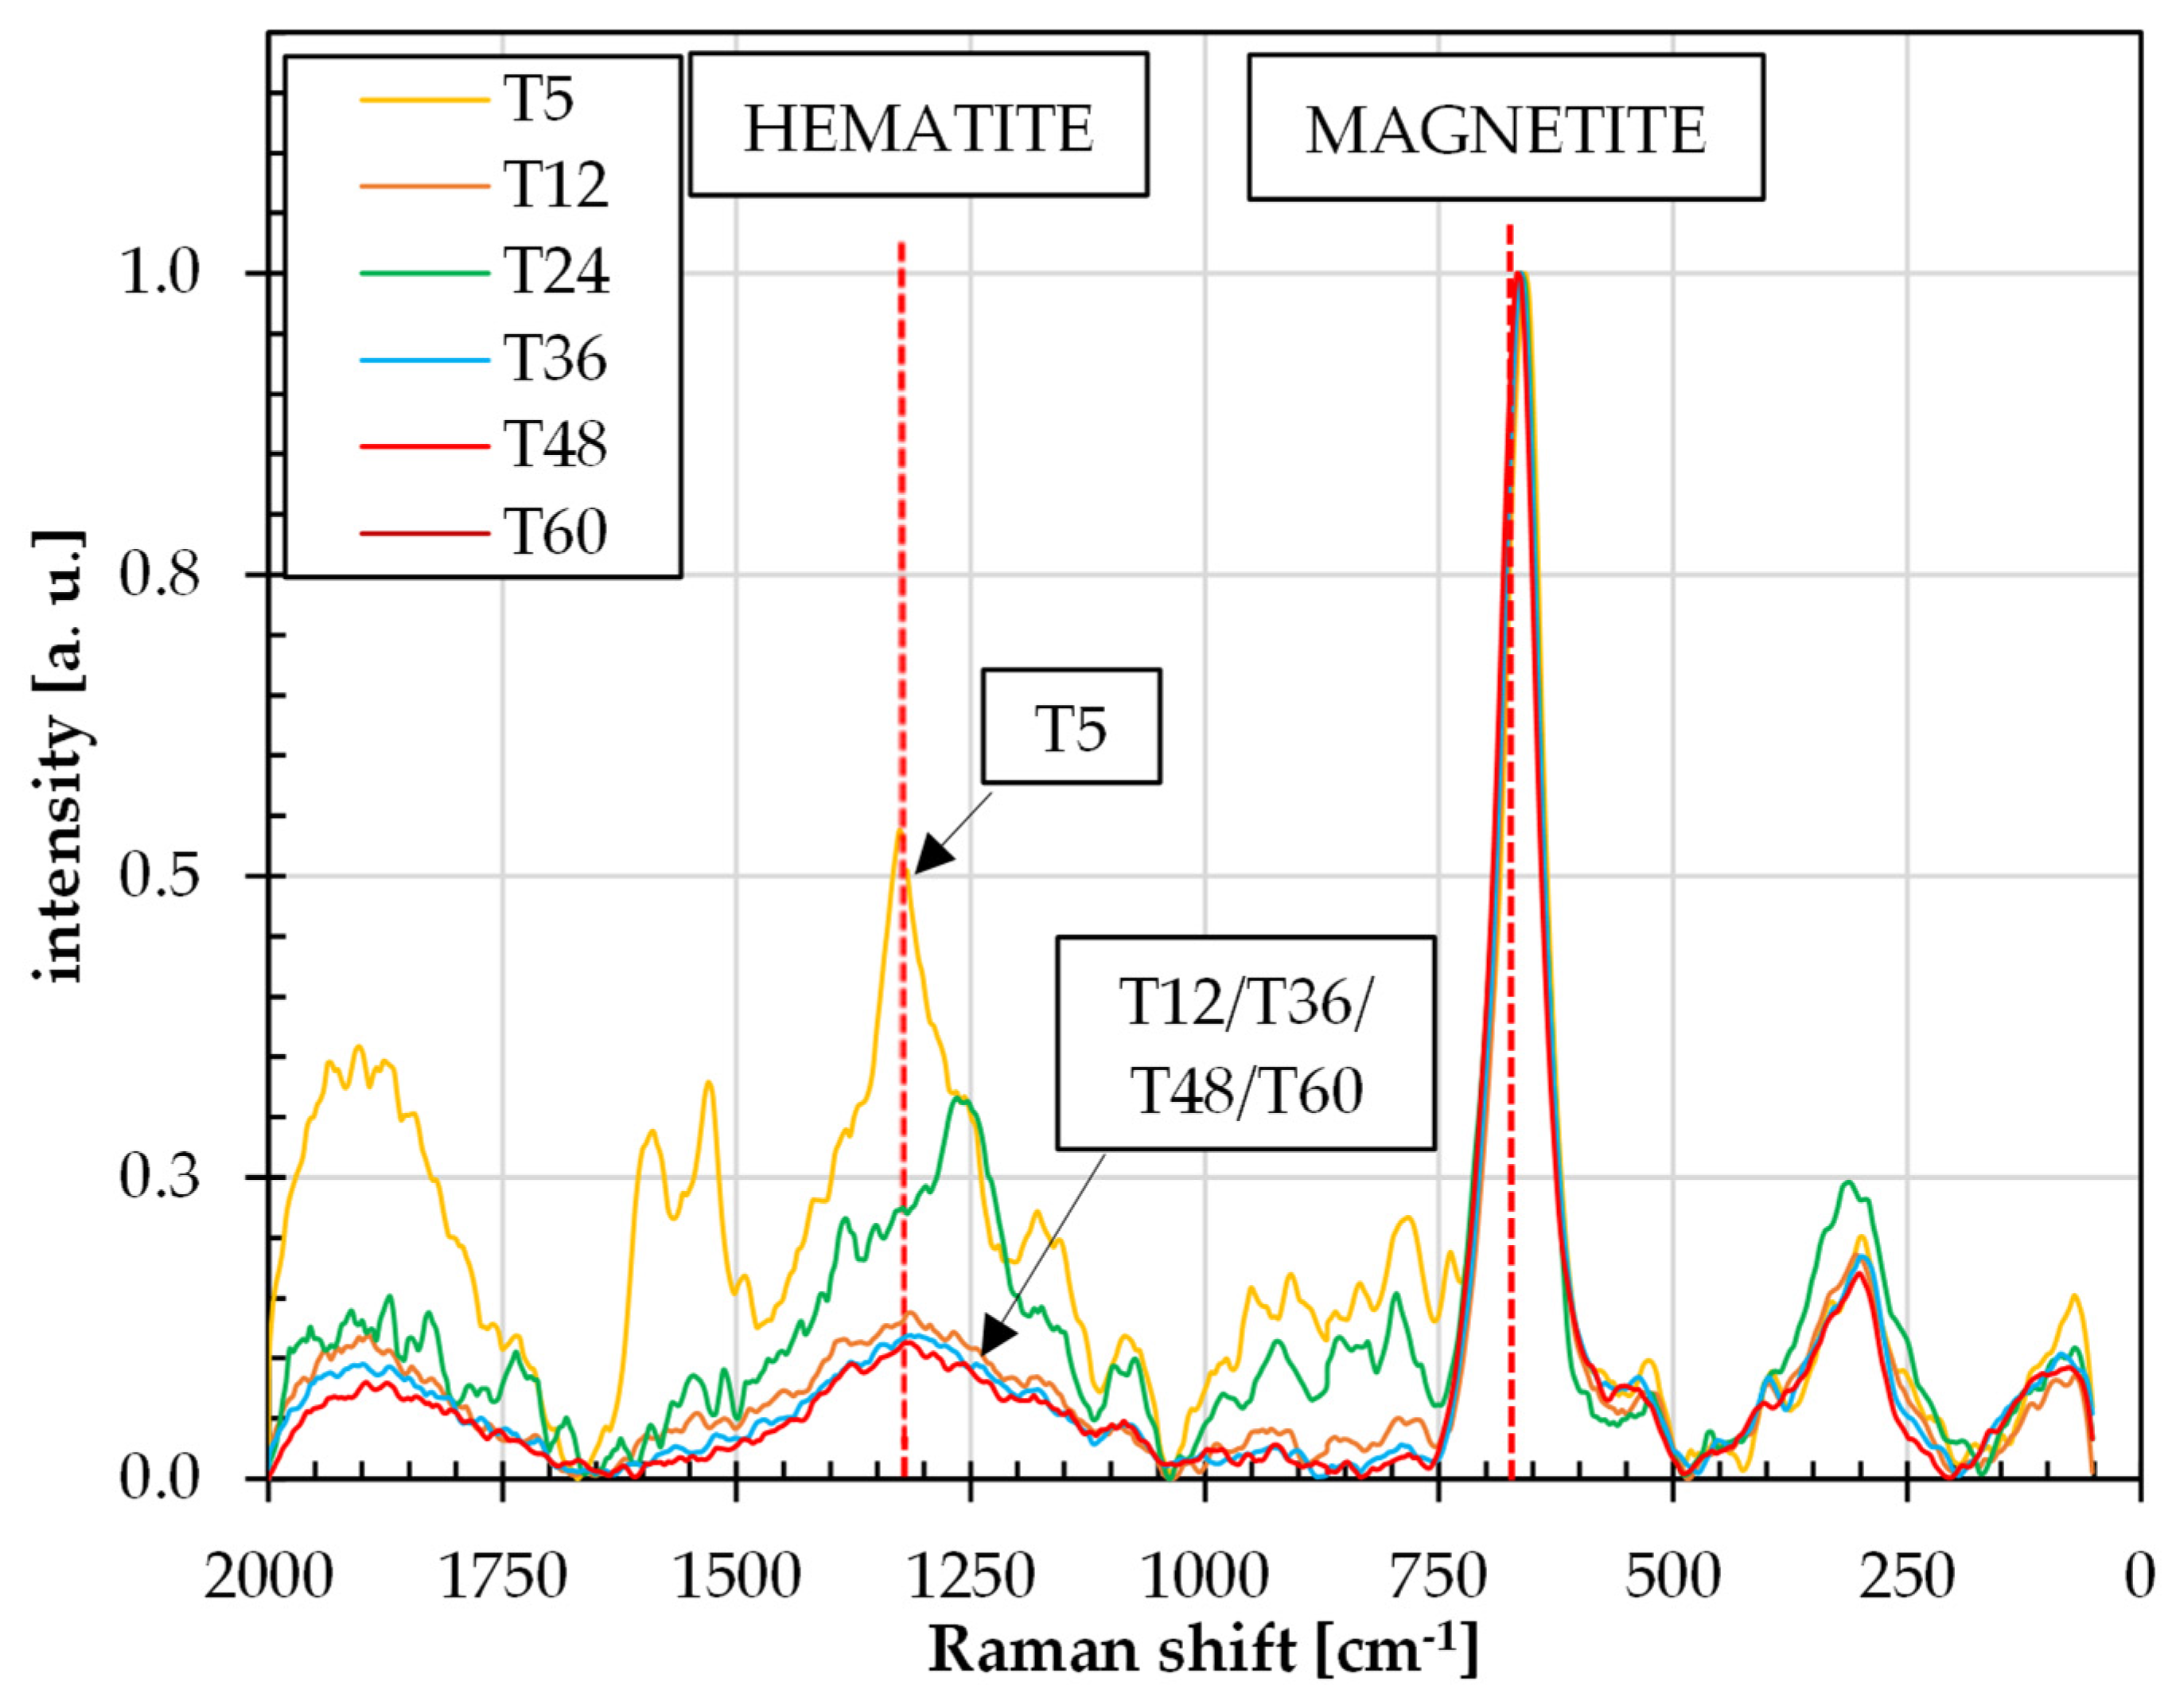
The thermally grown steel oxide layers exhibited a characteristic composition consisting of both hematite and magnetite phases, as identified by Raman spectroscopy (Figure 3). Hematite is identified by the presence of peaks at 1320 cm−1, 412 cm−1 and 293 cm−1, which are commonly attributed to 2-magnon scattering and the A1g and Eg vibrational modes, respectively [19,20,21]. Magnetite, in contrast, is identified by the presence of a strong Raman band at approximately 680 cm−1, commonly associated with its A1g vibrational mode, along with weaker bands at 540 cm−1 and 310 cm−1, which are respectively the T2g and Eg vibrational modes [20,22]. With increasing furnace exposure time, the thickness of the magnetite layer increased by more than one order of magnitude compared to that of the hematite layer [11]. As a result, the magnetite to hematite ratio progressively shifted in favour of magnetite, as confirmed by the gradual decrease in the relative intensity of the hematite-related peak at ~1320 cm−1 in the Raman spectra, while the magnetite band at ~680 cm−1 remained dominant, indicating an increasing prevalence of magnetite in the surface oxide scale.
With longer oxidation times, the hematite-to-magnetite ratio decreases and the surface becomes progressively darker, in agreement with the intrinsic optical properties of magnetite, which exhibits a grey to black coloration. Overall, the observed optical variations are consistent with the compositional changes identified by Raman spectroscopy and with the expected morphological evolution of thermally grown oxides at this temperature [11,19,20].

4.2. Permeation Current Density

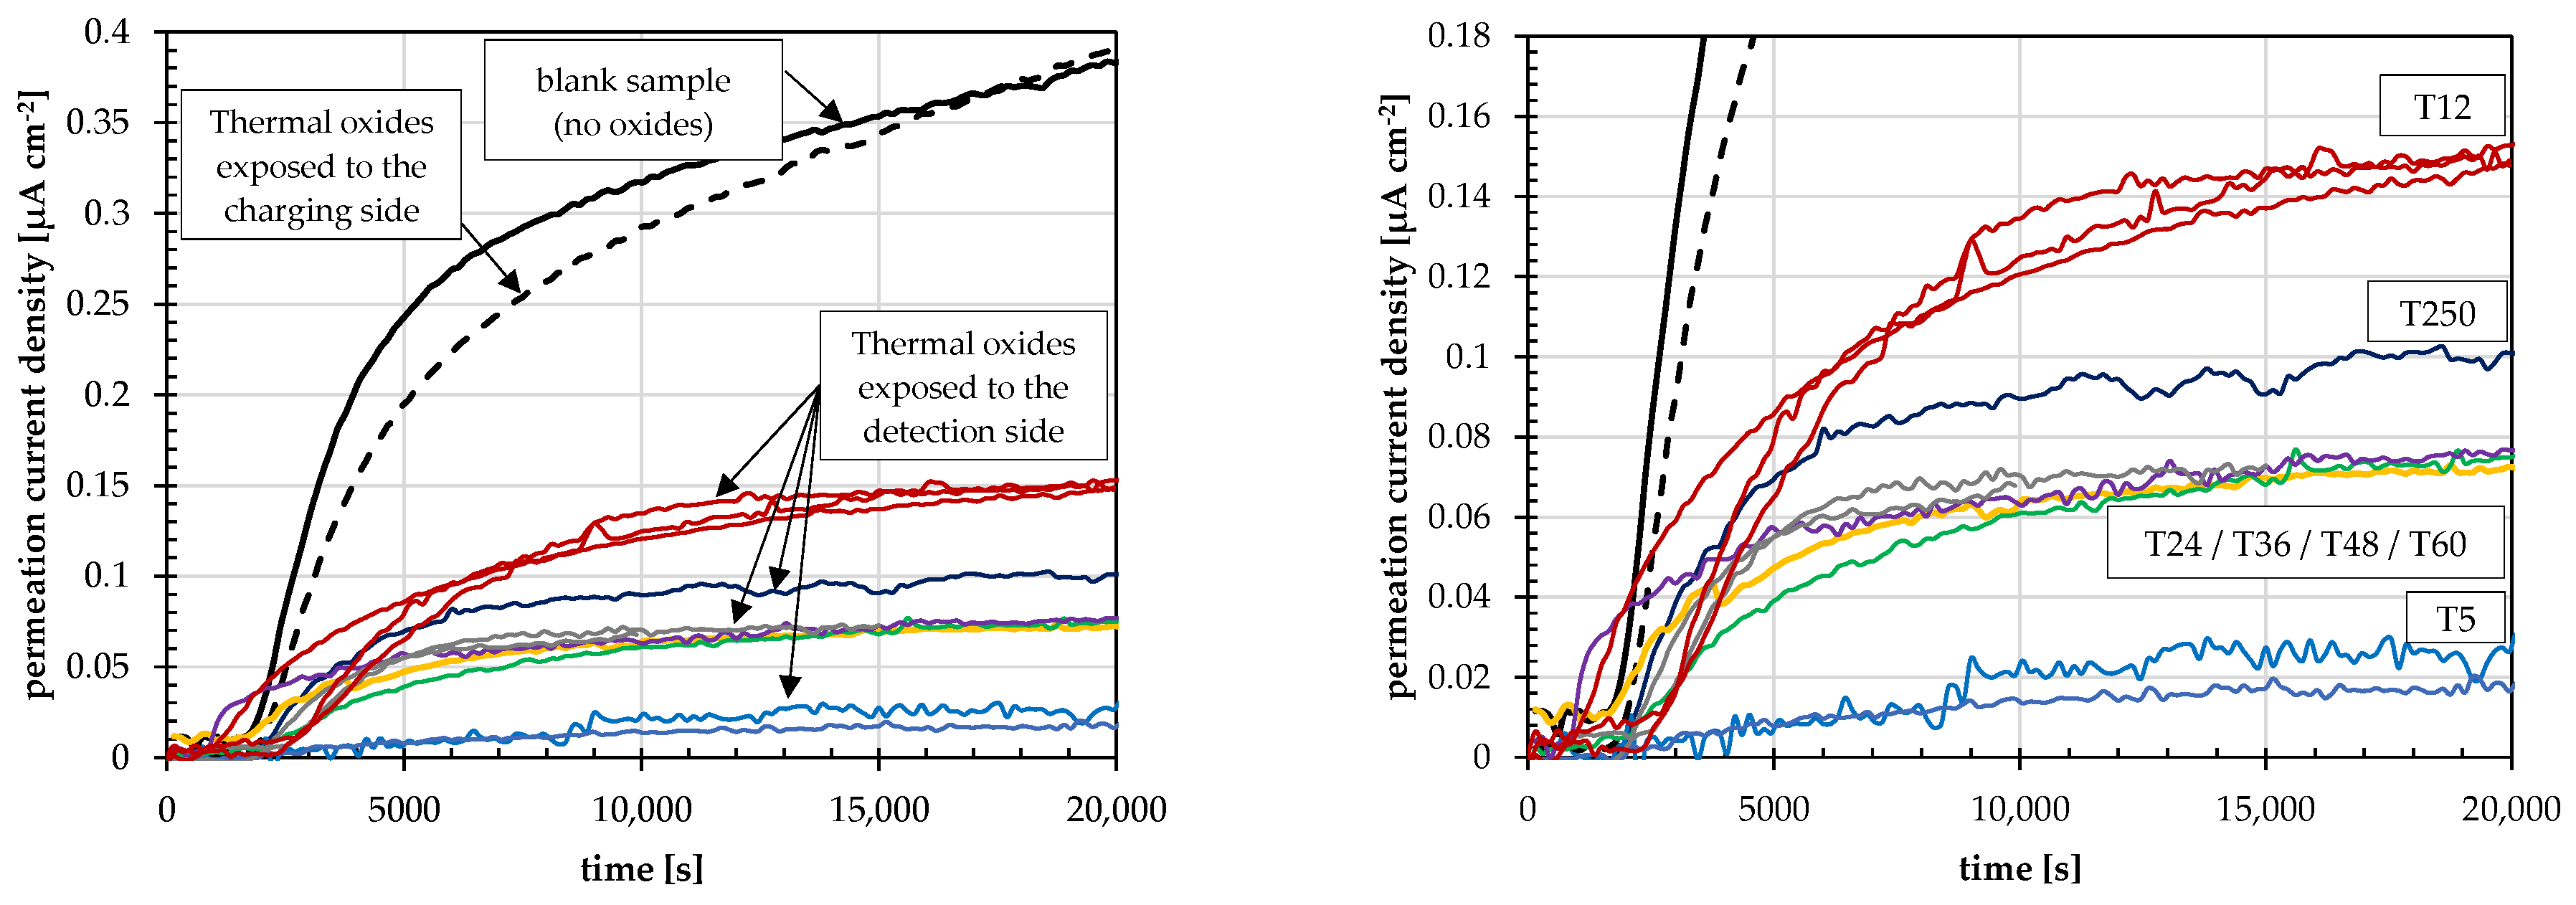
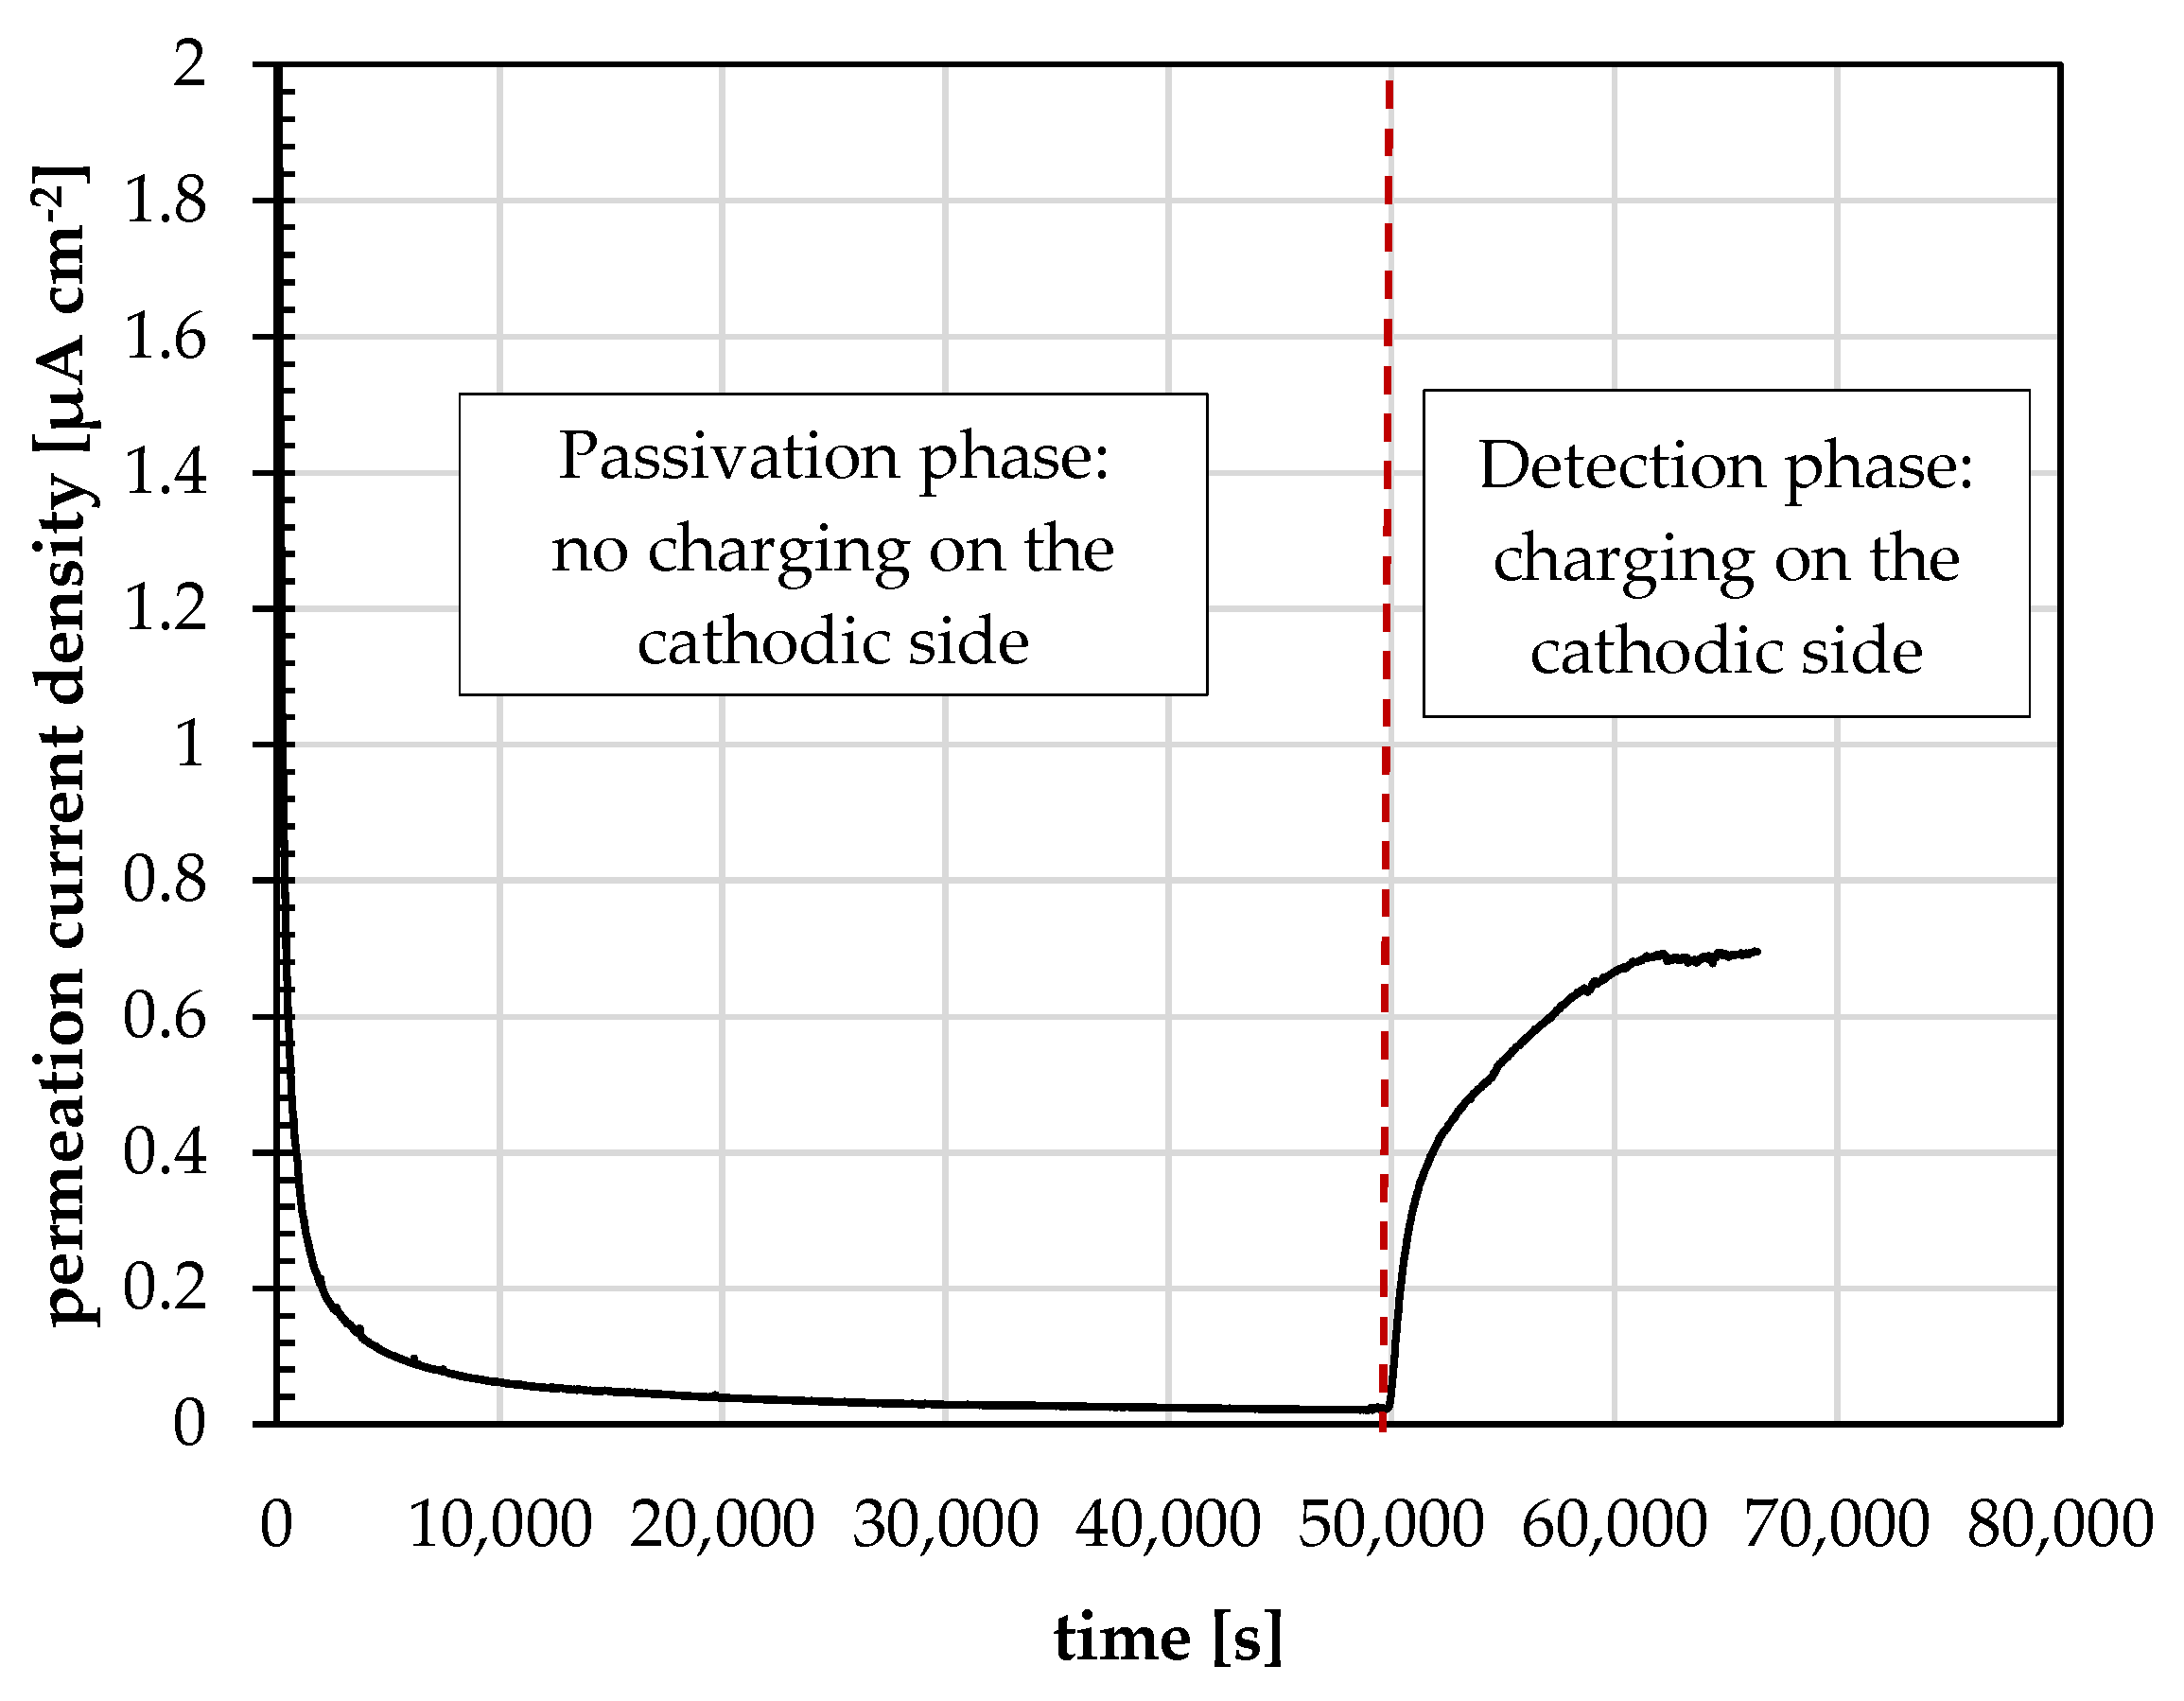
Figure 4 shows the evolution of the current density measured on the detection side throughout the entire test. During the first stage, the detection current density decreased until it reached the passivation current density. In the second stage, during cathodic charging, the detection current density increased until it reached an apparent steady-state values. The permeation current density curves reported in Figure 5 represent the transient current density measured on the detection side during cathodic charging, corrected for the passivation contribution (Equation (1)), and used to evaluate the hydrogen flux. The permeation current density values under apparent steady-state conditions are reported in Table 3, together with the calculated diffusion coefficient for each curve. Each curve in Figure 5 corresponds to a different sample, and each colour indicates a different condition (a different furnace exposure time). For each condition, several samples were tested to reduce statistical variability. Each sample was used for only one permeation test and then stored in a desiccator for subsequent analysis. The solid black curve represents the blank sample, without thermal oxide on either side. The dashed black curve corresponds to the sample with a thermal oxide layer formed after 24 min of furnace exposure on the charging side and a clean surface on the detection side (T48 charging side sample). These two curves are nearly superimposed and exhibit the highest permeation current density values. The red curves correspond to the samples with thermal oxide on the detection side formed after 12 min of furnace exposure (T12). The light-blue curves show the lowest permeation current density values and correspond to the samples with thermal oxide on the detection side formed after 5 min of furnace exposure (T5). All the other curves, corresponding to furnace exposure times of 24 min or longer, largely overlap and display intermediate permeation current density values between the T12 (red curves) and T5 (light-blue curves) conditions. Overall, when the thermal oxide is present on the detection side, the permeation current density decreases compared to the other conditions.

5. Discussion

By comparing the permeation current densities of the blank samples with those of samples with a thermally grown oxide layer on one side, two main trends can be identified: the effect of the thermal oxide on the charging side and on the detection side.

5.1. Effect of Thermal Oxide on the Charging Side

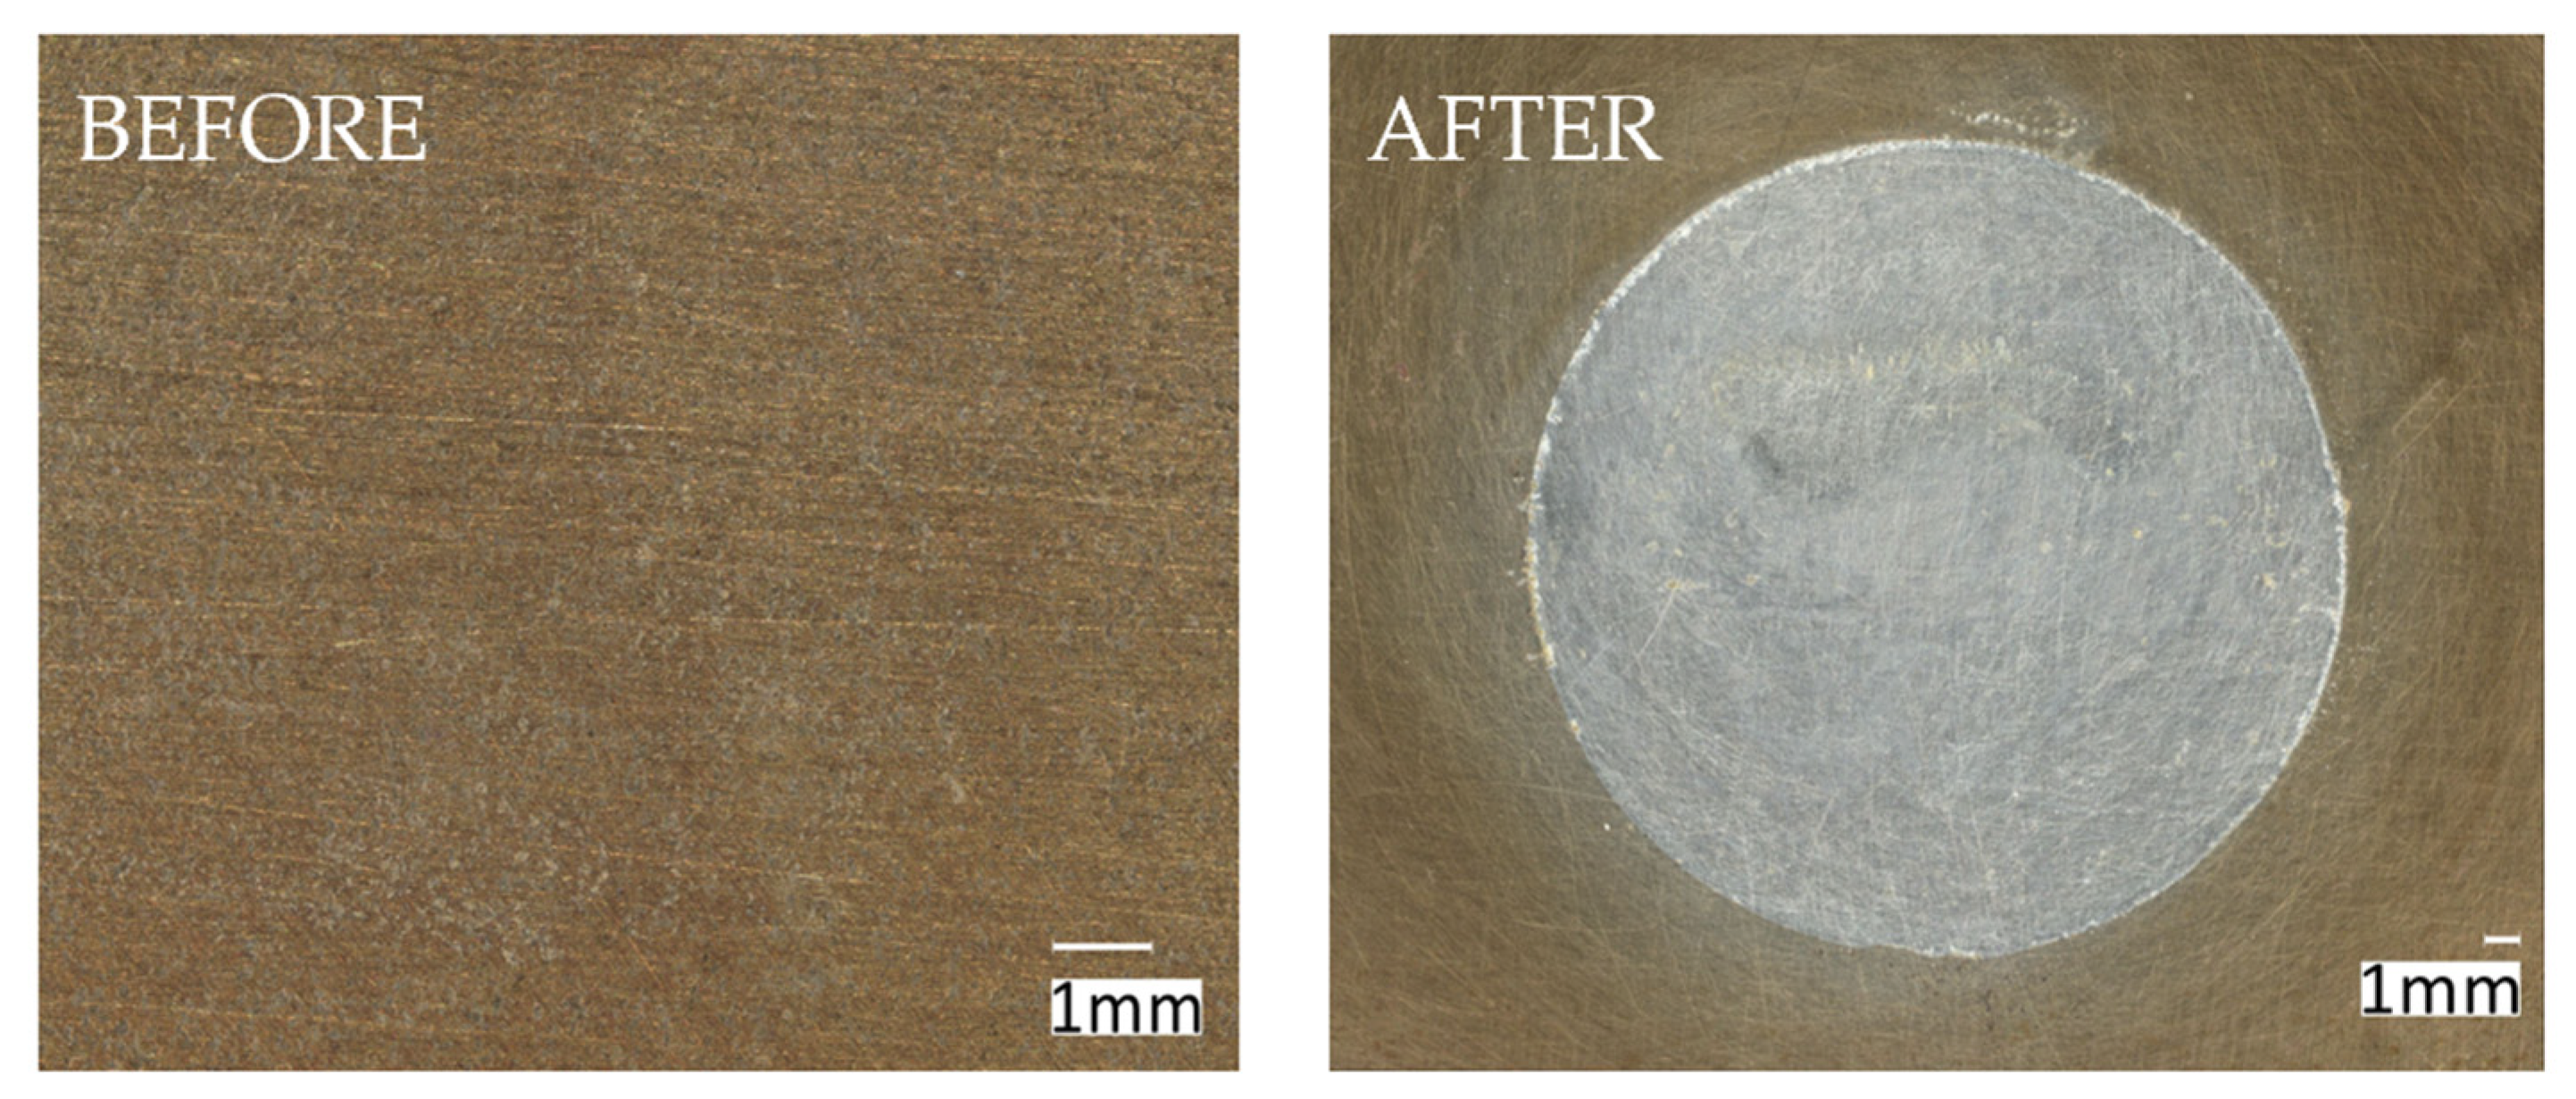
As shown in Figure 5, the permeation current densities of the blank samples and the sample with the thermal oxide only on the charging side (T48 charging side sample) are nearly identical. Therefore, the presence of steel thermal oxide on the charging side does not significantly affect the hydrogen permeation response under the investigated conditions. A comparison of the surface exposed to the charging compartment, performed before and after the permeation test (Figure 6), confirms a substantial alteration of the oxide layer during the experiment.
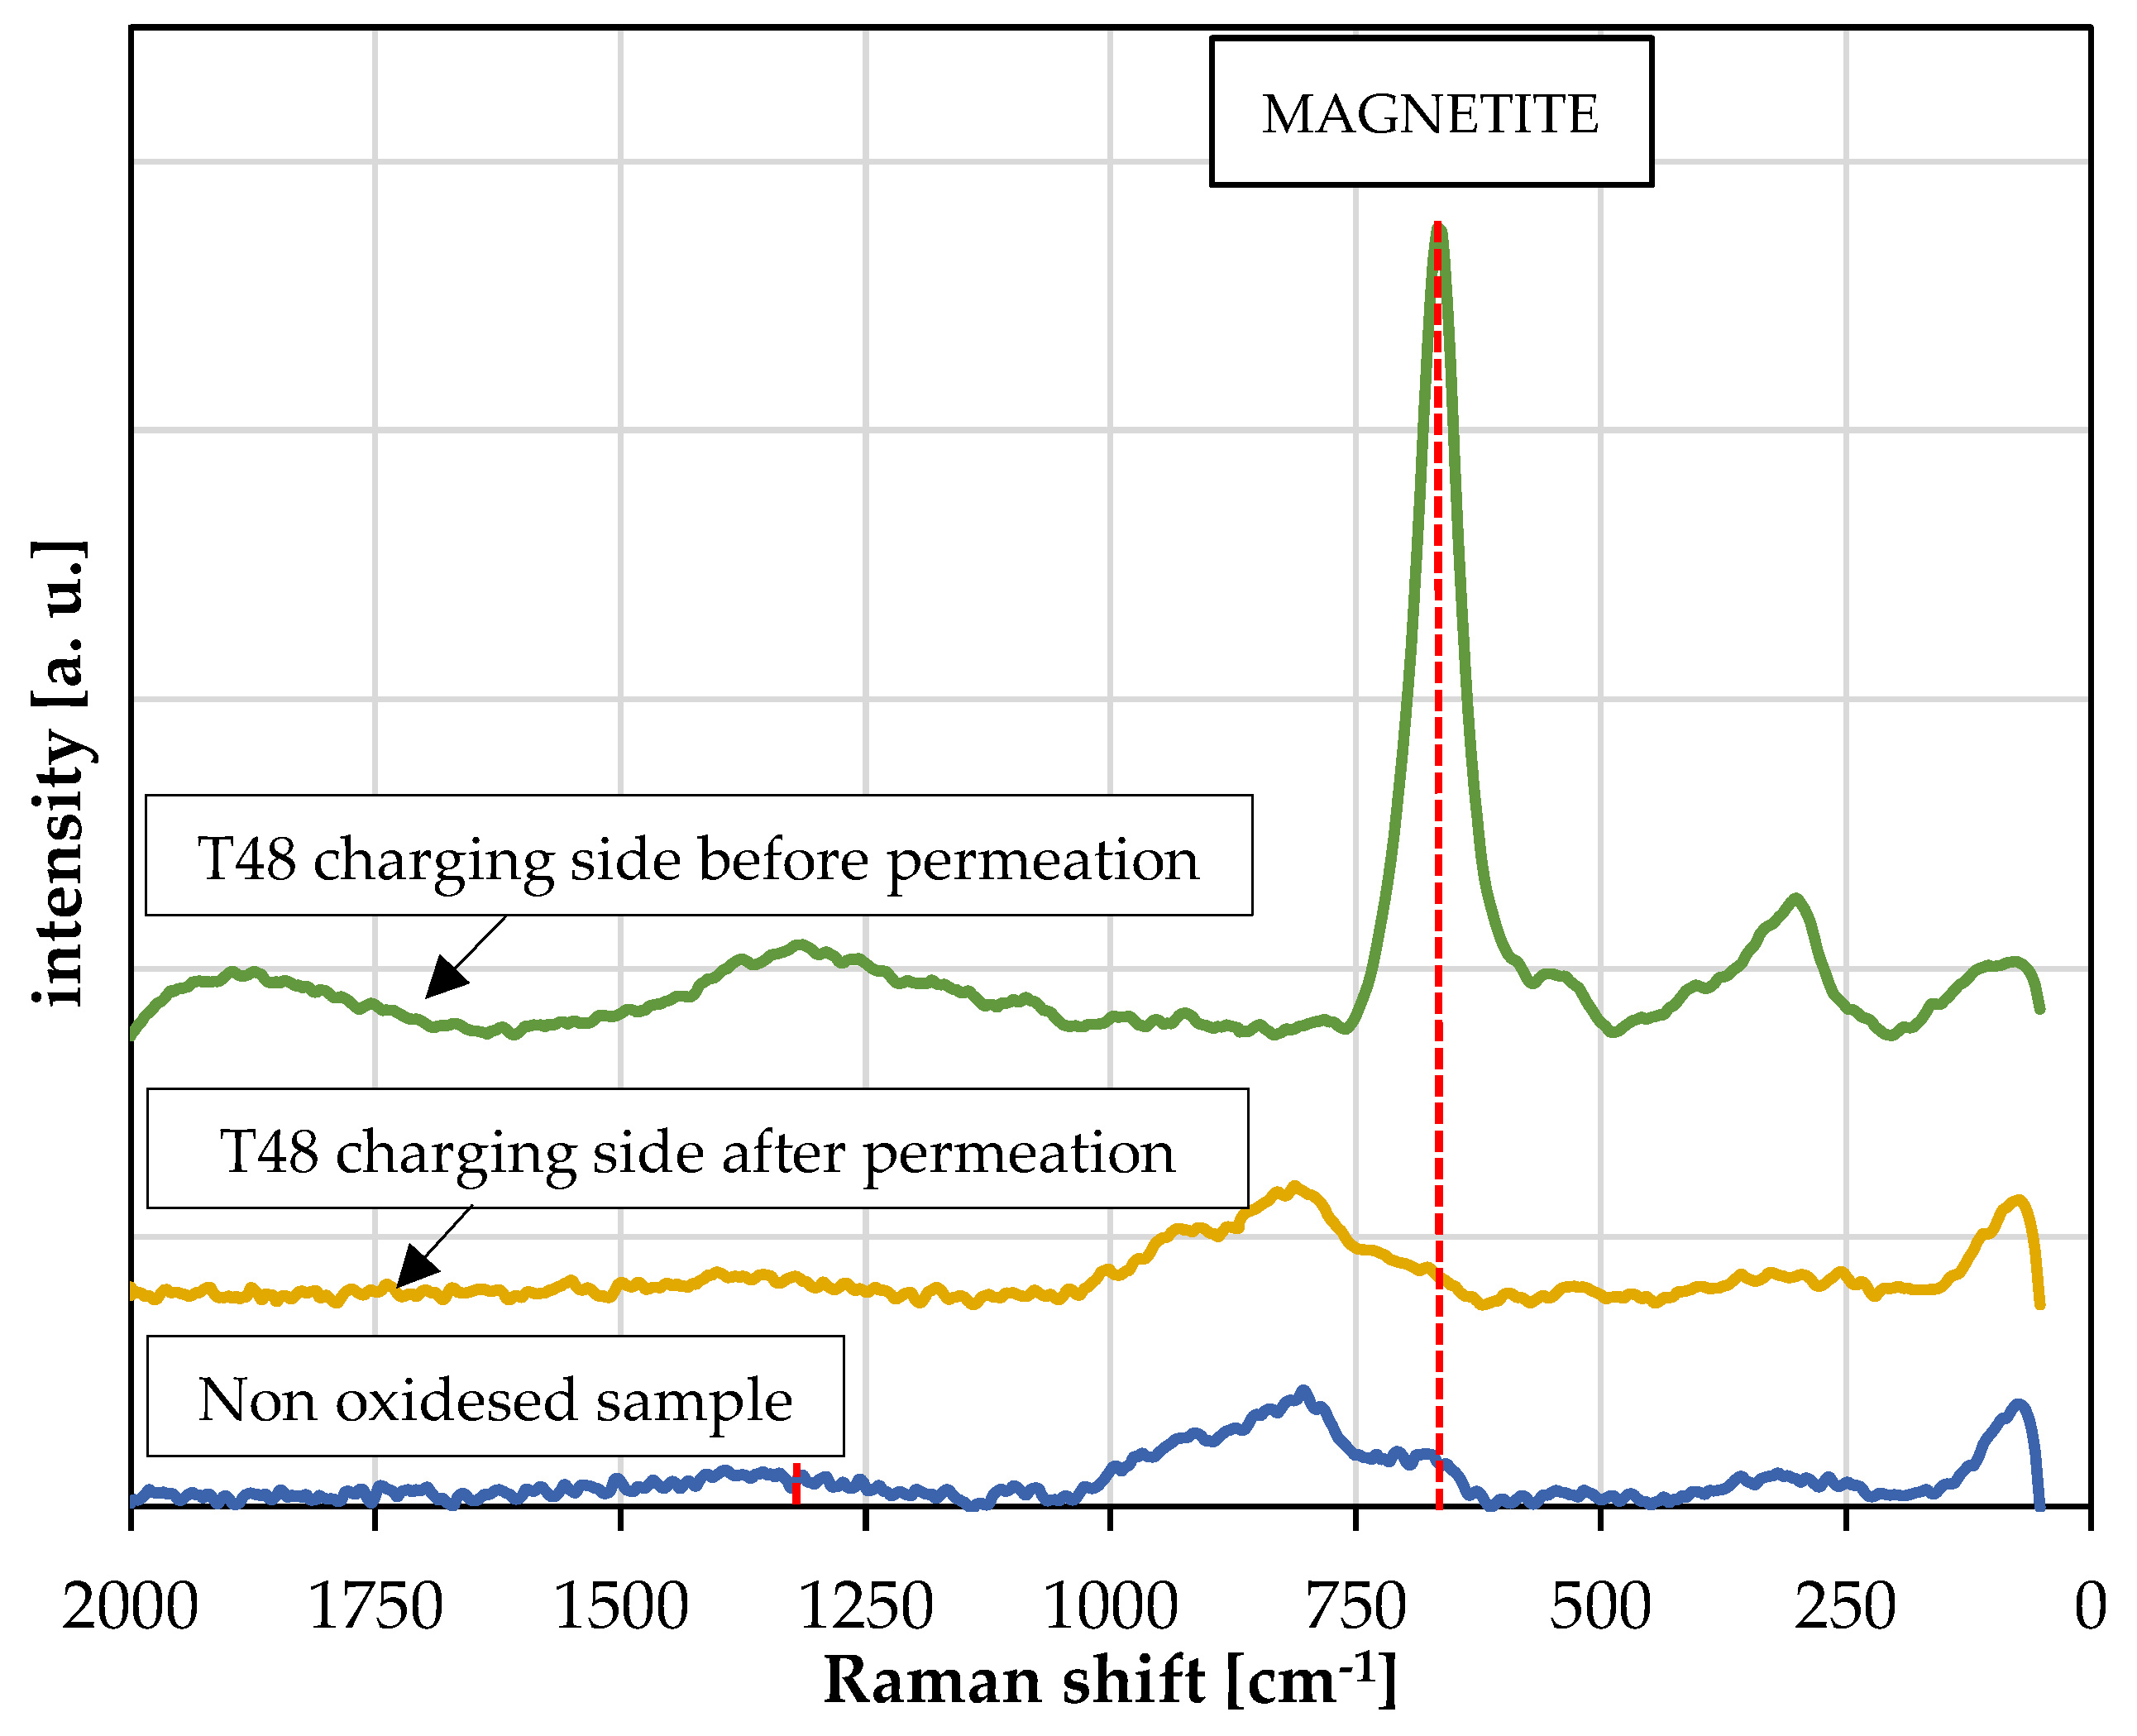
Raman spectroscopy was employed to investigate possible phase transformations or compositional modifications of the oxide layer induced by cathodic charging and hydrogen permeation. As shown in Figure 7, the characteristic Raman band of magnetite, detected on the surface prior to the permeation test, disappears after the experiment. Moreover, the Raman spectrum acquired after permeation closely resembles that of a steel virgin surface without thermal oxides.
The marked modification of the oxide layer after the permeation test may be attributed to cathodic debonding. One possible explanation is the accumulation of hydrogen at the metal/oxide interface during cathodic charging. Hydrogen atoms can recombine at the interface to form molecular hydrogen, and the local pressure generated by hydrogen bubble formation at the metal/oxide interface may weaken interfacial adhesion and promote mechanical detachment of the oxide scale [23]. Alternatively, the oxide layer may have undergone partial electrochemical reduction during the permeation experiment. According to the Pourbaix diagram of iron, considering that the cathodic potential on the charging side was approximately −1.2 V vs. SCE and that the pH was above 10, the system lies within the immunity region of iron. Under these conditions, the oxide is therefore not thermodynamically stable and may be reduced during cathodic polarization. Under sufficiently cathodic potentials and in the presence of hydrogen transport phenomena, iron oxides can be reduced to lower oxidation states, resulting in structural destabilization of the oxide scale [4,5,24]. Such cathodic transformations may lead to thinning, fragmentation, or, in some cases, partial or complete loss of the oxide layer. Therefore, the Raman spectrum of the surface after the permeation test, which closely resembles that of a pristine steel surface, may reflect a hydrogen-induced mechanical delamination or a cathodic reduction and dissolution of the oxide layer or a synergistic contribution of both mechanisms.

5.2. Effect of Thermal Oxide on the Detection Side

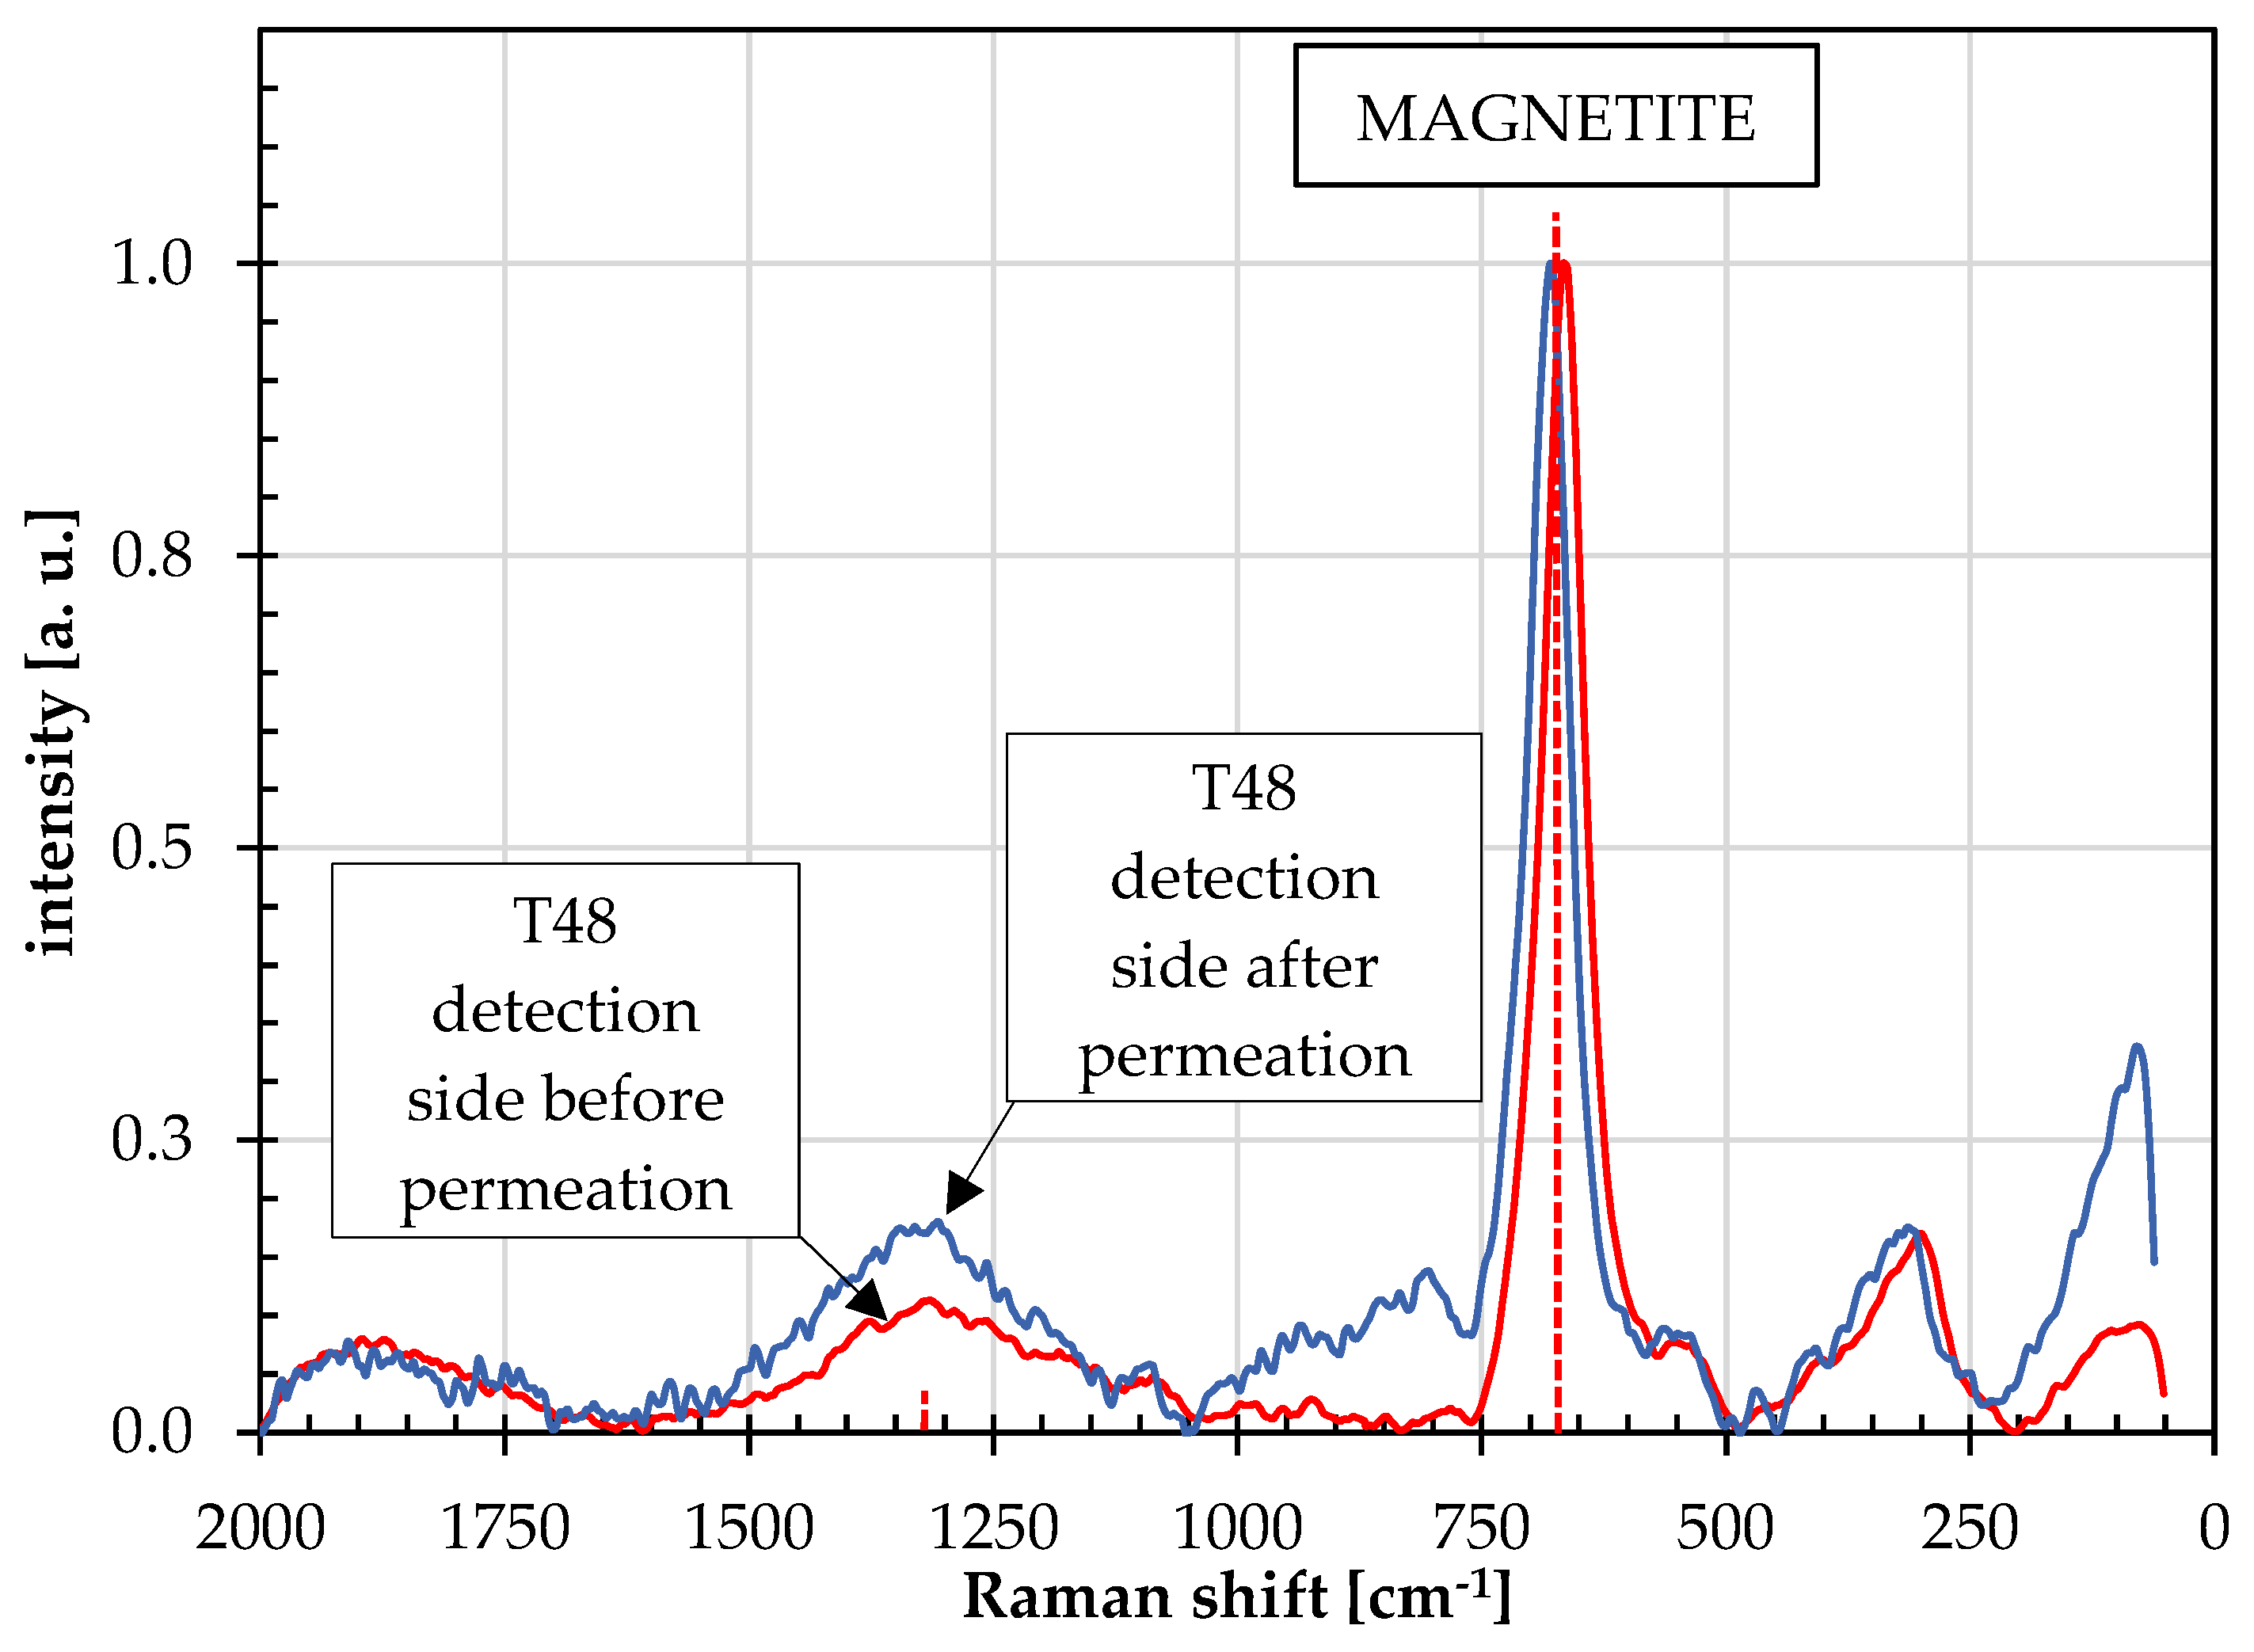
To ensure that exposing the oxide layer to the detection side environment did not significantly alter its surface characteristics during the course of the permeation test, a Raman spectra of the oxide layer on the detection side was acquired both before the start of the permeation experiment and after its completion. The spectra acquired for the samples exposed 48 min at 250 °C are shown in Figure 8 as a representative example. The comparison confirmed that the spectra were essentially identical, indicating that the oxide layer on the detection side remained structurally unchanged throughout the test duration. Although anodic polarization in the detection compartment promotes oxide formation on the detection side, this effect is common to all specimens tested under identical detection conditions. Therefore, since this study focuses on a comparative assessment rather than on absolute permeation parameters, it does not affect the validity of the comparison among the different sample conditions.
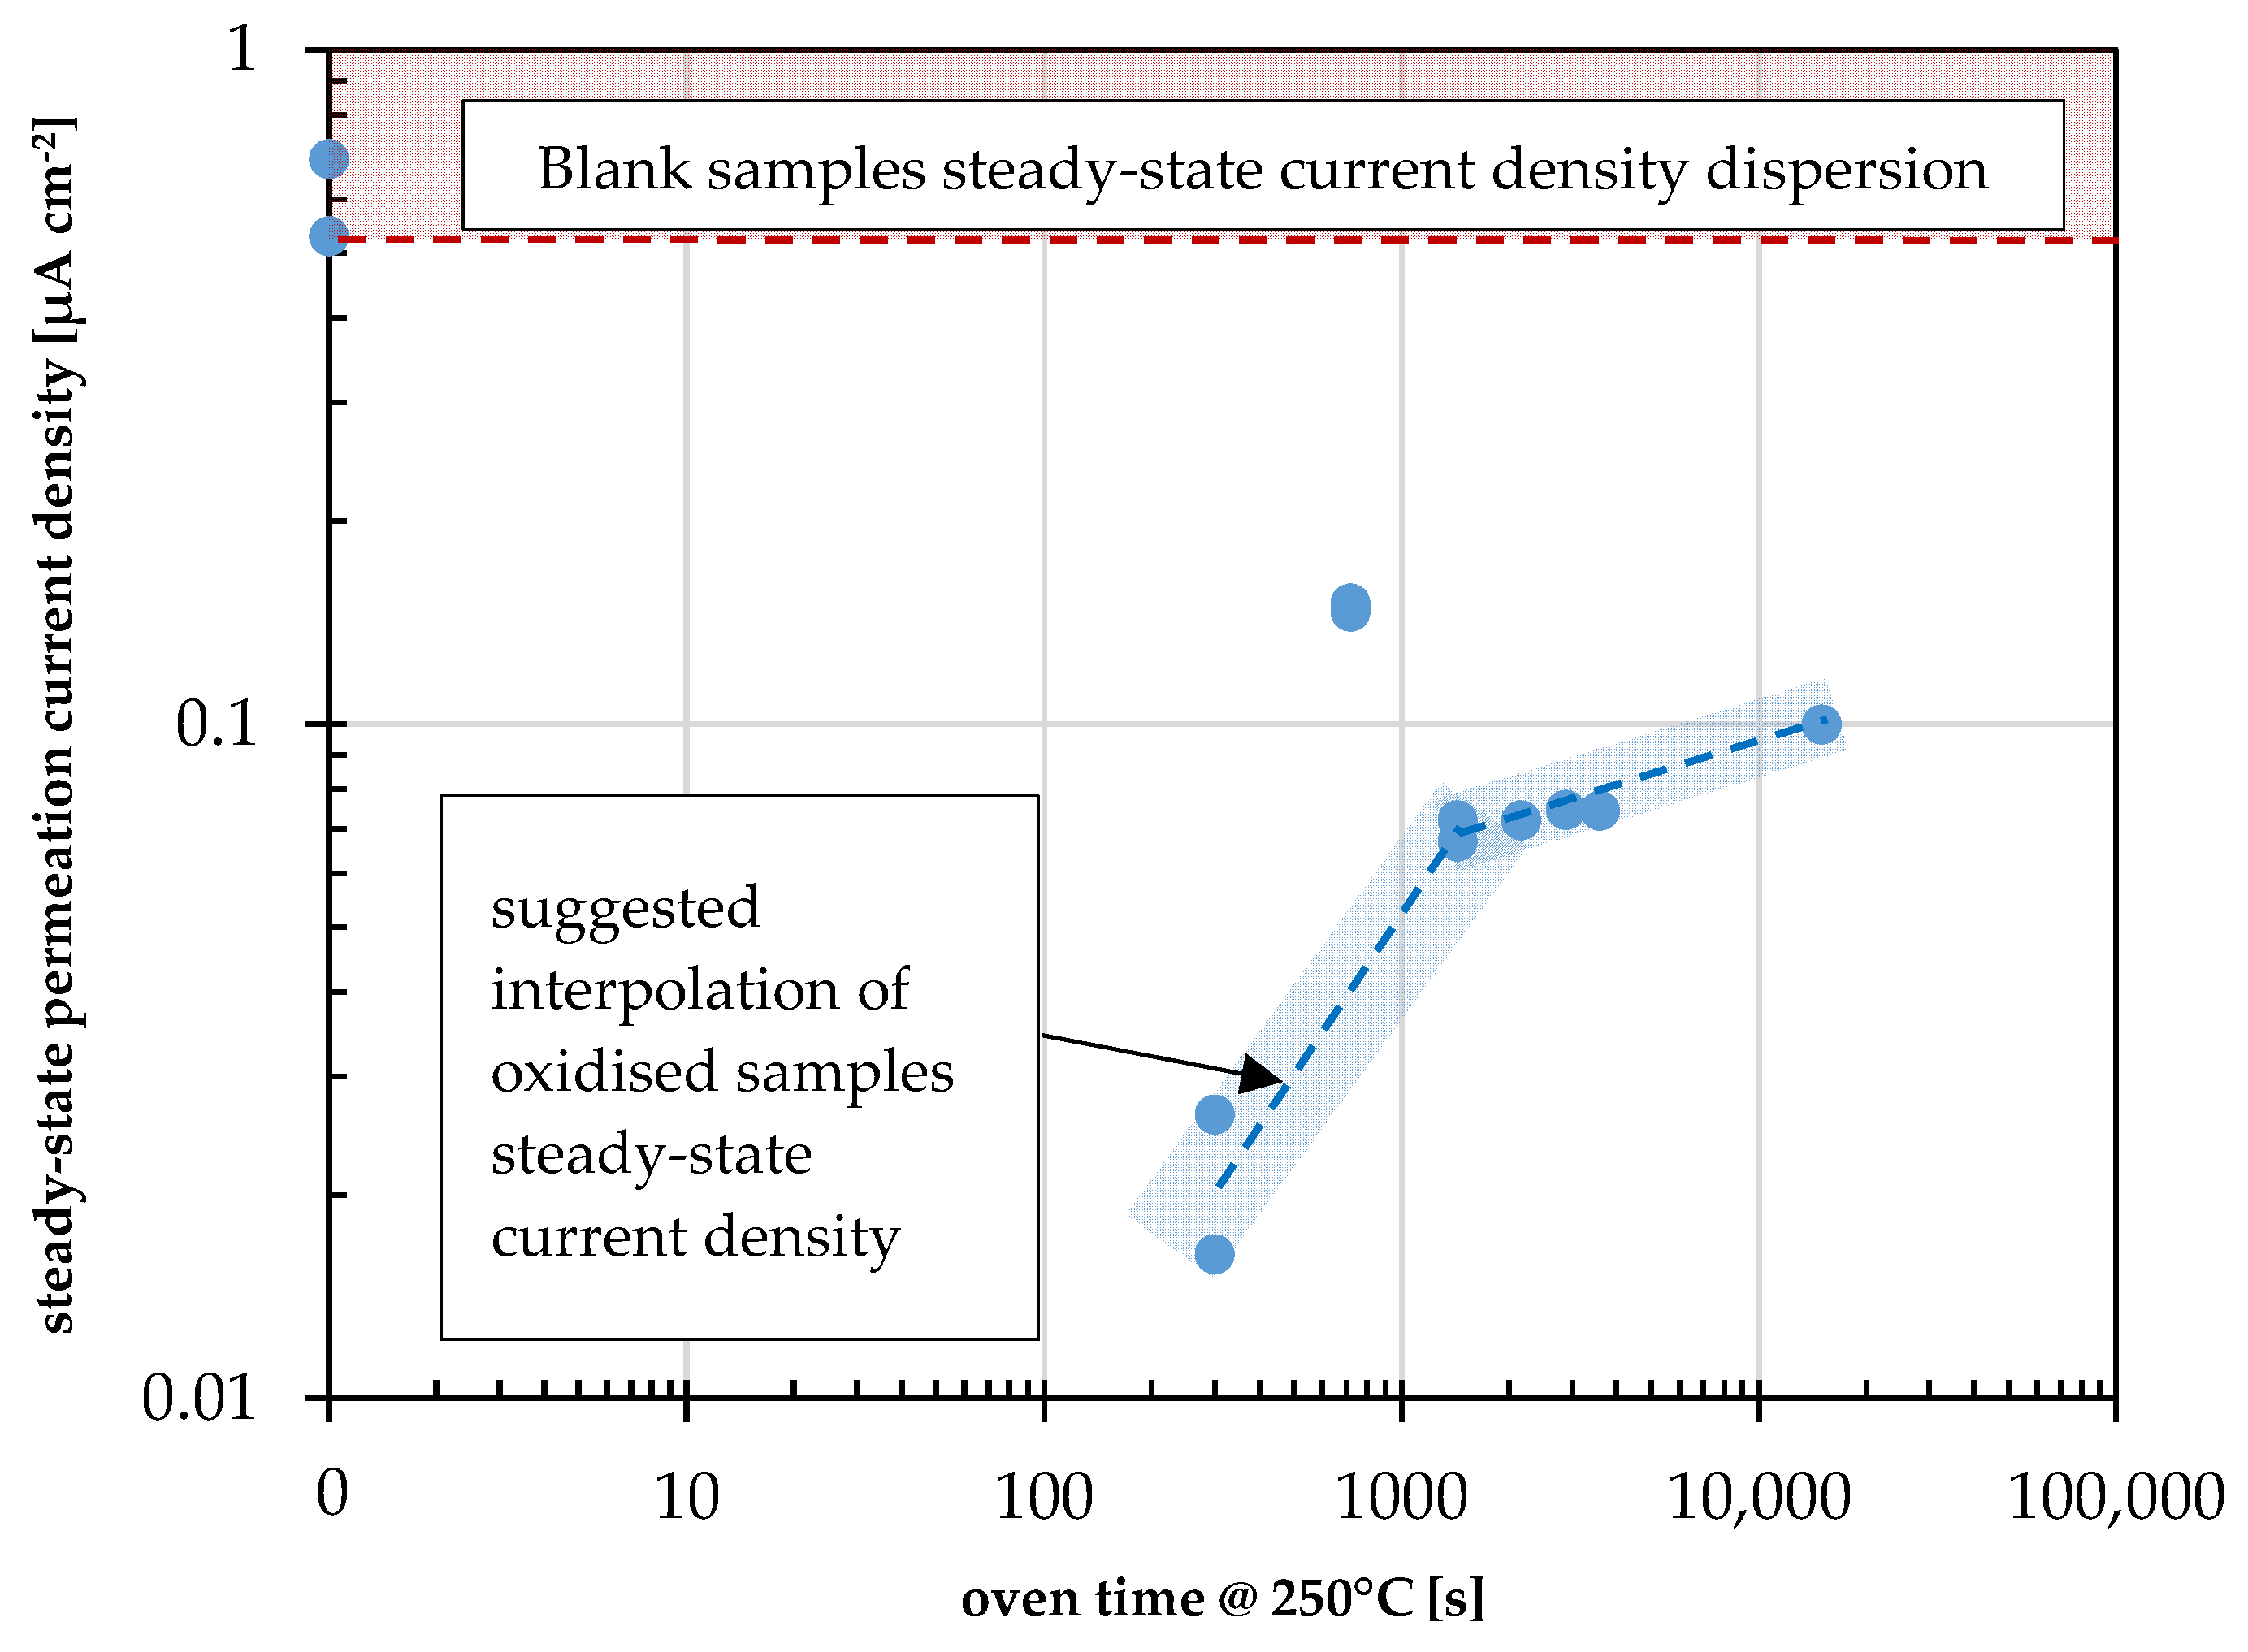
Since the oxide layer did not show any apparent change after the test, the apparent diffusion coefficients were calculated according to Equation (2) and are reported in Table 3. The permeation current densities, also reported in Table 3, were plotted as a function of oxidation time in Figure 9. The average apparent diffusion coefficient is 5.9 × 10⁻¹¹ m2 s−1, with a standard deviation of 1.7 × 10⁻¹¹ m2 s−1. This value is lower than that reported by Koren et al. [25] for the same steel with a palladium-coated detection surface, which was on the order of 3 × 10⁻¹⁰ m2 s−1 at room temperature. The standard deviation obtained in the present study appears consistent with the expected experimental uncertainty associated with electrochemical hydrogen permeation measurements. The apparent diffusion coefficients reported in Table 3 remain within a relatively narrow range, from 2.9 × 10⁻¹¹ to 9.4 × 10⁻¹¹ m2 s−1, regardless of the presence, thickness, or composition of the oxide layer. This suggests that the thermally grown oxides do not significantly affect hydrogen diffusion through the bulk metallic membrane. Conversely, the steady-state permeation current density varies markedly, decreasing from approximately 0.5 µA cm−2 for the blank samples to much lower values for most oxidized samples. Therefore, the oxide layer appears to act mainly by modifying the interfacial boundary conditions, affecting the exit electrochemical kinetics, rather than altering hydrogen transport through the bulk metal lattice. The corresponding C0 values, calculated according to Equation (3), also decrease from about 2 mol m−3 for the blank samples to 0.05–0.5 mol m−3 for most oxidized samples. Also, the sample with the oxide layer on the charging side (T48 charging side sample) shows a relatively high C0 value, comparable to that of the blank samples. Equation (3) was used to estimate the initial hydrogen concentration on the entry side. However, this equation is valid only if the hydrogen concentration on the exit side is assumed to be maintained close to zero by the anodic polarization applied in the detection compartment. It should be noted that, if the oxide layer modifies the apparent hydrogen concentration on the exit side, this assumption may no longer be fully valid. In this case, Equation (3) cannot be rigorously applied, since it assumes a zero-hydrogen concentration at the exit surface. Therefore, the values should be considered as apparent entry-side hydrogen concentrations, useful for comparative purposes among the tested samples rather than as absolute hydrogen concentration values.
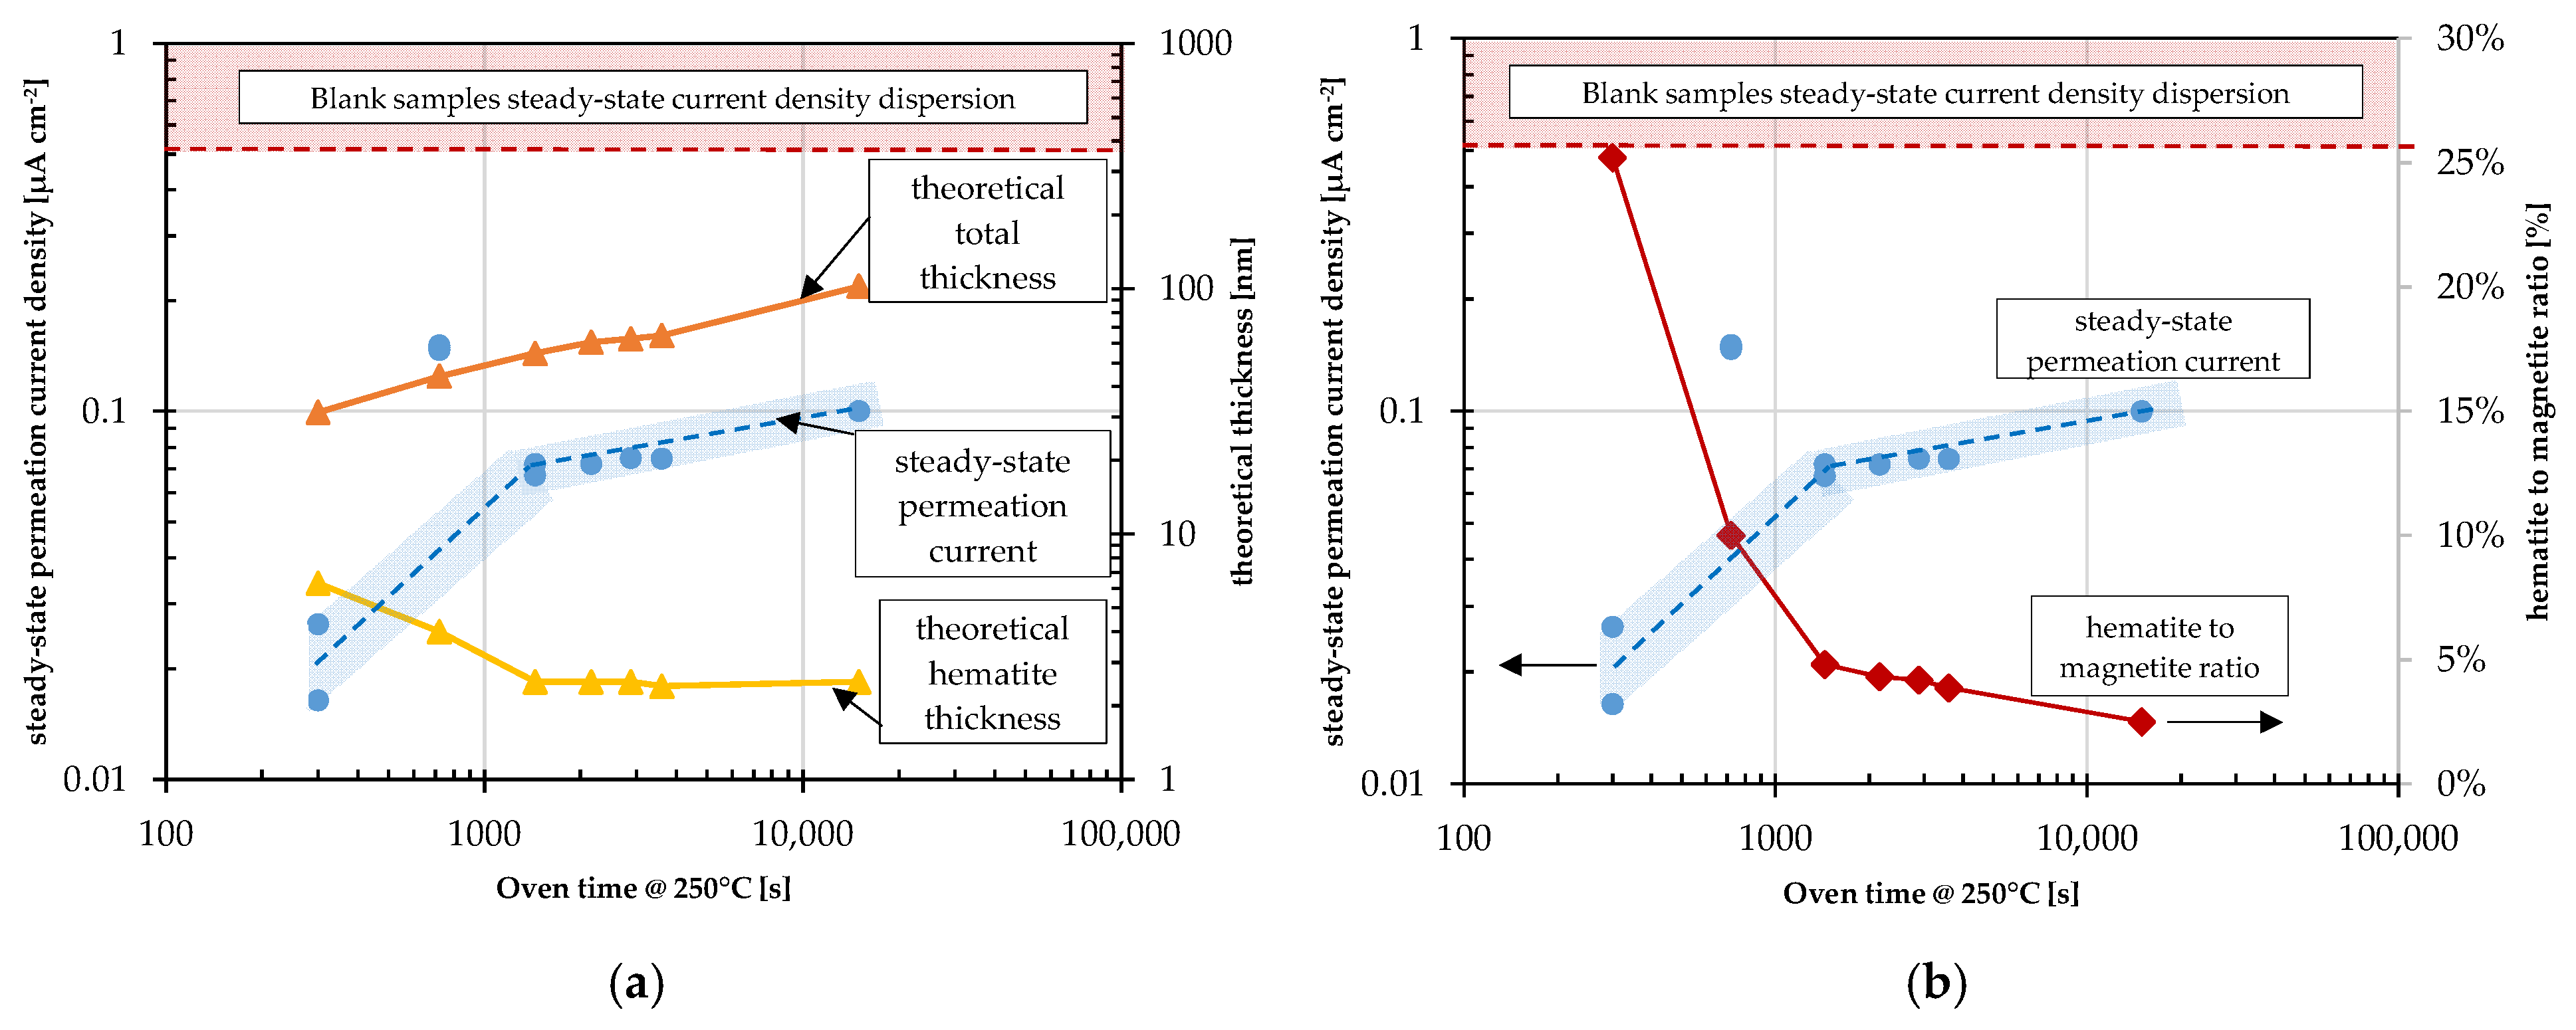
Raman analysis of the oxide layers shows that they consist of hematite and magnetite, which grow in different proportions, as reported in Figure 3. However, determining their exact proportions requires more advanced techniques than Raman spectroscopy alone. Wieland et al. [11] used spectroscopic ellipsometry to measure the thickness of the oxide layers. The total oxide thickness nor the thickness of the individual phases was directly measured in this work; instead, they were estimated based on the values reported by Wieland et al. [11] under comparable thermal treatment conditions. Accordingly, these values should be considered approximate and would require direct thickness measurements and detailed microstructural characterization for full validation. For each sample, the total oxide thickness, the thickness of the individual phases and the calculated hematite-to-magnetite ratio are reported in Figure 10, together with the apparent steady-state permeation current density. With increasing furnace time, the total thickness increases monotonically, as expected; however, the hematite-to-magnetite ratio is higher for samples with shorter exposure times and decreases for samples subjected to longer oxidation times, indicating a progressive enrichment in magnetite. The apparent steady-state permeation current density trend exhibits a change in slope after approximately 24 min of oven time, when the theoretical hematite thickness remains relatively constant and the hematite-to-magnetite ratio decreases (Figure 10). This increase in permeation current density can be correlated with the decrease in the hematite to magnetite ratio, but it may also be associated with features typical of thicker oxide scales. As the oxide layer grows, it may develop a higher density of defects, microcracks, or structural inhomogeneities, which could locally reduce its effectiveness as a barrier and partially counteract the expected shielding effect [11,23].
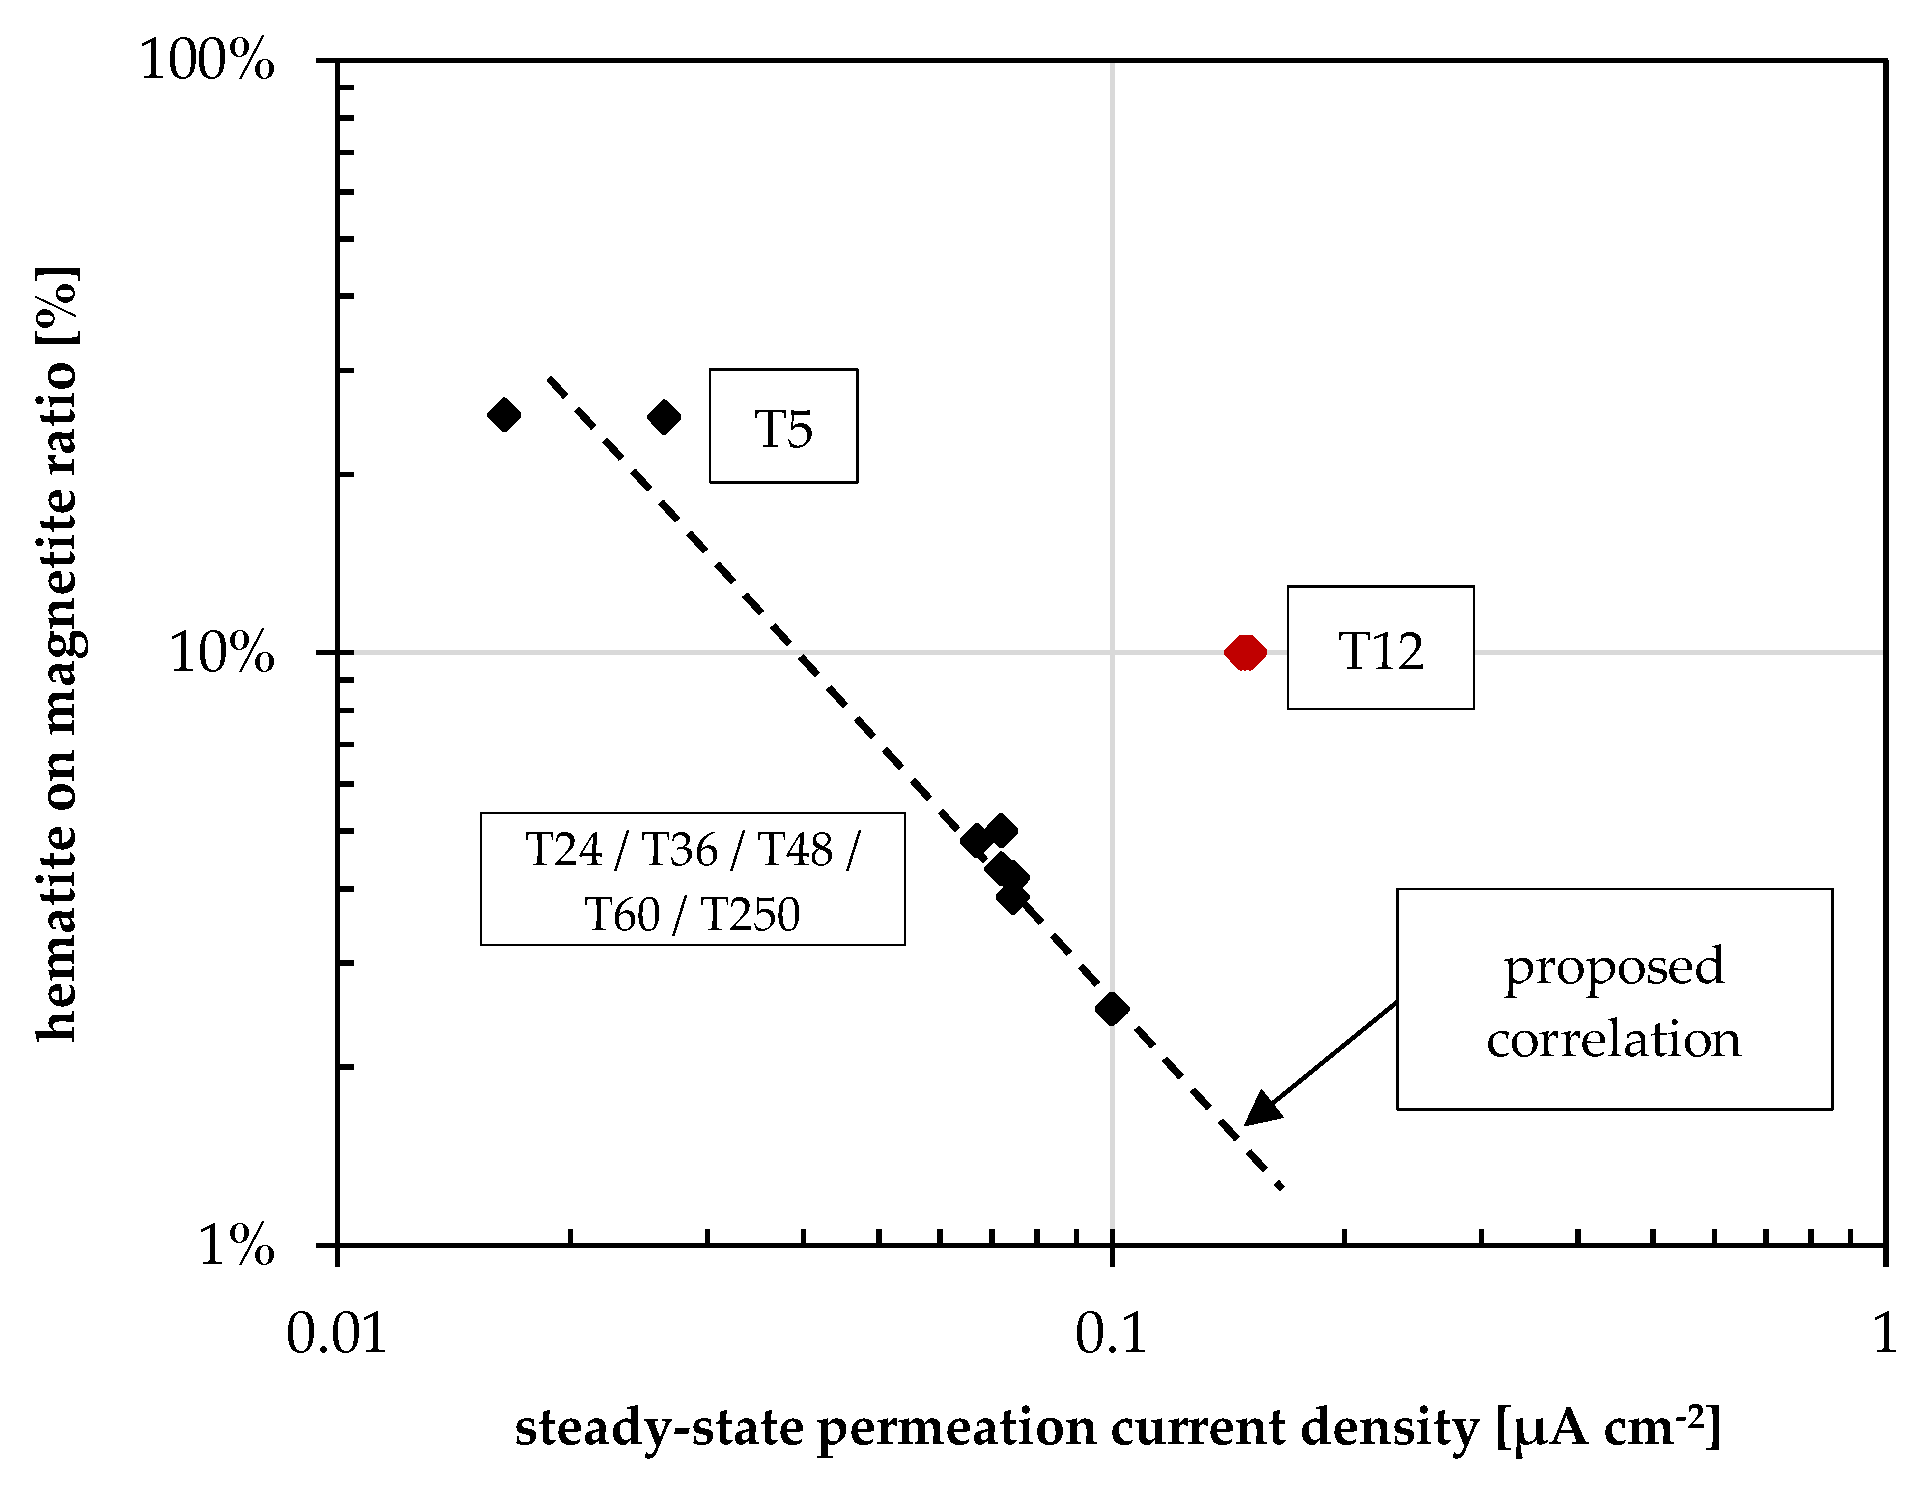
The variation of the permeation current densities as a function of the hematite-to-magnetite ratio (Figure 11) shows that apparently a higher hematite fraction leads to a reduction in the permeation current density. Taking into account the different interpretations proposed in the literature to explain the influence of oxide layers on hydrogen permeation current density [3,5,8,9,23,24,26], the inverse correlation observed in the present work may be discussed in relation to the different transport and electrochemical properties of hematite and magnetite. In particular, hematite is generally reported to have a significantly lower electronic conductivity than magnetite [11]. Since previous studies have shown that the overall electrical resistance of thermally grown iron oxide scales is strongly affected by the thickness and continuity of the outer hematite layer [10,11], a hematite-rich surface may contribute to limiting interfacial charge-transfer reactions involved in hydrogen entry and recombination.

6. Conclusions

The presence of a thermally grown oxide layer on the charging side does not significantly affect the apparent steady-state permeation regime, as the oxide is likely removed during the early stages of testing, leading to behaviour comparable to that of non-oxidized samples. Conversely, oxides on the detection side systematically reduce the measured permeation current density, indicating an active role in controlling hydrogen permeation. This behaviour could be measured thanks to the specific experimental approach of placing the oxide layer on the detection side rather than on the hydrogen entry side. The reduction in permeation current is not governed primarily by oxide thickness, since thinner oxides formed after short oxidation times produced a stronger decrease than thicker oxides formed after longer treatments. This suggests that phase composition, particularly a higher hematite-to-magnetite ratio, plays a dominant role. However, although a reduced outward hydrogen flux may limit surface release, it could also promote hydrogen retention within the metal, potentially increasing susceptibility to hydrogen embrittlement. This aspect requires further investigation under conditions representative of gaseous hydrogen exposure.

Author Contributions

Conceptualization, M.C. and B.A.; Methodology, M.C. and L.G.; Validation, M.C. and B.A.; Formal Analysis, M.P. and L.G.; Investigation, M.P. and R.R.; Resources, M.C., M.P. and R.R.; Data Curation, M.P. and L.G.; Writing—Original Draft Preparation, M.P.; Writing—Review and Editing, M.C., L.G. and B.A.; Supervision, M.C. and B.A.; Project Administration, B.A.; Funding Acquisition, B.A. All authors have read and agreed to the published version of the manuscript.

Funding

This research was funded by the European Union—NextGeneration EU from the Italian Ministry of Environment and Energy Security POR H2 AdP MMES/ENEA with involvement of CNR and RSE, PNRR—Mission 2, Component 2, Investment 3.5 “Ricerca e sviluppo sull’idrogeno”, CUP: I83C22001170006.

Data Availability Statement

The raw data supporting the conclusions of this article will be made available by the authors on request.

Conflicts of Interest

The authors declare no conflicts of interest.

References

  1. Bruzzoni, P.; Garavaglia, R. Anodic iron oxide films and their effect on hydrogen permeation through steel. Corros. Sci. 1992, 33, 1797–1807. [Google Scholar] [CrossRef]
  2. Manolatos, P.; Jerome, M.; Duret-Thual, C.; Le Coze, J. The electrochemical permeation of hydrogen in steels without palladium coating. Part I: Interpretation difficulties. Corros. Sci. 1995, 37, 1773–1783. [Google Scholar] [CrossRef]
  3. Casanova, T. The Influence of an Oxide Layer on Hydrogen Permeation Through Steel. Corros. Sci. 1996, 38, 1535–1544. [Google Scholar] [CrossRef]
  4. Song, R.H.; Pyun, S.I.; Oriani, R.A. The hydrogen permeation through passivating film on iron by modulation method. Electrochim. Acta 1991, 36, 825–831. [Google Scholar] [CrossRef]
  5. Manolatos, P.; Jerome, M.; Galland, J. Necessity of a palladium coating to ensure hydrogen oxidation during electrochemical permeation measurements on iron. Electrochim. Acta 1995, 40, 867–871. [Google Scholar] [CrossRef]
  6. Zhang, T.; Zhao, W.; Zhao, Y.; Ouyang, K.; Deng, Q.; Wang, Y.; Jiang, W. Effects of surface oxide films on hydrogen permeation and susceptibility to embrittlement of X80 steel under hydrogen atmosphere. Int. J. Hydrogen Energy 2018, 43, 3353–3365. [Google Scholar] [CrossRef]
  7. Ma, H.C.; Zagidulin, D.; Goldman, M.; Shoesmith, D.W. Influence of iron oxides and calcareous deposits on the hydrogen permeation rate in X65 steel in a simulated groundwater. Int. J. Hydrogen Energy 2021, 46, 6669–6679. [Google Scholar] [CrossRef]
  8. Zhou, C.; Jiang, C.; Chen, H.; Xie, Y.; Lv, Y.; Shen, Y.; Zhang, K.; Zhang, L.; Zheng, J. Effect of heat treatment temperature on the hydrogen barrier properties of oxide films on the surface of X52 pipeline steel. Corros. Sci. 2025, 255, 113085. [Google Scholar] [CrossRef]
  9. Röthig, M.; Hoschke, J.; Chowdhury, F.W.; Tapia-Bastidas, C.V.; Venezuela, J.; Gray, E.; Depover, T.; Verbeken, K.; Djukic, M.B.; Atrens, A. Gaseous hydrogen permeation in X65 D pipeline steel and a preliminary evaluation of the influence of oxygen. Int. J. Hydrogen Energy 2025, 158, 150459. [Google Scholar] [CrossRef]
  10. Rubben, T.; Baert, K.; Depover, T.; Verbeken, K.; Revilla, R.I.; De Graeve, I. Influence of Thermal Oxide Layers on the Hydrogen Transport through the Surface of SAE 1010 Steel. J. Electrochem. Soc. 2022, 169, 111503. [Google Scholar] [CrossRef]
  11. Wielant, J.; Goossens, V.; Hausbrand, R.; Terryn, H. Electronic properties of thermally formed thin iron oxide films. Electrochim. Acta 2007, 52, 7617–7625. [Google Scholar] [CrossRef]
  12. Devanathan, M.A.V.; Stachurski, Z. The adsorption and diffusion of electrolytic hydrogen in palladium. Proc. R. Soc. London Ser. A Math. Phys. Sci. 1962, 270, 90–102. [Google Scholar] [CrossRef]
  13. Koyama, M.; Rohwerder, M.; Tasan, C.C.; Bashir, A.; Akiyama, E.; Takai, K.; Raabe, D.; Tsuzaki, K. Recent progress in microstructural hydrogen mapping in steels: Quantification, kinetic analysis, and multi-scale characterisation. Mater. Sci. Technol. 2017, 33, 1481–1496. [Google Scholar] [CrossRef]
  14. Ohaeri, E.; Eduok, U.; Szpunar, J. Hydrogen related degradation in pipeline steel: A review. Int. J. Hydrogen Energy 2018, 43, 14584–14617. [Google Scholar] [CrossRef]
  15. ISO 17081:2014; Method of Measurement of Hydrogen Permeation and Determination of Hydrogen Uptake and Transport in Metals by an Electrochemical Technique. International Organization for Standardization: Geneva, Switzerland, 2014.
  16. ASTM G148-97; Standard Practice for Evaluation of Hydrogen Uptake, Permeation, and Transport in Metals by an Electrochemical Technique. ASTM International: West Conshohocken, PA, USA, 1997.
  17. Parkins, R.N.; Zhou, S. The stress corrosion cracking of C-Mn steel in CO2-HCO3 CO32− solutions. II: Electrochemical and other data. Corros. Sci. 1997, 39, 175–191. [Google Scholar] [CrossRef]
  18. McBreen, J.; Nonis, L.; Beck, W. A Method for Determination of the Permeation Rate of Hydrogen Through Metal Membranes. J. Electrochem. Soc. 1966, 113, 1218–1222. [Google Scholar] [CrossRef]
  19. de Faria, D.L.A.; Venâncio Silva, S.; de Oliveira, M.T. Raman microspectroscopy of some iron oxides and oxyhydroxides. J. Raman Spectrosc. 1997, 28, 873–878. [Google Scholar] [CrossRef]
  20. Sparavigna, A.C. Raman Spectroscopy of the Iron Oxides in the Form of Minerals, Particles and Nanoparticles. ChemRxiv 2023. [Google Scholar] [CrossRef]
  21. Tadic, M.; Trpkov, D.; Kopanja, L.; Vojnovic, S.; Panjan, M. Hydrothermal synthesis of hematite (α-Fe2O3) nanoparticle forms: Synthesis conditions, structure, particle shape analysis, cytotoxicity and magnetic properties. J. Alloys Compd. 2019, 792, 599–609. [Google Scholar] [CrossRef]
  22. Shebanova, O.N.; Lazor, P. Raman spectroscopic study of magnetite (FeFe2O4): A new assignment for the vibrational spectrum. J. Solid State Chem. 2003, 174, 424–430. [Google Scholar] [CrossRef]
  23. Xie, D.G.; Wang, Z.J.; Sun, J.; Li, J.; Ma, E.; Shan, Z.W. In situ study of the initiation of hydrogen bubbles at the aluminium metal/oxide interface. Nat. Mater. 2015, 14, 899–903. [Google Scholar] [CrossRef] [PubMed]
  24. Goldman, M.; Tully, C.S.; Zagidulin, D.; Noël, J.J.; Shoesmith, D.W. The influence of trapped hydrogen on the passivity of iron oxides. Int. J. Hydrogen Energy 2025, 166, 150887. [Google Scholar] [CrossRef]
  25. Koren, E.; Yamabe, J.; Lu, X.; Hagen, C.M.; Wang, D.; Johnsen, R. Hydrogen diffusivity in X65 pipeline steel: Desorption and permeation studies. Int. J. Hydrogen Energy 2024, 61, 1157–1169. [Google Scholar] [CrossRef]
  26. Schomberg, K.; Grabke, H.J. Hydrogen permeation through oxide and passive films on iron. Steel Res. 1996, 67, 565–572. [Google Scholar] [CrossRef]
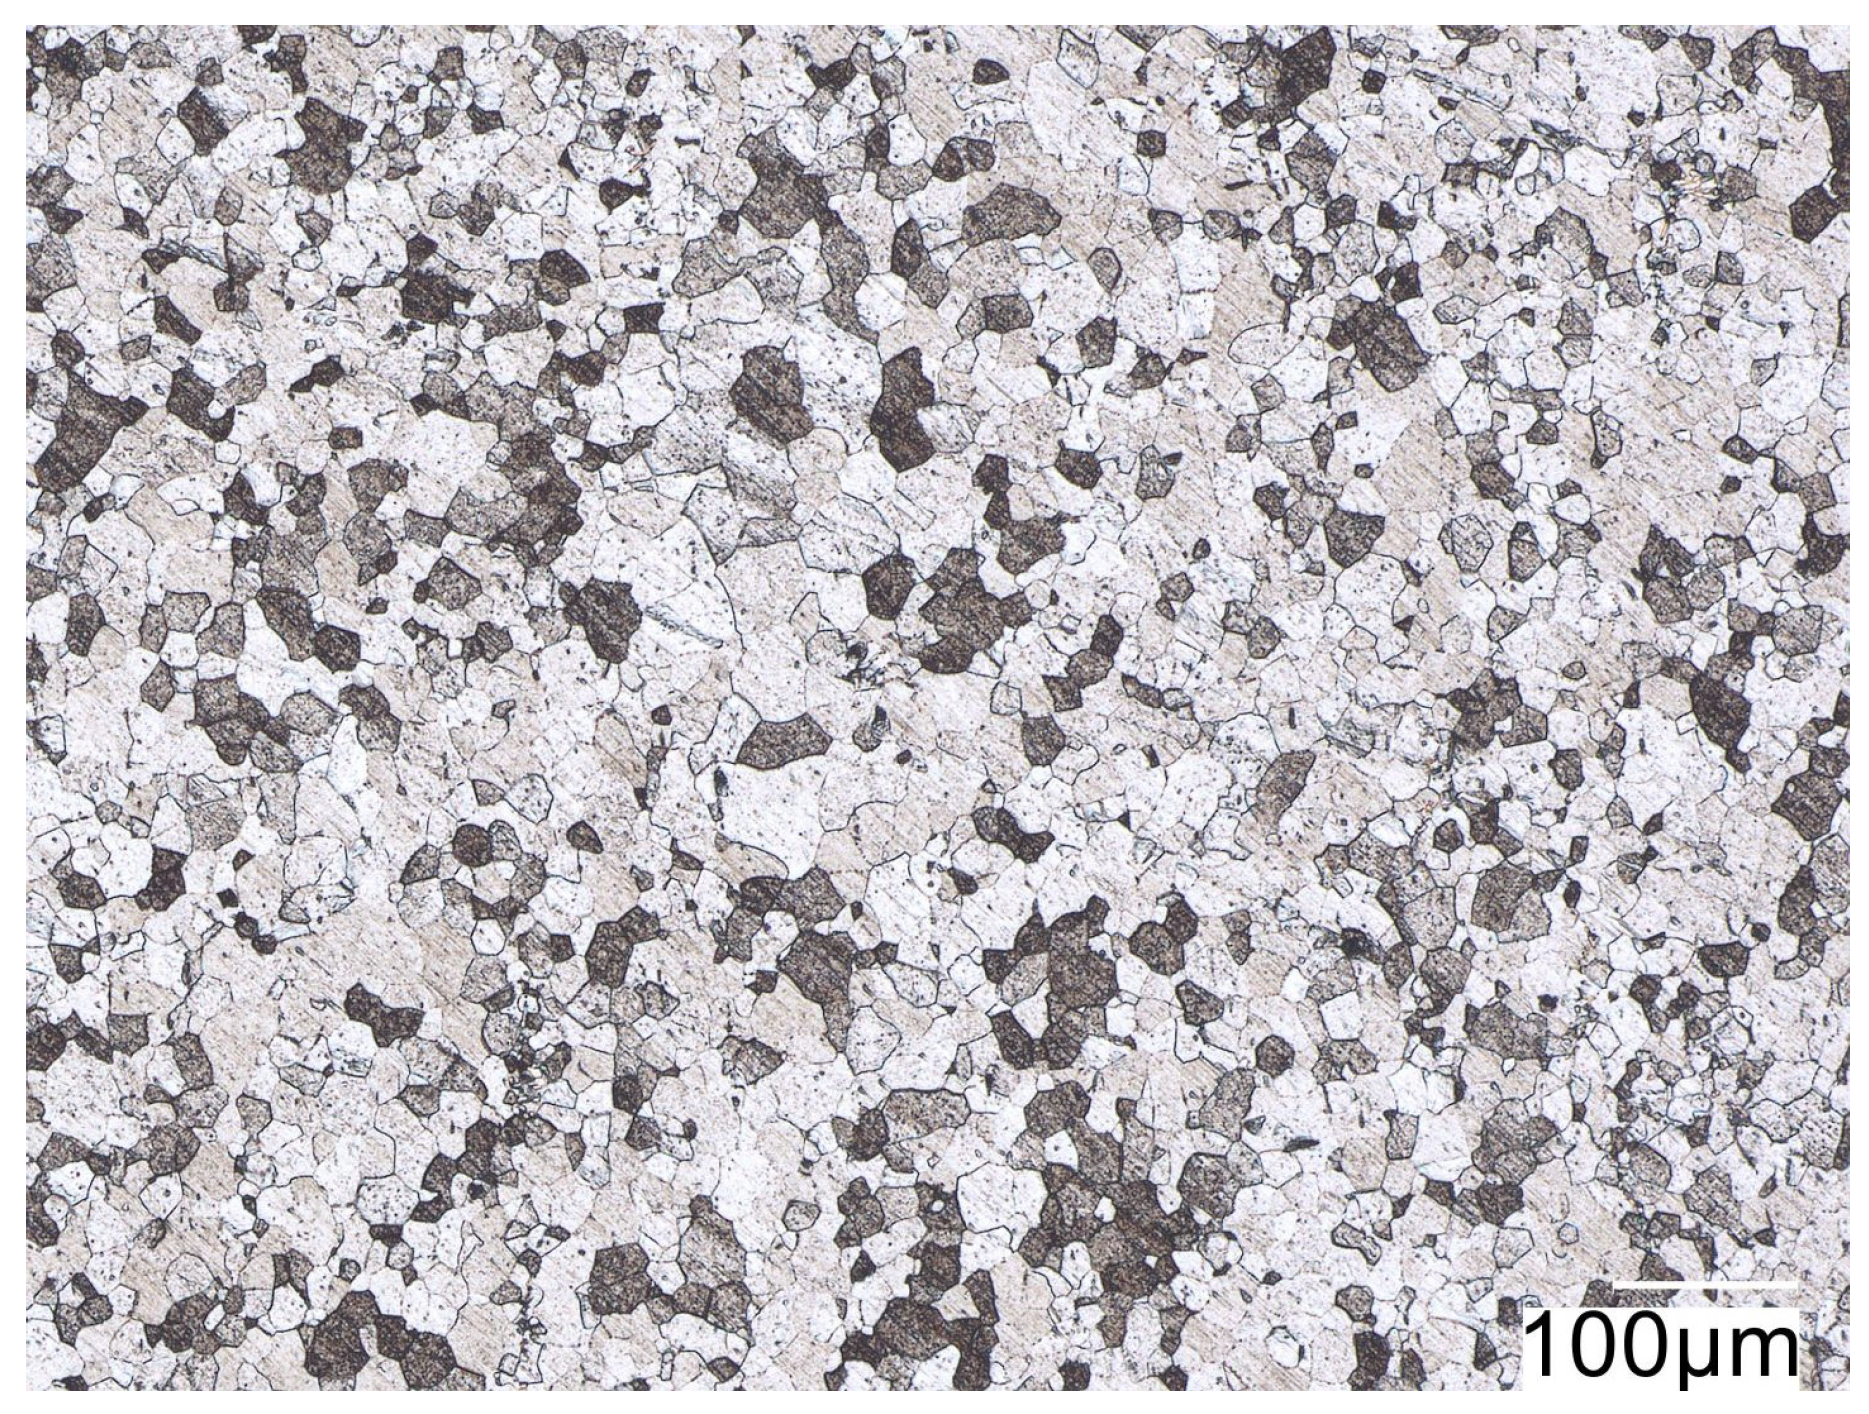
Figure 1. Ferrite–pearlite microstructure revealed by Nital etching for 50 s (300×).
Cmd 07 00042 g001
Figure 2. Surface appearance of samples oxidized at 250 °C for different durations: (a) 5 min; (b) 24 min; (c) 60 min; (d) 250 min.
Cmd 07 00042 g002
Figure 3. Comparison of Raman spectra of oxide layers, formed on samples after increasing furnace exposure time, normalized to the intensity of the magnetite peak.
Cmd 07 00042 g003
Figure 4. Permeation curve showing both the passivation and detection phases.
Cmd 07 00042 g004
Figure 5. Permeation curves corrected by subtracting the passivation current density.
Cmd 07 00042 g005
Figure 6. Charging side surface of the same sample before (left) and after (right) the permeation test.
Cmd 07 00042 g006
Figure 7. Raman spectra of the sample surface before and after the permeation test, compared with that of the blank sample.
Cmd 07 00042 g007
Figure 8. Raman spectra of the T48 sample surface (48 min at 250 °C) exposed to the detection side, acquired before and after the permeation test.
Cmd 07 00042 g008
Figure 9. Apparent steady-state hydrogen permeation current densities as a function of the oxidation time at 250 °C.
Cmd 07 00042 g009
Figure 10. Correlation between permeation current density, thickness, and composition of thermal oxides: (a) trend of the theoretical thickness of magnetite and hematite correlated with the permeation current density; (b) trend of the theoretical magnetite-to-hematite thickness ratio correlated with the permeation current density.
Cmd 07 00042 g010
Figure 11. Proposed correlation between the hematite to magnetite ratio and the permeation current density under apparent steady-state conditions.
Cmd 07 00042 g011
Table 1. Mass fraction composition of steel samples.
Weight %CMnPSAlFe
C-steel0.050.330.010.020.03balance
Table 2. Summary of the prepared samples and their exposure time at 250 °C for thermal oxide formation.
LabelSample Thickness
[mm]
Time of Exposure at 250 °C [min]
1T5-21.45
2T5-31.45
3T12-21.212
4T12-31.412
5T12-41.412
6T24-11.224
7T24-21.224
8T36-21.436
9T48-21.448
10T48 charging side1.448
11T601.260
12T250-21.4250
13Blank-21.4/
14Blank-31.4/
Table 3. Summary of the permeation current density values ( i p e r m ) measured at apparent steady-state condition, diffusion coefficient ( D a p p ), apparent entry-side hydrogen concentration ( C 0 ) and time lag for all tested samples.
LabelFurnace Time
[min]
Permeation
Current Density at Apparent Steady-State Condition
[µA cm−2]
D Apparent
[m2 s−1]
Apparent
Entry-Side C0
[mol/m3]
t_lag
[s]
1T5-250.0162.9 × 10−110.051200
2T5-350.0266.1 × 10−110.12200
3T12-2120.1496.9 × 10−110.3800
4T12-3120.1514.3 × 10−110.52700
5T12-4120.1475.3 × 10−110.42500
6T24-1240.0676.1 × 10−110.11500
7T24-2240.0728.1 × 10−110.11650
8T36-2360.0726.2 × 10−110.21650
9T48-2480.0755.1 × 10−110.21650
10T48 charging side480.5065.3 × 10−111.41200
11T60600.0759.4 × 10−110.1600
12T250-22500.16.5 × 10−110.31350
13Blank-200.6956.1 × 10−111.7/
14Blank-300.5336.9 × 10−112.1/
Disclaimer/Publisher’s Note: The statements, opinions and data contained in all publications are solely those of the individual author(s) and contributor(s) and not of MDPI and/or the editor(s). MDPI and/or the editor(s) disclaim responsibility for any injury to people or property resulting from any ideas, methods, instructions or products referred to in the content.