Article

Comprehensive Methodology for Quality Assurance Following Installation and Backfilling of Polymer-Coated Steel Pipelines


by
Gregory R. Neizvestny
1,2,
Samuel Kenig
3 and
Konstantin Kovler
2,*
1
Mekorot–Israel National Water Co., Tel-Aviv 6713402, Israel
2
Faculty of Civil and Environmental Engineering, Technion–Israel Institute of Technology, Haifa 3200003, Israel
3
The Department of Polymer Materials Engineering, Shenkar College of Engineering and Design, Ramat Gan 5252626, Israel
*
Author to whom correspondence should be addressed.
Corros. Mater. Degrad. 2026, 7(2), 35; https://doi.org/10.3390/cmd7020035
Submission received: 16 March 2026 / Revised: 28 May 2026 / Accepted: 28 May 2026 / Published: 9 June 2026

Highlights

What are the main findings?
  • Establishing the new criteria for 3LPE coating of underground steel pipelines, including re-definition of defect severity classification, and stricter minimum performance thresholds for oil/gas and water pipelines.
  • First systematic QA framework for post-installation/backfilling assessment of polymer coatings.
  • Introduction of quantitative criteria for average specific electrical resistance of polymer coatings.
  • Direct correlation between coating defects, dielectric degradation, and cathodic protection (CP) current demand.
  • Introduction of a physically based new parameter: specific coating defect ratio (Ae).
  • Integration of complementary NDT methods into a unified polymer coating QA protocol.
What are the implications of the main findings?
  • Enhanced coating reliability and service life through early post-installation QA, enabling detection of installation-induced defects and control of corrosion protection performance from initial service stages.
  • Optimized inspection strategy through integration of DT (Drainage Test) and DCVG (Direct Current Voltage Gradient) results into a unified polymer coating QA protocol, enabling efficient staged diagnostics and reducing unnecessary excavations.
  • Defect-controlled integrity management linking defect density (Ae), electrical resistance, and CP current, enabling predictive maintenance focused on localized damage rather than bulk polymer degradation.
  • Transition from qualitative to quantitative QA through resistance-based criteria and defect metrics, enabling standards revision aligned with the dielectric performance of modern 3LPE coatings.

Abstract

The article deals with non-destructive methodologies for assessing and preventing corrosion of polymer-coated underground pipelines, advanced corrosion-barrier coating systems based on extruded three-layer high-density polyethylene (3LPE), corrosion control strategies for buried oil, gas, and water transmission infrastructures, and mechanisms and engineering approaches for corrosion prevention and mitigation. The quality assurance of newly polymer-coated underground pipelines, following construction (installation and backfilling), is vital for evaluating the polymer coating quality state and the efficiency of passive anti-corrosion protection, aimed at reducing corrosion risks and prolonging the pipeline’s service life. The evaluation relies on the coating average specific electrical resistance and the presence of coating defects (number, total area, and distribution) of inspected pipeline sections. In this study, based on extensive real data obtained from testing of newly installed underground water and oil/gas pipeline networks (60 projects with a total pipeline length of 260 km) with various technical characteristics, Drainage Test and DCVG (Direct Current Voltage Gradient) complementary non-destructive indirect methods have been investigated to determine the quality level and identify the location and severity of defects in polyolefin (polyethylene) coatings. The novel concepts and criteria were defined: the quantitative criteria for average specific electrical resistance are established; in addition, a new parameter related to the specific coating defects ratio is introduced, which has been shown to correlate with the criteria for the average specific electrical resistance of the polymer coating and consumed electrical current; finally, following DCVG measurements of the 3LPE coating system, a novel degree of relative defect sizes (%IR) for repairs has been suggested. The innovative and comprehensive approach can support the efforts of regulatory quality assurance, design, maintenance, safety, and research communities to ensure the long-term integrity and sustainability of underground polymer-coated steel pipelines.

1. Introduction

The quality objective of underground buried steel pipelines (oil, gas, water, and product derivatives) is to ensure safe operation, reliability, durability, and environmental safety over their service life as required by technical specifications. According to a report of the leading international corrosion organization, AMPP (NACE) [1], the drinking water and sewer systems sector has the largest direct corrosion impact costs among different industrial sectors. The failure of steel pipelines is frequently attributed to external and internal corrosion [2]. To prevent them, it is essential to implement appropriate measures by conducting various quality assurance methodologies. Therefore, the quality assessment of the external and internal walls of the pipelines in service is highly important [3,4]. Non-destructive testing/examination (NDT/NDE) tools are proposed to monitor the quality level of steel pipelines and protective coatings [5]. Pipeline diagnostics include internal and external methods. Internal diagnostics, or in-line inspection (ILI), detects anomalies, like cracks and pitting, by ultrasonic testing (UT) or magnetic flux leakage (MFL) [6]. External diagnostics employs above-ground techniques for assessing the quality of polymer-coated underground steel pipelines [7,8]. This methodology, known as ECDA (External Coating Direct Assessment) [9], identifies defects in buried pipelines after installation and backfilling to mitigate future corrosion deterioration.
A pipeline comprises a steel pipe and a polymer coating that provides passive anti-corrosive protection [10,11]. External active protection methods are also used, including electrochemical protection through Cathodic protection (CP) [12,13,14].
Underground buried ferrous pipelines are subjected to soil corrosion due to chemical or physicochemical interactions with their surrounding environment [15,16].
Commonly, the external protective polymer coating on the metal surface of the pipe should effectively isolate it from the corrosion of the soil electrolyte [17]. The protective coatings should adhere to the metal, have low permeability to water, gases, chlorine ions, and sulfates, and have high elongation, strength, and electrical resistance throughout their service life [18]. The polymer coating significantly reduces the CP current consumption and interference, prevents the infiltration of stray currents into the pipeline, and minimizes the leakage of protective current [18].
Before the 1980s, external coatings for underground steel pipelines included bitumen, coal tar, polymeric tapes, and Fusion Bond Epoxy (FBE) [19,20]. In legacy coating systems, the formation of numerous external coating defects during service significantly increased cathodic protection (CP) current demand due to compromised dielectric integrity [21]. At the beginning of the 1980s, a 3-layer extruded HDPE (3LPE) polyolefin coating system was developed [20,22] that currently is one of the main factory-applied coating system types used for underground gas, oil, and water steel pipelines. The main recent standards for the factory-applied coating systems are [23,24,25] and for field joint coatings—[26].
Three primary standards [23,24,25] specify the technical characteristics of newly HDPE coatings for underground pipelines. The [24] standard is preferable for underground water pipeline mains, as it has technical requirements more suited to the water industry. This standard specifies that 3LPE includes a 60 µm minimum thickness of epoxy primer (FBE), a 140 µm copolymer adhesive layer, and a protective high-density polyethylene (HDPE) top layer. The total coating thickness varies by diameter and type, ranging from 1.8 mm for diameters up to 100 mm to 3.7 mm for those over 800 mm. For pipes with diameters of 80″ (2032 mm) and 100″/108″ (2540/2743 mm), the local standard [27] specifies minimum thicknesses of 4.2 mm and 5 mm, respectively.
The technical specifications for external protective field joint coatings (FJC), like 2-layer heat shrinkable sleeves (HSS), applied at various field locations, including welding joints, T-joints, elbows, and similar irregular areas under limited controlled quality installation, compared to those of factory-applied coatings, are not identical [26,28,29].
Careless loading, transportation, and installation of pipes at the site can damage the coating [30]. Accordingly, the primary requirements for achieving a reliable and long-term service performance of polymeric coating systems are the effective mitigation of degradation-induced damage mechanisms and the implementation of rigorous quality assurance protocols to ensure sustained structural integrity and durability following pipeline installation and backfilling.
Pipeline coatings degrade with service time due to numerous factors [31,32,33], such as soil characteristics, static and dynamic stresses, groundwater, microorganisms, and temperature. This can gradually increase corrosion risks [34,35,36]. In areas where the coating is damaged or degraded, and CP is wholly or partially absent, the pipeline is susceptible to soil corrosion and to the detrimental effects of stray currents. Corrosive soil conditions are the most common cause of external corrosion in transmission water mains [37].
Corrosion protection philosophy comprises different approaches in North America and Europe:
  • North American regulation, like [38], requires the utilization of non-shielding coatings for buried pipelines. A non-shielding coating allows cathodic protection current to reach the pipeline surface even if the coating is disbonded. Disbondment is the loss of adhesion and separation of a protective polymer coating from the underlying steel substrate [39]. Therefore, the prevalent external pipeline coating in the USA is Fusion Bonded Epoxy (FBE) with the above required characteristics according to international standards [40,41,42].
  • In Europe and the Middle East, pipelines are typically protected from corrosion using a three-layer extruded polyethylene (3LPE) coating system combined with Impressed Current Cathodic Protection (ICCP). This combination has been proven highly effective over time. This type of coating constitutes a shielding coating that prevents cathodic protection (CP) current from reaching the pipeline surface [43].
In recent decades, many studies have been conducted to understand this mechanism and the effectiveness of cathodic protection under disbonded coatings [36,44,45]. According to novel theoretical models and practical observations, no corrosion occurs beneath fully disbonded 3LPE coatings and at adjacent disbonded areas.

2. The Polymer Coating’s Specific Electrical Resistance

Pipeline passive protection is assessed by measuring its specific electrical resistance of polymer coating. This parameter is the essential property that expresses the operational state of the pipeline and reflects both the quality of the coating and the consumption of CP current. The coating’s specific electrical resistance is mostly influenced by a polymer coating’s electrical resistance at a localized defect, which includes several contributing resistances due to the surrounding soil, as described in Figure 1 and is detailed hereupon [46,47,48,49]. A coating defect is defined as a discontinuity in the protective coating that results in exposure of unprotected steel surface to the soil environment.
The polymer coating’s total resistance to a local defect with CP current is:
Rdef = Rpol + RD + RF + RB
The polarization resistance (Rpol) is calculated according to the formula:
Rpol = ΔU/j·AD = rpol/AD
where
  • Rpol—polarization resistance in coating defect (Ω).
  • ΔU—polarization shift in defect potential (0.3 ÷ 0.6 V)
  • ΔU = Uoff − Un (Uoff—Instant Off potential, V (without current); Un—natural potential, V)
  • j—current density of polarized defect (0.1–0.5 A/m2)
  • AD—Defect area (m2)
  • rpol—specific polarization resistance (Ω·m2); rp = 0.3V/0.3A·m−2~1 Ω·m2
The resistance of the polarization film (RD) is determined by the following expression:
RD = rD/AD
where
  • RD—resistance of the polarization film (Ω).
  • rD—Average electrical resistance of the defect’s coating layer formed on the surface of cathodically protected steel (Ω·m2); rp = 1 ÷ 10 Ω·m2 (rp(average) ≈ 5 Ω·m2).
  • AD—Defect area (m2).
The longitudinal resistance in the defect location (RF) is given by the formula:
RF = ρl/AD
where
  • RF—The longitudinal resistance in the fault location (Ω).
  • ρ—Specific electrical soil resistivity (Ω·m).
  • l—coating thickness (m).
  • AD—Defect area (m2).
The spreading resistance (RB) of a defect through the soil is given by the following expression:
RB = ρ/2d
where
  • RB—Resistance to defect current spreading through the soil/The resistance to remote earth (Ω).
  • ρ—Specific electrical soil resistivity (Ω·m).
  • d—equivalent diameter of surface (m).

3. Coatings Defects in Conjunction with Cathodic Protection

Cathodic Protection (CP) is widely used to mitigate corrosion in underground steel pipelines. This anticorrosion method works by applying electrical current from either ICCP stations or sacrificial anodes, mostly Magnesium (Mg) or Zinc (Zn), causing the current to flow through the conductive soil (electrolyte) to the metal surface in areas of coating defects.
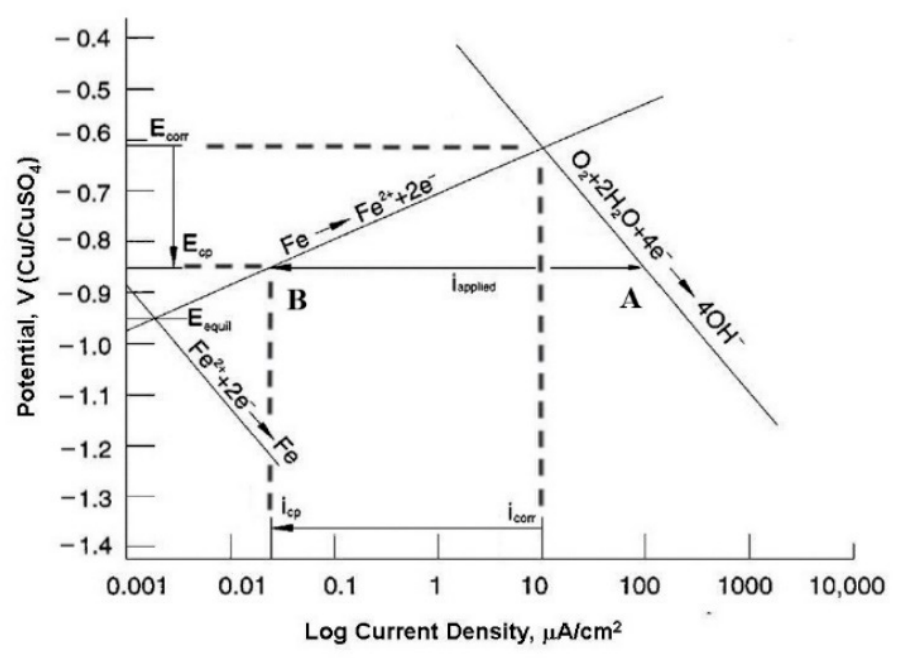
As shown in the Evans diagram given in Figure 2 [2,50] and as shown further in Table 1, the pipeline’s potential is deliberately shifted to more negative values by cathodic polarization with appropriate protection (or IR-free) potentials, which in turn reduces its corrosion rates to less than 0.01 mm/y. As depicted, the initial parameters used for Figure 2 are the corrosion potential (Ecorr) versus CSE (Cu/CuSO4) reference electrode, with Ecorr (CSE) = −0.61 V, and the corrosion current density jcorr = 10 µAcm−2. By applying a cathodic current density of japp(AB) = jAjB ≅ 102 µAcm−2, the corrosion potential is shifted to a protection potential (ES) of −0.85 V, reducing the anodic current density of approximately 100.04 µAcm−2, indicated by the vertical dashed line (point B) [50,51]. As the underground pipeline reaches the protection potential (−0.85 V) under cathodic protection, the corrosion rate at the structure’s steel surface is minimized. According to Figure 3, applying CP enhances the reduction reaction rate by generating hydroxide anions (OH), or consuming hydrogen cations (H+) (chemical reaction). An increased reaction rate leads to higher pH levels at the metal surface, making the environment more alkaline (basic). As a result of this process, the anodic Tafel slope increases, causing the oxidation kinetics to move left on the diagram. Passivation, the formation of a stable oxide film in an alkaline environment, is responsible for the decline in the metal’s corrosion rate.
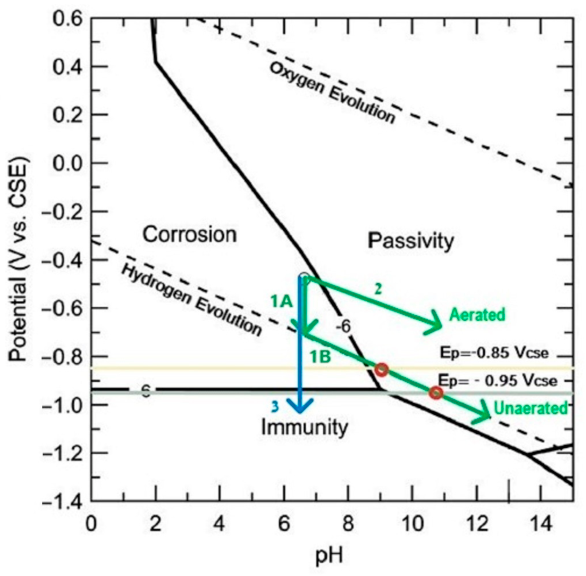
Relevant technical principles and protection potential criteria are outlined in internationally recognized standards [52,53]. The efficiency of cathodic protection is governed by the dual polarization behavior of exposed steel at coating defects, which induces localized alkalization (elevated interfacial pH) at the metal surface, thereby suppressing electrochemical corrosion processes [46,54,55]. These processes are reflected in Pourbaix diagram (Figure 3).
Recent studies have emphasized that alkalinity (pH) is a crucial and foundational factor in achieving effective corrosion protection [56,57]. The effectiveness of cathodic protection largely relies on mass transport and diffusion processes of hydroxyl ions adjacent to the steel surface, as shown in Figure 3, describing the different polarization types contributing to steel protection in soils: for good bedding quality or precipitation of calcareous deposits in well-aerated or unaerated soils, the mechanism of cathodic protection is characterized by favoring the continuous accumulation of hydroxyl ions at the steel surface and formation of a passive film; for poor bedding or presence of Sulfate Reducing Bacteria (SRB), the mechanism of cathodic protection is characterized by restricted convection of hydroxyl ions at the steel surface, without the formation of a passive film. Based on the protection (IR-free) potential criteria as reflected in Table 1, the next electrochemical processes occur:
a.
Protective potentials criteria of −0.85 VCSE and −0.95 VCSE—both, the increased oxygen reduction (lower concentration of oxygen dissolved in the electrolyte) and the hydrogen evolution
For good bedding conditions or calcareous deposits, the scenario can be considered favoring hydroxide ion accumulation and formation of a passive film at the steel surface. The unaerated conditions are controlled by increased oxygen reduction and hydrogen evolution as dominant cathodic reactions. Once cathodic current is applied, the residual oxygen concentration near the steel surface in the soil drops from 8 ppm (the typical dissolved oxygen level in water at ambient temperature) to 0 ppm, reflecting complete oxygen consumption [58,59]. The cathodic reaction yields hydroxyl ions (OH) at the steel surface, which in turn raises the pH in its vicinity [60,61]. Due to the accumulation of hydroxyl ions (OH) at the steel interface, the pH increases, facilitating the formation of a passive film (passivation) that inhibits corrosion.
Once oxygen is depleted, the steel potential shifts toward the equilibrium potential of the hydrogen electrode, which is governed solely by the pH, as described by the following Nernst equation:
EH+/H2 = −0.320 − 0.059·pH
As the equilibrium potential for hydrogen evolution is governed exclusively by pH, the IR-free potential at the steel surface serves as a direct indicator of the local pH environment, as reflected in Table 1:
At −0.85 VCSE (IR-free potential), the steel surface reaches a pH of 9, a level that ensures passive film formation in normal and aerobic soil conditions.
At −0.95 VCSE (IR-free potential), the steel surface reaches a pH of 10.5, a level that supports passivity in anaerobic and aggressive soils.
Figure 3 explains the electrochemical process: Assuming that the initial point is in the corrosion zone with the unprotected potential of −0.48 V and with the neutral pH (~7). The green arrow (1A) shows the contribution of activation polarization with the negative shift in potential only; whereas the continued green line (1B) represents the contribution of concentration polarization with the shift in IR-free potential along the hydrogen evolution line up to two IR-free potential criteria in the international standards (−0.85 VCSE and −0.95 VCSE) [52,53,54,62]. Both criteria correspond to alkalinity values of pH = 9 and pH = 10.5, respectively, in the passivity zone.
Considering the overall electrochemical framework (restricted to protection potentials down to −1.20 V, while more negative potentials are deliberately excluded due to their association with overprotection phenomena such as coating disbondment and hydrogen embrittlement), the dominant electrochemical reactions under neutral soil conditions can be described as follows:
Cathodic Reaction (Oxygen Reduction): O2 + 2H2O + 4e → 4OH
Anodic Reaction (Iron Oxidation): Fe → Fe2+ + 2e
b.
Protective potentials criteria of −0.65 VCSE and −0.75 VCSE—Overpotential oxygen reduction
The porous media of soil, i.e., fine sand, allows for continuous oxygen diffusion, making depletion improbable under well-aerated bedding conditions or calcareous deposits without oxygen depletion. Overpotential oxygen reduction becomes the dominant factor influencing steel potential, in which the protection potential surpasses −0.85 VCSE, and the pH at the steel surface becomes indeterminate. Although protection potentials may be considerably more positive (green arrow 2 in Figure 3), this does not imply corrosion, as clarified in Table 1 under specific conditions. They correspond to two IR-free potential criteria in the standards (−0.65 VCSE and −0.75 VCSE) in the passivity zone [52,53].
c.
Poor bedding or presence of SRB (Sulfate Reducing Bacteria)
For poor bedding or the presence of SRB, under certain conditions, such as the presence of air voids or flowing water at the pipeline-soil boundary, accumulation of hydroxyl ions has not occurred, preventing the formation of a passive film, especially in gravel bedding where trench preparation has led to uneven settlement. If passivity cannot be attained, the steel must be polarized by high current CP densities to sufficiently negative potentials toward the immunity zone to ensure sufficient corrosion protection (blue arrow 3 in Figure 3).

4. The Current Comparison Method

The current comparison method consists of the following parts:
-
Calculation (based on a worst-case quality) of the limiting current I* value needed to achieve a protection potential or IR-Free potential (Es).
-
Performing a Drainage Test (cathodic polarization) to measure the actual polarization current I.
-
Calculation of the I* value compared with the actual measured I value to evaluate whether the pipeline is protected against corrosion.
When the pipeline is polarized to a steady state condition, the following applies:
ΔE = Eon − EIR-free
where
  • ΔE—IR drop in soil caused by the current running to a coating defect
  • Eon—Potential of coating defect (i.e., pipeline) as measured in remote earth
  • EIR-free—Potential at the coating defect
The resistance for a circular coating defect with a diameter d is:
RB = ρ/2d
In accordance with Ohm’s Law:
ΔE = I·RB = I·ρ/2d  ⤇  I = ΔE·2d/ρ
To eliminate the diameter of the coating defect from the equation, the current density is introduced:
J = I/A = I/(π·d2/4) = 4 I/(π·d2)
d2 = 4 I/(π J)
Taking the square of Equation (11), rearrangement and substitution of Equation (13) give the following:
I2 = ΔE2·4d22 = ΔE2·4·4·I/π·J·ρ2
I = 16ΔE2/πJρ2
where
  • I—Protection current (A).
  • ΔE—IR drop in soil caused by the current flowing to a coating defect, V (ΔE = Eon − EIR-free).
  • J—Current density (A/m2).
  • ρ—specific soil resistivity (Ω·m).
The limiting current I* is the current that is needed to polarize the pipe-to-soil potential to the protection potential ES can be derived from Equation (15).
I* = 16·(Eon − Es)2/π·J*·ρ2
Table 2 defines the symbols as well as typical values used for the specific calculations.
Table 3. Guide values for the protection current density for bare steel required to achieve the protection potential in different environments.
MediumProtection Current Density in mA/m2
Soils with sand and gravel500
Mixed soil200
Cohesive soils of clay100
Standing groundwater100
Flowing groundwater (for example on slopes)200

5. Criteria for Protection Potentials

The protection or IR-free potential is a criterion for corrosion protection in the leading standards [52,53]. It is defined as the potential between the structure and the electrolyte, excluding any voltage error from IR drop due to cathodic or other currents. The above standards specify that the CP is effective when the metal-to-electrolyte Off-potential is more negative than the protection potential and should not be more negative than −1.20 VCSE. Table 2 details the applicable protection potentials as given in the standards [52,53].
The guide values for the protection current density for bare steel required to achieve the protection potential in different environments have been adopted from [46] and are represented in Table 3.
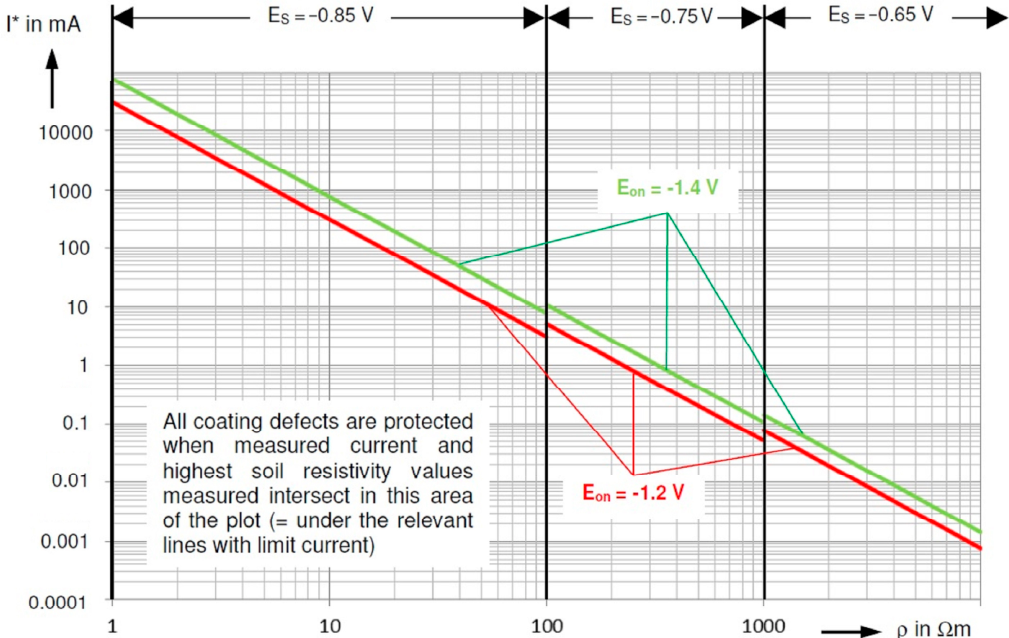
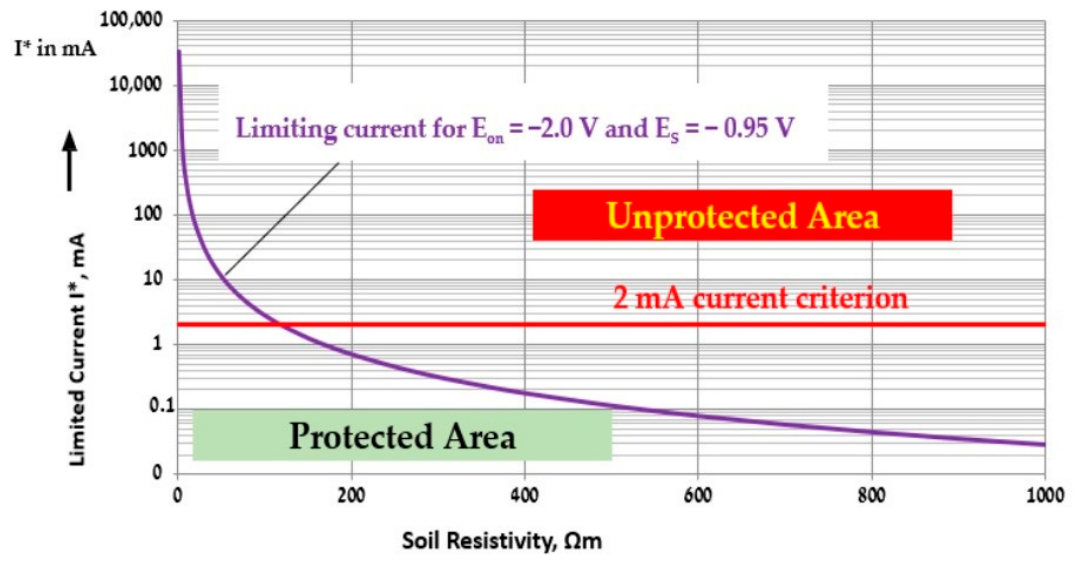
As a practical example, let us consider two cases described in Table 4, which are graphically represented in Figure 4.
To determine whether all coating defects at the pipeline section under investigation are protected, the following must apply:
-
The Off potential measured at the drain point must fulfill the protection potential ES.
-
The intersection points of the measured polarization current and the highest soil resistivity measured along the pipeline must be located below the relevant line with limit current, as shown in Figure 2.
The polarization current I is measured by means of a Drainage Test (cathodic polarization) as specified later.
To compare between polarization current I and limit current I*, Table 5 provides the guidelines for the interpretation of the results in accordance with the standard [63] (Section 2.4.1 in the standard).

6. Experimental Procedure

6.1. General

This quality assurance case study aims to develop comprehensive assessment criteria for the protective polymer coatings of underground steel pipelines after installation and backfilling, to investigate the DCVG indirect method, and to establish technical specifications, quality assurance, and control instructions. The case research has been based on 60 underground water and gas/oil projects, with varying lengths and diameters ranging from 6 inches (152 mm) to 100 inches (2540 mm).
The new water and gas/oil steel transmission pipeline projects are spread across various regions of the country, each one with distinct technical features that set them apart from other projects. This diversity has enabled the testing of the non-contact methods for performance, effectiveness, and reliability over a wide range of conditions.
Commonly, electrical methods are utilized to evaluate the coating quality and integrity of underground steel pipelines [12]. After installing and welding the pipeline in an open trench, but before backfilling, a visual inspection is performed on the coated steel pipeline section [64]. Afterward, spark testing or high-voltage detection is performed to identify coating discontinuities in the open trench only. This method is described in the standards [65,66]. Following installation and backfilling, the average coating’s specific electrical resistance and consumed current as measured by the Drainage Test (cathodic polarization) have been used to assess the quality level of the newly polymer-coated buried steel pipelines.
Furthermore, the DCVG technique is applied to indicate and locate coating defects and their severity.

6.2. Determination of Coating Average Specific Electrical Resistance and Consumed Electrical Current Criteria in Newly Installed and Backfilled Buried Pipes

The method for assessing average specific coating electrical resistance (herein: coating electrical resistance) and consumed electrical current in installed and backfilled electrically separated pipeline sections involves cathodic polarization and measuring pipe-to-soil potentials (On/Off) with the polarizing electrical current. The name of the test is the Drainage Test (DT), or the current requirement test, or the cathodic polarization test.
The leading international regulations [24,26,52,53] do not include methodology and criteria regarding the coating electrical resistance of newly polymer-coated underground steel pipelines after installation and backfilling. Some of them refer to coating breakdown factors that aim to calculate the total electrical current of the investigated pipeline section without providing the average electrical resistance criteria of the polymer coating [52,53,67,68]. The methodology of the Drainage Test or cathodic polarization can be found in the technical book [46] and in the standard [69] only.
The regulatory document [70] also allows for calculating the coating conductance G (reciprocal of resistance) based on the potential or current attenuation methods. Calculated conductance is a function of the soil resistivity. To define the coating quality of pipelines installed in different soil resistivities, the standard specifies how to calculate the “normalized specific conductance” to 1000 ohm·cm (or 10 ohm·m).
When all the technical requirements of the factory 3LPE coating are met, its electrical resistance is notably high. This resistance must have a minimum value of 108 ohm·m2, representing a “defect-free” coating [71].
The process of inappropriate pipeline excavation and installation in the open trench usually has the most significant negative impact on coating quality, as it can involve several destructive actions on the pipeline’s insulation [17,72], reducing its initial electrical resistance by one to three orders of magnitude [51].
  • The Drainage Test (Cathodic Polarization) Procedure
A Drainage Test can be conducted for different purposes, such as assessing the average electrical specific coating resistance or the consumed electrical current to protect an underground object from corrosion. Higher current consumption indicates more coating defects on the pipeline and/or larger defect areas, meaning lower coating quality. The results are relevant if the Off potential is equal to or higher than the valid protection potential. This method is not effective for the identification of coating defects.
The first step of the procedure includes applying a current to the pipeline. Then the On and Off potentials and electrical current are measured at regular time intervals, and the test is finished when the potentials are in a steady state (no further change in the negative direction) or after a defined time duration (about an hour). To determine the average electrical resistance of a polymer-coated buried pipeline segment, the difference between the On and Off potentials is divided by the applied current, and the ratio is multiplied by the surface area of the coated pipeline section [46].
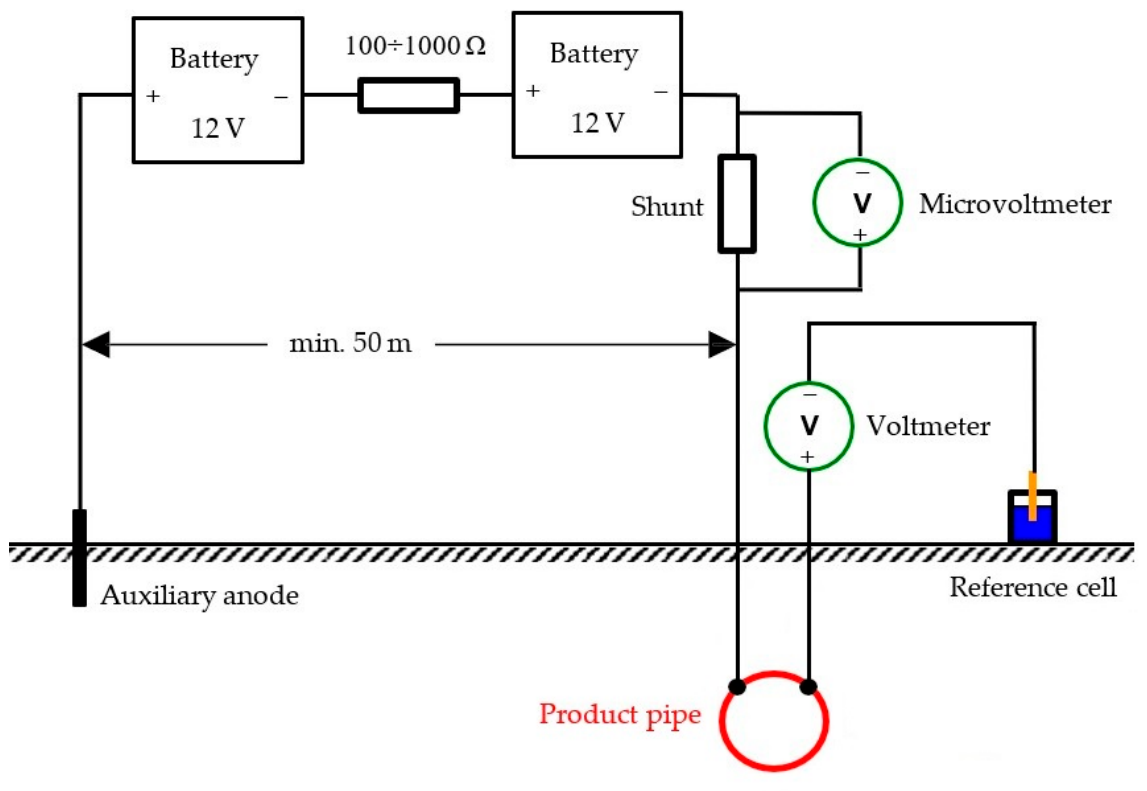
Figure 5 describes the Drainage Test’s setup in case the objective is to achieve a coating resistance of 108 Ω·m2 (excellent isolation properties). By means of two batteries of 12 V, a DC current is applied to the pipeline under investigation. The On potential of the pipeline will be at 24 V. The current should be measured with a microvoltmeter over a shunt.
Table 6 indicates the relation between the measuring range of the microvoltmeter, the resistance of the shunt, and the applied current. To ensure that reliable values are measured, the following conditions should be fulfilled.
  • The auxiliary anode must be installed at a distance of at least 50 m from the pipeline under investigation.
  • The spreading resistance of the anode must be low enough to achieve an On potential of 24 V at the pipeline (usually up to 5 Ω).
  • The Voltmeter for the potential measurement should have an internal resistance Ri ≥ 10 MΩ. Furthermore, the voltmeter must be disconnected when the current is measured.
It should be noted that an On potential of 24 V and an internal resistance Ri = 10 MΩ will result in a measuring current of 2.4 µA. Additionally, because a small stray current can misrepresent the measurements, batteries should be used instead of a rectifier with an AC power supply for applying current. Batteries ensure that the power supply is completely separated from the soil. Furthermore, the surveyed pipeline section must be electrically separated from the pipeline network. It requires connecting the pipe section to a temporary or permanent cathodic station. The current enters the pipeline through the soil (electrolyte) at the sites of the coating defects. More defects and/or their larger size increase current consumption, indicating lower coating quality.
The electrical current (I, [A]), On (φon [V]) and Off (φoff [V]) potentials are measured at regular time intervals, typically at 0, 3, 6, 9, 12, 15, 30, and 60 min.
The test ends when the Off potential stabilizes (no further negative change or complete pipeline polarization) or after a set time. For 3LPE coating, the normal test duration is one hour.
The main equipment used for the study was: 2 batteries of 12 V DC or Extech 382200 Constant Voltage/Current digital DC power supply with dual LCD (Extech Instruments, Nashua, NH, USA); Multimeters/Voltmeters: Fluke 287 (Fluke Corporation, Everett, WA, USA) and M. C. Miller Co. LC-4.5 (M. C. Miller Co., Inc., Sebastian, FL, USA); Reference Electrode (CSE): M. C. Miller Co. RE-5C M. C.; MicroMax GPS360 Current Interrupter (American Innovations, Austin, TX, USA).

6.3. Indirect Above-Ground Methods for Identifying Coating Defects

One of the objectives of the work was to examine various indirect inspection methods and to analyze and establish the relationship between the geometrical dimensions, the number of coating defects, and the correlation with Drainage Test results.
An extensive literature review was carried out to select the optimal methodology for detecting coating defects in underground pipelines [7,8,9,12,73,74,75,76]. ECDA methods enable the identification of defects in buried pipelines after coverage. According to the standard [9], ECDA involves four steps: Pre-Assessment, indirect Inspection, direct Inspection, and post-Assessment. ECDA involves various indirect above-ground techniques, like Direct Current Voltage Gradient (DCVG), Alternating Current Voltage Gradient (ACVG), AC Current Attenuation (ACCA), and Close Interval Potential Survey (CIPS). For this research work, after an extended literature survey and trials, the DCVG method has been selected as it was most effective for identifying pipe coating defects, including the small ones. Accordingly, the DCVG measures the voltage gradient using two Cu/CuSO4 reference electrodes placed in the soil above a cathodically protected investigated pipeline. The epicenter of fault location is identified, its GPS coordinates are recorded, and coating indication severity (%IR) is calculated using perpendicular stepped voltage gradient readings from the epicenter toward remote earth. Calculating %IR is based on measuring the potential difference between the indication epicenter and the remote earth (OL/RE) once an indication is located. The potential difference is expressed as a percentage of the total calculated potential shift on the pipeline at the indication location (P/RE), as per standard [7]:
% I R   C o a t i n g   I n d i c a t i o n   S e v e r i t y   =   O v e r   t h e   L i n e   t o   R e m o t e   E a r t h   m V C a l c u l a t e d   P i p e   t o   R e m o t e   E a r t h   a t   I n d i c a t i o n   [ m V ]     100 %
or:
% I R   C o a t i n g   I n d i c a t i o n   S e v e r i t y   =   O L / R E P / R E     100 %
where
  • OL/RE—potential difference from the indication epicenter to remote earth (mV).
  • P/RE—Pipe to remote earth signal magnitude (mV).
The main tools used for the study were: Analogue DCVG Survey Meter kit (DC Voltage Gradient Technology and Supply Ltd., Atherton, Manchester, UK); Extech 382200 Constant Voltage/Current digital DC power supply with dual LCD (Extech Instruments, Nashua, NH, USA); Multimeters/Voltmeters: Fluke 287 (Fluke Corporation, Everett, WA, USA) and M. C. Miller Co. LC-4.5; Reference Electrode (CSE): M. C. Miller Co. RE-5C (Miller Co., Inc., Sebastian, FL, USA); MicroMax GPS360 Current Interrupter (American Innovations, Austin, TX, USA).

7. Results

The ability to detect defects in underground pipelines depends on many factors: type, condition, and thickness of the coating; soil conductivity and conditions (specific electrical resistance, dry/wet); characteristics of backfilling materials around the pipe; cover depth of the pipeline; wall thickness; various pipeline characteristics (T-joints, reinforced concrete blocks, consumer connections, etc.); adjacent buried infrastructures with/without cathodic protection, AC power lines (161 kV or 400 kV), etc.
The DCVG method effectively detects both small and large defects. Additional considerations have been evaluated, including various organizational and economic factors such as work ergonomics, productivity, initial equipment costs, inspection costs, qualified personnel, the number of contractors required, and the method’s usage in other infrastructure companies.
After selection of two complementary methods: Drainage Test and DCVG, the quality analysis was carried out on 60 new water and oil/gas pipeline projects, covering 260 km with diameters ranging from 6 inches to 100 inches. In most pipelines, both DT and DCVG were performed. In some cases, only DT was made, or only DCVG without DT was carried out.
The main technical characteristics of coatings:
  • The steel grade for pipes is X42, with a typical length of 12.2 m and varying wall thicknesses
  • The factory-applied external coating: 3-layer extruded HDPE (3LPE) with varying coating thicknesses according to the standard [24]:
    For oil/gas pipelines—the top layer was stabilized (antioxidant-containing) HDPE;
    For water pipelines—the top layer was unstabilized (antioxidant-free) HDPE;
  • Field joint coatings at the weld joints: for oil/gas pipelines—2-layer polymer tapes (applied cold polymeric tape field joint coatings—Class 12 according to the standard [26]); for water pipelines—2-layer heat shrinkable sleeves (HSS—Class 14A according to the standard [26]).
Table 7 summarizes the data obtained from the DCVG indirect method (number and severity of defects), and the coating average specific electrical resistance with average consumed electrical current results from the DT method, conducted on water (N1-N50) and oil/gas pipelines (G51-G60).
These pipeline defects can lead to further corrosion, especially in corrosive soils [14,37], resulting in relatively rapid failures and a shorter lifespan of the pipeline. It is important to note that not all water pipes are protected by CP after installation and backfilling; thus, those pipelines are more susceptible to corrosion.

The Last Stage: Direct Examination

Direct examination, according to the 3rd stage of ECDA methodology [9], involves analyzing the data from the previous (2nd) stage to select the excavation sites and to inspect and assess the extent of the coating damage, including the measurements of defects’ geometrical dimensions. The data obtained from direct examination, in combination with the previous data, make it possible to identify and assess the impact of external corrosion factors on the pipeline.
The defects and their severity (%IR) that were found during the DCVG indirect method (2nd ECDA stage) were examined after excavation to understand the reasons for their creation. After the examination, the defects have been repaired (3rd ECDA stage).
The analysis of the defects led to the introduction of a new empirical parameter—specific coating defects ratio (AE), of measured defect area (in mm2) per total pipe area (in m2), which was found to fully correlate with the DT and DCVG results.

8. Discussion

After processing and analyzing the data, the summary is presented in Table 8.
The study establishes a highly efficient, precise, two-stage approach for localizing coating defects and potential corrosion areas before excavation:
Stage 1: Integral Assessment (The Drainage Test/Cathodic Polarization Method). The method evaluates the overall condition of a polymer-coated long pipeline sections to define the comprehensive coating system quality criteria based on average electrical resistance and to determine if it meets these quality criteria or exhibits unacceptable current leakage.
Stage 2: Identification of coating defects (DCVG—Direct Current Voltage Gradient). Once Stage 1 identifies a problematic coating (factory-applied and field joint) with defects, behind the criteria established at the first stage, DCVG is deployed as the primary micro-localization tool to pinpoint the exact coordinates of discrete defects.
Based on the Drainage Test results of the current case study, the integral quality assessment of the 3LPE coating of the newly installed and backfilled steel pipelines has been analyzed. Consequently, it is recommended to classify the polymer coating’s average specific electrical resistance and consumed electrical current as “Excellent” if the value of the electrical resistance is 3 × 10⁶ Ω·m2 or above, and the maximum electrical current consumption is 2 mA or below. The quality of the coating is “Good” if the overall polymer coating electrical resistance falls within the range of 3 × 10⁵ Ω·m2 to 3 × 10⁶ Ω·m2, with a corresponding range of consumed electrical current between 2 and 22 mA. The quality level is “Satisfactory” if the electrical resistance is within the range of 3 × 10⁴ Ω·m2 to 3 × 10⁵ Ω·m2 with a related range of consumed electrical current between 22 and 151 mA, while the “Unsatisfactory” quality level stands for the electrical resistance value below 3 × 10⁴ Ω·m2 or the minimum electrical current consumption of 151 mA.
For oil/gas pipeline coating systems, a more stringent performance criterion should be adopted, such as a minimum specific electrical resistance on the order of 1 × 10⁷ Ω·m2.
It should be emphasized that the criteria for the initial average coating electrical resistance specified in this study differ from the criteria adopted by the international regulation: 3 × 10⁵ Ω·m2 and 104 Ω·m2 for excellent quality assessment, respectively [69,70]. This difference may be related to the diverse types and characteristics of external coatings. The regulatory document [70], which has relatively low criteria for the average electrical resistance, was written almost 25 years ago and most likely focuses on FBE coatings, which have an initially lower electrical resistance compared to the 3-layer HDPE coating.
In this study, it was found that the DCVG technique is a reliable and effective indirect method for detecting and assessing damage, quality, and its significance (severity). Thus, DCVG should be combined with DT inspection as an optimal indirect method. Upon completing the DCVG test, a direct examination should be carried out through excavation at the identified fault locations, where the defects are subsequently documented and repaired. The reinspection should be carried out after the repair of selected defects.
The typical examples of various defects and their severity identified by the DCVG indirect ECDA method are provided in Appendix A.
The sensitivity to the degree of polymer coating degradation of the localization techniques varies significantly depending on the type of degradation. Our approach explicitly differentiates how the DCVG methodology responds to the following distinct types of anomalies:
a.
Coating Thickness Decrease (Uniform Wear/Thinning)
  • Sensitivity: Our method is not sensitive to the decrease in the coating thickness.
  • Mechanism: Direct Current Voltage Gradient (DCVG) and Drainage Tests rely entirely on the flow of electric current through a holiday (defect/hole) from the soil to the steel surface. As long as the 3LPE polymer coating remains continuous, even if its thickness is significantly reduced due to mechanical scraping or soil stress, the electrical resistance remains extremely high.
  • Implication: Thinning without a physical puncture will not trigger a voltage gradient or an increase in current demand. Therefore, these methods cannot map gradual thickness degradation.
b.
Size of Cracks and Holidays (Through-Thickness Defects)
  • Sensitivity: Extremely High. The experienced DCVG operator detects very small polymer coating flaws (holidays) exposing up to 1 cm2 of the steel substrate at a trench depth of 2 m, under high resistivity backfill soil conditions (>100 Ω·m). In highly resistant soil conditions (>100 Ω·m), it is recommended to wet the contact areas around the reference electrodes for optimizing electrolytic coupling, thereby enhancing the sensitivity required to detect structural anomalies and flaws within the dielectric polymer insulation during DCVG surveys.
  • Mechanism: When a crack or puncture penetrates the full thickness of the polymer coating to achieve the bare steel, an electrical path is established. The sensitivity of the DCVG method is quantified by calculating the defect severity (%IR).
c.
Precision of Localized Corrosion Areas for Excavation
The main objective of combining the Drainage Test and DCVG is to minimize unnecessary civil engineering costs by avoiding erroneous excavations.
    • Spatial Precision: The methodology demonstrates a high pinpoint precision up to ±0.5 m along the pipeline axis.
    • Epicenter Determination: By utilizing the DCVG reference electrodes in a “null” balance or peak-signal configuration directly over the centerline of the pipe, operators can identify the exact epicenter (zero-point) where the current vectors converge.
    • Directional Resolution: The method not only finds the longitudinal location but can often indicate whether the defect is on the top, side, or bottom of the pipe based on the symmetry of the voltage gradient fields mapped on the ground surface.
In this study, the DCVG test results identified 220 defects of different coating severities (%IR). This indicates an average of 1.45 defects per kilometer of length (without considering the coating severity). The 220 defects are distributed by %IR as follows:
    • 207 defects (94%) are identified with a relative size %IR ≤ 15 and considered as nonsignificant defects. They are distributed as follows: very small (0 < %IR ≤ 1)—127 defects (58%), small (1 < %IR ≤3)—58 faults (26%), moderate (3 < %IR ≤ 15)—22 defects (10%).
    • Other 13 defects (6%) with relative sizes of %IR > 15 are considered as significant faults and are distributed as follows: medium (15 < %IR ≤ 35)—7, significant (35 < %IR ≤ 60)—3, critical (%IR > 60)—3.
    • The above distribution of defects across different relative sizes varies from the definitions found in the two versions of the standard [9] from 2002 and from 2008. These versions of the standard are more applicable to previous coating generations with an equal distribution of defects, such as coal tar, bitumen, cold tapes, and even FBE. In the latest version of the standard (2010), the categories of fault distributions have been abolished.
    • The different benchmark classification of %IR distribution has been proposed in this study for 3LPE coating with unequal distribution of defects: small (0 < %IR ≤ 1); moderate (1 < %IR ≤ 3) and significant (%IR > 3).
A significant part of the defects is concentrated in the field joint coatings (welding joints wrapped by 2-layer heat shrinkable sleeves) and T-connections protected by liquid protective coatings, like 2-part epoxy (47%, or 104 defects).
The low values of coating electrical resistance, particularly in water pipelines, result from imperfect quality control/field inspection methods and pipeline installation procedures. The most effective corrosion control method for corrosion prevention is cathodic protection.
In analogy with Figure 2, electrical current criteria for the Drainage Test versus limiting current have been graphically represented for the values as specified in Figure 6. Table 9 summarizes the calculated values for some major points as well as the points where the lines intersect.
Figure 6 shows that coating defects in soil resistivity of less than 119 Ω·m for water and oil/gas pipelines consume current more than 2 mA, which is equal to the average specific coating resistance of 3 × 10⁶ Ω·m2. As a result, coating defects in such soil resistivities will result in failing the Drainage Test.
For each pipeline type, the comparison has been conducted between the received polarization current (I) from the Drainage Test and the calculated limit current (I*) according to Table 4 and Equation (15). It has been found that not all coating defects are protected, based on various parameters, including ON and Off Potentials, electrical current, and soil resistivity.

9. Conclusions

The present work introduces several methodological and conceptual novelties that address well-recognized gaps in the current literature and various standards for polymer-coated buried pipelines:
  • First systematic quality assurance (QA) framework for post-installation/backfilling coating assessment
Existing standards and literature primarily address factory coating quality or in-service corrosion assessment, but do not provide robust criteria for evaluating coating integrity immediately after installation and backfilling. This study establishes a comprehensive, field-validated QA methodology specifically targeting this critical but insufficiently addressed stage.
  • Introduction of quantitative criteria for average specific coating electrical resistance
Current standards [23,24,52,53,69,70] refer to coating conductance or breakdown factors but lack explicit, validated threshold criteria for coating resistivity in newly installed pipelines. The study defines multi-level performance thresholds (Excellent–Unsatisfactory) based on extensive field data (60 projects, 260 km), thereby converting a previously qualitative assessment into a quantitative, engineering-applicable metric.
  • Proposal for a new physically meaningful parameter: specific coating defect ratio (AE)
A novel parameter, defect-area-to-coating-area ratio (AE), was introduced. Importantly, AE is shown to correlate directly with electrical resistance and CP current demand, providing a bridge between geometrical defect characterization and electrochemical performance, which is not addressed in prior ECDA-based approaches.
  • Integration of complementary NDT methods into a unified QA protocol
While Drainage Test and DCVG exist independently, this work establishes their combined and complementary use as a standardized diagnostic sequence. The framework defines when each method should be applied, improving inspection efficiency and reliability, an aspect not formalized in existing methodologies.
  • Re-definition of defect severity classification for modern 3LPE coatings
Existing standards [7,8,9] (e.g., ECDA) were developed mostly for earlier coating systems (bitumen, tapes, FBE) and assume uniform defect distributions, which are not representative of 3LPE systems. This study proposes a revised %IR-based defect classification tailored to 3LPE coatings, accounting for their non-uniform defect distribution and field-joint dominance.
The new criteria for defect severity ranges have been established in the study:
  • Small defects (%IR < 1%). Typically correspond to small punctures, scratches, or narrow cracks. The methodology classifies these as low priority, often requiring only continuous monitoring rather than immediate excavation, as the cathodic protection (CP) system can easily mitigate corrosion at these discontinuities.
  • Medium (1 ≤ %IR < 3%) and large defects (%IR ≥ 3). Correspond to moderate and severe mechanical damage, wide cracks, or large chunks of missing coating. These create moderate and large voltage gradients in the soil, making them highly visible to the DCVG operator.
  • Establishment of stricter, application-specific performance criteria for HDPE-based coatings
The work demonstrates that legacy threshold values (e.g., 104 or 3 × 10⁵ Ω·m2) are inadequate for modern multilayer HDPE systems. It introduces higher, polymer-specific acceptance criteria (e.g., ≥3 × 10⁶–107 Ω·m2), reflecting the intrinsically high dielectric performance of polyolefin coatings and highlighting the need for revision of current standards [69,70].
  • Direct linkage between coating defects, dielectric degradation, and CP current demand
The study provides a quantitative framework linking defect population, electrical resistance, and cathodic protection current, enabling predictive assessment of coating performance rather than post-failure diagnostics.
Further quality and condition assessments have been conducted using the Drainage Test and Line Current Attenuation method, and other alternative techniques to determine the aging rates of the external 3LPE coating’s electrical resistance on transmission water and oil/gas pipelines during their service life [77].

Author Contributions

Conceptualization, G.R.N.; methodology, G.R.N.; validation, G.R.N.; formal analysis, G.R.N.; investigation, G.R.N.; writing—original draft preparation, G.R.N.; writing—review and editing, all authors; visualization, G.R.N.; supervision, S.K. and K.K.; project administration, G.R.N.; funding acquisition, G.R.N. All authors have read and agreed to the published version of the manuscript.

Funding

This research received no external funding.

Data Availability Statement

The original contributions presented in this study are included in the article. Further inquiries can be directed to the corresponding author.

Acknowledgments

This study was carried out at the water transmission pipeline network of Mekorot—Israeli National Water Co. and at networks of other oil/gas infrastructure companies, like INGL.

Conflicts of Interest

The author G.R. Neizvestny was employed by Mekorot—Israeli National Water Co. The remaining authors declare that the research was conducted in the absence of any commercial or financial relationships that could be construed as potential conflicts of interest.

Appendix A. The Typical Examples of Various Defects and Their Severity Identified by DCVG Indirect ECDA Method
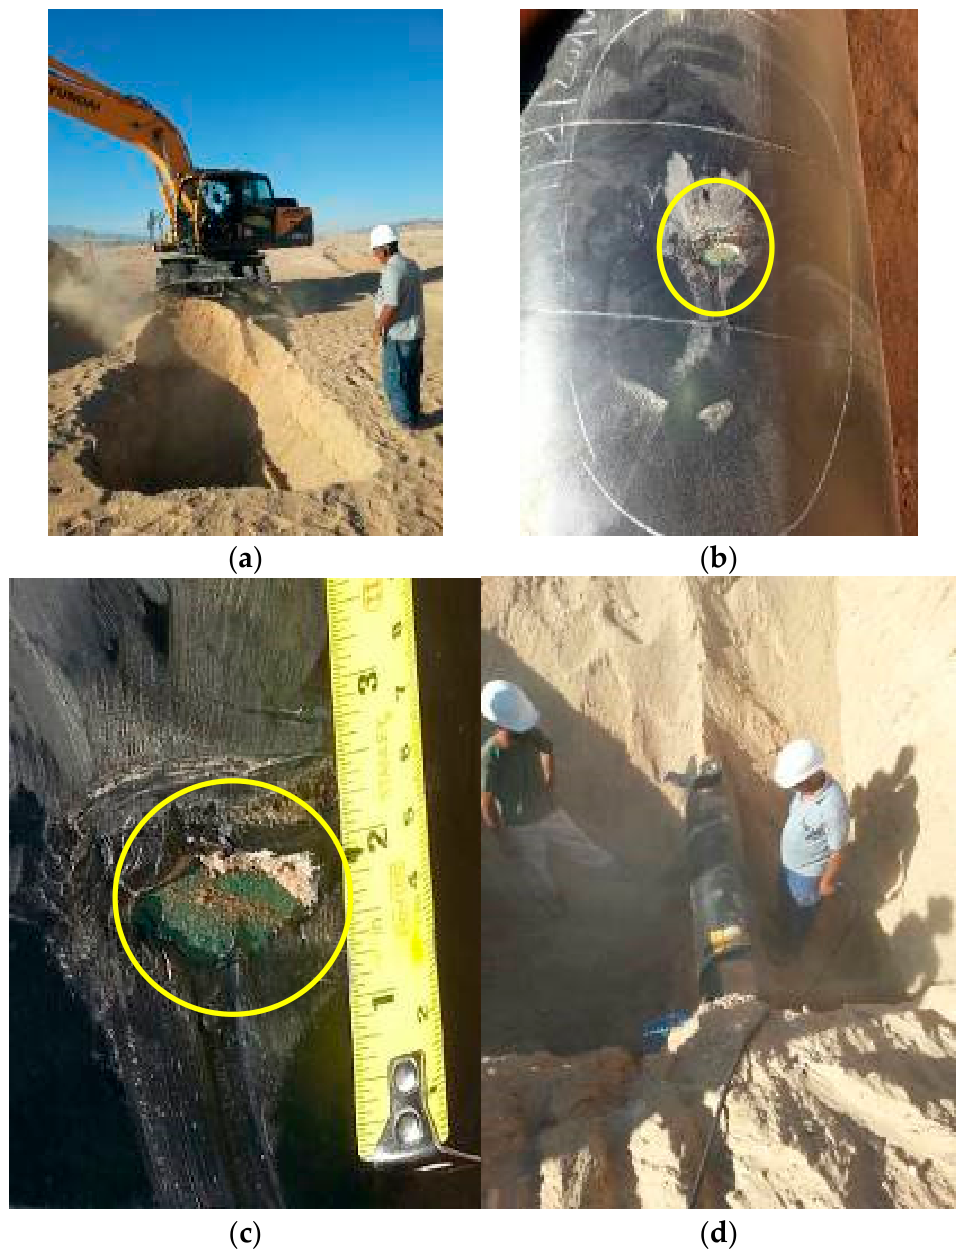
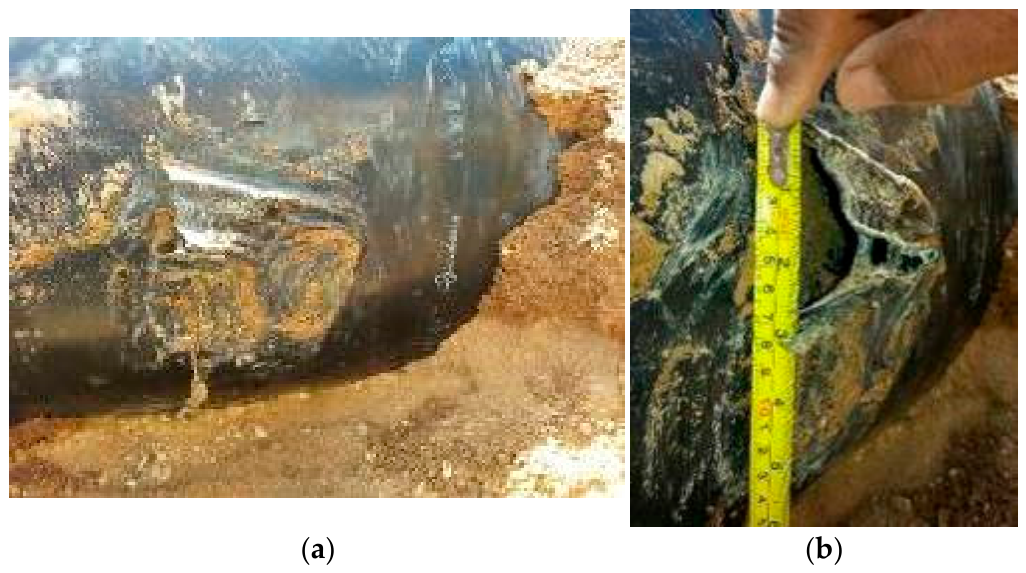
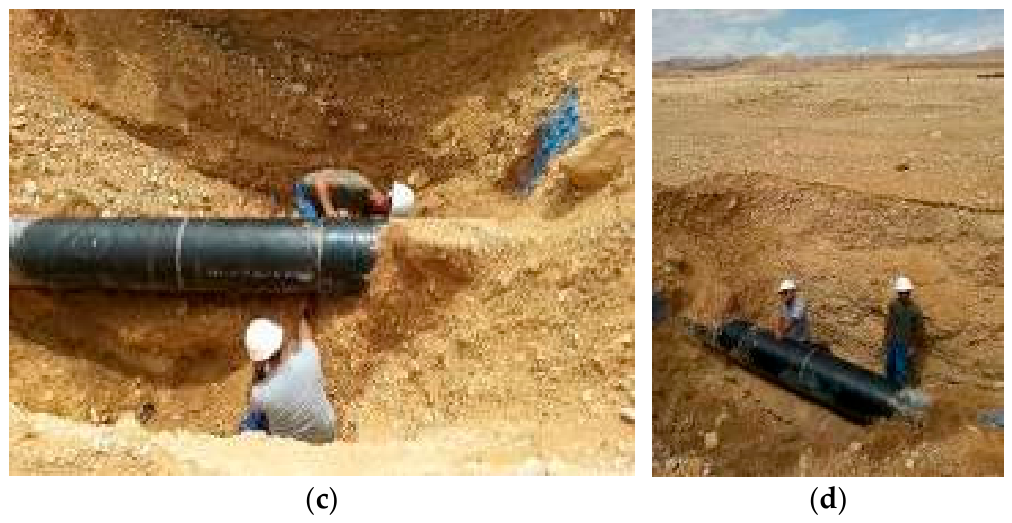
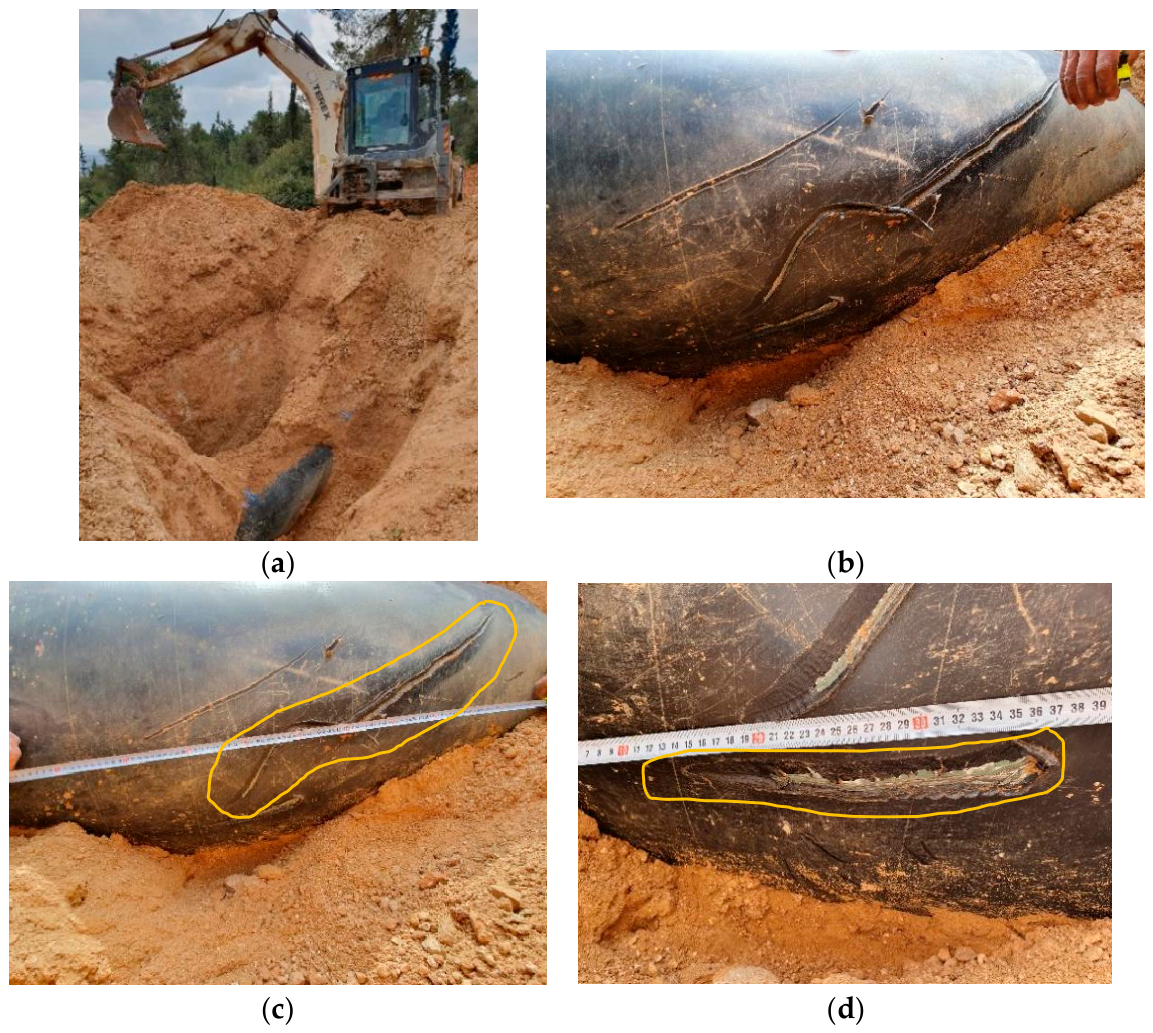
The typical examples of defects and their severity (%IR) that were identified by the DCVG indirect technique (2nd ECDA stage), examined after excavation and repair (3rd ECDA stage), are shown in Figure A1, Figure A2 and Figure A3.
Figure A1. The defect in the 16″ water pipeline (N1) with %IR = 1.2. (a) After performing the DCVG survey, the defect’s epicenter was found very accurately. The ECDA 3rd stage focuses on direct examination by excavating the defect. (b) The exposed defect after excavation. (c) Measurements of the defect dimensions (4.71 cm2) which correspond to %IR = 1.2. (d) The defect after repair.
Cmd 07 00035 g0a1
Figure A2. The defect in the 20″ water pipeline (N2) in a welding joint wrapped by a 2-layer HDPE hot shrinkable sleeve (HSS) with %IR = 1.33. (a) After the direct examination, damage was found in a HSS. (b) Measurements of the defect dimensions (8.25 cm2) which correspond to IR = 1.33%. (c) Repair of the defect. (d) The defect after repair.
Cmd 07 00035 g0a2aCmd 07 00035 g0a2b
Figure A3. The defects (3 scratches) in the 32″ water pipeline (N46) found in a factory-applied 3LPE coating with %IR = 12.6. (a) The excavation of one of the defects found in the DCVG survey. (b) The few scratches with distinctive characteristics (length, width, form, cross-section) found after the excavation that were caused by careless installation. (c) Dimension measurements of the longest and the most severe scratch (27.3 cm2) which correspond to IR = 1.33%. (d) Dimension measurements of the second scratch (7.9 cm2). The total defect area is 42.4 cm2 which corresponds to %IR = 12.6.
Cmd 07 00035 g0a3

References

  1. Corrosion Cost and Preventive Strategies in the United States; Publication/Report Number: FHWA-RD-01-156, R315-01; Federal Highway Administration: Washington, DC, USA, 2001. Available online: https://rosap.ntl.bts.gov/view/dot/40697/dot_40697_DS1.pdf (accessed on 16 March 2026).
  2. Roberge, P.R. Corrosion Engineering: Principles and Practice, 1st ed.; McGraw-Hill Education: New York, NY, USA, 2008. [Google Scholar]
  3. API RP572-2016; Inspection Practices for Pressure Vessels, 4th Edition. The American Petroleum Institute (API): Washington, DC, USA, 2016.
  4. Liu, Z.; Kleiner, Y.; Rajani, B. Condition Assessment Technologies for Water Transmission and Distribution Systems; EPA600R-12017; U.S. Environmental Protection Agency: Washington, DC, USA, 2012.
  5. Rajani, B.; Kleiner, Y.; Rajani, B.; Kleiner, Y. Selecting Cost-Effective Condition Assessment Technologies for High-Consequence Water Mains; Project #4553; Water Research Foundation: Denver, CO, USA; AWWA: Denver, CO, USA, 2017. [Google Scholar]
  6. NACE SP0102-2017; In-Line Inspection of Pipelines. NACE International: Houston, TX, USA, 2017. [CrossRef] [Scilit]
  7. NACE TM0109-09; Aboveground Survey Techniques for the Evaluation of Underground Coating Condition. NACE International: Houston, TX, USA, 2009.
  8. NACE SP0207-2007; Performing Close-Interval Potential Surveys and DC Surface Potential Gradient Surveys on Buried or Submerged Metallic Pipelines. NACE International: Houston, TX, USA, 2007.
  9. ANSI/NACE SP0502-2010; Pipeline External Corrosion Direct Assessment Methodology. NACE International: Houston, TX, USA; AMPP: Houston, TX, USA, 2010. [CrossRef] [Scilit]
  10. Fontana, M.G. Corrosion Engineering, 3rd ed.; McGraw-Hill Book Co.: Singapore, 1987. [Google Scholar]
  11. Groysman, A. Corrosion for Everybody; Springer: Dordrecht, The Netherlands, 2010. [Google Scholar] [CrossRef] [Scilit]
  12. Parker, M.E.; Peattie, E.G. Pipe Line Corrosion and Cathodic Protection: A Practical Manual for Corrosion Engineers, Technicians, and Field Personnel, 3rd ed.; Gulf Publishing Co.: Houston, TX, USA, 1984. [Google Scholar]
  13. Schweitzer, P.A. Corrosion of Linings and Coatings: Cathodic and Inhibitor Protection and Corrosion Monitoring, 2nd ed.; CRC Press, Taylor & Francis Group: Boca Raton, FL, USA, 2007. [Google Scholar] [CrossRef] [Scilit]
  14. Best Management Practice: Mitigation of External Corrosion on Buried Pipeline Systems; The Canadian Association of Petroleum Producers (CAPP): Calgary, AB, Canada, 2026.
  15. Romanoff, M. Underground Corrosion; U.S. Department of Commerse: Washington, DC, USA; National Bureau of Standards: Washington, DC, USA, 1957. [CrossRef] [Scilit]
  16. Schwerdtfeger, W.J. Soil resistivity as related to underground corrosion and cathodic protection. J. Res. Natl. Bur. Stand. Sect. C Eng. Instrum. 1965, 69C, 71. [Google Scholar] [CrossRef] [Scilit]
  17. Baker, M. Pipeline Corrosion, Final Report; U.S. Department of Transportation Pipeline and Hazardous Materials Safety Administration Office of Pipeline Safety: Washington, DC, USA, 2008.
  18. NACE SP0169-2013; Control of External Corrosion on Underground or Submerged Metallic Piping Systems. NACE International: Houston, TX, USA, 2013. [CrossRef] [Scilit]
  19. Thompson, I.; Saithala, J.R. Review of pipeline coating systems from an operator’s perspective. Corros. Eng. Sci. Technol. 2016, 51, 118–135. [Google Scholar] [CrossRef] [Scilit]
  20. Papavinasam, S.; Attard, M.; Revie, R.W. Evolution of External Pipeline Coatings for Corrosion Protection—A Review. Corros. Rev. 2008, 26, 373–438. [Google Scholar] [CrossRef] [Scilit]
  21. Anonyuo, S.; Kwakye, J.M.; Ozowe, W. Corrosion management and materials compatibility in energy infrastructure: A strategic review of pipeline integrity solutions. Eng. Sci. Technol. J. 2024, 5, 3209–3220. [Google Scholar] [CrossRef] [Scilit]
  22. Romano, M. The Ins and Outs of Pipeline Coatings Used to Protect Oil and Gas Pipelines. J. Prot. Coat. Linings 2005, 22, 40–47. [Google Scholar]
  23. ISO 21809-1:2018; Petroleum and Natural Gas Industries—External Coatings for Buried or Submerged Pipelines Used in Pipeline Transportation Systems Part 1: Polyolefin Coatings (3-Layer PE and 3-Layer PP). ISO: Geneva, Switzerland, 2018.
  24. DIN 30670-2012; Polyethylene Coatings on Steel Pipes and Fittings Requirements and Testing. DIN Deutsches Institut für Normung: Berlin, Germany, 2012.
  25. ANSI/AWWA C215-10; Extruded Polyolefin Coatings for the Exterior of Steel Water Pipelines. American Water Works Association: Denver, CO, USA, 2010. [CrossRef] [Scilit]
  26. ISO 21809-3:2016; Petroleum and Natural Gas Industries—External Coatings for Buried or Submerged Pipelines Used in Pipeline Transportation Systems Part 3: Field Joint Coatings. ISO: Geneva, Switzerland, 2016.
  27. SI 30670-2021; Polyethylene Coatings on Steel Pipes and Fittings—Requirements and Testing (Updates in Hebrew). SII: Tel Aviv, Israel, 2021.
  28. DIN 30672-2000; Tape and Shrinkable Materials for the Corrosion Protection of Buried or Underwater Pipelines Without Cathodic Protection for Use at Operating Temperatures Up to 50 °C. DIN Deutsches Institut für Normung and DVGW Deutscher Verein des Gas-und Wasserfaches e.V. German Associaton of Gas and Water Engineers: Berlin, Germany, 2000.
  29. BS EN 12068:1999; Cathodic Protection. External Organic Coatings for the Corrosion Protection of Buried or Immersed Steel Pipelines Used in Conjunction with Cathodic Protection. Tapes and Shrinkable Materials: London, UK; British Standards Institution: London, UK, 1999.
  30. van Assema, I. Preventing Coating Damage in the Supply Chain of Pipelines. In Proceedings of the 18th International Conference of Pipeline Protection; BHR Group: Antwerp, Belgium, 2009. [Google Scholar]
  31. Argent, C.; Norman, D. Three Layer Polyolefin Coatings: Fulfilling Their Potential? In Proceedings of the NACE 61st Annual Conference and Exposition, San Diego, CA, USA, 12–16 March 2006. [Google Scholar] [CrossRef] [Scilit]
  32. Chang, B.T.A.; Sue, H.-J.; Jiang, H.; Browning, B.; Wong, D.; Pham, H.; Guo, S.; Kehr, A.; Mallozzi, M.; Snider, W.; et al. Integrity of 3LPE Pipeline Coatings: Residual Stresses and Adhesion Degradation. In Proceedings of the 2008 7th International Pipeline Conference, Calgary, AB, Canada, 29 September–3 October 2008; ASMEDC: Singapore, 2008; Volume 2, pp. 75–86. [Google Scholar] [CrossRef] [Scilit]
  33. Guermazi, N.; Elleuch, K.; Ayedi, H.F.; Kapsa, P. Aging effect on thermal, mechanical and tribological behaviour of polymeric coatings used for pipeline application. J. Mater. Process. Technol. 2008, 203, 404–410. [Google Scholar] [CrossRef] [Scilit]
  34. Melot, D.; Paugam, G.; Roche, M. Disbondments of Pipeline Coatings and their effects on corrosion risks. In Proceedings of the 17th International Conference on Pipeline Protection, Edinburgh, UK, 17–19 October 2007; BHR Group Edinb.: Bedfordshire, UK, 2009. [Google Scholar]
  35. Ranade, S.; Tan, M.Y.; Forsyth, M. The Effects of Mechanical Stress, Environment and Cathodic Protection on the Degradation and Failure of Coatings: An Overview. In Proceedings of the Corrosion and Prevention 2014, Darwin, Australia, 21–24 September 2014. Paper 50. [Google Scholar]
  36. Roche, M.; Melot, D.; Paugam, G. Recent Experience with Pipeline Coating Failures. In Proceedings of the 16th International Conference on Pipeline Protection, Paphos, Cyprus, 2–4 November 2005; BHR Group: Bedfordshire, UK, 2005. [Google Scholar]
  37. Romer, A.E.; Bell, G.E.C. Causes of External Corrosion on Buried Water Mains. In Pipelines 2001; American Society of Civil Engineers: San Diego, CA, USA, 2001; pp. 1–9. [Google Scholar] [CrossRef] [Scilit]
  38. 49 CFR Part 192, PART 192—TRANSPORTATION OF NATURAL AND OTHER GAS BY PIPELINE: MINIMUM FEDERAL SAFETY STANDARDS (up to Date as of 7-10-2025), PHMSA. Available online: https://www.ecfr.gov/current/title-49/part-192 (accessed on 16 March 2026).
  39. Fletcher, A.; Nicholas, D. Fusion Bonded Polyethylene Coatings—40 Years On. In Proceedings of the Australasian Corrosion Association (ACA) Annual Conference, Darwin, Australia, 21–24 September 2014. Paper 094. [Google Scholar]
  40. NACE RP0394-2002; Standard Recommended Practice, Application, Performance, and Quality Control of Plant-Applied, Fusion-Bonded Epoxy External Pipe Coating. AMPP: Houston, TX, USA, 2002. [CrossRef] [Scilit]
  41. ISO 21809-2: 2014; Petroleum and Natural Gas Industries—External Coatings for Buried or Submerged Pipelines Used in Pipeline Transportation Systems-Part 2: Single Layer Fusion-Bonded Epoxy Coatings, Second Edition. ISO: Geneva, Switzerland, 2014.
  42. AWWA C213-22; Fusion-Bonded Epoxy Coatings and Linings for Steel Water Pipe and Fittings. AWWA: Denver, CO, USA, 2022.
  43. Kuang, D.; Cheng, Y.F. Study of cathodic protection shielding under coating disbondment on pipelines. Corros. Sci. 2015, 99, 249–257. [Google Scholar] [CrossRef] [Scilit]
  44. Büchler, M. Effectiveness of cathodic protection under disbonded coatings: On the implications of shielding conditions on the integrity of pipelines. In Proceedings of the Pipeline Technology Conference 2019, Berlin, Germany, 18–21 March 2019. [Google Scholar]
  45. Meroufel, A.; Gordon, A.; Thierry, D. Cathodic protection shielding of coated buried pipeline. J. Coat. Technol. Res. 2024, 21, 445–459. [Google Scholar] [CrossRef] [Scilit]
  46. von Baeckmann, W.; Schwenk, W.; Prinz, W. (Eds.) Handbook of Cathodic Corrosion Protection: Theory and Practice of Electrochemical Protection Processes, 3rd ed.; Gulf Publishing Company: Houston, TX, USA, 1997. [Google Scholar]
  47. Webb, N.C. Coating Conductance—Friend or FOE—Be careful what you specify. In Proceedings of the CEOCOR Congress; Institute of Corrosion: Copenhagen, Denmark; CEOCOR: Brussels, Belgium, 2019. [Google Scholar]
  48. Bette, U.; Vesper, W. Taschenbuch für den Kathodischen Korrosionsschutz; Vulkan-Verlag GmbH: Essen, Germany, 2005; 367p. [Google Scholar]
  49. CEOCOR. Guidelines for Measurement Techniques in Cathodic Protection, 2nd ed.; Study Committee for Corrosion and Cathodic Protection of Pipelines: Luxembourg, 2001; Available online: www.ceocor.lu (accessed on 16 March 2026).
  50. Eliaz, N.; Gileadi, E. Physical Electrochemistry: Fundamentals, Techniques and Applications; Wiley-VCH: Weinheim, Germany, 2018. [Google Scholar]
  51. Peabody, A.W. Peabody’s Control of Pipeline Corrosion, 3rd ed.; NACE International, The Worldwide Corrosion Authority: Houston, TX, USA, 2018. [Google Scholar] [CrossRef] [Scilit]
  52. EN 12954-2019; General Principles of Cathodic Protection of Buried or Immersed Onshore Metallic Structures. European Committee for Standartization: Brussels, Belgium, 2019.
  53. ISO 15589-1-2015; Petroleum, Petrochemical and Natural Gas Industries—Cathodic Protection of Pipeline Systems Part 1: On-Land Pipelines. ISO: Geneva, Switzerland, 2015.
  54. Angst, U.; Büchler, M.; Martin, B.; Schöneich, H.-G.; Haynes, G.; Leeds, S.; Kajiyama, F. Cathodic protection of soil buried steel pipelines—A critical discussion of protection criteria and threshold values: Protection criteria for cathodic protection of steel pipelines. Mater. Corros. 2016, 67, 1135–1142. [Google Scholar] [CrossRef] [Scilit]
  55. Freiman, L.I.; Kuznetsova, E.G. Model Investigation of the Peculiarities of the Corrosion and Cathodic Protection of Steel in the Insulation Defects on Underground Steel Pipelines. Prot. Met. 2001, 37, 484–490. [Google Scholar] [CrossRef] [Scilit]
  56. Angst, U.M. A Critical Review of the Science and Engineering of Cathodic Protection of Steel in Soil and Concrete. Corrosion 2019, 75, 1420–1433. [Google Scholar] [CrossRef] [Scilit] [PubMed]
  57. Refait, P.; Jeannin, M.; Fleury, E.; Raffin, F.; Fontaine, S. Cathodic Protection of Carbon Steel in Soil: A Study of Induced Passivation. Corros. Mater. Degrad. 2024, 5, 387–405. [Google Scholar] [CrossRef] [Scilit]
  58. Martinelli-Orlando, F.; Mundra, S.; Angst, U.M. Cathodic protection mechanism of iron and steel in porous media. Commun. Mater. 2024, 5, 15. [Google Scholar] [CrossRef] [Scilit]
  59. Martinelli-Orlando, F.; Shi, W.; Angst, U. Investigation of pH and Oxygen Variations on Steel Electrode Under Cathodic Protection; ETH Zürich: Zürich, Switzerland, 2019; 16p. [Google Scholar] [CrossRef]
  60. Joos, D.; Büchler, M. An Objective Discussion of Cathodic Protection Criteria Based on Literature Data, Eine Objektive Diskussion der Schutzkriterien für den Kathodischen Korrosionsschutz Basierend auf Literaturdaten; Technoparkstr. 1, CH-8005; SGK Swiss Society for Corrosion Protection: Zürich, Luxembourg, 2017. [Google Scholar]
  61. Büchler, M. Corrosion Protection Through Cathodic Polarization: A Discussion of the Relevant Effects and Comparison with Literature; CEOCOR: Brussels, Belgium, 2018. [Google Scholar]
  62. Cimock, D. Cathodic Protection Effectiveness: A Review of Protection Criteria, Threshold Values, and Evaluation of Alternative Methods; 2017 Tech. Rep.; EPRI: Palo Alto, CA, USA, 2017. [Google Scholar]
  63. AfK-Empfehlung Nr. 10-2000; Verfahren zum Nachweis der Wirksamkeit des des kathodischen Korrosionsschutzes an erdverlegten Rohrleitungen. DVGW: Bonn, Germany, 2000.
  64. API RP574-2016; Inspection Practices for Piping System Components, 4th Edition. The American Petroleum Institute (API): Washington, DC, USA, 2016.
  65. NACE SP0274-2011; High-Voltage Electrical Inspection of Pipeline Coatings. NACE International: Houston, TX, USA, 2011.
  66. NACE SP0188-2024; Discontinuity (Holiday) Testing of New Protective Coatings on Conductive Substrates. AMPP: Houston, TX, USA, 2024. [CrossRef] [Scilit]
  67. DNV RP B401-2021; Cathodic Protection Design. DNV AS: Oslo, Norway, 2021.
  68. DNVGL-RP-F103-2016; Cathodic Protection of Submarine Pipelines. DNV GL AS: Oslo, Norway, 2016.
  69. GOST R 51164-1998; General Requirements for Protection Against Corrosion. Gosstandart of Russia: Moscow, Russia, 1998.
  70. AMPP (NACE) TM0102-23; Measurement of Protective Coating Electrical Conductance on Underground Pipelines. AMPP: Houston, TX, USA, 2023. [CrossRef] [Scilit]
  71. Rehberg, T.; Schad, M. Corrosion Protective Coating Technology for Transit Pipelines in Europe. Corrosion Protection, 3R International Conference, Special Edition, 2010. Available online: https://www.denso-group.com/fileadmin/d3_documents/DENSOLEN_R_-AS30-R20_MP_..._Technical_article_PR00142393.pdf (accessed on 16 March 2026).
  72. Baker, M. Mechanical Damage—Final Report; Under Delivery Order DTRS56-02-D-70036; U.S. Department of Transportation, Pipeline and Hazardous Materials Safety Administration Office of Pipeline Safety: Washington, DC, USA, 2009.
  73. Ukiwe, C.; McDonnell, S. Optimization of the Coating Anomaly Detection and Prioritization Methodology Using Voltage Gradient Surveys. In Proceedings of the NACE International Annual Conference; Paper No. 11132; NACE: Houston, TX, USA, 2011. [Google Scholar]
  74. Ruschau, G.; Kowalski, A. Evaluation and Validation of Aboveground Techniques for Coating Condition Assessment—Final Report; DTRS56-05-T-0004; United States Department of Transportation: Washington, DC, USA, 2006.
  75. Segall, S.M.; Eng, P.; Gummow, R.A.; Eng, P.; Street, M. Interpretation of Indirect Inspections Data in the ECDA Process; Corrosion Conference Expo Paper No. 11128; NACE: Houston, TX, USA, 2011. [Google Scholar]
  76. McKinney, J.P.; Orazem, M.E.; Moghissi, O.C.; Technologies, C.; Road, F.; D’Zurko, D. Development of ECDA Criteria for Prioritization of Indications. In Proceedings of the 61st NACE Corrosion Conference; Paper No 06188; NACE: San Diego, CA, USA, 2006. [Google Scholar]
  77. Neizvestny, G.R.; Kenig, S.; Kovler, K. Aging Investigation of Polyethylene-Coated Underground Steel Pipelines. Corros. Mater. Degrad. 2025, 6, 62. [Google Scholar] [CrossRef] [Scilit]
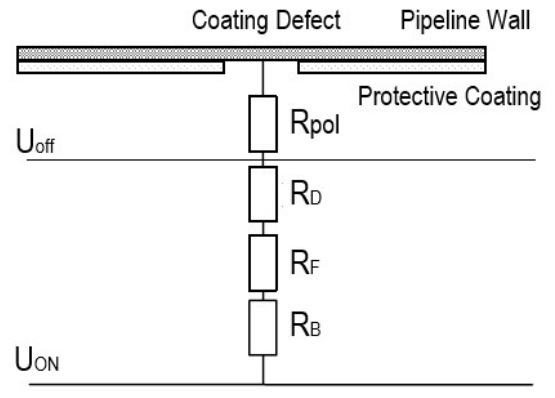
Figure 1. The simplified equivalent electrical circuit of a polymer coating defect. The agenda of technical parameters is: UON—On Potential (with CP current) [mV]; UOff—Instant Off Potential (without CP current) [mV]; Rpol—Polarization Resistance (without CP current) [Ω]; RD—Resistance of the polarization film [Ω]; RF—Coating defect longitudinal resistance [Ω]; RB—The spreading resistance [Ω].
Cmd 07 00035 g001
Figure 2. Evans diagram illustrating iron (steel) corrosion in an aerated neutral electrolyte (soil), demonstrating the principle of Impressed Current Cathodic Protection (ICCP). The dashed horizontal lines indicate the shift from the unprotected potential (−0.61 V) of a buried steel pipeline to the protected potential of −0.85 V [51].
Cmd 07 00035 g002
Figure 3. Pourbaix diagram illustrating the cathodic polarization mechanism of iron (steel).
Cmd 07 00035 g003
Figure 4. Graphical representation of the limiting current I* as a function of Eon, ES, and ρ.
Cmd 07 00035 g004
Figure 5. The scheme of the Drainage Test setup.
Cmd 07 00035 g005
Figure 6. Graphical representation of the limiting current I* as a function of I (the polarization current measured by a Drainage Test) and ρ (soil resistivity). For this study, an electrical current I of 2 mA is equal to the average specific coating resistance of 3 × 10⁶ Ω·m2. Soil resistivity axis in linear format (instead of logarithmic one as in Figure 4).
Cmd 07 00035 g006
Table 1. Protection potentials (versus VCSE (Cu/CuSO4) reference cell).
Medium: Water and SoilFree-Corrosion
Potential
Protection
Potential
Aerobic conditions (Oxygen present)Normal conditions, T < 40 °C, ρ < 100 Ω·m−0.65 to −0.40 V−0.85 V
Normal conditions, T > 60 °C, ρ < 100 Ω·m−0.80 to −0.50 V−0.95 V
Aerated, sandy soils: T < 40 °C, 100 < ρ < 1000 Ω·m−0.50 to −0.30 V−0.75 V
Aerated, sandy soils: T < 40 °C, ρ > 1000 Ω·m−0.40 to −0.20 V−0.65 V
Anaerobic conditions (No oxygen present)−0.80 to −0.65 V−0.95 V
Table 2. Basic variables for threshold calculation of the polarization current.
SymbolVariableRemark
I*Limiting Current [A] needed to fulfill the protection potential criteriaLimit value that is to be calculated
EonOn potential [V] as measured in remote earthOn potential is expected to be applied during the application of the CP system. Typical value is −1.2 V or more negative.
EsProtection (IR-Free) potential [V]Values specified in Table 2. Usually, −0.95 V is used when no detailed information is available.
J*Current density [A/m2]Table 3 depicts typical values. Commonly, the value 0.2 A/m2 is chosen when no detailed information is available.
ρHighest specific soil resistivity [Ω·m] as measured along the investigated pipeline sectionValue taken from soil resistivity during the design phase and/or as measured in pits during the construction phase.
Table 4. The two examples of dependence of limiting current as a function of Eon, ES, and ρ.
FormulaTechnical ParameterCase 1Case 2
I* = 16·(Eon − Es)2/π·J*·ρ2Limiting current, I* (A)Y-axis, red linesY axis, green lines
Protection current density J* (A/m2)0.2 A/m2
On potential Eon (V)−1.2 V−1.4 V
Protection potential criterion Es (V)As a function of soil resistivity [52]
Soil resistivity ρ, (Ω·m)X-axis
Table 5. Analysis of calculated and measured values.
CaseEoffIConclusion About CPPossible Measures
1Eoff ≤ EsI ≤ I*Effectivenone
2Eoff > EsI ≤ I*Assessment
not possible
Check for contacts with other objects; check assumed values J and ρ
3any caseI > I*Check the assumed values of J and ρ; locate and eliminate any coating defects.
Table 6. The relation between the measuring range of the microvoltmeter, the resistance of the shunt, and the applied current.
ShuntMeasuring Range
10 mV30 mV100 mV
10 Ω1 mA3 mA10 mA
100 Ω100 µA300 µA1 mA
1000 Ω10 µA30 µA100 µA
10,000 Ω1 µA3 µA10 µA
Table 7. Coating average specific electrical resistance, average consumed electrical current, and IR distribution of sixty (60) new underground pipelines of different lengths (L), by Drainage Test and/or by DCVG.
Pipeline Name (*)Length L, kmØ, InchCoating Average
Specific Electrical
Resistance, 106 Ω·m2
Average
Consumed
Electrical
Current, mA
AE—Specific Coating Defects Ratio, mm2/m2DCVG—%IR Distribution
Total Number of Defects0–11–33–1515–3535–6060–100
N1 (South)7.02161.975.000.033210000
N2 (South)7.09201.0111.030.084130000
N3 (South)7.042419.300.66<0.011100000
N4 (South)8.20200.7315.280.1411911000
N5 (South)2.80300.002351.402,5701000001
N6 (North)1.80240.1130.473.232020000
N7 (North)3.62360.0989.44.524201100
N8 (South)10.92160.07151.006.876311010
N9 (South)7.90361.852.540.032200000
N10 (South)2.98360.657.570.171001000
N11 (Center)1.201001.644.250.041010000
N12 (North)3.24240.432.572.203030000
N13 (South)17.00280.0979.600.3314570101
N14 (Center)3.43300.04105.3017.455310100
N15 (South)3.48320.1429.682.165013100
N16 (North)2.74100.375.430.432011000
N17 (North)0.96284.100.25<0.01-------
N18 (North)1.40360.4110.610.362101000
N19 (North)0.60120.1428.302.162011000
N20 (North)7.30641.7021.200.03201910000
N21 (North)1.48200.523.220.244400000
N22 (North)1.00200.591.870.205410000
N23 (North)0.20240.4217.910.354400000
N24 (North)0.80605.100.72<0.011100000
N25 (North)0.402814.000.07<0.012200000
N26 (Center)2.09480.0668.808.8816384001
N27 (Center)1.38320.674.500.162200000
N28 (Center)0.65489.300.09<0.011100000
N29 (Center)1.05800.0960.004.522001100
N30 (Center)0.68364.000.27<0.014400000
N31 (Center)1.04320.382.120.412110000
N32 (Center)4.44241.173.620.060000000
N33 (Center)0.555436.000.06<0.010000000
N34 (Center)0.62160.002250.002,5719720000
N35 (Center)0.88300.009170.002108620000
N36 (Center)1.60300.3910.710.394300100
N37 (Center)1.05360.943.220.097610000
N38 (South)1.05120.2133.601.103201000
N39 (South)1.81800.7217.90.143300000
N40 (South)3.2560.971.750.097601000
N41 (South)0.52800.3220.900.552110000
N42 (South)2.08409.000.57<0.012200000
N43 (South)0.99400.0385.00286230010
N44 (South)3.04403.760.34<0.016600000
N45 (South)5.08400.5616.210.218350000
N46 (North)2.2432---2101000
N47 (South)5.37200.1011.433.795320000
N48 (Center)2.80100---1001000
N49 (South)3.2380.1526.001.9315283110
N50 (South)10.18161.2012.200.06-------
G51 (Center)9.421816.900.65<0.01-------
G52 (Center)7.761810.900.80<0.01-------
G53 (North)14.731026.301.79<0.01-------
G54 (North)12.541819.500.74<0.01-------
G55 (Center)12.801844.200.07<0.01-------
G56 (North)9.643622.100.59<0.01-------
G57 (Center)9.24185.401.24<0.01-------
G58 (Center)7.57187.200.16<0.01-------
G59 (North)6.603625.70.61<0.01-------
G60 (North)7.90367.902.00<0.01-------
Total260.0 2201275822733
(*)—The pipelines (N1–N50) are referred to as water transmission pipelines, whereas the pipelines (G51–G60) are referred to as oil/gas industry. For oil/gas pipelines, DT has been conducted only. DCVG has not been carried out due to excellent average coating-specific electrical resistance results.
Table 8. Average coating specific electrical resistance criteria (in Ω·m2 units) and consumed electrical current based on Drainage Test; and specific coating defects ratio criteria with defect size classification.
Coating ConditionAverage Specific Coating Resistance, Ω·m2 (Calculated After 60 min Conducted by Drainage Test)Consumed Electrical Current, mAAE―Specific Coating Defects Ratio, mm2/m2Recommendations to Further Perform the DCVG testDefect Size Classification
ExcellentR ≥ 3 × 10⁶I ≤ 2<0.01DCVG tests are unnecessaryVery small single defects (IR < 1)
Good3 × 105 ≤ R < 3 × 1062 < I ≤ 220.01 ÷ 1.50DCVG tests are necessarySeveral very small, small (1 ≤ %IR < 3) or single moderate defects (3 ≤ IR < 15)
Fair3 × 104 ≤ R < 3 × 10522 < I ≤ 1511.50 ÷ 15.0DCVG tests are necessarySeveral large (IR ≥ 15) combined with very small, small and moderate defects
UnsatisfactoryR < 3 × 104151 > I>15.0DCVG tests are necessarySignificant quantity of defects with various sizes (large, medium and small)
Table 9. Calculated values for some major points as well as the point where the lines intersect.
FormulaρJ*UonUsI*
I* = 16·(Eon − Es)2/π·J*·ρ2Ω mA/m2VVmA
10.2−2.0−0.9528,075
100.2−2.0−0.95280.7
900.2−2.0−0.953.466
1000.2−2.0−0.952.807
1190.2−2.0−0.951.984
10000.2−2.0−0.950.028
Disclaimer/Publisher’s Note: The statements, opinions and data contained in all publications are solely those of the individual author(s) and contributor(s) and not of MDPI and/or the editor(s). MDPI and/or the editor(s) disclaim responsibility for any injury to people or property resulting from any ideas, methods, instructions or products referred to in the content.