Article

Field-Dependent Redox Thermodynamics of MoOmHn Species on Cu(111) and Ni(111) Surfaces Under Alkaline Hydrogen Evolution Conditions


by
Eliakim M. Kambale
1,2,
David S. Rivera Rocabado
1,3,4,*,
Yusuke Kanematsu
1 and
Takayoshi Ishimoto
1,*
1
Graduate School of Advanced Science and Engineering, Hiroshima University, 1-3-2 Kagamiyama, Higashi-Hiroshima 739-8511, Hiroshima, Japan
2
Department of Chemistry, Faculty of Science and Technology, University of Kinshasa, Kinshasa XI P.O. Box 190, Democratic Republic of the Congo
3
Department of Chemistry, Graduate School of Science, Osaka Metropolitan University, 3-3-138 Sugimoto, Sumiyoshi-ku 558-8585, Osaka, Japan
4
International Research and Education Center, Graduate School of Science, Osaka Metropolitan University, 3-3-138 Sugimoto, Sumiyoshi-ku 558-8585, Osaka, Japan
*
Authors to whom correspondence should be addressed.
Surfaces 2026, 9(2), 51; https://doi.org/10.3390/surfaces9020051
Submission received: 3 April 2026 / Revised: 30 May 2026 / Accepted: 2 June 2026 / Published: 8 June 2026

Abstract

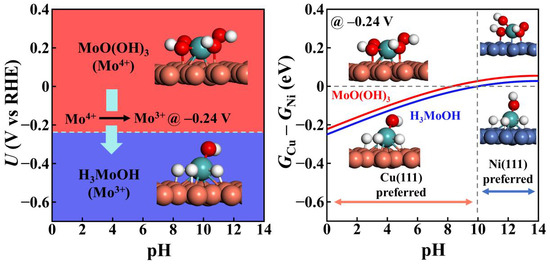
Whether copper fundamentally alters Mo-centered redox thermodynamics or mainly tunes hydrogen adsorption in Ni–Mo electrocatalysts under alkaline hydrogen evolution reaction (HER) conditions remains unresolved. Density functional theory calculations combined with a field-corrected computational hydrogen electrode framework are used to evaluate the thermodynamic stability of H3Mo, H3MoOH, H2Mo(OH)2, and MoO(OH)3 on Cu(111) and Ni(111) and to construct surface Pourbaix diagrams under electrochemical conditions. The results show that substrate identity reorganizes the redox stabilization hierarchy of these Mo intermediates. Across the examined conditions, at least one of H3Mo, H3MoOH, or MoO(OH)3 is thermodynamically favored over H2Mo(OH)2 on both surfaces. However, only Cu(111) exhibits measurable pH-dependent free-energy shifts, reaching 0.25 eV on the reversible hydrogen electrode scale. The magnitude of this electrostatic modulation is comparable to the intrinsic substrate-dependent relative Gibbs free-energy differences, suggesting that Cu reshapes Mo redox thermodynamics rather than merely weakening hydrogen binding strength. Electronic structure and vibrational analyses further show that Cu(111) preferentially weakens Mo–O interactions, whereas Ni(111) more strongly perturbs Mo–H bonding in hydrogen-rich complexes. Overall, these results establish that substrate identity governs the electrostatic modulation of Mo redox thermodynamics under alkaline HER conditions and provide mechanistic insight into substrate effects relevant to Cu-containing Ni–Mo systems.

Graphical Abstract

1. Introduction

The hydrogen evolution reaction (HER) is a fundamental half-reaction in water splitting and underpins the production of green hydrogen from renewable electricity [1,2,3]. Among available electrolysis technologies, alkaline water electrolysis is particularly attractive for large-scale deployment because of its low materials cost, long-term durability, technological maturity, and compatibility with earth-abundant electrocatalysts under relatively mild operating conditions [4,5]. However, HER in alkaline media is typically slower than in acidic electrolytes, owing in part to the additional water dissociation (Volmer) step required to generate adsorbed hydrogen and to the influence of hydroxyl adsorption and interfacial water structure on surface kinetics [4,6,7,8,9,10,11]. Achieving high activity therefore requires catalysts capable of overcoming these kinetic limitations [4]. Although platinum remains the benchmark HER catalyst, its scarcity and cost constrain large-scale implementation [1,2,3,4].
Among non-precious alternatives, nickel–molybdenum (Ni–Mo) alloys have emerged as leading candidates for alkaline HER because of their high activity, stability, and low cost [4,12]. Their performance has often been attributed to synergistic interactions between Ni and Mo, although the precise mechanistic origin remains debated [2,4,13,14]. In particular, the identity of the active Mo species remains unresolved. While some interpretations assign primary activity to metallic Ni with Mo acting mainly in a supportive role [4,13], recent spectroscopic and electrochemical evidence suggests that oxidized Mo species, including Mo3+, may directly participate in hydride formation and H2 evolution [1,13,14]. Under reaction conditions, Mo has also been reported to undergo structural and compositional evolution, indicating that the active surface may differ substantially from the as-prepared alloy [5,12]. These observations have motivated a Mo3+–hydride-centered framework in which cathodic polarization promotes redox-active Mo species capable of forming reactive hydrides [13,14,15]. Within this picture, four surface intermediates—H3Mo, H3MoOH, H2Mo(OH)2, and MoO(OH)3—define a redox-coupled thermodynamic landscape governing activity in Ni–Mo systems [13,14,15]. This selection is grounded in a systematic computational screening of 37 MoOmHn cluster compositions spanning Mo oxidation states from 0 to +6 on Ni(111) [13], from which the four complexes emerged as the thermodynamically dominant species under the HER-relevant electrochemical conditions; the complete stability landscape across all screened compositions is compiled in Figure S7 of the Supporting Information of reference [13]. Within this framework, the four intermediates are assigned the formal Mo oxidation states H3Mo/Mo2+, H3MoOH/Mo3+, H2Mo(OH)2/Mo3+, and MoO(OH)3/Mo4+, consistent with both the experimentally supported Mo hydride/oxyhydride chemistry of reference [13] and standard ligand-counting conventions. These labels are used throughout as chemical descriptors and are not derived from computed partial charges; the Mo partial-charge values reported in Table S1 nonetheless support the expected electronic trend across the oxygenated series, in which increasing oxygen coordination yields a more positively charged Mo center.
Incorporating copper into Ni–Mo catalysts has been reported to further enhance alkaline HER performance [1,12,16]. Most interpretations attribute this improvement to modifications of the adsorbate’s electronic environment, including d-band shifts that weaken hydrogen adsorption [3,16,17], although cooperative interactions between oxidized Cu and Mo species have also been proposed under certain conditions [1]. However, whether Cu merely tunes hydrogen adsorption strength or instead reorganizes the Mo-centered redox stabilization hierarchy under cathodic bias remains unclear. Clarifying this distinction is important because, if Cu perturbs the relative stability of oxidized and hydride-containing Mo species, its role extends beyond simple hydrogen-binding optimization.
Prior theoretical evaluations of these MoOmHn intermediates were performed on Ni(111), representing Ni-rich alloy environments [13]. Here the same intermediates are examined on pure Cu(111) to interrogate the role of substrate electronic structure in Mo redox thermodynamics, rather than to reproduce the full lattice and compositional complexity of ternary Ni–Mo–Cu catalysts. The matched FCC (111) terminations of Cu and Ni ensure that the comparison is not confounded by supercell-level lattice differences. Similarly, the present study does not perform a new enumeration of all MoOmHn stoichiometries on Cu(111); instead, it adopts the established intermediate set to enable direct quantitative comparability with the Ni(111) reference calculations [13,14], reserving the full enumeration on Cu(111) as a future research direction.
Prior theoretical treatments of Ni–Mo HER systems have relied on the conventional computational hydrogen electrode (CHE) formalism [18,19], which neglects explicit interfacial electric field effects. While this approximation is often adequate for weakly polar adsorbates such as atomic hydrogen, it can misrepresent more polar MoOmHn intermediates, whose thermodynamic stability depends on coupling between their dipole moments and the interfacial electric field under cathodic bias. Neglecting this field–dipole interaction may lead to incorrect identification of the thermodynamically preferred Mo oxidation state under operating conditions. To address this limitation, a field-corrected CHE framework [20,21] is employed here to construct surface Pourbaix diagrams for MoOmHn intermediates on Ni(111) and Cu(111) under electrochemically relevant conditions.
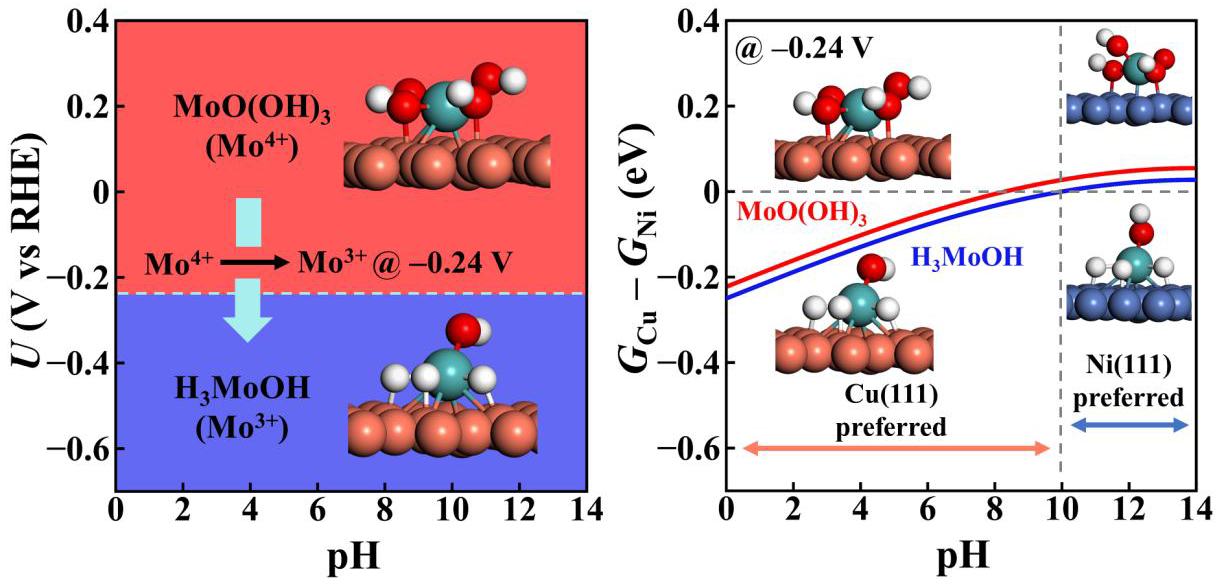
Field- and pH-dependent free-energy analysis reveals that substrate identity reorganizes the Mo redox stabilization hierarchy. Whereas Ni(111) exhibits comparatively weak pH sensitivity, Cu(111) shows measurable free-energy shifts of up to 0.25 eV on the reversible hydrogen electrode (RHE) scale, demonstrating significant electrostatic modulation of Mo-centered intermediates. The magnitude of this field-induced stabilization is comparable to intrinsic substrate-dependent Gibbs free-energy differences, suggesting that Cu reshapes Mo redox thermodynamics rather than simply tuning hydrogen binding strength. Electronic structure analysis further reveals contrasting bond-softening tendencies, with Cu preferentially weakening Mo–O interactions and Ni selectively softening Mo–H bonds. Together, these results establish substrate-dependent electrostatic control over Mo redox thermodynamics under alkaline HER conditions.

2. Computational Details

Spin-polarized density functional theory (DFT) calculations were carried out using the Vienna Ab initio Simulation Package (VASP 6.4.2) [22,23]. The revised Perdew–Burke–Ernzerhof (RPBE) functional within the generalized gradient approximation (GGA) was employed to describe exchange–correlation effects [24,25]. RPBE generally yields less exothermic adsorption energies than PBE for adsorbates on transition-metal surfaces and is therefore often used to mitigate the well-documented overbinding tendency of PBE [19,25,26,27].
The projector augmented-wave method was used to represent the interaction between core and valence electrons [28,29]. A plane-wave cutoff energy of 520 eV was applied throughout all calculations. Electronic self-consistency was achieved with an energy convergence criterion of 10−6 eV, while atomic positions were relaxed until residual forces on each atom were below 0.02 eV Å−1. To account for electron localization in the Mo 4d states of the MoOmHn complexes, a Hubbard correction was applied within the Dudarev formalism [30,31,32], in which the effective on-site parameter is defined as U e f f = U     J . Following Bau et al. [13], who employed the same correction for this MoOmHn intermediate family on Ni(111), we adopted U e f f = 2.0 eV; this preserves direct comparability with their experimentally supported Ni(111) thermodynamic framework and avoids introducing an additional methodological variable in the present Cu(111) versus Ni(111) comparison. Although the absolute Gibbs energies depend on the chosen U e f f , applying the same value to every intermediate on both surfaces provides a consistent baseline for resolving the substrate-dependent trends that are the focus of this work.
Cu(111) and Ni(111) surfaces were modeled as 4 × 4 supercells consisting of three atomic layers, separated by a 17 Å vacuum region along the surface normal to avoid interactions between periodic images (Figure S1). The three-layer 4 × 4 slab model was selected to maintain direct comparability with the Ni(111) reference calculations of Bau et al. [13], who showed that Mo-cluster binding energies on a comparable three-layer Ni(111) slab differed by only 0.01 eV from those obtained using an eight-layer slab. In the present work, the same slab thickness and lateral periodicity were used for both Cu(111) and Ni(111), providing a consistent basis for the substrate comparison. As an additional convergence check, a five-layer slab produced no meaningful changes in optimized adsorption geometries, with adsorption energies differing by less than 0.10 eV. The top two layers and the adsorbates were allowed to relax, while the bottom layer was kept fixed. The Brillouin zone was sampled using a 3 × 3 × 1 Monkhorst–Pack k-point mesh [33] for structural relaxations. For electronic structure analysis and vibrational frequency calculations, a denser 5 × 5 × 1 k-point mesh was used to improve electronic convergence. Gas-phase species were calculated using only the Γ-point in reciprocal space. First-order Methfessel–Paxton smearing [34] with a width of 0.20 eV was used to ensure stable electronic convergence for the metallic slab models. Because adsorption energies were evaluated as differences between similar metallic states, finite-smearing contributions are expected to largely cancel and thus should not affect the relative energetic trends discussed here. Dispersion interactions were included using Grimme’s D3 correction with Becke–Johnson damping [35], and solvent effects were treated with the VASPSol implicit solvent approach [36,37], using a dielectric constant of 78.4 [38] to represent water at 298.15 K. The computational setup was benchmarked against the Ni(111) reference data of Bau et al. [13] for the same MoOmHn family. Relative Gibbs energies agree to within 0.06 eV for H3MoOH and H2Mo(OH)2, and the MoO(OH)3 crossing potential agrees to within 0.01 V (Table S2); the larger H3Mo deviation reflects a different optimized hydride orientation, as discussed below. Optimized Mo–ligand and Mo–metal distances also fall within chemically reasonable ranges, providing a qualitative consistency check given that direct crystallographic data for the surface-bound systems are unavailable. Together, these comparisons support extending the Ni(111) framework to Cu(111).
External electric fields were applied along the surface normal using the dipole-layer method implemented in VASP. A dipole correction was included to remove spurious electrostatic interactions between periodic slab images and to ensure a well-defined potential drop across the vacuum region. Field strengths between −0.8 and +0.8 V Å−1 were considered, following the range reported by Kelly et al. [20]. Charge distributions and bond orders were analyzed using the 6th version of the Density Derived Electrostatic and Chemical (DDEC6) method [39,40]. Density-of-states analyses and thermal corrections to the Gibbs free energy were performed using VASPKIT (version 1.3.5) [41]. Thermal corrections were evaluated at 1 atm for gas-phase hydrogen and 0.0317 atm for water. These pressures correspond to the standard-state hydrogen pressure and the equilibrium vapor pressure of water at 298.15 K, respectively [42,43].
The adsorption energy was calculated as
E a d s = E s l a b + a d s o r b a t e E s l a b E a d s o r b a t e ,
where E a d s o r b a t e , E s l a b , and E s l a b + a d s o r b a t e are the electronic total energies of the gas-phase adsorbate, the pristine slab, and the slab–adsorbate system, respectively. Negative E a d s values indicate exothermic adsorption.
The thermodynamic stability of molybdenum complexes on metallic surfaces under HER-relevant electrochemical conditions was evaluated through the Gibbs free energy of the following reaction [13]:
M o + n     m H 2 O + n     2 m e M o O m H n + n     2 m O H ,
where * denotes an adsorption site on the respective metal surface.
At equilibrium, the electrochemical potential condition yields Δ r G = ( n     2 m ) e U [44], where Δ r G is the reaction Gibbs free energy, ( n     2 m ) is the number of electrons involved in the redox process, e is the elementary charge in atomic units, and U is the electrode potential referenced to the RHE (V). Following the thermodynamic framework previously applied to surface-bound molybdenum complexes by Bau et al. [13,14], the relative Gibbs free energy of formation of each complex on the metal surface was defined as
G r e l = G M o O m H n G M o m   G H 2 O + m n 2 G H 2 + n 2 m e U ,
Here, G M o O m H n , G M o , G H 2 O and G H 2 correspond to the Gibbs free energies of adsorbed M o O m H n , adsorbed M o , gas-phase water, and gas-phase hydrogen, respectively. Negative G r e l values indicate thermodynamically favorable formation of the complex on the metal surface, whereas positive values indicate that the reverse reaction is favored.
The potential-dependent slope of G r e l for each complex is governed by the coefficient (n − 2m) in the above thermodynamic expression, which takes values of +3 (H3Mo), +2 (H3MoOH), 0 (H2Mo(OH)2), and −5 (MoO(OH)3). Therefore, cathodic bias stabilizes H3Mo and H3MoOH, leaves H2Mo(OH)2 potential-independent, and destabilizes MoO(OH)3, before any field-dependent corrections are introduced through the procedure described below.
Following recent extensions of the CHE that explicitly account for interfacial electric-field effects, the Gibbs free energies entering Equation (3) were corrected to include the response of adsorbed species to the electrode field. In this framework, the field-dependent free energy of an adsorbed complex is written as
G f i e l d ( E ) = G r e l + μ · E α 2 E 2 ,
where G r e l is the zero-field relative Gibbs free energy, E is the interfacial electric field, and μ and α are the adsorption-induced dipole moment and polarizability, respectively. Electronic energies of the slab–adsorbate systems were computed at nine external electric fields Eext applied along the surface normal, from −0.8 to +0.8 V Å−1 in steps of 0.2 V Å−1. For each adsorbed MoOmHn complex, the field-induced change in the relative Gibbs free energy was fitted by least-squares to G f i e l d E = G f i e l d E G r e l = μ · E α 2 E 2 , from which the adsorption-induced dipole moment μ and the polarizability α were extracted as fitting coefficients. This procedure follows the approach introduced by Kelly et al. [20] and subsequently adopted for RHE-dependent surface Pourbaix analyses [21]. The fitting parameters, coefficient of determination R2, and fitting-window robustness are reported in the Supporting Information (Tables S3 and S4, and Figure S2). The interfacial electric field, E , was estimated using the parallel-plate capacitor model, in which the field depends on the electrode potential U S H E relative to the potential of zero charge ( U P Z C ) and on the Helmholtz capacitance C H (in F m−2):
E = C H ( U S H E U P Z C ) ε ε 0 ,
where ε0 denotes the permittivity of free space (8.85 × 10⁻¹² F m−1), and ε is the dielectric constant. When expressed on the RHE scale, this relation makes E explicitly dependent on both the applied potential U and the p H through the conversion between RHE and SHE potentials, thereby introducing pH-dependent adsorption energetics even at fixed U R H E :
E = C H ε ε 0 U R H E k B T l n ( 10 ) e p H U P Z C .
Consistent with prior studies, CH was set equal to 0.25 F m−2, and zero-point energy, entropic, and solvation corrections were assumed to be independent of the applied field [20,21]. The U P Z C values of Cu and Ni were set to −0.70 V [45] and −0.30 V [46], respectively. In VASP, the externally applied electric field is expressed in V Å−1. Consequently, μ and α, obtained from quadratic fitting of the field-dependent energies, are reported in units of eÅ and eÅ2 V−1, respectively. For consistency between the capacitor-model field defined in Equation (6), which is expressed in V m−1, and the VASP convention used in Equation (4), the field values were converted from V m−1 to V Å−1 prior to evaluating the field-dependent free energies.
The 2D surface Pourbaix diagrams (Figures S7 and S10) were constructed by evaluating Equation (4), with the potential and pH dependence introduced through Equation (6), on a uniform tessellation of a chosen ( U R H E , p H ) plane subset and assigning to each tile the complex of lowest field-corrected relative Gibbs free energy, G f i e l d , while retaining the full ordering of all competing MoOmHn species, and thereby resolving the metastability hierarchy. We refer to this approach as the Tessellated Ab Initio Pourbaix (TAIP) analysis.
For Raman spectra, vibrational modes were obtained using density functional perturbation theory calculations [47,48,49], and Raman tensors were evaluated from finite differences of dielectric tensors for positive and negative displacements along each normal mode, using the postprocessing script developed by Fonari and Stauffer [50].
An eigenvector overlap analysis, inspired by the work of Lazzeri et al. [51], was employed to quantitatively compare vibrational modes of adsorbates on different metal surfaces. In the present work, this method is referred to as the Cross-System Eigenmode Mapping (CSEM). Prior to comparison, adsorbate geometries were aligned using the Kabsch algorithm [52], and their displacement vectors were rotated accordingly. An iterative atom-index permutation procedure was employed to minimize the root-mean-square deviation between adsorbate geometries on different metal surfaces, thereby accounting for possible atom reordering while preserving chemical equivalence. Only adsorbate-atom displacements were considered in the analysis. The overlap matrix S i j between mode i of system A and mode j of system B was computed as the absolute value of the dot product of the corresponding normalized eigenvectors:
S i j = v i · v j ,
where v i and v j are unit-normalized eigenvectors. This metric ranges from 0, corresponding to orthogonal modes, to 1, indicating identical modes, and quantifies the similarity of atomic displacement patterns independently of vibrational frequency. Vibrational modes were visualized using the postprocessing script of Dardzinski [53] to verify mode similarity.

3. Results and Discussion

3.1. Substrate-Dependent Adsorbate–Metal Hybridization Governs Structure and Energetics of Mo Complexes on Cu(111) and Ni(111)

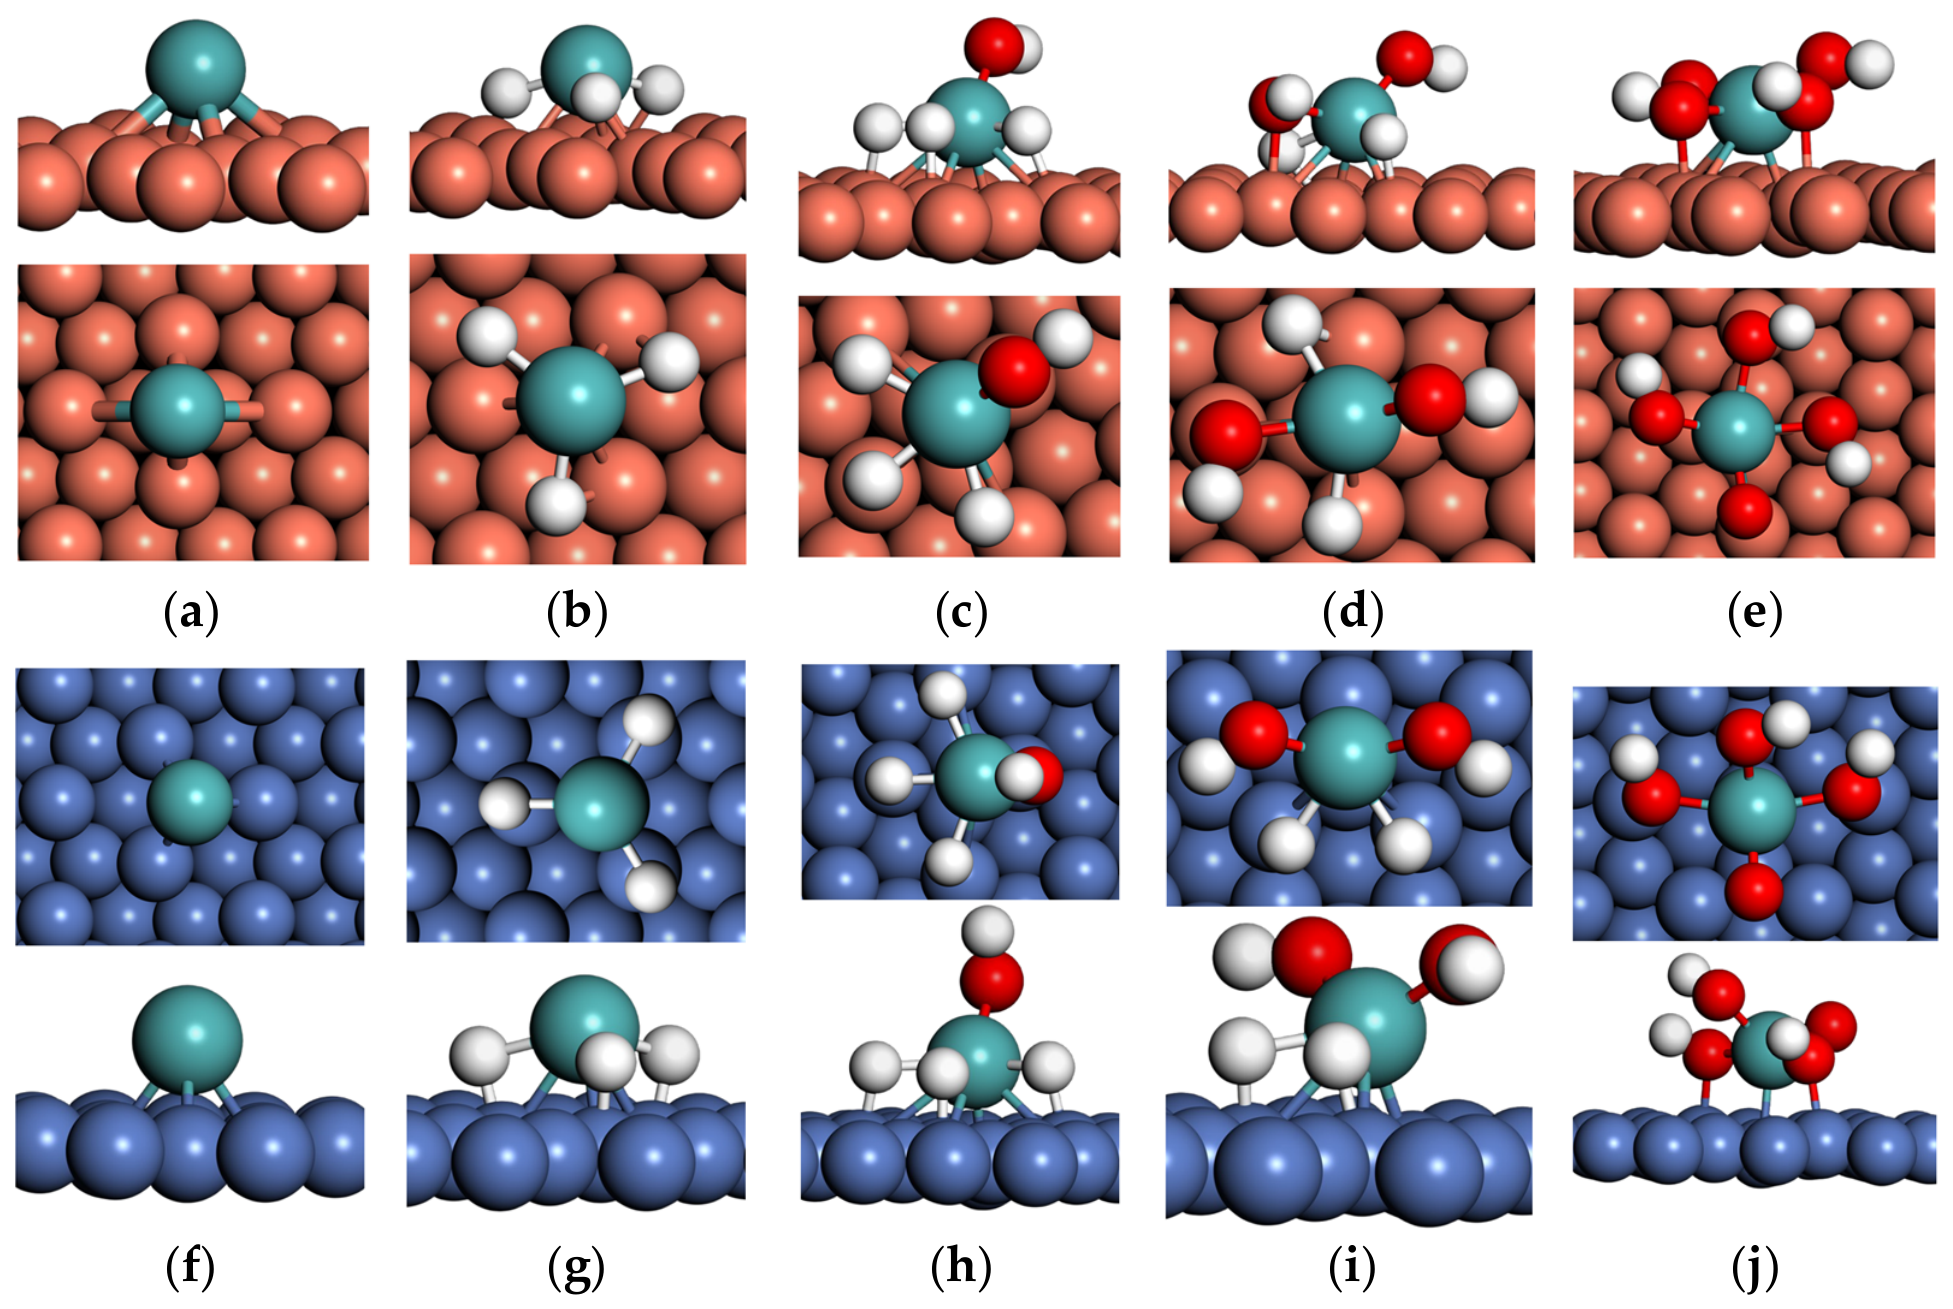
Mo and its hydrogenated and oxygenated complexes (H3Mo, H3MoOH, H2Mo(OH)2, and MoO(OH)3) were adsorbed on Cu(111) and Ni(111) surfaces. Figure 1 shows the most stable adsorption geometries on the two surfaces. The bare Mo adatom preferentially occupies a bridge site on Cu(111) and a threefold hollow site on Ni(111) (Figure 1a,f, Table S5). The hollow configuration provides a more symmetric coordination environment than the bridge geometry, consistent with differences in the electronic structure of the two metals and the resulting adsorbate–metal hybridization. Upon ligand coordination, the preferred adsorption configuration changes with the coordination environment of the Mo center, reflecting progressive saturation of Mo-centered bonding interactions by the ligands, which alters the extent and geometry of metal–adsorbate coupling. H3Mo, H3MoOH, and H2Mo(OH)2 are adsorbed at threefold hollow sites on both metals. However, the Mo–metal distances are unequal, with one bond shorter than the other two (Tables S6–S8), indicating lateral displacement from the ideal C3v hollow position. Such deviations from ideal adsorption-site symmetry are consistent with uneven hybridization between adsorbate orbitals and the three surface atoms, since adsorption-site symmetry governs the symmetry-allowed coupling between adsorbate states and surface d-states [54].
The electronic consequences of this distortion are reflected in the distribution of adsorbate–surface bond orders. As shown in Figure S3, the DDEC6 bond orders between adsorbate atoms and the surface are generally more uneven on Cu(111) than on Ni(111). For example, in H2Mo(OH)2, the two hydroxyl oxygens interact asymmetrically with the Cu surface atoms (bond orders of 0.28 and < 0.05), whereas the corresponding interactions on Ni(111) are nearly equivalent (0.06 and 0.07). A similar trend is observed for H3MoOH and MoO(OH)3, where O–metal and H–metal bond orders are more broadly distributed on Cu but more uniform on Ni. These observations suggest that bonding on Cu is more localized to individual surface atoms, whereas bonding on Ni is distributed more evenly across the adsorption site, consistent with stronger adsorbate–metal hybridization.
In contrast, the most oxygenated complex, MoO(OH)3, preferentially binds at atop sites on both surfaces and forms a single dominant Mo–metal bond of 2.35 Å on Ni(111) and 2.34 Å on Cu(111) (Table S9). This behavior is consistent with the high oxygen coordination of the Mo center, which strengthens internal Mo–O bonding and consequently reduces Mo-centered interaction with multiple surface atoms.
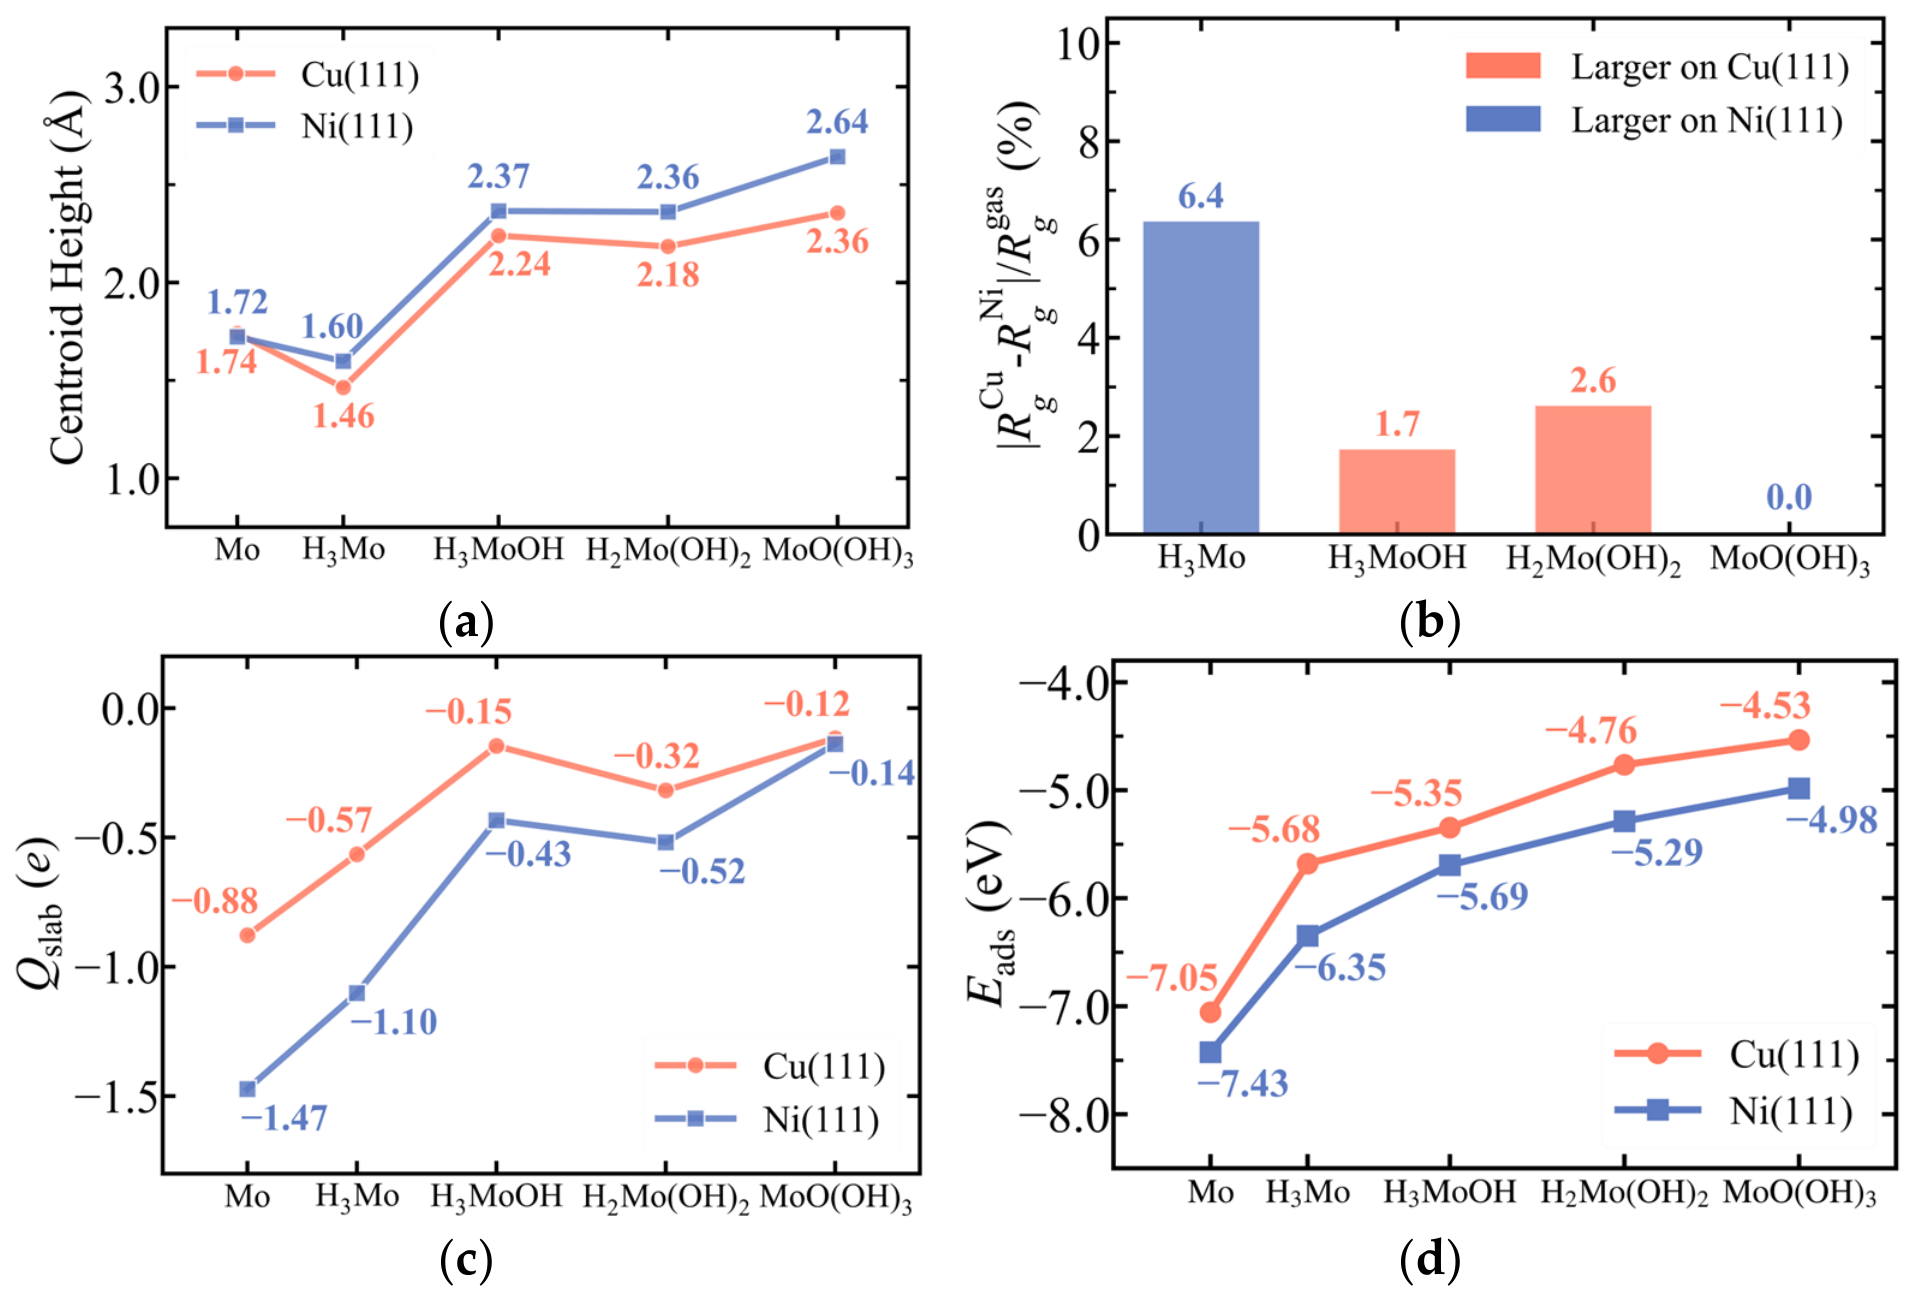
Despite these local differences, global structural descriptors indicate broadly similar adsorption geometries on the two substrates. Figure 2a shows the distance between the adsorbate centroid and the average z-coordinate of the top-layer slab atoms (centroid height). For all complexes, the centroid height is slightly larger on Ni(111) than on Cu(111), although the differences remain modest across the series: 0.02, 0.13, 0.13, 0.18, and 0.29 Å for Mo, H3Mo, H3MoOH, H2Mo(OH)2, and MoO(OH)3, respectively. A complementary descriptor is the relative variation in the radius of gyration ( R g ) between the two adsorbed states, normalized by the gas-phase value: Δ R g = | R g C u R g N i   | / R g g a s (Figure 2b). H3Mo exhibits a larger expansion on Ni (6.4%) relative to Cu, consistent with elongation of the Mo–H bonds by 0.16 Å relative to the gas phase, whereas H3MoOH and H2Mo(OH)2 show only minor expansion (<3.0%) on Cu. MoO(OH)3 displays essentially no size difference between the two surfaces. Overall, these descriptors confirm that geometric differences between complexes adsorbed on the two substrates are modest.
Electronic and energetic descriptors, however, reveal systematic differences. All complexes exhibit net electron donation to the substrate upon adsorption, with Ni(111) consistently accepting more charge than Cu(111), despite the slightly larger centroid heights noted above. The computed charge-transfer values (in units of e) are −0.57 (Cu) versus −1.10 (Ni) for H3Mo, −0.15 versus −0.43 for H3MoOH, −0.32 versus −0.52 for H2Mo(OH)2, and −0.12 versus −0.14 for MoO(OH)3 (Figure 2c). Within the d-band model of chemisorption [55,56,57,58], adsorption strength is correlated with the position of the metal d-band center relative to the Fermi level. Because the d-band center of Ni lies closer to the Fermi level than that of Cu (−1.84 eV versus −2.75 eV for clean slabs, Figure S4a), stronger adsorbate–metal hybridization and enhanced charge transfer are expected on Ni. Consistently, adsorption on Ni(111) is more exothermic for all complexes considered, with adsorption energy differences E a d s = E a d s N i E a d s C u of −0.67 eV for H3Mo, −0.35 eV for H3MoOH, −0.52 eV for H2Mo(OH)2, and −0.45 eV for MoO(OH)3. Increasing oxygen coordination is accompanied by reduced charge transfer and weaker adsorption (Figure 2d), consistent with strong internal Mo–O bonding and diminished Mo-centered interaction with the surface.
The stronger interaction with the Ni surface also alters the internal bonding of the complexes. Enhanced adsorbate–metal hybridization on Ni is consistent with redistribution of electron density from the Mo–ligand framework toward the surface, thereby weakening Mo–H and O–H bonds relative to Cu. These changes are reflected in the vibrational spectra discussed below. Because net atomic charge analysis assigns negative partial charge to Mo–H hydrogens and positive partial charge to O–H hydrogens in both isolated and adsorbed complexes (Tables S12–S16), the former are referred to as hydride hydrogens and the latter as protic hydrogens.

3.2. Substrate-Dependent Weakening and Reorganization of Mo–H Bonding in H3Mo on Cu(111) and Ni(111)

Section 3.2, Section 3.3, Section 3.4 and Section 3.5 analyze each Mo complex individually following a consistent two-layer structure: DDEC6 bond orders and atomic partial charges first quantify the electronic consequences of substrate-dependent hybridization, after which CSEM analysis and Raman intensity comparisons document the resulting vibrational reorganization. Adsorption geometries on Cu(111) and Ni(111) are summarized briefly within each subsection and described more broadly in Section S2.5 of the Supporting Information. Per-complex analysis is necessary because the substrate-dependent bonding patterns change qualitatively across the series—Mo–H bonds are preferentially softened on Ni for the hydride-containing complexes (Section 3.2 and Section 3.3), whereas Mo–O interactions are preferentially perturbed on Cu for the oxygen-coordinated species (Section 3.4 and Section 3.5)—a crossover that is synthesized in Section 3.6 and whose mechanistic implications are discussed in Section 3.7 and Section 3.8.
H3Mo adsorbs with broadly similar geometries on Cu(111) and Ni(111) (Figure 1b,g; Supplementary Information Section S2.5.2), and the summed DDEC6 H–metal bond orders are comparable on the two substrates (Figure S3a,b). Direct hydride–surface interactions are therefore similar, and the primary substrate-dependent distinction lies within the Mo–H bonding framework.
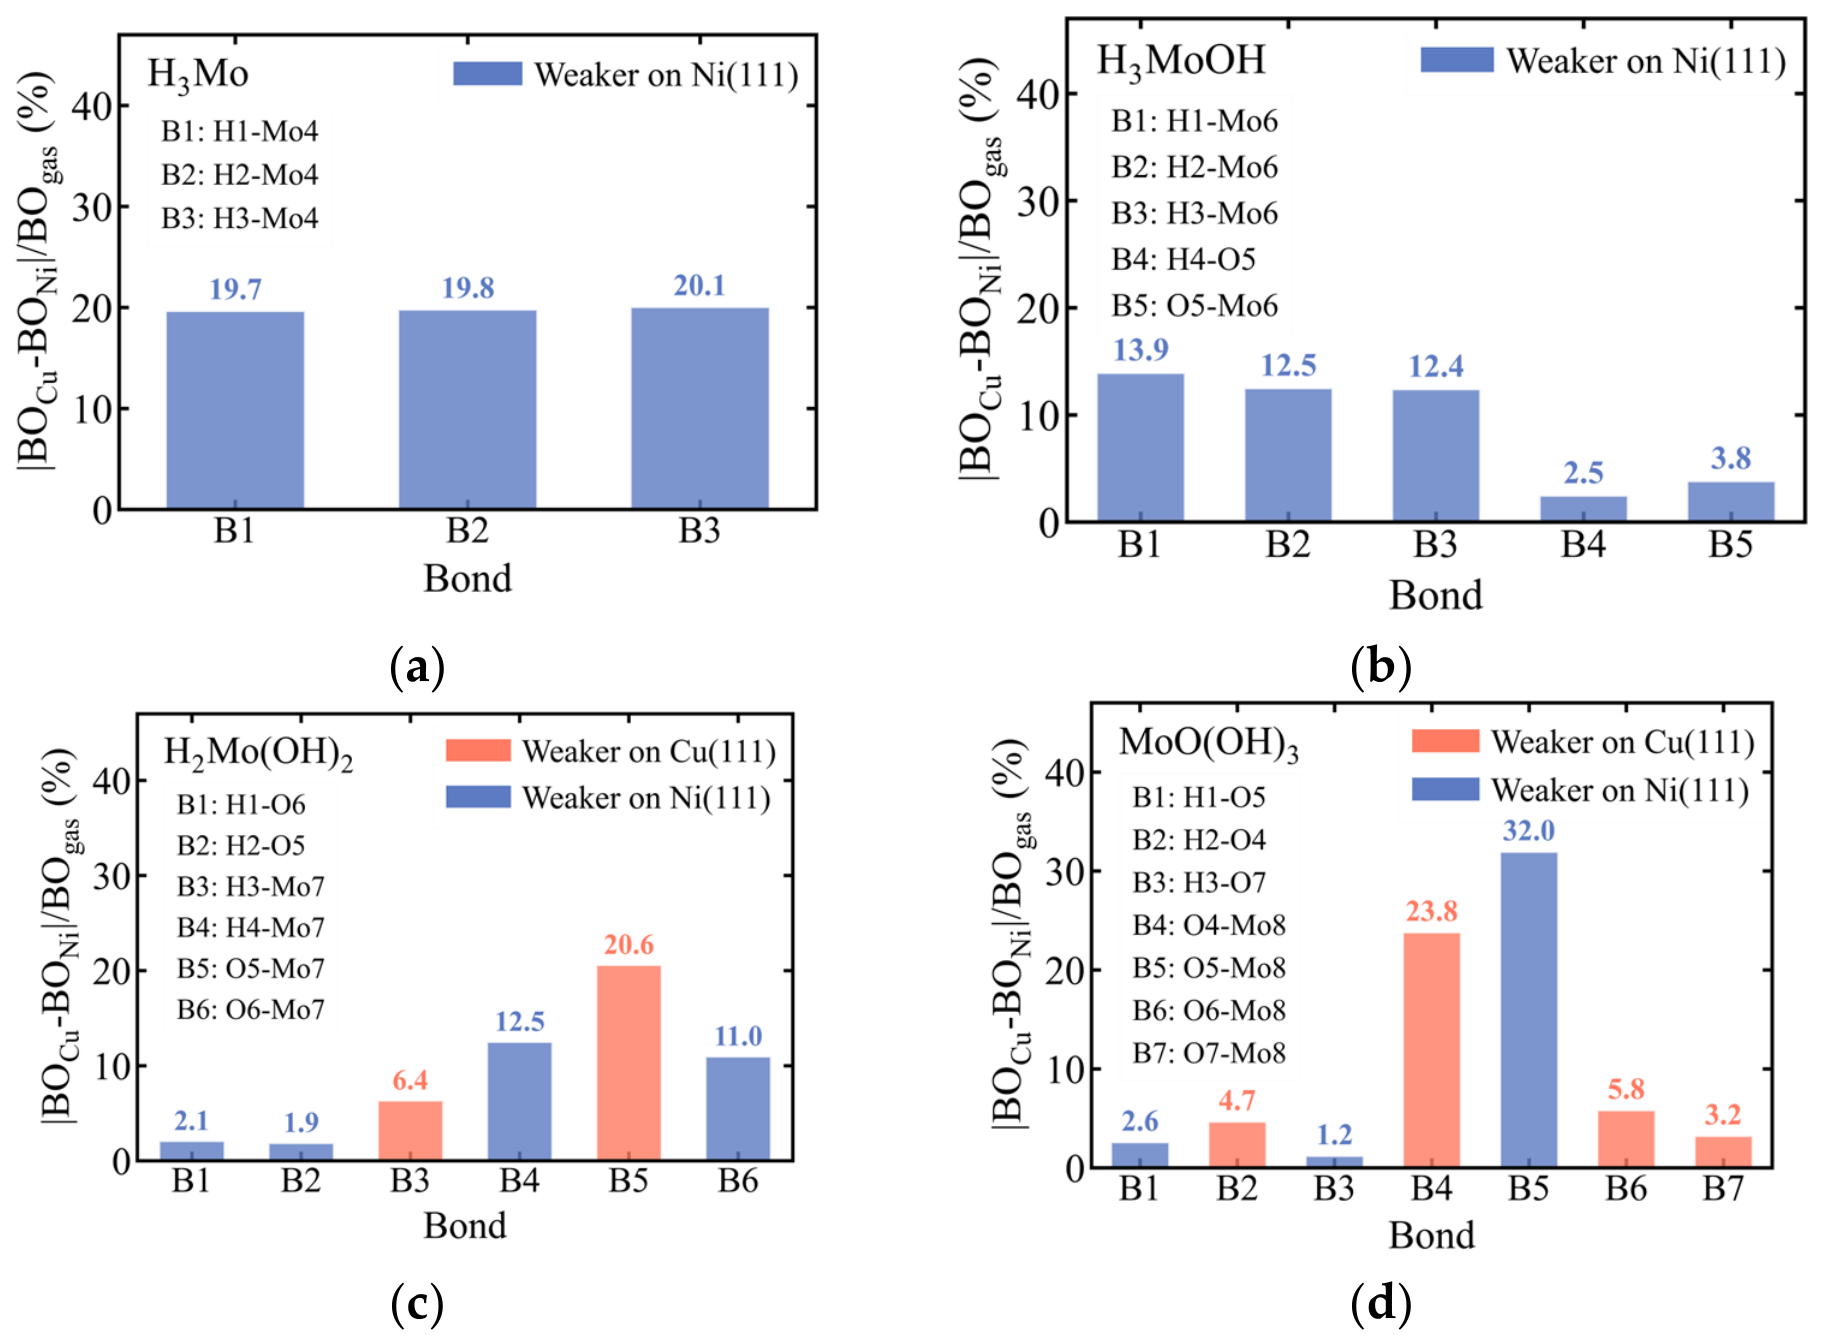
Greater charge transfer to Ni(111) is accompanied by an average 19.9% reduction in Mo–H bond order relative to Cu (range: 19.7–20.1%; Figure 3a). Consistent with this trend, the partial charge on Mo increases from +1.40 on Cu(111) to +1.67 on Ni(111), while hydride charges become less negative (−0.28 to −0.19; Tables S12 and S13), indicating reduced electron density in the Mo–H bonding framework.
These changes are reflected in the vibrational spectra. CSEM analysis (Figure S5a) shows only moderate correspondence between the Mo–H stretching manifolds on the two surfaces despite their broadly similar adsorption geometries: the adsorbate vibrational modes on Cu(111) near 1345 cm−1 map onto lower-frequency Ni(111) modes near 760 cm−1, with projection scores of 0.65–0.83. The reduced Mo–H bond order on Ni is consistent with the observed red shifts; however, the large frequency difference (Δν ≈ 590 cm−1), together with only moderate eigenvector overlap, indicates appreciable reorganization of the Mo–H stretching manifold rather than simple preservation of mode character.
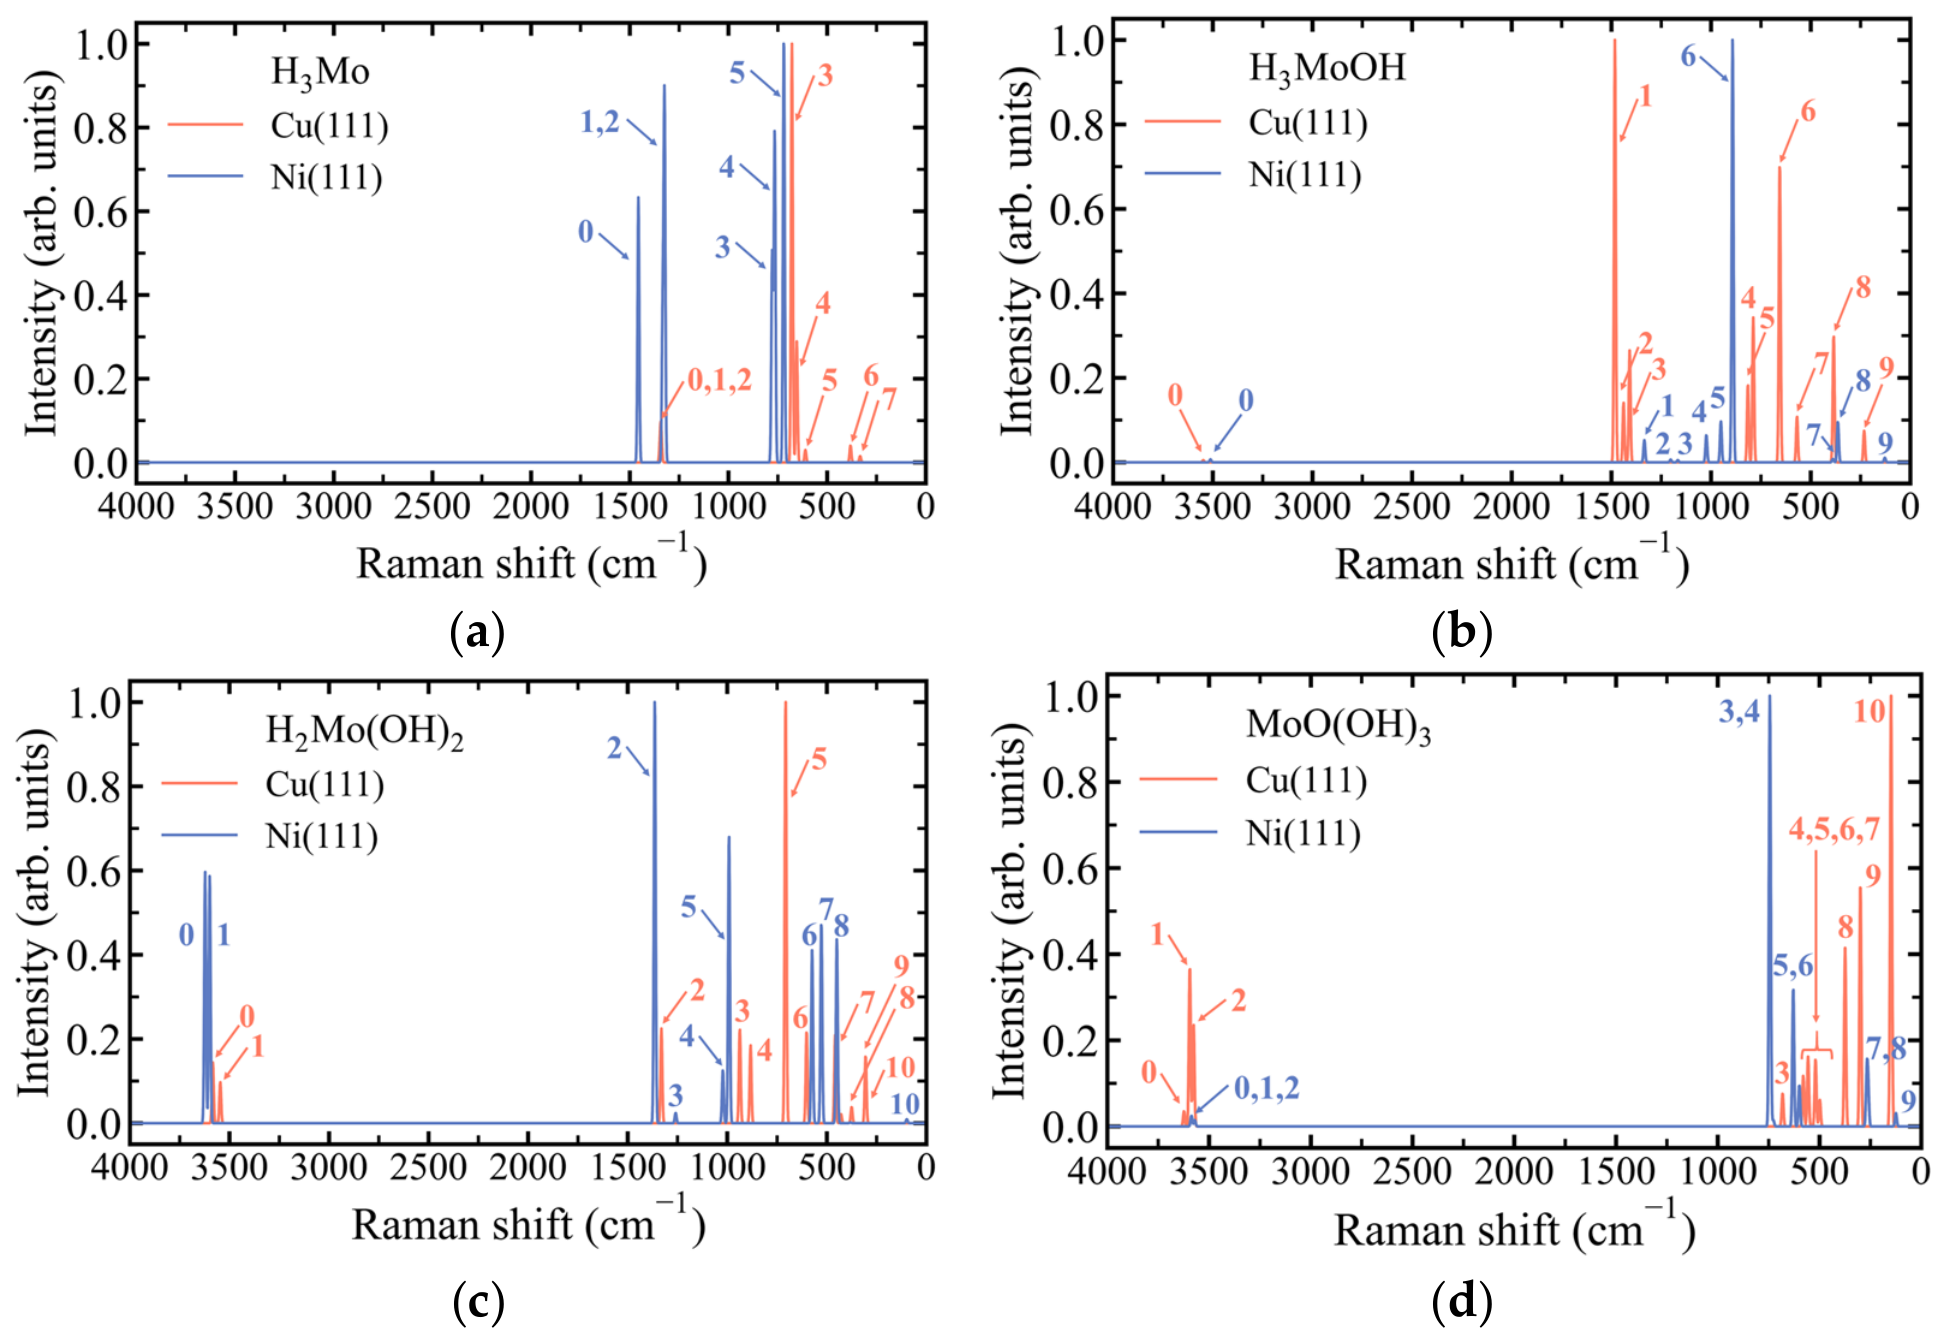
The Raman response is consistent with this interpretation (Figure 4a). The paired Mo–H stretching features display large Cu/Ni intensity contrasts (peak 0 versus 4 at 1:80, peak 1 versus 3 at 1:13, and peak 2 versus 5 at 1:20), indicating substantial modification of vibrational mode character on Ni and likely reflecting increased mixing between Mo–H stretching and H–metal motions.

3.3. Substrate-Dependent Redistribution of Mo–H Bonding and Weakly Perturbed O–H Modes in H3MoOH on Cu(111) and Ni(111)

H3MoOH contains three hydride hydrogens and one protic hydrogen, and the hydrides adopt broadly similar geometries on both surfaces (Figure 1c,h; Supplementary Information Section S2.5.3). The hydride and protic hydrogens nevertheless respond in opposite directions to the stronger adsorbate–metal hybridization on Ni: the hydride–metal distances contract slightly relative to Cu, while the protic hydrogen moves farther from the surface (Supplementary Information Section S2.5.3).
The summed H–metal bond orders indicate slightly stronger hydride–surface interactions on Ni than on Cu (Figure S3a,b). In contrast, Mo–H bond orders decrease on Ni by an average of 12.9% relative to Cu (Figure 3b), consistent with redistribution of electron density toward H–Ni interactions. Accordingly, the partial charge on Mo increases from +0.95 on Cu(111) to +1.13 on Ni(111), while the hydride charges become slightly less negative (Tables S14 and S15), indicating reduced electron density in the Mo–H bonding framework.
Vibrational spectra further show pronounced Mo–H softening and Mo–H–metal coupling on Ni. Vibrational modes on Cu between 1406 and 1487 cm−1 map onto Ni modes between 902 and 1027 cm−1 (Figure S5b), with projection scores of 0.74–0.88. Displacement patterns suggest that these modes change from predominantly Mo–H stretches on Cu to coupled Mo–H–Ni vibrations on Ni. The modest Raman intensity ratios Cu/Ni (≈1:1–3:1; Figure 4b), together with the appreciable projection scores, indicate partial preservation of mode character on both substrates.
The O–H stretching mode of the protic hydrogen remains largely unaffected by the surface because the proton resides relatively far from the slab (Supplementary Information Section S2.5.3). The O–H bond order decreases only slightly on Ni relative to Cu (2.5%), producing a modest red shift from 3544 cm−1 on Cu(111) to 3511 cm−1 on Ni(111) (Figure 3b and Figure 4b); the corresponding charge changes on the protic hydrogen and oxygen are marginal (Tables S14 and S15). The eigenmode projection score of 0.86 indicates substantial, though not complete, conservation of normal-mode character (the geometric origin of the residual reorganization is discussed in Supplementary Information Section S2.5.3), and the Raman intensity ratio remains close to unity (≈1:1; Figure 4b), supporting the assignment of analogous surface-distal O–H stretching modes on the two substrates.

3.4. Substrate-Dependent Symmetry Breaking and Loss of Vibrational Correspondence in H2Mo(OH)2 on Cu(111) and Ni(111)

H2Mo(OH)2 adopts markedly different adsorption geometries on the two substrates (Figure 1d,i; Supplementary Information Section S2.5.4). On Cu(111), the hydroxyl hydrogens lie on opposite sides of the Mo center, producing inequivalent hydroxyl groups: one oxygen interacts strongly with the surface (bond order 0.28) while the second interacts weakly (bond order < 0.05) (Figure S3c). On Ni(111), both hydroxyl groups lie on the same side of the complex and interact weakly and symmetrically with the slab (<0.10; Figure S3d).
The atomic charge distribution follows the same pattern (Tables S16 and S17). On Cu(111), the two hydroxyl groups exhibit distinct charges (O: −0.67 and −0.73; H: +0.44 and +0.41), consistent with the stronger interaction of one oxygen with the surface. In contrast, the corresponding charges on Ni(111) are identical for the two hydroxyl groups (O: −0.71 and −0.71; H: +0.45 and +0.45), reflecting the more symmetric adsorption geometry. In both cases the Mo center becomes more positively charged on Ni (1.24 → 1.38), indicating greater electron transfer to the Ni surface.
Because of these substrate-dependent bonding differences, O–H stretching manifolds cannot be consistently mapped between the two substrates for the adsorbed H2Mo(OH)2 complex. The Cu and Ni O–H modes between 3546 and 3622 cm−1 show low cross-substrate projection scores of 0.19 and 0.53 (Figure S5c), and their Raman activities differ significantly (Cu/Ni ≈ 1:6; Figure 4c), reflecting the loss of vibrational correspondence.

3.5. Substrate-Dependent Redistribution of Mo–OH Bonding and Mode-Dependent O–H Vibrational Response in MoO(OH)3 on Cu(111) and Ni(111)

MoO(OH)3 adsorption geometries remain broadly similar on both substrates (Figure 1e,j; Supplementary Information Section S2.5.5), and the overall electronic differences are modest for this complex (Tables S18 and S19): the Mo center becomes only slightly more positively charged on Ni (1.58 → 1.68), and the average oxygen charge changes only marginally (−0.69 → −0.72), consistent with the relatively small Cu/Ni difference in charge transfer (Figure 2c).
The main distinction arises from the orientation of the O–H groups and the resulting redistribution of electron density within the Mo–OH framework. The surface-proximal O–H groups associated with bonds B1 and B2 in Figure 3d point in opposite directions on Cu but align in the same direction on Ni (Figure 1e,j). In both adsorption geometries, three of the four oxygen atoms interact with the slab through the hydroxyl groups (bond orders 0.34 and 0.37 on Cu versus 0.47 and 0.47 on Ni), whereas the terminal Mo=O oxygen remains comparatively weakly coupled (0.24 on Cu versus 0.13 on Ni) (Figure S3c,d). The summed O–metal bond orders are more uneven on Cu than on Ni, indicating more localized adsorbate–surface interactions on Cu; in contrast, the nearly identical O–metal bond orders on Ni reflect more evenly distributed hybridization between the hydroxyl oxygens and the surface d-states, consistent with stronger adsorbate–metal coupling.
This redistribution of bonding is reflected in the vibrational behavior of the two surface-proximal O–H bonds. One O–H bond is slightly softened on Cu (4.7%), whereas the other is softened on Ni (2.6%) (Figure 3d). The synchronous surface-proximal O–H stretching mode (3576 cm−1 on Cu and 3586 cm−1 on Ni) involves in-phase motion of these two bonds and exhibits low eigenmode overlap (projection score 0.25; Figure S5d), reflecting its sensitivity to the different orientations of the two O–H bonds. In contrast, the asynchronous stretch (3595 cm−1 on Cu → 3568 cm−1 on Ni) involves out-of-phase motion and retains higher overlap (projection score 0.73). Notably, the synchronous mode exhibits a blue shift whereas the asynchronous mode displays a red shift, consistent with asymmetric softening of the two O–H bonds across the substrates (Figure 3d).
The surface-distal O–H stretch associated with bond B3 shows the strongest correspondence between the two substrates: mode 0 at 3623 cm−1 on Cu corresponds to mode 1 at 3572 cm−1 on Ni with a projection score of 0.97. Despite only minor bond softening on Ni (1.2%), a red shift of 51 cm−1 is observed, and the Raman intensity ratio (3:1; Figure 4d) is consistent with the assignment of analogous surface-distal O–H stretching vibrations.

3.6. Substrate-Dependent Bonding and Vibrational Trends Across Mo Complexes on Cu(111) and Ni(111)

The four Mo complexes examined in Section 3.1, Section 3.2, Section 3.3, Section 3.4 and Section 3.5 reveal a coherent substrate-dependent bonding pattern when read across geometric, electronic, and vibrational descriptors. Global geometric descriptors (centroid height, molecular size) indicate broadly similar adsorption configurations on Cu(111) and Ni(111); the substrate contrast emerges most sharply from local electronic descriptors (bond orders, atomic charges), which document stronger and more evenly distributed adsorbate–metal hybridization on Ni and more localized, distance-compensated bonding on Cu. The two descriptor families resolve the same substrate-dependent adsorbate–metal interaction at different scales. The resulting redistribution of bonding within the Mo–ligand framework leaves a direct vibrational signature: projection scores quantify the conservation of normal modes between substrates, while Raman intensities track the substrate-induced changes in vibrational character. The asymmetry that emerges is the central finding of this section: Ni preferentially softens Mo–H and O–H bonds across the hydride-containing complexes, whereas Cu more strongly perturbs the Mo–O framework—illustrated in Figure 3c, where Cu weakens one Mo–O bond of H2Mo(OH)2 more strongly than Ni, and in Figure 3d, where three of the four Mo–O bonds in MoO(OH)3 are more strongly perturbed on Cu. This substrate-dependent inversion of bonding selectivity sets the stage for the mechanistic analysis in Section 3.7 and Section 3.8.

3.7. Field-Dependent Thermodynamics and Electrochemical Stability of Mo Complexes on Cu(111) and Ni(111)

Relative Gibbs free energies ( G r e l ) under HER-relevant potential conditions were evaluated for H3Mo, H3MoOH, H2Mo(OH)2, and MoO(OH)3 adsorbed on Ni(111). The results (Table S2) are in good agreement with those reported by Bau et al. [13], with deviations below 0.06 eV for all species except H3Mo, for which a difference of 0.22 eV likely reflects its optimized adsorption geometry. Multiple initial configurations were examined, and both three- and five-layer slab models converged to the same trigonal-pyramidal structure, in which the three hydride H atoms are oriented toward the Ni surface and the Mo center sits at the apex (Figure 1g). Bau et al. report a different H3Mo conformation, with one hydride directed away from the surface; the additional H–Ni contacts in the present structure provide a plausible origin for the extra stabilization. This difference observed for H3Mo is therefore interpreted as species-specific rather than systematic.
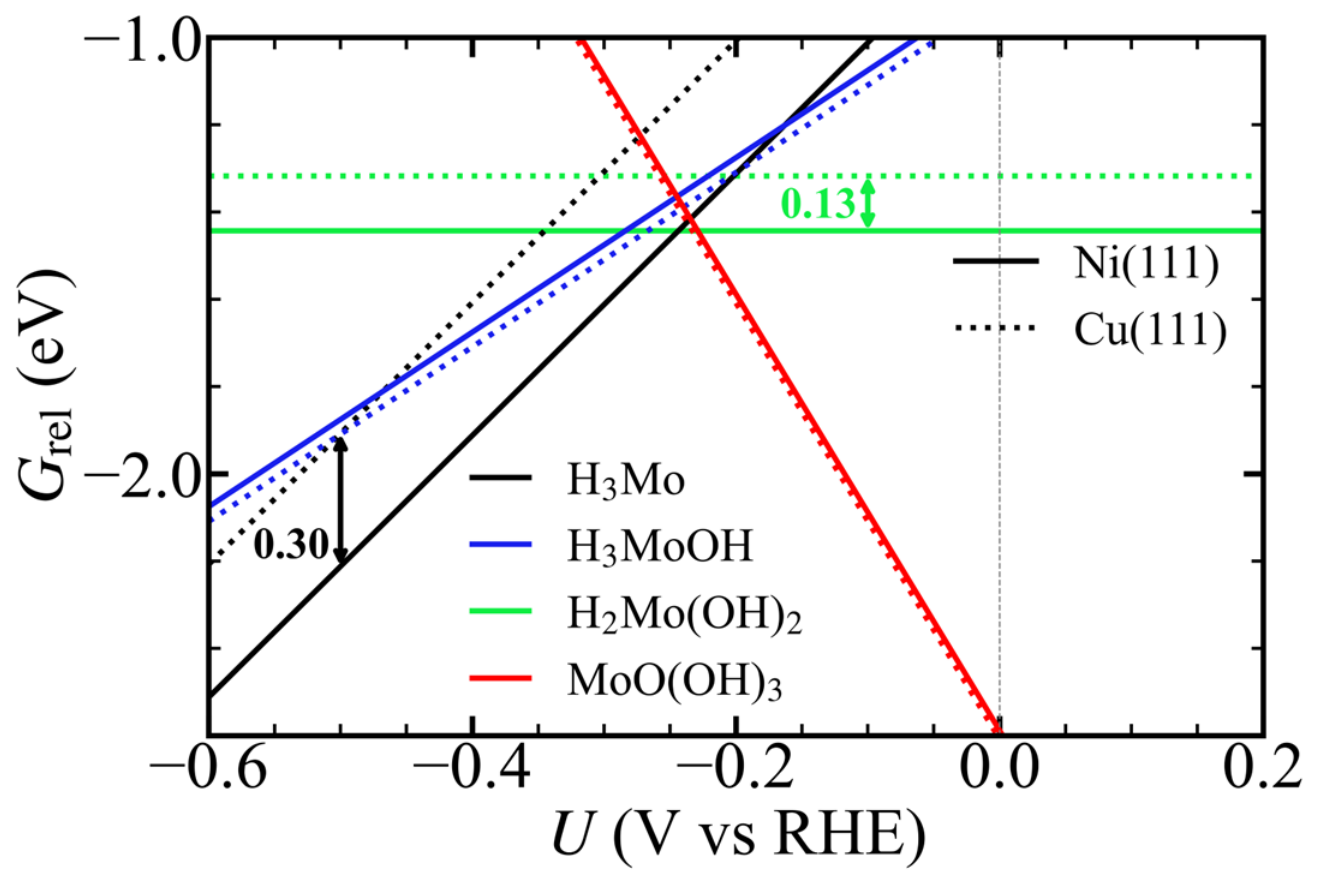
Comparison of surface Pourbaix diagrams for Ni(111) and Cu(111) (Figure 5) establishes the baseline thermodynamic differences between the two substrates. H3MoOH and MoO(OH)3 exhibit nearly identical stability on both surfaces (differences < 0.05 eV), whereas H3Mo and H2Mo(OH)2 are stabilized more strongly on Ni by 0.30 and 0.13 eV, respectively. Across the explored pH–potential space, at least one of H3Mo, H3MoOH, or MoO(OH)3 is thermodynamically preferred over H2Mo(OH)2, effectively restricting the accessible redox manifold to these three species. These baseline differences define a static thermodynamic landscape; however, under electrochemical conditions, interfacial electric fields can further modulate the relative stability of these states.
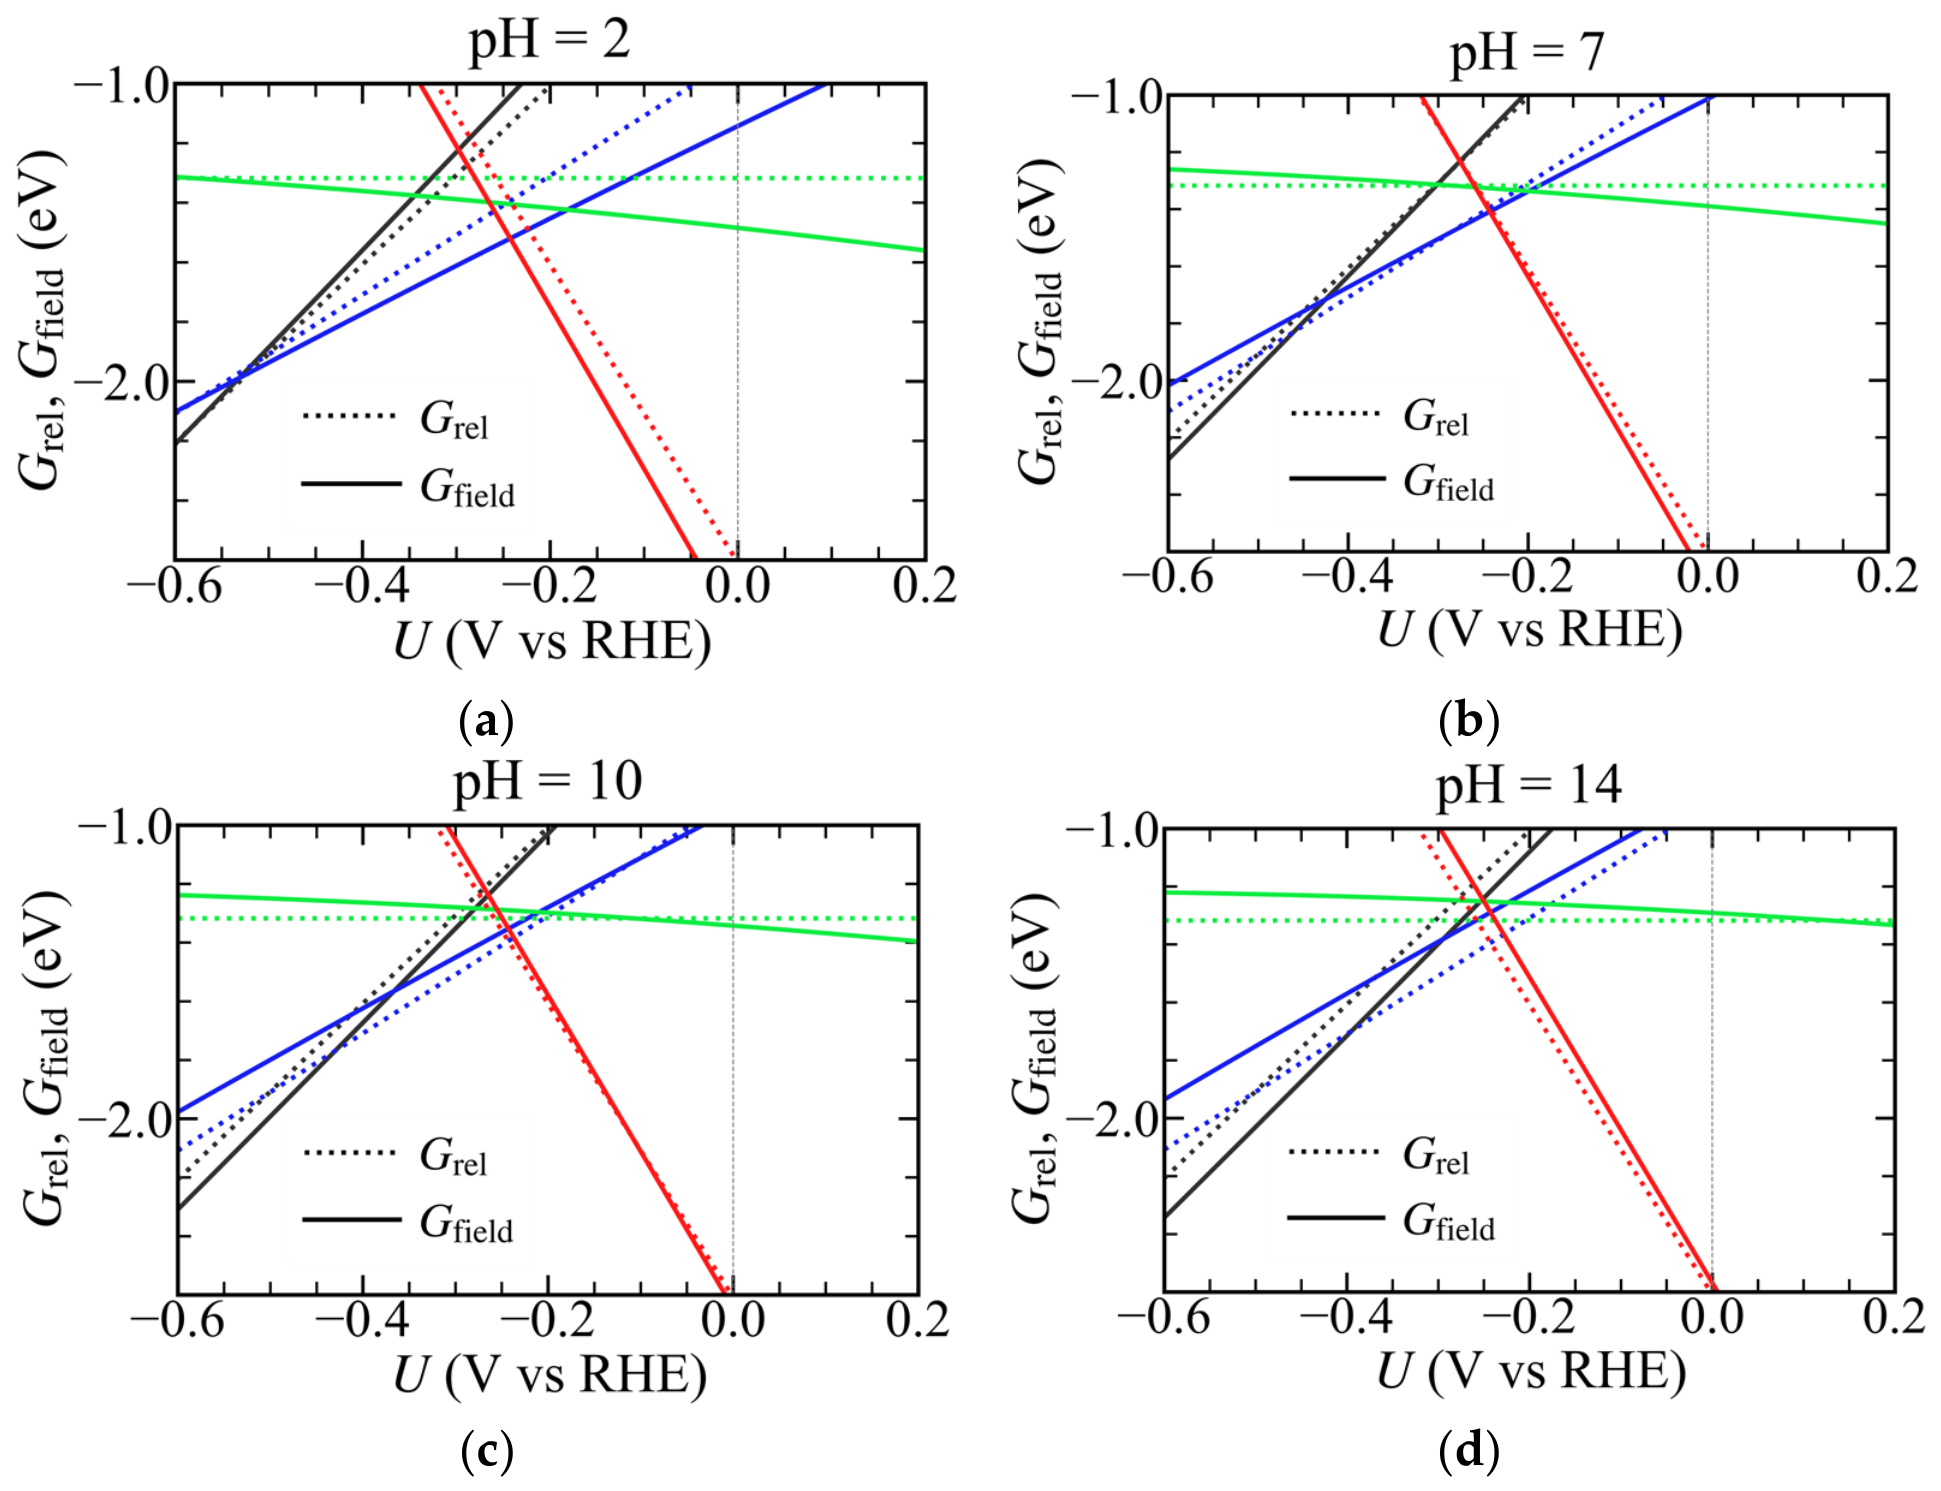
The horizontal green line for H2Mo(OH)2 in Figure 5 follows directly from its stoichiometry. Written as MoO2H4 in the MoOmHn notation, H2Mo(OH)2 has m = 2 and n = 4, so the slope coefficient (n − 2m) in Equation (3) vanishes, leaving its relative Gibbs free energy independent of the electrode potential. As a result, H2Mo(OH)2 is neither stabilized nor destabilized under cathodic bias. By contrast, the H3Mo (n − 2m = +3) and H3MoOH (n − 2m = +2) lines tilt progressively downward under cathodic bias.
To assess how these thermodynamic trends evolve under electrochemical conditions, the response of the metal–adsorbate interface to an applied electric field was examined. Charge redistribution was quantified at nine values of the external electric field between −0.8 and 0.8 V Å−1 as
Q r = Q s l a b E Q s l a b E = 0 ,
where Q s l a b is the sum of the DDEC6 atomic charges on the metal slab. Thus, Q r quantifies the field-induced change in slab charge relative to the zero-field configuration.
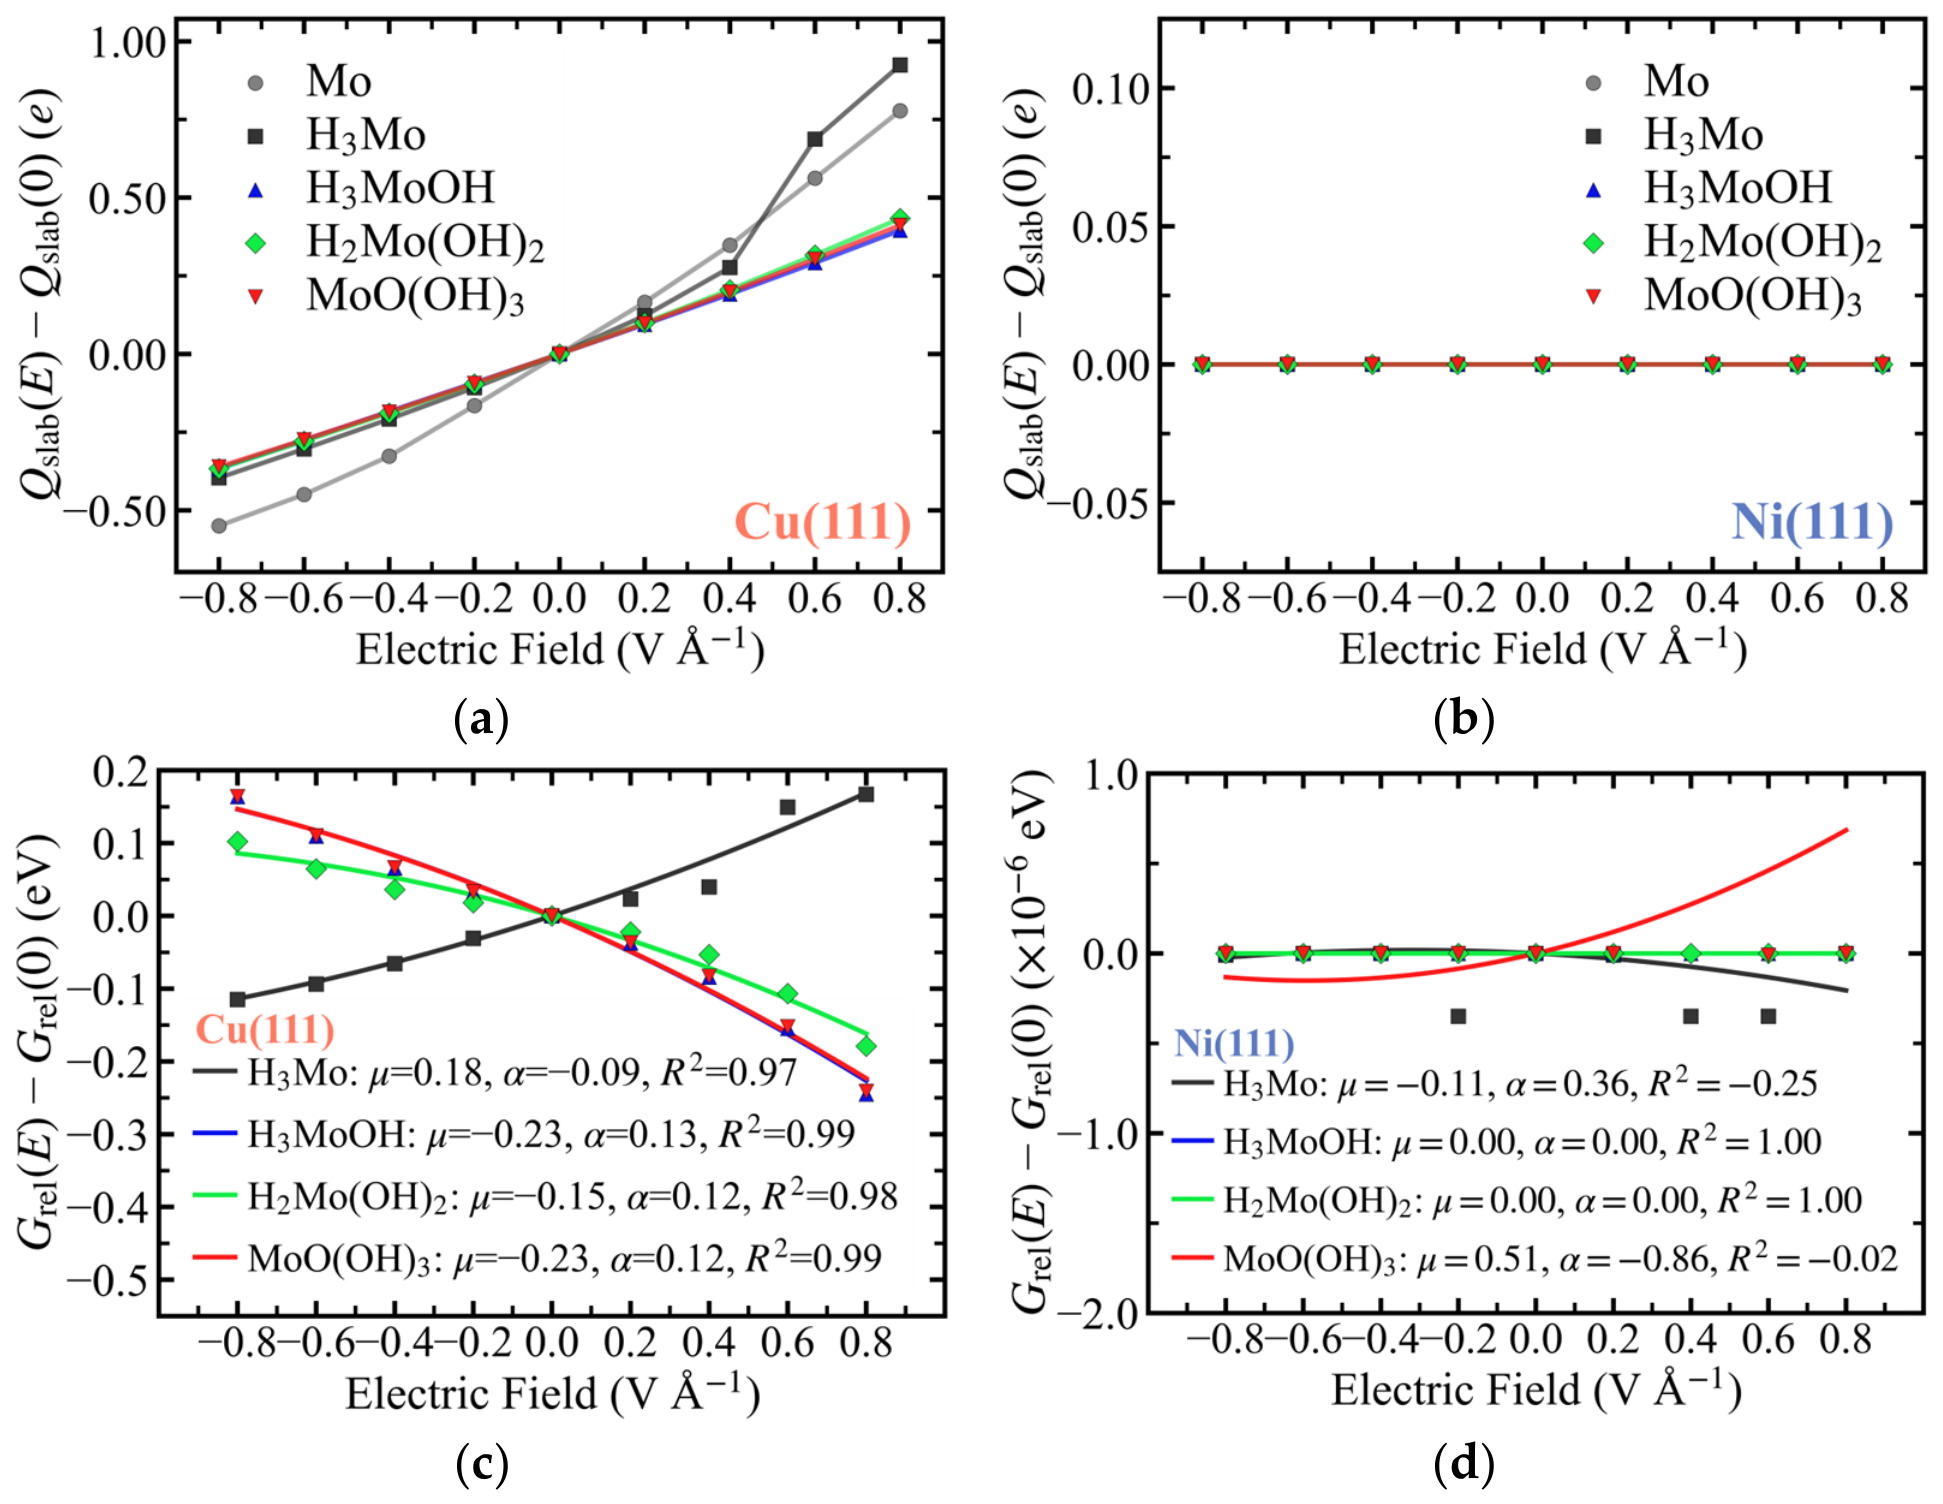
On Cu(111), Q r exhibits a quasi-linear dependence on the applied field within the weak-field regime (−0.4 to 0.4 V Å−1), spanning −0.33 to 0.35 e for Mo (minimum–maximum values within this window), while pronounced nonlinearity emerges beyond ±0.6 V Å−1 (Figure 6a,b). In contrast, on Ni(111), Q r remains effectively zero over the entire field range (−0.8 to 0.8 V Å−1) for all systems, with variations within the numerical resolution of the charge analysis (|ΔQ| < 0.01 e) [40].
This contrast reflects fundamental differences in adsorbate–surface bonding. Within the d-band framework [55,58], the Ni(111) d-band center lying closer to the Fermi level than that of Cu(111) suggests enhanced adsorbate–surface hybridization. The resulting larger adsorption-induced charge transfer on Ni (Figure 2c) yields a more strongly polarized interface and, consequently, diminished sensitivity to external perturbations (Figure 6b), likely reinforced by more delocalized bonding (Figure S3) that contributes to field screening. In contrast, the less polarized (Figure 2c), more localized bonding on Cu (Figure S3) leaves the interface more susceptible to field-induced charge redistribution (Figure 6a). This picture is supported by the planar-averaged field-induced charge-density difference Δρ(z) (Figure S6): Cu(111) shows pronounced charge accumulation and depletion near the adsorbate–surface region, consistent with the finite μ and α values reported above, whereas Ni(111) exhibits only weak redistribution, in line with its nearly field-invariant free energies. The d-band picture and the Δρ(z) analysis thus offer a physically motivated explanation of the observed trends, though the present calculations do not explicitly resolve dielectric screening, potential-dependent surface charge density, or the full Helmholtz interface dipole, which would require constant-potential simulations with explicit double-layer structure. The field-induced slab charge response, μ, α, and Δρ(z) (Figure S6) should therefore be viewed as internal, model-specific descriptors of interfacial response within this framework.
Consistent with this contrasting charge response, two distinct energetic regimes emerge in the field-dependent free energies. On Ni(111), the relative Gibbs free energies remain invariant with applied field, yielding μ and α that are effectively zero within numerical precision. On Cu(111), in contrast, G f i e l d displays a clear field dependence.
Quadratic fitting of the field-dependent energies using Equation (4) over the full ±0.8 V Å−1 field range yields μ values of 0.15–0.24 eÅ for all Cu-supported complexes. The corresponding α values are approximately 0.12 eÅ2V−1 for H3MoOH, H2Mo(OH)2, and MoO(OH)3, and lower (0.09 eÅ2V−1) for H3Mo (insets of Figure 6c,d). Notably, H3Mo exhibits dipole and polarizability values of opposite signs relative to the other complexes, defining two distinct electrostatic response regimes. These parameters, extracted from the field-dependent form of G r e l , represent effective descriptors of interfacial electrostatic coupling rather than intrinsic molecular properties.
To assess the robustness of the field-correction procedure, additional fits were performed over the narrower ±0.4 and ±0.6 V Å−1 field ranges (Figure S2), motivated by the quasi-linear charge response on Cu(111) within ±0.4 V Å−1. Although the magnitudes of μ and α vary modestly, the resulting 2D Pourbaix diagrams (Figure S7) and cross-metal trends remain largely unchanged (Figures S8 and S9). Similarly, varying the Helmholtz capacitance CH from 0.20 to 0.60 F m−2 [20] alters the magnitude of the field-induced shifts by up to 0.45 eV but does not affect their direction or relative ordering (Table S20). The field-induced shifts in relative Gibbs free energy discussed in the present work were computed using CH = 0.25 F m−2 following Kelly et al. [20]. The interfacial field further depends on the assumed potential of zero charge, U P Z C . To interrogate the sensitivity of the field-corrected Pourbaix landscapes to this parameter, U P Z C was perturbed by ±0.30 V about the reference value. The resulting modifications primarily shift the stability boundaries within pH–potential space while preserving the overall topology: the characteristic three-regime sequence (H3Mo/H3MoOH/MoO(OH)3) and the potential-dependent energetic ordering of the complexes are preserved across the explored U P Z C range, and no additional stability domain appears (Figures S10 and S11).
The thermodynamic impact of electrostatic coupling is illustrated in Figure 7, which compares zero-field relative Gibbs free energies (dotted lines) with field-corrected profiles (solid lines) on Cu(111). G f i e l d shifts reach up to 0.25 eV across the examined pH range, stabilizing H3Mo and destabilizing oxygenated species under alkaline conditions. In contrast, Ni(111) exhibits negligible field-induced changes, reflecting its screened interfacial response.
The magnitude of these field-induced shifts on Cu is comparable to the intrinsic substrate-dependent differences observed at zero field (e.g., 0.30 eV for H3Mo), demonstrating that electrostatic effects constitute a thermodynamic contribution on par with substrate identity. Thus, the relative stability of Mo intermediates on Cu is not fixed but evolves dynamically with pH and potential.
The resulting changes in relative stability are reflected in the 2D Pourbaix diagram (Figure S7). At pH 0, the stability sequence with increasing potential is H3Mo → H3MoOH → MoO(OH)3, while H2Mo(OH)2 exhibits no stability domain despite negative G f i e l d values. Across all conditions, H2Mo(OH)2 is outranked by at least one of H3Mo, H3MoOH, or MoO(OH)3. The field correction does not invert this ordering: the fitted μ and α of H2Mo(OH)2 are comparable to those of its two competitors (Table S4), so all three experience field-induced free-energy shifts of similar magnitude, leaving H2Mo(OH)2 without a stability domain under any of the examined pH–potential conditions. A transient kinetic role as a Mo3+ intermediate cannot be excluded; however, resolving it would require barrier and transition-state calculations beyond the present scope.
With increasing pH, the stability region of H3Mo expands, whereas that of H3MoOH contracts. The H3Mo/H3MoOH boundary shifts with both pH and potential, whereas the H3MoOH/MoO(OH)3 boundary remains horizontal, indicating negligible pH sensitivity of that transition. Within the double-layer capacitor framework described by Equation (6), the pH dependence of the stability boundaries originates from pH-induced modulation of the interfacial electric field and its coupling to the adsorption-induced dipole moment and polarizability, as expressed in Equation (4). At the H3MoOH/MoO(OH)3 boundary, the condition G f i e l d H 3 M o O H = G f i e l d M o O O H 3 leads to a quadratic expression in the potential U and pH through the electric field terms E and E2, whose coefficients are Δµ and Δα, respectively. Because the fitted dipole moments and polarizabilities of the two complexes are very similar (μ ≈ 0.23 eÅ, α ≈ 0.12 eÅ2V−1, Figure 6c), the coefficients associated with the field-dependent, and therefore pH-dependent, terms are close to zero. As a result, the boundary effectively reduces to a function of potential only, producing the observed horizontal line. In contrast, the distinct electrostatic responses of H3Mo and H3MoOH generate finite field-coupling terms, leading to the oblique, pH-dependent H3Mo/H3MoOH boundary.
Overall, these results demonstrate that Cu introduces a field-sensitive thermodynamic response absent on Ni, enabling electrostatic modulation of Mo-centered redox equilibria under operating conditions. The magnitude of this effect is comparable to intrinsic substrate-dependent stabilization, establishing electrostatic coupling as a key factor in determining the thermodynamic landscape of Mo-based HER intermediates.

3.8. Contrasting Roles of Ni and Cu in Governing Mo-Centered Redox Thermodynamics and Reactivity in Ni–Mo HER

In the Mo3+–hydride framework proposed by Bau et al. [13,14,15], HER proceeds through interconversion of oxygenated Mo4+ precursors and reduced hydride-containing Mo3+ species under cathodic bias, with the metallic substrate acting primarily as a modulator of relative state stability rather than as an independent catalytic center. In the following paragraphs, reactivity within this framework is discussed indirectly through trends in thermodynamic stabilization, bond softening, and field response, rather than through explicit transition-state calculations.
Under zero-field conditions, adsorption energetics establish a clear baseline distinction between the two substrates. Hydrogen-rich intermediates are systematically more stable on Ni(111), as reflected in adsorption-energy differences E a d s = E a d s N i E a d s C u of −0.67 eV for H3Mo, −0.35 eV for H3MoOH, and −0.52 eV for H2Mo(OH)2 relative to Cu(111) (Figure 2d), and in the greater stability of H3Mo and H2Mo(OH)2 by 0.30 and 0.13 eV, respectively, in relative Gibbs free energy (Figure 5). The magnitude of these energetic differences tracks the geometric response of each complex to the substrate change: H3Mo, which exhibits a 6.4% expansion on Ni (Figure 2b), and H2Mo(OH)2, which adopts distinct symmetries on Ni and Cu (Figure 1d,i), show the largest adsorption-energy differences, whereas H3MoOH and MoO(OH)3, which retain similar geometries on both surfaces (Figure 1c,h and Figure 1e,j, respectively), exhibit smaller gaps (−0.35 and −0.45 eV, respectively). This stronger stabilization is accompanied by enhanced bond softening: all three Mo–H bonds in H3Mo are weakened by approximately 20% on Ni relative to Cu, those in H3MoOH by approximately 13%, and those in H2Mo(OH)2 by approximately 2%, with O–H bonds following a similar but smaller trend (Figure 3a–c). These results indicate that Ni stabilizes hydrogen-rich intermediates while simultaneously increasing Mo–H lability within the reduced manifold, demonstrating that stronger adsorption does not imply a more rigid hydride framework.
In contrast, Cu perturbs the oxygen-coordinated manifold more strongly. Bond-softening analysis shows that three of the four Mo–O bonds in MoO(OH)3 are weakened more strongly on Cu than on Ni, and that in H2Mo(OH)2 the Mo–O response is asymmetric, with one bond weakened more strongly on Cu (20.6%) and the other on Ni (12.5%) (Figure 3c,d), consistent with stronger destabilization of oxygen-bound configurations on Cu. This effect is reflected in adsorption energetics: MoO(OH)3 is less stable than H3MoOH by 0.82 eV on Cu, compared to 0.71 eV on Ni, indicating a slightly larger energetic separation between oxidized and reduced states on Cu. Despite this difference, the relative Gibbs free energies of both species remain nearly identical across the two substrates (Figure 5), with cross-metal differences below 0.03 eV. This apparent insensitivity arises from the definition of G r e l , which references adsorbed Mo and therefore cancels part of the substrate-dependent baseline stabilization. Adsorption energies thus more clearly capture the substrate effect, revealing that Cu perturbs the internal thermodynamic spacing of the Mo3+/Mo4+ couple more strongly than Ni, consistent with the Cu–Mo redox cooperation proposed by Nishimoto et al. [1].
These static trends define a thermodynamic manifold in which the relevant competition is effectively confined to H3Mo, H3MoOH, and MoO(OH)3. Within this landscape, H2Mo(OH)2 occupies an intermediate position on the adsorption-energy ladder between MoO(OH)3 and H3MoOH (Figure 2d) and exhibits mixed bonding characteristics, combining weak Mo–H softening with asymmetric Mo–O perturbation (Figure 3c). At the same time, its relative Gibbs free energy remains nearly potential-independent, appearing as horizontal lines in the 1D Pourbaix diagrams (Figure 5). These features suggest that H2Mo(OH)2 may act as a thermodynamic bridge between oxygenated and hydride states, although its precise role within the operative HER mechanism cannot be established without explicit transition-state analysis.
The distinction between the two substrates becomes more pronounced when electrostatic effects are considered. The thermodynamic separation between Cu(111) and Ni(111) is strongly modulated by potential and pH through the interfacial electric field, with a markedly stronger response on Cu than on Ni. This behavior can be rationalized in terms of adsorbate–surface bonding: Cu exhibits more localized and uneven interactions, whereas Ni displays more distributed bonding and stronger hybridization, which enhances baseline stabilization but reduces sensitivity to external perturbations.
This heightened field sensitivity on Cu strongly influences the accessible Mo redox manifold, which, based on the oxidation-state assignments of Bau et al. [13], includes H3Mo (Mo2+), H3MoOH and H2Mo(OH)2 (Mo3+), and MoO(OH)3 (Mo4+). However, the surface Pourbaix diagram on Cu(111) (Figure S7) narrows this space to H3Mo, H3MoOH, and MoO(OH)3, with H2Mo(OH)2 excluded under relevant conditions. Because the Mo3+/Mo4+ interconversion underpins the Mo3+–hydride mechanism, the analysis centers on the H3MoOH/MoO(OH)3 redox couple. Figure S9 shows that this pair undergoes pronounced potential- and pH-dependent stabilization relative to Ni, leading to a crossover in which Cu becomes thermodynamically favored: at −0.40 V versus RHE, this preference is limited to acidic to near-neutral conditions (pH < 7; Figure S9a), whereas at −0.10 V it extends up to pH ≈ 12 (Figure S9d). These trends demonstrate that the Mo3+/Mo4+ thermodynamic balance is field-tunable on Cu. Consistent with this picture, enhanced performance for Ni–Mo(Cu) catalysts under moderately alkaline environments has been reported [1], suggesting that such electrostatic modulation may be relevant under operando conditions.
Although increasing pH stabilizes H3Mo on Cu, the field perturbation is insufficient to overcome the substantial baseline thermodynamic gap (Figures S8 and S9), indicating that electrostatic effects modulate but do not fully override the stronger intrinsic stabilization on Ni. H2Mo(OH)2 follows a similar trend, remaining favored on Ni across most conditions, except within a narrow regime at U R H E   = −0.10 V and pH < 2.4 (Figure S9d), where it becomes more stable on Cu.
Taken together, these results show that Ni and Cu influence the Mo-centered HER manifold through distinct yet complementary mechanisms. Ni primarily stabilizes hydrogen-rich intermediates through strong electronic coupling while enhancing Mo–H bond lability, whereas Cu selectively destabilizes oxygen-coordinated states and enables field-dependent tuning of the Mo3+/Mo4+ thermodynamic balance. Because the present analysis does not provide activation barriers for the elementary Volmer, Heyrovsky, or Tafel steps, the calculated redox thermodynamics should not be interpreted as direct predictions of HER rates. The Pourbaix diagrams identify the pH–potential conditions under which Mo redox/hydride states become thermodynamically accessible, while the bond-order analysis provides qualitative information on Mo–H and Mo–O bond lability. Within this scope, Ni(111)-induced Mo–H weakening may be relevant to subsequent hydride-transfer or H2-forming steps, whereas the stronger field response and Mo–O bond weakening on Cu(111) suggest a role in tuning the Mo3+/Mo4+ speciation balance within the Mo3+-centered HER mechanism [13,14,15]. A quantitative connection to hydrogen-evolution rates will require explicit free-energy barrier and transition-state calculations.

4. Conclusions

Mo complexes adsorbed on Cu(111) and Ni(111) exhibit substrate-dependent electronic structure and thermodynamic behavior that extend beyond simple differences in adsorption strength to include electrostatic modulation of redox energetics. Although Ni(111) promotes greater interfacial charge transfer and stronger overall adsorption, the key thermodynamic distinction lies in the electrochemical response of the Mo-centered redox states. Across the examined pH–potential range, at least one of H3Mo, H3MoOH, or MoO(OH)3 remains thermodynamically favored over H2Mo(OH)2 on both substrates. However, only Cu(111) displays measurable pH-dependent field-corrected relative Gibbs free-energy shifts on the RHE scale, reaching 0.25 eV. The magnitude of this field-driven modulation is comparable to the intrinsic substrate-induced differences in zero-field relative Gibbs free energy, indicating that Cu incorporation does more than tune hydrogen binding: it also reshapes the Mo redox landscape through its electrostatic response.
Preferential Mo–O bond weakening on Cu(111) is consistent with greater thermodynamic destabilization of the oxidized MoO(OH)3 state relative to the reduced H3MoOH state, thereby increasing the adsorption-energy separation between these redox states compared to Ni(111). In contrast, preferential softening of Mo–H and O–H bonds on Ni(111) indicates enhanced hydrogen-ligand lability despite stronger adsorption stabilization, reflecting more extensive redistribution of charge within the Mo–ligand framework. Vibrational analysis further shows that even modest geometric differences can reorganize surface-proximal normal modes through substrate-specific bond-order redistribution, whereas surface-distal O–H modes remain largely conserved across the two surfaces.
Collectively, these results establish that Cu modifies Mo-centered redox thermodynamics through electrostatic field effects whose magnitude is comparable to intrinsic substrate differences, while Ni primarily stabilizes hydrogen-rich intermediates and enhances Mo–H bond lability. These findings imply that substrate identity governs not only the static ordering of Mo oxidation states but also their field sensitivity under operating conditions, underscoring the need for explicit free-energy and transition-state analyses to assess the kinetic consequences for hydride transfer and hydrogen-evolution rates in Cu-containing Ni–Mo HER systems.

Supplementary Materials

The following supporting information can be downloaded at: https://www.mdpi.com/article/10.3390/surfaces9020051/s1. Figure S1: Slab models (a) Ni(111) and (b) Cu(111). Each model consists of a 4 × 4 supercell with a vacuum thickness of 17 Å.; Figure S2: Field-induced free-energy changes G f i e l d ( E ) for MoOmHn complexes adsorbed on Cu(111); Figure S3: Sum of DDEC6 bond orders (BO) between adsorbate hydrogen and oxygen atoms and all slab atoms: (a) H–Cu(111), (b) H–Ni(111), (c) O–Cu(111), and (d) O–Ni(111); Figure S4: Projected density of states of slab d-states for (a) clean surfaces and upon adsorption of (b) Mo, (c) H3Mo, (d) H3MoOH, (e) H2Mo(OH)2, and (f) MoO(OH)3 on Cu(111) (orange) and Ni(111) (blue); Figure S5: Pairwise overlap matrix of unit-normalized displacement vectors for vibrational modes of Mo complexes adsorbed on Cu(111) (y-axis) and Ni(111) (x-axis) from the Cross-System Eigenmode Mapping (CSEM) analysis: (a) H3Mo, (b) H3MoOH, (c) H2Mo(OH)2 and (d) MoO(OH)3; Figure S6: Planar-averaged field-induced charge-density difference, Δρ(z), for representative H3MoOH and MoO(OH)3 adsorbed on Cu(111) (top) and Ni(111) (bottom): (a) Cu–H3MoOH, (b) Cu–MoO(OH)3, (c) Ni–H3MoOH, and (d) Ni–MoO(OH)3; Figure S7: Two-dimensional (2D) surface Pourbaix diagram (TAIP map) on the reversible hydrogen electrode (RHE) scale for H3Mo, H3MoOH, H2Mo(OH)2, and MoO(OH)3 adsorbed on Cu(111); Figures S8 and S9: Difference between the electric field-corrected relative Gibbs free energies on Cu(111), G f i e l d C u , and the zero-field relative Gibbs free energies on Ni(111), G r e l N i , for Mo complexes as a function of pH at (a) U R H E = 0.40   V , (b) U R H E = 0.30   V , (c) U R H E = 0.24   V , and (d) U R H E = 0.10   V ; Figure S10: Sensitivity of the field-corrected electrochemical stability diagram (TAIP map) of Mo complexes adsorbed on Cu(111) to the potential of zero charge U P Z C ; Figure S11: Relative stability of Mo complexes on Cu(111) versus Ni(111) as a function of pH. Table S1: Mo DDEC6 partial charges at zero electric field on Cu(111) and Ni(111), Cu − Ni difference (Δ), reference Mo Bader charges on Ni(111) from Bau et al., and assigned formal oxidation states for the four MoOmHn intermediates; Table S2: Comparison of relative Gibbs free energies of Mo complexes adsorbed on Ni(111) with reference data from Bau et al.; Table S3: Fitted dipole moment μ, polarizability α, and coefficient of determination R2 obtained from least-squares fits of G f i e l d ( E ) to μ · E ( α / 2 ) · E 2 over the full ±0.8 V Å−1 field range on Cu(111); Table S4: Fitting-window robustness of μ, α, and R2 across ±0.8, ±0.6, and ±0.4 V Å−1 field ranges on Cu(111); Table S5: Bond lengths of the Mo adatom on Ni(111) and Cu(111) surfaces; Tables S6–S9: Bond lengths of the H3Mo/H3MoOH/H2Mo(OH)2/MoO(OH)3 adsorbed on Ni(111) and Cu(111) surfaces; Tables S10 and S11: DDEC6 charge distribution of the Mo adatom on Cu(111) and Ni(111). Tables S12–S19: DDEC6 charge distribution of H3Mo/H3MoOH/H2Mo(OH)2/MoO(OH)3 adsorbed on Cu(111) and Ni(111); Table S20: Average shifts in the electric field-corrected relative Gibbs free energy G f i e l d ¯ of Mo complexes adsorbed on Cu(111) across the full pH range for different Helmholtz capacitance (CH) values. References [13,20,21] are cited in the Supplementary Materials.

Author Contributions

Conceptualization, D.S.R.R. and T.I.; methodology, D.S.R.R., E.M.K., Y.K. and T.I.; software, E.M.K.; validation, D.S.R.R., Y.K. and T.I.; formal analysis, E.M.K.; investigation, E.M.K.; resources, T.I.; data curation, E.M.K.; writing—original draft preparation, E.M.K.; writing—review and editing, D.S.R.R. and Y.K.; visualization, E.M.K.; supervision, T.I.; project administration, T.I.; funding acquisition, T.I. All authors have read and agreed to the published version of the manuscript.

Funding

This research was funded by the Japan Science and Technology Agency (JST) through the GteX (Green Technologies of Excellence) Program, grant number JPMJGX23H2.

Institutional Review Board Statement

Not applicable.

Informed Consent Statement

Not applicable.

Data Availability Statement

The data supporting the findings of this study are available within the Supporting Information and in a publicly accessible repository at https://doi.org/10.5281/zenodo.19535353.

Conflicts of Interest

The authors declare no conflicts of interest. The funders had no role in the design of the study; in the collection, analyses, or interpretation of data; in the writing of the manuscript; or in the decision to publish the results.

Abbreviations

The following abbreviations are used in this manuscript:
1DOne-dimensional
2DTwo-dimensional
CHEComputational Hydrogen Electrode
CSEMCross-System Eigenmode Mapping
DDECDensity Derived Electrostatic and Chemical (method)
DFTDensity Functional Theory (method)
HERHydrogen Evolution Reaction
PBEPerdew–Burke–Ernzerhof (functional)
PZCPotential of Zero Charge
RHEReversible Hydrogen Electrode
RPBERevised Perdew–Burke–Ernzerhof (functional)
SHEStandard Hydrogen Electrode
TAIPTessellated Ab Initio Pourbaix (analysis)
VASPVienna Ab initio Simulation Package

References

  1. Nishimoto, T.; Obata, K.; Komiya, H.; Naito, T.; Harada, K.; Yoshida, M.; Takanabe, K. Oxidized Copper and Molybdenum Species Exclusively Boosting Electrocatalytic Hydrogen Evolution in Non-Extreme pH Carbonate Buffer Electrolyte. ACS Catal. 2023, 13, 14725–14736. [Google Scholar] [CrossRef]
  2. Miao, F.; Cui, P.; Yu, S.; Gu, T. In situ fabrication of a 3D self-supported porous Ni–Mo–Cu catalyst for an efficient hydrogen evolution reaction. Dalton Trans. 2023, 52, 8654–8660. [Google Scholar] [CrossRef] [PubMed]
  3. Wu, X.; Li, Z.; Wang, H.; Wang, J.; Xi, G.; Zhao, X.; Zhang, C.; Liao, W.; Ho, J.C. Defect-Engineered Multi-Intermetallic Heterostructures as Multisite Electrocatalysts for Efficient Water Splitting. Adv. Sci. 2025, 12, e2502244. [Google Scholar] [CrossRef] [PubMed]
  4. Luo, M.; Yang, J.; Li, X.; Eguchi, M.; Yamauchi, Y.; Wang, Z.-L. Insights into alloy/oxide or hydroxide interfaces in Ni–Mo-based electrocatalysts for hydrogen evolution under alkaline conditions. Chem. Sci. 2023, 14, 3400–3414. [Google Scholar] [CrossRef] [PubMed]
  5. Du, W.; Shi, Y.; Zhou, W.; Yu, Y.; Zhang, B. Unveiling the In Situ Dissolution and Polymerization of Mo in Ni4Mo Alloy for Promoting the Hydrogen Evolution Reaction. Angew. Chem. Int. Ed. Engl. 2021, 60, 7051–7055. [Google Scholar] [CrossRef]
  6. Liu, F.; Shi, C.; Guo, X.; He, Z.; Pan, L.; Huang, Z.; Zhang, X.; Zou, J. Rational Design of Better Hydrogen Evolution Electrocatalysts for Water Splitting: A Review. Adv. Sci. 2022, 9, e2200307. [Google Scholar] [CrossRef]
  7. Zhao, L.; Zhang, Y.; Zhao, Z.; Zhang, Q.-H.; Huang, L.-B.; Gu, L.; Lu, G.; Hu, J.-S.; Wan, L.-J. Steering elementary steps towards efficient alkaline hydrogen evolution via size-dependent Ni/NiO nanoscale heterosurfaces. Natl. Sci. Rev. 2020, 7, 27–36. [Google Scholar] [CrossRef]
  8. Shen, L.; Lu, B.; Li, Y.; Liu, J.; Huang-Fu, Z.; Peng, H.; Ye, J.; Qu, X.; Zhang, J.; Li, G.; et al. Interfacial Structure of Water as a New Descriptor of the Hydrogen Evolution Reaction. Angew. Chem. Int. Ed. Engl. 2020, 59, 22397–22402. [Google Scholar] [CrossRef]
  9. Liu, E.; Qin, X.; Delmo, E.P.; Shao, M.; Vegge, T.; Drisdell, W.S. Discovering the Catalytic Role of Interfacial Water Towards Hydrogen Evolution/Oxidation Reactions in Aqueous Solutions. In Proceedings of the Electrochemical Society Meeting Abstracts Prime2024; The Electrochemical Society, Inc.: Pennington, NJ, USA, 2024; Volume MA2024-02, p. 2822. [Google Scholar] [CrossRef]
  10. Sun, M.; Staykov, A.; Yamauchi, M. Understanding the Roles of Hydroxide in CO2 Electroreduction on a Cu Electrode for Achieving Variable Selectivity. ACS Catal. 2022, 12, 14856–14863. [Google Scholar] [CrossRef]
  11. Guha, A.; Sahoo, M.; Alam, K.; Rao, D.K.; Sen, P.; Narayanan, T.N. Role of water structure in alkaline water electrolysis. iScience 2022, 25, 104835. [Google Scholar] [CrossRef]
  12. Zhang, B.; Yao, J.; Liu, J.; Zhang, T.; Wan, H.; Wang, H. Reducing the pH dependence of hydrogen evolution kinetics via surface reactivity diversity in medium-entropy alloys. EES Catal. 2023, 1, 1017–1024. [Google Scholar] [CrossRef]
  13. Bau, J.A.; Kozlov, S.M.; Azofra, L.M.; Ould-Chikh, S.; Emwas, A.-H.; Idriss, H.; Cavallo, L.; Takanabe, K. Role of Oxidized Mo Species on the Active Surface of Ni–Mo Electrocatalysts for Hydrogen Evolution under Alkaline Conditions. ACS Catal. 2020, 10, 12858–12866. [Google Scholar] [CrossRef]
  14. Bau, J.A.; Ahmad, R.; Cavallo, L.; Rueping, M. A Unified Theory for H2 Evolution on Mo-Based Electrocatalysts. ACS Energy Lett. 2022, 7, 3695–3702. [Google Scholar] [CrossRef]
  15. Bau, J.A.; Emwas, A.-H.; Nikolaienko, P.; Aljarb, A.A.; Tung, V.; Rueping, M. Mo3+ hydride as the common origin of H2 evolution and selective NADH regeneration in molybdenum sulfide electrocatalysts. Nat. Catal. 2022, 5, 397–404. [Google Scholar] [CrossRef]
  16. Zhao, Y.; Zhang, J.; Zhang, W.-S.; Wu, A.-L. Growth of Ni/Mo/Cu on carbon fiber paper: An efficient electrocatalyst for hydrogen evolution reaction. Int. J. Hydrogen Energy 2021, 46, 35550–35558. [Google Scholar] [CrossRef]
  17. Yang, S.; Zhang, Z.; Oliveira, A.M.; Xi, S.; Zhiani, M.; Zhang, J.; Tu, Z.; Xiao, F.; Wang, S.; Yan, Y.; et al. Accelerating Hydrogen Desorption of Nickel Molybdenum Cathode via Copper Modulation for Pure-Water-Fed Hydroxide Exchange Membrane Electrolyzer. Adv. Funct. Mater. 2024, 34, 2313275. [Google Scholar] [CrossRef]
  18. Hansen, H.A.; Rossmeisl, J.; Nørskov, J.K. Surface Pourbaix diagrams and oxygen reduction activity of Pt, Ag and Ni(111) surfaces studied by DFT. Phys. Chem. Chem. Phys. 2008, 10, 3722–3730. [Google Scholar] [CrossRef]
  19. Nørskov, J.K.; Rossmeisl, J.; Logadottir, A.; Lindqvist, L.; Kitchin, J.R.; Bligaard, T.; Jónsson, H. Origin of the Overpotential for Oxygen Reduction at a Fuel-Cell Cathode. J. Phys. Chem. B 2004, 108, 17886–17892. [Google Scholar] [CrossRef]
  20. Kelly, S.R.; Kirk, C.; Chan, K.; Nørskov, J.K. Electric Field Effects in Oxygen Reduction Kinetics: Rationalizing pH Dependence at the Pt(111), Au(111), and Au(100) Electrodes. J. Phys. Chem. C 2020, 124, 14581–14591. [Google Scholar] [CrossRef]
  21. Liu, H.; Zhang, D.; Wang, Y.; Li, H. Reversible Hydrogen Electrode (RHE) Scale Dependent Surface Pourbaix Diagram at Different pH. Langmuir 2024, 40, 7632–7638. [Google Scholar] [CrossRef]
  22. Kresse, G.; Furthmüller, J. Efficient iterative schemes for ab initio total-energy calculations using a plane-wave basis set. Phys. Rev. B 1996, 54, 11169–11186. [Google Scholar] [CrossRef]
  23. Kresse, G.; Furthmüller, J. Efficiency of ab-initio total energy calculations for metals and semiconductors using a plane-wave basis set. Comput. Mater. Sci. 1996, 6, 15–50. [Google Scholar] [CrossRef]
  24. Perdew, J.P.; Burke, K.; Ernzerhof, M. Generalized gradient approximation made simple. Phys. Rev. Lett. 1996, 77, 3865–3868. [Google Scholar] [CrossRef] [PubMed]
  25. Hammer, B.; Hansen, L.B.; Nørskov, J.K. Improved adsorption energetics within density-functional theory using revised Perdew-Burke-Ernzerhof functionals. Phys. Rev. B 1999, 59, 7413–7421. [Google Scholar] [CrossRef]
  26. Wellendorff, J.; Silbaugh, T.L.; Garcia-Pintos, D.; Nørskov, J.K.; Bligaard, T.; Studt, F.; Campbell, C.T. A benchmark database for adsorption bond energies to transition metal surfaces and comparison to selected DFT functionals. Surf. Sci. 2015, 640, 36–44. [Google Scholar] [CrossRef]
  27. Tonigold, K.; Groß, A. Dispersive interactions in water bilayers at metallic surfaces: A comparison of the PBE and RPBE functional including semiempirical dispersion corrections. J. Comput. Chem. 2012, 33, 695–701. [Google Scholar] [CrossRef]
  28. Blöchl, P.E. Projector augmented-wave method. Phys. Rev. B 1994, 50, 17953–17979. [Google Scholar] [CrossRef]
  29. Kresse, G.; Joubert, D. From ultrasoft pseudopotentials to the projector augmented-wave method. Phys. Rev. B 1999, 59, 1758–1775. [Google Scholar] [CrossRef]
  30. Dudarev, S.L.; Botton, G.A.; Savrasov, S.Y.; Humphreys, C.J.; Sutton, A.P. Electron-energy-loss spectra and the structural stability of nickel oxide: An LSDA+U study. Phys. Rev. B 1998, 57, 1505–1509. [Google Scholar] [CrossRef]
  31. Lutfalla, S.; Shapovalov, V.; Bell, A.T. Calibration of the DFT/GGA+U Method for Determination of Reduction Energies for Transition and Rare Earth Metal Oxides of Ti, V, Mo, and Ce. J. Chem. Theory Comput. 2011, 7, 2218–2223. [Google Scholar] [CrossRef]
  32. Wang, L.; Maxisch, T.; Ceder, G. Oxidation energies of transition metal oxides within the GGA + U framework. Phys. Rev. B 2006, 73, 195107. [Google Scholar] [CrossRef]
  33. Monkhorst, H.J.; Pack, J.D. Special points for Brillouin-zone integrations. Phys. Rev. B 1976, 13, 5188–5192. [Google Scholar] [CrossRef]
  34. Methfessel, M.; Paxton, A.T. High-precision sampling for Brillouin-zone integration in metals. Phys. Rev. B 1989, 40, 3616. [Google Scholar] [CrossRef]
  35. Grimme, S.; Antony, J.; Ehrlich, S.; Krieg, H. A consistent and accurate ab initio parametrization of density functional dispersion correction (DFT-D) for the 94 elements H-Pu. J. Chem. Phys. 2010, 132, 154104–154119. [Google Scholar] [CrossRef] [PubMed]
  36. Mathew, K.; Sundararaman, R.; Letchworth-Weaver, K.; Arias, T.A. Hennig, Implicit solvation model for density-functional study of nanocrystal surfaces and reaction pathways. J. Chem. Phys. 2014, 140, 084106. [Google Scholar] [CrossRef]
  37. Mathew, V.S.C.; Kolluru, S.; Mula, S.N.; Steinmann, S.N.; Hennig, R.G. Implicit self-consistent electrolyte model in plane-wave density-functional theory. J. Chem. Phys. 2019, 151, 234101. [Google Scholar] [CrossRef] [PubMed]
  38. Archer, D.G.; Wang, P. The Dielectric Constant of Water and Debye-Hückel Limiting Law Slopes. J. Phys. Chem. Ref. Data 1990, 19, 371–411. [Google Scholar] [CrossRef]
  39. Manz, T.A.; Limas, N.G. DDEC6: A Method for Computing Even-Tempered Net Atomic Charges in Periodic and Nonperiodic Materials. arXiv 2015. [Google Scholar] [CrossRef]
  40. Limas, N.G.; Manz, T.A. Introducing DDEC6 atomic population analysis: Part 4. Efficient parallel computation of net atomic charges, atomic spin moments, bond orders, and more. RSC Adv. 2018, 8, 2678–2707. [Google Scholar] [CrossRef]
  41. Wang, V.; Xu, N.; Liu, J.-C.; Tang, G.; Geng, W.-T. VASPKIT: A user-friendly interface facilitating high-throughput computing and analysis using VASP code. Comput. Phys. Commun. 2021, 267, 108033. [Google Scholar] [CrossRef]
  42. Trasatti, S. The Absolute Electrode Potential: An Explanatory Note: (Recommendations 1986). De Gruyter 1986, 58, 955–966. [Google Scholar] [CrossRef]
  43. Jerkiewicz, G. Standard and Reversible Hydrogen Electrodes: Theory, Design, Operation, and Applications. ACS Catal. 2020, 10, 8409–8417. [Google Scholar] [CrossRef]
  44. Singh, A.K.; Zhou, L.; Shinde, A.; Suram, S.K.; Montoya, J.H.; Winston, D.; Gregoire, J.M.; Persson, K.A. Electrochemical Stability of Metastable Materials. Chem. Mater. 2017, 29, 10159–10167. [Google Scholar] [CrossRef]
  45. Łukomska, A.; Sobkowski, J. Potential of zero charge of monocrystalline copper electrodes in perchlorate solutions. J. Electroanal. Chem. 2004, 567, 95–102. [Google Scholar] [CrossRef]
  46. Ohmori, T. Measurement of the potential of zero-charge on nickel electrode by the galvanostatic transient method. J. Electroanal. Chem. Interfacial Electrochem. 1983, 157, 159–164. [Google Scholar] [CrossRef]
  47. Porezag, D.; Pederson, M.R. Infrared intensities and Raman-scattering activities within density-functional theory. Phys. Rev. B 1996, 54, 7830–7836. [Google Scholar] [CrossRef] [PubMed]
  48. Baroni, S.; de Gironcoli, S.; Corso, A.D.; Giannozzi, P. Phonons and related crystal properties from density-functional perturbation theory. Rev. Mod. Phys. 2001, 73, 515–562. [Google Scholar] [CrossRef]
  49. Gonze, X. Perturbation expansion of variational principles at arbitrary order. Phys. Rev. A 1995, 52, 1086–1095. [Google Scholar] [CrossRef]
  50. Fonari, A.; Stauffer, S. vasp_raman.py. 2013. Available online: https://github.com/raman-sc/VASP/ (accessed on 24 November 2025).
  51. Lazzeri, M.; Mauri, F. First-Principles Calculation of Vibrational Raman Spectra in Large Systems: Signature of Small Rings in Crystalline SiO2. Phys. Rev. Lett. 2003, 90, 036401. [Google Scholar] [CrossRef]
  52. Kabsch, W. A solution for the best rotation to relate two sets of vectors. Acta Crystallogr. Sect. A 1976, 32, 922–923. [Google Scholar] [CrossRef]
  53. Yu, M.; Moayedpour, S.; Yang, S.; Dardzinski, D.; Wu, C.; Pribiag, V.S.; Marom, N. Dependence of the electronic structure of the EuS/InAs interface on the bonding configuration. Phys. Rev. Mater. 2021, 5, 064606. [Google Scholar] [CrossRef]
  54. Ruban, A.; Hammer, B.; Stoltze, P.; Skriver, H.; Nørskov, J. Surface electronic structure and reactivity of transition and noble metals. J. Mol. Catal. A Chem. 1997, 115, 421–429. [Google Scholar] [CrossRef]
  55. Hammer, B.; Norskov, J.K. Why gold is the noblest of all the metals. Nature 1995, 376, 238–240. [Google Scholar] [CrossRef]
  56. Hammer, B.; Morikawa, Y.; Nørskov, J.K. CO Chemisorption at Metal Surfaces and Overlayers. Phys. Rev. Lett. 1996, 76, 2141–2144. [Google Scholar] [CrossRef]
  57. Bhattacharjee, S.; Waghmare, U.V.; Lee, S.-C. An improved d-band model of the catalytic activity of magnetic transition metal surfaces. Sci. Rep. 2016, 6, 35916. [Google Scholar] [CrossRef] [PubMed]
  58. Hammer, B.; Nørskov, J. Electronic factors determining the reactivity of metal surfaces. Surf. Sci. 1995, 343, 211–220. [Google Scholar] [CrossRef]
Figure 1. Top and side views of the most stable adsorption configurations of Mo (a,f); H3Mo (b,g); H3MoOH (c,h); H2Mo(OH)2 (d,i); and MoO(OH)3 (e,j) on Cu(111) (ae) and Ni(111) (fj). Copper, nickel, molybdenum, oxygen, and hydrogen atoms are shown as orange, blue, teal, red, and white spheres, respectively. Atomic radii are not to scale.
Surfaces 09 00051 g001
Figure 2. (a) Adsorbate-centroid height relative to the average z-coordinate of the top surface layer for Cu(111) and Ni(111); (b) Relative adsorbate expansion upon adsorption on Cu(111) and Ni(111), quantified by the radius of gyration ( R g ); (c) Charge transferred to the slab upon adsorption of Mo complexes ( Q s l a b ) on Cu(111) and Ni(111); (d) Adsorption energies of Mo complexes on Cu(111) and Ni(111). Orange and blue denote adsorption on Cu(111) and Ni(111), respectively.
Surfaces 09 00051 g002
Figure 3. Changes in DDEC6 bond orders (ΔBO) of internal bonds in Mo complexes upon adsorption on Cu(111) and Ni(111): (a) H3Mo; (b) H3MoOH; (c) H2Mo(OH)2; and (d) MoO(OH)3. Bond “softening” or “weakening” denotes a decrease in bond order upon adsorption. Orange bars indicate greater bond softening on Cu(111), whereas blue bars indicate greater bond softening on Ni(111).
Surfaces 09 00051 g003
Figure 4. Computed Raman spectra of Mo complexes adsorbed on Cu(111) (orange) and Ni(111) (blue): (a) H3Mo, (b) H3MoOH, (c) H2Mo(OH)2, and (d) MoO(OH)3. Numerical labels denote the vibrational mode indices corresponding to the peaks, as assigned from the overlap matrices (Figure S5). Intensities are normalized.
Surfaces 09 00051 g004
Figure 5. One-dimensional (1D) Pourbaix diagrams of Mo complexes adsorbed on Cu(111) (dashed) and Ni(111) (solid). Black, blue, green, and red curves correspond to H3Mo, H3MoOH, H2Mo(OH)2, and MoO(OH)3, respectively.
Surfaces 09 00051 g005
Figure 6. (a,b) Charge redistribution under an applied electric field for Mo complexes adsorbed on Cu(111) and Ni(111). (c,d) Changes in relative Gibbs free energy under an applied electric field. Gas-phase H2O and H2 energies, as well as thermal corrections to the Gibbs free energies, are assumed constant. Ni(111) exhibits negligible variation, whereas Cu(111) shows measurable changes in slab charge with increasing field strength. The relative Gibbs free energies follow the same trend.
Surfaces 09 00051 g006
Figure 7. One-dimensional (1D) Pourbaix diagrams of Mo complexes adsorbed on Cu(111) at (a) pH = 2; (b) pH = 7; (c) pH = 10; and (d) pH = 14. Black, blue, green, and red curves correspond to H3Mo, H3MoOH, H2Mo(OH)2, and MoO(OH)3, respectively. Stability is evaluated using the relative Gibbs free energy ( G r e l , dotted) and the electric field-corrected relative Gibbs free energy ( G f i e l d , solid). With increasing pH, the blue, green, and red solid curves shift upward, indicating decreased stability of the corresponding complexes, whereas the black solid curve shifts downward, indicating enhanced stability of H3Mo at high pH.
Surfaces 09 00051 g007
Disclaimer/Publisher’s Note: The statements, opinions and data contained in all publications are solely those of the individual author(s) and contributor(s) and not of MDPI and/or the editor(s). MDPI and/or the editor(s) disclaim responsibility for any injury to people or property resulting from any ideas, methods, instructions or products referred to in the content.