Article

Adjustable Capillary Forces Through Wetting State Changes in Liquid Bridges: Regulation via Trapezoidal Microstructures

1
School of Mechanical Engineering, North University of China, Taiyuan 030051, China
2
Department of Weapon System Design, School of Mechanical and Electrical Engineering, North University of China, Taiyuan 030051, China
3
School of Aerospace Engineering, Beijing Institute of Technology, Beijing 100081, China
*
Authors to whom correspondence should be addressed.
Surfaces 2025, 8(4), 73; https://doi.org/10.3390/surfaces8040073 (registering DOI)
Submission received: 8 September 2025 / Revised: 4 October 2025 / Accepted: 10 October 2025 / Published: 12 October 2025
(This article belongs to the Special Issue Superhydrophobic Surfaces: Wetting Phenomena and Preparation Methods)

Abstract

A detailed understanding of the mechanistic role of solid surface microstructures in modulating capillary forces and liquid transport in liquid bridge systems is crucial, for liquid bridges between rough surfaces are omnipresent in nature and various industries. In this work, Gibbs free energy expression was derived for a liquid bridge system confined between a smooth surface and a microstructured surface, based on the principle of minimum thermodynamic potential. Furthermore, by analyzing the energy conversion during spacing variation between the two solid surfaces, an analytical expression for the capillary force of the liquid bridge was derived that incorporates the geometric parameters of the microstructures and the contact angle. Finally, numerical simulations were performed using the Fluent UDFs (User-Defined Functions) to validate the proposed capillary force model. The simulation results validated the analytical expression and revealed the influence of the microstructures on the force distribution on the upper and lower surfaces of the liquid bridge, and on the droplet transport performance.

1. Introduction

Understanding the mechanistic role of solid surface microstructures in modulating capillary forces and liquid transport in liquid bridge systems is key to deciphering wet adhesion phenomena in tree frogs and geckos [1,2,3], while enabling advanced engineering implementations such as soldering [4,5], oil recovery [6,7,8], ultrathin wafer slicing [9], microfluidics [10,11,12,13], AFM [14,15,16], 3D printing [17,18,19], etc.
Numerous studies have been devoted to understanding the mechanical behavior, rupture mechanisms, and stability of liquid bridges formed between two smooth surfaces under various geometrical constraints. Bagheri et al. [20] and Mu et al. [21] developed approximate and analytical expressions for liquid bridges formed between symmetrical spherical surfaces, respectively, providing the influence of parameters such as droplet volume and sphere separation distance on the capillary force of the liquid bridge. Willett et al. [22], Nguyen et al. [23], Zhao et al. [24], and Xiao et al. [25] developed and validated analytical or semi-analytical models for capillary forces and rupture distances of liquid bridge systems formed between two spherical surfaces of unequal radii, advancing the understanding of liquid bridge mechanics across different particle systems. Wu et al. [26,27] investigated the capillary force characteristics and liquid redistribution behavior between two spherical surfaces with varying contact angles, revealing the complex mechanical responses of liquid bridges under asymmetric wetting conditions. Kazuo et al. [28,29] and Wang et al. [30] investigated capillary forces and rupture behaviors in three-sphere liquid bridge systems through numerical simulations and experimental validation, extending prior two-sphere studies to more complex multi-body configurations under both static and dynamic conditions. Teixeira [31] and Chen et al. [32] studied the mechanics of liquid bridges formed between two parallel surfaces with different wettabilities, emphasizing the critical roles of geometric constraints and contact angle hysteresis in determining bridge stability and the efficiency of liquid transfer processes. In addition, bridges formed between a sphere and a plane at the micro- to nanoscale have been widely investigated. Kwon et al. [33] quantified capillary forces under constant curvature using static and dynamic force spectroscopy. Li et al. [34] developed a predictive model for rupture distances, achieving strong agreement with experimental results. Van et al. [35] and Yakov et al. [36] independently derived analytical models incorporating interfacial pressure differences and validated them through AFM-based measurements.
However, in practical scenarios, the contacting solid surfaces are rarely perfectly smooth [37,38,39,40]. Micro- and nano-scale structures, either engineered or arising from intrinsic roughness, are often present on solid substrates and have been shown to modulate surface wettability [41,42,43,44], contact angle hysteresis [32,45], and droplet rupture [38,46,47], altering the capillary force and the dynamics of droplet exchange between surfaces. These effects are not captured by classical models based on smooth-boundary assumptions. Therefore, incorporating microstructure effects and droplet wetting states into a liquid-bridge force model elucidates the microscopic mechanisms of bioinspired adhesion in humid environments [48], while providing a framework to optimize microstructure design, enhance sensor sensitivity in wet conditions [49], and enable precise control of microfluidic behavior [50,51].
In this study, we aim to systematically investigate the influence of the microstructure shape and its Young contact angle on the capillary force and droplet transport behavior in liquid bridge systems, by incorporating realistic surface geometries into a generalized capillary model and employing numerical simulations. The proposed approach addresses a critical gap in current liquid bridge mechanics and provides a theoretical foundation for the design of surface-engineered interfaces with tunable adhesion and fluid transfer properties.

2. Theoretical Model

Consider a 2D capillary liquid bridge in static equilibrium confined between a smooth upper plate and a rough superhydrophobic surface with uniformly spaced trapezoidal microstructures (Figure 1). The liquid volume V 0 remains constant. The apparent contact angles and contact radii of the droplet on the upper and lower surfaces are denoted as θ Yu , θ eu , r u , and r b , respectively, with a vertical separation distance H between surfaces. The trapezoidal microstructures feature top width W tt , bottom width W tb , height H t , and inter-spacing S t . The droplet resides in a Cassie–Baxter state on the microstructured surface, with its triple-phase contact line positioned at a vertical distance h t from the trapezoid tops. Based on geometric relationships among W tt , W tb , H t , S t , and h t , the apparent contact angle θ eb relates to Young’s contact angle θ Yb as expressed in Equation (1) [52]:
cos θ eb = r f cos θ Yb ( 1 f )
where f = ( W tt + 2 h t tan α t ) / ( S t + W tb ) denotes the ratio of the projected solid–liquid contact area to the horizontal area of the representative unit shown in Figure 1; r = ( W tt + 2 h t / cos α t ) / ( W tt + 2 h t tan α t ) denotes the roughness factor defined as a ratio of the solid–liquid area to its projection on a flat plan, as illustrated in Figure 1; and α t = arctan ( ( W tb W tt ) / 2 H t ) denotes the angle formed between the side surface of the trapezoidal microstructure and the y-axis, as shown in Figure 1.
In both the theoretical model and the corresponding numerical simulations, the dimensionless parameters—namely, the Capillary number and the Bond number—are found to be sufficiently small, with maximum values of 0.0001 and 0.539, respectively. These findings indicate that viscous and gravitational forces are negligible compared to capillary forces and can thus be reasonably ignored within the investigated parameter space. Consequently, the droplet dynamics are dominated by capillarity, allowing the use of a quasi-static approximation in the analysis. Accordingly, the profile of the liquid–gas interface between the upper plate and microstructure surface can be approximated as a circular arc centered at point O 1 (coordinates ( x , 0 ) ) with radius R . Based on geometric relationships, V 0 , r u , and r b derived in Equations (2)–(4):
V 0 = x H + R 2 ( α + β + sin α cos α + sin β cos β ) 2
r u = x + R cos α
r b = x + R cos β
where α = θ Yu π / 2 and β = θ eb π / 2 denote the central angles corresponding to the liquid–gas interfaces in the first and fourth quadrants (as shown in Figure 1), respectively. According to the geometric relationship, the functional form of R with respect to H is given by: R = H / ( sin α + sin β ) .
From Equations (2)–(4), the liquid–gas interface area L lg , the solid–liquid interface area L sl , and the solid–gas interface area L sg for the system in Figure 1 can be determined, as expressed in Equation (5). Consequently, the interfacial energy G of the system is derived in Equation (6):
L sl = r u + r b r f L sg = L L sl L lg = R ( α + β ) + r b ( 1 f )
G = γ sl L sl + γ sg L sg + γ lg L lg
where L denotes the solid surface area of the liquid bridge system, which can be regarded as a constant. γ sl , γ sg , and γ lg represent the solid–liquid interfacial tension, the solid–gas interfacial tension, and the liquid–gas interfacial tension, respectively.
For a liquid bridge under static or quasi-static stretching conditions, the capillary force arises from two conditions: (1) the surface tension γ lg acting along the liquid–gas interface and (2) the Laplace pressure Δ P within the bridge [5,53,54]. Consider a virtual displacement d H applied to the upper plate in the y-direction (Figure 1). The mechanical work d E F done by the external force F and the work d E Δ P associated with Δ P is fully converted into interfacial free energy d G . These differential work terms are expressed in Equations (7)–(9):
d E F = F d H
d E Δ P = Δ P r u d H Δ P ( H d x R ( α + β ) d R )
d G = γ sl d L sl + γ sg d L sg + γ lg d L lg
where Δ P = γ lg / R = γ lg ( sin α + sin β ) / H .
It can be shown that r u d H H d x + R ( α + β ) d R 0 and this holds universally, indicating that the droplet volume is incompressible. As a result, d E F is fully converted into d G , it is d E F d G . Therefore, an expression for F can be derived from the interfacial free energy with respect to its independent variable, as shown in Equation (10).
F = d G d h = [ γ sl d L sl d h + γ sg d L sg d h + γ lg d L lg d h ]
By substituting Equations (1)–(6) into Equation (10) and simplifying, we obtain:
F = γ lg sin θ eu γ lg ( sin α + sin β ) H [ V 0 H R 2 ( α + β + sin α cos α + sin β cos β ) 2 H + H cos α sin α + sin β ] = γ lg sin θ eu γ lg R [ x + R cos α ] = γ lg sin θ eu Δ P r u
Similarly, when the upper plate is fixed, applying a virtual displacement d H to the microstructure in the negative y-direction yields the capillary force F b acting on the microstructure surface (Equation (12)). From Equations (11) and (12), the capillary force on the upper plate and the microstructured surface satisfy F = F b , i.e., they are equal in magnitude but opposite in direction. For consistency with simulations, we adopt the following sign convention: tensile forces (separation) are negative, while compressive forces (attraction) are positive.
F b = γ lg sin θ eb + Δ P r b

3. Computational Validation of the Capillary Force

The Computational Fluid Dynamics method, Volume of Fluid simulation, was introduced to validate the effectiveness of Equations (11) and (12) and to investigate the influence of microstructured surfaces on the liquid bridge rupture phenomenon simultaneously. The effectiveness of this simulation method has been validated in previous studies [43,44,46,55].
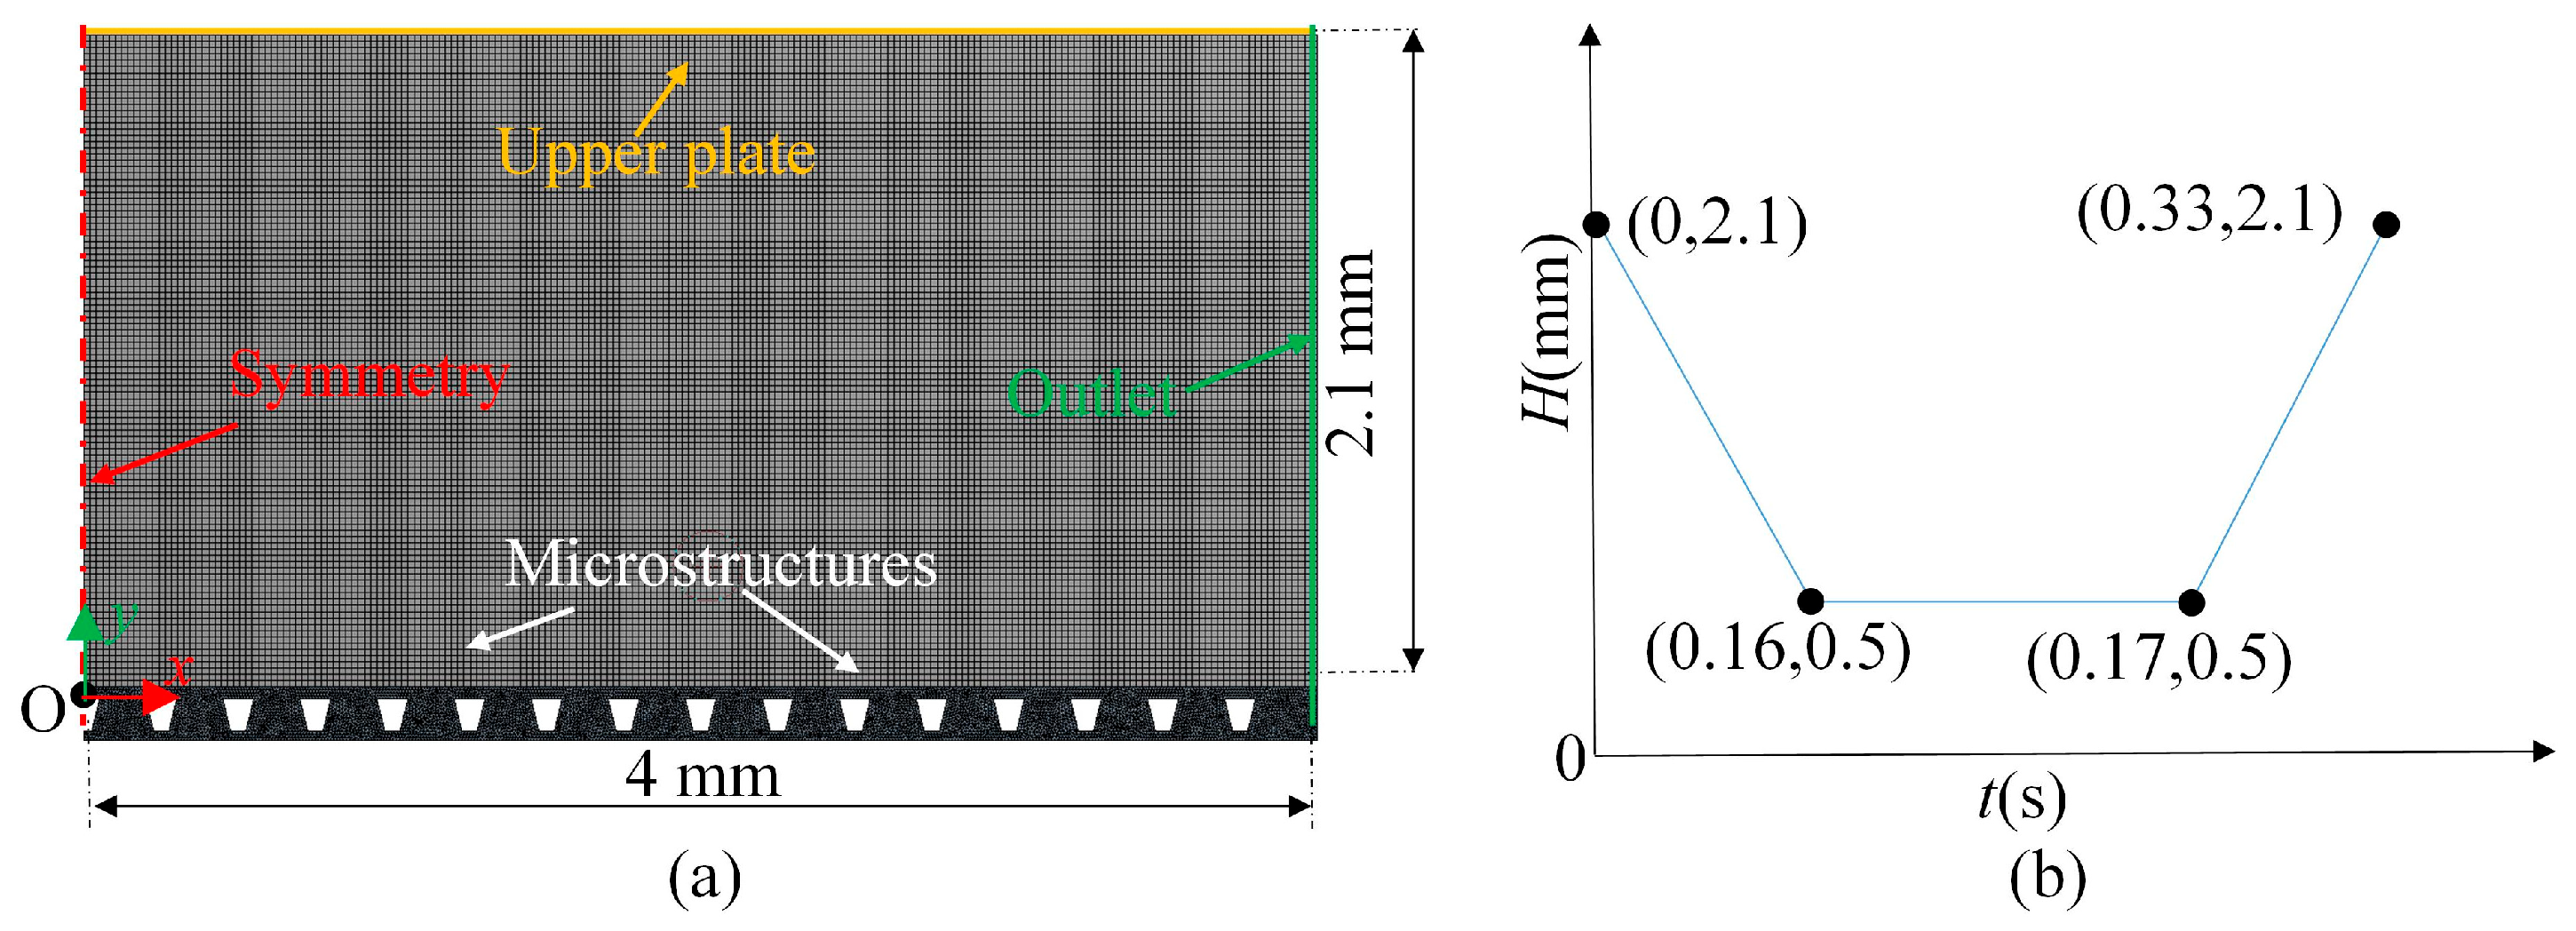
To reduce computational effort, a half-model of the liquid bridge was adopted based on the symmetry of the physical model shown in Figure 1, with the symmetry axis along the y-axis, and the entire simulation domain has a length of 4 mm and a height of 2.13 mm, as shown in Figure 2a. The simulation domain was filled with both gas (Primary Phase) and liquid phases (Secondary Phase); the properties of the two phases were specified as air and water–liquid from the Fluent Database Materials, and the Surface Tension Coefficient was 0.0728 N/m. After grid independence verification, the maximum element size in the simulations was determined to be 20 μm, and the time step size was set as 0.000001 s, and the time stepping method was set as variable. The dynamic mesh method was determined as layering, and its remeshing parameters were set to default values. In the calculation, the pressure and velocity were coupled with the Pressure-Implicit with Splitting of Operators algorithm, and the 2nd-order upwind scheme was used for the discretization of the model equations [43,44,56]. All parameter settings in the Monitor Check Convergence Absolute Criteria were set to 0.00001. At each time step, the solver outputs the capillary forces acting on the upper plate and the microstructure surface, thereby establishing the relationship between the bridge spacing and the capillary force.
The boundary conditions of the simulation model (Figure 2a) were configured as follows: the left boundary was set as a pressure outlet, the right boundary as a symmetry plane, the upper boundary as a moving wall (upper plate) following the displacement-time profile in Figure 2b, and the microstructures as stationary walls. In both simulations and theoretical analyses, the volume of the droplet V0 was assumed to be 1.57075 mm2 (the initial radius of the droplet is 1 mm), and a representative trapezoidal microstructure was analyzed with fixed parameters W tt = 0.1   mm , H t = 0.1   mm , W tb + S t = 0.25   mm , while maintaining consistent wettability θ Yu = θ Yb . Variations in the bottom width W tb (0.00, 0.05, 0.075, 0.1, 0.125, 0.15, 0.175, 0.2 mm) and Young’s contact angle θ Yb (100°, 110°, 120°) dynamically altered droplet wetting states and capillary force behavior [43,44], resulting in a parametric matrix of 8 × 3 = 21 simulation cases.

4. Results and Discussions

4.1. Influence of Microstructures and Contact Angle on the Capillary Force

Based on the presence or absence of microstructures and the relationship between parameters W tb and θ Yu = θ Yb , the droplet exhibits three representative wetting states on the microstructured surface: the Young state, Cassie–Baxter state, and Wenzel state. Accordingly, the variation of the capillary force with respect to H in Equations (11) and (12) also exhibits three distinct regimes.

4.1.1. Young State

When the lower surface parameters are set to St = 0 and Wtb = Wtt, the trapezoidal grooves vanish, and the model should reduce to the well-known case of a liquid bridge between two flat parallel plates, in which case f = 1 , r = 1 . Equation (1) reduces to Equation (13), which indicates that the lower surface of the liquid bridge becomes ideally smooth. Under this condition, the expression for the capillary force F b degenerates to F Yb , as shown in Equation (14).
θ eb = θ Yb
F Yb = γ lg sin θ Yb + Δ P Y r Yb
where r Yb = V 0 / H R Y 2 ( α Y + β Y + sin α Y cos α Y + sin β Y cos β Y ) / ( 2 H ) + R Y cos β Y and Δ P Y = γ lg / R Y denote the contact radius between smooth surfaces and the additional pressure inside the liquid in the Young state, respectively; R Y = H / ( sin α Y + sin β Y ) , α Y = θ Yu π / 2 , and β Y = θ Yb π / 2 denote the radius of the liquid–gas interface and the central angles in the first and fourth quadrants, respectively, for the smooth-surface liquid bridge model in Figure 1; θ Yu and θ Yb denote, respectively, the Young contact angles of the droplet with the upper and lower surfaces in the smooth-surface liquid bridge model shown in Figure 1. Equation (1) is fully consistent with the liquid bridge force models for smooth upper and lower surfaces reported by other researchers [5,39,54,57,58].
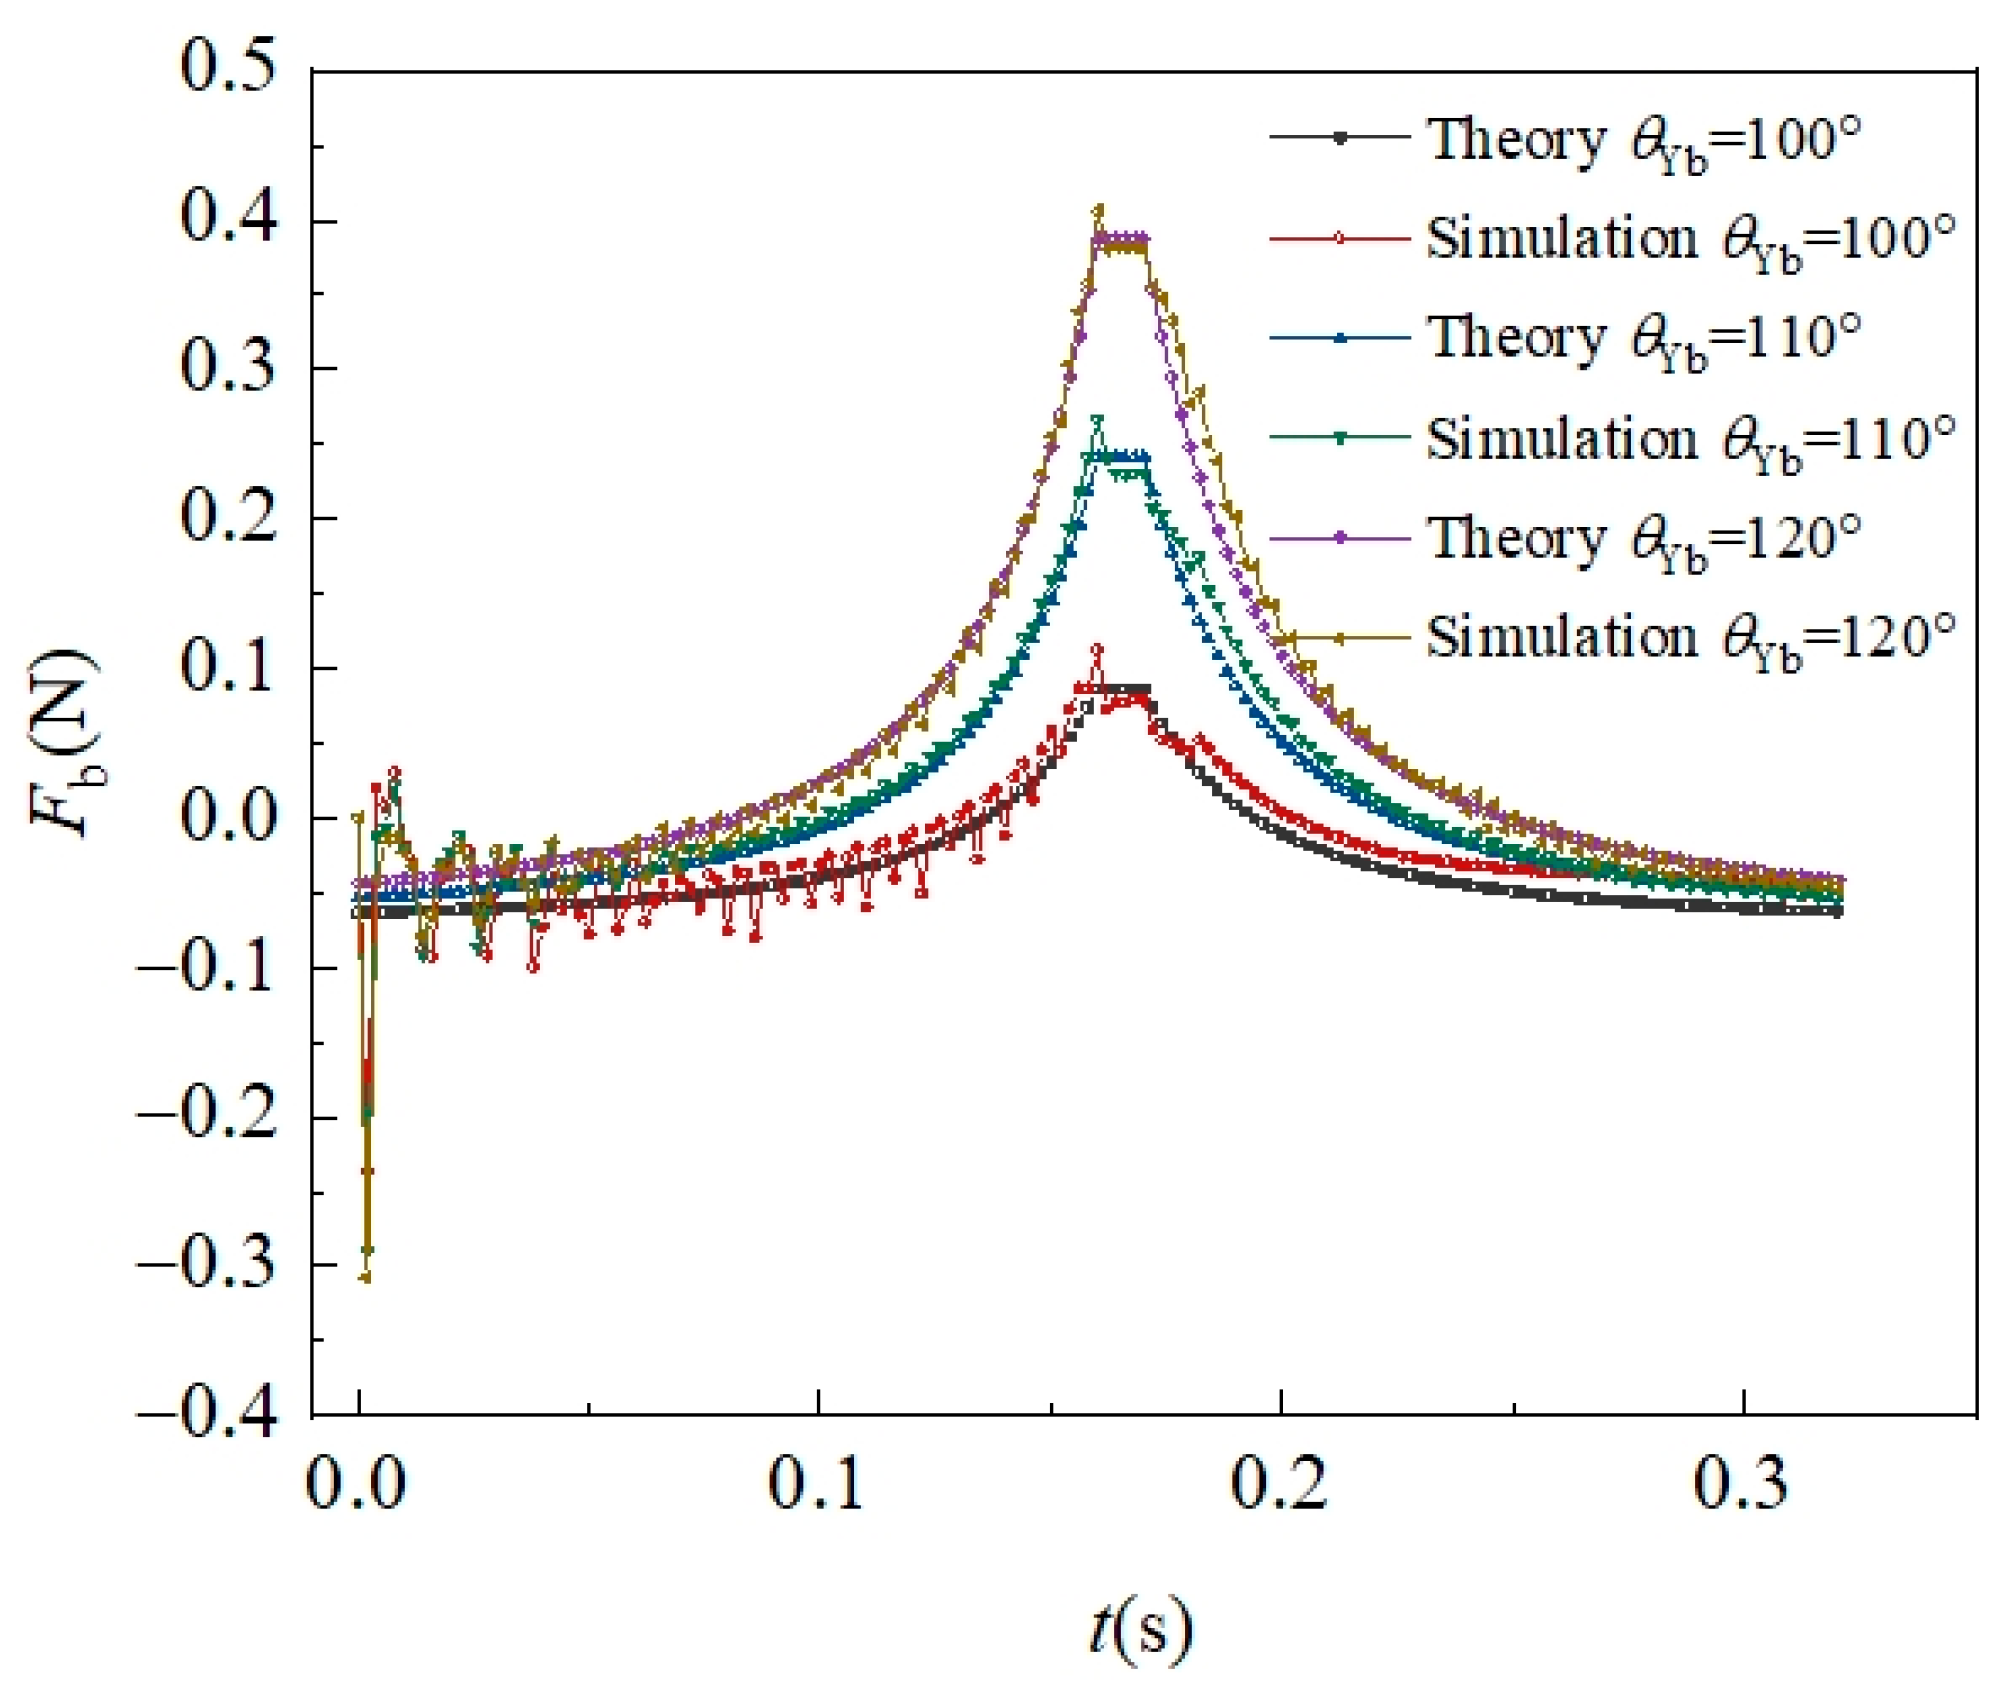
Figure 3 shows the temporal evolution of the capillary force on this lower surface. During the time interval 0–0.16 s, the liquid bridge gap H decreases linearly from 2.1 mm to 0.5 mm. Correspondingly, the capillary force on both the upper and lower plates transitions from tensile to compressive, exhibiting a zero-force crossover point. Furthermore, the compressive force magnitude increases with decreasing H . Larger θ Yb values amplify the compressive force. Conversely, tensile forces are dominant at larger H or smaller θ Yb .
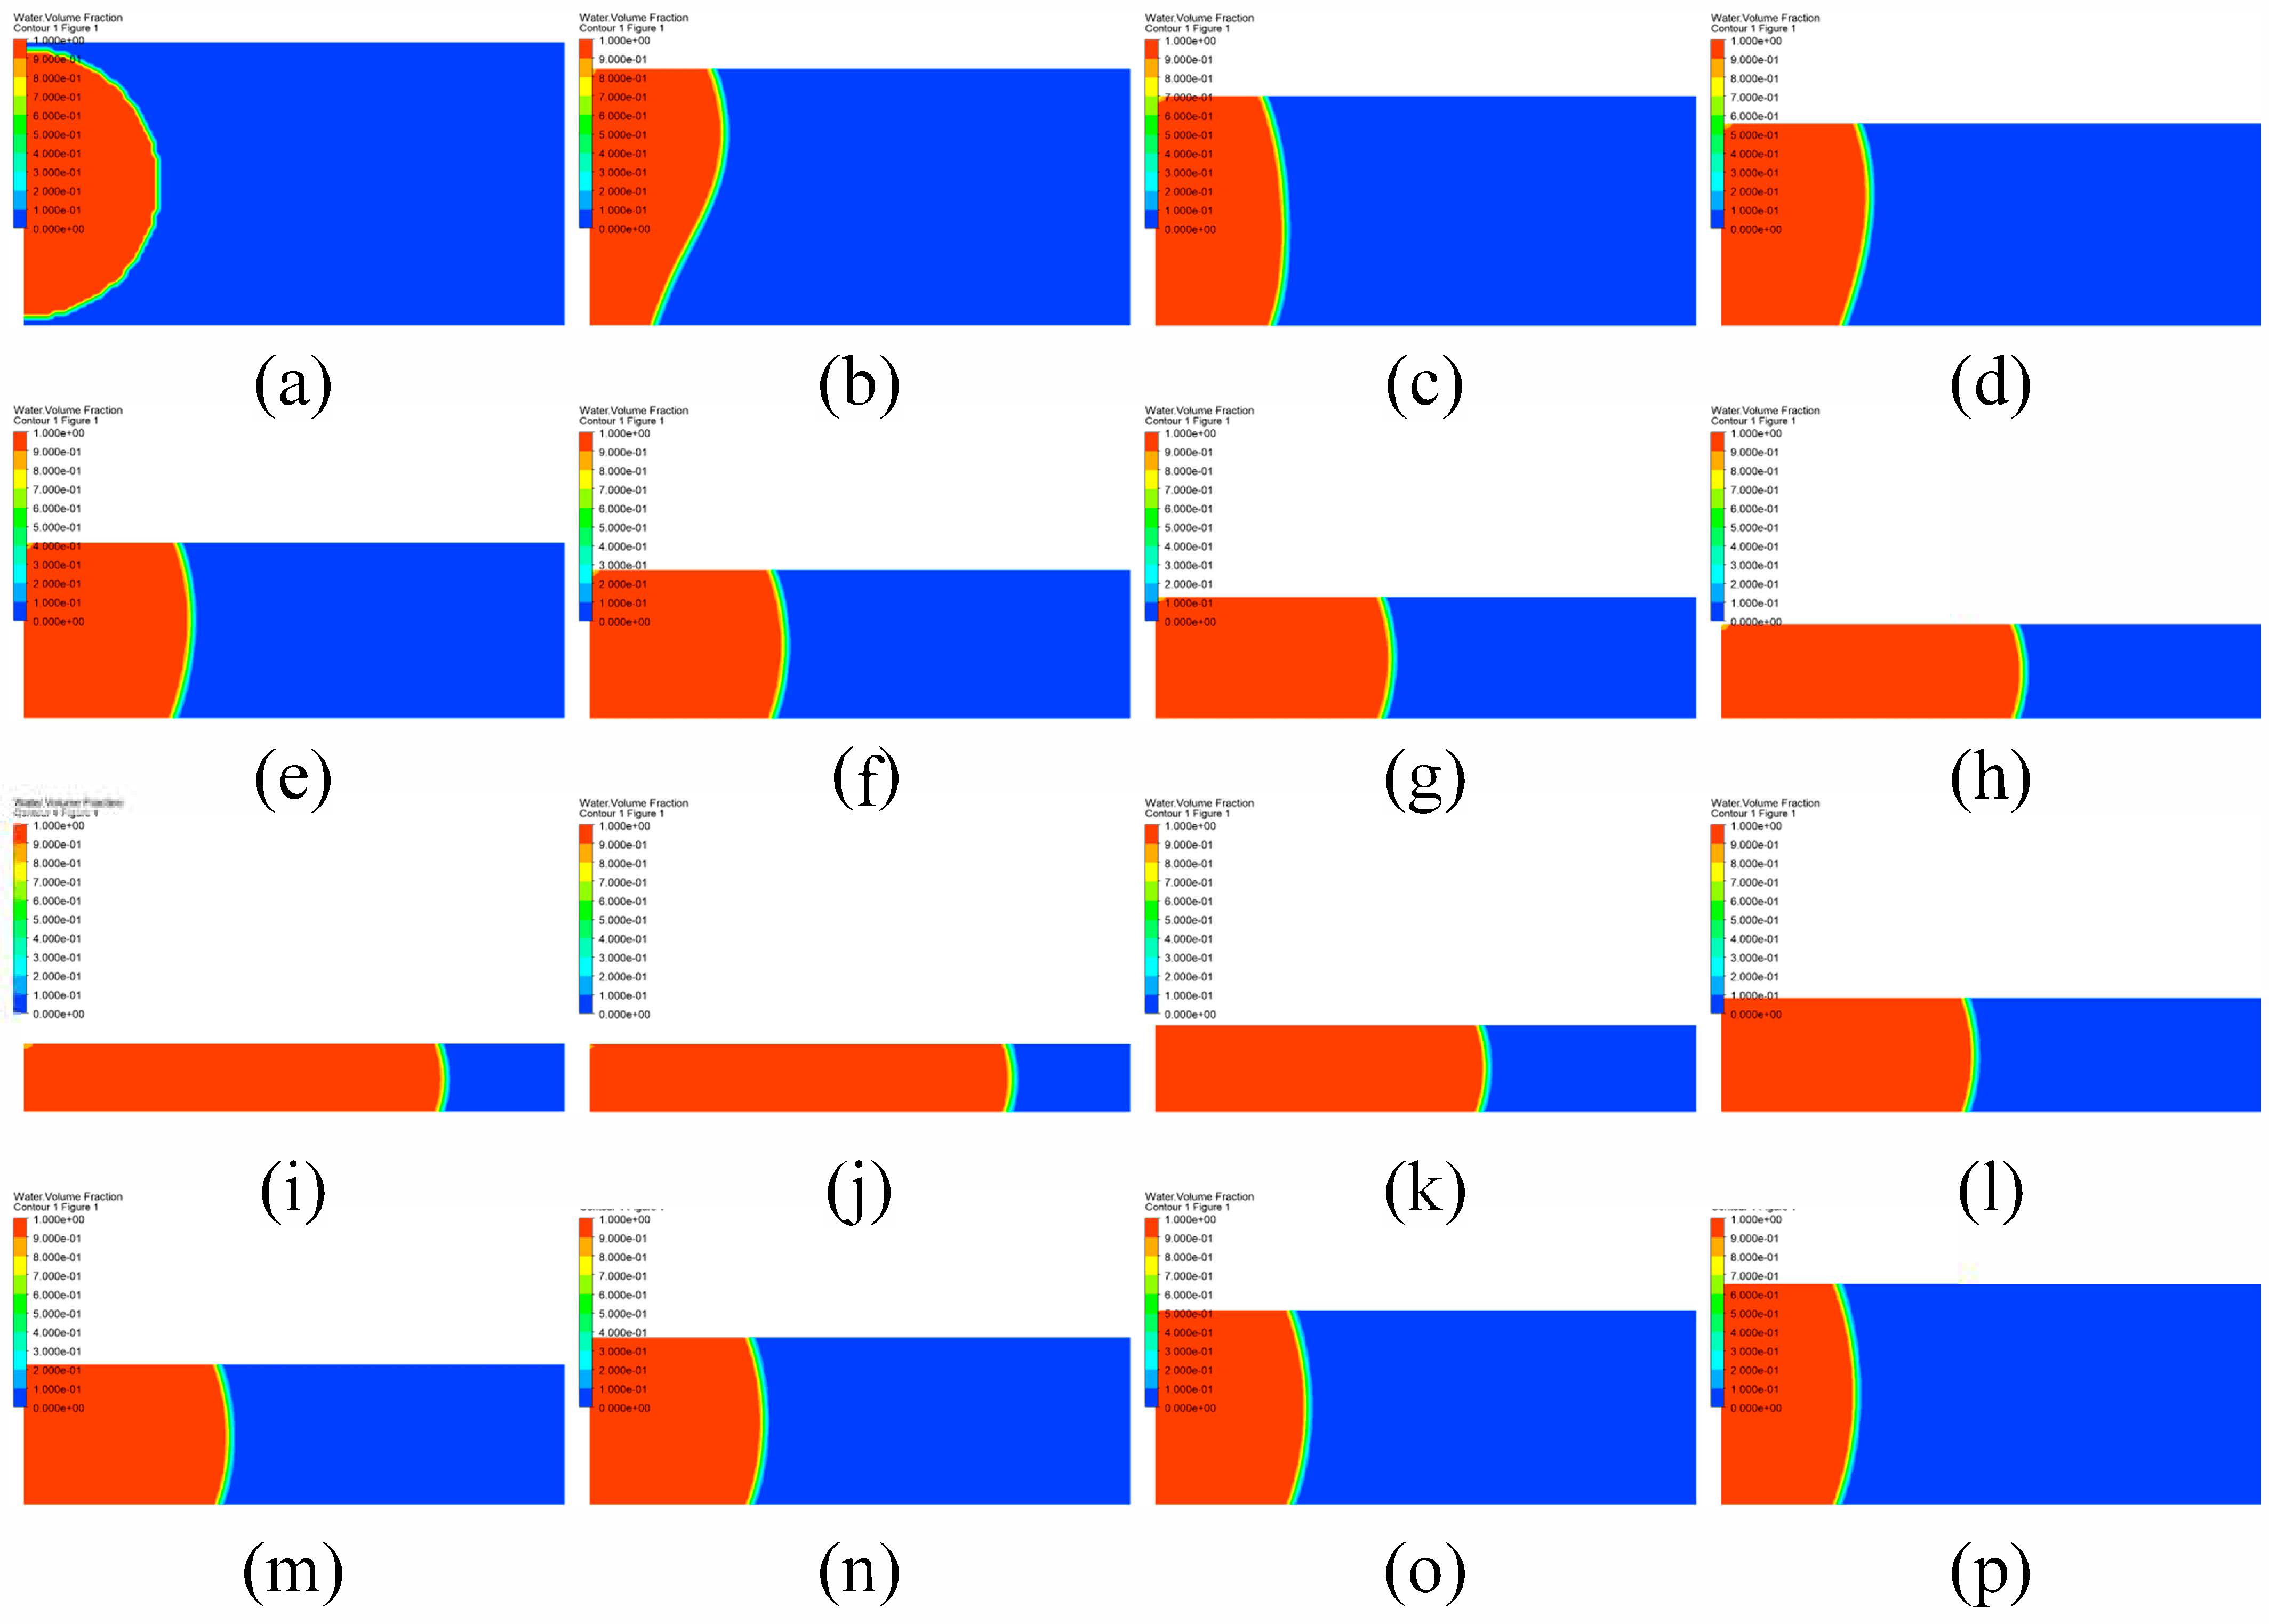
As shown in Figure 3, theoretical predictions exhibit good overall agreement with simulation results. However, at θ Y b = 100 ° , simulated force data oscillate around the theoretical curve due to rapid droplet spreading along the solid surfaces upon contact, driven by liquid–gas interfacial tension. Slight asymmetries in force distribution at the upper and lower three-phase contact lines induced by mesh discretization and numerical errors disrupt system symmetry, triggering droplet oscillations between the two surfaces (Figure 4). From 0.000–0.008 s, the droplet ascends toward the upper surface (Figure 4a–e). During 0.008–0.014 s, it descends (Figure 4e–h). Between 0.016–0.020 s, it reascends (Figure 4i–k). From 0.022–0.028 s, it returns downward (Figure 4l–n). These inertial oscillations cause force variations on both surfaces, with the oscillation period progressively decreasing to a stabilized value of ≈0.006 s (Figure 3).
At θ Y b = 110 ° and 120 ° , droplet oscillation between the liquid bridge surfaces becomes negligible. No contact angle hysteresis occurs, and the liquid–gas interface maintains an arc-shaped profile (Figure 5). Under these conditions, theoretical predictions align almost perfectly with simulation results, validating the model for liquid bridges confined between ideally smooth surfaces.

4.1.2. Cassie–Baxter State

When the lower surface of the liquid bridge possesses microstructures, the droplet may adopt either a Cassie–Baxter state or a Wenzel state on the structured surface. For droplets maintaining the Cassie state throughout the compression and release cycles of the upper plate, the geometric parameters reduce to f = W tt / ( S t + W tb ) , r = W tt / W tt = 1 , causing Equation (1) to degenerate into Equation (15). During plate compression, the liquid bridge height H decreases progressively, driving the normal force F b to transition from tensile to compressive: the tensile force magnitude diminishes continuously until vanishing, after which the compressive force increases monotonically. Conversely, during plate release, the compressive force gradually decays while the tensile force reemerges and intensifies until reaching a critical rupture threshold, at which point the liquid bridge fractures, as demonstrated in Figure 6.
cos θ eb = W tt S t + W tb ( cos θ Yb + 1 ) 1
As shown in Figure 6, the theoretical predictions of capillary forces on both the upper and lower surfaces of the Cassie–Baxter state liquid bridge exhibit good overall agreement with simulation results, validating the proposed model. However, systematic discrepancies emerge during the compression and release phases of the upper plate: During compression, the theoretical model consistently underpredicts the capillary force exerted on the microstructured surface relative to simulations. Conversely, during release, the model overpredicts the force magnitude. Additionally, the simulated capillary force on the microstructured surface displays persistent high-frequency fluctuations throughout both phases.
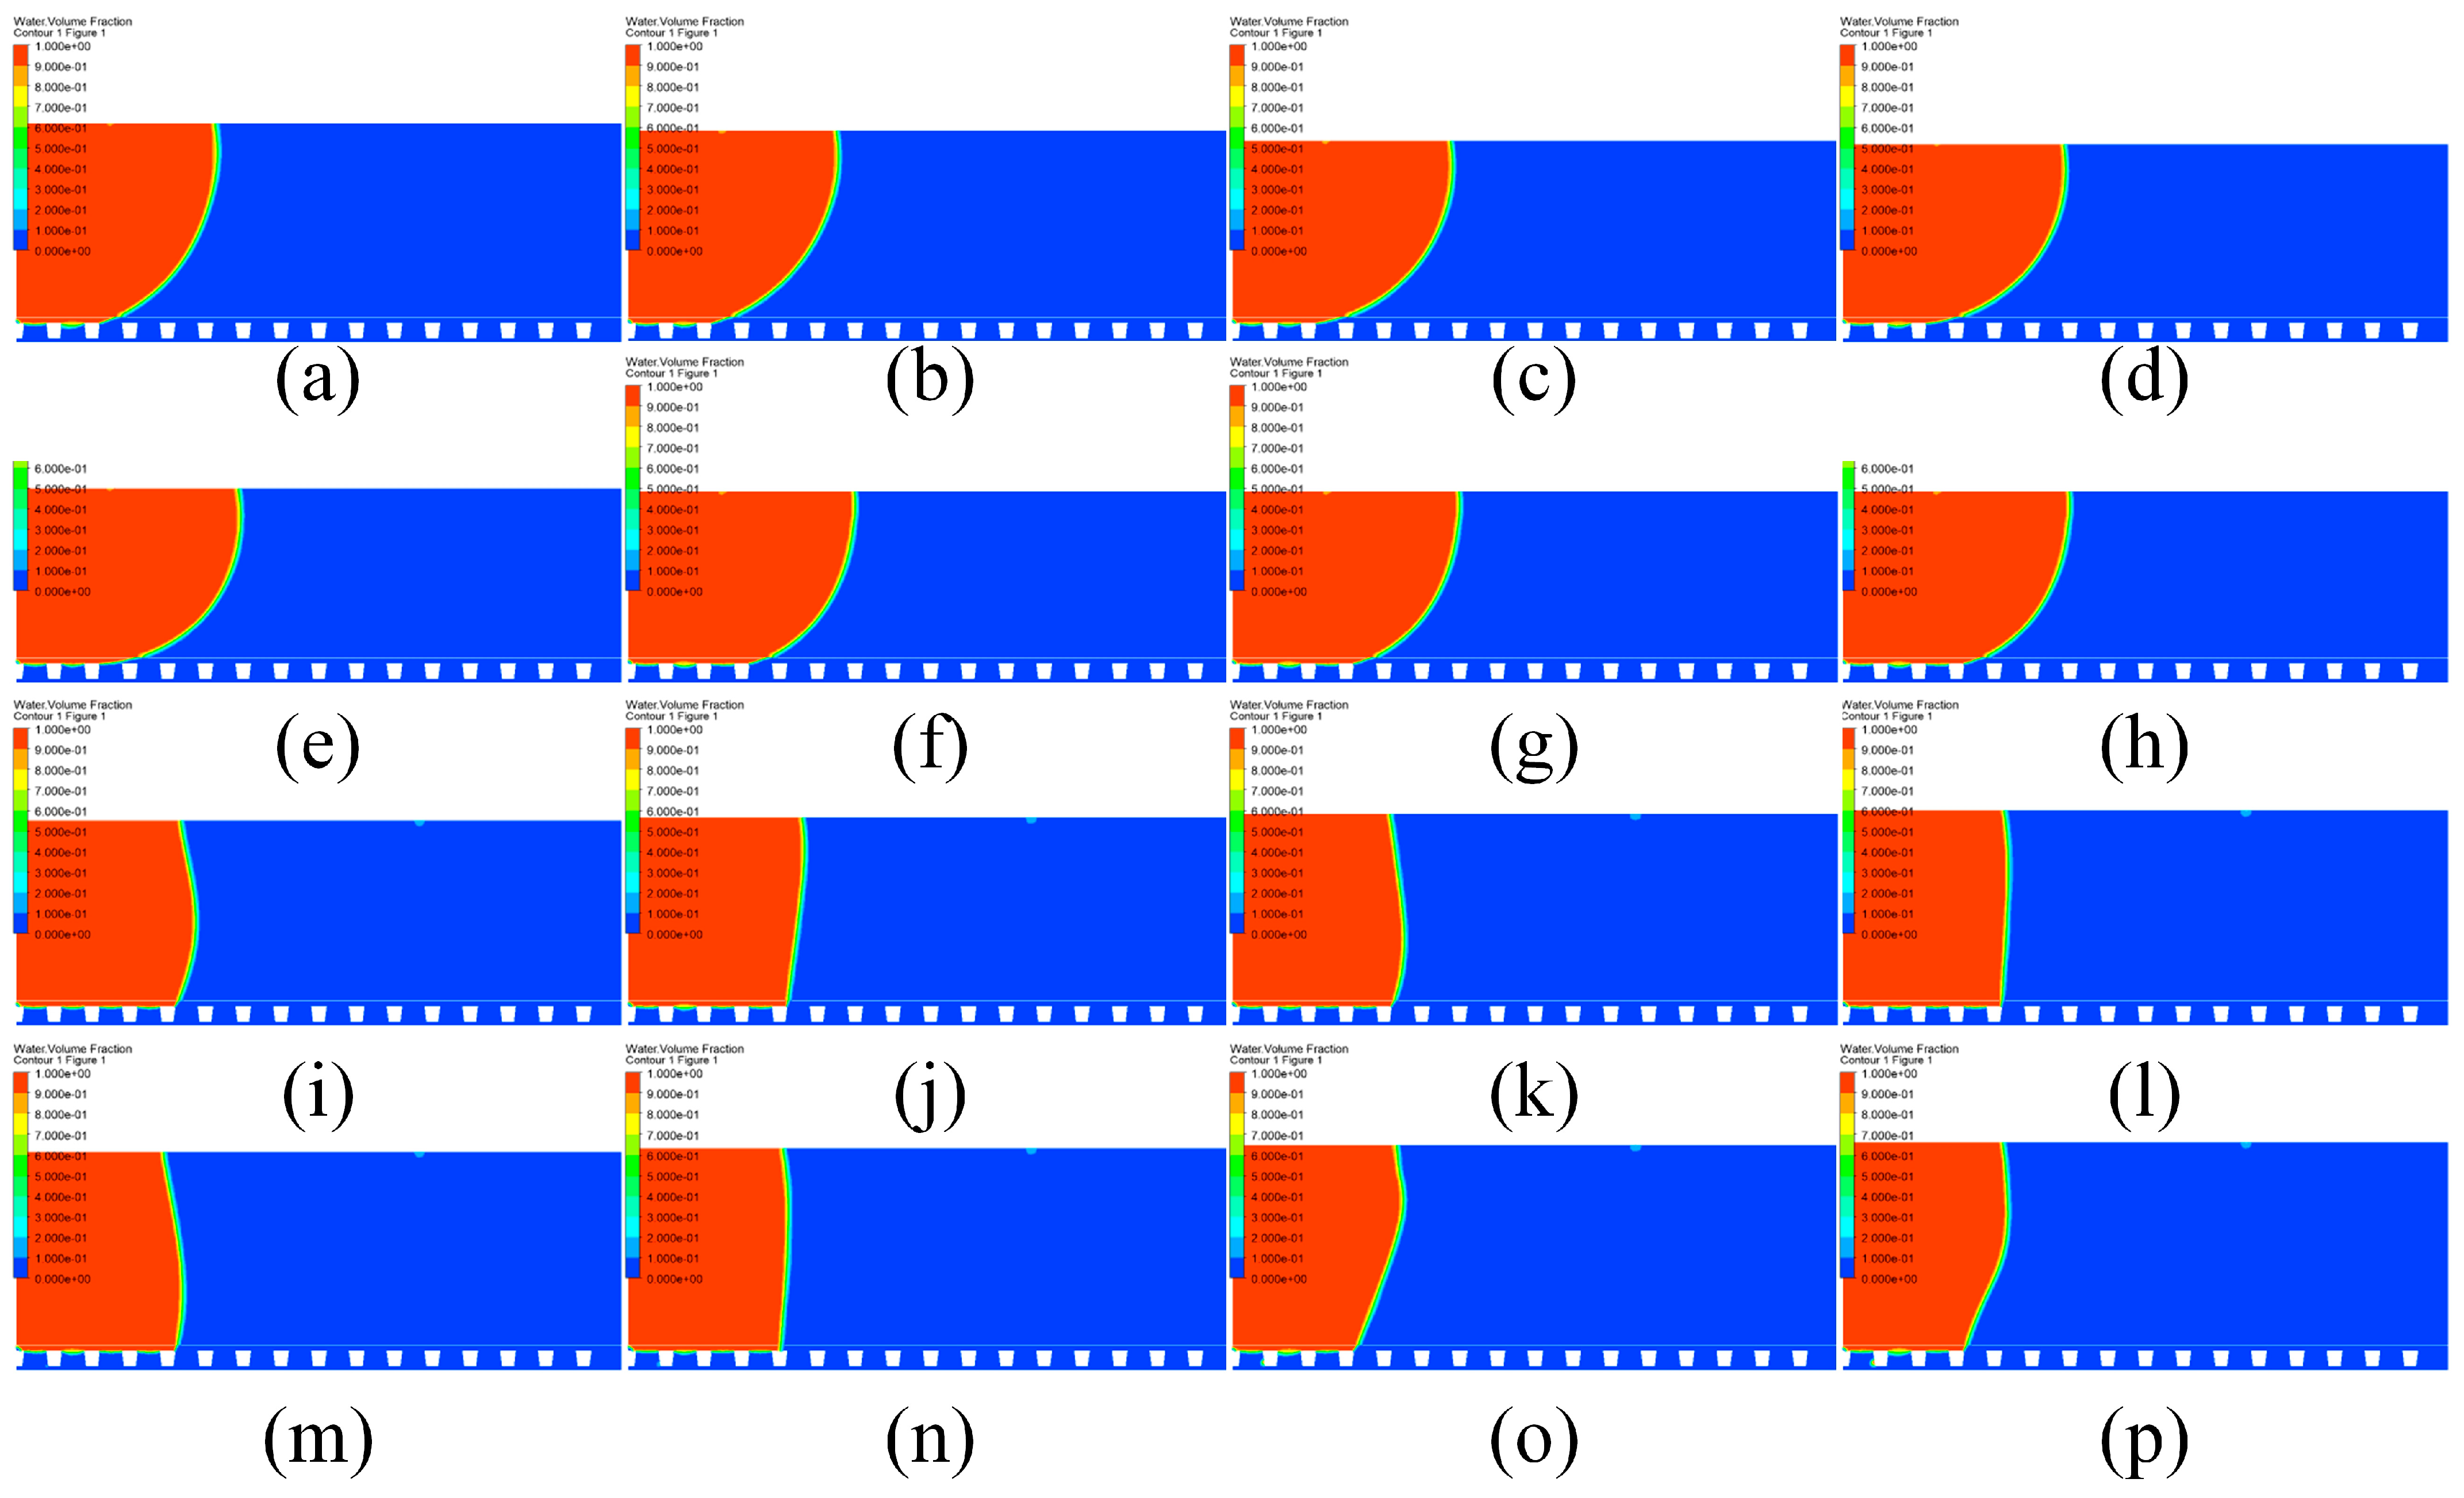
These deviations arise from pinning of the three-phase contact line at the sharp corners of trapezoidal microstructures during droplet spreading/retraction. As the droplet advances, contact line pinning at microstructure edges causes the simulated apparent contact angle to deviate from Cassie–Baxter model predictions (Figure 7a–h). During 0.080–0.096 s, the outermost contact line pins at the third left trapezoid apex (Figure 7a–e), progressively increasing the apparent contact angle and elevating capillary forces beyond theoretical values. Between 0.096–0.098 s, rapid advancement to the fourth trapezoid apex (Figure 7e,f) sharply reduces the contact angle, inducing transient force fluctuations. From 0.098–0.103 s, sustained pinning at the fourth trapezoid (Figure 7f–h) coupled with upper plate descent drives further contact angle increase.
During plate release, upward motion of the upper plate induces droplet retraction, causing contact line pinning at trapezoidal microstructure edges. This pinning reduces the apparent contact angle below Cassie–Baxter model predictions (Figure 7i–p). From 0.247–0.259 s: Contact line pins at the fifth left trapezoid (Figure 7i–n) progressively decrease the contact angle and depress capillary forces below theoretical values. At 0.259–0.260 s: Rapid retraction to the fourth trapezoid (Figure 7n,o) abruptly increases the contact angle, generating transient force perturbations. During 0.260–0.262 s: Sustained pinning at the fourth trapezoid (Figure 7o,p) with continued plate ascent drives a further contact angle decrease until re-pinning at the third trapezoid occurs.
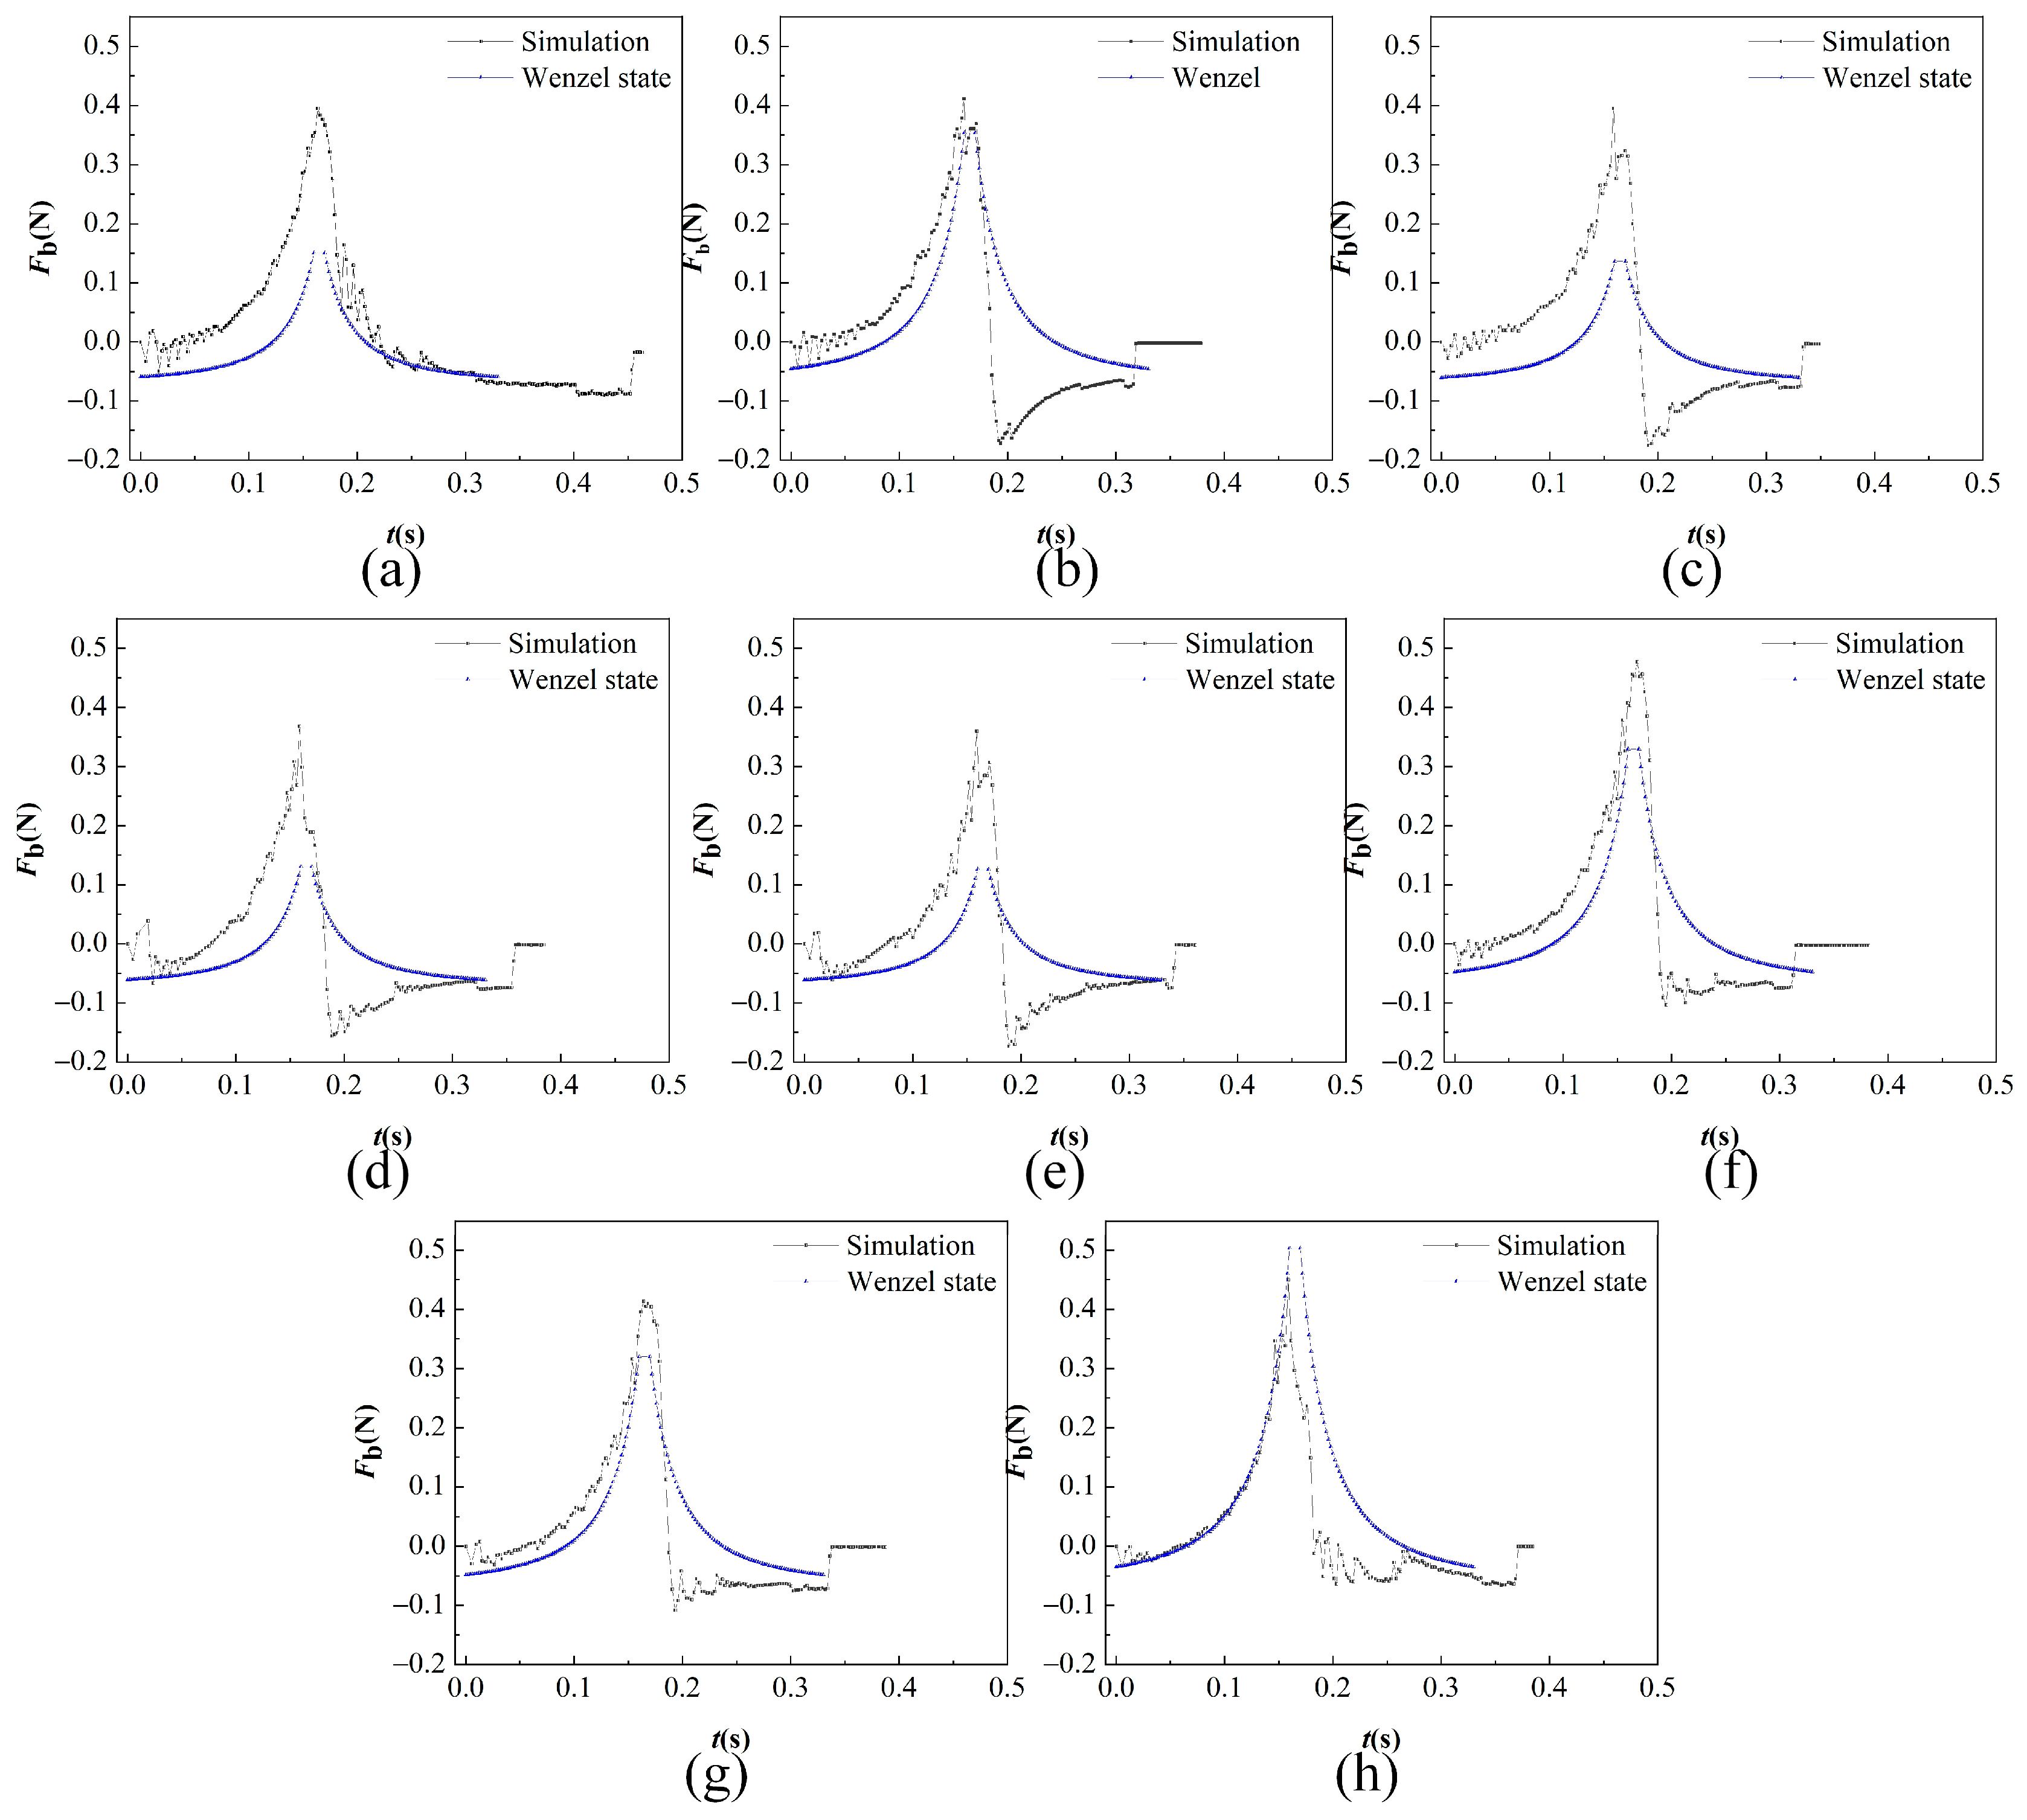
When the droplet maintains the Cassie–Baxter state on the microstructured surface, the pressure exerted on this surface during upper plate compression exceeds that on a smooth surface under identical contact angles and liquid bridge heights (Figure 3 and Figure 6). This pressure enhancement stems from microstructures increasing the apparent contact angle, which amplifies surface non-wettability [43,44].

4.1.3. Wenzel State

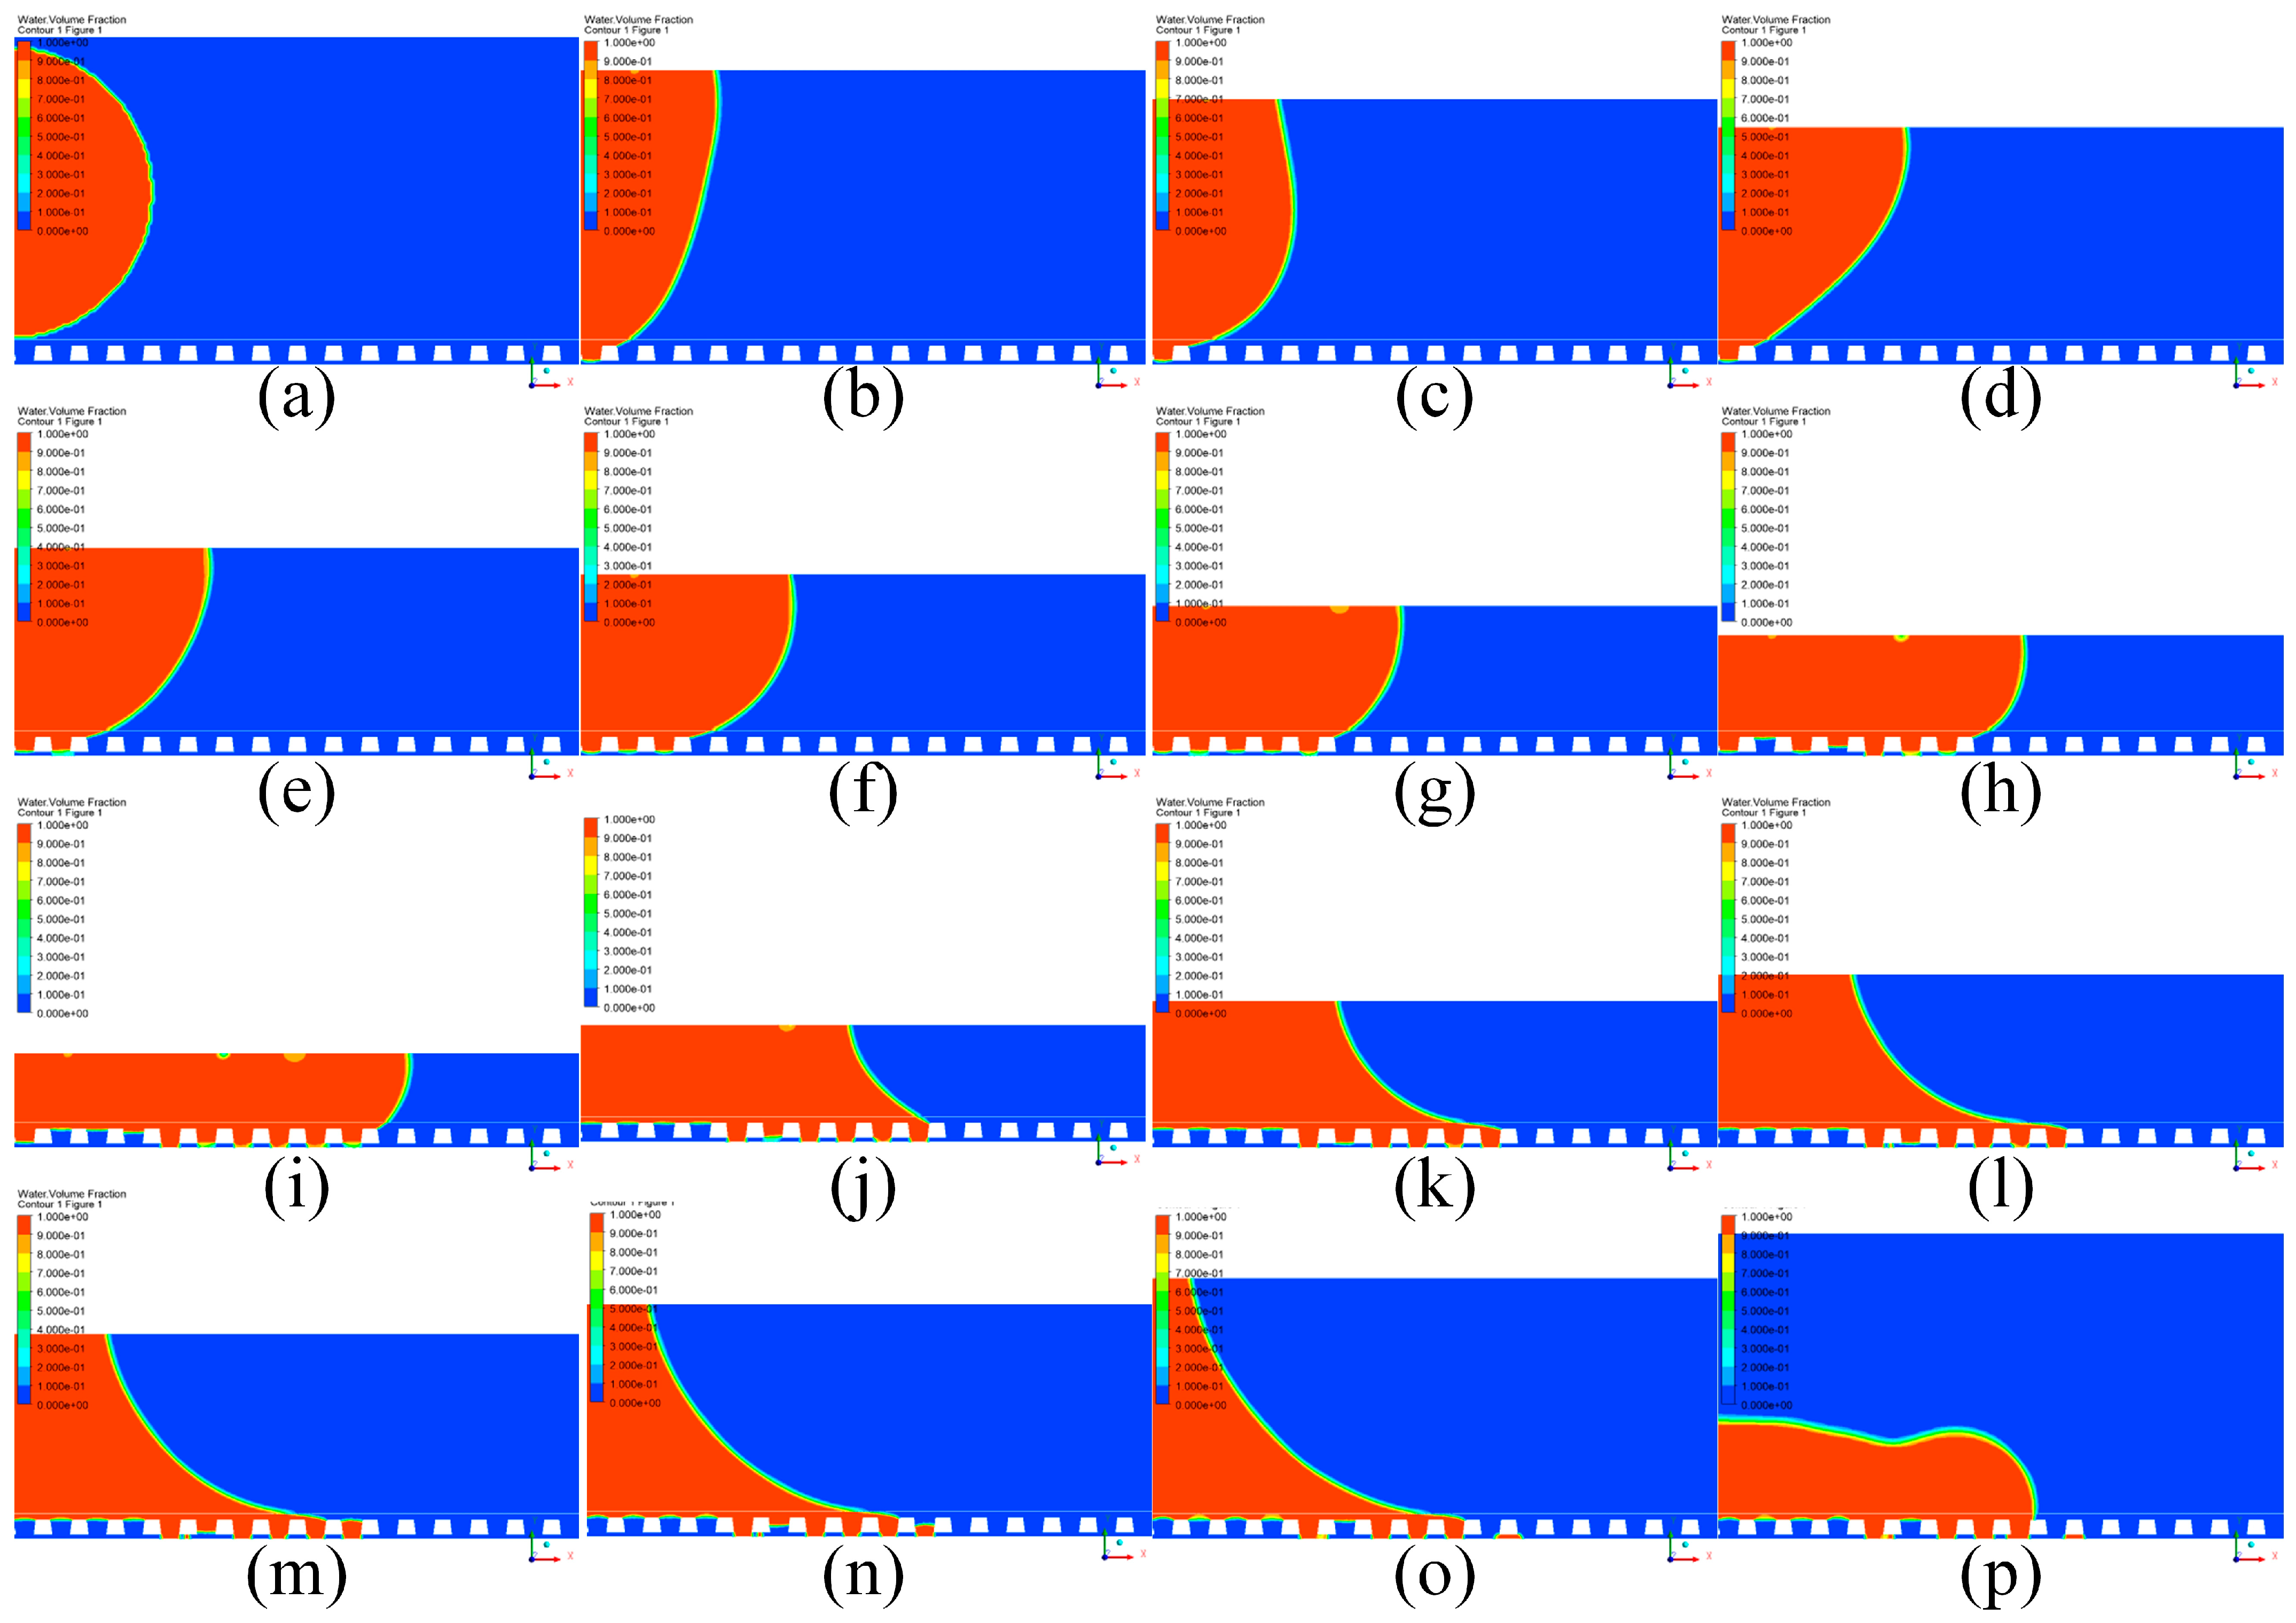
When the capillary pressure threshold at the microstructure–liquid–air interface falls below the Laplace pressure within the droplet, the droplet transitions to the Wenzel state and impregnates the microstructures. This transition is irreversible under practical conditions [43,44,59,60]. With geometric parameters reducing to f = 1   a n d   r = ( W t b W t t 2 + 4 H t 2 + W t t + S t ) / ( W t b + S t ) , simplifying Equation (1) to Equation (16). In the Wenzel state, during plate compression, theoretical capillary forces on both surfaces show excellent agreement with simulations; during plate release (upward motion), significant discrepancies emerge (Figure 8) due to droplet spreading dynamics. Although the outermost contact line pins on trapezoidal microstructures during release (Figure 9a–h), the apparent contact angle remains consistent with theoretical predictions. Crucially, this angle consistency explains the force agreement during compression but not during release, where contact line pinning dominates force behavior.
cos θ eb = ( W tb W tt ) 2 + 4 H t 2 + W tt + S t W tb + S t cos θ Yb
Upon transitioning to the Wenzel state, the droplet’s outermost contact line becomes strongly pinned within microstructures, exhibiting minimal mobility (Figure 9i–p). Specifically, it remains immobilized between the tenth and eleventh left trapezoids. During upper plate ascent: The solid–liquid contact area on the microstructured surface remains nearly invariant; the contact angle progressively decreases, falling substantially below Wenzel model predictions (Figure 9p). This persistent pinning reduces the simulated apparent contact angle below theoretical values. Consequently, the theoretical capillary force significantly overpredicts simulation results (Figure 8). Ultimately, droplet deposition and microstructure impregnation render reversion to the Cassie–Baxter state energetically improbable.

4.2. Influence of Microstructures and Contact Angle on Droplet Transport Performance

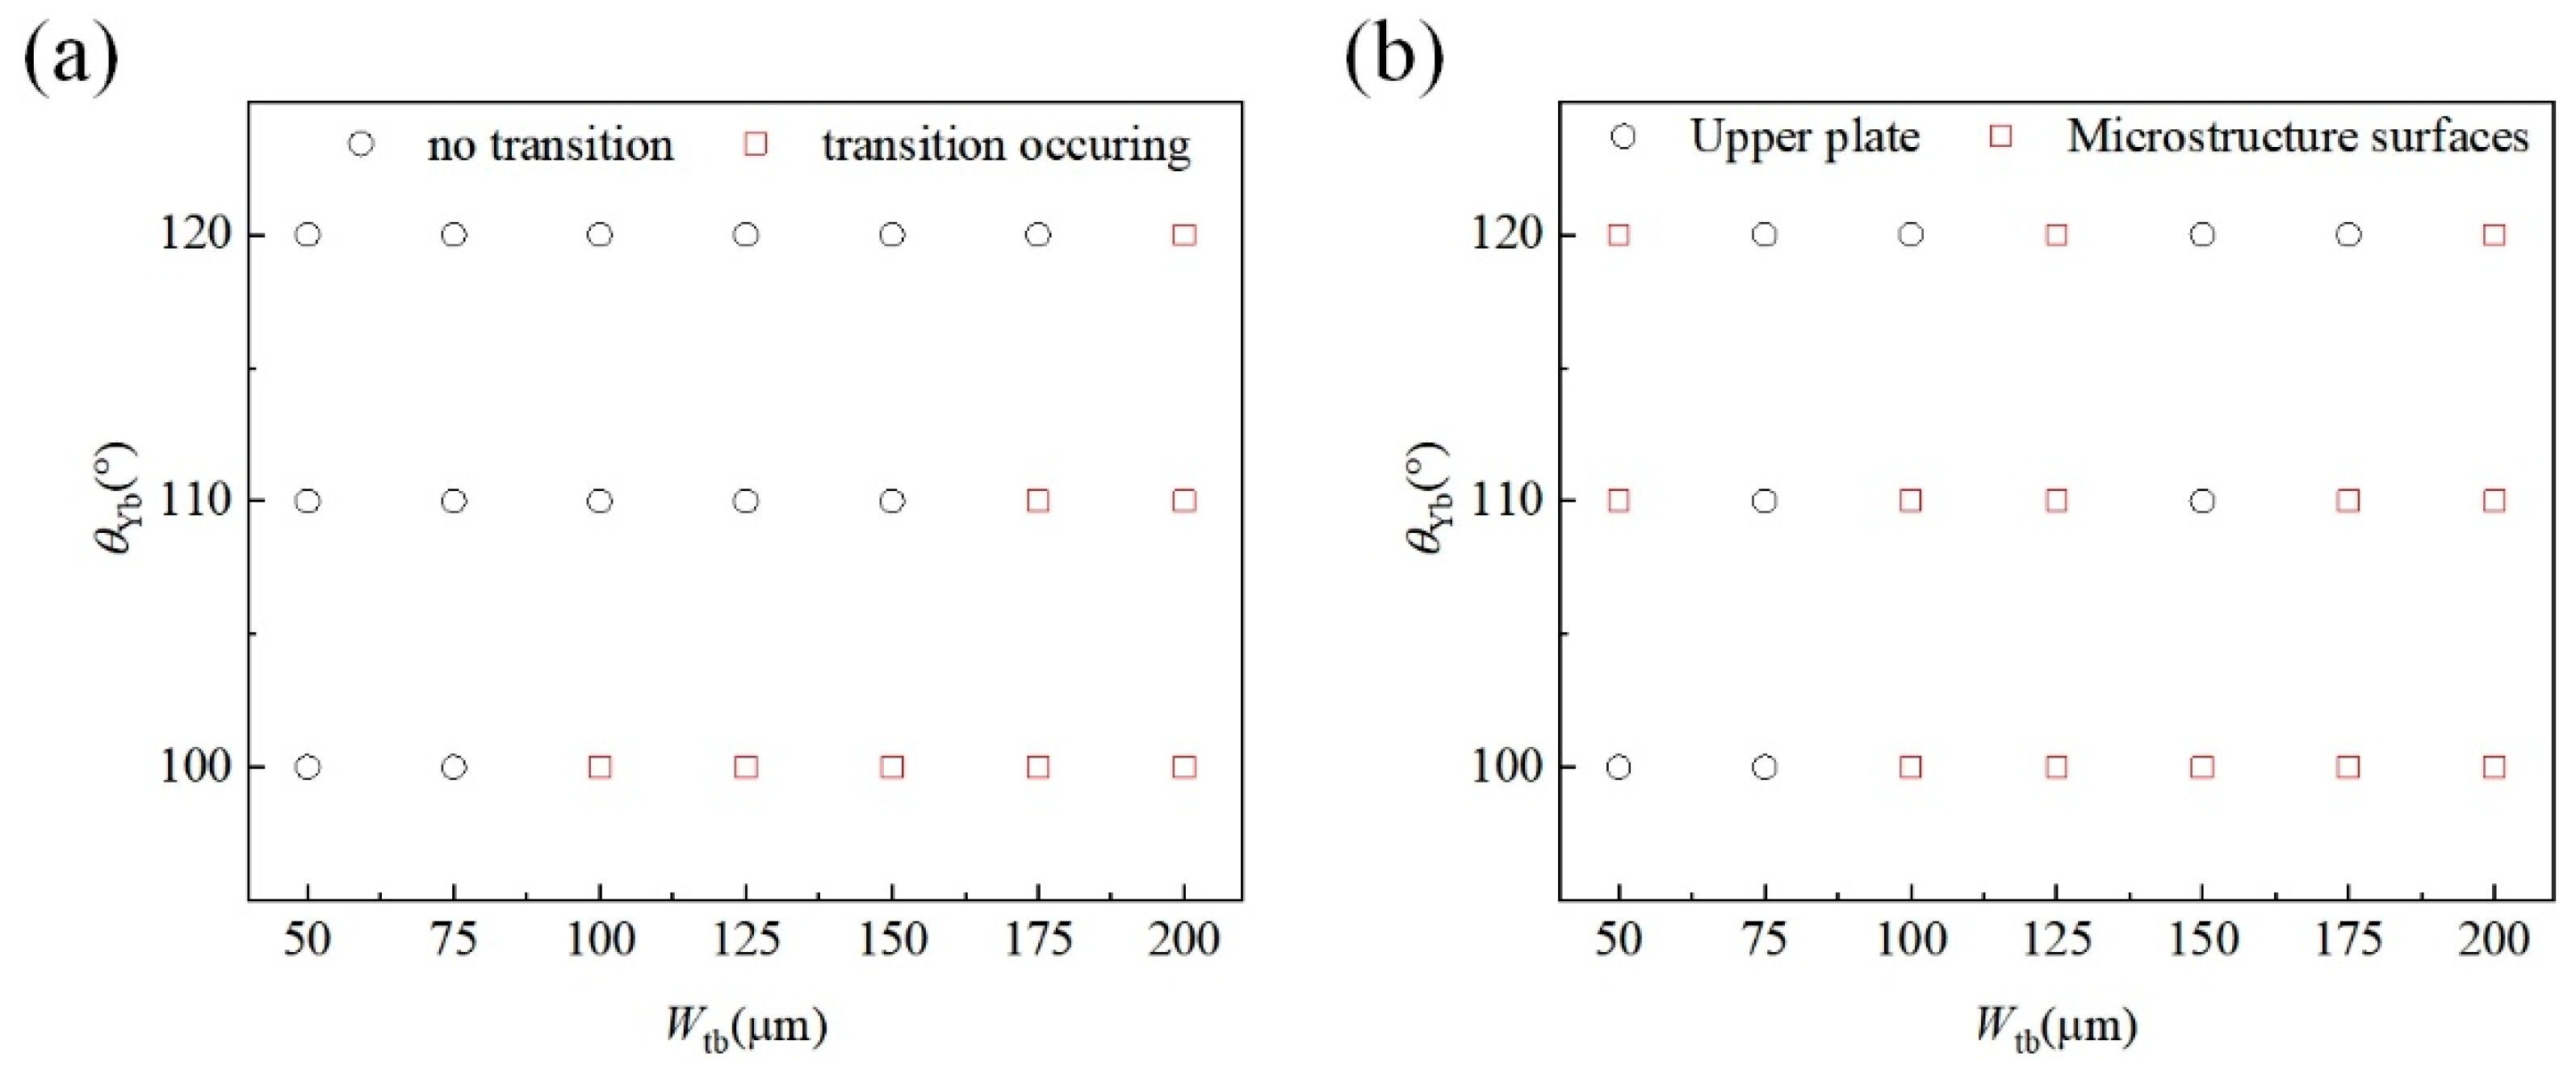
The bottom width Wtb of trapezoidal microstructures and intrinsic contact angle θYb govern droplet wetting states, directly impacting transport tendencies between liquid bridge surfaces. Figure 10a demonstrates that larger Wtb and smaller θYb increase wetting transition probability during compression–release cycles. Mechanistically, increased sidewall steepness (from larger Wtb) and reduced θYb lower the capillary pressure threshold, diminishing anti-wetting resistance [43,44,61]. For droplets maintaining the Cassie–Baxter state, liquid bridge rupture yields stochastic adhesion to either surface. This indeterminacy originates from contact line pinning/depinning dynamics during plate retraction (Figure 7), which perturbs droplet morphology. Such perturbations create rupture-time uncertainties in apparent contact angles (θeu, θeb), ultimately dictating droplet deposition preference. However, upon the Cassie-to-Wenzel wetting transition, the deposition outcome becomes deterministic: post-rupture, the droplet invariably adheres to the microstructured surface. This behavior is demonstrated in Figure 10a,b.
According to the statistical analysis of the simulation results, the rupture heights of the liquid bridges for each case are summarized in Table 1. When both the upper and lower surfaces are smooth (Wtb = 0.00 mm), the average rupture height across the three simulation cases is 4.85 mm. In contrast, for the 13 simulation cases with microstructured surfaces where the liquid bridge remained in the Cassie–Baxter state throughout compression and stretching, the average rupture height decreases to 3.22 mm. Moreover, in the 8 simulation cases where a Cassie–Wenzel transition occurred during compression/stretching, the average rupture height further decreases to 2.20 mm. These findings demonstrate that the introduction of surface microstructures markedly reduces the rupture height of liquid bridges, with the most pronounced effect observed when a wetting-state transition takes place.

5. Conclusions

Based on the principle of minimum energy, an analytical model for capillary forces in liquid bridges was derived, incorporating microstructural geometric parameters and intrinsic contact angles. Combined with Fluent’s dynamic mesh technology, this study systematically investigated how microstructure geometry and intrinsic contact angle govern force distribution and droplet transport. The key conclusions are:
(1)
For hydrophobic surfaces (θYb > 90°), capillary force directionality (tensile/compressive) and magnitude are co-determined by microstructure geometry, θYb, and bridge spacing H: at constant wetting state, force magnitude increases with decreasing H; Increasing H transitions forces from compressive to tensile, crossing a zero-force critical point. These insights can inform the design of microfluidic systems and MEMS devices requiring precise force control.
(2)
Decreasing H may trigger Cassie-to-Wenzel wetting transitions on microstructured surfaces. Post-transition, droplets exclusively adhere to microstructured surfaces after rupture. Understanding this transition provides guidance for bioinspired adhesive surfaces and functional coatings.
(3)
Microstructures significantly reduce liquid bridge rupture height compared to smooth surfaces, suggesting strategies for optimizing droplet manipulation, sensor sensitivity, and additive manufacturing processes in wet or humid environments.

Author Contributions

Conceptualization, Y.L.; validation, Y.W., G.L., J.Z. and T.L.; formal analysis, X.C., Y.W., G.L., J.Z. and T.L.; investigation, X.C.; writing—original draft, Y.L.; writing—review & editing, L.H. and B.Z.; supervision, L.H. and B.Z. All authors have read and agreed to the published version of the manuscript.

Funding

This work is supported by the National Natural Science Foundation of China (No. 52301306, 12293000, 12293001, 12293002), the Natural Science Foundation for Young Scientists of Shanxi Province, China (Nos. 202203021222059, 202203021212158, 202203021212139, 202203021222063, and 202303021212185). Aeronautical Science Foundation of China (No. 20230054072017).

Data Availability Statement

All data needed to evaluate the conclusions of this study are present in the paper. Additional data related to this study can be requested from the authors.

Conflicts of Interest

The authors declare no conflicts of interest.

References

  1. Peng, Z.; Wang, C.; Chen, S. Effects of surface wettability on gecko adhesion underwater. Colloids Surf. B Biointerfaces 2014, 122, 662–668. [Google Scholar] [CrossRef]
  2. Li, M.; Shi, L.; Wang, X. Physical mechanisms behind the wet adhesion: From amphibian toe-pad to biomimetics. Colloids Surf. B Biointerfaces 2021, 199, 111531. [Google Scholar] [CrossRef]
  3. Sun, T.; Liu, Y.; Tian, Y. Bio-inspired controllable adhesion for robotics: Mechanisms, design, and future directions. Robotica 2025, 43, 2751–2781. [Google Scholar] [CrossRef]
  4. Makrygianni, M.; Margariti, E.; Andritsos, K.; Reppas, D.; Zacharatos, F.; Oikonomidis, N.; Spandonidis, C.; Zergioti, I. High Speed Soldering Using Laser Printing for the Assembly of Electronic Components. J. Laser Micro/Nanoeng. 2020, 15, 204–208. [Google Scholar] [CrossRef]
  5. Goodband, S.; Kusumaatmaja, H.; Voïtchovsky, K. Development of a setup to characterize capillary liquid bridges between liquid infused surfaces. AIP Adv. 2022, 12, 015120. [Google Scholar] [CrossRef]
  6. Xiao, Y.; You, Z.; Wang, L.; Du, Z. A critical review of capillary pressure behavior and characterization in fractional-wet reservoirs. Capillarity 2024, 10, 12–21. [Google Scholar] [CrossRef]
  7. Dejam, M.; Hassanzadeh, H. Formation of liquid bridges between porous matrix blocks. AIChE J. 2011, 57, 286–298. [Google Scholar] [CrossRef]
  8. Eggers, J.; Sprittles, J.E.; Snoeijer, J.H. Coalescence Dynamics. Annu. Rev. Fluid Mech. 2025, 57, 61–87. [Google Scholar] [CrossRef]
  9. Zheng, J.; Ge, P.; Bi, W.; Zhao, Y.; Wang, C. Action mechanism of liquid bridge between electroplated diamond wires for ultrathin wafer slicing. Sol. Energy 2022, 231, 343–354. [Google Scholar] [CrossRef]
  10. Bian, X.; Huang, H.; Chen, L.; Shen, X. Droplet Tweezers Based on the Hydrophilic-Hydrophobic Interface Structure and Their Biological Application. Langmuir 2022, 38, 13522–13531. [Google Scholar] [CrossRef]
  11. Azizian, P.; Casals-Terré, J.; Ricart, J.; Cabot, J.M. Capillary-driven microfluidics: Impacts of 3D manufacturing on bioanalytical devices. Analyst 2023, 148, 2657–2675. [Google Scholar] [CrossRef] [PubMed]
  12. Zhao, Z.; Wang, W.; Xiang, G.; Jiang, L.; Jiang, X. Capillary-Assisted Confinement Assembly for Advanced Sensor Fabrication: From Superwetting Interfaces to Capillary Bridge Patterning. ACS Nano 2025, 19, 3019–3036. [Google Scholar] [CrossRef]
  13. Brockmann, P.; Lannert, M.; Ennayar, H.; Cao, Y.; Dong, X.; Zhang, Z.; Brulin, S.; Roisman, I.V.; Hussong, J. Enhancement of interfacial instabilities by solid particles during fast stretching of a liquid suspension bridge. Soft Matter 2025, 21, 6559–6574. [Google Scholar] [CrossRef] [PubMed]
  14. Wei, Z.; Sun, Y.; Ding, W.; Wang, Z. The formation of liquid bridge in different operating modes of AFM. Sci. China Phys. Mech. Astron. 2016, 59, 694611. [Google Scholar] [CrossRef]
  15. Wei, Z.; Zhao, Y. Growth of liquid bridge in AFM. J. Phys. D Appl. Phys. 2007, 40, 4368–4375. [Google Scholar] [CrossRef]
  16. Wang, R.; Lai, T. Comparison of contact time dependence of adhesion force between silica/DLC and silica/graphene interfaces by AFM at different humidities. J. Phys. Conf. Ser. 2024, 2819, 012012. [Google Scholar] [CrossRef]
  17. Hu, R.; Luo, M.; Liu, T.; Liang, L.; Huang, A.; Trushnikov, D.; Karunakaran, K.P.; Pang, S. Thermal fluid dynamics of liquid bridge transfer in laser wire deposition 3D printing. Sci. Technol. Weld. Join. 2019, 24, 401–411. [Google Scholar] [CrossRef]
  18. Lee, J.; Lu, Y.; Kashyap, S.; Alarmdari, A.; Emon, M.O.F.; Choi, J.-W. Liquid bridge microstereolithography. Addit. Manuf. 2018, 21, 76–83. [Google Scholar] [CrossRef]
  19. Zhi, P.; Wu, Y.-C.; Rabczuk, T. Effects of time-varying liquid bridge forces on rheological properties, and resulting extrudability and constructability of three-dimensional printing mortar. Front. Struct. Civ. Eng. 2023, 17, 1295–1309. [Google Scholar] [CrossRef]
  20. Bagheri, M.; Roy, S.; Pöschel, T. Approximate expressions for the capillary force and the surface area of a liquid bridge between identical spheres. Comput. Part. Mech. 2024, 11, 2179–2190. [Google Scholar] [CrossRef]
  21. Mu, F.; Su, X. Analysis of liquid bridge between spherical particles. China Particuology 2007, 5, 420–424. [Google Scholar] [CrossRef]
  22. Willett, C.; Adams, M.; Johnson, S.; Seville, J. Capillary Bridges between Two Spherical Bodies. Langmuir 2000, 16, 9396–9405. [Google Scholar] [CrossRef]
  23. Nguyen, H.; Millet, O.; Gagneux, G. On the capillary bridge between spherical particles of unequal size: Analytical and experimental approaches. Contin. Mech. Thermodyn. 2018, 31, 225–237. [Google Scholar] [CrossRef]
  24. Zhao, C.; Kruyt, N.; Millet, O. Capillary bridges between spherical particles under suction control: Rupture distances and capillary forces. Powder Technol. 2020, 360, 622–634. [Google Scholar] [CrossRef]
  25. Xiao, F.; Jing, J.; Kuang, S.; Yang, L.; Yu, A. Capillary forces on wet particles with a liquid bridge transition from convex to concave. Powder Technol. 2020, 363, 59–73. [Google Scholar] [CrossRef]
  26. Wu, D.; Zhou, P.; Wang, G.; Zhao, B.; Howes, T.; Chen, W. Modeling of capillary force between particles with unequal contact angle. Powder Technol. 2020, 376, 390–397. [Google Scholar] [CrossRef]
  27. Wu, D.; Zhou, P.; Zhao, B.; Howes, T.; Wang, G. Liquid redistribution upon the liquid-bridge rupture between two unequal particles with a minimal energy method. Powder Technol. 2019, 354, 165–173. [Google Scholar] [CrossRef]
  28. Murase, K.; Mochida, T.; Sugama, H. Experimental and numerical studies on liquid bridge formed among three spheres. Granul. Matter 2004, 6, 111–119. [Google Scholar] [CrossRef]
  29. Murase, K.; Mochida, T.; Sagawa, Y.; Sugama, H. Estimation on the Strength of a Liquid Bridge Adhered to Three Spheres. Adv. Powder Technol. 2008, 19, 349–367. [Google Scholar] [CrossRef]
  30. Wang, J.; Gallo, E.; François, B.; Gabrieli, F.; Lambert, P. Capillary force and rupture of funicular liquid bridges between three spherical bodies. Powder Technol. 2017, 305, 89–98. [Google Scholar] [CrossRef]
  31. Teixeira, P.; Teixeira, M. The shape of two-dimensional liquid bridges. J. Phys. Condens. Matter 2020, 32, 034002. [Google Scholar] [CrossRef]
  32. Chen, H.; Tang, T.; Zhao, H.; Law, K.; Amirfazli, A. How pinning and contact angle hysteresis govern quasi-static liquid drop transfer. Soft Matter 2016, 12, 1998–2008. [Google Scholar] [CrossRef]
  33. Kwon, S.; Kim, B.; An, S.; Lee, W.; Kwak, H.Y.; Jhe, W. Adhesive force measurement of steady-state water nano-meniscus: Effective surface tension at nanoscale. Sci. Rep. 2018, 8, 8462. [Google Scholar] [CrossRef]
  34. Yang, L.; Tu, Y.; Fang, H. Modeling the rupture of a capillary liquid bridge between a sphere and plane. Soft Matter 2010, 6, 6178–6182. [Google Scholar] [CrossRef]
  35. Honschoten, V.; Tas, N.; Elwenspoek, M. The profile of a capillary liquid bridge between solid surfaces. Am. J. Phys. 2010, 78, 277–286. [Google Scholar] [CrossRef]
  36. Rabinovich, Y.; Esayanur, M.; Moudgil, B. Capillary Forces between Two Spheres with a Fixed Volume Liquid Bridge: Theory and Experiment. Langmuir 2005, 21, 10992–10997. [Google Scholar] [CrossRef] [PubMed]
  37. Guo, H.; Li, Q.; Zhao, H.; Zhou, K.; Feng, X. Functional map of biological and biomimetic materials with hierarchical surface structures. RSC Adv. 2015, 5, 66901–66926. [Google Scholar] [CrossRef]
  38. Butler, M.; Vella, D. Liquid bridge splitting enhances normal capillary adhesion and resistance to shear on rough surfaces. J. Colloid Interface Sci. 2022, 607, 514–529. [Google Scholar] [CrossRef] [PubMed]
  39. Nguyen, H.; Zhao, C.; Millet, O.; Selvadurai, A. Effects of surface roughness on liquid bridge capillarity and droplet wetting. Powder Technol. 2021, 378, 487–496. [Google Scholar] [CrossRef]
  40. Matsuoka, H.; Miyamoto, M.; Fukui, S. Effects of surface roughness on characteristics of liquid transfer due to breakage of liquid meniscus bridge. Microsyst. Technol. 2016, 22, 1397–1404. [Google Scholar] [CrossRef]
  41. Zheng, J.; Streator, J. A liquid bridge between two elastic half-spaces: A theoretical study of interface instability. Tribol. Lett. 2004, 16, 1–9. [Google Scholar] [CrossRef]
  42. Zhu, M.; Huang, L.; Zhang, B.; Chen, S.; Zhang, H.; Zhang, X.; Li, D.; Yao, Y.; Peng, Z.; Chen, S. Recent progress in optimal design of superhydrophobic surfaces. APL Mater. 2022, 10, 110701–110715. [Google Scholar] [CrossRef]
  43. Huang, L.; Yao, Y.; Peng, Z.; Zhang, B.C.; Chen, S. One-level microstructure-arrayed hydrophobic surface with low surface adhesion and strong anti-wetting function. J. Phys. Condens. Matter 2021, 33, 505002. [Google Scholar] [CrossRef] [PubMed]
  44. Huang, L.; Yao, Y.; Peng, Z.; Zhang, B.; Chen, S. How to achieve a monostable Cassie state on a micropillar-arrayed superhydrophobic surface. J. Phys. Chem. B 2021, 125, 883–894. [Google Scholar] [CrossRef]
  45. Chen, H.; Amirfazli, A.; Tang, T. Modeling liquid bridge between surfaces with contact angle hysteresis. Langmuir 2013, 29, 3310–3319. [Google Scholar] [CrossRef]
  46. Chen, J.; Wang, P.; Li, M.; Shen, J.; Howes, T.; Wang, G. Rupture distance and shape of the liquid bridge with rough surface. Miner. Eng. 2021, 167, 106888. [Google Scholar] [CrossRef]
  47. Rodrigues, M.; Coelho, R.; Teixeira, P. Dynamics of liquid bridges between patterned surfaces. Phys. D Nonlinear Phenom. 2024, 469, 134322. [Google Scholar] [CrossRef]
  48. Shao, Z.; Ji, R.; Liu, Q. Tree-frog-inspired osmocapillary adhesive bonding to diverse substrates. arXiv 2025, arXiv:2405.05730. [Google Scholar]
  49. Gao, Y.; Yan, C.; Huang, H.; Yang, T.; Tian, G.; Xiong, D.; Chen, N.; Chu, X.; Zhong, S.; Deng, W.; et al. Microchannel-Confined MXene Based Flexible Piezoresistive Multifunctional Micro-Force Sensor. Adv. Funct. Mater. 2020, 30, 1909603. [Google Scholar] [CrossRef]
  50. Feng, J.; Qiu, Y.; Jiang, L.; Wu, Y. Long-Range-Ordered Assembly of Micro-/Nanostructures at Superwetting Interfaces. Adv. Mater. 2022, 34, e2106857. [Google Scholar] [CrossRef] [PubMed]
  51. Zheng, H.; Li, J.; Zhou, Y.; Zhang, C.; Xu, W.; Deng, Y.; Li, J.; Feng, S.; Yi, Z.; Zhou, X.; et al. Electrically switched underwater capillary adhesion. Nat. Commun. 2022, 13, 4584. [Google Scholar] [CrossRef] [PubMed]
  52. Milne, A.; Amirfazli, A. The Cassie equation: How it is meant to be used. Adv. Colloid Interface Sci. 2012, 170, 48–55. [Google Scholar] [CrossRef] [PubMed]
  53. Li, X.; Wang, D.; Huang, F.; Cai, Z.; Gao, Z. Stretching and rupture of a viscous liquid bridge between two spherical particles. Asia-Pac. J. Chem. Eng. 2020, 16, e2579. [Google Scholar] [CrossRef]
  54. Gao, S.; Jin, L.; Du, J.; Liu, H. The Liquid-Bridge with Large Gap in Micro Structural Systems. J. Mod. Phys. 2011, 2, 404–415. [Google Scholar] [CrossRef]
  55. Chen, J.; Shen, J.; Guo, J.; Wang, G. Separation efficiency of liquid–solid undergoing vibration based on breakage of liquid bridge. Particuology 2022, 61, 103–110. [Google Scholar] [CrossRef]
  56. Dong, L.; Chaudhury, A.; Chaudhury, M. Lateral vibration of a water drop and its motion on a vibrating surface. Eur. Phys. J. E Soft Matter Biol. Phys. 2006, 21, 231–242. [Google Scholar] [CrossRef] [PubMed]
  57. Endlein, T.; Barnes, W. Wet Adhesion in Tree and Torrent Frogs. In Encyclopedia of Nanotechnology; Springer: Dordrecht, The Netherlands, 2016; pp. 4355–4373. [Google Scholar]
  58. Tselishchev, Y.; Val’tsifer, V. Influence of the Type of Contact between Particles Joined by a Liquid Bridge on the Capillary Cohesive Forces. Colloid J. 2003, 65, 385–389. [Google Scholar] [CrossRef]
  59. Li, Y.; Quere, D.; Lv, C.; Zheng, Q. Monostable superrepellent materials. Proc. Natl. Acad. Sci. USA 2017, 114, 3387–3392. [Google Scholar] [CrossRef]
  60. Fang, W.; Guo, H.; Li, B.; Li, Q.; Feng, X. Revisiting the critical condition for the Cassie–Wenzel transition on micropillar-structured surfaces. Langmuir 2018, 34, 3838–3844. [Google Scholar] [CrossRef]
  61. Luo, C.; Xiang, M. Existence and stability of an intermediate wetting state on circular micropillars. Microfluid. Nanofluid. 2014, 17, 539–548. [Google Scholar] [CrossRef]
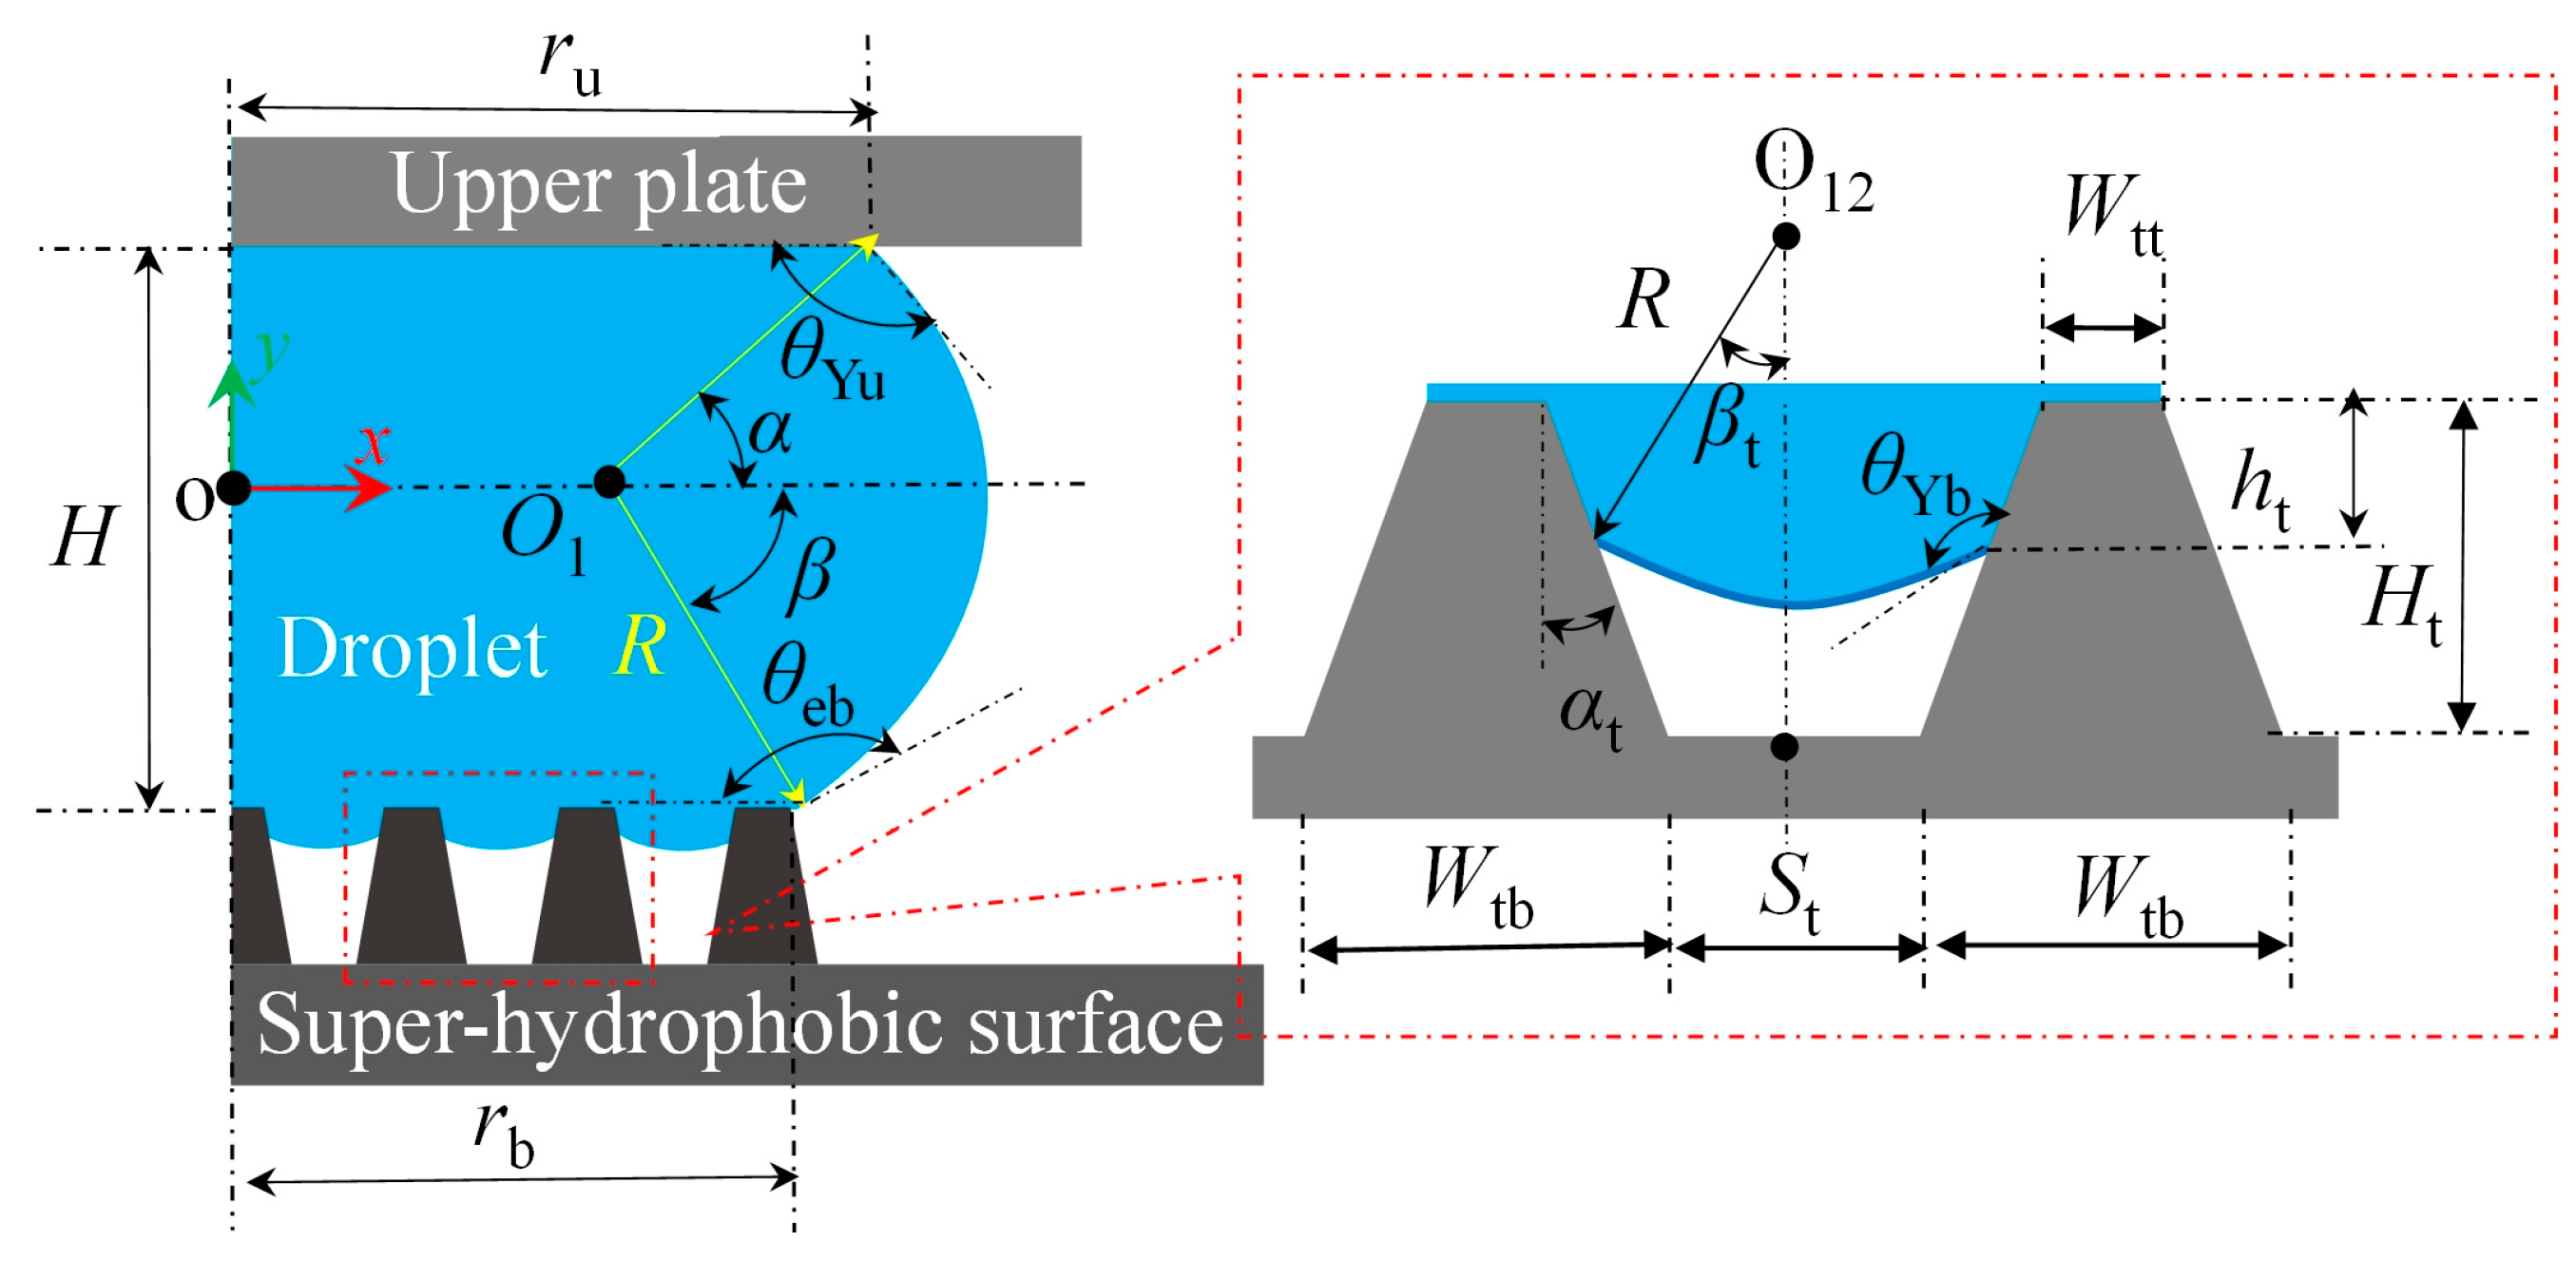
Figure 1. Schematic of a 2D liquid bridge confined between a smooth surface and a microstructured surface with trapezoidal features.
Surfaces 08 00073 g001
Figure 2. Boundary conditions and plate motion in the liquid bridge simulation. (a) Computational domain with boundary settings. (b) Upper plate displacement versus simulated time.
Surfaces 08 00073 g002
Figure 3. Evolution of capillary force on the lower surface versus time for varying Young’s contact angle θ Y b under ideal smooth-surface conditions ( f = 1 ,   r = 1 ).
Surfaces 08 00073 g003
Figure 4. Droplet oscillation dynamics during initial liquid bridge formation: Water volume fraction contours. (a) 0.000 s; (b) 0.002 s; (c) 0.004 s; (d) 0.006 s; (e) 0.008 s; (f) 0.010 s; (g) 0.012 s; (h) 0.014 s; (i) 0.016 s; (j) 0.018 s; (k) 0.020 s; (l) 0.022 s; (m) 0.024 s; (n) 0.026 s; (o) 0. 028 s; (p) 0.030 s. In the legend, blue represents a gas volume fraction of 1 and red represents a liquid volume fraction of 1.
Surfaces 08 00073 g004
Figure 5. Droplet deformation under quasi-static compression: Water volume fraction contours at selected time instants during upper plate displacement. Time progression: (a) 0.00 s; (b) 0.020 s; (c) 0.040 s; (d) 0.060 s; (e) 0.080 s; (f) 0.100 s; (g) 0.120 s; (h) 0.140 s; (i) 0.160 s; (j) 0.170 s; (k) 0.190 s; (l) 0.210 s; (m) 0.230 s; (n) 0.250 s; (o) 0.270 s; (p) 0.290 s. In the legend, blue represents a gas volume fraction of 1, and red represents a liquid volume fraction of 1.
Surfaces 08 00073 g005
Figure 6. Evolution of capillary force on the lower surface of the liquid bridge as a function of time and contact angle f = W t t / ( W t b + S t ) ,   r = 1 . (a) W t b = 50   μ m ,   θ Y b = 100 ° ; (b) W t b = 75   μ m ,   θ Y b = 100 ° ; (c) W t b = 50   μ m ,   θ Y b = 110 ° ; (d) W t b = 75   μ m ,   θ Y b = 110 ° ; (e) W t b = 100   μ m ,   θ Y b = 110 ° ; (f) W t b = 125   μ m ,   θ Y b = 110 ° ; (g) W t b = 150   μ m ,   θ Y b = 110 ° ; (h) W t b = 75   μ m ,   θ Y b = 120 ° ; (i) W t b = 100   μ m ,   θ Y b = 120 ° ; (j) W t b = 125   μ m ,   θ Y b = 120 ° ; (k) W t b = 150   μ m ,   θ Y b = 120 ° ; (l) W t b = 175   μ m ,   θ Y b = 120 ° .
Surfaces 08 00073 g006
Figure 7. Contact angle hysteresis during cyclic compression–release of the upper plate at W tb = 75   μ m and θ Yb = 100 ° : Water volume fraction contours illustrating droplet interface evolution. (a) 0.080 s; (b) 0.084 s; (c) 0.091 s; (d) 0.093 s; (e) 0.095 s; (f) 0.097 s; (g) 0.100 s; (h) 0.103 s; (i) 0.247 s; (j) 0.249 s; (k) 0.252 s; (l) 0.254 s; (m) 0.256 s; (n) 0.259 s; (o) 0.261 s; (p) 0.263 s. In the legend, blue represents a gas volume fraction of 1, and red represents a liquid volume fraction of 1.
Surfaces 08 00073 g007
Figure 8. Evolution of capillary force on the lower surface of the liquid bridge as a function of time and contact angle f = 1 ,     r = ( W t b W t t 2 + 4 H t 2 + W t t + S t ) / ( W t b + S t ) . (a) W t b = 100   μ m ,     θ Y b = 100 ° ; (b) W t b = 125   μ m ,     θ Y b = 100 ° ; (c) W t b = 150   μ m ,     θ Y b = 100 ° ; (d) W t b = 175   μ m ,     θ Y b = 100 ° ; (e) W t b = 200   μ m ,     θ Y b = 100 ° ; (f) W t b = 175   μ m ,     θ Y b = 110 ° ; (g) W t b = 200   μ m ,     θ Y b = 110 ° ; (h) W t b = 200   μ m ,     θ Y b = 120 ° .
Surfaces 08 00073 g008
Figure 9. Water volume fraction contours illustrating the pinning of the droplet after the wetting transition occurs. (a) 0.000 s; (b) 0.020 s; (c) 0.042 s; (d) 0.061 s; (e) 0.081 s; (f) 0.100 s; (g) 0.121 s; (h) 0.142 s; (i) 0.161 s; (j) 0.191 s; (k) 0.211 s; (l) 0.230 s; (m) 0.252 s; (n) 0.271 s; (o) 0.290 s; (p) 0.321 s. In the legend, blue represents a gas volume fraction of 1, and red represents a liquid volume fraction of 1.
Surfaces 08 00073 g009
Figure 10. Statistical analysis of Wtb and θYb on droplet transport: (a) Wetting state phase diagram. Black circles: Cassie state maintained; red squares: Cassie-to-Wenzel transition occurred. (b) Deposition outcome after rupture. Black circles: adhered to the upper plate; red squares: adhered to the microstructured surface.
Surfaces 08 00073 g010
Table 1. Statistical results of rupture heights of liquid bridges in different simulation cases (unit: mm).
Wtb (mm)0.000.050.0750.100.1250.150.1750.20
θYb = 100°6.343.272.683.221.842.022.222.09
θYb = 110°4.503.833.413.763.432.861.802.04
θYb = 120°3.723.413.113.293.482.522.842.37
Disclaimer/Publisher’s Note: The statements, opinions and data contained in all publications are solely those of the individual author(s) and contributor(s) and not of MDPI and/or the editor(s). MDPI and/or the editor(s) disclaim responsibility for any injury to people or property resulting from any ideas, methods, instructions or products referred to in the content.