Abstract
Accelerated synthesis of gold nanoparticles (AuNPs) in charged microdroplets produced by electrospray ionization (ESI) was exploited to modify the surface of graphite screen-printed electrodes (GSPEs). The deposited AuNPs were then functionalized by the charged microdroplets deposition of 6-ferrocenyl-hexanethiol (6Fc-ht) solutions that act as reducing and stabilizing agents and provide electrochemical properties for the modified electrodes. The morphology and composition of the AuNPs were characterized by scanning electron microscopy (SEM). Cyclic voltammetry (CV), differential pulse voltammetry (DPV) and electrochemical impedance spectroscopy (EIS) were used to investigate the electrochemical behavior of the modified electrodes. The results showed that the ESI microdroplets deposition technique produces uniform and well-dispersed AuNPs on GSPE, and optimal conditions for deposition were identified, enhancing GSPE electrocatalytic performance. Further functionalization by ESI microdroplets of AuNPs with 6Fc-ht demonstrated improved redox properties compared with the conventional self-assembled monolayer (SAM) method, highlighting the technique’s potential for the easy and fast functionalization of electrochemical sensors.
1. Introduction
Electrospray ionization (ESI) is a mass spectrometric technique that allows obtaining gaseous naked ions of nonvolatile molecules by spraying microdroplets into a high-voltage electric field whose invention by John Fenn was awarded the Nobel Prize [1]. In recent years, ESI microdroplets have gained additional interest in the scientific community as they have been demonstrated to be a unique medium where ionic reactions can be accelerated 106 times with respect to the same bulk processes [2]. Starting from the first studies by Cooks and Zare [3,4], a large variety of chemical and biological processes in solution were demonstrated to occur in the microseconds fly-time of the microdroplets before their Coulombic explosion into naked ions [5,6,7,8,9,10,11,12,13,14,15].
Furthermore, the microdroplets deposited onto a solid surface generate a thin film that retains their peculiar, confined volume but allows for the neutral products of the reaction to be separated and quantified [16,17,18,19,20,21,22,23,24,25]. Moreover, the thin film is continuously formed by microdroplets deposition, thus extending the reaction time to any desired longer value with respect to the microsecond droplet lifetime. Furthermore, several studies demonstrated that metal nanoparticles can be efficiently deposited onto a target surface from solutions of metal ion salts [26,27,28]. These unusual applications of mass spectrometry have enormously broadened the field of its applications from a purely analytical technique to a procedure capable of supporting or improving classic synthetic methods in solution [29,30]. Gold nanoparticles (AuNPs) are nanoscale gold particles with unique optical, electrical, and catalytic properties [31]. One of the challenges in using AuNPs for various applications is to control their size, shape, and surface chemistry. Functionalization of AuNPs with organic molecules such as thiols can modify their surface properties and enhance their stability, biocompatibility, and functionality. Recently, Zare and coworkers demonstrated that AuNPs can be formed by ESI microdroplets deposition at ambient conditions by spraying a solution containing only tetracholoroauric acid without adding reducing agents [32].
Moreover, AuNPs of less than 10 nm in diameter were generated in the microsecond time scale. The fast formation of AuNPs was attributed to the strong electric field at the water–air microdroplets interface. In this study, the procedure developed by Zare was used to modify the surface of graphite screen-printed electrodes (GSPE). The morphology of the AuNPs was characterized by scanning electron microscopy (SEM), whereas cyclic voltammetry (CV), differential pulse voltammetry (DPV) and electrochemical impedance spectroscopy (EIS) were used to investigate the electrochemical behavior of the modified electrodes. Furthermore, the same deposition method was used to functionalize the AuNPs-modified electrode surface with 6-ferrocenyl-hexanethiol (6Fc-ht) as a redox probe. The results obtained pave the way for using this deposition technique to develop electrochemical sensors and biosensors.
2. Materials and Methods
2.1. Reagentes and Samples
Potassium ferricyanide (K3[Fe(CN)6]), potassium ferrocyanide (K4[Fe(CN)6]), potassium chloride (KCl), tetrachloroauric acid (HAuCl4), 6-ferrocenyl-hexanethiol (6Fc-ht), and methanol (MeOH) were purchased by Merck Life Science (Milan, Italy). All solutions used for the electrochemical measurements were prepared using Milli-Q water (R = 18.2 MΩ cm at 25 °C; TOC < 10 μg L−1, Millipore, Molsheim, France). GSPE electrodes were purchased by Metrohm Italiana S.r.L. (Origgio, Italy) K3[Fe(CN)6]/K4[Fe(CN)6] 1 mM and 5 mM solutions were prepared in KCl 0.1 M. The 6-Ferrocenyl-hexanethiol 1 mM stock solution used to modify GSPE electrodes via ESI and SAM methods was prepared by dissolving the reagent in pure MeOH.
2.2. ESI Z-Spray Microdroplets Deposition Experiments
Microdroplets deposition experiments were performed by using the Z-spray ionization (ESI) source of a quadrupole-time of flight (Q-TOF, Ultima, Micromass, Manchester, UK) mass spectrometer suitably adapted to microdroplets reaction studies [33]. Briefly, in the ESI Z-spray source, the microdroplets, dried by the N2 desolvation gas, hit the GSPE working surface fixed on a target plate whose distance from the exit of the ESI capillary can be varied from 1.0 to 3.0 cm. The GSPE working surface was biased with the same voltage applied to the ESI source cone, thus allowing the charged microdroplets stream to be selectively focalized onto this part of the screen-printed electrode (supplementary materials, Figure S1). The sprayed HAuCl4 water solutions were prepared daily at a total concentration of 6.4 × 10⁻⁵ M. Nitrogen was used as desolvation gas at a flow rate of 200 L h−1 and at a temperature of 200 °C (corresponding to an actual microdroplets stream temperature of 70 °C). The ESI Z-spray experiments involving HAuCl4 were performed in negative ion mode. Typical source potentials were as follows: capillary −2.5 kV, cone voltage 70 V, RF lens-1 120 V, and syringe pump flow 20 μL min−1. After the AuNPs deposition, the GSPE surfaces were treated with a spray of microdroplets containing 6Fc-ht. The 6Fc-ht methanol solutions were prepared daily at a total concentration of 1.0 × 10⁻⁵ M and were delivered to the GSPE working surface for 10 min. The 6Fc-ht deposition through the ESI Z-spray source was performed in positive ion mode. Typical source potentials were as follows: capillary 3.5 kV, cone 70 V, RF lens-1 120 V, desolvation gas flow rate 200 L h−1, temperature 200 °C and syringe pump flow 20 μL min−1. In the case of H2O2 oxidation catalysis, the DPV measurements were conducted in a 5 mL solution of PBS 0.01 M and KCl 0.1 M by adding increasing amounts of H2O2 from a 5 mM mother solution prepared in PBS 0.01 M.
2.3. Surface Characterization Apparatus
Scanning electron microscopy (SEM) was performed to characterize the electrode surface morphology using a Dual Beam Auriga (Zeiss instrument, Oberkochen (Germany) of the Sapienza Nanoscience and Nanotechnology Labs (SNN-Lab). Elemental evaluation of the AuNPs was ascertained by energy-dispersive X-ray (EDX) analysis.
2.4. Electrochemical Measurements and Apparatus
Cyclic voltammetry (CV) and differential pulse voltammetry (DPV) measurements were conducted in a three-electrode system consisting of a platinum wire as the counter electrode and an Ag/AgClsat. electrode as reference. The experiments were performed in a 10 mL solution of 1 mM K3[Fe(CN)6]/K4[Fe(CN)6] with KCl 0.1 M as a supporting electrolyte. Electrochemical impedance spectroscopy (EIS) measurements were carried out using the same three-electrode setup in a 5 mM K3[Fe(CN)6]/K4[Fe(CN)6] solution with KCl 0.1 M as supporting electrolyte. The experiments involving 6Fc-ht, CV, and DPV measurements were performed in 0.1 M KCl. All experiments were conducted at room temperature.
2.5. Self-Assembled Monolayer (SAM) Formation
The procedure to provide the formation of a SAM of 6Fc-ht onto the GSPE/AuNPs electrodes was realized by dipping the modified electrodes in a 1 mM thiol solution in ethanol for 24 h. Afterward, the electrodes were left to dry and rinsed with water and ethanol.
3. Results and Discussion
3.1. ESI Microdroplets Deposition Experiments
To probe the formation of gold in the Q-TOF ESI Z-spray modified source, a stream of aqueous microdroplets from a 6.4 × 10⁻⁴ M HAuCl4 solution was collected in negative ion mode onto a glass slide for 1 h. The formation of a naked-eye visible gold film clearly evidenced the capability of our systems to reproduce the Zare experiments (Figure S1). Moreover, even the negative ion mass spectrum registered with the Q-TOF mass-spectrometer was comparable with that reported by Zare et al., showing the signal corresponding to AuCl2− and AuCl4− as the prevalent anionic species produced by the complete desolvation of the ESI microdroplets. As underlined by Zare, the AuCl2− species clearly indicates that Au+3 is reduced inside the microdroplets. With the aim to promote the deposition of gold nanoparticles with as small as a nanometric diameter, the tetrachloroauric acid solution was diluted ten times (6.4 × 10⁻⁵ M), and the reaction time was reduced in the range of 2–10 min. The selected deposition times are considerably longer than the millisecond interval used by Zare et al. in their experiments. This choice was necessary to obtain intense electrochemical signals, but it led to an increase in the size of gold nanoparticles, which underwent aggregation phenomena (vide infra). The ESI microdroplets were collected onto the working area of a GSPE. ESI source parameters, such as electric field polarity and spray-target distance, may strongly affect the microdroplets deposition processes [34,35].
In a series of preliminary experiments, the distance between the ESI spray tip and the specific portion of the GSPE that has to be modified by AuNPs was varied from 1.0 to 3.5 cm. The DPV analysis of the AuNPs modified electrodes suggests that the optimal electrochemical signal was associated with the deposition of the ESI microdroplet stream at a distance to the graphite electrode of 2.5 cm. This parameter was then used to modify the working area of the GSPE electrodes with AuNPs in all the subsequent experiments. Three experiments were conducted to determine the efficiency of the gold nanoparticle deposition process by extending the deposition time to 150 min to reach weighable quantities of gold onto the GSPE surface. The modified electrodes were washed with water to remove chloroauric acid residues and placed in an oven at 100 °C for 1 h. The measured electrode weight increase corresponds to an average conversion of 60% of the total chloroauric acid delivered to the surface. The AuNPs-modified electrodes were then functionalized by the deposition of microdroplets containing 6Fc-ht as a redox mediator. The only difference in the mass spectrometric condition used in these experiments was the ESI voltage polarity that was switched to positive values, leading to better results in terms of DPV and CV measurements. The positive ESI mass spectrum of 6Fc-ht is dominated by a single signal corresponding to its molecular ion at m/z 302 (Figure S2).
3.2. SEM and Electrochemical Characterization of the AuNPs-Modified Electrodes
The morphology and distribution of AuNPs obtained through the ESI microdroplets deposition after 2, 4 and 10 min of an HAuCl4 solution have been analyzed by SEM microscopy (Figure 1). In the Supplementary Materials (Figure S3), the EDX analysis is reported, confirming the presence of gold on the electrode surface.
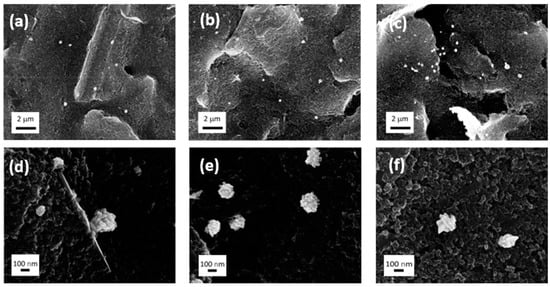
Figure 1.
SEM images: (a,d) 2 min of deposition; (b,e) 4 min of deposition; (c,f) 10 min of deposition.
The total amount of HAuCl4 delivered to the electrode surface increases by increasing the deposition time as well (2 min: 0.00087 mg; 4 min: 0.0017 mg; 10 min: 0.0043 mg). Between 2 and 4 min, the AuNPs number accordingly increases, and the distribution over the surface appears homogeneous after 4 min. After 10 min of deposition, the AuNPs start to concentrate more in specific regions (Figure 1a–c). The AuNPs morphology results in large anisotropic aggregates of smaller NPs (of approximately 30 nm) that are not completely formed at 2 min of deposition (Figure 1d and Figure S4) with the co-presence of AuNPs of approximately 350 nm and 100 nm.
After 4 min (Figure 1e), the medium size for all the AuNPs aggregates is approximately 220 nm, and the aggregates are formed by smoother NPs (Figure S5). After 10 min of deposition, the medium size is approximately 260 nm with more spikey morphology (Figure 1c,f and Figure S6). In addition, the presence of random bigger aggregates suggests the occurrence of successive nucleations during the longer deposition time.
The graphics of the statistical distribution of AuNPs content and size for three different batches at 2, 4, and 10 min of deposition are reported in Figures S8–S10.
The electrochemical characterization of GSPE/AuNPs platforms was realized using CV, DPV, and EIS measurements. The CV curves (Figure 2a) show increasing oxidation and reduction peak currents for the redox couple K4[Fe(CN)6]/K3[Fe(CN)6] with increasing HAuCl4 deposition time, as well as the reversibility of the reaction. These results are consistent with the widely known property of AuNPs to promote ET efficiency, increasing the surface-to-volume ratio, as well as the electrode conductivity [31,36].
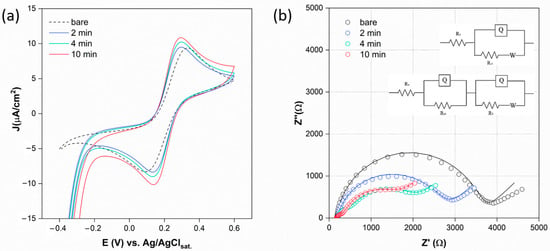
Figure 2.
(a) CV measurements of AuNPs-GSPE surfaces modified under different deposition times, performed in K4[Fe(CN)6]/K3[Fe(CN)6] 1 mM, KCl 0.1 M, between −0.4 and 0.6 V vs. Ag/AgClsat., rate = 10 mV/s. (b) EIS measurements of AuNPs-GSPE surfaces under different deposition times, performed in K4[Fe(CN)6]/K3[Fe(CN)6] 5 mM, KCl 0.1 M, EDC = 0.215 V, EAC = 0.01 V, νmax = 100,000 Hz, νmin = 0.1 Hz. The dotted lines represent experimental data, and the solid lines represent the fit lines. Inset: Randles (R(Q[RW])) and R(QR)(Q[RW]) circuits employed for the fitting procedure.
The EIS measurements are carried out for the same platforms, and the Nyquist plots are reported in Figure 2b. The impedance curves are fitted using a typical Randles circuit in the case of 0 and 2 min, while those at 10 min are fitted using an R(QR)(Q[RW]) circuit, obtaining the characteristic system parameters reported in the Supplementary Materials (Table S1).
All the platforms are semi-reversible systems, according to the relationship RCT ≥ RW = σ/Ω, which is the condition for having a visible kinetic region over the mass transfer region [37]. By increasing the deposition time, the RCT decreases and, interestingly, at 4 and 10 min, an additional small semi-circle at higher frequencies (ν) appears. This resistance and capacitance are attributable to the AuNPs interface (AuI), which becomes visible at higher AuNPs concentrations [38].
However, the presence of AuNPs, besides increasing the electrode conductivity, confers an intrinsic heterogeneity to the electrode surface, which is responsible for a non-uniform formation of the double layer. Therefore, the capacitance contribution decreases, as well as both the τCT and τd. The Bode plots reported in Figure 3a,b show the variation of |Z| and phase angle (ϕ), respectively, with increasing applied ν. The plateau region under high ν in the |Z| profile results in ν-independencet for all the modified electrodes, following the typical resistive behavior under such conditions [39].
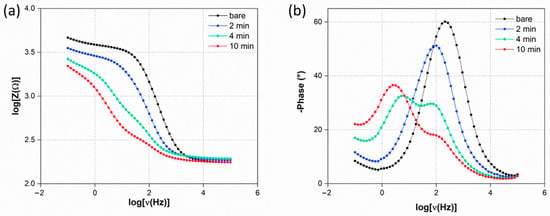
Figure 3.
Bode plots (a) |Z| and (b) phase angle behavior in the function of applied ν.
The slope relies on the system’s capacitance, which is responsible for the progressively higher phase shift between the current signal and the applied voltage. The greater the phase shift, the poorer the current flow through the system. After 2 min of deposition, |Z| decreases relative to the bare electrode across the entire applied ν range, and ϕmax decreases, shifting slightly to lower ν. This indicates that the system still exhibits capacitive dominance. With increased deposition times of 4 and 10 min, both |Z| and ϕ profiles decrease in magnitude compared to the bare and 2 min electrodes and show a splitting into two distinct phenomena, reflecting the Nyquist plot behavior. The phenomenon at intermediate ν represents the AuI contribution, while the one at lower ν is related to the double layer. After 10 min, despite the decrease in |Z| magnitude, the ϕmax related to the double-layer capacitance increases and shifts to lower ν. This is likely due to the formation of a more uniform double layer as a result of reaching a concentration of AuNPs that promotes increased double-layer capacitance compared to the 4 min electrode. Additionally, the increasing slope of the |Z| profile at low ν is notable, which can be attributed to the progressive decrease in τCT, making diffusion the rate-limiting step of the process [40].
DPV measurements conducted under oxidation and reduction conditions (Figure 4a,b) allowed for a better characterization of the electrochemical behavior of the modified platforms. For ferrocyanide oxidation, the peak occurs at 0.22 V for the bare electrode, progressively shifting to lower potentials with increasing deposition time (0.2 V at 2 min, 0.15 V at 4 and 10 min). This indicates a gradually more favorable ET process promoted by the increasing concentration of AuNPs. The peak current also increases, reaching its highest value at 10 min. Similar behavior is observed under reduction conditions. After 4 and 10 min, an additional ET process is evident under both oxidation and reduction conditions, even in the absence of oxygen and ferricyanide likely due to the oxidation and reduction of Au. The literature shows that oxidation under acidic conditions is generally not appreciable for adsorbed spherical AuNPs [41], whereas reduction is observed in DPV at 0.45 V vs. Ag/AgClsat. In this study, the highly anisotropic morphology of the AuNPs could account for their particularly high reactivity. The oxidation peak appears at 0.6 V at 4 min and shifts to 0.49 V at 10 min, with an increase in current intensity. This is probably due to the more spiky morphology [42,43] of AuNPs obtained after 10 min of deposition (Figure 1e,f) and their higher concentration. In the case of reduction, the additional ET process is less pronounced, increasing in current with the higher AuNPs concentration.
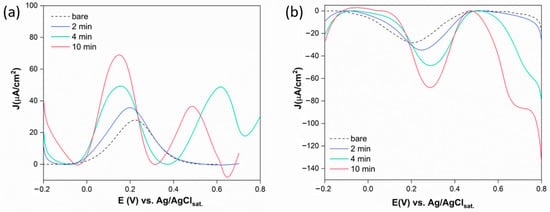
Figure 4.
DPV measurements of AuNPs-GSPE surfaces under different deposition times, performed in K4[Fe(CN)6]/K3[Fe(CN)6] 1 mM, KCl 0.1 M, EDC = 0.215 V, EAC = 0.01 V, νmax = 100,000 Hz, νmin = 0.1 Hz.
3.3. Functionalization of GSPE/AuNPs Platforms with 6-Ferrocenyl-Hexanethiol
Finally, the GSPE/AuNPs platforms characterized above have been functionalized with 6Fc-ht as a redox mediator. The functionalization was realized by the conventional self-assembled monolayer (SAM) formation (see Section 2.5) and by the ESI microdroplets deposition technique. In both cases, prior to the characterization, the electrodes were rinsed with abundant water and ethanol to remove the excess of physically adsorbed 6Fc-ht.
The CV measurements have also been carried out for these systems (Figure 5a,b). The system modified by the SAM procedure did not provide appreciable oxidation and reduction signals for all the HAuCl4 deposition times. This is probably due to strongly adsorbed redox probe molecules onto free graphite through the aliphatic chain, inducing high capacitive current and ferrocene’s limited mobility. Consequently, only a weak ferrocene oxidation signal can barely be observed in Figure 5a (1, 2, 3) at higher potentials than expected [44]. Gold broad oxidation signals are also detected in Figure 5a (4, 5) at 4 and 10 min.
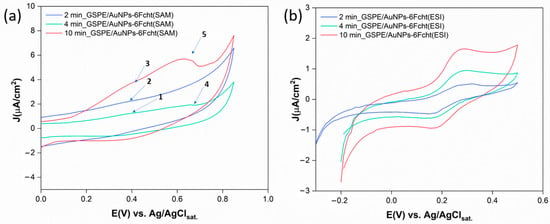
Figure 5.
(a) CV measurements of GSPE surfaces functionalized with AuNPs at different HAuCl4 deposition times, modified with 6Fc-ht through the SAM procedure performed in KCl 0.1 M, between 0 and 0.85 V vs. Ag/AgClsat., rate = 10 mV/s. 6Fc-ht oxidation signals (1, 2, and 3) and gold oxidation signals (4, 5); (b) CV measurements of GSPE surfaces functionalized with AuNPs at different HAuCl4 deposition times, modified with 6Fc-ht through the ESI technique performed in KCl 0.1 M between −0.2 and 0.5 V vs. Ag/AgClsat., rate = 10 mV/s.
On the contrary, the ESI deposition technique provided for better CV profiles (Figure 5b) even if the electrode surface was exposed to a less concentrated 6Fc-ht microdroplets stream for only 10 min. The oxidation and reduction peaks are detected at 0.26 and 0.22 V vs. Ag/AgClsat. respectively, and the current increases with increasing deposition time. These results could be attributed to the peculiar properties of the thin film formed by the charged microdroplets deposition to strongly accelerate the specific interaction between 6Fc-ht and AuNPs with respect to the bulk process. Moreover, the limited quantity of the reagent used to functionalize the gold nanoparticles seems to avoid its physical interaction with the free graphite. In contrast, the SAM procedure exposes the electrode surface to a concentrated solution of 6Fc-ht during a period of 24 h and likely promotes its extensive physical adsorption onto the free graphite.
Finally, the DPV measurements under oxidation and reduction conditions were performed for the systems obtained through different modification procedures (Figure 6).
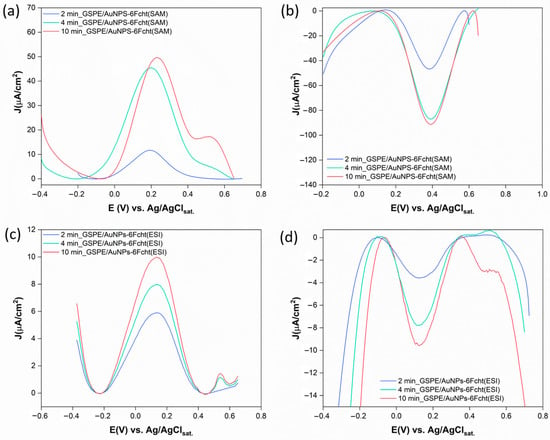
Figure 6.
DPV measurements of GSPE surfaces functionalized with AuNPs at different HAuCl4 deposition times, modified with 6Fc-ht through the SAM procedure (a,b) and ESI microdroplets deposition technique (c,d), performed in KCl 0.1 M, EDC = 0.215 V, EAC = 0.01 V, νmax = 100,000 Hz, and νmin = 0.1 Hz.
Although oxidation and reduction currents increase with deposition time for the SAM procedure, the redox process appears irreversible when comparing current intensities. Additionally, the oxidation and reduction potentials significantly deviate from the expected values for ferrocene. These results are consistent with the CV data discussed earlier. In contrast, the DPV for the platforms obtained via the ESI technique shows better reversibility. For all deposition times, oxidation and reduction peaks appear at 0.13 V and 0.12 V vs. Ag/AgClsat, respectively, aligning with the ferrocene redox behavior reported in the literature under similar conditions [45]. Lastly, gold oxidation is consistently observed at 4 and 10 min of deposition, except in the reduction phase of the SAM system.
3.4. Electrochemical Detection of H2O2
The ESI GSPE/AuNPs-6Fcht platform at 10 min of microdroplets deposition, which provides the best electrochemical performance, was employed for the detection of H2O2. Specifically, the catalysis of H2O2 oxidation by 6Fc-ht was followed through the DPV measurements (Figure 7), where the Fc oxidation current increases with increasing H2O2 concentration, as recently reported in the literature [46].
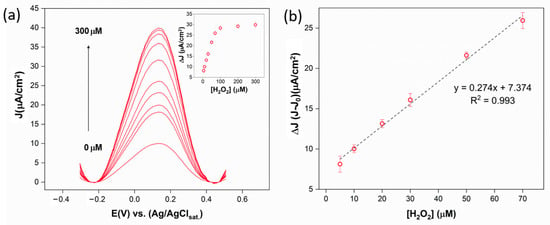
Figure 7.
(a) DPV curves collected in the absence and presence of increasing concentrations of H2O2 in the range 0–300 μM in PBS 0.01 M, KCl 0.1 M. In the inset are reported the ΔI (I-I0) over the analyzed H2O2 concentration range; (b) sensor calibration line.
The mechanism proposed in the literature involves the oxidation of Fc to Fc+ and the catalysis of H2O2 oxidation to O2 by Fc+. Afterwards, Fc is oxidized back to Fc+, increasing the peak current proportionally to the H2O2 concentration present in the working solution. The platform exhibited an optimal response to the target, providing for a linear range of 5–70 μM with a limit of detection (LOD) of 0.9 μM. These results make this platform promising for applications in reactive oxygen species (ROS) detection.
4. Conclusions
This study demonstrates the potential of the ESI-charged microdroplets deposition technique for forming and functionalizing AuNPs on GSPEs. By optimizing deposition parameters such as ESI voltage polarity and spray-target distance, we achieved a homogenous distribution of AuNPs, verified through SEM analyses. The advantages of the ESI microdroplets deposition technique over the common AuNPs generation methods can be summarized as follows: (i) minor reagents consumption due to the use of HAuCl4 diluted solution in the absence of reducing agents, (ii) accelerated nanoparticle formation rate, (iii) elimination of time-intensive purification steps like centrifugation or filtration. Electrochemical characterization using CV, DPV, and EIS confirmed the enhanced electrocatalytic properties of the AuNPs-modified electrodes, attributed to improved ET efficiency and increased surface conductivity. Functionalization with 6-ferrocenyl-hexanethiol via the same ESI microdroplets deposition technique also resulted in superior redox behavior compared to conventional self-assembled monolayer (SAM) methods. The ESI technique provided specific interaction between 6-ferrocenyl-hexanethiol and AuNPs, promoting effective redox activity while minimizing non-specific adsorption. Moreover, deposition and functionalization of the AuNPs through charged microdroplets deposition may occur in two consecutive steps of a few minutes without any electrode surface manipulation, saving processing time and improving the uniformity and repeatability of the modified layer. Finally, the platform at 10 min of microdroplets deposition showing the best electrochemical performance was used to develop an electrochemical sensor for H2O2 detection. The device exhibited a linear range of 5–70 μM and a LOD of 0.9 μM.
These findings highlight the versatility and efficacy of ESI microdroplets deposition in fabricating and functionalizing nanostructured electrodes, paving the way for advanced electrochemical sensors and biosensors.
Supplementary Materials
The following supporting information can be downloaded at: https://www.mdpi.com/article/10.3390/surfaces7040052/s1, Figure S1: ESI Z-spray apparatus, Figure S2 and S3: ESI mass spectra, Figure S4: EDX analysis, Figures S5–S7 Magnified SEM images of AuNPs, Figure S8: Size distribution of AuNPs after 2 min of microdroplets deposition, Figure S9: Size distribution of AuNPs after 4 min of microdroplets deposition, Figure S10: Size distribution of AuNPs after 10 min of microdroplets deposition, Table S1: EIS parameters.
Author Contributions
R.Z. and M.M.: methodology, investigation, formal analysis, writing—original draft. F.M., F.P., R.Z. and M.M.: conceptualization, resources, writing—original draft, review, and editing. M.A., A.T., C.S., A.D.N. and A.R.: resources, review, and editing. All authors have read and agreed to the published version of the manuscript.
Funding
This work was supported by Sapienza Università di Roma “Progetti di Ateneo 2020”, RM120172B7339DD4. C.S. thanks the Italian Ministry of University and Research (MUR) for a Researcher position (DM n. 1062, 10/08/2021) within the EU-funded National Operational Programme (PON) on Research and Innovation 2014–2020.
Data Availability Statement
The dataset is available on request from the authors.
Conflicts of Interest
The authors declare that they have no known competing financial interests or personal relationships that could have appeared to influence the work reported in this paper.
References
- Fenn, J.B.; Mann, M.; Meng, C.K.; Wong, S.F.; Whitehouse, C.M. Electrospray ionization for mass spectrometry of large biomolecules. Science 1989, 246, 64–71. [Google Scholar] [CrossRef] [PubMed]
- Wei, Z.; Li, Y.; Cooks, R.G.; Yan, X. Accelerated reaction kinetics in microdroplets: Overview and recent developments. Annu. Rev. Phys. Chem. 2020, 71, 31–51. [Google Scholar] [CrossRef] [PubMed]
- Banerjee, S.; Zare, R.N. Syntheses of isoquinoline and substituted quinolines in charged microdroplets. Angew. Chem. Int. Ed. Engl. 2015, 127, 15008–15012. [Google Scholar] [CrossRef]
- Espy, R.D.; Wleklinski, M.; Yan, X.; Cooks, R.G. Beyond the flask: Reactions on the fly in ambient mass spectrometry. TrAC Trends Anal. Chem. 2014, 57, 135–146. [Google Scholar] [CrossRef]
- Yan, X.; Bain, R.M.; Cooks, R.G. Organic reactions in microdroplets: Reaction acceleration revealed by mass spectrometry. Angew. Chem. Int. Ed. Engl. 2016, 55, 12960–12972. [Google Scholar] [CrossRef]
- Badu-Tawiah, A.K.; Cyriac, J.; Cooks, R.G. Reactions of organic ions at ambient surfaces in a solvent-free environment. J. Am. Soc. Mass Spectrom. 2012, 23, 842–849. [Google Scholar] [CrossRef]
- Ansu-Gyeabourh, E.; Amoah, E.; Ganesa, C.; Badu-Tawiah, A.K. Monoacylation of symmetrical diamines in charge microdroplets. J. Am. Soc. Mass Spectrom. 2020, 32, 531–536. [Google Scholar] [CrossRef]
- Huang, K.-H.; Wei, Z.; Cooks, R.G. Accelerated reactions of amines with carbon dioxide driven by superacid at the microdroplet interface. Chem. Sci. 2021, 12, 2242–2250. [Google Scholar] [CrossRef]
- Zhao, P.; Gunawardena, H.P.; Zhong, X.; Zare, R.N.; Chen, H. Microdroplet ultrafast reactions speed antibody characterization. Anal. Chem. 2021, 93, 3997–4005. [Google Scholar] [CrossRef]
- Kang, J.; Lhee, S.; Lee, J.K.; Zare, R.N.; Nam, H.G. Restricted intramolecular rotation of fluorescent molecular rotors at the periphery of aqueous microdroplets in oil. Sci. Rep. 2020, 10, 16859. [Google Scholar] [CrossRef]
- Zhong, X.; Chen, H.; Zare, R.N. Ultrafast enzymatic digestion of proteins by microdroplet mass spectrometry. Nat. Commun. 2020, 11, 1049. [Google Scholar] [CrossRef] [PubMed]
- Nam, I.; Lee, J.K.; Nam, H.G.; Zare, R.N. Abiotic production of sugar phosphates and uridine ribonucleoside in aqueous microdroplets. Proc. Natl. Acad. Sci. USA 2017, 114, 12396–12400. [Google Scholar] [CrossRef] [PubMed]
- Qiu, L.; Cooks, R.G. Simultaneous and spontaneous oxidation and reduction in microdroplets by the water radical cation/anion pair. Angew. Chem. Int. Ed. Engl. 2022, 134, e202210765. [Google Scholar] [CrossRef]
- Holden, D.T.; Morato, N.M.; Cooks, R.G. Aqueous microdroplets enable abiotic synthesis and chain extension of unique peptide isomers from free amino acids. Proc. Natl. Acad. Sci. USA 2022, 119, e2212642119. [Google Scholar] [CrossRef] [PubMed]
- Cheng, H.; Tang, S.; Yang, T.; Xu, S.; Yan, X. Accelerating electrochemical reactions in a voltage-controlled interfacial microreactor. Angew. Chem. Int. Ed. Engl. 2020, 59, 19862–19867. [Google Scholar] [CrossRef] [PubMed]
- Müller, T.; Badu-Tawiah, A.; Cooks, R.G. Accelerated Carbon Carbon Bond-Forming Reactions in Preparative Electrospray. Angew. Chem. Int. Ed. Engl. 2012, 124, 12002–12005. [Google Scholar] [CrossRef]
- He, Q.; Badu-Tawiah, A.K.; Chen, S.; Xiong, C.; Liu, H.; Zhou, Y.; Hou, J.; Zhang, N.; Li, Y.; Xie, X. In Situ bioconjugation and ambient surface modification using reactive charged droplets. Anal. Chem. 2015, 87, 3144–3148. [Google Scholar] [CrossRef]
- Wei, Z.; Wleklinski, M.; Ferreira, C.; Cooks, R.G. Reaction acceleration in thin films with continuous product deposition for organic synthesis. Angew. Chem. Int. Ed. Engl. 2017, 129, 9514–9518. [Google Scholar] [CrossRef]
- Tata, A.; Salvitti, C.; Pepi, F. From vacuum to atmospheric pressure: A review of ambient ion soft landing. J. Am. Soc. Mass Spectrom. 2020, 450, 116309. [Google Scholar] [CrossRef]
- Wei, Z.; Zhang, X.; Wang, J.; Zhang, S.; Zhang, X.; Cooks, R.G. High yield accelerated reactions in nonvolatile microthin films: Chemical derivatization for analysis of single-cell intracellular fluid. Chem. Sci. 2018, 9, 7779–7786. [Google Scholar] [CrossRef]
- Salvitti, C.; de Petris, G.; Troiani, A.; Managò, M.; Villani, C.; Ciogli, A.; Sorato, A.; Ricci, A.; Pepi, F. Accelerated D- Fructose Acid-Catalyzed Reactions in Thin Films Formed by Charged Microdroplets Deposition. J. Am. Soc. Mass Spectrom. 2022, 33, 565–572. [Google Scholar] [CrossRef] [PubMed]
- Troiani, A.; de Petris, G.; Pepi, F.; Garzoli, S.; Salvitti, C.; Rosi, M.; Ricci, A. Base-assisted conversion of protonated D-fructose to 5-HMF: Searching for gas-phase green models. Chem. Open 2019, 8, 1190. [Google Scholar] [CrossRef] [PubMed]
- Salvitti, C.; de Petris, G.; Troiani, A.; Managò, M.; Ricci, A.; Pepi, F. Kinetic Study of the Maillard Reaction in Thin Film Generated by Microdroplets Deposition. Molecules 2022, 27, 5747. [Google Scholar] [CrossRef]
- Salvitti, C.; de Petris, G.; Troiani, A.; Managò, M.; Di Noi, A.; Ricci, A.; Pepi, F. Sulfuric Acid Catalyzed Esterification of Amino Acids in Thin Film. J. Am. Soc. Mass Spectrom. 2023, 34, 2748–2754. [Google Scholar] [CrossRef] [PubMed]
- De Angelis, M.; Managò, M.; Pepi, F.; Salvitti, C.; Troiani, A.; Villani, C.; Ciogli, A. Stereoselectivity in electrosprayed confined volumes: Asymmetric synthesis of warfarin by diamine organocatalysts in microdroplets and thin films. RSC Adv. 2024, 14, 1576–1580. [Google Scholar] [CrossRef] [PubMed]
- Li, A.; Luo, Q.; Park, S.; Cooks, R.G. Synthesis and catalytic reactions of nanoparticles formed by electrospray ionization of coniage metals. Angew. Chem. Int. Ed. Engl. 2014, 53, 3147–3150. [Google Scholar] [CrossRef]
- Li, A.; Baird, Z.; Bag, S.; Sarkar, D.; Prabhath, A.; Pradeep, T.; Cooks, R.G. Using ambient ion beams to write nanostructured patterns for Surface Enhanced Raman spectroscopy. Angew. Chem. Int. Ed. Engl. 2014, 53, 12528–12531. [Google Scholar] [CrossRef]
- Basuri, P.; Chakraborty, A.; Ahuja, T.; Mondal, B.; Kumar, J.S.; Pradeep, T. Spatial reorganization of analytes in charged aqueous microdroplets. Chem. Sci. 2022, 13, 13321–13329. [Google Scholar] [CrossRef]
- Jin, S.; Chen, H.; Yuan, X.; Xing, D.; Wang, R.; Zhao, L.; Zhang, D.; Gong, C.; Zhu, C.; Gao, X. The Spontaneous electron-mediated redox processes on sprayed water microdroplets. JACS Au 2023, 3, 1563–1571. [Google Scholar] [CrossRef]
- Kafeenah, H.; Jen, H.; Chen, S. Microdroplet mass spectrometry: Accelerating reaction and application. Electrophoresis 2022, 43, 74–81. [Google Scholar] [CrossRef]
- Sarfraz, N.; Khan, I. Plasmonic gold nanoparticles (AuNPs): Properties, synthesis and their advanced energy, environmental and biomedical applications. Chem. Asian J. 2021, 16, 720–742. [Google Scholar] [CrossRef] [PubMed]
- Lee, J.K.; Samanta, D.; Nam, H.G.; Zare, R.N. Spontaneous formation of gold nanostructures in aqueous microdroplets. Nat. Commun. 2018, 9, 1562. [Google Scholar] [CrossRef] [PubMed]
- Salvitti, C.; Troiani, A.; Mazzei, F.; D’Agostino, C.; Zumpano, R.; Baldacchini, C.; Bizzarri, A.R.; Tata, A.; Pepi, F. The use of a commercial ESI Z-spray source for ambient ion soft landing and microdroplet reactivity experiments. Int. J. Mass Spectrom. 2021, 468, 116658. [Google Scholar] [CrossRef]
- Badu-Tawiah, A.K.; Campbell, D.I.; Cooks, R.G. Reactions of microsolvated organic compounds at ambient surfaces: Droplet velocity, charge state, and solvent effects. J. Am. Soc. Mass Spectrom. 2012, 23, 1077–1084. [Google Scholar] [CrossRef]
- Mondal, S.; Acharya, S.; Biswas, R.; Bagchi, B.; Zare, R.N. Enhancement of reaction rate in small-sized droplets: A combined analytical and simulation study. J. Chem. Phys. 2018, 148, 244704. [Google Scholar] [CrossRef]
- Zumpano, R.; Polli, F.; D’Agostino, C.; Antiochia, R.; Favero, G.; Mazzei, F. Nanostructure-Based Electrochemical Immunosensors as Diagnostic Tools. Electrochem 2021, 2, 10–28. [Google Scholar] [CrossRef]
- Lazanas, A.C.; Prodromidis, M.I. Electrochemical Impedance Spectroscopy—A Tutorial. ACS Meas. Sci. Au 2023, 3, 162–193. [Google Scholar] [CrossRef]
- Choi, W.; Shin, H.-C.; Kim, J.M.; Choi, J.-Y.; Yoon, W.-S. Modeling and Applications of Eletrochemical Impedance Spectroscopy (EIS) for Lithium-ion Batteries. J. Electrochem. Sci. Technol. 2020, 11, 1–13. [Google Scholar] [CrossRef]
- Loveday, D.; Peterson, P.; Rodgers, B. Evaluation of organic coatings with electrochemical impedance spectroscopy. JCT Coat. Tech 2004, 8, 46–52. [Google Scholar]
- Ariyoshi, K.; Siroma, Z.; Mineshige, A.; Takeno, M.; Fukutsuka, T.; Abe, T.; Uchida, S. Electrochemical Impedance Spectroscopy Part 1: Fundamentals. Electrochemistry 2022, 90, 102007. [Google Scholar] [CrossRef]
- Pumera, M.; Aldavert, M.; Mills, C.; Merkoçi, A.; Alegret, S. Direct voltammetric determination of gold nanoparticles using graphite-epoxy composite electrode. Electrochim. Acta 2005, 50, 3702–3707. [Google Scholar] [CrossRef]
- Edgeccombe, C.J.; Valdre, U. Microscopy and computational modelling to elucidate the enhancement factor for field electron emitters. J. Microsc. 2001, 203, 188–194. [Google Scholar] [CrossRef]
- Stassi, S.; Cauda, V.; Canavese, G.; Manfredi, D.; Pirri, C.F. Synthesis and characterization of gold nanostars as filler of tunneling conductive polymer composites. Eur. J. Inorg. Chem. 2012, 16, 2669–2673. [Google Scholar] [CrossRef]
- Göver, T.; Zafer, Y. Electrochemical study of 6-(ferrocenyl) hexanethiol on gold electrode surface in non-aqueous media. Surf. Interfaces 2018, 13, 163–167. [Google Scholar] [CrossRef]
- Wang, B.; Anzai, J.I. A facile electrochemical detection of hypochlorite ion based on ferrocene compounds. Int. J. Electrochem. Sci. 2015, 10, 3260–3268. [Google Scholar] [CrossRef]
- Zhang, H.; Hu, H.; Li, Y.; Wang, J.; Ma, L. A ferrocene-based hydrogel as flexible electrochemical biosensor for oxidative stress detection and antioxidation treatment. Biosens. Bioelectron. 2024, 248, 115997. [Google Scholar] [CrossRef]
Disclaimer/Publisher’s Note: The statements, opinions and data contained in all publications are solely those of the individual author(s) and contributor(s) and not of MDPI and/or the editor(s). MDPI and/or the editor(s) disclaim responsibility for any injury to people or property resulting from any ideas, methods, instructions or products referred to in the content. |
© 2024 by the authors. Licensee MDPI, Basel, Switzerland. This article is an open access article distributed under the terms and conditions of the Creative Commons Attribution (CC BY) license (https://creativecommons.org/licenses/by/4.0/).