
Flexible, Biocompatible PET Sheets: A Platform for Attachment, Proliferation and Differentiation of Eukaryotic Cells


Abstract
:1. Introduction
2. Experimental
2.1. Materials
2.2. Functionalization of PET Substrate by Arylation with Diazotized N,N-Dimethyl-p-phenylenediamine (DMA)
2.3. Surface-Confined Photopolymerization
2.4. Immobilization of Fibronectin Protein
2.5. XPS Surface Characterization
2.6. Cell Adhesion
3. Results and Discussion
3.1. General Procedure to Modify PET Surface for Cell Adhesion and Growth of Muscle Fibers
3.2. Surface Characterization of PET Surfaces by XPS
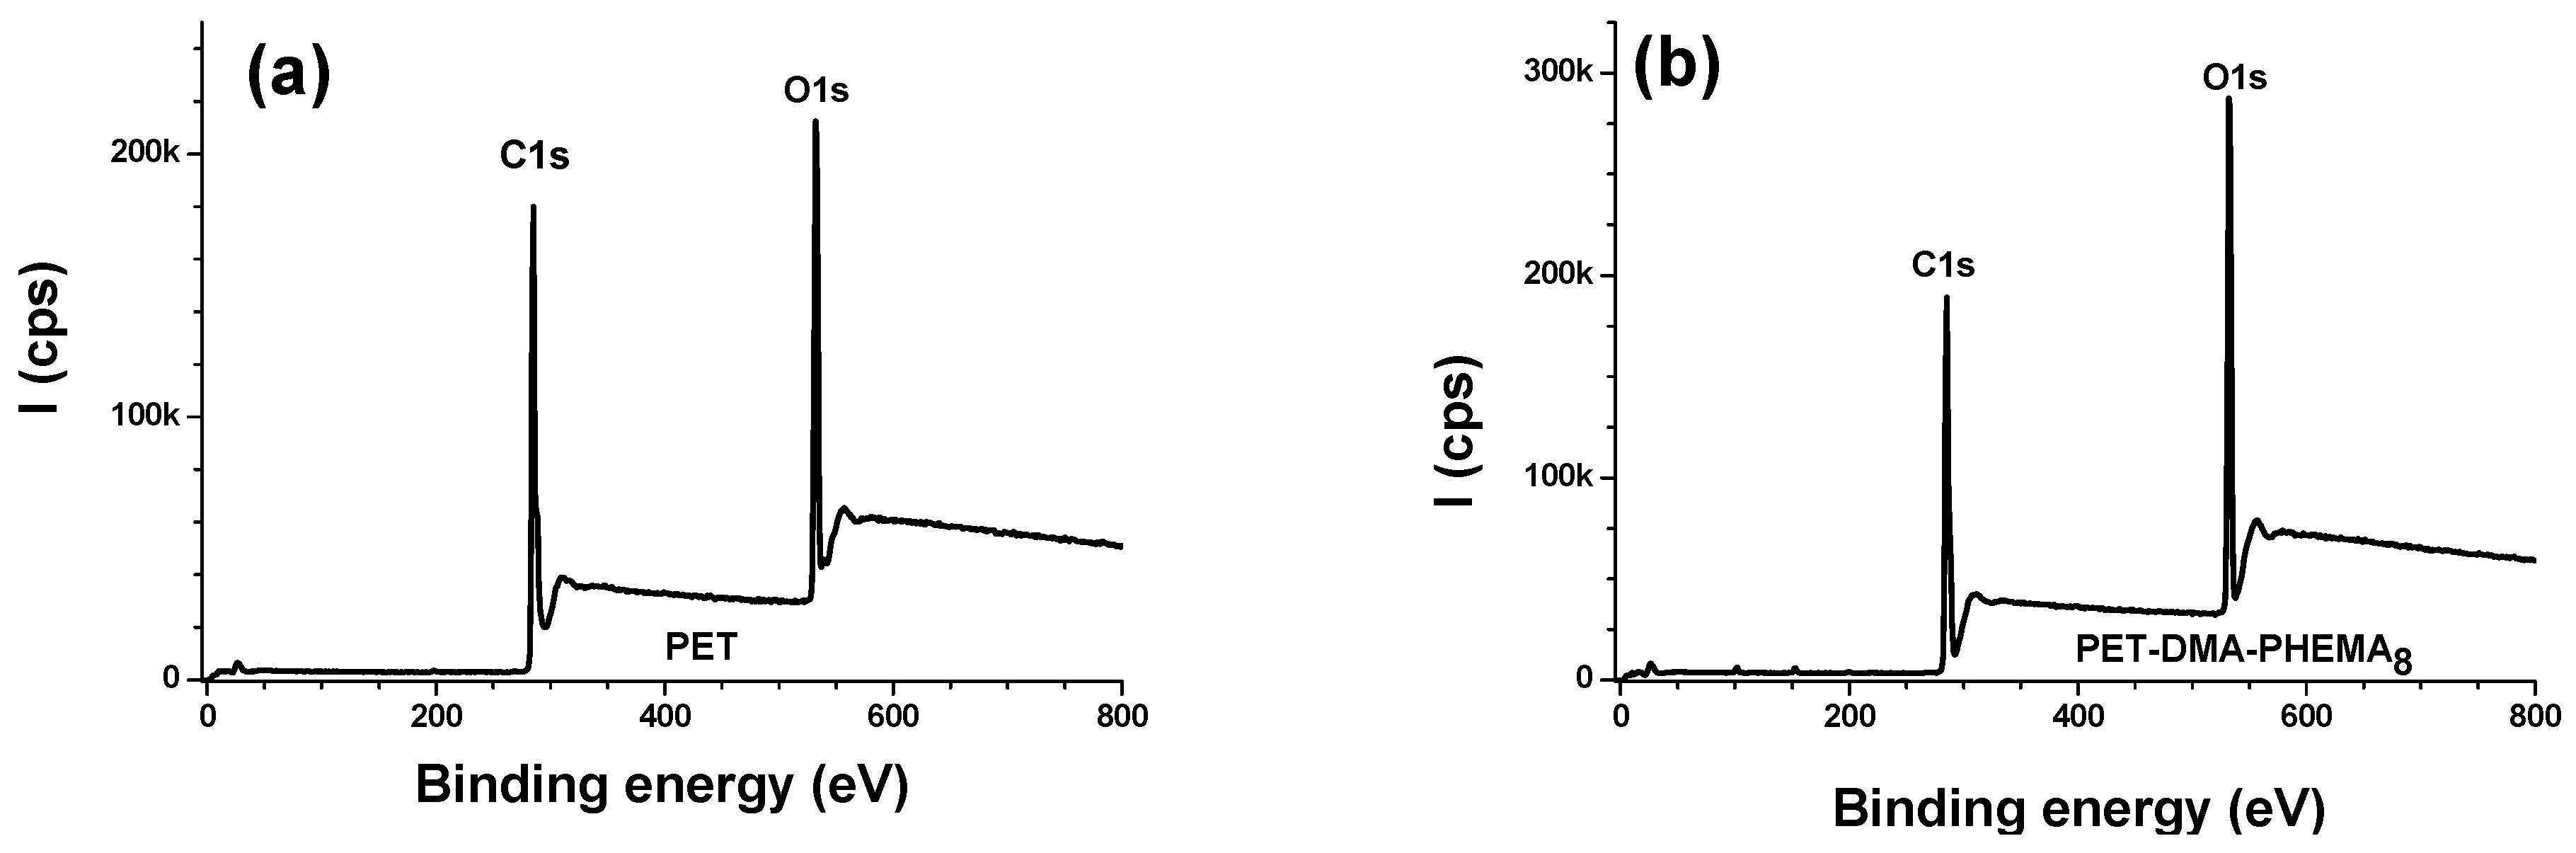
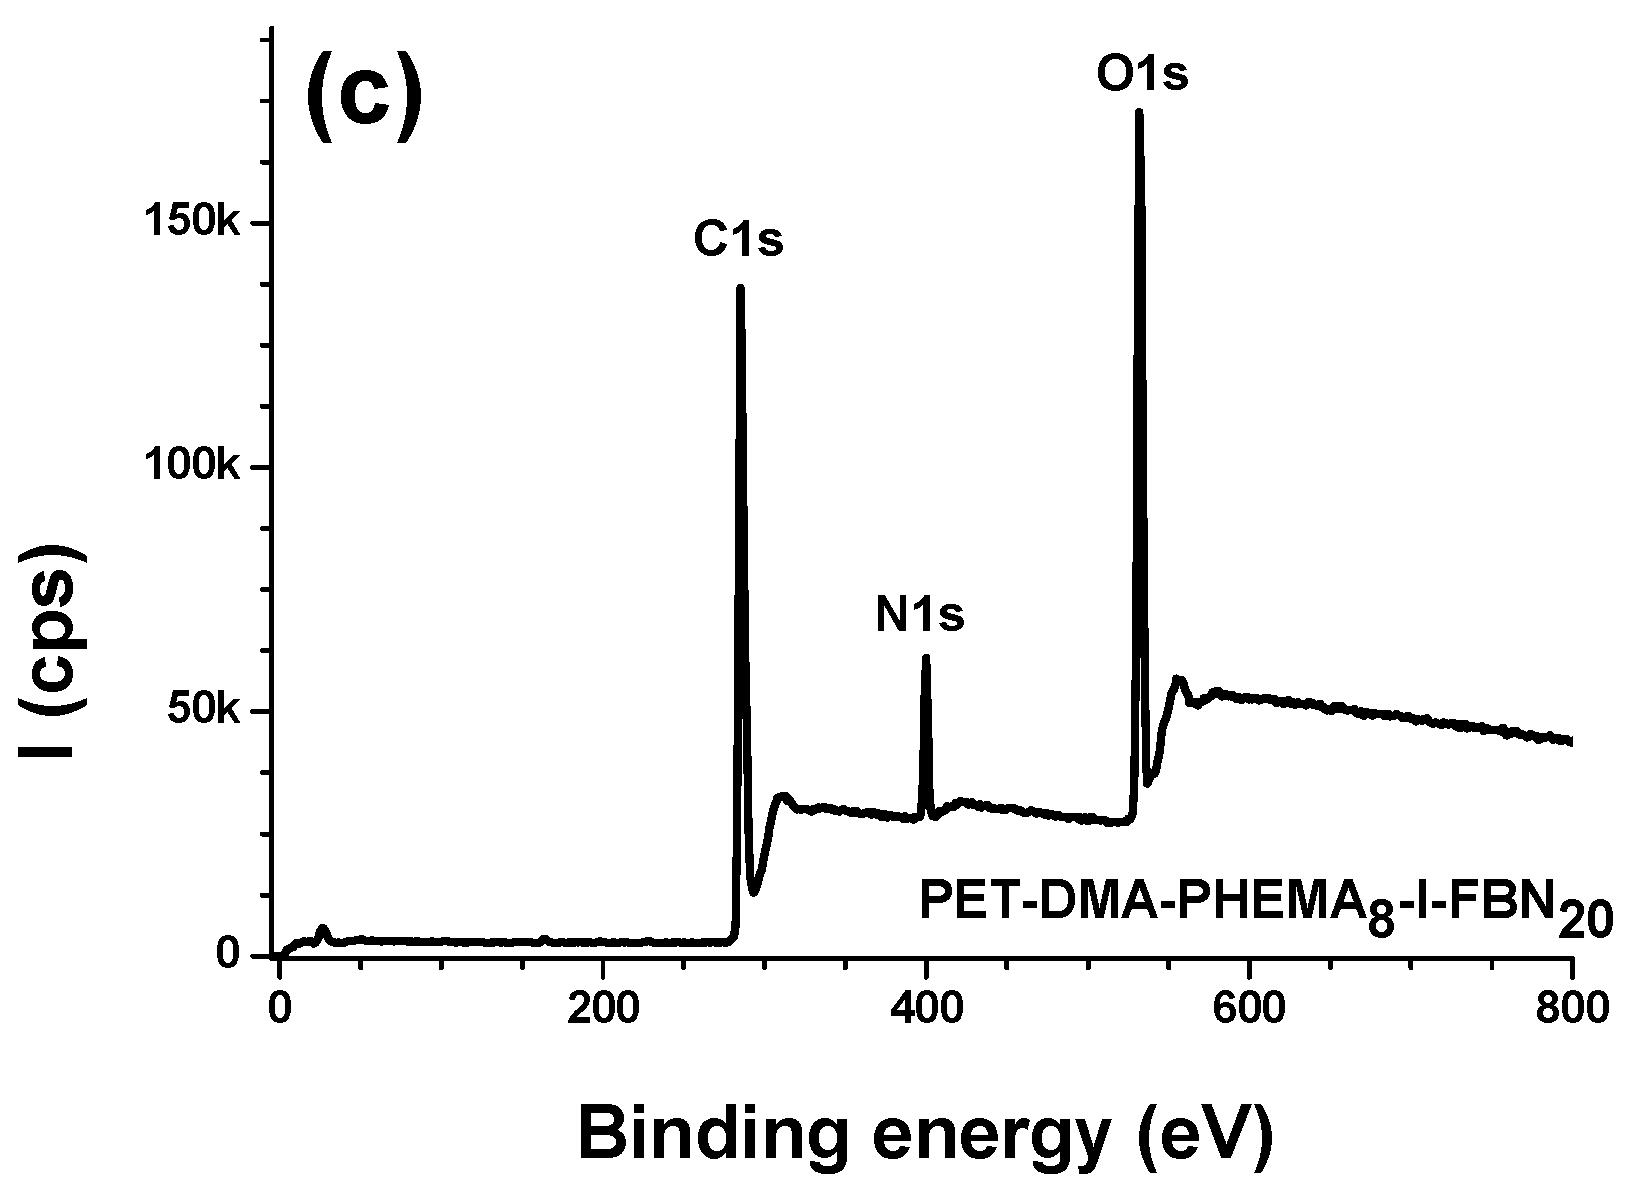
3.2.1. Survey Regions and Surface Elemental Composition
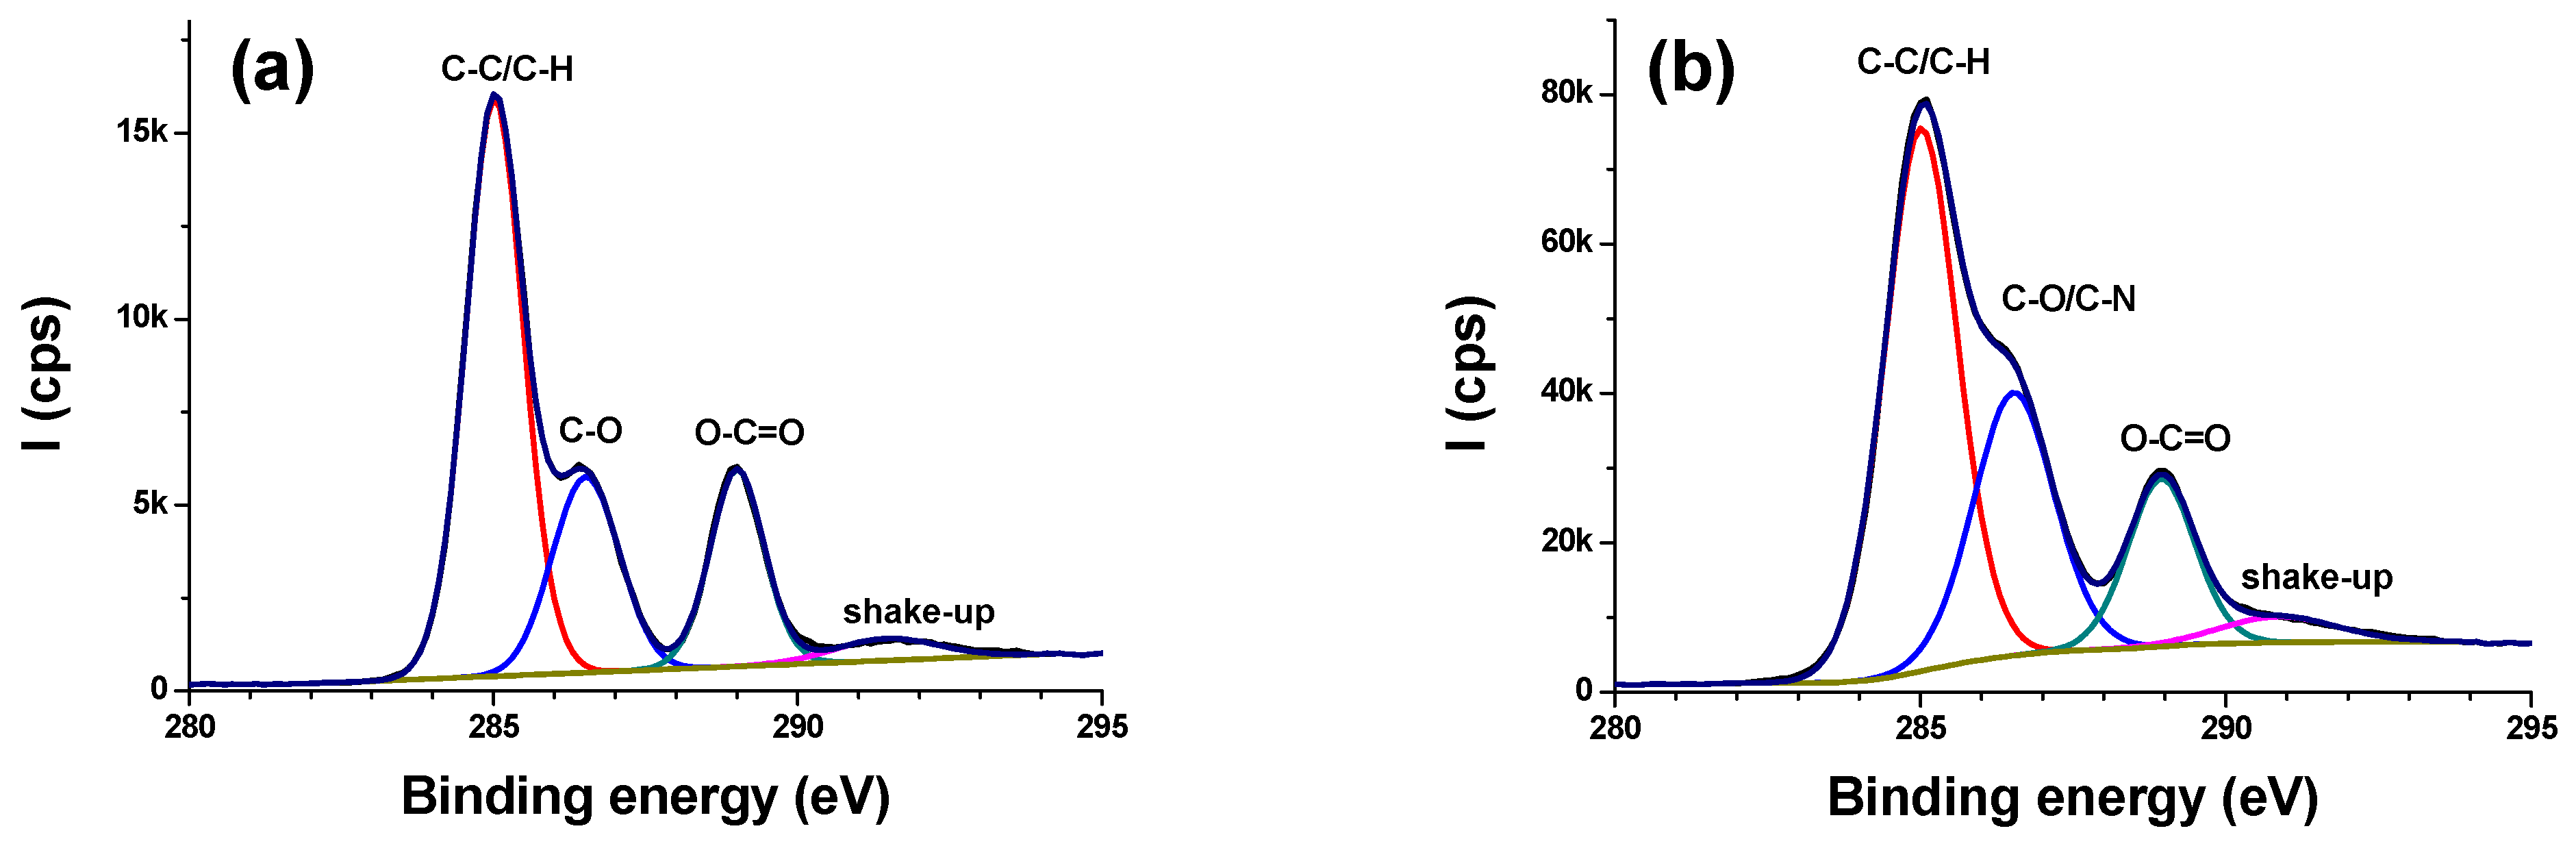
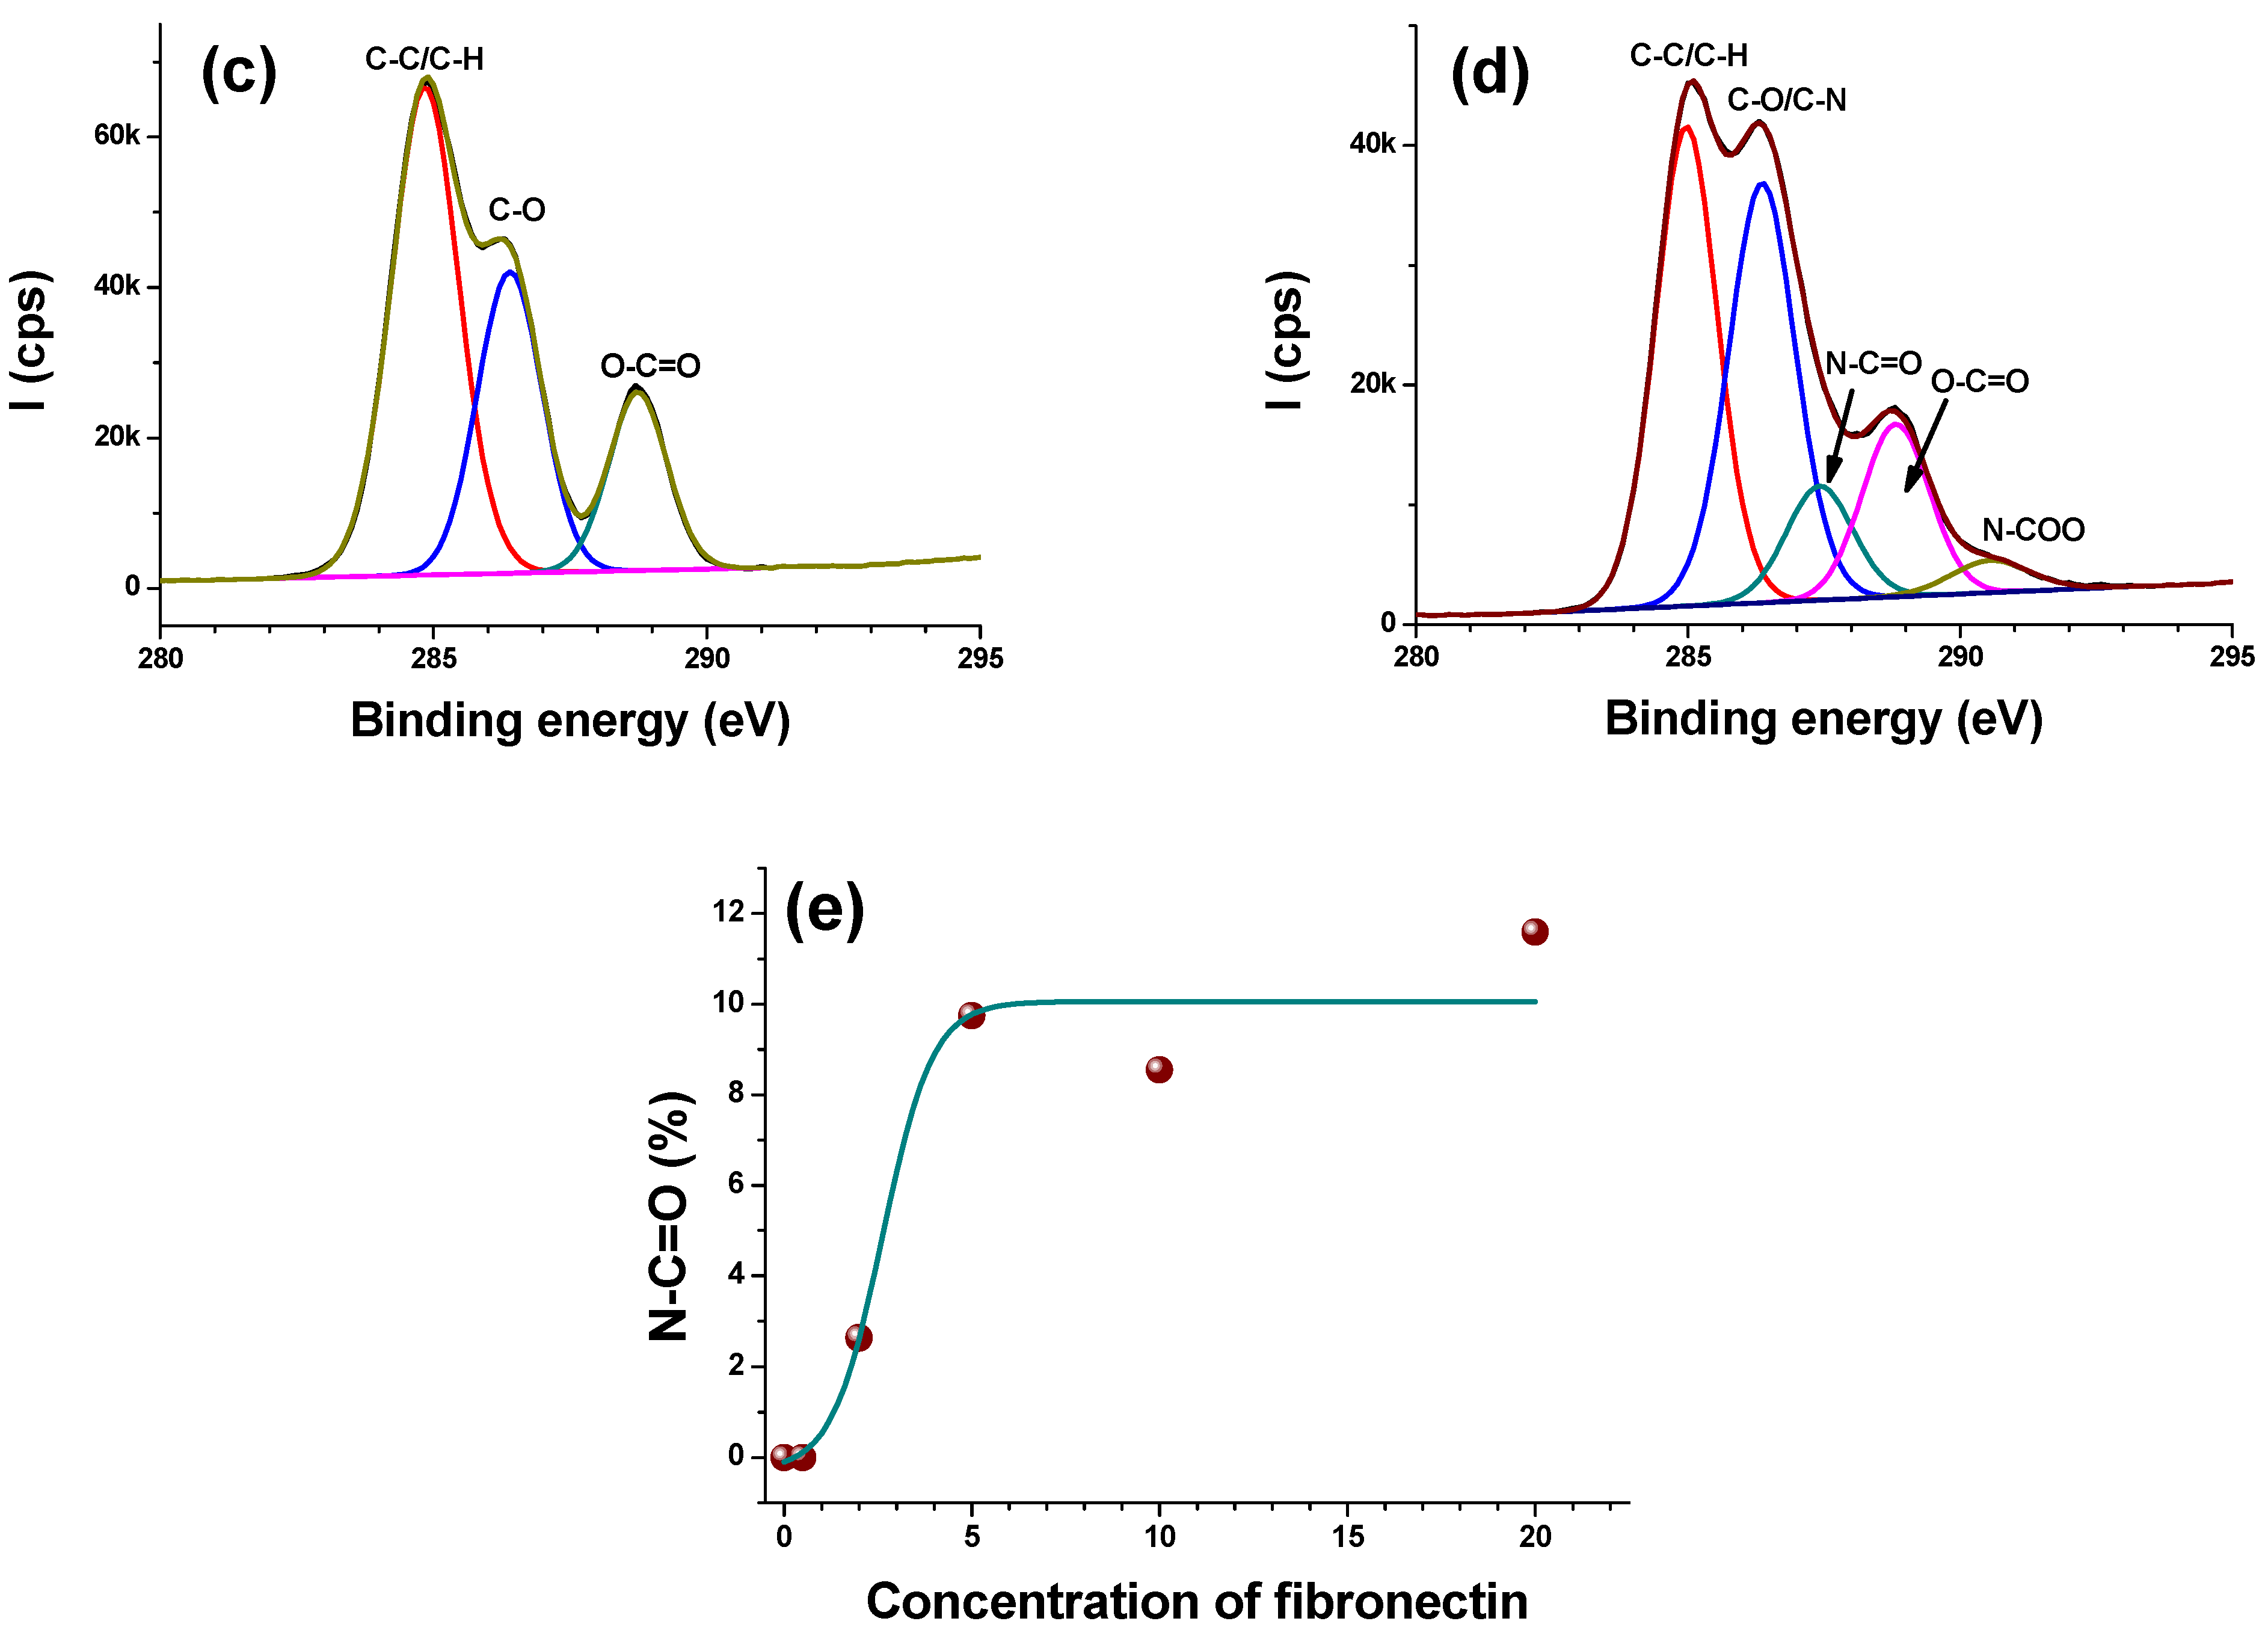
3.2.2. High Resolution Regions
- C1s
- O1s
- N1s and S2p
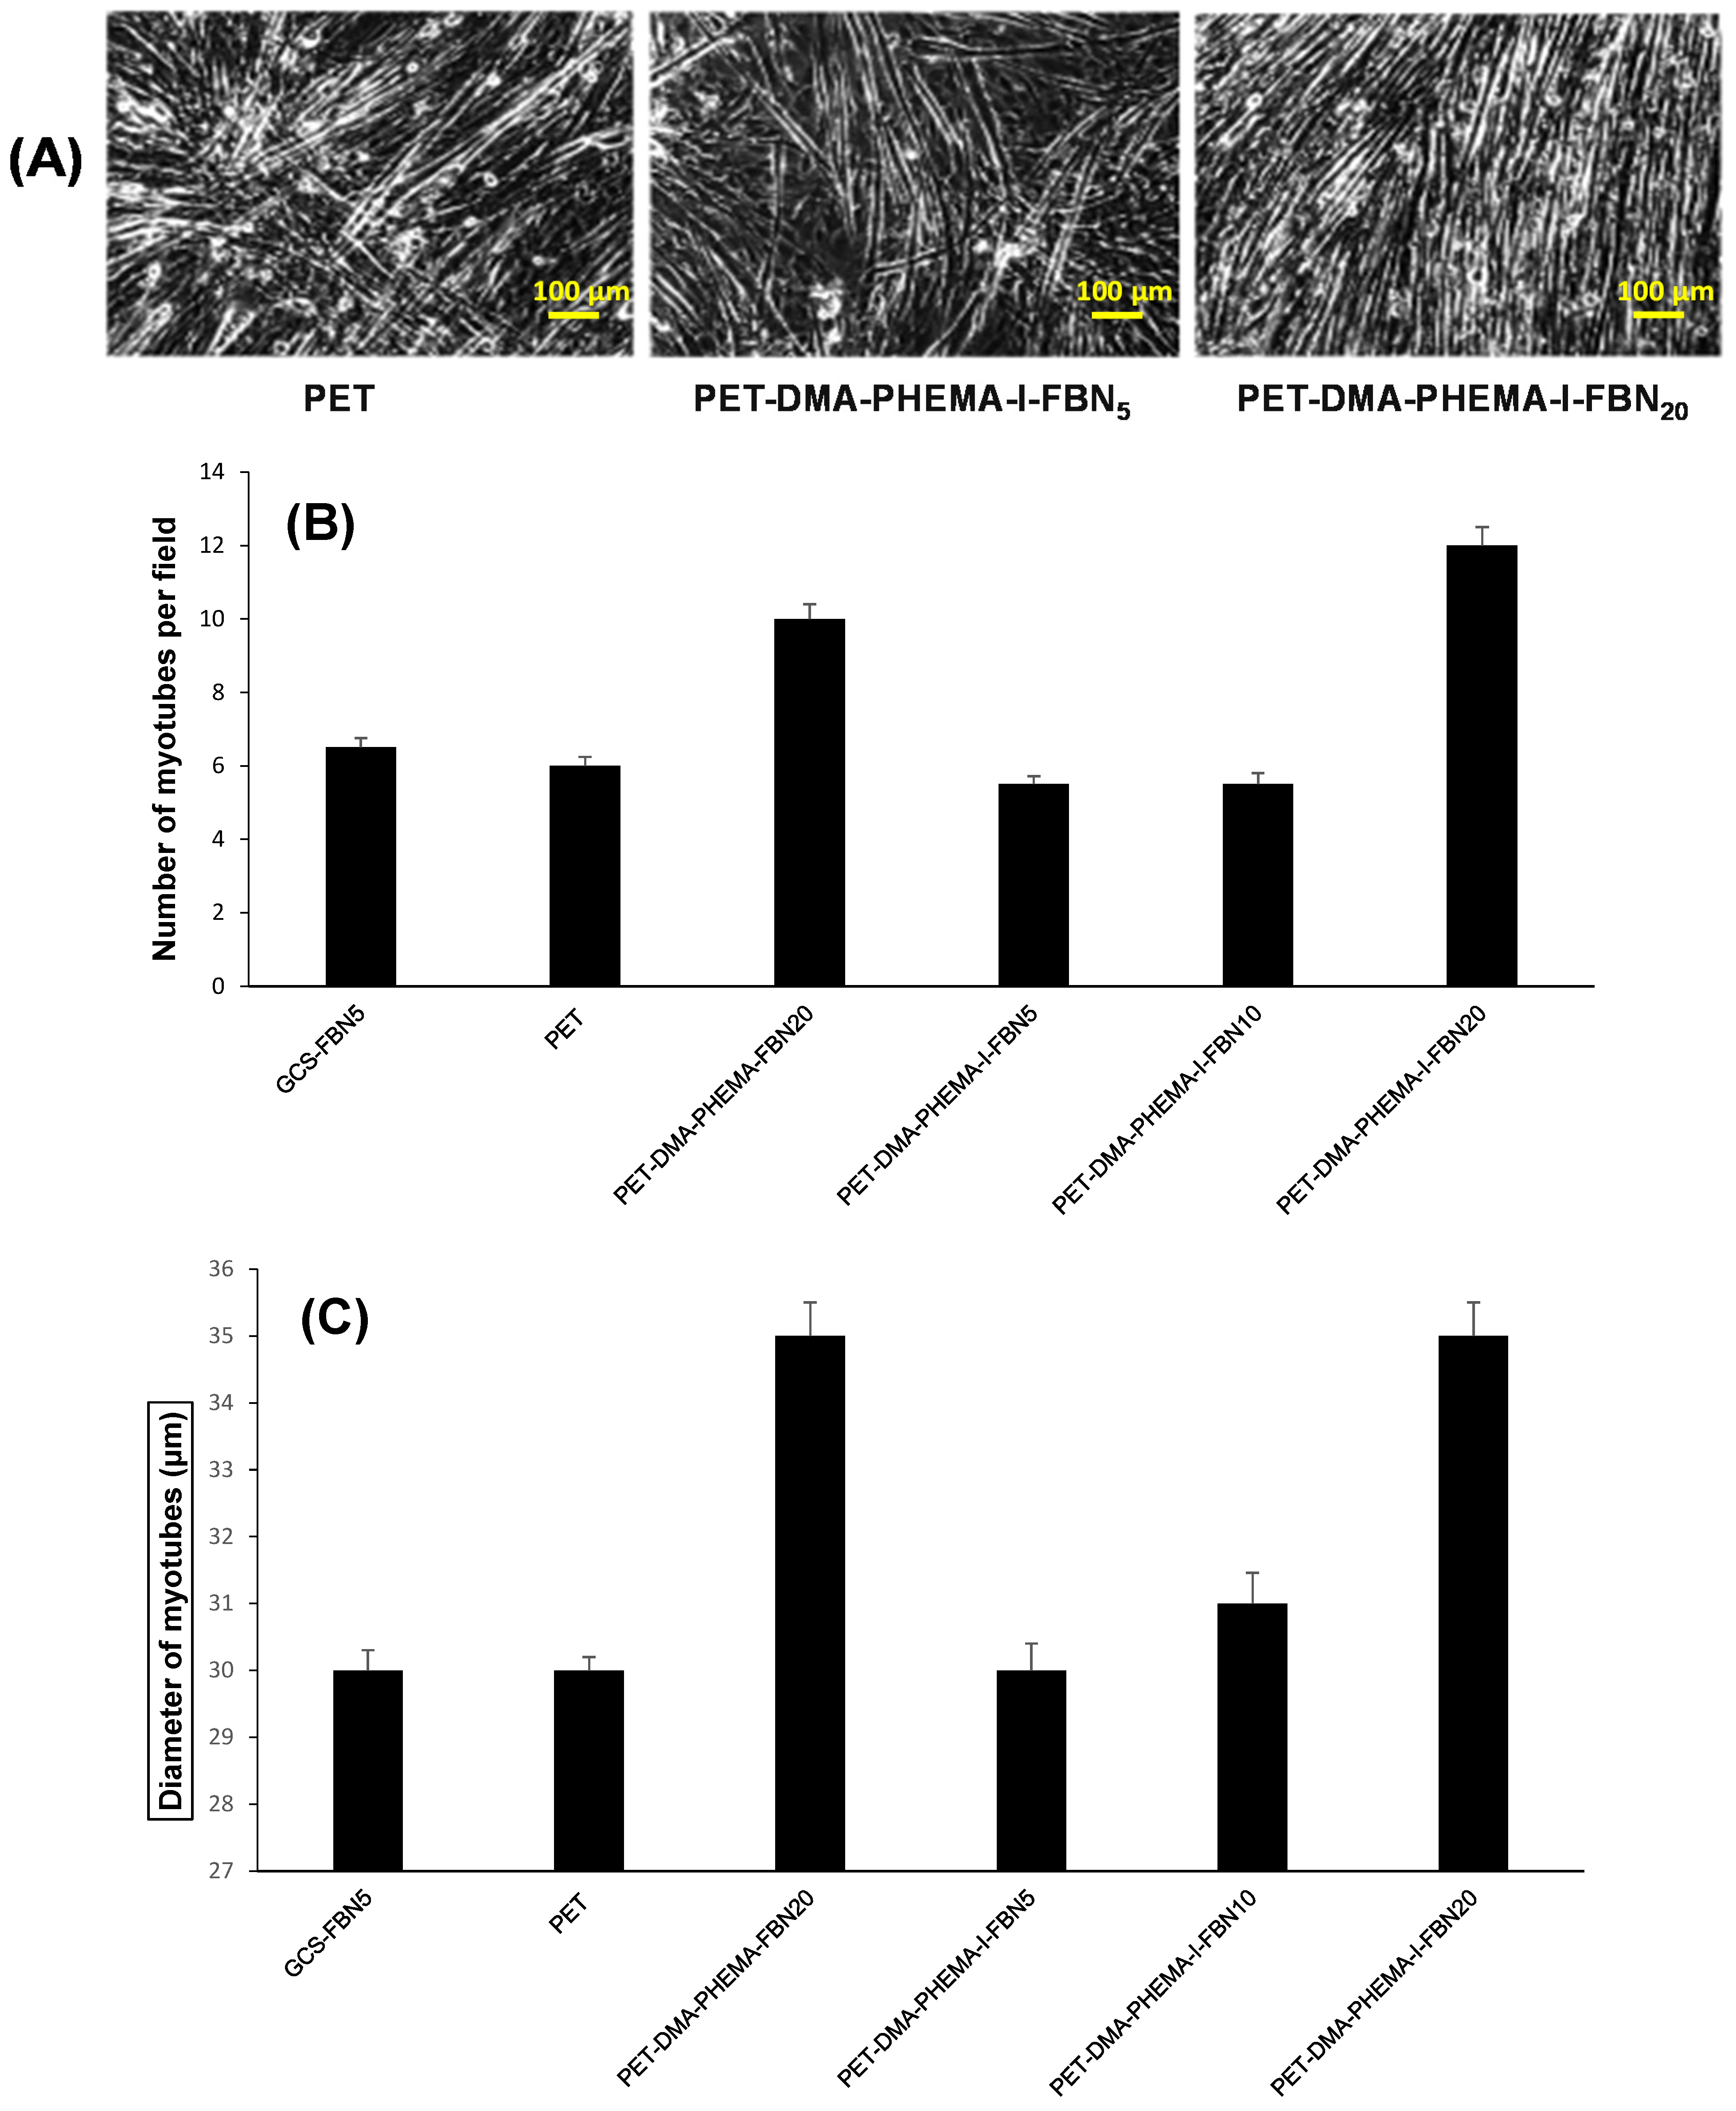
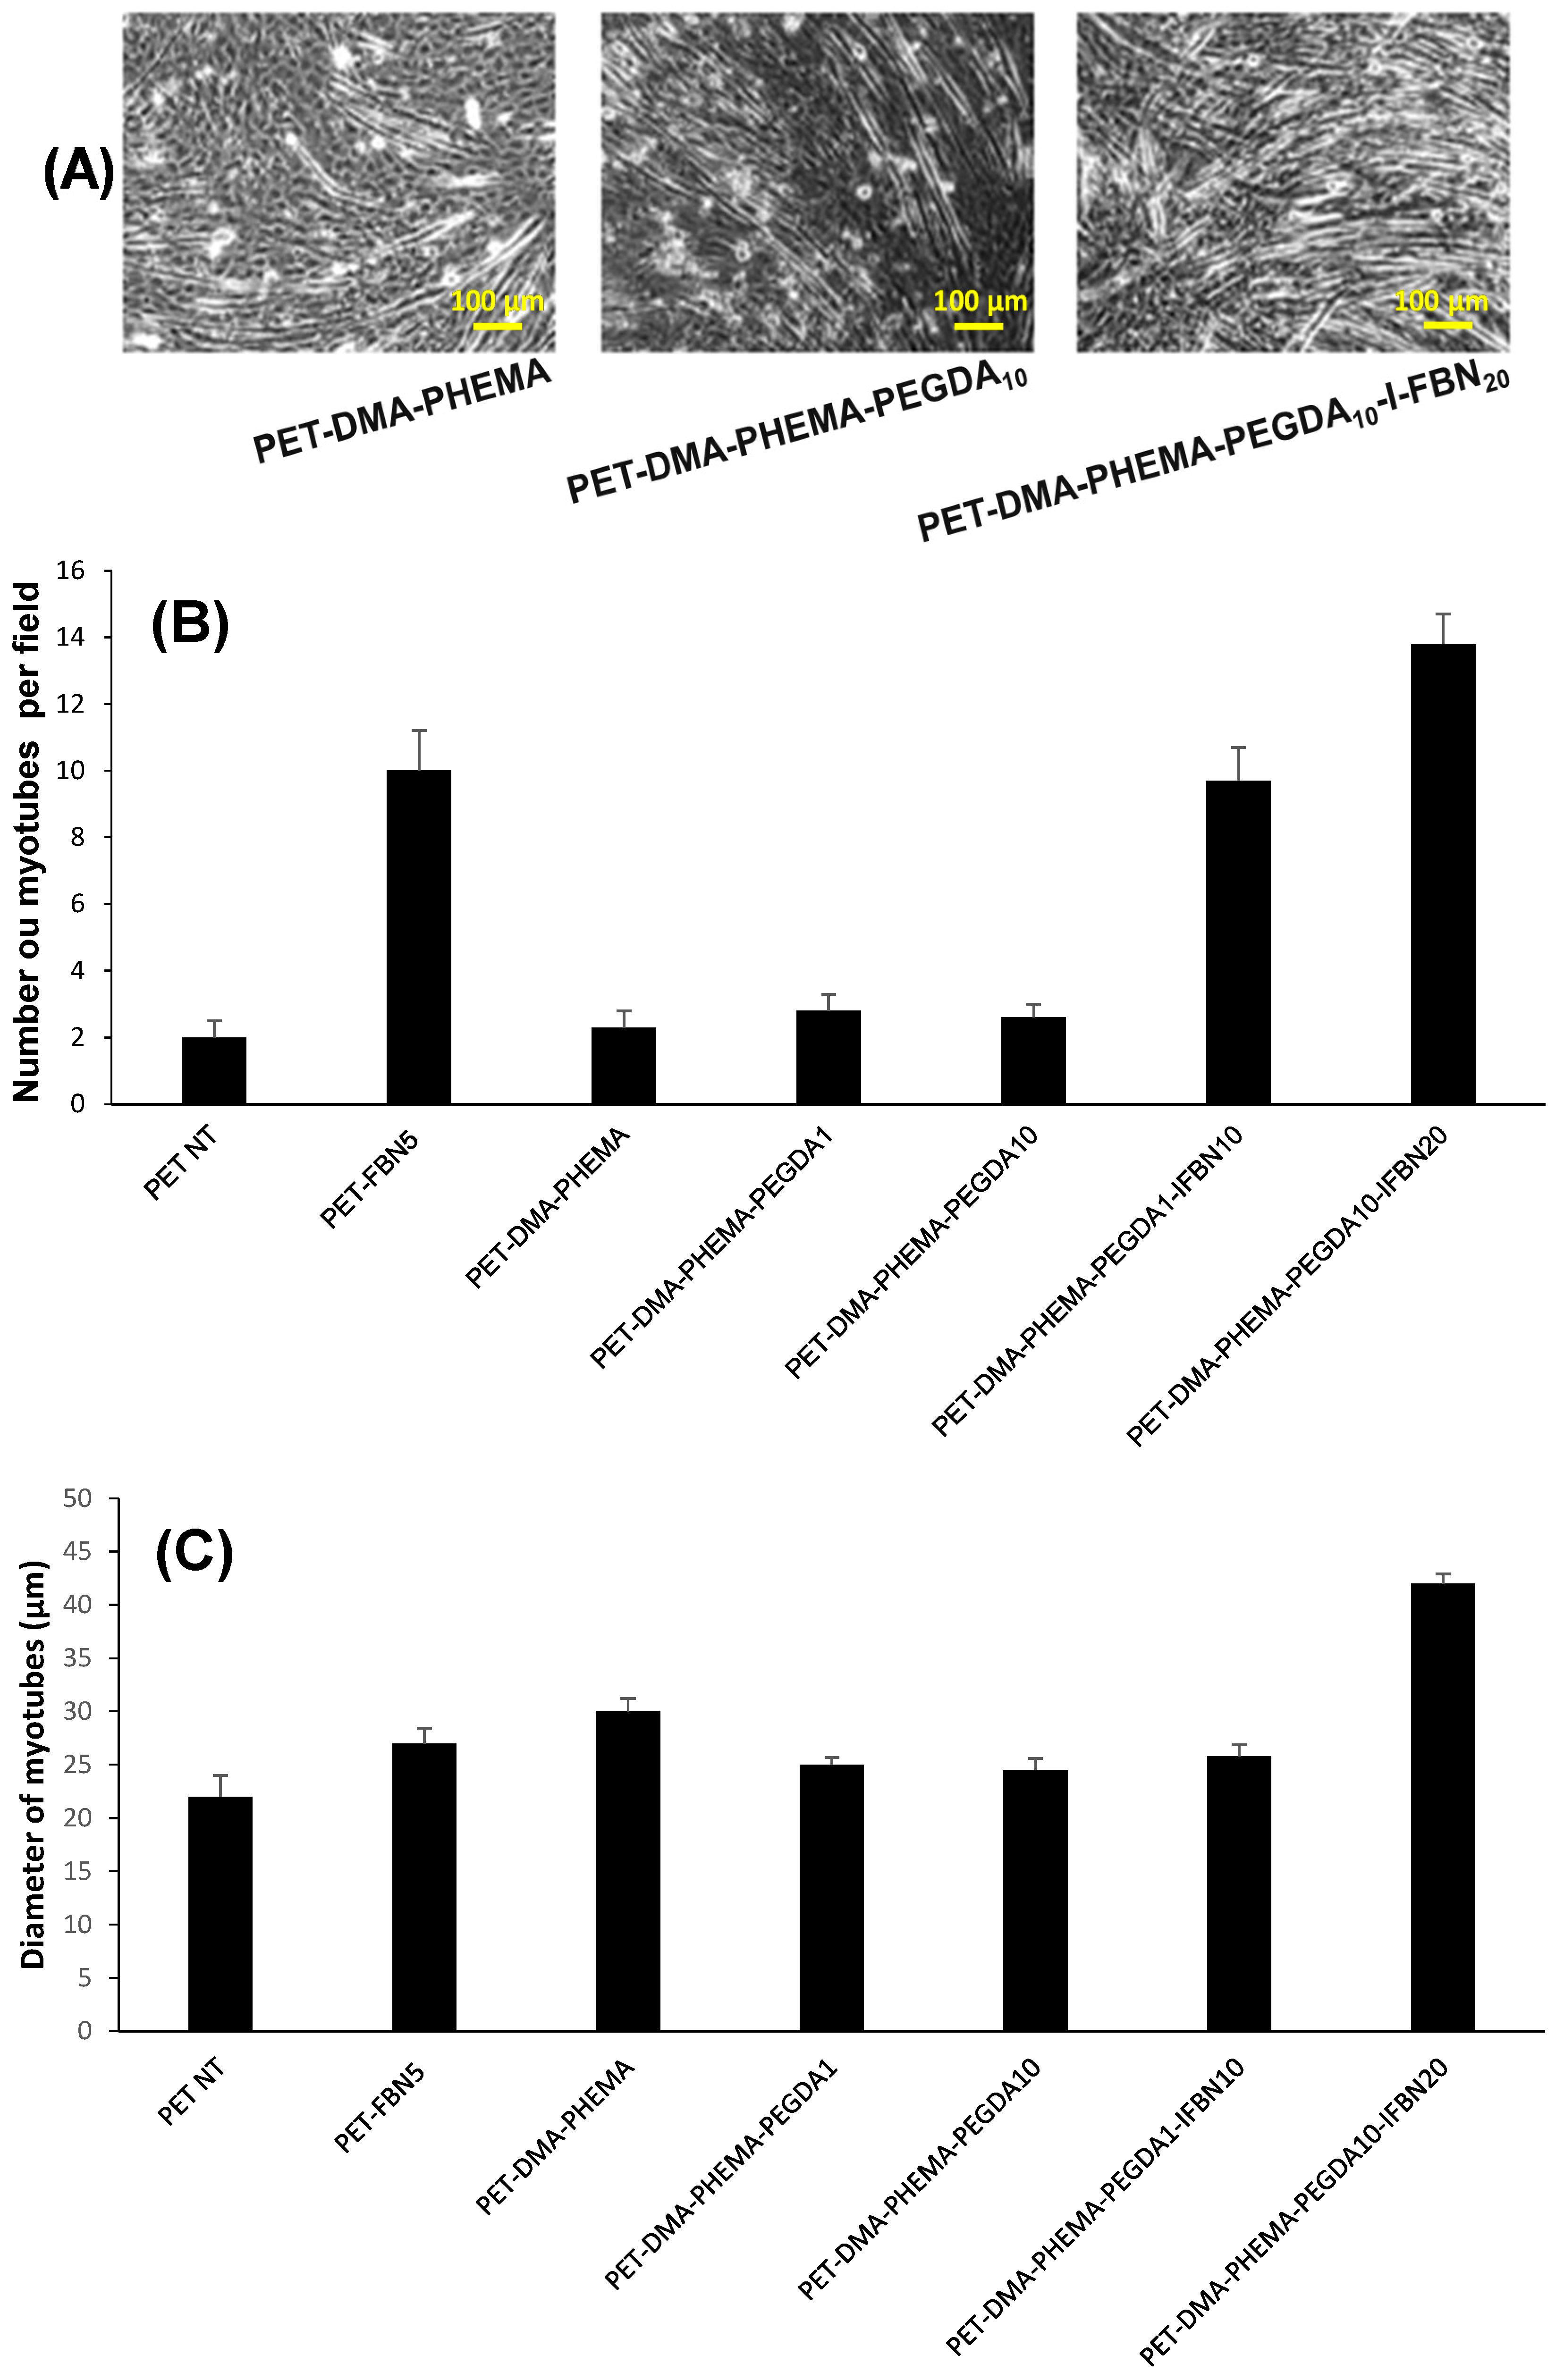
3.3. Cell Adhesion and Growth of Muscular Fibers
4. Discussion
5. Conclusions
Supplementary Materials
Author Contributions
Funding
Institutional Review Board Statement
Informed Consent Statement
Data Availability Statement
Acknowledgments
Conflicts of Interest
References
- Schwartz, M.A. Integrins and extracellular matrix in mechanotransduction. Cold Spring Harb. Perspect Biol. 2010, 2, a005066. [Google Scholar] [CrossRef]
- Srivastava, N.; James, J.; Narayan, K.S. Morphology and electrostatics play active role in neuronal differentiation processes on flexible conducting substrates. Organogenesis 2014, 10, 1–5. [Google Scholar] [CrossRef] [PubMed] [Green Version]
- Nune, M.; Manchineella, S.; Govindaraju, T.; Narayan, K.S. Melanin incorporated electroactive and antioxidant silk fibroin nanofibrous scaffolds for nerve tissue engineering. Mater. Sci. Eng. C 2019, 94, 17–25. [Google Scholar] [CrossRef] [PubMed]
- Park, J.H.; Park, J.U.; Chang, H. Advances in Biomaterials for Breast Reconstruction. Appl. Sci. 2021, 11, 7493. [Google Scholar] [CrossRef]
- Balakin, S.; Ibarlucea, B.; Belyaev, D.; Baraban, L.; Hänsel, S.; Maitz, M.; Werner, C.; Cuniberti, G. Hemocompatible Electrochemical Sensors for Continuous Monitoring of Blood Parameters. Eng. Proc. 2021, 6, 19. [Google Scholar] [CrossRef]
- Kou, L.; Yao, Q.; Zhang, H.; Chu, M.; Bhutia, Y.D.; Chen, R.; Ganapathy, V. Transporter-targeted nano-sized vehicles for enhanced and site-specific drug delivery. Cancers 2020, 12, 2837. [Google Scholar] [CrossRef]
- Chung, S.; King, M.W. Design concepts and strategies for tissue engineering scaffolds. Biotechnol. Appl. Biochem. 2011, 58, 423–438. [Google Scholar] [CrossRef]
- Ng, K.; Gao, B.; Yong, K.W.; Li, Y.; Shi, M.; Zhao, X.; Li, Z.; Zhang, X.; Pingguan-Murphy, B.; Yang, H.; et al. Paper-based cell culture platform and its emerging biomedical applications. Mater. Today 2017, 20, 32–44. [Google Scholar] [CrossRef]
- Brown, R.A.; Phillips, J.B. Cell Responses to Biomimetic Protein Scaffolds Used in Tissue Repair and Engineering. Int. Rev. Cytol. 2007, 262, 75–150. [Google Scholar]
- Zhang, X.; Xu, B.; Puperi, D.S.; Yonezawa, A.L.; Wu, Y.; Tseng, H.; Grande-Allen, K.J. Integrating valve-inspired design features into poly (ethylene glycol) hydrogel scaffolds for heart valve tissue engineering. Acta Biomater. 2015, 14, 11–21. [Google Scholar] [CrossRef] [Green Version]
- Abdul Samat, A.; Abdul Hamid, Z.A.; Jaafar, M.; Yahaya, B.H. Mechanical Properties and In Vitro Evaluation of Thermoplastic Polyurethane and Polylactic Acid Blend for Fabrication of 3D Filaments for Tracheal Tissue Engineering. Polymers 2021, 13, 3087. [Google Scholar] [CrossRef]
- Beldjilali-Labro, M.; Garcia Garcia, A.; Farhat, F.; Bedoui, F.; Grosset, J.F.; Dufresne, M.; Legallais, C. Biomaterials in tendon and skeletal muscle tissue engineering: Current trends and challenges. Materials 2018, 11, 1116. [Google Scholar] [CrossRef] [Green Version]
- Vasiliadis, A.V.; Katakalos, K. The Role of Scaffolds in Tendon Tissue Engineering. J. Funct. Biomater. 2020, 11, 78. [Google Scholar] [CrossRef]
- Zhao, Y.; Li, Y.; Peng, X.; Yu, X.; Cheng, C.; Yu, X. Feasibility study of oxidized hyaluronic acid cross-linking acellular bovine pericardium with potential application for abdominal wall repair. Int. J. Biol. Macromol. 2021, 184, 831–842. [Google Scholar] [CrossRef]
- Brown, B.N.; Badylak, S.F. Extracellular matrix as an inductive scaffold for functional tissue reconstruction. Transl. Res. 2013, 163, 268–285. [Google Scholar] [CrossRef] [PubMed] [Green Version]
- Mecham, R.P. Overview of extracellular matrix. Curr. Protoc. Cell Biol. 2012, 57, 10.1.1–10.1.16. [Google Scholar] [CrossRef]
- Hussey, G.S.; Dziki, J.L.; Badylak, S.F. Extracellular matrix-based materials for regenerative medicine. Nat. Rev. Mater. 2018, 3, 159–173. [Google Scholar] [CrossRef]
- Hynes, R.O.; Naba, A. Overview of the matrisome—An inventory of extracellular matrix constituents and functions. Cold Spring Harb. Perspect Biol. 2012, 4, a004903. [Google Scholar] [CrossRef] [PubMed] [Green Version]
- Statzer, C.; Ewald, C.Y. The extracellular matrix phenome across species. Matrix Biol. Plus 2020, 8, 100039. [Google Scholar] [CrossRef] [PubMed]
- Lu, P.; Takai, K.; Weaver, V.M.; Werb, Z. Extracellular matrix degradation and remodeling in development and disease. Cold Spring Harb. Perspect Biol. 2011, 3, a005058. [Google Scholar] [CrossRef]
- Winkler, J.; Abisoye-Ogunniyan, A.; Metcalf, K.J.; Werb, Z. Concepts of extracellular matrix remodelling in tumour progression and metastasis. Nat. Commun. 2020, 11, 5120. [Google Scholar] [CrossRef] [PubMed]
- Singh, A.; Zakaria, S.; Joshi, N.; Jha, P.; Decorse, P.; Lecoq, H.; Lau-Truong, S.; Jouini, M.; Aswal, D.K.; Chehimi, M.M. Electrochemical investigation of free-standing polypyrrole–silver nanocomposite films: A substrate free electrode material for supercapacitors. RSC Adv. 2013, 3, 24567–24575. [Google Scholar] [CrossRef]
- Lo, M.; Seydou, M.; Bensghaïer, A.; Pires, R.; Gningue-Sall, D.; Aaron, J.J.; Mekhalif, Z.; Delhalle, J.; Chehimi, M.M. Polypyrrole-wrapped carbon nanotube composite films coated on diazonium-modified flexible ITO sheets for the electroanalysis of heavy metal ions. Sensors 2020, 20, 580. [Google Scholar] [CrossRef] [PubMed] [Green Version]
- Fukuda, K.; Yu, K.; Someya, T. The future of flexible organic solar cells. Adv. Energy Mater. 2020, 10, 2000765. [Google Scholar] [CrossRef]
- Gooding, J.J.; Ciampi, S. The molecular level modification of surfaces: From self-assembled monolayers to complex molecular assemblies. Chem. Soc. Rev. 2011, 40, 2704–2718. [Google Scholar] [CrossRef] [Green Version]
- Mousli, F.; Snoussi, Y.; Khalil, A.M.; Jlassi, K.; Mekki, A.; Chehimi, M.M. Surface Modification of Polymeric Substrates with Photo- and Sonochemically Designed Macromolecular Grafts. In Surface Modification of Polymers: Methods and Applications; Pinson, J., Thiry, D., Eds.; Wiley-VCH: Weinheim, Germany, 2019; pp. 273–315. [Google Scholar]
- Hetemi, D.; Noël, V.; Pinson, J. Grafting of diazonium salts on surfaces: Application to biosensors. Biosensors 2020, 10, 4. [Google Scholar] [CrossRef] [Green Version]
- Amani, H.; Arzaghi, H.; Bayandori, M.; Dezfuli, A.S.; Pazoki-Toroudi, H.; Shafiee, A.; Moradi, L. Controlling cell behavior through the design of biomaterial surfaces: A focus on surface modification techniques. Adv. Mater. Interfaces 2019, 6, 1900572. [Google Scholar] [CrossRef] [Green Version]
- Zoppe, J.O.; Ataman, N.C.; Mocny, P.; Wang, J.; Moraes, J.; Klok, H.A. Surface-initiated controlled radical polymerization: State-of-the-art, opportunities, and challenges in surface and interface engineering with polymer brushes. Chem. Rev. 2017, 117, 1105–1318. [Google Scholar] [CrossRef] [Green Version]
- Bensghaïer, A.; Mousli, F.; Lamouri, A.; Postnikov, P.S.; Chehimi, M.M. The Molecular and Macromolecular Level of Carbon Nanotube Modification Via Diazonium Chemistry: Emphasis on the 2010s Years. Chem. Afr. 2020, 3, 535–569. [Google Scholar] [CrossRef]
- Chehimi, M.M. (Ed.) Aryl Diazonium Salts: New Coupling Agents in Polymer and Surface Science; Wiley-VCH: Weinheim, Germany, 2012. [Google Scholar]
- Bélanger, D.; Pinson, J. Electrografting: A powerful method for surface modification. Chem. Soc. Rev. 2011, 40, 3995–4048. [Google Scholar] [CrossRef] [PubMed]
- Gautier, C.; Lopez, I.; Breton, T. A post-functionalization toolbox for diazonium (electro)-grafted surfaces: Review of the coupling methods. Mater. Adv. 2021, 2, 2773–2810. [Google Scholar] [CrossRef]
- Ben Slama, R.; Mrabet, B.; Bakhrouf, A.; Salmi, Z.; Bakas, I.; Chehimi, M.M. Polymer/silver hybrid thin films for anti-pathogenic bacterial applications. Surf. Innov. 2015, 3, 103–114. [Google Scholar] [CrossRef]
- Mahjoubi, H.; Buck, E.; Manimunda, P.; Farivar, R.; Chromik, R.; Murshed, M.; Cerruti, M. Surface phosphonation enhances hydroxyapatite coating adhesion on polyetheretherketone and its osseointegration potential. Acta Biomater. 2017, 47, 149–158. [Google Scholar] [CrossRef] [PubMed]
- Boccafoschi, F.; Fusaro, L.; Botta, M.; Ramella, M.; Chevallier, P.; Mantovani, D.; Cannas, M. Arginine-glycine-glutamine and serine-isoleucine-lysine-valine-alanine-valine modified poly(l-lactide) films: Bioactive molecules used for surface grafting to guide cellular contractile phenotype. Biointerphases 2014, 9, 029002. [Google Scholar] [CrossRef] [PubMed]
- Gam-Derouich, S.; Mahouche-Chergui, S.; Turmine, M.; Piquemal, J.Y.; Hassen-Chehimi, D.B.; Omastová, M.; Chehimi, M.M. A versatile route for surface modification of carbon, metals and semi-conductors by diazonium salt-initiated photopolymerization. Surf. Sci. 2011, 605, 1889–1899. [Google Scholar] [CrossRef]
- Zare, M.; Bigham, A.; Zare, M.; Luo, H.; Rezvani Ghomi, E.; Ramakrishna, S. pHEMA: An Overview for Biomedical Applications. Int. J. Mol. Sci. 2021, 22, 6376. [Google Scholar] [CrossRef]
- Yang, J.; Shen, M.H. Polyethylene glycol-mediated cell fusion. Methods Mol. Biol. 2006, 325, 59–66. [Google Scholar]
- Legeay, G.; Coudreuse, A.; Poncin-Epaillard, F.; Herry, J.M.; Bellon-Fontaine, M.N. Surface engineering and cell adhesion. J. Adhes. Sci. Technol. 2010, 24, 2301–2322. [Google Scholar] [CrossRef]


| Materials | % C | % O | % N | % S |
|---|---|---|---|---|
| PET (KOH-activated) | 74.4 | 25.6 | 0 | - |
| PET-DMA | 71.7 | 25.1 | 3.3 | - |
| PET-DMA-PHEMA | 71.8 | 28.0 | 0.2 | - |
| PET-DMA-PHEMA-I | 50.7 | 46.7 | 2.6 | - |
| PET-DMA-PHEMA-I-FBN0.5 | 70.9 | 27.0 | 2.1 | traces |
| PET-DMA-PHEMA-I-FBN2 | 70.2 | 28.0 | 1.7 | 0.1 |
| PET-DMA-PHEMA-I-FBN5 | 69.8 | 26.8 | 3.3 | 0.1 |
| PET-DMA-PHEMA-I-FBN10 | 69.6 | 25.2 | 5.0 | 0.2 |
| PET-DMA-PHEMA-I-FBN20 | 68.5 | 24.3 | 7.0 | 0.2 |
| PET-DMA-PHEMA-PEGDA1 | 69.3 | 30.4 | 0.3 | - |
| PET-DMA-PHEMA-PEGDA10 | 69.3 | 30.5 | 0.2 | - |
| PET-DMA-PHEMA-PEGDA1-I | 49.2 | 48.7 | 2.2 | |
| PET-DMA-PHEMA-PEGDA10-I | 46.5 | 53.2 | 0.3 | |
| PET-DMA-PHEMA-PEGDA1-I-FBN20 | 49.8 | 49.1 | 1.0 | ~0.1 |
| PET-DMA-PHEMA-PEGDA10-I-FBN20 | 49.5 | 49.6 | 0.8 | ~0.1 |
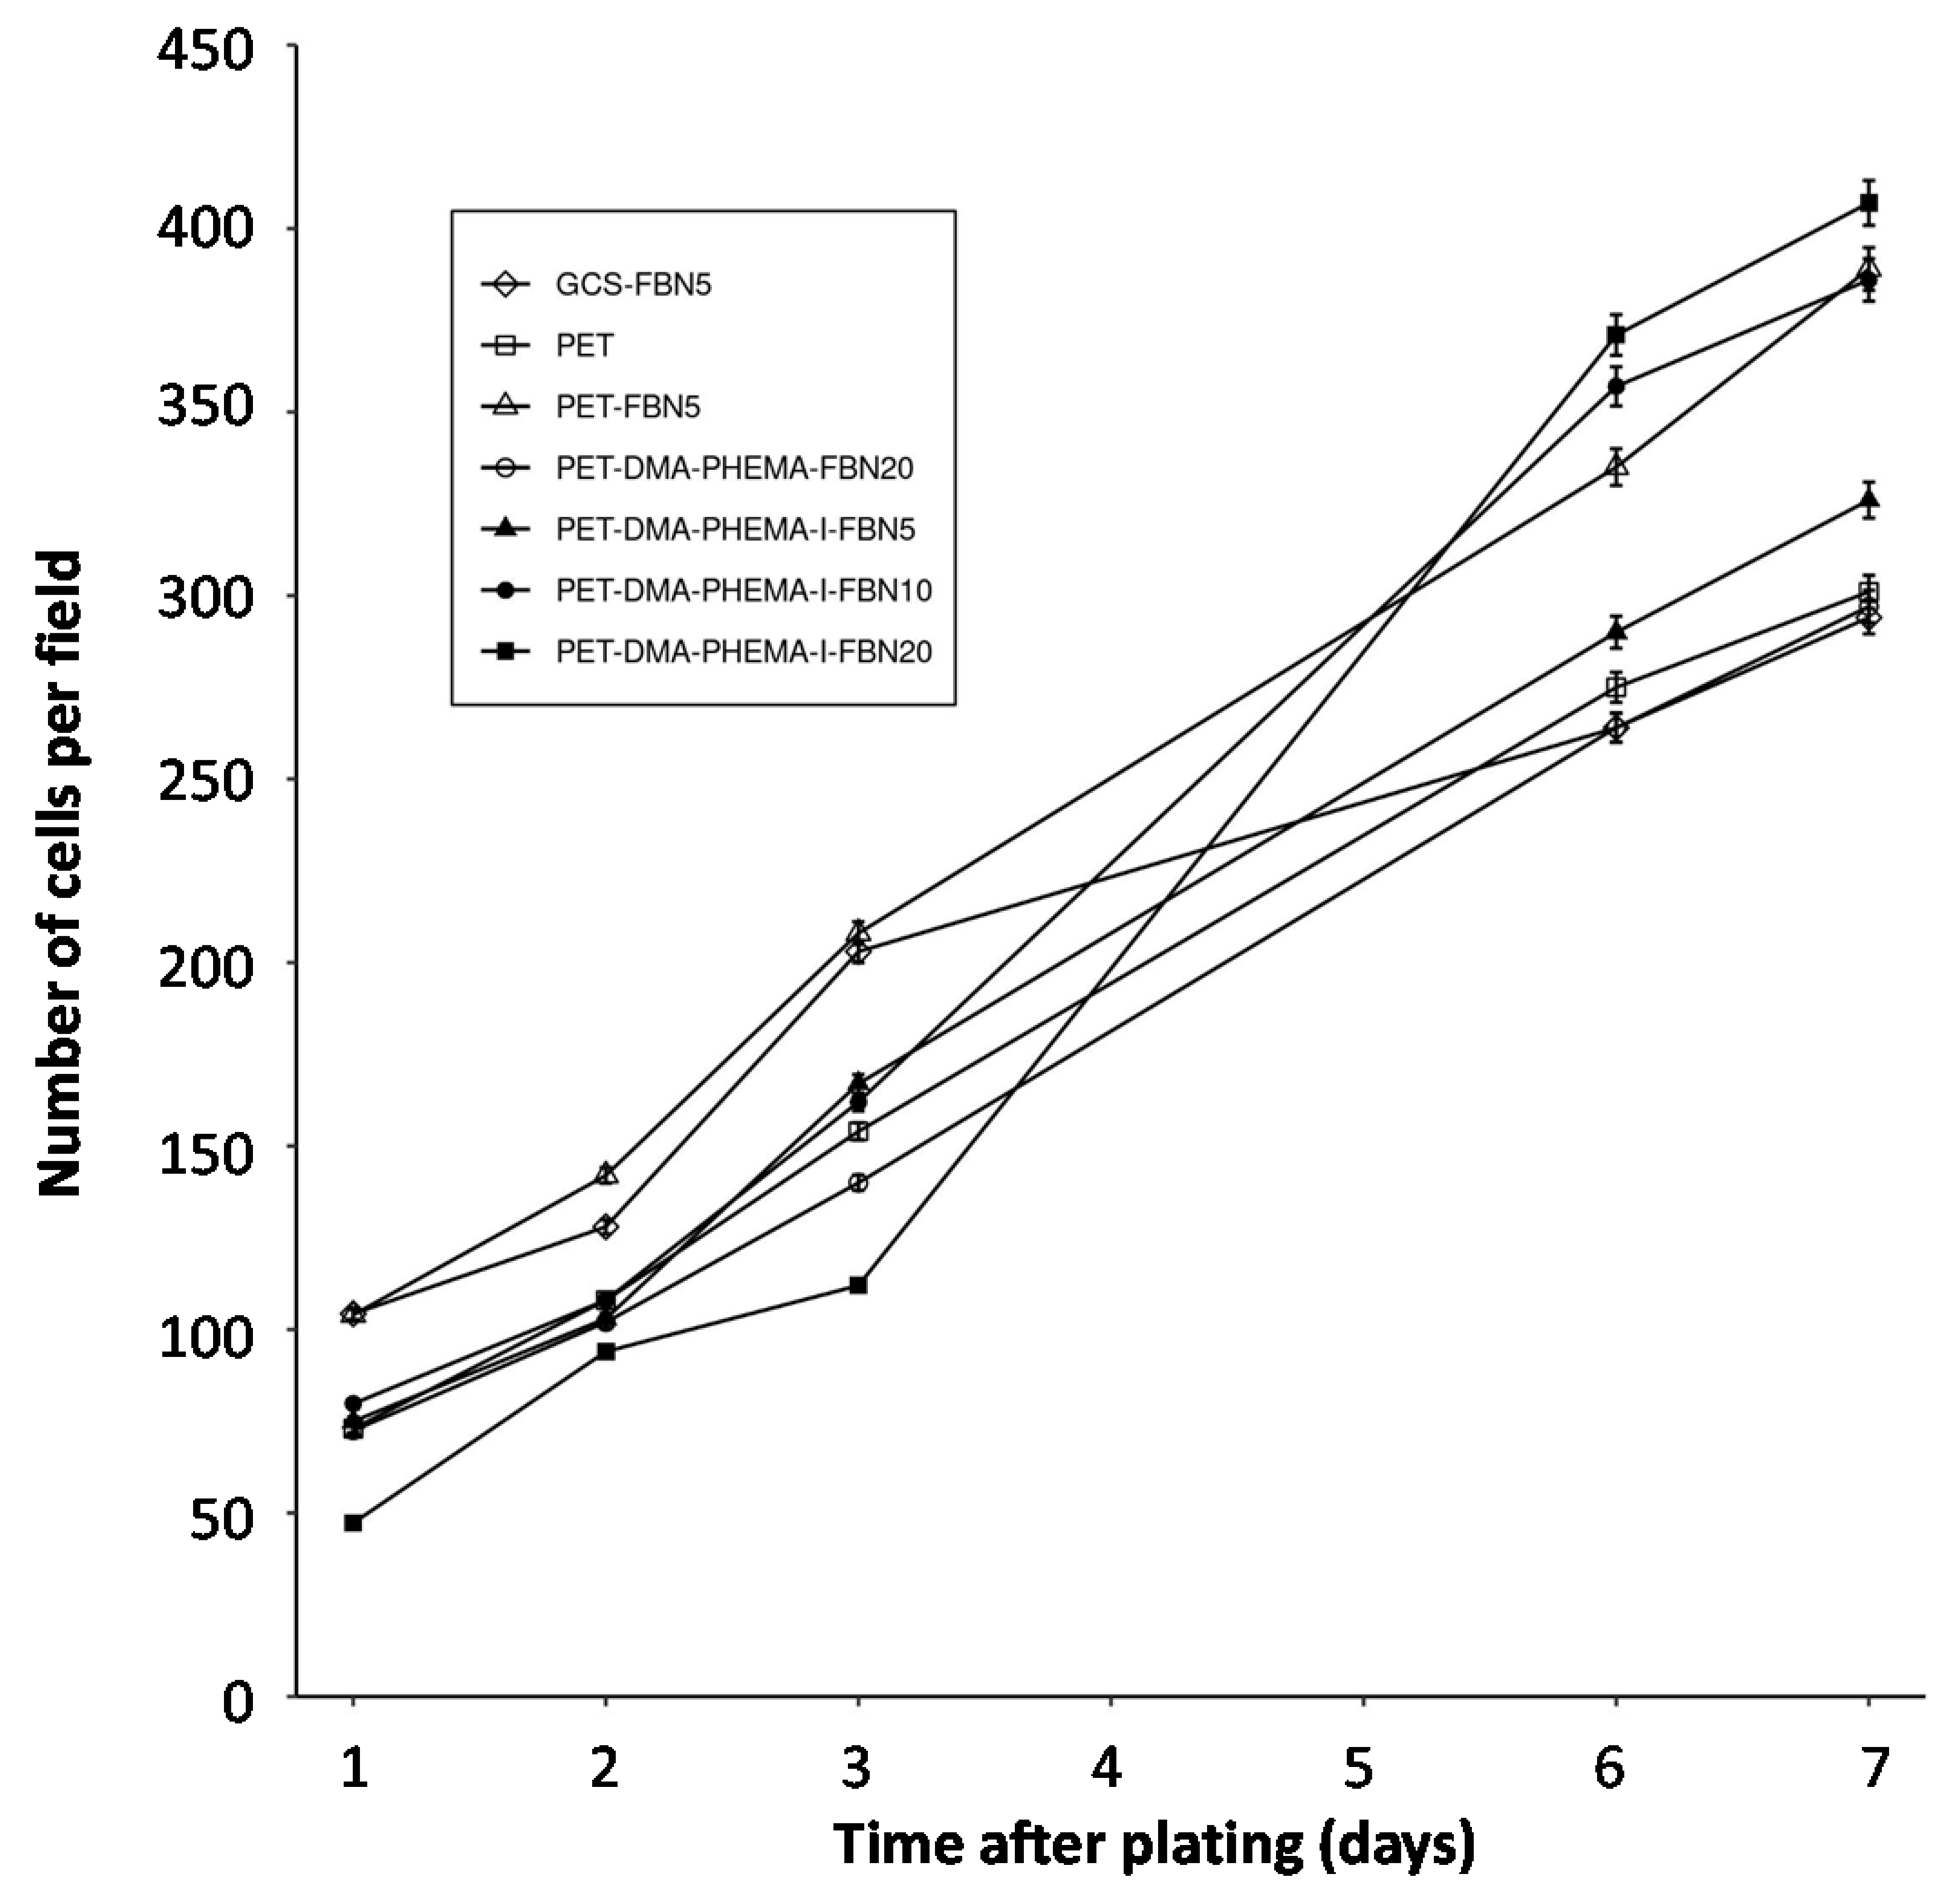
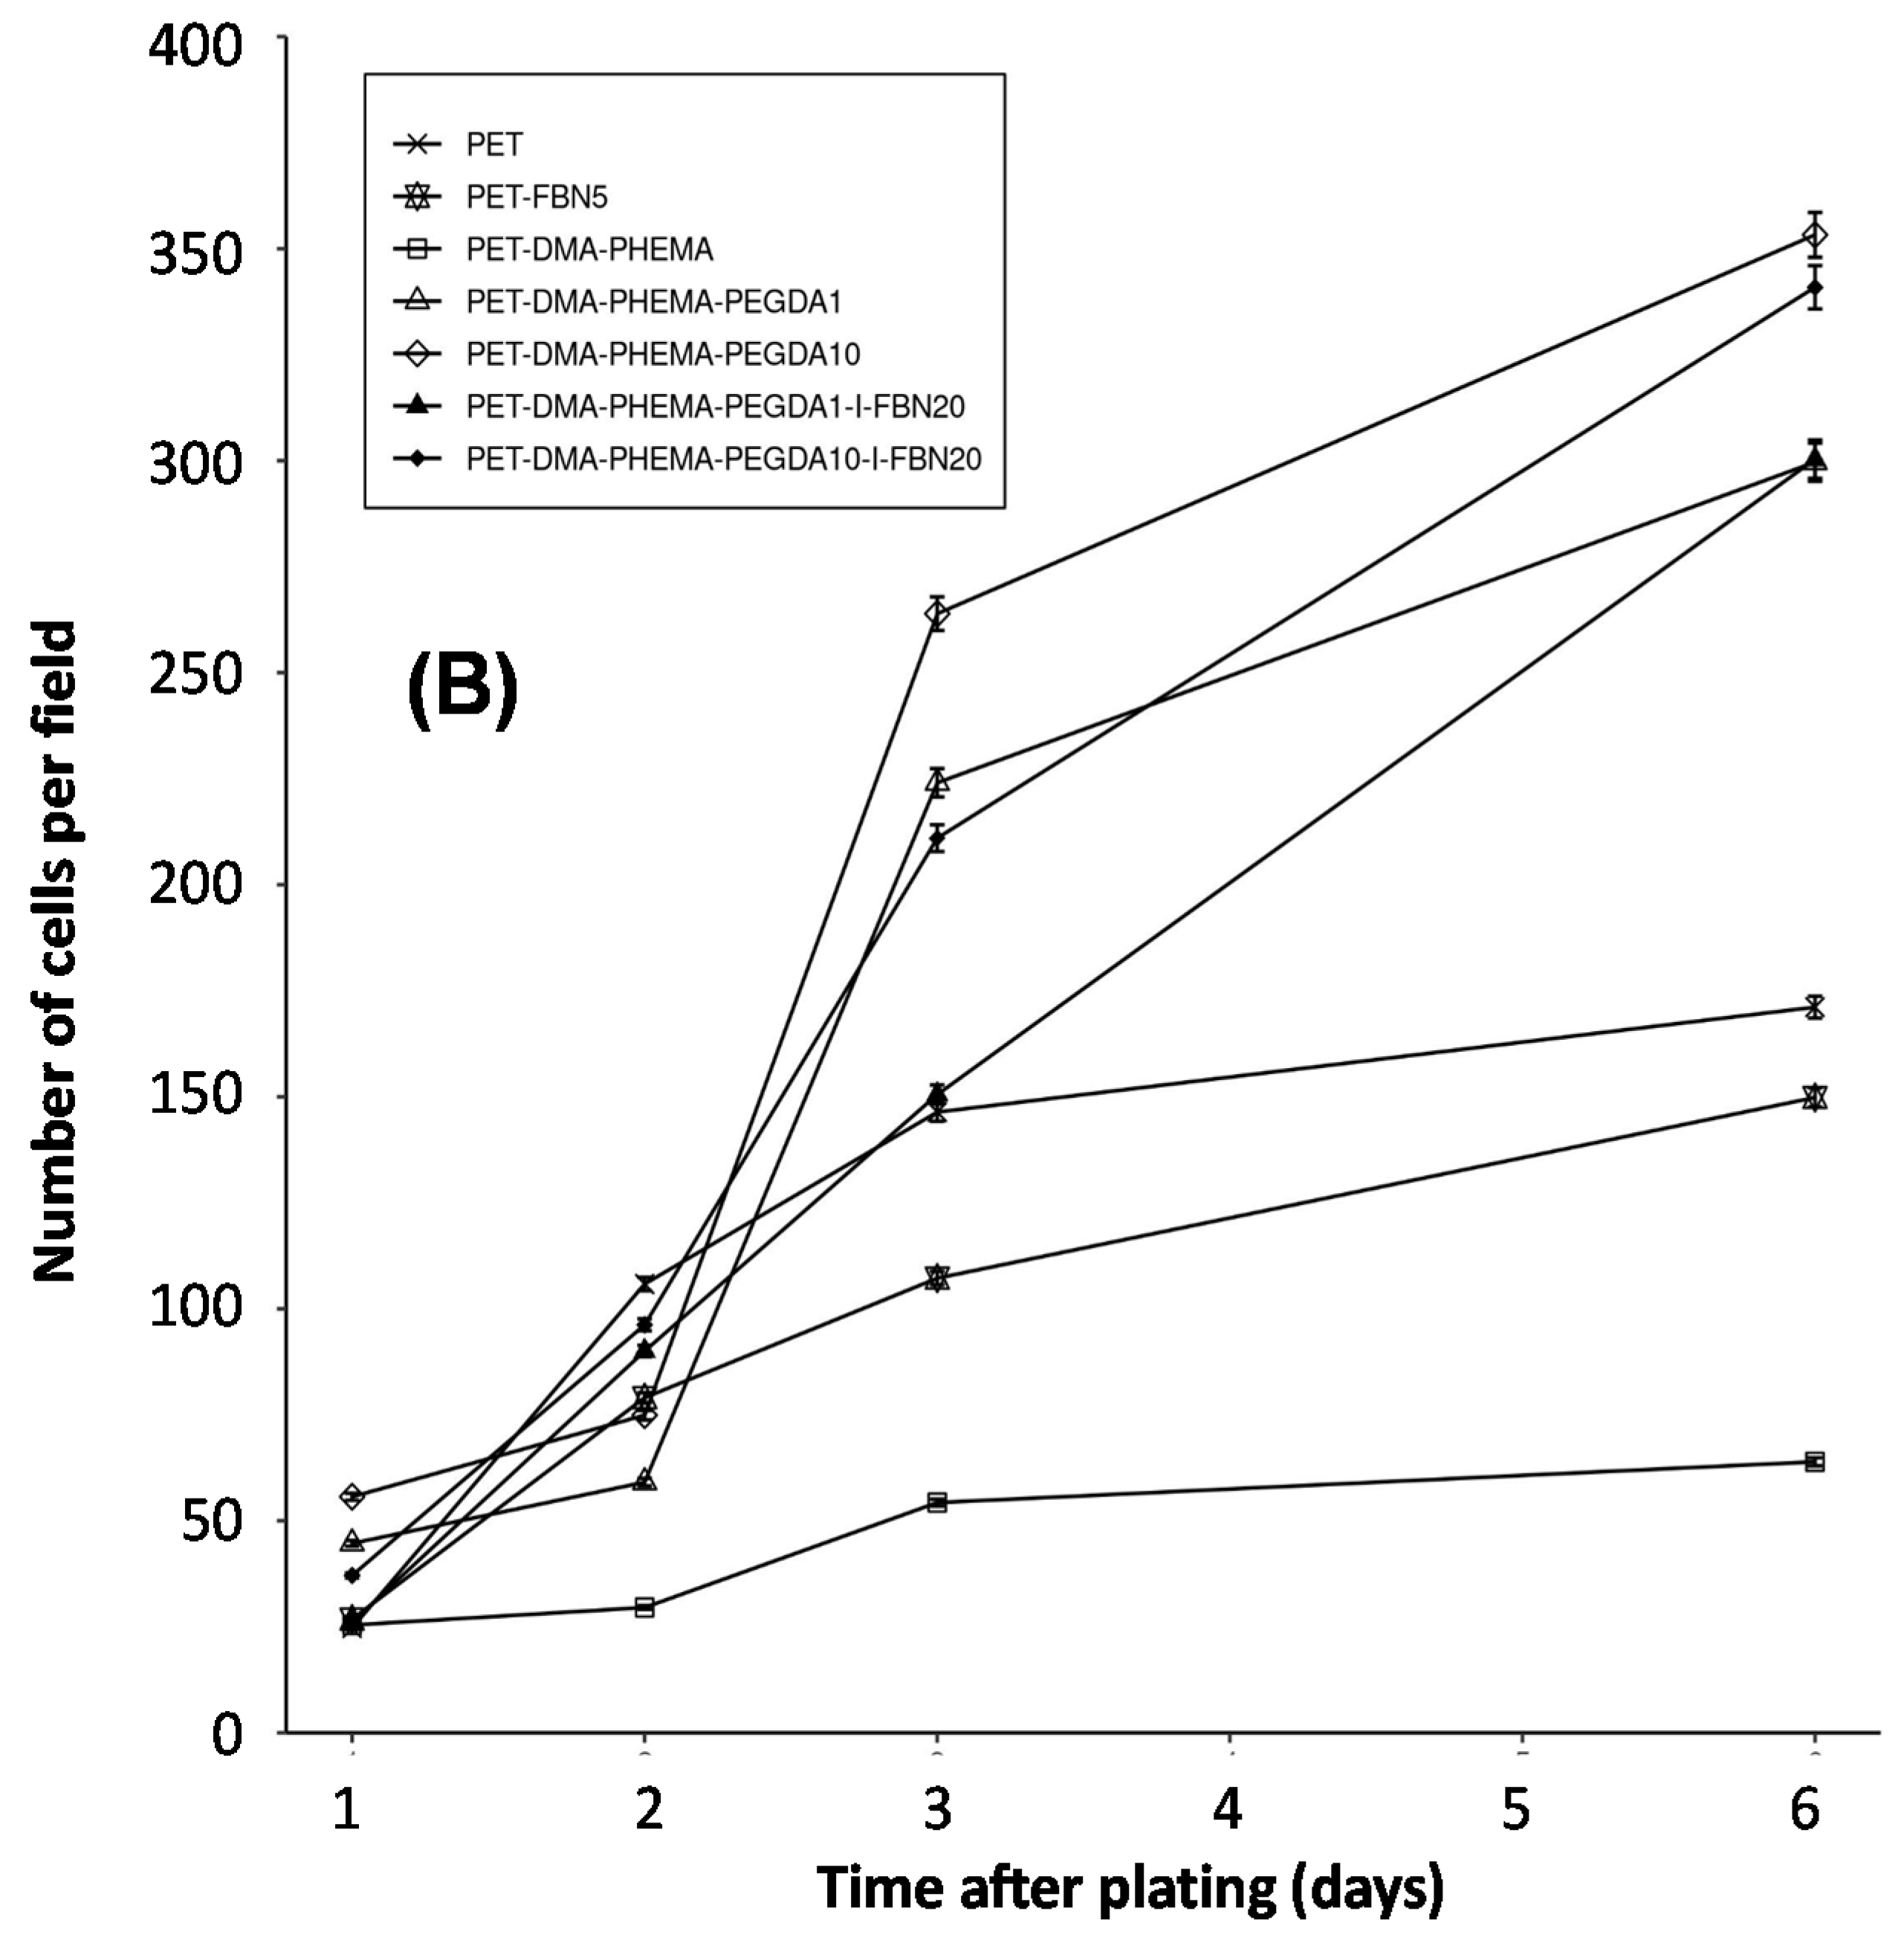
| PET Surfaces | Exponential Coefficient (k) | Half-Time (Days) | Figure |
|---|---|---|---|
| GCS-FBN5 | 0.17 | 4.1 | 4 |
| PET | 0.23 | 3.0 | 4 |
| PET-FBN5 | 0.23 | 3.0 | 4 |
| PET-DMA-PHEMA-FBN20 | 0.21 | 3.3 | 4 |
| PET-DMA-PHEMA-I-FBN5 | 0.24 | 2.9 | 4 |
| PET-DMA-PHEMA-I-FBN10 | 0.27 | 2.6 | 4 |
| PET-DMA-PHEMA-I-FBN20 | 0.35 | 2.0 | 4 |
| PET | 0.24 | 2.9 | 5 |
| PET-DMA-PHEMA | 0.20 | 3.5 | 5 |
| PET-DMA-PHEMA-PEGDA1 | 0.38 | 1.8 | 5 |
| PET-DMA-PHEMA-PEGDA10 | 0.38 | 1.8 | 5 |
| PET-DMA-PHEMA-PEGDA1-I-FBN20 | 0.44 | 1.6 | 5 |
| PET-DMA-PHEMA-PEGDA10-I-FBN20 | 0.42 | 1.7 | 5 |
Publisher’s Note: MDPI stays neutral with regard to jurisdictional claims in published maps and institutional affiliations. |
© 2021 by the authors. Licensee MDPI, Basel, Switzerland. This article is an open access article distributed under the terms and conditions of the Creative Commons Attribution (CC BY) license (https://creativecommons.org/licenses/by/4.0/).
Share and Cite
Samanta, S.; Gaad, D.; Cabet, E.; Lilienbaum, A.; Singh, A.; Aswal, D.K.; Chehimi, M.M. Flexible, Biocompatible PET Sheets: A Platform for Attachment, Proliferation and Differentiation of Eukaryotic Cells. Surfaces 2021, 4, 306-322. https://doi.org/10.3390/surfaces4040026
Samanta S, Gaad D, Cabet E, Lilienbaum A, Singh A, Aswal DK, Chehimi MM. Flexible, Biocompatible PET Sheets: A Platform for Attachment, Proliferation and Differentiation of Eukaryotic Cells. Surfaces. 2021; 4(4):306-322. https://doi.org/10.3390/surfaces4040026
Chicago/Turabian StyleSamanta, Soumen, Diana Gaad, Eva Cabet, Alain Lilienbaum, Ajay Singh, Dinesh K. Aswal, and Mohamed M. Chehimi. 2021. "Flexible, Biocompatible PET Sheets: A Platform for Attachment, Proliferation and Differentiation of Eukaryotic Cells" Surfaces 4, no. 4: 306-322. https://doi.org/10.3390/surfaces4040026
APA StyleSamanta, S., Gaad, D., Cabet, E., Lilienbaum, A., Singh, A., Aswal, D. K., & Chehimi, M. M. (2021). Flexible, Biocompatible PET Sheets: A Platform for Attachment, Proliferation and Differentiation of Eukaryotic Cells. Surfaces, 4(4), 306-322. https://doi.org/10.3390/surfaces4040026