Article

Ultrafast Growth of h-MoO3 Microrods and Its Acetone Sensing Performance

by
Giovana T. Santos
,
Anderson A. Felix
* and
Marcelo O. Orlandi
*
Department of Engineering, Physics and Mathematics, Chemistry Institute, São Paulo State University (UNESP), Araraquara, São Paulo 14800-060, Brazil
*
Authors to whom correspondence should be addressed.
Surfaces 2021, 4(1), 9-16; https://doi.org/10.3390/surfaces4010002
Submission received: 27 November 2020 / Revised: 21 December 2020 / Accepted: 22 December 2020 / Published: 26 December 2020

Abstract

:
Hexagonal molybdenum trioxide (h-MoO3) was synthesized by microwave-assisted hydrothermal method, allowing an ultrafast growth of unidimensional microrods with well-faceted morphology. The crystalline structure of this metastable phase was confirmed by X-ray diffraction (XRD) and Raman spectroscopy. Scanning electron microscopy (SEM) showed that hexagonal microrods can be obtained in one minute with well-defined exposed facets and the fine control of morphology. Sensing tests of the acetone biomarker revealed that the h-MoO3 microrods exhibit, at low ppm level, good sensor signal, fast response/recovery times, selectivity to different interferent gases, and a lower detection limit of 400 ppb.

1. Introduction

In the last few years, chemoresistive gas sensors using semiconducting metal oxides (SMOx) as sensing layer have been widely investigated for application in noninvasive diabetes diagnostics based on the detection of the acetone biomarker in human breath [1]. The application of these chemoresistive gas sensors as diabetes diagnostic tool offers advantages, such as low-cost processing, simple design and, mainly, great potential for integration in portable electronic devices [2]. Besides, it can exhibit sensitivity and selectivity comparable to other types of gas sensors, such as optical sensors, electrochemical sensors, etc. [3,4], which shows high cost and limited portability [3].
Diabetes patients exhale acetone concentrations higher than 1.8 ppm, while healthy people exhale concentrations between 300 and 900 ppm [3]. This narrow acetone concentration range to distinguish healthy and ill people requires chemoresistive sensors with high sensitivity and selectivity, combined with reduced lower limit detection (LDL). To overcome these issues, several n-type and p-type SMOx, such as WO3 [2,3,5], SnO2 [5,6], TiO2 [7], Co3O4 [8], have been considered as sensing layers in chemoresistive gas sensors. Furthermore, different surface engineering approaches of SMOx, including functionalization with noble metals or semiconductor heterostructures, have been also investigated, aiming mainly for high acetone selectivity, which is a major challenge in exhaled breath sensors [9].
Among other SMOx polymorphic molybdenum trioxide (MoO3) phases are wide band gap semiconductors (>2.7 eV) with functional optical and electronic properties, making them adaptable for different electronic applications, such as gas sensors, energy-storage units and electrochromic systems [10,11,12]. The orthorhombic α-MoO3 phase is thermodynamically stable and its properties have been widely investigated [13,14,15]. On the other hand, the knowledge about the physical and chemical properties of the (ε, β and h)-MoO3 metastable phases, which often offers enhanced properties when compared to the thermodynamic stable one [16,17,18], is still limited due to the restricted number of routes that allow for stabilizing these metastable phases under normal ambient conditions [10,18].
The hexagonal (h-MoO3) phase exhibits a crystalline lattice composed by zigzag chains of MoO6 octahedra connected to each other by corner sharing, which leads to the formation of large one-dimensional tunnels along the c direction [10,19]. The general formula of the hexagonal phase is given by (A2O)x·MoO3·(H2O)y, where A is an alkali-metal or ammonium ions and x and y values are directly correlated to the synthesis route, because cations or water molecules can be intercalated on the tunnels depending on the synthesis route [10,19]. The h-MoO3 is a temperature-dependent metastable phase with thermodynamic stability up to 400 °C exhibiting promising gas sensing property [20,21,22,23]. However, the synthesis of well-defined morphologies of this metastable phase using low temperature, short time and exhibiting thermodynamic stability is still not overcome.
Herein, the microwave-assisted hydrothermal method was employed to synthesize crystalline h-MoO3 microrods at low temperature and for a short time. This route allowed an ultrafast and template-free growth of well-faceted hexagonal rods with controlled size distribution. In addition, we reported for the first time, to the best of our knowledge, the sensing capability of this metastable phase to acetone biomarker showing good sensor signal and selectivity combined with fast speed response and excellent lower detection limit.

2. Materials and Methods

The h-MoO3 microrods were prepared by a template-free microwave-assisted hydrothermal (MAH) route. The precursor solution was prepared dissolving molybdic acid (H2MoO4—1.00 g—Sigma-Aldrich) in 100 mL of aqueous nitric acid solution (HNO3—0.05 M) at 25 °C under constant stirring. This solution was placed in a sealed Teflon autoclave and heated in a microwave system (2.45 GHz/800 W) at 125 °C for 1 min using a heating rate of 50 °C/min. After cooling down, the final suspension was centrifuged at 10,000 rpm and the collected powder was washed with deionized water several times and dried at 80 °C for 24 h.
X-ray diffraction (XRD) (Diffractometer D8 ADVANCE Eco, Cu-Kα radiation, Bruker, Billerica, MA, USA), Raman spectroscopy (Micro Raman Lab RAM HR800, λlaser = 632.8 nm, Horiba Jobin Yvon, Kyoto, Japan) and scanning electron microscopy (FEG-SEM, 7500F, JEOL, Tokyo, Japan) were used to evaluate the crystalline structure and morphological characteristics of the powders.
Gas sensing measurements were carried out using a planar-type gas sensor device in a self-heating configuration. This type of device is composed of interdigitated platinum electrodes (arrays of 300 µm Pt fingers spaced 300 µm apart) on insulating alumina substrates in which a porous sensing layer is deposited by drop-casting method using an isopropanol suspension of h-MoO3 microrods (5 mg powder/100 µL isopropanol). The heaters are metallic tracks on the backside of the alumina substrate and the temperature is controlled by the current on the heater element using an external power supply (DLM40-15, Sorensen, AMETEK, Berwyn, PA, USA). The resistance of the devices was monitored over time in a multichannel system using a data acquisition switch unit (34972A, Keysight, Santa Rosa, CA, USA) under cyclic exposure between air baseline and the premixed analyte gases in dry air at 200 °C, keeping the total gas flow rate (analyte gas plus dry synthetic air) at 100 sccm (gas flow controller GV50A, MKS, Andover, MA, USA). More details about the gas sensing setup and measurements can be found in our previous manuscripts [24,25]. Sensor signal (S) was defined as Rair/Rgas for reducing gas and Rgas/Rair for oxidizing gases, the response/recovery time was taken as the time needed to reach 90% of the final steady-state signal and the selectivity was estimated as Sacetone/Sinterferent [26,27]. Two sensor devices were tested to verify the reproducibility of the acetone sensing response.

3. Results

All diffraction peaks in the XRD pattern shown in Figure 1a can be indexed by the hexagonal molybdenum trioxide (h-MoO3) phase with space group P63/m and lattice parameters a = b = 10.584 Å and c = 3.72776 Å, according to the standard Inorganic Crystal Structure Database (ICSD) card #75417, indicating a single-phase powder with high crystallinity [28]. However, the relative peak intensities reveal that the {100} plane family is more intense when compared to the standard ICSD card, suggesting an anisotropic crystalline growth of the h-MoO3 phase [10,19]. Raman active modes identified in Figure 1b confirm the metastable hexagonal phase of MoO3 [29]. The bands located at 985–974 cm−1 and 912–880 cm−1 are assigned to the symmetrical and asymmetrical stretching modes, respectively, of the Mo=O double bond. The several bands appearing between 550–200 cm−1 are mainly related to the Mo-O-Mo vibrations (rocking and scissoring), while the modes below 200 cm−1 are associated to the MoO6 octahedral vibrations in the h-MoO3 phase [29].
The formation of unidimensional microrods with well-faceted hexagonal cross section, regular size and smooth surface can be observed in the SEM images (Figure 2a). Large size microrods, with monomodal length distribution and average length of (25 ± 7) μm (Figure 2b), grown in one-minute isothermal treatment suggest an ultrafast growth of the h-MoO3 phase via the template-free MAH method. The growth of large h-MoO3 crystals via the conventional hydrothermal method using longer times has been attributed to the Ostwald ripening mechanism [21]. Here, the nucleation of the h-MoO3 phase occurs in the initial reaction process in water solution due to the dissociation and association of the reactant molybdic acid (H2MoO4) and nitric acid (HNO3) molecules leading to the formation of a large number of MoO6 octahedral crystal nuclei, which is the building block of the polymorphic MoO3 phases [10]. Local microwave heating induces a quick and strong integration of the nuclei forming small h-MoO3 particles that quickly lead to anisotropic growth of large microrods through the Ostwald ripening process.
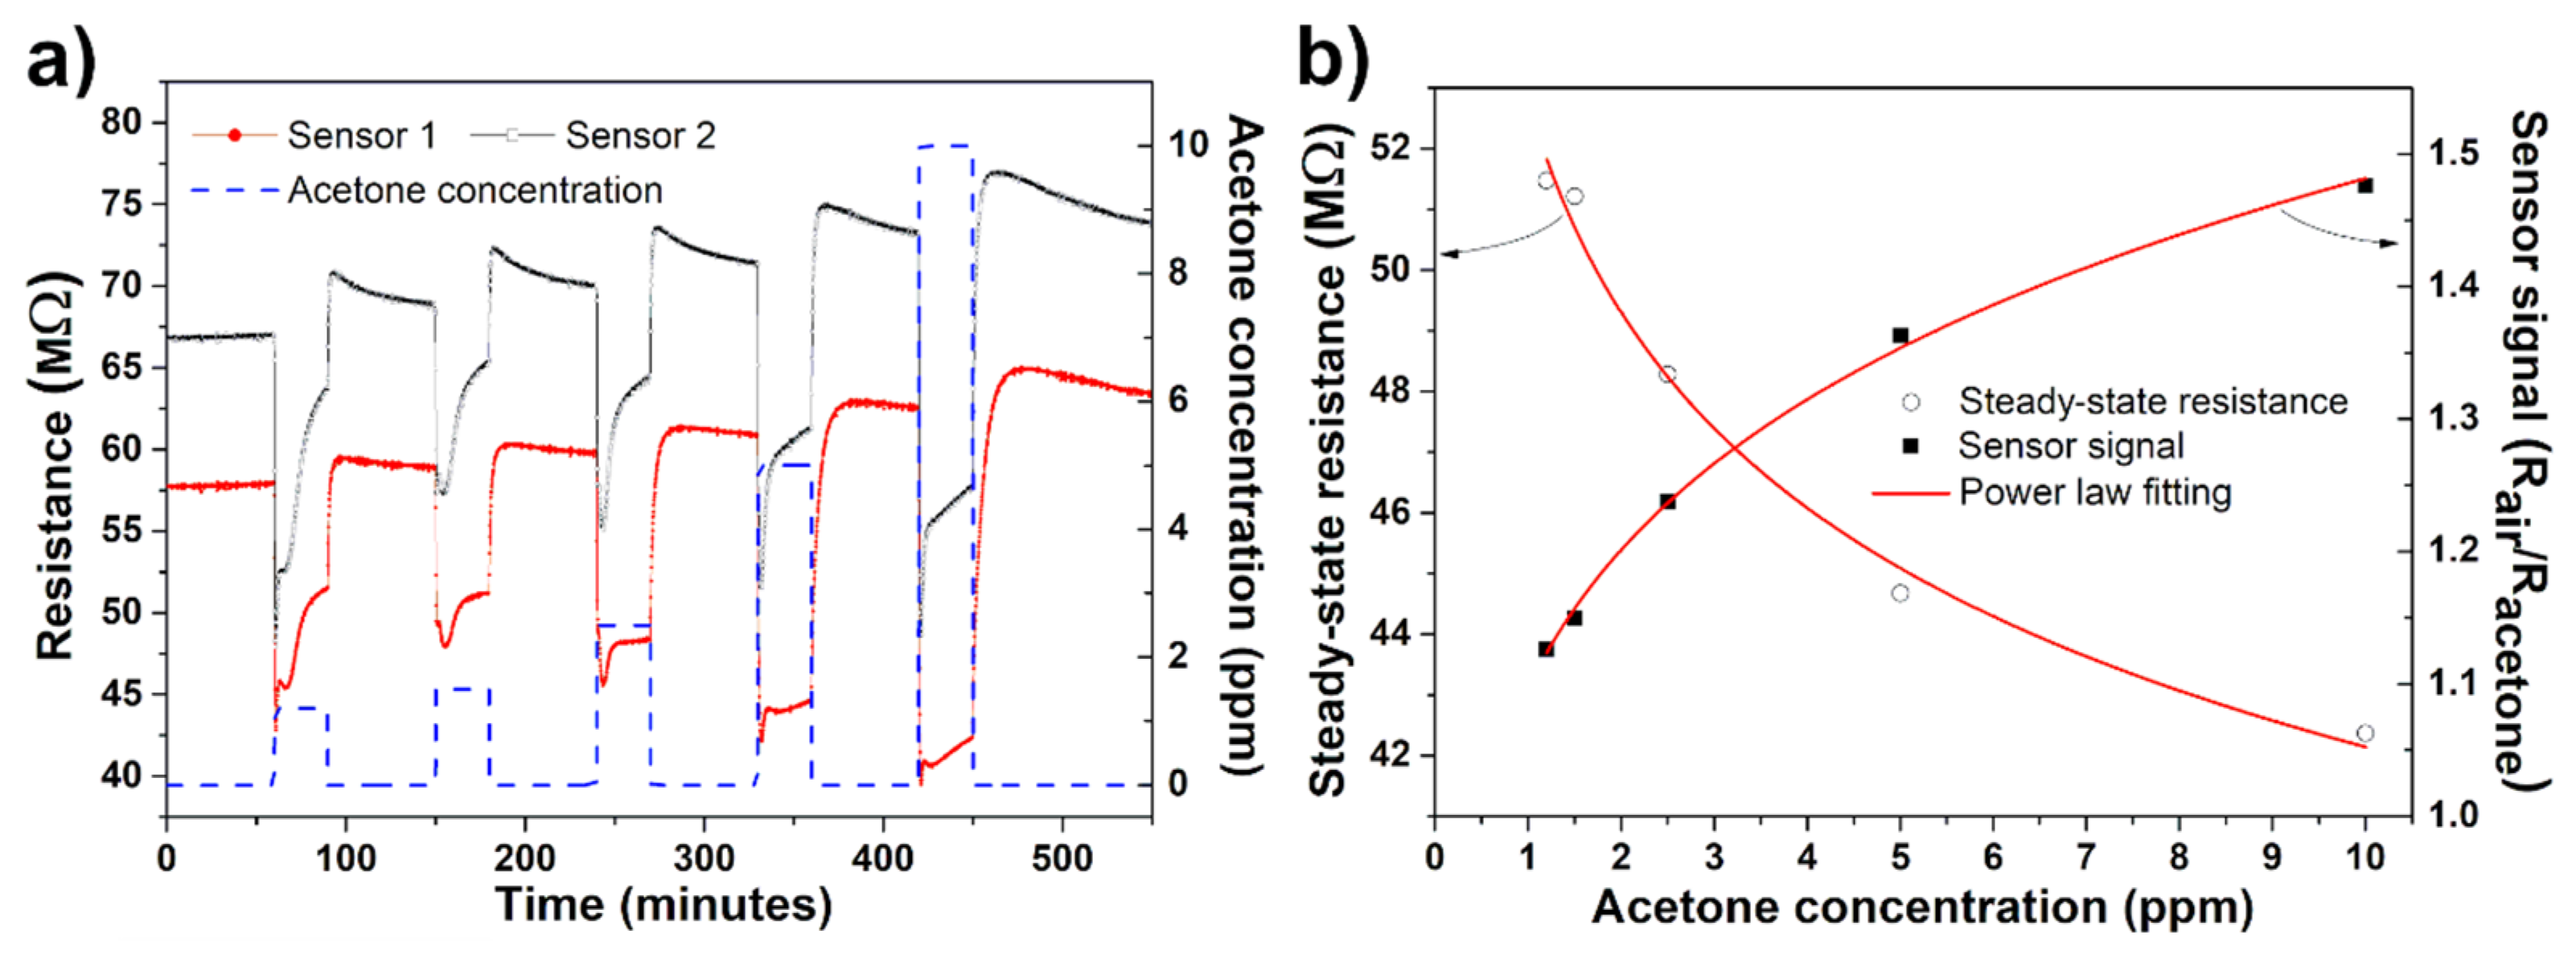
Keeping in mind the thermodynamic instability of the h-MoO3 phase and based on previous literature [30,31,32], the acetone sensing response was performed at an operating temperature of 200 °C in different concentrations, as shown in Figure 3a. As expected, for n-type semiconductors, the h-MoO3 sensor resistance decreased in the presence of acetone exhibiting reversible response down to the lowest exposure levels (1.25 ppm) with similar sensing response for both tested sensors. The h-MoO3 microrods also present faster adsorption/desorption speed with response and recovery times of about 10 s and 120 s at 1.25 ppm, respectively, reaching up to 60 s and 500 s at 10 ppm. In addition, steady-state resistance decreased and sensor signal increased (Figure 3b), with sensor signals up to ~1.5 at 10 ppm, following a power-law dependence on acetone concentration [27,33]. These results show a good performance of h-MoO3 sensors to detect acetone in the desirable concentration range to diabetes diagnostic [2,3]. Table 1 provides a comparison of the acetone sensing performance between the h-MoO3 and different SMOx sensors. The h-MoO3 microrods show comparable sensor signal to TiO2 and Co4O3 and adsorption/desorption speed to SnO2 and WO3 sensors at a lower operating temperature.
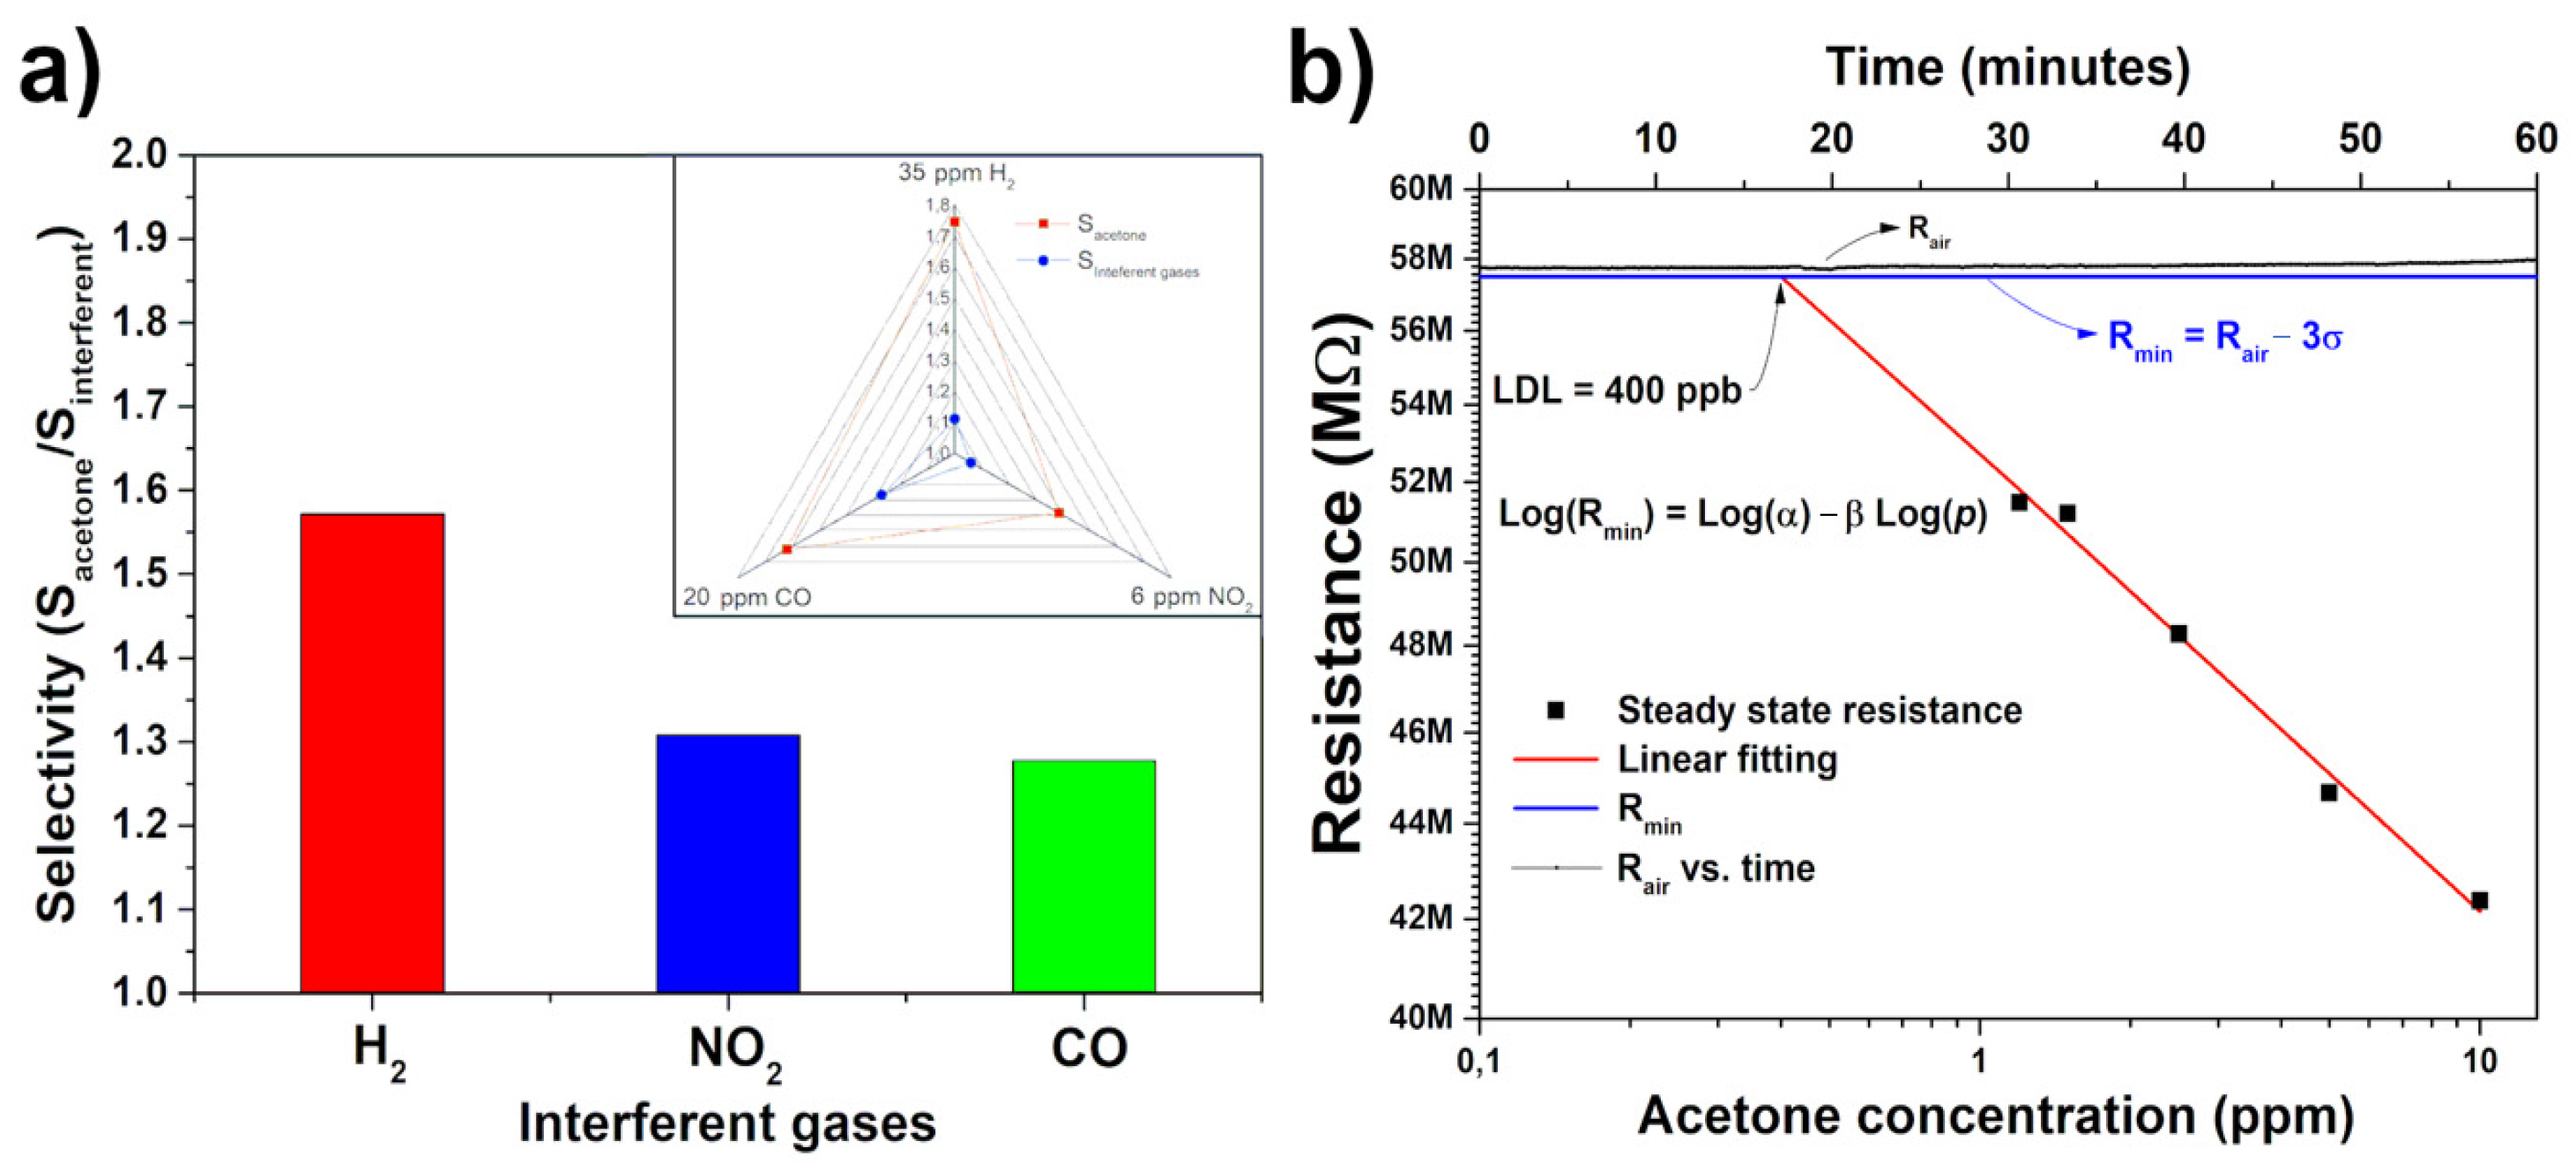
Selectivity of the h-MoO3 sensors to acetone was verified against NO2, H2 and CO interferent gases, as shown in Figure 4a. The sensor signal (inset in Figure 4a) revealed that the h-MoO3 microrods exhibit the largest acetone sensor signal values in relation to all interferent gases at different concentrations, exhibiting a selectivity to acetone of about 1.55 to H2 and 1.30 to NO2 and CO, i.e., a sensor signal to acetone 55% higher in comparison to H2 and 30% in relation to NO2 and CO.
Lower detection limit (LDL) is the minimum gas concentration detectable by chemoresistive gas sensors [27,33]. The steady-state resistance has power law dependence (Figure 3b), given by R = α p a c e t o n e β , where α and β are constants equal approximately to 52.74 MΩ and 0.10, respectively. Thus, as shown in Figure 4b, the LDL of h-MoO3 sensors can be estimated by the linear extrapolation of the log (R)—log(p) plot down to the minimum resistance (Rmin ≈ 57.50 MΩ). The minimum resistance is defined as R m i n = R a i r 3 σ , where Rair is the resistance in air (≈ 57.74 MΩ) before the gas exposure and σ is the standard deviation of the air baseline resistance (≈80 kΩ and 3σ ≈ 240 kΩ) in the 60 min before gas exposure, which is related to the noise of the transient resistance measurement [27]. In addition, the sensing behavior indicates that the signal used on R m i n calculation, i.e., for n-type semiconductors, (−) is used for reducing gases and (+) for oxidizing gases, and vice-versa for p-type semiconductors [27]. An excellent lower detection limit (LDL) around 400 ppb was estimated for the h-MoO3 microrods, which is comparable to SMOx-based sensors and it is in the desirable acetone concentration range to distinguish healthy people and diabetic patients [1,3,7].
Surface gas–solid interaction on the n-type h-MoO3 semiconductor may be ascribed to the ionosorption of oxygen species ( O 2 , O , O 2 ), in which a depletion layer is formed in response to charge transfer from the solid to the gas, resulting in an increased overall sensor resistance [25,27]. Thus, at an operating temperature of 200 °C, the following dynamic reaction of absorption/desorption oxygen ions on the surface of h-MoO3 dominates the gas–solid interaction:
O 2 ( a d s ) + e 2 O ( a d s )
Acetone molecules react with the pre-adsorbed oxygen ions, reducing its concentration on the h-MoO3 surface and resulting in decreased overall sensor resistance due to the charge transfer from gas to solid, according to the following reactions [34,35]:
C H 3 C O C H 3 ( g a s ) + O   ( a d s ) C H 3 C O ( a d s ) + + C H 3 O ( a d s ) + e
C H 3 C O ( a d s ) + + O   ( a d s ) C H 3 ( a d s ) + + C O 2 ( g a s ) + e
C H 3 O ( a d s ) + C H 3 ( a d s ) + + 6 O   ( a d s ) 2 C O 2 ( g a s ) + 3 H 2 O ( g a s ) + 6 e
C H 3 C O C H 3 ( g a s ) + 8 O   ( a d s ) 3 C O 2 ( g a s ) + 3 H 2 O ( g a s ) + 8 e
In addition, the gas sensing response of SMOx can be enhanced by the surface energy of exposed crystallographic planes, leading to improved sensor signal and selectivity [36,37]. Recently, it has been demonstrated that sensing performance in the α-MoO3 phase can be reached by modulating the specific exposed surface plane [25]. Therefore, it is reasonable to suppose that the enhanced acetone sensing performance of the h-MoO3 microrods may be related to a favored chemical sensitization of the acetone–oxygen absorption/desorption reactions, as stated in Equations (1)–(5), due to the well-defined crystallographic exposed planes on the surface of the microrods, which is related to the {100} family plane in the hexagonal phase. Besides, this morphological effect may be also contributing to the initial high decreasing in overall sensor resistance when the device is exposed to lower acetone concentrations.

4. Conclusions

In summary, unidimensional h-MoO3 microrods with well-faceted hexagonal morphology were achieved by microwave-assisted hydrothermal method. An ultrafast growth of these microrods was promoted by the Ostwald ripening process due to the rapid local microwave heating. Acetone sensing tests showed that the h-MoO3 microrods exhibit good sensor signal, faster speedy response, selectivity to different interferent gases and reduced lower detection limit. A sensing mechanism was discussed considering the contribution of the well-faceted morphology of the microrods to the enhanced acetone sensing performance of the h-MoO3 phase. This metastable phase is a promising candidate as a sensing layer in chemoresistive gas sensors applied to acetone detection; however, additional studies, already in progress, on different volatile organic compounds (VOCs) and, mainly, relative humidity, must be conducted, aiming at its application to noninvasive diabetes diagnostics.

Author Contributions

Conceptualization, A.A.F. and M.O.O.; methodology, G.T.S. and A.A.F.; formal analysis, G.T.S., A.A.F. and M.O.O.; writing—original draft preparation, A.A.F.; writing—review and editing, G.T.S., A.A.F. and M.O.O.; supervision, A.A.F. and M.O.O.; project administration, M.O.O.; funding acquisition, M.O.O. All authors have read and agreed to the published version of the manuscript.

Funding

This research was funded by São Paulo Research Foundation (FAPESP), grant number 17/26219-0, the National Council for Scientific and Technological Development (CNPq), grant numbers 443138/2016-8, 305437/2018-6 and PIBIC 139621/2019-9, and the Postdoctoral National Program of the Coordination for the Improvement of Higher Education Personnel (PNPD/CAPES).

Institutional Review Board Statement

Not applicable.

Informed Consent Statement

Not applicable.

Data Availability Statement

The data presented in this study are available on request from the corresponding authors.

Acknowledgments

The authors also thank multiuser equipment facilities: LCE/DEMA/UFSCAR and Raman Lab and LMA/IQ/UNESP.

Conflicts of Interest

The authors declare no conflict of interest.

References

  1. Masikini, M.; Chowdhury, M.; Nemraoui, O. Review—Metal Oxides: Application in Exhaled Breath Acetone Chemiresistive Sensors. J. Electrochem. Soc. 2020, 167, 037537. [Google Scholar] [CrossRef] [Green Version]
  2. Choi, S.-J.; Lee, I.; Jang, B.-H.; Youn, D.-Y.; Ryu, W.-H.; Park, C.O.; Kim, I.-D. Selective Diagnosis of Diabetes Using Pt-Functionalized WO3 Hemitube Networks As a Sensing Layer of Acetone in Exhaled Breath. Anal. Chem. 2013, 85, 1792–1796. [Google Scholar] [CrossRef] [PubMed]
  3. Righettoni, M.; Tricoli, A.; Pratsinis, S.E. Si:WO3 Sensors for Highly Selective Detection of Acetone for Easy Diagnosis of Diabetes by Breath Analysis. Anal. Chem. 2010, 82, 3581–3587. [Google Scholar] [CrossRef]
  4. Zhou, X.; Lee, S.; Xu, Z.; Yoon, J. Recent Progress on the Development of Chemosensors for Gases. Chem. Rev. 2015, 115, 7944–8000. [Google Scholar] [CrossRef] [PubMed]
  5. Li, F.; Gao, X.; Wang, R.; Zhang, T. Design of WO3-SnO2 core-shell nanofibers and their enhanced gas sensing performance based on different work function. Appl. Surf. Sci. 2018, 442, 30–37. [Google Scholar] [CrossRef]
  6. Chen, Y.; Qin, H.; Cao, Y.; Zhang, H.; Hu, J. Acetone Sensing Properties and Mechanism of SnO2 Thick-Films. Sensors 2018, 18, 3425. [Google Scholar] [CrossRef] [Green Version]
  7. Navale, S.T.; Yang, Z.B.; Liu, C.; Cao, P.J.; Patil, V.B.; Ramgir, N.S.; Mane, R.S.; Stadler, F.J. Enhanced acetone sensing properties of titanium dioxide nanoparticles with a sub-ppm detection limit. Sens. Actuators B Chem. 2018, 255, 1701–1710. [Google Scholar] [CrossRef]
  8. Zhang, C.; Li, L.; Hou, L.; Chen, W. Fabrication of Co3O4 nanowires assembled on the surface of hollow carbon spheres for acetone gas sensing. Sens. Actuators B Chem. 2019, 291, 130–140. [Google Scholar] [CrossRef]
  9. Rydosz, A. Sensors for Enhanced Detection of Acetone as a Potential Tool for Noninvasive Diabetes Monitoring. Sensors 2018, 18, 2298. [Google Scholar] [CrossRef] [Green Version]
  10. de Castro, I.A.; Datta, R.S.; Ou, J.Z.; Castellanos-Gomez, A.; Sriram, S.; Daeneke, T.; Kalantar-zadeh, K. Molybdenum Oxides—From Fundamentals to Functionality. Adv. Mater. 2017, 29, 1701619. [Google Scholar] [CrossRef]
  11. Gouma, P.; Prasad, A.; Stanacevic, S. A selective nanosensor device for exhaled breath analysis. J. Breath Res. 2011, 5, 037110. [Google Scholar] [CrossRef] [PubMed]
  12. Felix, A.A.; Barbosa, M.S.; Bueno, P.R.; Orlandi, M.O. Real-Time Monitoring of Electrochromic Memory Loss of Layered α-MoO3 Nanoplates. J. Electrochem. Soc. 2020, 167, 166509. [Google Scholar] [CrossRef]
  13. Chen, Y.; Lu, C.; Xu, L.; Ma, Y.; Hou, W.; Zhu, J.-J. Single-crystalline orthorhombic molybdenum oxide nanobelts: Synthesis and photocatalytic properties. CrystEngComm 2010, 12, 3740. [Google Scholar] [CrossRef]
  14. Gong, J.; Zeng, W.; Zhang, H. Hydrothermal synthesis of controlled morphologies of MoO3 nanobelts and hierarchical structures. Mater. Lett. 2015, 154, 170–172. [Google Scholar] [CrossRef]
  15. Wang, L.; Zhang, X.; Ma, Y.; Yang, M.; Qi, Y. Rapid microwave-assisted hydrothermal synthesis of one-dimensional MoO 3 nanobelts. Mater. Lett. 2016, 164, 623–626. [Google Scholar] [CrossRef]
  16. Kumar, V.; Wang, X.; Lee, P.S. Formation of hexagonal-molybdenum trioxide (h-MoO3) nanostructures and their pseudocapacitive behavior. Nanoscale 2015, 7, 11777–11786. [Google Scholar] [CrossRef] [Green Version]
  17. Zheng, L.; Xu, Y.; Jin, D.; Xie, Y. Novel Metastable Hexagonal MoO 3 Nanobelts: Synthesis, Photochromic, and Electrochromic Properties. Chem. Mater. 2009, 21, 5681–5690. [Google Scholar] [CrossRef]
  18. Yao, D.D.; Ou, J.Z.; Latham, K.; Zhuiykov, S.; O’Mullane, A.P.; Kalantar-zadeh, K. Electrodeposited α- and β-Phase MoO3 Films and Investigation of Their Gasochromic Properties. Cryst. Growth Des. 2012, 12, 1865–1870. [Google Scholar] [CrossRef]
  19. Chithambararaj, A.; Rajeswari Yogamalar, N.; Bose, A.C. Hydrothermally Synthesized h-MoO3 and α-MoO3 Nanocrystals: New Findings on Crystal-Structure-Dependent Charge Transport. Cryst. Growth Des. 2016, 16, 1984–1995. [Google Scholar] [CrossRef]
  20. Ramana, C.V.; Atuchin, V.V.; Troitskaia, I.B.; Gromilov, S.A.; Kostrovsky, V.G.; Saupe, G.B. Low-temperature synthesis of morphology controlled metastable hexagonal molybdenum trioxide (MoO3). Solid State Commun. 2009, 149, 6–9. [Google Scholar] [CrossRef]
  21. Chithambararaj, A.; Chandra Bose, A. Role of synthesis variables on controlled nucleation and growth of hexagonal molybdenum oxide nanocrystals: Investigation on thermal and optical properties. CrystEngComm 2014, 16, 6175–6186. [Google Scholar] [CrossRef]
  22. Liu, Y.; Yang, S.; Lu, Y.; Podval’naya, N.V.; Chen, W.; Zakharova, G.S. Hydrothermal synthesis of h-MoO3 microrods and their gas sensing properties to ethanol. Appl. Surf. Sci. 2015, 359, 114–119. [Google Scholar] [CrossRef]
  23. Song, J.; Ni, X.; Gao, L.; Zheng, H. Synthesis of metastable h-MoO3 by simple chemical precipitation. Mater. Chem. Phys. 2007, 102, 245–248. [Google Scholar] [CrossRef]
  24. Felix, A.A.; Longo, E.; Varela, J.A.; Orlandi, M.O. Gas sensing and conductivity relationship on nanoporous thin films: A CaCu3Ti4O12 case study. Thin Solid Films 2016, 604, 69–73. [Google Scholar] [CrossRef] [Green Version]
  25. Felix, A.A.; Silva, R.A.; Orlandi, M.O. Layered α-MoO3 nanoplates for gas sensing applications. CrystEngComm 2020, 22, 4640–4649. [Google Scholar] [CrossRef]
  26. Volanti, D.P.; Felix, A.A.; Orlandi, M.O.; Whitfield, G.; Yang, D.-J.; Longo, E.; Tuller, H.L.; Varela, J.A. The Role of Hierarchical Morphologies in the Superior Gas Sensing Performance of CuO-Based Chemiresistors. Adv. Funct. Mater. 2013, 23, 1759–1766. [Google Scholar] [CrossRef]
  27. Gurlo, A.; Barsan, N.; Weimar, U. Gas sensors based on semiconducting metal oxides. In Metal Oxides: Chemistry and Application; Fierro, J.L.G., Ed.; CRC Press: Boca Raton, FL, USA, 2005; pp. 683–738. [Google Scholar]
  28. Guo, J.D.; Zavalij, P.; Whittingham, M.S. Preparation and Characterization of a MoO3 With Hexagonal Structure. Eur. J. Solid State Inorg. Chem. 1994, 31, 833. [Google Scholar]
  29. Moura, J.V.B.; Silveira, J.V.; da Silva Filho, J.G.; Souza Filho, A.G.; Luz-Lima, C.; Freire, P.T.C. Temperature-induced phase transition in h-MoO3: Stability loss mechanism uncovered by Raman spectroscopy and DFT calculations. Vib. Spectrosc. 2018, 98, 98–104. [Google Scholar] [CrossRef]
  30. Felix, A.A.; Santos, G.T.; Orlandi, M.O.; São Paulo State University (UNESP), Araraquara, Brazil. Personal Communication, 2020.
  31. Suman, P.H.; Felix, A.A.; Tuller, H.L.; Varela, J.A.; Orlandi, M.O. Comparative gas sensor response of SnO2, SnO and Sn3O4 nanobelts to NO2 and potential interferents. Sens. Actuators B Chem. 2015, 208, 122–127. [Google Scholar] [CrossRef]
  32. Suman, P.H.; Felix, A.A.; Tuller, H.L.; Varela, J.A.; Orlandi, M.O. Giant Chemo-Resistance of SnO disk-like structures. Sens. Actuators B Chem. 2013, 186, 103–108. [Google Scholar] [CrossRef]
  33. Barsan, N.; Weimar, U. Conduction Model of Metal Oxide Gas Sensors. J. Electroceram. 2001, 7, 143–167. [Google Scholar] [CrossRef]
  34. Kim, S.-J.; Choi, S.-J.; Jang, J.-S.; Kim, N.-H.; Hakim, M.; Tuller, H.L.; Kim, I.-D. Mesoporous WO3 Nanofibers with Protein-Templated Nanoscale Catalysts for Detection of Trace Biomarkers in Exhaled Breath. ACS Nano 2016, 10, 5891–5899. [Google Scholar] [CrossRef] [PubMed]
  35. Wongrat, E.; Chanlek, N.; Chueaiarrom, C.; Thupthimchun, W.; Samransuksamer, B.; Choopun, S. Acetone gas sensors based on ZnO nanostructures decorated with Pt and Nb. Ceram. Int. 2017, 43, S557–S566. [Google Scholar] [CrossRef]
  36. Han, X.; Jin, M.; Xie, S.; Kuang, Q.; Jiang, Z.; Jiang, Y.; Xie, Z.; Zheng, L. Synthesis of Tin Dioxide Octahedral Nanoparticles with Exposed High-Energy {221} Facets and Enhanced Gas-Sensing Properties. Angew. Chem. Int. Ed. 2009, 48, 9180–9183. [Google Scholar] [CrossRef]
  37. Xiao, C.; Yang, T.; Chuai, M.; Xiao, B.; Zhang, M. Synthesis of ZnO nanosheet arrays with exposed (100) facets for gas sensing applications. Phys. Chem. Chem. Phys. 2016, 18, 325–330. [Google Scholar] [CrossRef]
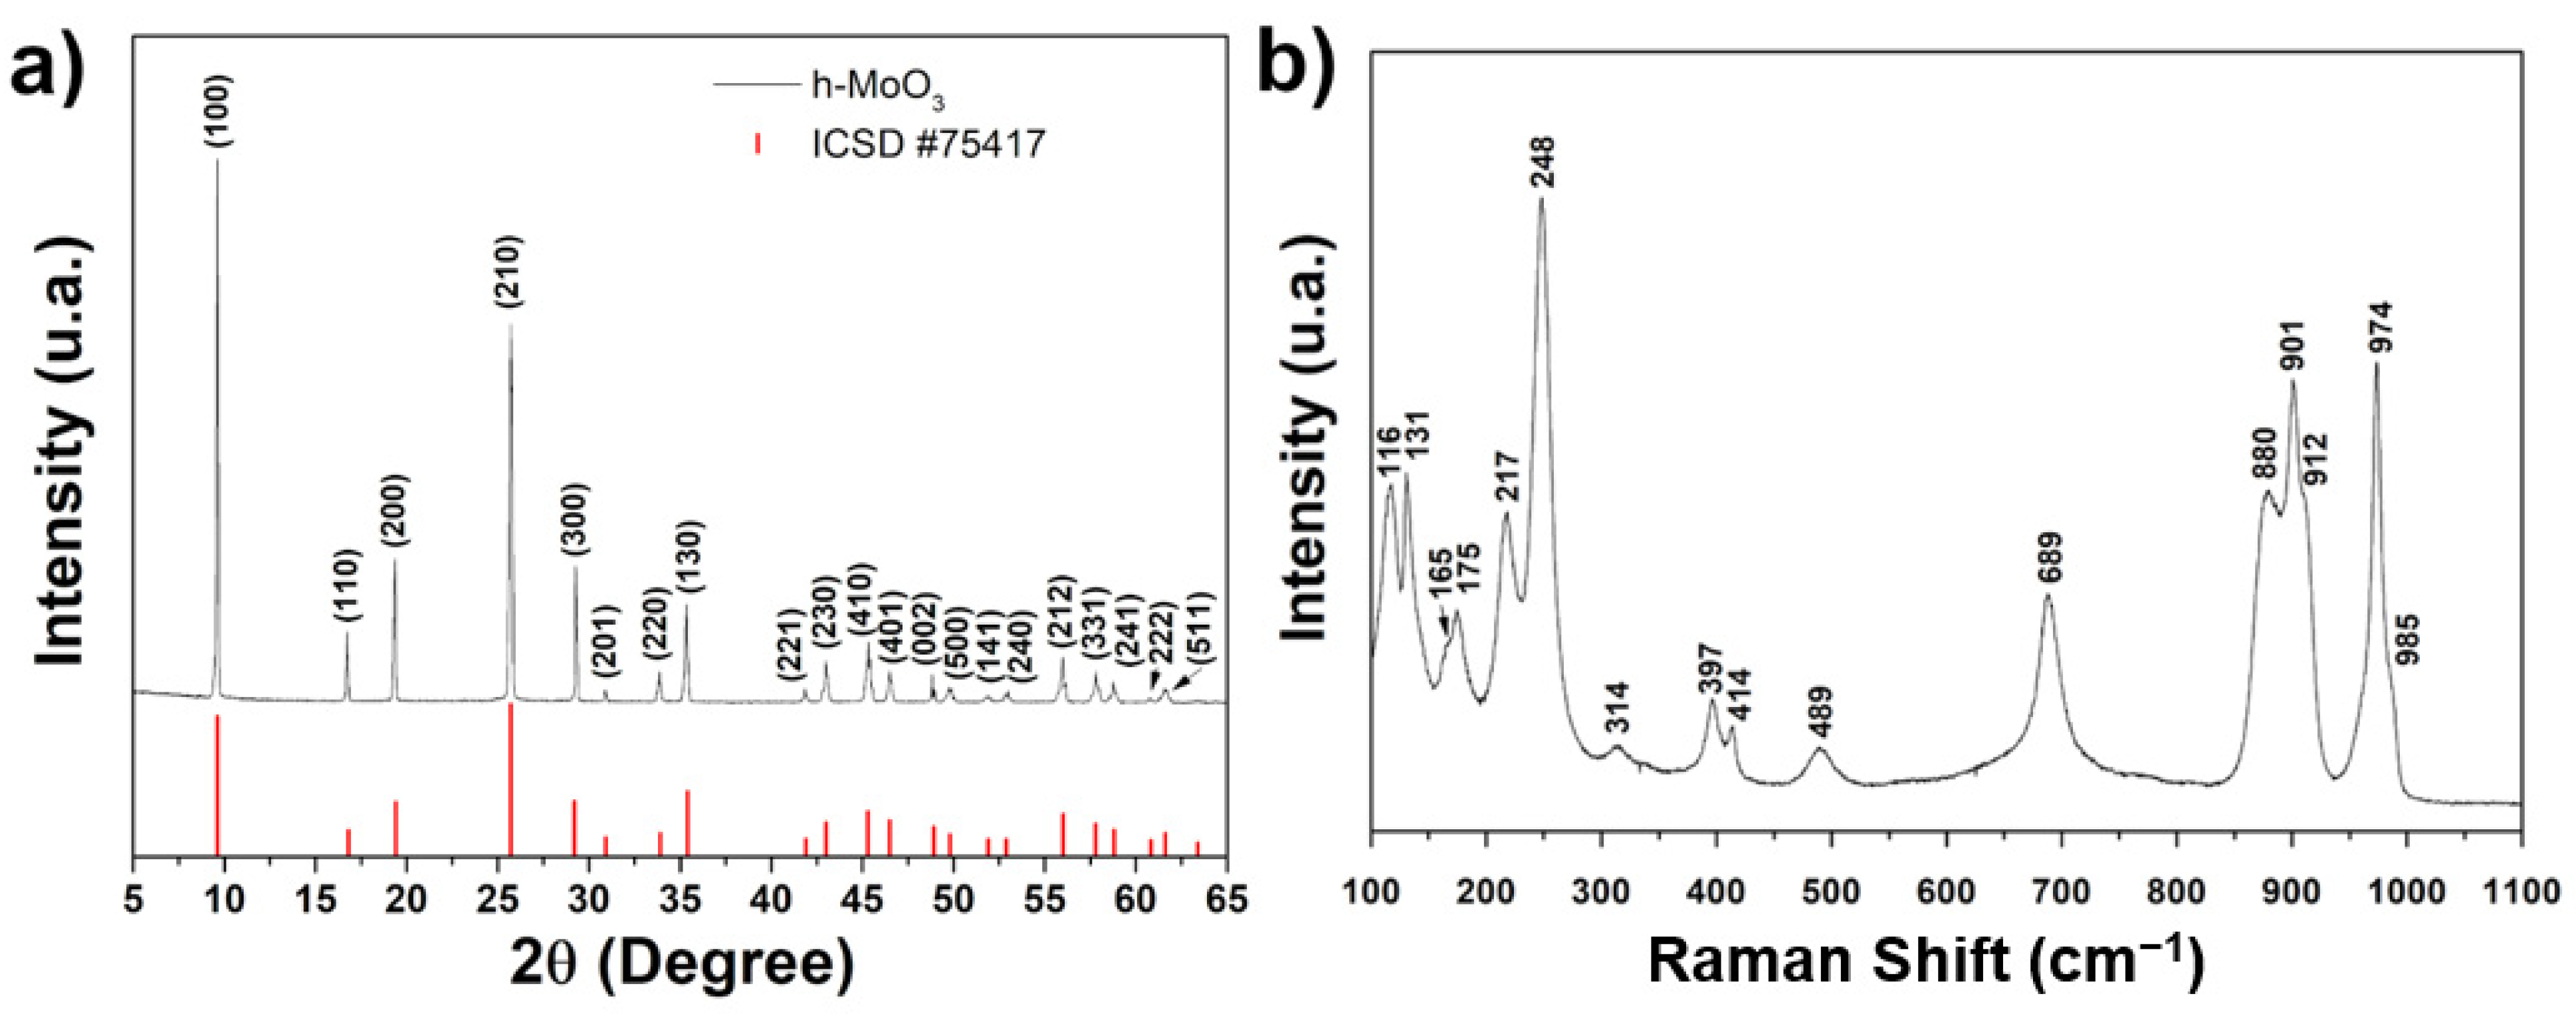
Figure 1. (a) XRD pattern and (b) Raman spectra of the as-grown h-MoO3 via MAH method at 125 °C for 1 min.
Surfaces 04 00002 g001
Figure 2. (a) SEM image and (b) length distribution of the h-MoO3 microrods. Right inset in (a): SEM cross section image of a microrod.
Surfaces 04 00002 g002
Figure 3. (a) Transient acetone sensing response and (b) steady-state resistance and sensor signal of the h-MoO3 sensor (sensor 1) as a function of the concentration at 200 °C.
Surfaces 04 00002 g003
Figure 4. (a) Selectivity of the h-MoO3 sensor (sensor 1) to acetone in relation to NO2, CO, and H2 at 6, 20 and 35 ppm, respectively, in an operating temperature of 200 °C. Right inset in 4a: Polar plot of the acetone sensor signal against interferent gases. (b) Determination of the lower detection limit (LDL) of the h-MoO3 sensor (sensor 1).
Surfaces 04 00002 g004
Table 1. Acetone sensing performance of selected SMOx.
Crystalline PhaseAcetone Concentration
(ppm)
Operating Temperature
(°C)
Sensor SignalResponse/
Recovery Time
(s)
Reference
WO323004.1-[2]
WO310280~2.016/129[5]
SnO210280~2.07/72[5]
SnO251805.070/64[6]
TiO210270~1.5-[7]
Co3O410150~1.7-[8]
h-MoO31.22001.1210/60This work
h-MoO3102001.4860/500This work
Publisher’s Note: MDPI stays neutral with regard to jurisdictional claims in published maps and institutional affiliations.