Review

Fluorinated Surfactant Adsorption on Mineral Surfaces: Implications for PFAS Fate and Transport in the Environment

by
Anthony V. Alves
1,
Marina Tsianou
1 and
Paschalis Alexandridis
1,2,*
1
Department of Chemical and Biological Engineering, University at Buffalo, The State University of New York (SUNY), Buffalo, NY 14260-4200, USA
2
Department of Civil, Structural and Environmental Engineering, University at Buffalo, The State University of New York (SUNY), Buffalo, NY 14260-4200, USA
*
Author to whom correspondence should be addressed.
Surfaces 2020, 3(4), 516-566; https://doi.org/10.3390/surfaces3040037
Submission received: 9 July 2020 / Revised: 8 September 2020 / Accepted: 21 September 2020 / Published: 28 September 2020

Abstract

:
Fluorinated surfactants, which fall under the class of per- and polyfluoroalkyl substances (PFAS), are amphiphilic molecules that comprise hydrophobic fluorocarbon chains and hydrophilic head-groups. Fluorinated surfactants have been utilized in many applications, e.g., fire-fighting foams, paints, household/kitchenware items, product packaging, and fabrics. These compounds then made their way into the environment, and have been detected in soil, fresh water, and seawater. From there, they can enter human bodies. Fluorinated surfactants are persistent in water and soil environments, and their adsorption onto mineral surfaces contributes to this persistence. This review examines how fluorinated surfactants adsorb onto mineral surfaces, by analyzing the thermodynamics and kinetics of adsorption, and the underlying mechanisms. Adsorption of fluorinated surfactants onto mineral surfaces can be explained by electrostatic interactions, hydrophobic interactions, hydrogen bonding, and ligand and ion exchange. The aqueous pH, varying salt or humic acid concentrations, and the surfactant chemistry can influence the adsorption of fluorinated surfactants onto mineral surfaces. Further research is needed on fluorinated surfactant adsorbent materials to treat drinking water, and on strategies that can modulate the fate of these compounds in specific environmental locations.

1. Introduction

Water, a necessity for all life on this planet, is regularly tested for its quality; however, past actions (or lack of action) have made this task challenging. Our society faces a dilemma in that several chemicals that are highly beneficial to our quality of life end up being environmental pollutants, and these pollutants reside in the water that we drink and use in various activities. Several pollutants found in water, such as various pesticides, herbicides, and fire retardants, can cause adverse health effects, such as skin diseases, cancer, nausea, vomiting, cardiac arrest, birth defects, reproductive hormonal defects, and gastrointestinal issues [1,2,3,4,5]. Heavy metals, such as lead, mercury, cadmium, and chromium, have found their way into the environment and into human bodies, where they can cause multiple organ failures [6,7]. Other toxic chemicals that exist in the environment are persistent organic pollutants (POPs). POPs are bioaccumulative and do not degrade in the environment from naturally occurring chemical or biological processes [8,9].
Among various pollutants, per- and polyfluoroalkyl substances (PFAS) are of increasing concern [10,11]. Table 1 presents the chemical structure and select physicochemical properties of various PFAS surfactants that are discussed in this review [12,13,14,15,16,17,18]. General uses of PFAS include reduction in surface tension, foaming, lubrication, water/oil repellency, and coatings [19,20,21]. While their fluorocarbon part is highly hydrophobic, their functional head-group renders fluorinated surfactants soluble and mobile in aqueous environments [22]. Through waste disposal and other avenues, PFAS have slowly made their way into drinking water, streams, rivers, lakes, and oceans [23,24,25] as depicted in Figure 1 [26]. The removal of PFAS from the ecosystem can be quite difficult, because these compounds are highly persistent and uncooperative to conventional water treatment methods [27,28,29,30,31,32]. A wide range is available of fluorinated surfactants that have unique traits and chemical structures. Fluorinated surfactants include perfluoroalkyl acids (PFAA), such as perfluorinated carboxylic acids (PFCA), perfluoroalkane sulfonates (PFSA), etc. [33]. The most prevalent and discussed about are perfluorooctane sulfonate (PFOS) and perfluorooctanoic acid (PFOA). More specifically, these perfluorinated surfactants have been used in fire-fighting foams, paints, non-stick cookware, waterproof clothing, leather products, etc. [28,34,35,36].
Since fluorinated surfactants are toxic and considered pollutants, in 2016, the US Environmental Protection Agency (EPA) provided health advisory levels (HAL) for drinkable water containing 70 ng L−1 of PFOS and PFOA. The EPA also issued a HAL on drinking water that consists of 100 to 7000 ng L−1 of PFAS that have C—F chains four to seven carbon atoms in length [37]. PFAS are concerning because they have been found in our drinking water, soils, and sediments, so it is almost unavoidable to ingest these compounds [23,38]. Once ingested, fluorinated surfactants, such as long-chain PFAA, PFSA, and PFCA, show bioaccumulative characteristics, where these compounds can gather within a human body at a rate faster than can be excreted or catabolized [38]. These toxic PFAS can cause increased risks of cancer and immune-related health conditions [39,40,41].
In order to reduce the risks of drinking water that contains PFAS with C—F chains longer than seven carbons, manufacturers have been synthesizing and selling PFAS with shorter C—F chains, specifically perfluorobutanoic acid (PFBA) and perfluorobutane sulfonate (PFBS), which have shown low adsorption in freshwater environments [42,43]. While PFBS is further researched as a substitute to long-chain PFAS, not all short-chain PFAS can be used as substitutes; indeed, some short-chain PFAS have been shown to be more persistent in aqueous environments and can pose higher health risk to humans and to ecosystems [44]. Having said this, “safer” short-chain PFAS, like PFBS, when ingested, have been found less toxic to humans and are eliminated from the body much quicker than long-chain PFAS [45]. A phase-out process of particular PFAS has been proposed, by categorizing these compounds into “non-essential, substitutable, and essential”, in order to better plan their elimination from particular products [46,47]. With manufacturers coming up with new fluorinated surfactant chemistries as potential solutions in reducing the risk in the environment of the more toxic “legacy” PFAS, researchers have to investigate the properties and understand the solution and interfacial behavior of an ever-expanding range of fluorinated surfactants [11,33].
Whereas a phase-out is in effect of certain PFAS, such as PFOA and PFOS, and short-chain PFAS are being used that are presumably safer than the above PFAS, an ongoing need remains to remove the harmful PFAS that are currently residing in our ecosystem. A commonly used strategy in order to accomplish such a task is adsorption by activated carbon [48,49,50,51,52,53,54,55]. Activated carbon has been shown to exhibit efficient and better adsorption capabilities than other investigated adsorbents, such as zeolites and granular sludge [56]. Different types of activated carbon are available, including granular activated carbon (GAC) of varying grades, and powdered activated carbon (PAC) [22,57]. In addition to the research on the removal of PFAS from ecosystems, there is a strong interest in the transport and fate of PFAS in the environment [22,42,44,58]. If the adsorption properties of particular PFAS on specific surfaces and environments are known, then PFAS transport can be more accurately predicted, thus informing the fate of such PFAS within the environment. Extensive research [58,59,60,61,62] has identified the source of PFAS, how they are released into ecosystems, their locations, and the various non-mineral and mineral surfaces that PFAS adsorb onto, which can then prompt efficient removal methods that can ultimately be used to eliminate these PFAS from the surrounding ecosystem [44,58,63]. Since the adsorption of PFAS onto mineral surfaces plays a key role in the PFAS transport and fate, this review is useful to provide further insight within this field of study, because there is a lack of relevant reviews. While the reviews by Du et al. [22] and Zhang et al. [64] broadly examine the adsorption of various PFAS onto various surfaces, this review specifically covers the adsorption of PFAS surfactants onto mineral surfaces, under environmental factors that modulate such adsorption. Mineral surfaces have received much less attention in the reviews by Du et al. [22] and Zhang et al. [64] which encompassed activated carbons, resins, carbon nanotubes, biosorbents, molecularly imprinted polymers, and ceramics.
Table 2 organizes information on PFAS adsorbates, mineral surface adsorbents, solvent conditions, adsorbed amounts, and adsorbed layer structure that has been extracted from published articles that report on fluorinated surfactant adsorption on mineral surfaces. Several studies have examined the adsorption of fluorinated surfactants onto rather ill-defined “fresh water sediments, marine sediments, and soils” [4,65,66,67,68,69,70,71,72,73,74,75,76,77]. Whereas these articles often report on the physical characteristics and locations from where these surfaces have been found, the chemical composition and surface properties have not been sufficiently defined to be included in Table 2 and discussed in detail in this review. This decision, however, is not meant to diminish the great value of such work in assessing the fate and transport of fluorinated surfactants in the aqueous environment.
We review here studies pertaining to the adsorption of fluorinated surfactants from aqueous media onto inorganic mineral surfaces. We discuss the adsorption thermodynamics and the underlying fundamentals, such as electrostatic and hydrophobic interactions, ligand ion exchange, and hydrogen bonding. We also review factors that affect adsorption, like the aqueous solution pH; Na+, Ca2+, and other ions present in said solutions; humic acid, a naturally occurring compound in water environments that can inhibit the adsorption of PFAS onto mineral surfaces; and a surfactant chemistry [78,79]. This review examines many combinations of fluorinated surfactants and mineral surfaces as adsorbents. This review aims to further expand the understanding of fluorinated surfactant adsorption onto mineral surfaces in an aqueous environment, so that the fate and transport of PFAS is better understood. With this being known, absorbent materials and processes can be more effectively and efficiently developed and deployed, in order to remove various PFAS from known locations and mineral surfaces, so that ecosystems can be rendered safer for all.

2. Adsorption Isotherm

The adsorption of adsorbates can occur on many different surface types, for example on hydrophobic solid–liquid interfaces, hydrophilic solid–liquid interfaces, air–liquid interfaces, and liquid–liquid interfaces. The force summation between adsorbent and adsorbate that occurs during adsorption dictates whether the adsorbent and adsorbate either repel or attract each other [80]. During the adsorption of surfactants onto surfaces, there is typically a modification of the surfactant apparent charge and hydrophobicity, along with changes to surfactant properties that modulate processes, such as dispersion, flotation, detergency, wetting, oil recovery, and corrosion inhibition [81]. Adsorption is dictated by multiple forces acting between the surfactant and the surface, which include covalent bonding, hydrogen bonding, electrostatics, non-polar attractions, interactions that are laterally associative, and solvation and desolvation processes [81]. Electrolytes present in water, such as Ca2+, Mg2+, Al3+, and Fe3+, can promote the physical adsorption of ionic surfactants onto solids, by screening electrostatic interactions during the adsorption process [42,65,82]. Keeping in mind how adsorbates interact with different interfaces, the following examines the adsorption of fluorinated surfactant on solid surfaces, in order to resolve the fundamental interactions that occur during the adsorption process. The adsorption isotherm is a commonly used tool to describe the physical adsorption of fluorinated surfactants onto solid surfaces.
The adsorption isotherm expresses the relationship between the equilibrium concentration (qe) of the investigated surfactant (solute) on the surface (adsorbent) and the concentration of said surfactant in the water environment (Ce). Adsorption isotherms are a critical tool used to examine the adsorption capacity of surfaces and the interactions that occur between adsorbates and adsorbents [83]. During the adsorption of fluorinated surfactants onto mineral surfaces, adsorption isotherms are acquired by dictating when the fluorinated surfactant is depleted because of adsorption [81]. Adsorption capacities of mineral surfaces vary due to many factors, such as the types of surfactants and the mineral surface involved, the pH of the aqueous solution, the presence of electrolytes, etc. [22,84,85]. The physiochemical properties of adsorbents that determine their adsorption capacity include pore volume, micropore/mesopore size, porosity, particle diameter, surface area, and surface chemistry [22,56,66,86].
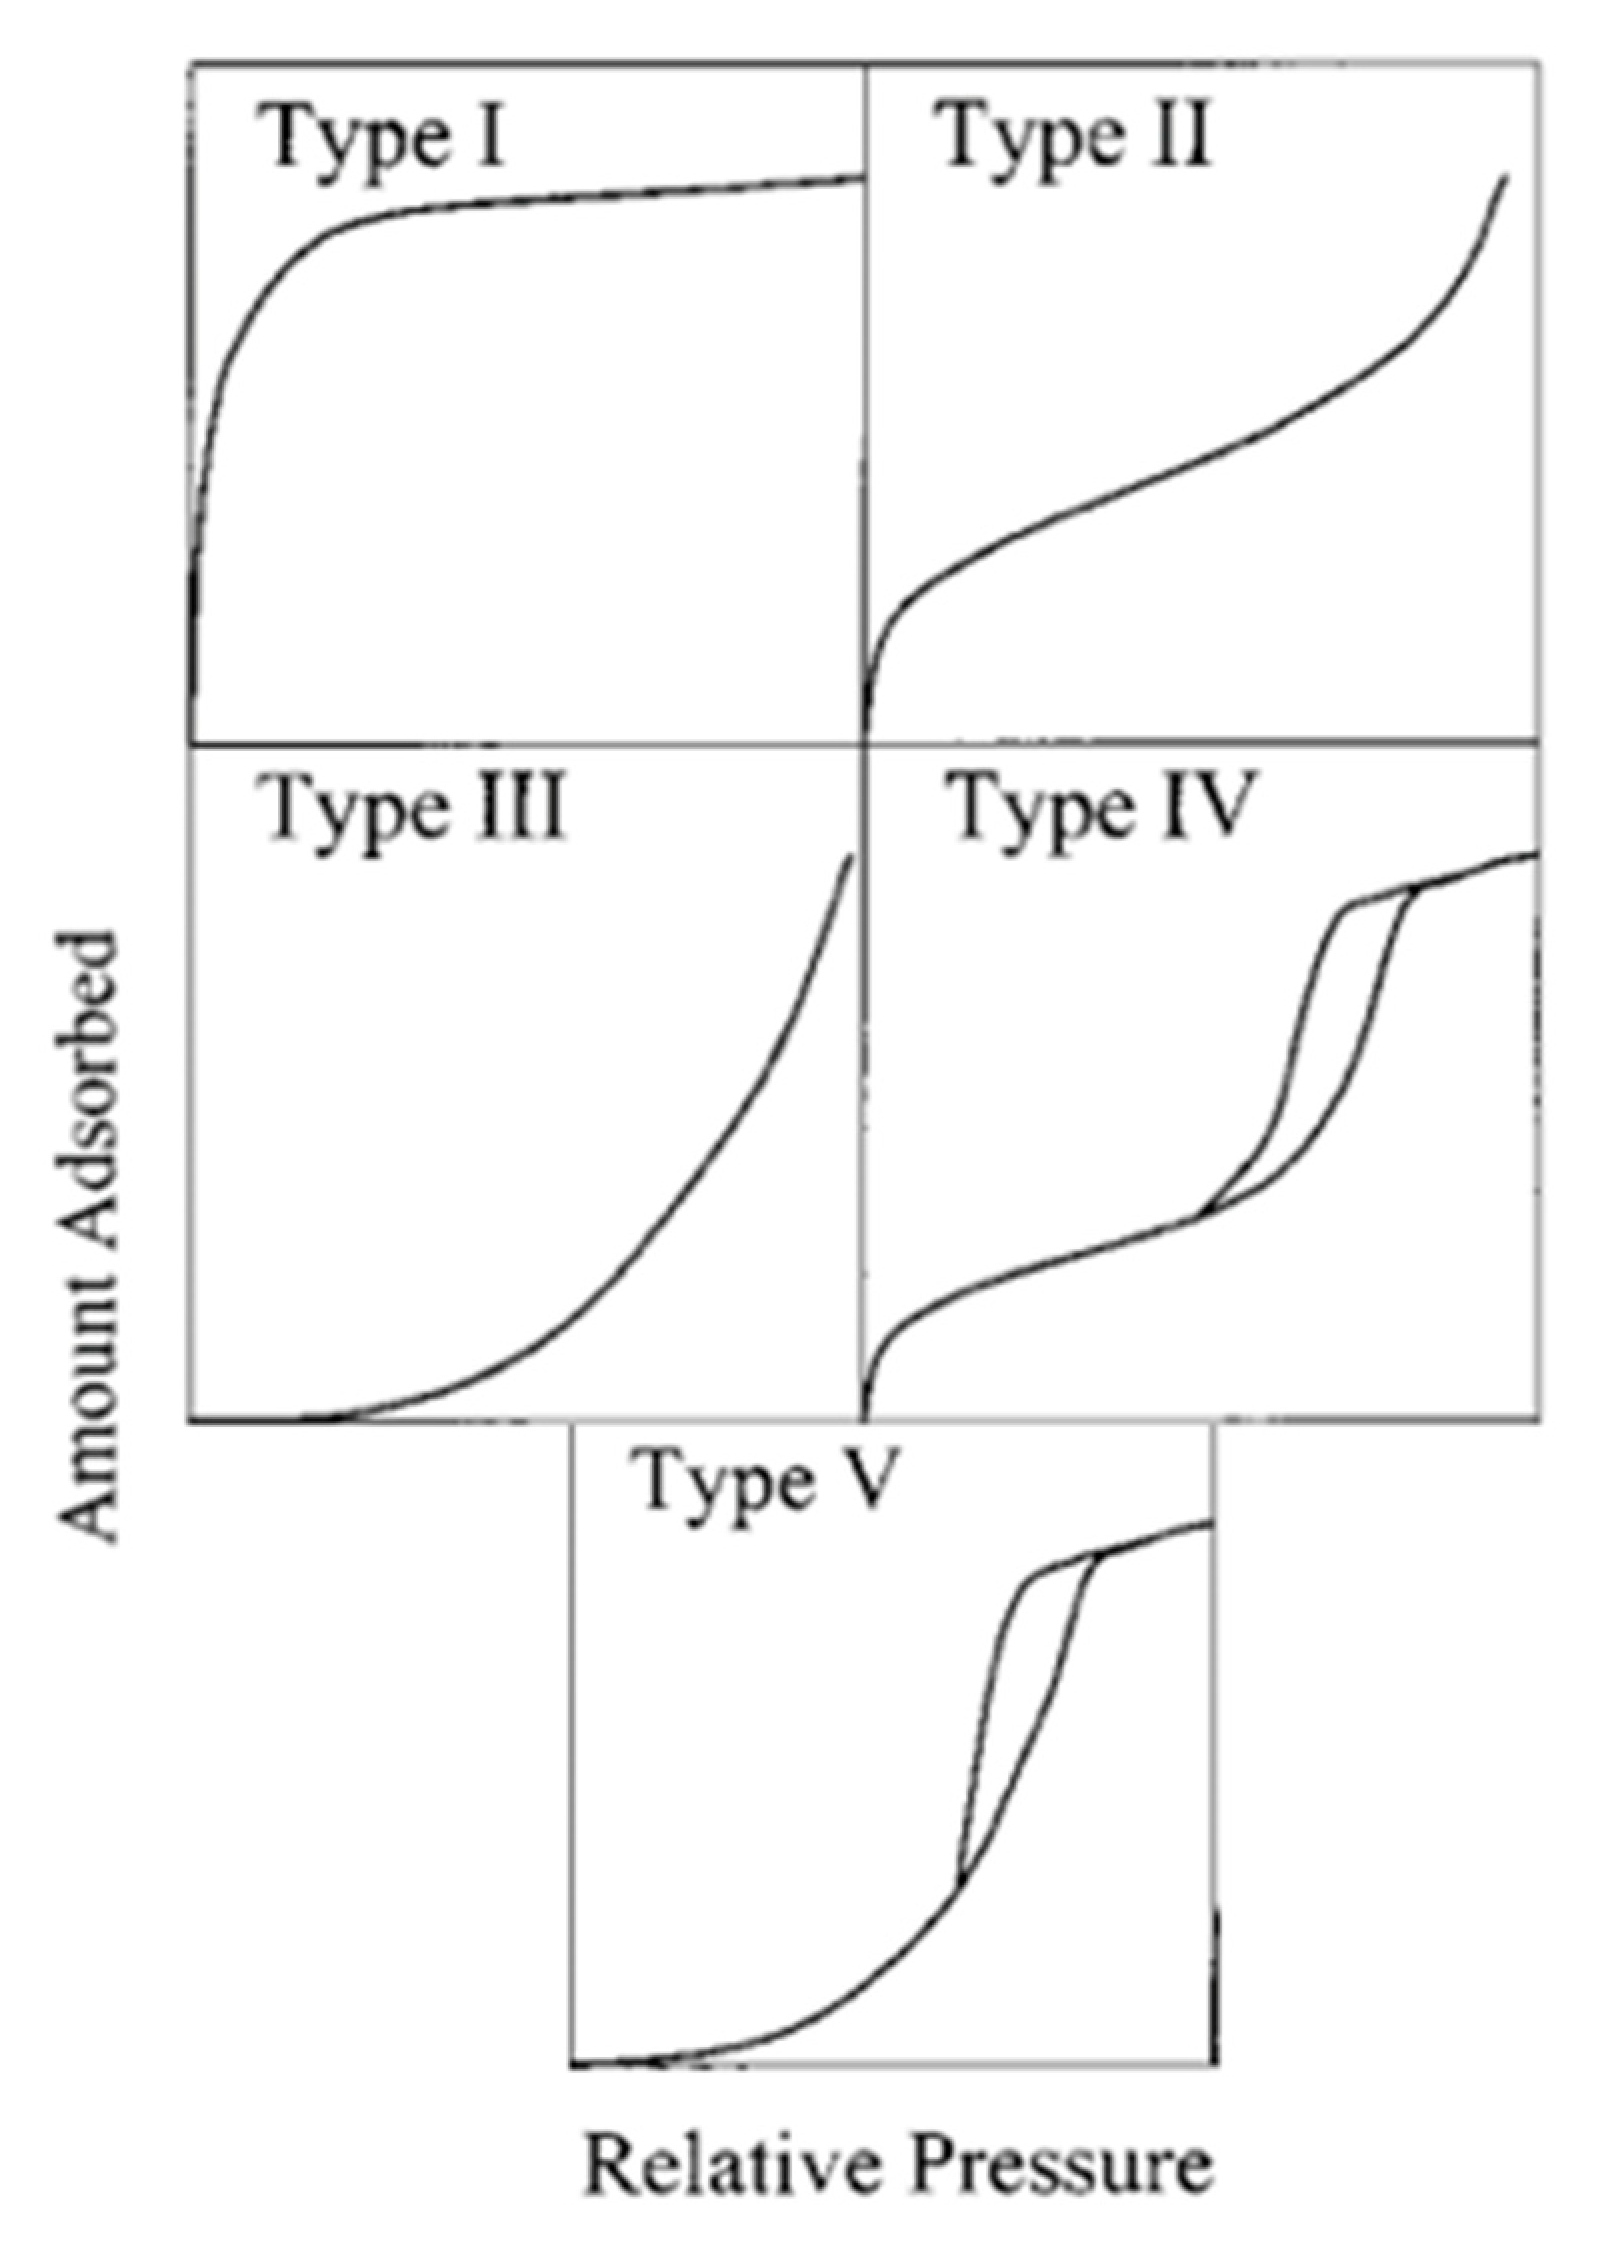
Several models have been employed to describe adsorption data, with the two most commonly used being the Langmuir and Freundlich isotherms [87]. The Langmuir isotherm was developed to explain gas–solid phase adsorption, but it can also be used to quantify the capacity of adsorbents [88]. In terms of the subject manner of this review, Langmuir isotherms can explain monolayer adsorption of fluorinated surfactants onto mineral surfaces [89]. Upon examining the adsorption of PFOS, PFOA, perfluorononanoic acid (PFNA), PFBS, etc., onto various mineral surfaces, e.g., alumina, silica, germanium, iron, titanium, etc., it was found that the majority of systems exhibited type I adsorption isotherms, which is when these PFAS surfactants form a single layer of such molecules onto solid surfaces [12,87,90,91,92,93]. Figure 2 shows schematics of type I, II, III, IV, and V adsorption isotherms, where the type I isotherm indicates monolayer adsorption on microporous surfaces, the type II isotherm indicates monolayer–multilayer adsorption on non-porous and macroporous surfaces, the type III isotherm indicates multilayer formations of adsorbate on porous surfaces, the type IV isotherm indicates multilayer adsorption on mesoporous surfaces, and the type V isotherm indicates monolayer–multilayer adsorption on porous surfaces [89,94].
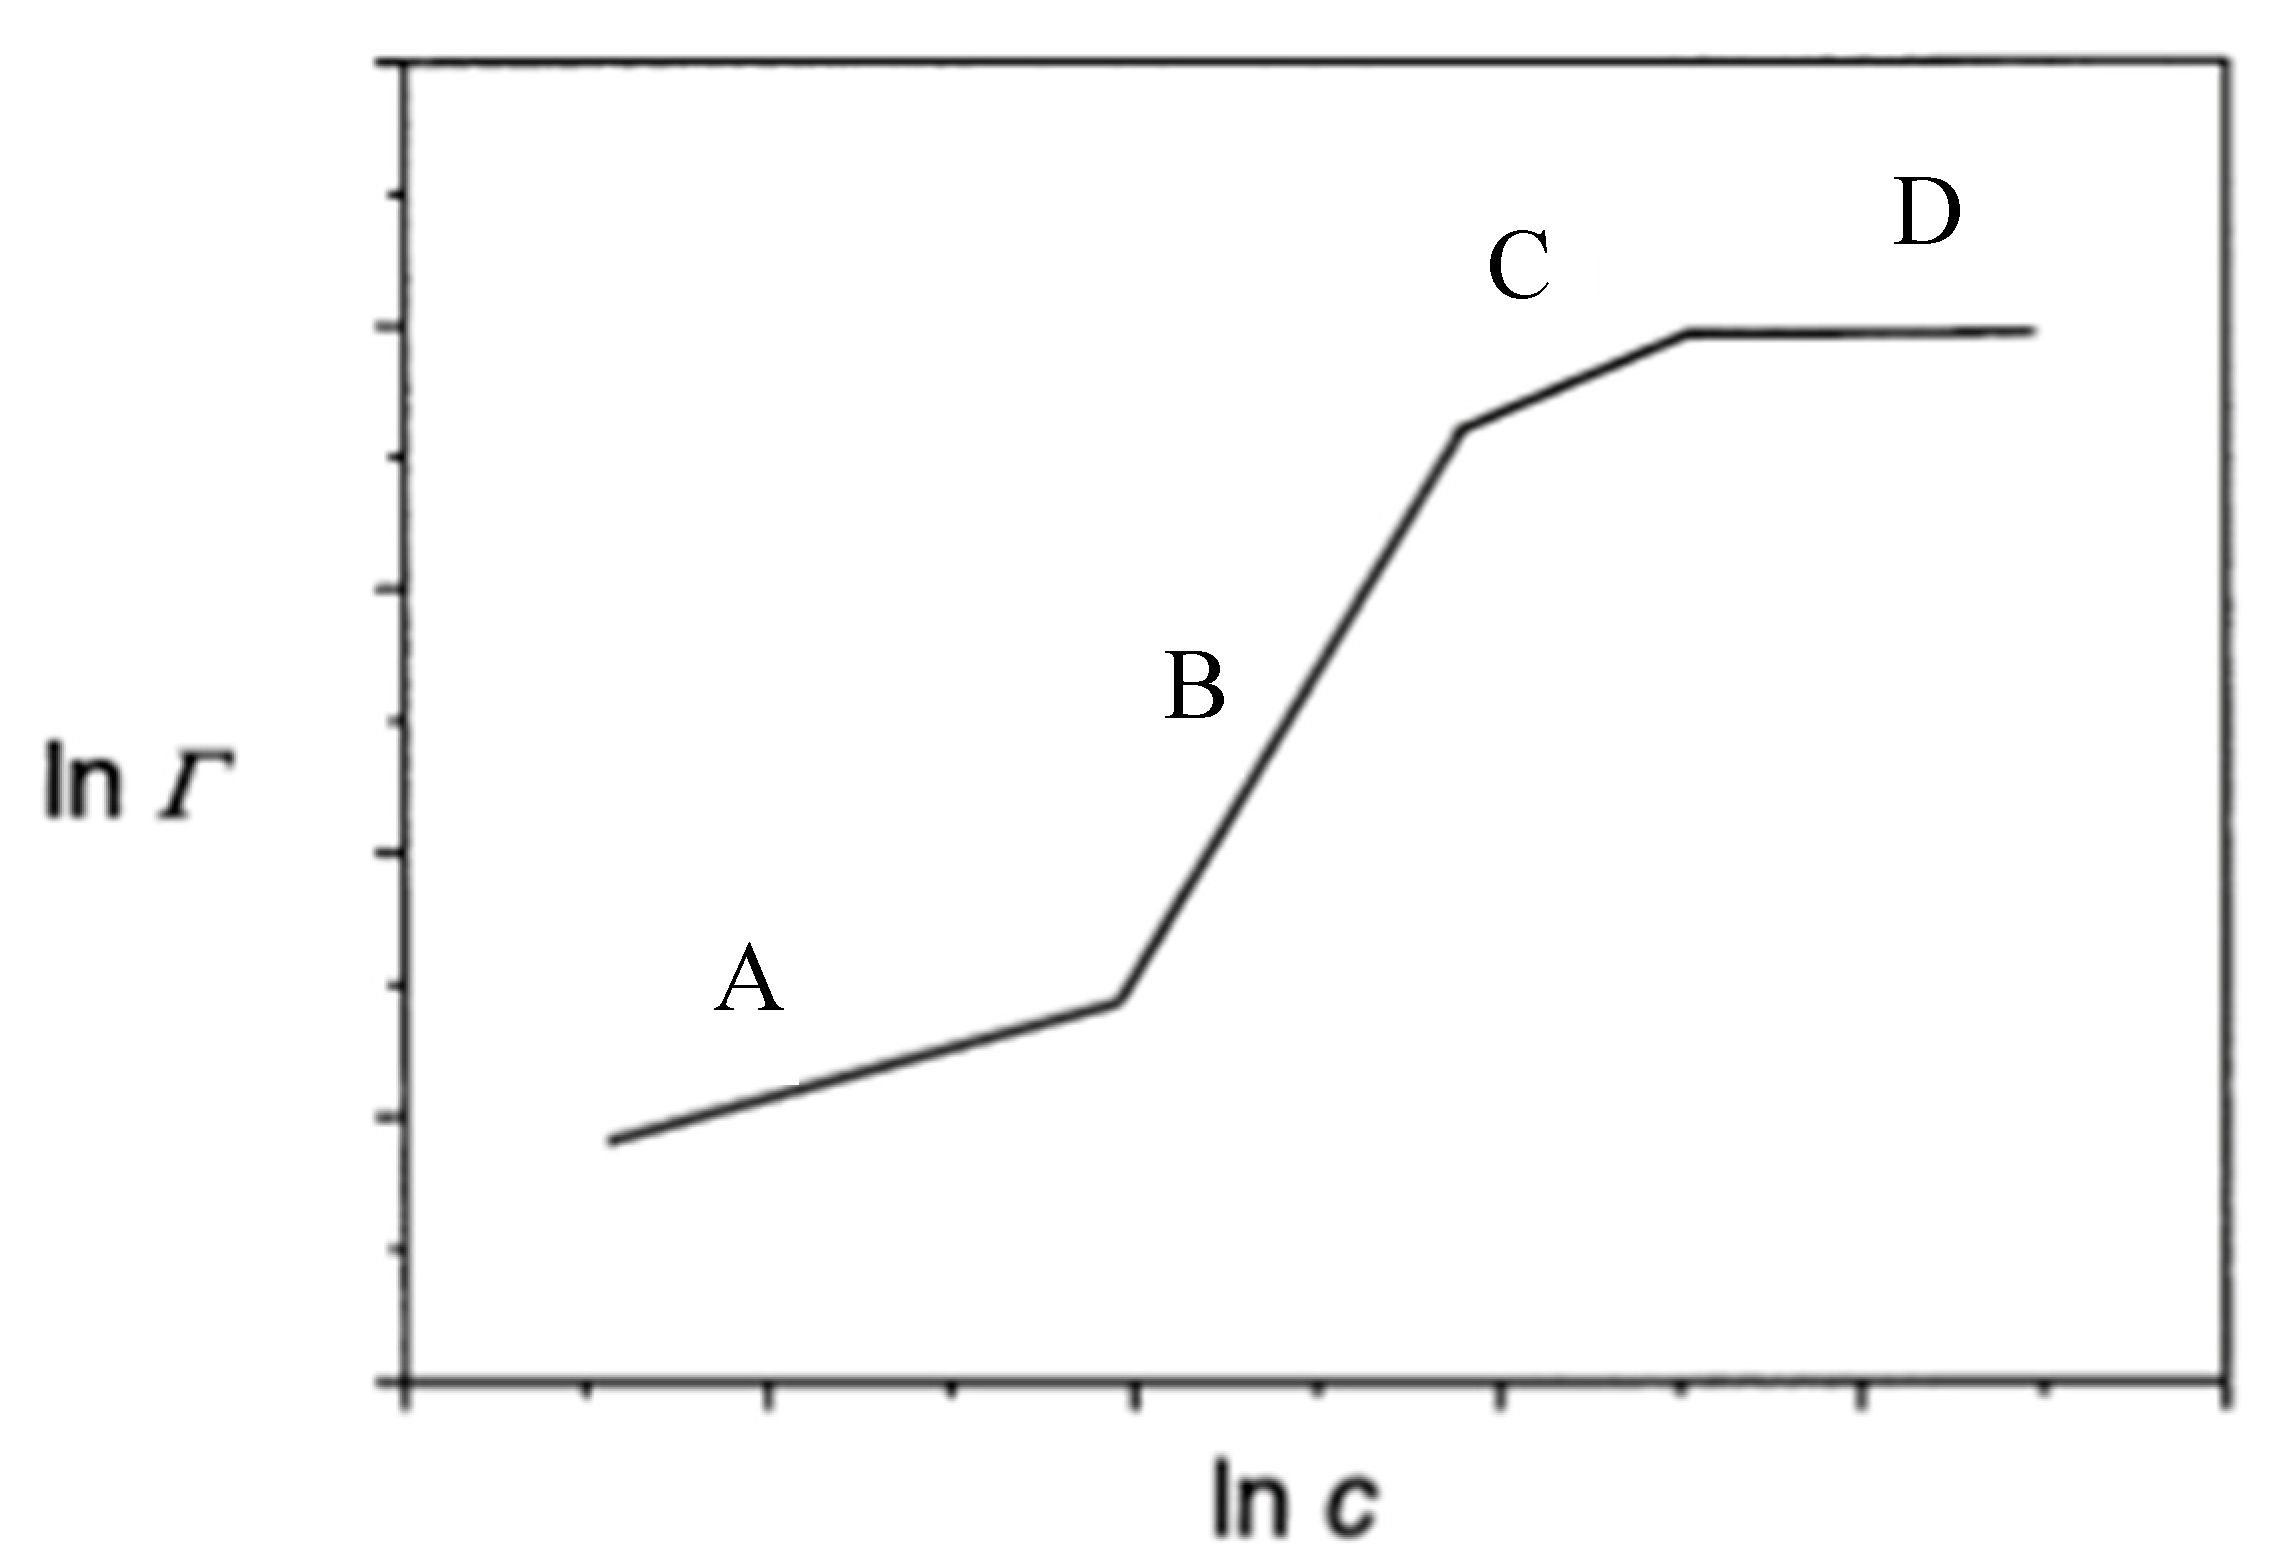
Fluorinated surfactants adsorb onto the mineral surface when the surfactant concentration in the aqueous solution is increased, which then results in the surface excess of fluorinated surfactants eventually reaching a plateau until no more surfactant molecules can be adsorbed. Figure 3 shows a schematic of an adsorption isotherm, where c (on the x-axis) indicates the concentration of fluorinated surfactant, and Γ the adsorbed amount of surfactant onto a surface. The Figure 3 adsorption isotherm is typically exhibited by ionic surfactants and is referred to as a “Somasundaran–Fuerstenau” isotherm [81]. Four concentration regions (on a log–log scale) are depicted in Figure 3, where, in (A), adsorption is primarily due to electrostatic interactions; in (B), adsorption is primarily due to electrostatic and hydrophobic interactions; in (C), the zero-point charge occurs on the surface; and in (D), surfactant micelle formation in the bulk is commencing [83].
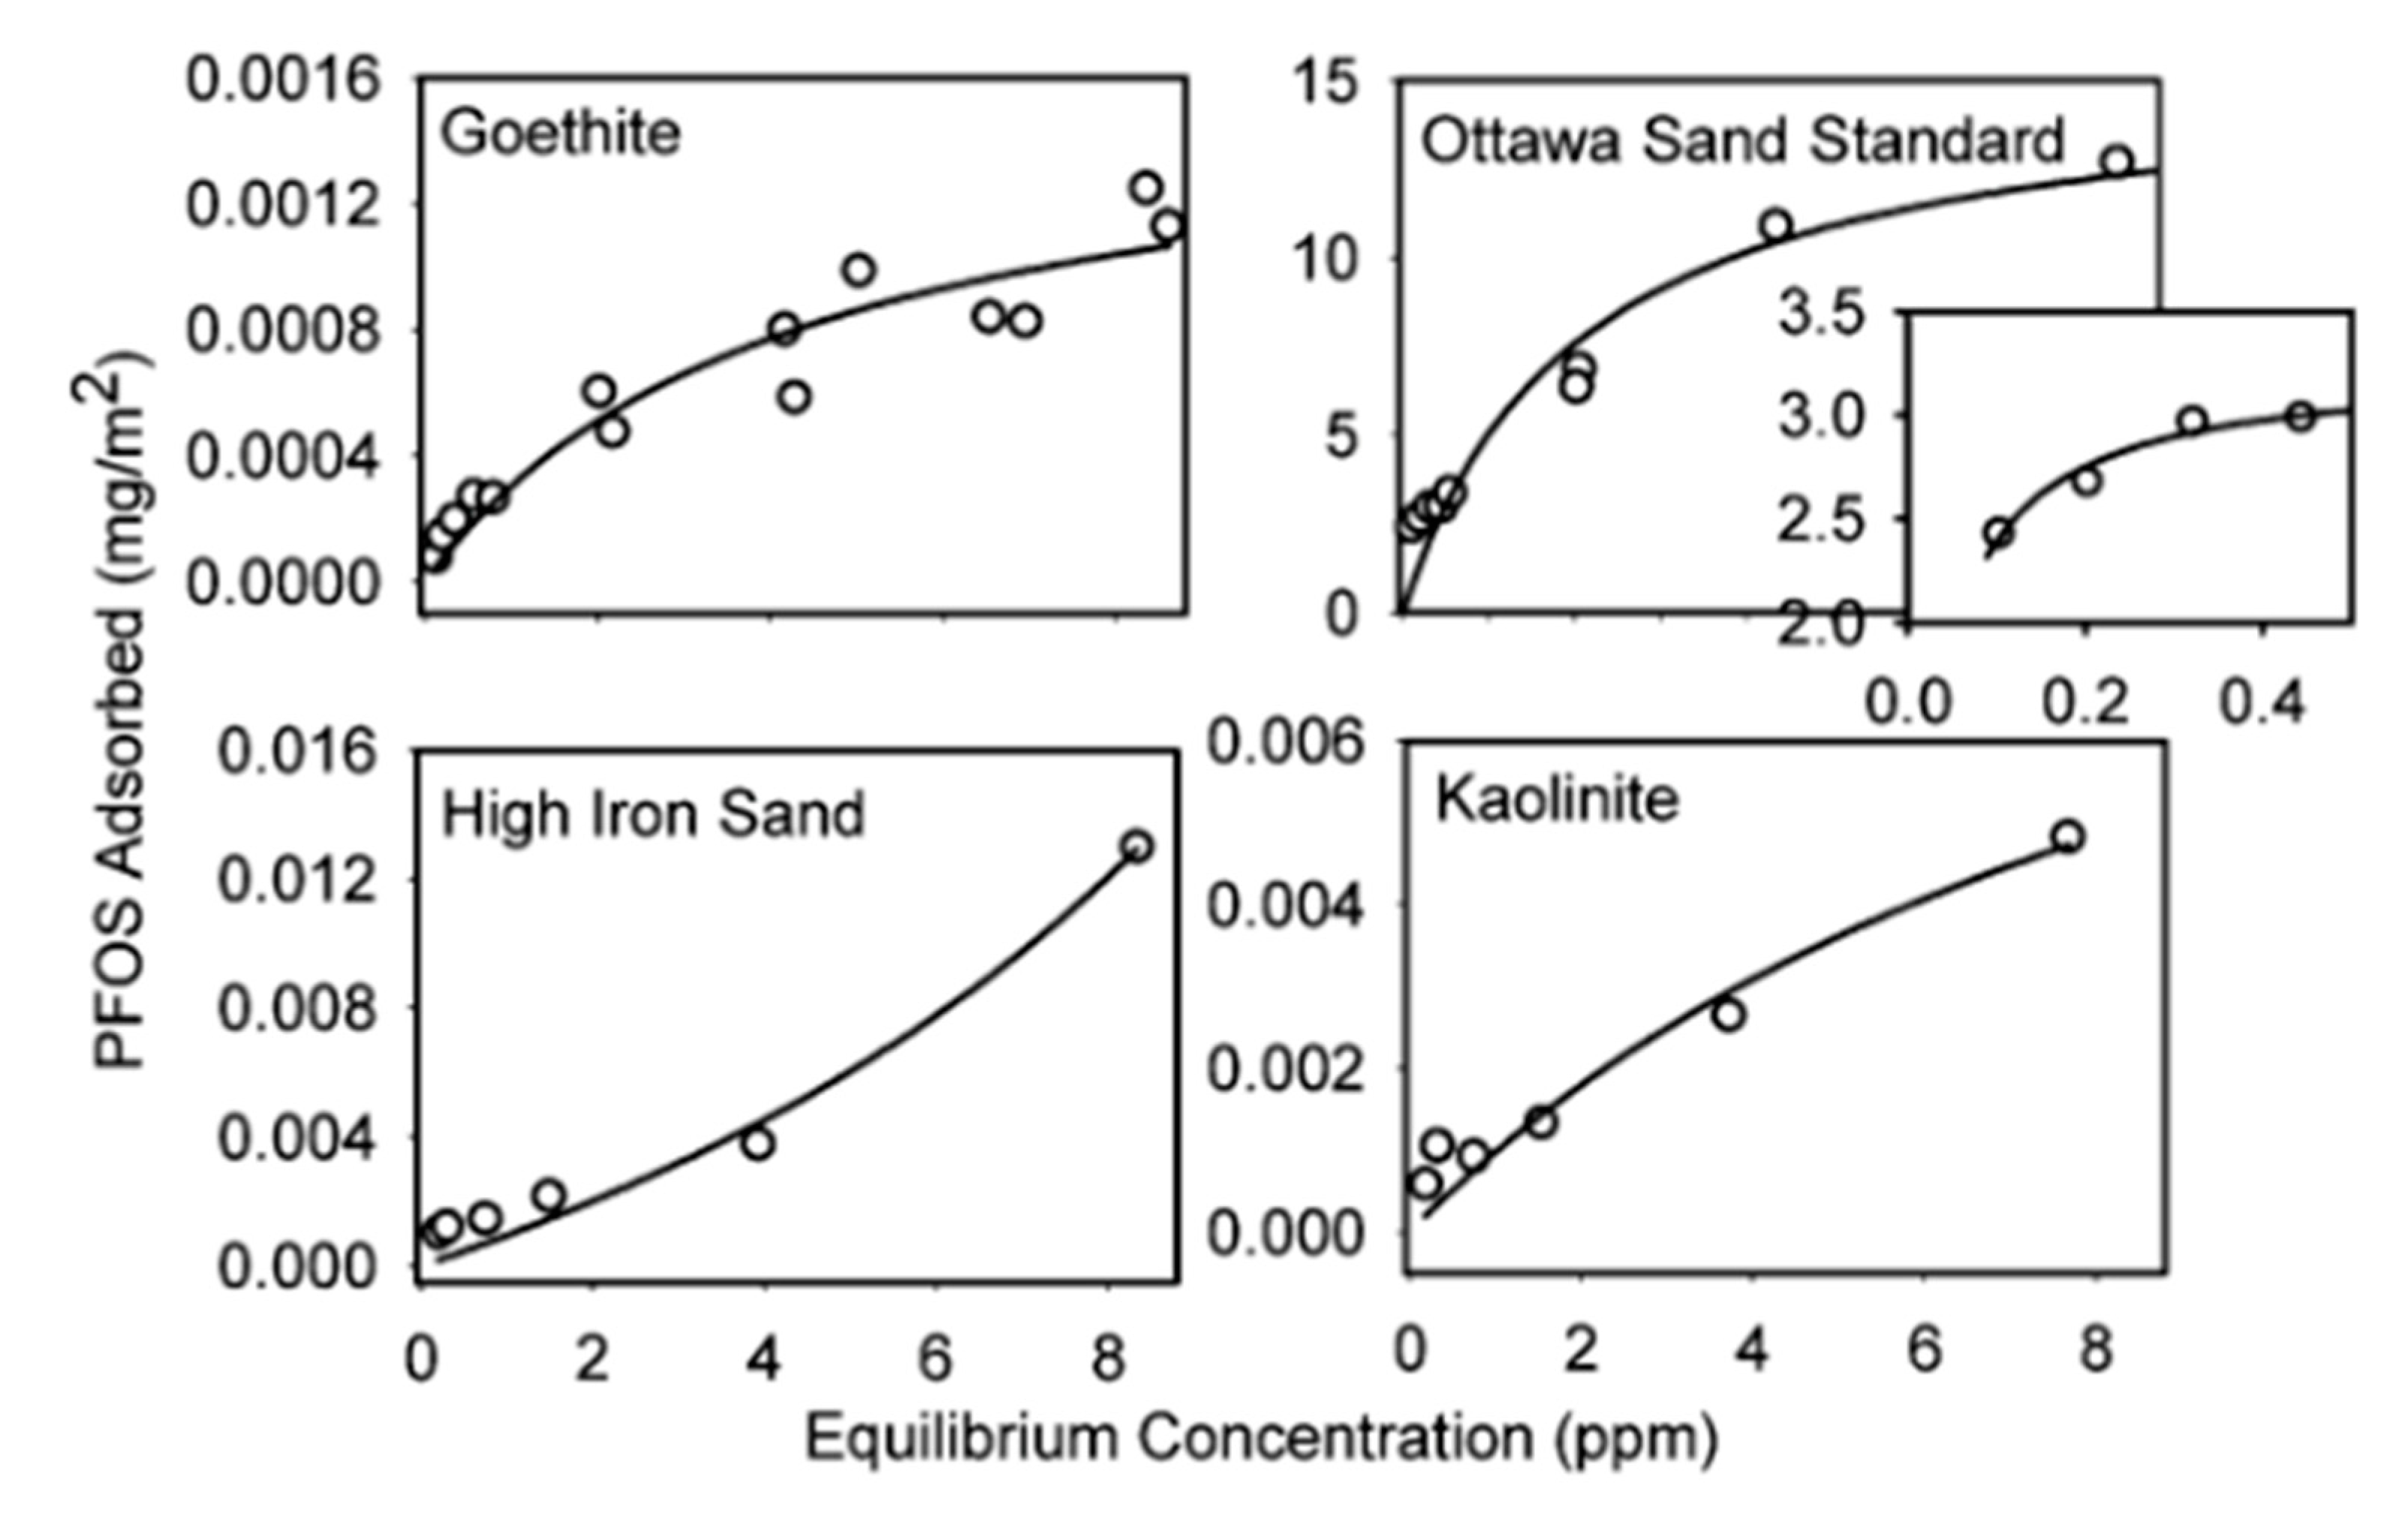
The adsorption of PFOS onto various sediments in different water environments was found to exhibit type I and III adsorption isotherms [90]. It can be seen in Figure 4 that goethite, Ottawa sand standard, and kaolinite exhibited type I isotherms, while high iron sand exhibited type III adsorption isotherm. In that study, high-iron sand had a higher affinity for PFOS than the other inorganic minerals examined, such as goethite and kaolinite, which led the authors to suggest multilayer adsorption. Similarly, the adsorption of ammonium perfluorooctanoate (APFO) onto alumina resulted in an isotherm indicative of bilayer formation [83]. The results presented in this section show that reported adsorption isotherms can differ depending on the types of PFAS and mineral surface examined. The amount of PFAS adsorbed onto mineral surfaces varies, depending on the mineral surface it adsorbs on, and adsorption isotherms can help interpret these changes.
In order to determine the amount of PFAS that adsorbed onto mineral surfaces, a typical strategy is to measure the concentration of PFAS in the aqueous solution (in contact with the mineral surfaces) prior and following the adsorption. Multiple analytical chemistry techniques have been used to accomplish this task, e.g., high-performance liquid chromatography, followed by mass spectroscopy (HPLC–MS) [66,78,84,95], HPLC/electrospray ionization with tandem mass spectroscopy (HPLC/ESI-MS) [42,96], and gas chromatograph/ESI-MS [85]. Other research groups have used ultra-performance liquid chromatography/ESI/MS [87], UPLC/MS/MS [91,92,93,97], Fluorine-19 nuclear magnetic resonance (F-NMR) [83], and Fourier Transform Infrared Spectroscopy (FTIR) [98].
While the aforementioned analytical techniques quantify the amount of PFAS adsorbed onto mineral surfaces, there is a dearth of reports that characterize the adsorbed layer structure. Hellsing et al. [12] analyzed neutron reflection data in order to determine the structure of PFAS onto alumina particles. He et al. [99,100] used Molecular Dynamics simulations to predict the structure of the PFOS layer adsorbed on a TiO2 surface. In most cases where the adsorbed layer structure is mentioned (see Table 2), the structure is typically inferred from the characteristics of the adsorption isotherms, as discussed in the context of Figure 2 [89].

3. Adsorption Thermodynamics

The thermodynamics of the adsorption process have been investigated in order to explain various interactions that occur during the adsorption of adsorbates onto adsorbents [42,87,93]. In this review, adsorption thermodynamics are examined so that the driving forces are revealed pertaining to the adsorption of fluorinated surfactants onto mineral surfaces. Different types of adsorption isotherms, such as type I, II, III, IV, and V, can reveal whether an adsorption process leads to either monolayer or multilayer coverage of adsorbate on various adsorbents that are either porous, non-porous, or mesoporous in physical structure.
The physical adsorption on solid surfaces of many compounds can be described by using the Langmuir (Equation (1)) or Freundlich adsorption isotherms (Equation (2)):
qe = ((KL qm Ce)/(1 + KLCe))
qe = KFCe(1/n)
where qe is the adsorbed amount of adsorbate (µg m−2), KL the Langmuir constant (L µg−1), qm the maximum adsorption capacity (µg m−2), Ce the concentration of adsorbate at equilibrium, and KF the Freundlich adsorption constant [87].
In a study of PFOS adsorption onto alumina nanoparticles and nanowires in water, at various temperatures, KL was used (Equation (3)) to evaluate thermodynamic parameters of adsorption [87]:
ΔG = −RT ln(kL)
ΔG for adsorption of PFOS onto nanosize alumina NP/NW was found to be about −20 KJ mol−1 at all temperatures examined [87]. The ΔG values of PFOS adsorption onto boehmite were −3.03, −2.56, and −2.10 KJ mol−1 at 293, 303, and 313 K, respectively [93]. Recall the following:
ΔG = ΔH − TΔS
The Van’t Hoff equation can then be used to connect the adsorption coefficient (KL) from the Langmuir adsorption isotherm (Equation (1)) with thermodynamic quantities and temperature [93]:
lnKL= −(ΔH/RT) + (ΔS/R)
ΔH is the change in enthalpy (KJ mol−1) and ΔS is the change of entropy (J mol−1 K−1) associated with adsorption; R is the ideal gas constant (J mol−1 K−1), and T the absolute temperature (K). In a study of PFOS adsorption onto boehmite, KL was used to estimate the adsorption enthalpy (ΔH) and entropy change (ΔS) [93]. The ΔH of PFOS adsorption onto boehmite was estimated to −16.9 KJ mol−1, which indicates that this adsorption process is exothermic and that temperature increase does not favor PFOS adsorption into boehmite. The calculated negative ΔS of PFOS adsorption (−5.69 J mol−1 K−1) indicates that the PFOS adsorption onto boehmite is enthalpy driven, rather than entropy driven [93]. The ΔS of PFOS adsorption onto alumina NP and NW was found −0.190 and 0.029 KJ mol−1 K−1, respectively, at 40 °C [87]. The negative ΔS value indicated the favorability of water molecule reorientation around the solute or the alumina NP surface. The positive ΔS for PFOS adsorption onto alumina NW suggested increased disorder at the solid/solution interface during adsorption [93]. This is related to PFOS molecules replacing adsorbed water molecules which then become free to move around.
A study that examined the adsorption thermodynamics of various perfluorinated surfactants adsorbing onto kaolinite in the presence of Na+ ions at different concentrations used Equation (6) to split ΔGadsorption, the total Gibbs free energy change during PFAS adsorption, into a hydrophobic contribution and an electrostatic contribution [42]:
ΔGadsorption = ΔGhydrophobic + ΔGelectrostatic, adsorbate–adsorbent + ΔGelectrostatic, adsorbate–adsorbate
Equation (7) was used to relate the contribution of the C—F chain toward ΔGhydrophobic:
ΔGhydrophobic = m ∗ ΔGCF2
where m is the number of carbon atoms on the C—F chain of a perfluorinated surfactant, and ΔGCF2 represents the hydrophobic free energy contribution of each individual CF2 group. The reported values of ΔGhydrophobic and ΔGCF2, 2.5–2.7 KJ mol−1 did not vary much with the Na+ concentration. On the contrary, when the Na+ concentration increased, the ΔGelectrostatic values became more negative, from about −5 to −11 KJ mol−1, which, in turn, reduced the m value that was required to achieve spontaneous adsorption (ΔGadsorption = 0) [42], meaning that the increase in Na+ concentration allowed PFAS with shorter C—F chains to adsorb to mineral surfaces. ΔGelectrostatic changed with Na+ concentration, because of the change in the surface charge of kaolinite during these actions. The high value of ΔGelectrostatic, adsorbate–adsorbate indicated that the electrostatic repulsion by adsorbed surfactants is a “thermodynamic inhibitor” of the adsorption process [42]. Xiao et al. considered salting-out effect as an explanation for why ions in solution can increase the adsorption of PFAS onto mineral surfaces, but they concluded that salting-out was not responsible for their results regarding Na+ ion effects on PFAS adsorption [42].
The research highlighted above by Jian et al. [87], Qian et al. [93], and Xiao et al. [42] contributes toward an improved understanding pertaining to PFAS adsorption onto mineral surfaces: The sign of enthalpy can explain whether an adsorption process is exothermic or endothermic and if it is promoted by temperature increase; and the value of entropy indicated the role of disorder within the adsorption process. It would be useful to obtain thermodynamic quantities of surfactant–surface (particle) interactions through direct means, i.e., isothermal titration calorimetry [101].

4. Adsorption Mechanism

As discussed in Section 3, the adsorption thermodynamics can explain the spontaneity of an adsorption process. Adsorption thermodynamics can also reveal some of the mechanisms of PFAS adsorption onto mineral surfaces. For example, during the adsorption of various perfluorinated surfactants onto kaolinite, the calculated ΔGelectrostatic, adsorbate–adsorbate of ~11.5 KJ mol−1 was double the value of ΔGelectrostatic, adsorbate–adsorbent, which indicated that electrostatic repulsions acted as a “thermodynamic inhibitor” [42]. The signs of enthalpy and entropy can also indicate the driving force behind adsorption, for example the adsorption of PFOS on boehmite was enthalpy-driven rather than entropy-driven [93]. Section 4 addresses the chemistry of the adsorbent and adsorbate, the solvent used, the presence of ion or compounds in solution, and that the pH can modulate the relative importance of the mechanisms that occur during adsorption. To this end, this section examines the role on adsorption of electrostatic interactions, hydrophobic interactions, hydrogen bonding, and ligand and ion exchange.

4.1. Electrostatic Interactions

During their adsorption onto minerals at environmental pH, anionic perfluorinated surfactants, such as PFOS and PFOA, with negatively charged head-groups, can be electrostatically attracted to mineral surfaces that are positively charged [65,97,99]. As previously mentioned, the surface charge and the charges on PFAS head-groups can have an impact on whether or not adsorption occurs [12]. In saltwater environments, monovalent and divalent ions are present, such as Na+, K+, Mg2+, and Ca2+, which, at varying concentrations, can cause electrostatic repulsion of attraction between fluorinated surfactants and mineral surface, which, in turn, can alter the surfactant adsorption onto mineral surfaces [42,65,100]. Electrostatic interactions are important to examine in order to better understand PFAS adsorption onto mineral surfaces.
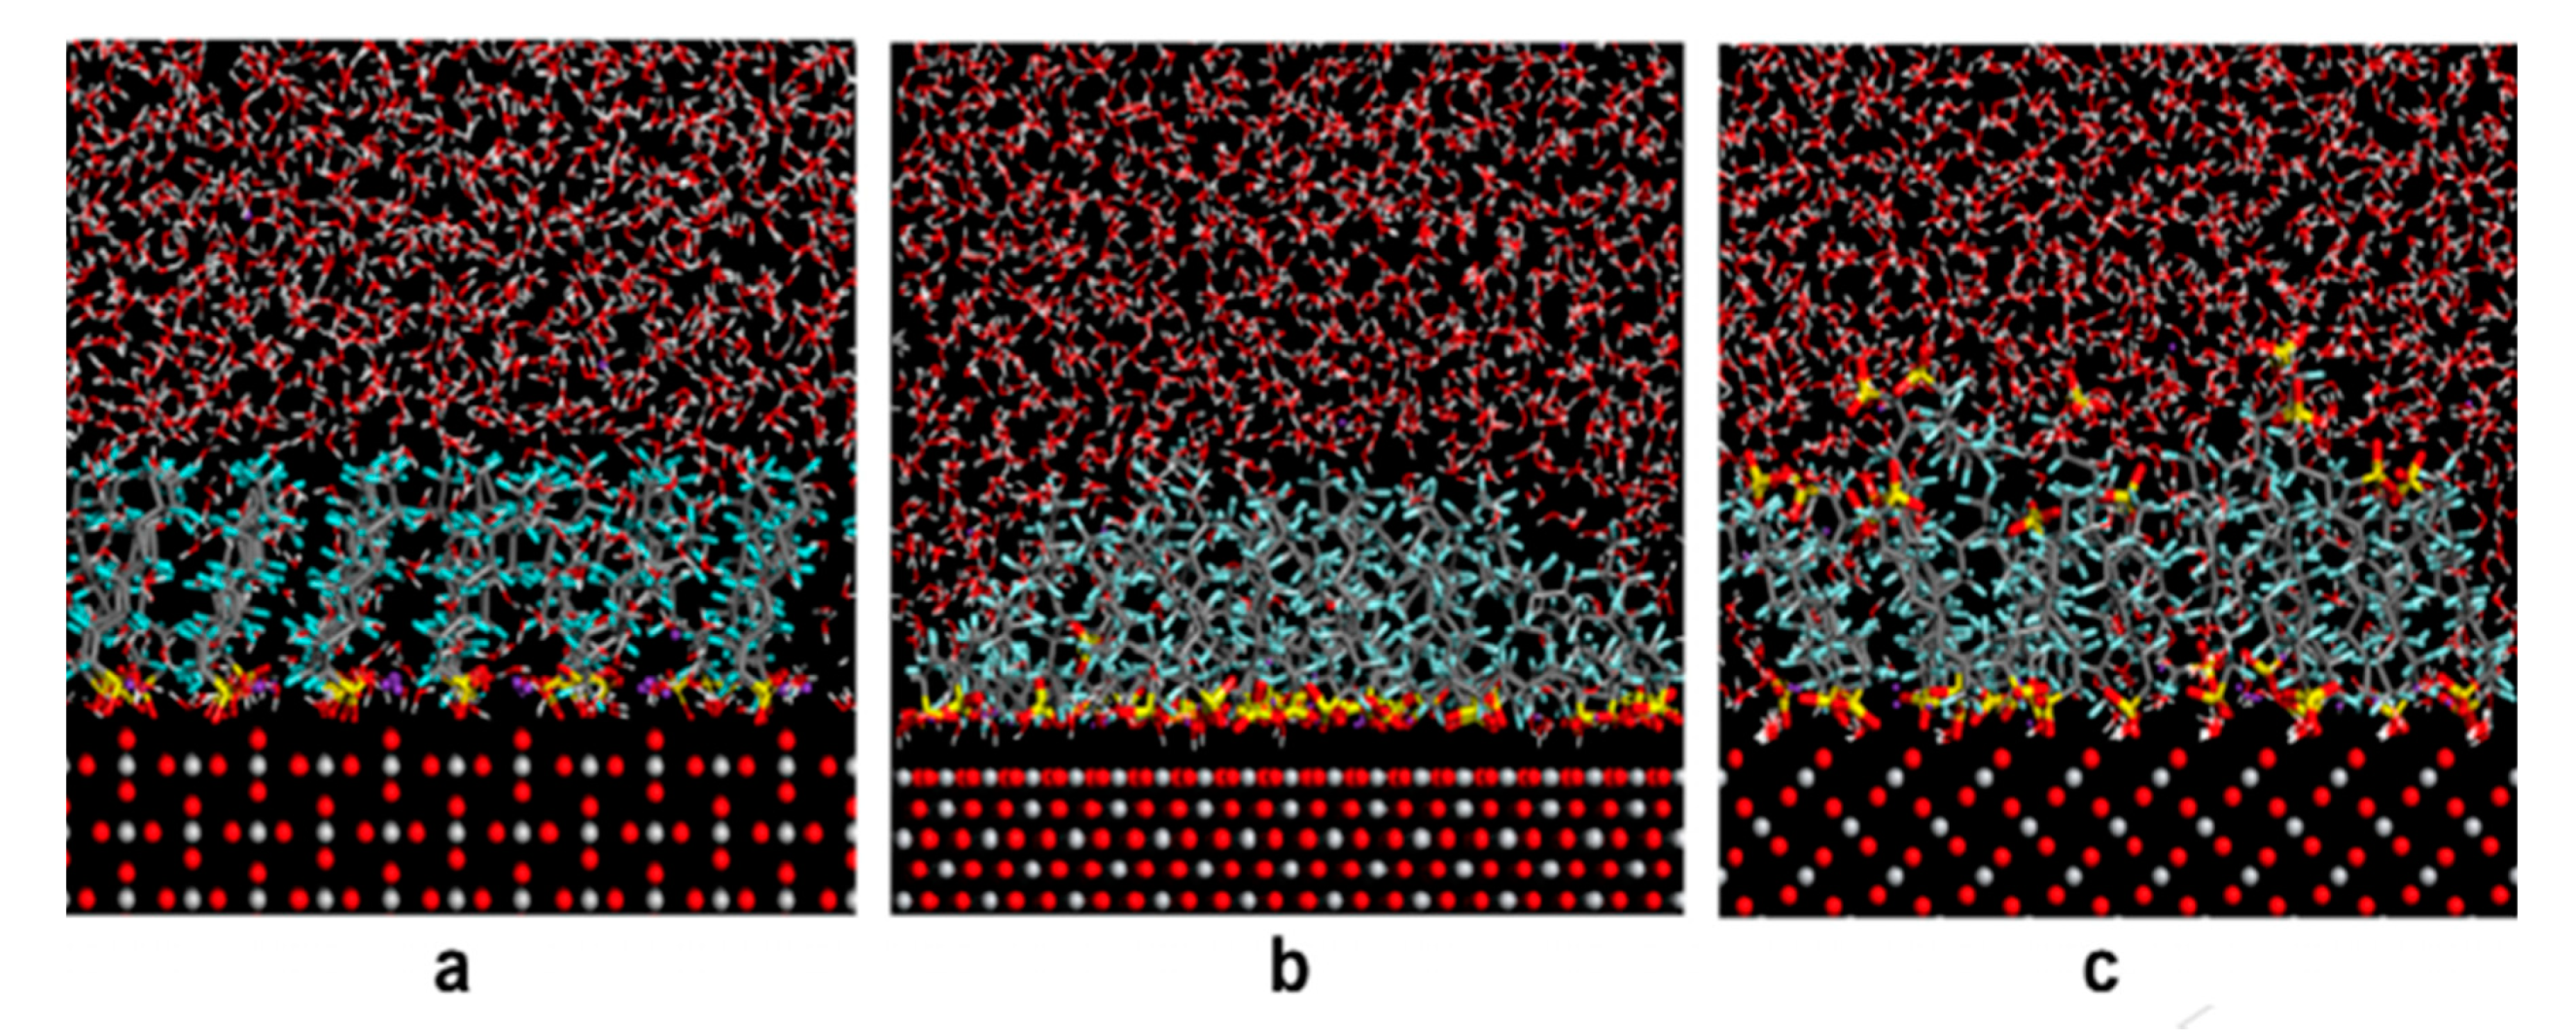
Electrostatic interactions were observed in the work of He et al. [99,100], who studied PFOS adsorption from water onto positively charged TiO2 surfaces. During adsorption and in the presence of K+ ions, the sulfonate head-groups of PFOS interacted with the TiO2 surfaces electrostatically, forming a PFOS monolayer. As the number of PFOS molecules increased from 25 to 36 and 64, the perfluoroalkyl chains of the PFOS molecules interacted with the monolayer structure via van der Waals interactions to form multilayer aggregates, according to the results of Molecular Dynamics (MD) simulations [100]. As the concentration of Ca2+ divalent ions increased (to an unreported amount), the PFOS molecules that formed multilayer aggregates changed back to a monolayer structure. Figure 5 shows results from MD simulations performed in water, at 300 K, with PFOS and K+ ions present in the solution. A monolayer coverage of PFOS can be seen at the (110) plane of the TiO2 surfaces, and the irregular structures caused by van der Waals interactions between the perfluoroalkyl and the PFOS monolayer can be seen at the (001) and (100) planes. It has been reported [85,90] that changes in solution pH and the presence of ions can cause either electrostatic attractions or repulsions between adsorbates and adsorbents. This can either promote or inhibit adsorption, and is discussed in Section 5.
It is also possible that some mineral surfaces, e.g., alumina (Al2O3), can have a net negative potential, which causes electrostatic repulsion between these negatively charged surfaces and the negatively charged head-groups of anionic surfactants. This should prevent adsorption, but there are occasions where fluorinated surfactants such as PFOS, PFOA, and PFNA can adsorb onto negatively charged mineral surfaces, such as quartz, having siloxane patches [85] despite electrostatic repulsion. This hydrophobic interaction is examined next.

4.2. Hydrophobic Interactions

During the adsorption of fluorinated surfactants onto mineral surfaces having hydrophobic moieties, hydrophobic interactions can be important even if there is an electrostatic repulsion between surfactant and mineral surface [65]. Shafique et al. [85] reported that PFCA hydrophobic C—F tails associated onto hydrophobic siloxane patches present on a fused silica (quartz) surface (Figure 6). This surface had silanol and siloxane patches, as confirmed by using ATR–FTIR spectroscopy. The Shafique et al. work indicates that hydrophobic interactions can surmount electrostatic repulsion [65,96,97]. This has also been observed during the adsorption of PFOS onto mineral surfaces that have pH-dependent surface charges. These mineral surfaces include montmorillonite (MM), kaolinite (KL), and hematite (HM), where, at a low pH value of ~2.3, and at low concentrations of calcium and sodium, negatively charged PFOS can adsorb onto such surfaces via hydrophobic interactions [96]. PFOS and PFOA with longer C—F chains have stronger hydrophobicity, which leads to a higher affinity toward hydrophobic surfaces such as carbon nanotubes (CNTs) [102]. In particular, the PFAS equilibrium adsorbed amount onto CNTs followed the sequence PFOS > perfluorohexane sulfonate (PFHxS) > PFOA > PFBS > perfluorohexanoic acid (PFHxA) > perfluorobutanoic acid (PFBA) [102].

4.3. Hydrogen Bonding

Hydrogen bonding is another mechanism that can be seen during the adsorption of fluorinated surfactants on mineral surfaces [22]. Typically, at higher pH settings, hydrogen bonding occurs when the oxygen atoms found on PFAS head-groups act as acceptors, where they then can bond to the hydrogen atoms that reside on the hydroxyl groups of the mineral surface [95,96]. In studies of PFOS/PFOA adsorption capacity onto nanosize hematite, which exhibited hydrogen bonding interactions, it was found that competitive adsorption occurs between hematite surfaces and water molecules for PFOS/PFOA adsorption [102,103]. Hydrogen bonding interactions were also observed during the adsorption of PFOS onto nanoparticles surfaces, such as Al2O3, Fe2O3, SiO2, and TiO2 when investigating pH effects on such adsorbents [95]. Specifically, at a pH above each nano-oxide’s point of zero charge (PZC) of 7.3 (Al2O3), 7.6 (Fe2O3), and 5.4 (TiO2), their hydroxyl groups, which are neutrally charged, can adsorb anionic PFOS molecules. The hydrogens on the hydroxyl groups of these nano-oxides form hydrogen bonds with oxygen atoms on the sulfonate head-groups on PFOS molecules [95]. Since C—F chains are hydrophobic, it is typically difficult for PFAS to form hydrogen bonds with the oxygen found on the functional groups of mineral surfaces [22]. Thus, hydrogen bonding may play a minor role during the PFAS adsorption onto mineral surfaces [22]. It may be harder for PFAS to adsorb onto regions of mineral surfaces that have minimal hydrogen atoms present.

4.4. Ligand Ion Exchange

When specific mineral surfaces have functional groups such as –Cl and –CO3, the adsorption of fluorinated surfactants onto mineral surfaces can also occur through a mechanism called ligand ion exchange [64,104]. This was seen, for example, on PFOS adsorption onto mesoporous silica and iron surfaces [104]. It was hypothesized that the hydroxyl functional groups found on metal oxides, such as AlOOH and Fe2O3, can be replaced by PFAS molecules via a ligand exchange conveyed by the following [91,103]:
Al—OH + L → Al—L + OH
≡Fe—OH2+ + L → ≡Fe—L + H2O
where L represents the ligand. The adsorption behavior is affected when surface complexes are formed from ligand exchanges during the adsorption of PFOS and PFOA on boehmite surfaces [92]. The following chemical reactions represent the case when boehmite is protonated and when anionic PFOS/PFOA is electrostatically attracted to protonated boehmite:
Al—OH + H+ → Al—OH2+
Al—OH2+ + L → Al—OH2—L
The decrease in pH can increase the positively charged sites on boehmite, which, in turn, enhances PFAS adsorption. Equation (10) shows that Al—OH2+ sites increase and Al—OH sites decrease when the H+ concentration increases in the aqueous environment. This leads to Equation (11), which describes an electrostatic interaction and/or a ligand exchange between the positively charged site on boehmite and anionic PFOS/PFOA, to form a surface complex [22,91].

5. Factors That Affect Adsorption

During the adsorption of fluorinated surfactants onto mineral surfaces, there are different modes of physical adsorption and adsorption mechanisms that can be altered by multiple factors. For example, it was seen in Section 4 that monovalent and divalent ions affect electrostatic interactions. It was also seen that hydrophobic interactions occurred at certain pH levels. We discuss in this section factors that can affect adsorption such as pH changes in solution, the presence of humic acid is monovalent and divalent ions, and surfactant chemistry.

5.1. Change in pH on Minerals and Aqueous Environment

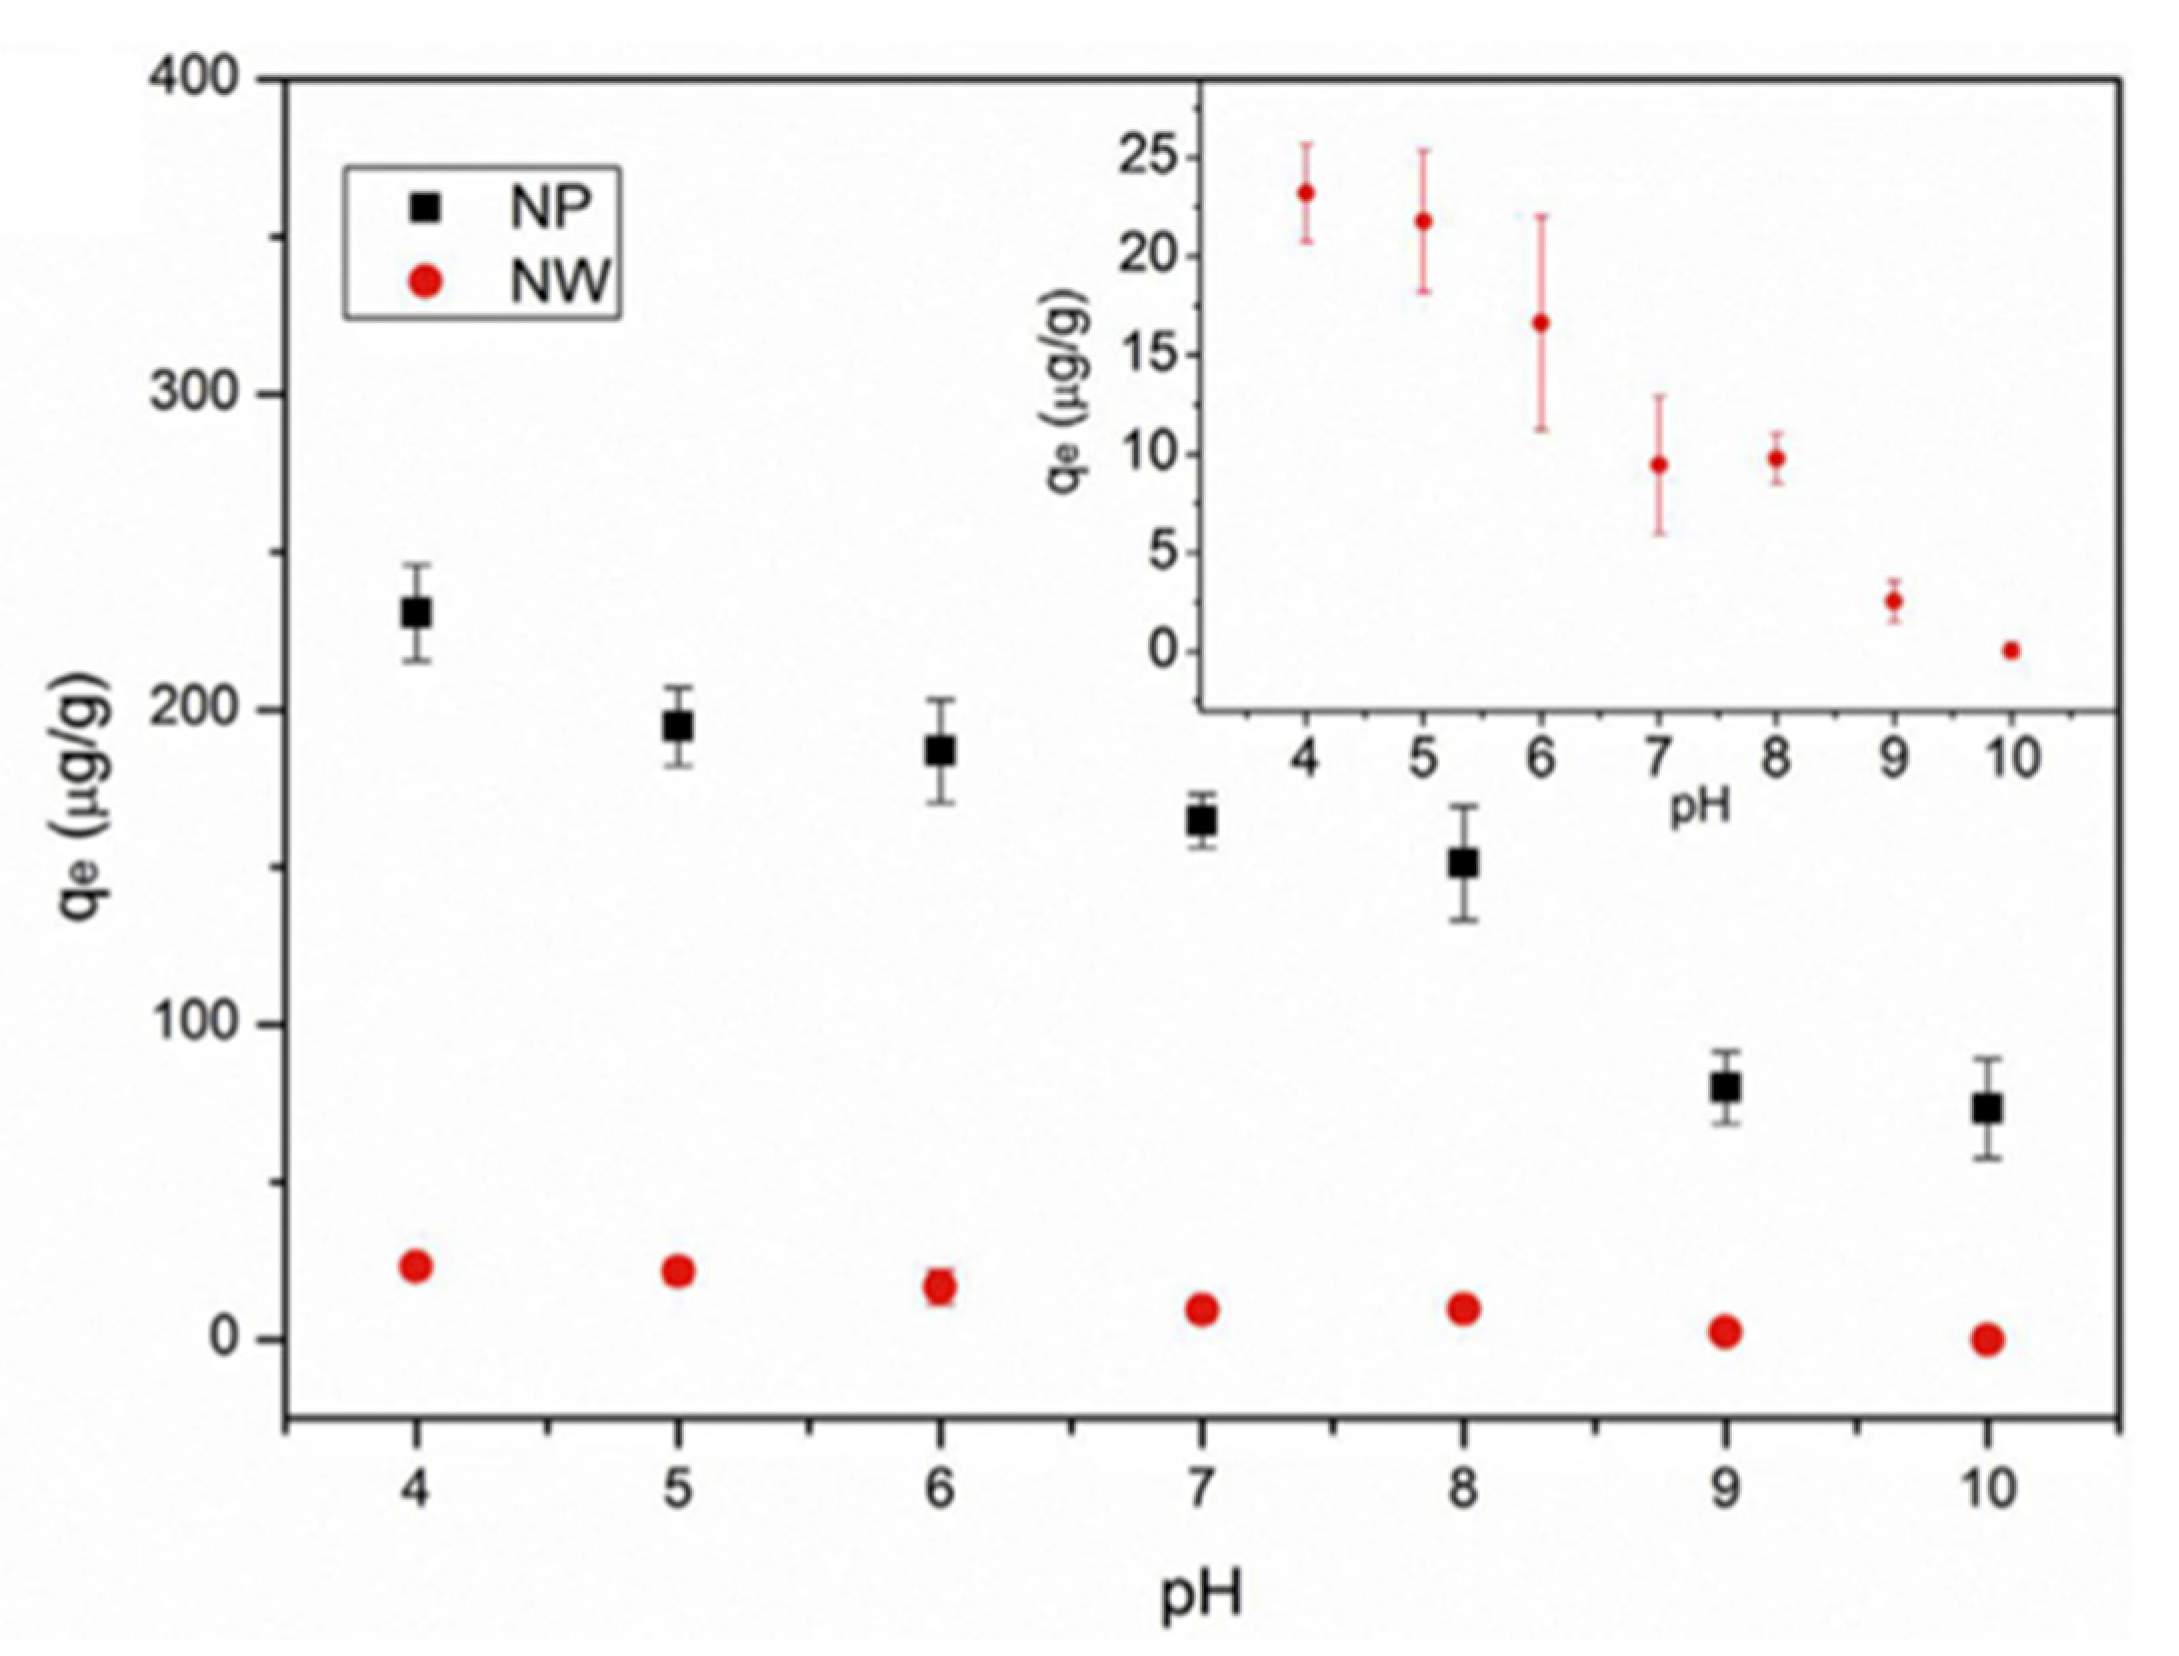
The adsorption of fluorinated surfactants onto mineral surfaces occurs mostly in aqueous systems, and it is important to examine the effects on adsorption of water pH changes, since pH can vary widely between different environments. The pH has been seen to either decrease or increase the amount of fluorinated surfactant adsorbed onto various mineral surface [85]. For example, the adsorption of PFOA onto silica surfaces decreased from 0.0008 to 0.0003 µmol m−2 as the pH of aqueous solution increased from 1.2 to 12.6 [85]. This indicates that, at higher pH levels, the coulombic repulsion that counteracts adsorption is weaker than the hydrophobic effect. At acidic pH, the reduced anionic charge decreases repulsion between anionic functional groups (for example, SiO and OOC), which leads to increased adsorption of PFOA onto silica surfaces. For the case of PFOS adsorption onto minerals, such as goethite and kaolinite, with surfaces made up of Iron(III) oxide-hydroxide and Al2Si2O5(OH)4, respectively, it was seen (Figure 7) that, as pH increased from 4 to 8, the amount of PFOS adsorbed onto both goethite and kaolinite decreased from ~3.6 to 1.6 µg [90]. As the pH increased, the average surface charge of goethite and kaolinite decreased to a less positive quantity (not reported) and adsorption occurred; thus, electrostatic interactions play a crucial role in PFOS adsorption onto goethite and kaolinite. In further research of pH effects on adsorption of other perfluorinated surfactants (PFOA, PFHxS, and perfluorohexanoic acid (PFHxA) onto kaolinite, montmorillonite, and hematite, it was observed that, as the pH increased in aqueous solution, the amount of these perfluorinated surfactants that adsorbs onto these mineral surfaces decreased [78,96]. For example, from pH 2.3 to 11.2, the adsorbed amount of PFOA on kaolinite, montmorillonite, and hematite was ~24 µg/g (pH 2.3) and ~16 µg/g (pH 11.2), ~23 µg/g (pH 2.2) and ~12 µg/g (pH 11.2), and ~28 µg/g (pH 2.2) and ~18 µg/g (11.2), respectively [96]. In the adsorption of tetraethylammonium perfluorooctylsulfonate (TEA-FOS) onto hydroxylated germanium, the adsorbed amount (per surface area) decreased from 28.7 µg m−2 at pH 3.4, to 7.58 µg m−2 at pH 10 [98]. Figure 8 also shows the adsorption of PFOS onto nanosize alumina NPs and NWs to decrease as the solution pH increases. The adsorption of PFOS onto alumina NPs decreased from 230 µg/g at pH = 4 to 100 µg/g at pH = 10. For alumina NWs, PFOS adsorption decreased from 25 µg/g at pH = 4 to 0 µg/g at pH = 10 [87]. According to the authors, when the pH increased from 4 to 10, the surface charge of the alumina NPs and NWs decreased toward the neutralization of the positive charge on these surfaces [87]. At these increased pH levels, the negatively charged PFOS head-groups interact minimally with the neutralized alumina surfaces; thus, the adsorption decreased [87].

5.2. Presence of Na+, Ca2+, and Other Ions in the Aqueous Environment

Fluorinated surfactants often exist in saltwater environments, in the presence of Na+ and Ca2+, which can affect the adsorption onto mineral surfaces. Figure 9 shows the effects of Na+ and Ca2+ ions on the adsorption of PFOS, PFOA, PFHxS, and PFHxA onto montmorillonite, kaolinite, and hematite surfaces [96]. In the presence of Na+ and Ca2+ ions at concentrations of 0.01–10 mM (CaCl2) and 0.1–100 mM (NaCl), the PFOS adsorbed amount increased. Specifically, the PFOS adsorbed amount onto montmorillonite, kaolinite, and hematite in the absence of Na+ and Ca2+ ions was ~19, ~21, and ~42 µg/g, respectively. In the presence of 100 mmol/L Na+ and 10 mmol/L Ca2+, the PFOS adsorption onto montmorillonite, kaolinite, and hematite increased to ~24, ~23, and ~59 µg/g, and ~23, ~27, and ~56 µg/g, respectively [96]. These and related data are reported in Table 2, where the adsorption results differ at varying Na+ and Ca2+ concentrations. Zhao et al. [96] further reported that, in the absence and in the presence of 100 mmol/L Na+ or 10 mmol/L Ca2+ ions, the amount of PFHxS adsorbed onto montmorillonite and kaolinite remained constant at ~29 and ~26 µg/g. The adsorption of PFHxS onto hematite increased from ~30 to 34 µg/g (Na+ ions) and from ~31 to 34 µg/g (Ca2+ ions) when there was 0–100 mmol/L Na+ or 0–10 mmol/L Ca2+ ions present in the solution [96]. The data show that the adsorption of PFHxS was less significant than the adsorption of PFOS was onto the same mineral surfaces. Zhao et al. [96] also investigated the adsorption of PFOA and PFHxA onto montmorillonite, kaolinite, and hematite, and the results of such experiments were similar to the results of PFHxS adsorption onto the same mineral surfaces: In all cases, there was little to no increase in adsorption when Na+ and Ca2+ ions were present in the solution. Kaolinite and hematite surfaces are both negatively charged, so as the Na+ and Ca2+ concentration in the aqueous solution increased from 0 to 100 mmol L−1 and 0 to 10 mmol L−1, respectively, the electrostatic repulsion between PFOS and kaolinite and hematite decreased (by an unreported amount), which caused an increase in adsorption, by ~5–15 µg/g [96]. Montmorillonite surfaces are positively charged, so, as the Na+ and Ca2+ concentration increased, the electrostatic attraction between PFOS anions and the montmorillonite surface weakened, which was caused by the electrical double layer compression effect [96]. Due to this, the PFOS adsorption onto montmorillonite did increase with the increase of Na+ and Ca2+ in the solution, but only by a small amount, i.e., about 3–5 µg/g.
PFOS adsorption onto marine sediments in saline environments was investigated in order to determine whether or not Na+ and Ca2+ ions had an impact on the adsorption [42,65,96]. The PFOS adsorption affinity for marine sediments in saline environments was found to be ten times higher than the PFOS adsorption in freshwater environments [65]. These marine sediments are typically negatively charged because they contain carboxyl and phenolic groups that are ionized [65]. Metal ions in the saline environments typically decrease the repulsion between PFOS and the marine sediment surfaces, which favors adsorption. Chen et al. [65] did not use adsorption isotherms to explain the adsorption of PFOS onto marine sediments, and they did not report the structure of the adsorbed PFOS layer either. Chen et al. [65] examined the influence of ionic composition on the concentration-specific distribution coefficient (Kd), which can be expressed by equation 12:
Kd = CS/CW
where CS is the amount of PFOS adsorbed onto the marine sediments (µg/kg), and CW is the PFOS concentration in the aqueous solution.
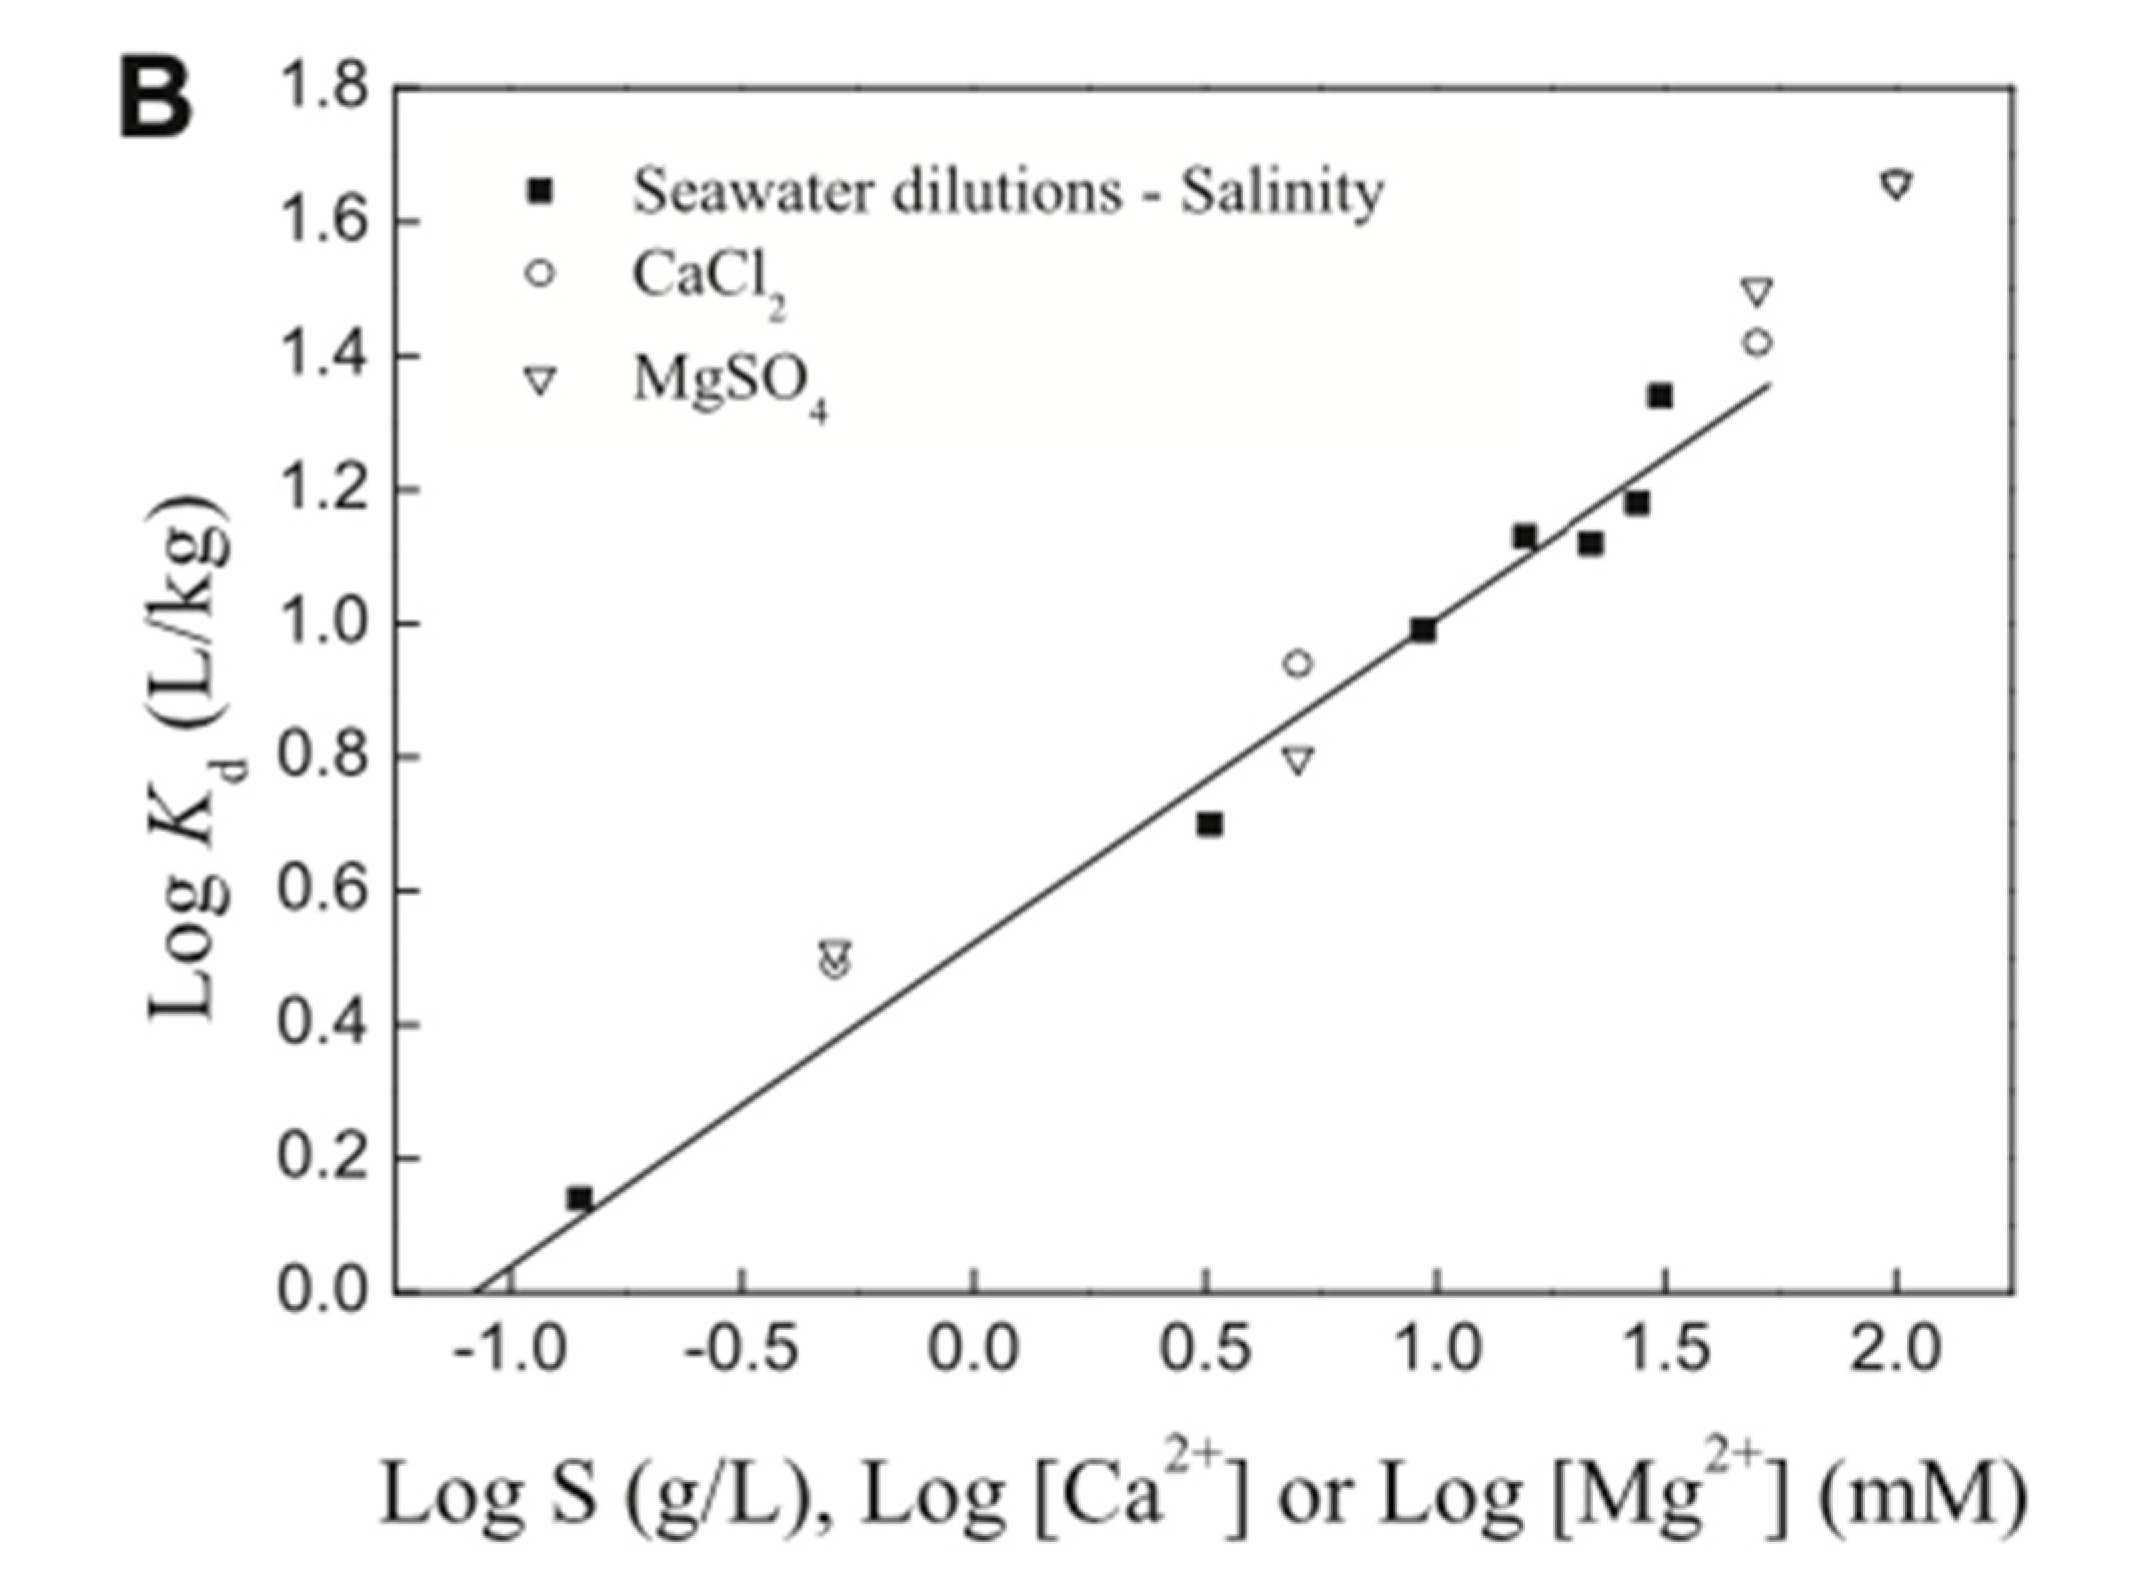
Chen et al. reported that increasing log[Ca2+] and log[Mg2+] values produced higher Kd values than log[Na+] and log[K+]. At log[Na+] = 1.7 mM and log[K+] = 2 mM, logKd was 1.18 L/kg and 0.7 L/kg, respectively. At log[Ca2+] = 1.6 mM and log[Mg2+] = 2 mM, logKd was 1.4 L/kg and 1.7 L/kg [2]. It can be seen in Figure 10 that the divalent ions produced larger logKd values than the monovalent ions at the same concentrations of Na+, K+, Ca2+, and Mg2+. According to Chen et al. [65], these results suggest that Na+ ions and K+ ions caused an increased PFOS adsorption onto marine sediments, but the presence of divalent ions, such as Ca2+ and Mg2+, caused more of an increase in PFOS adsorption than the monovalent ions. Although the increased adsorbed amounts of PFOS on the marine sediments in the presence of monovalent and divalent ions were unreported, Chen et al. [65] wanted to convey that larger logKd values indicated that more PFOS molecules adsorbed onto marine sediments, which was more evident from the logKd values exhibited by the divalent ion present during such experiments. This work helps to inform on the fates of various PFAS in marine settings.
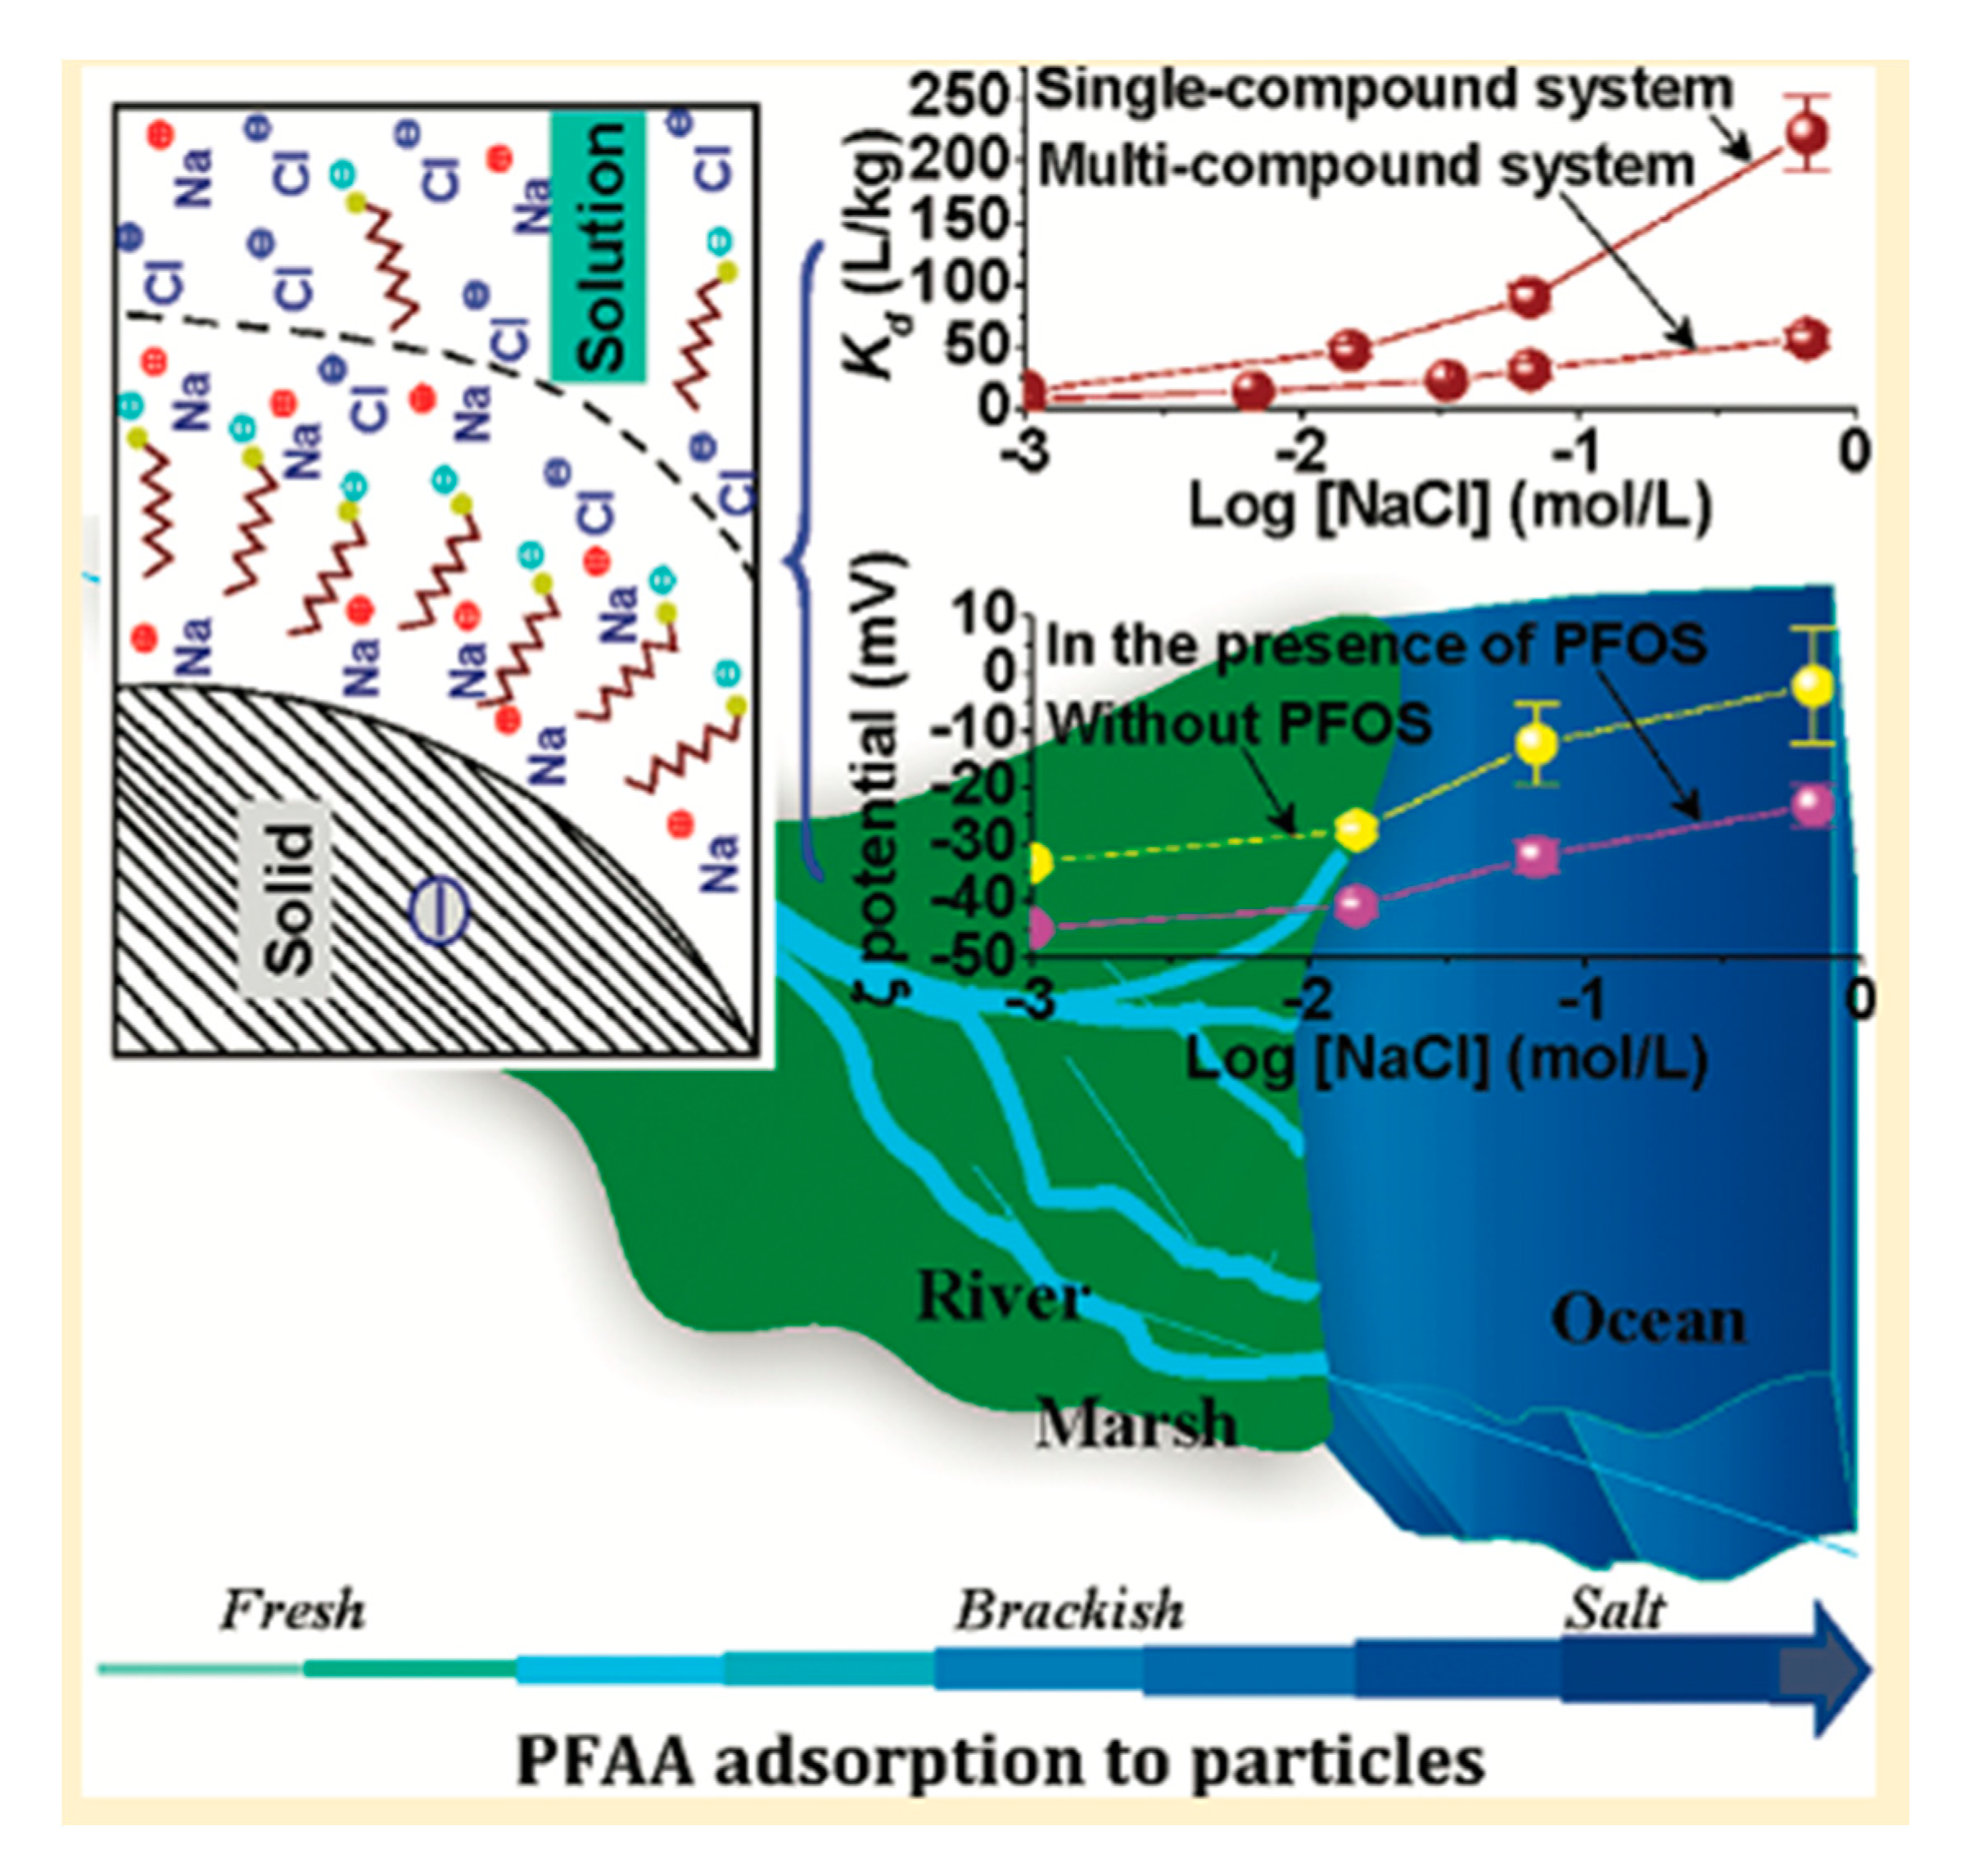
Xiao et al. [42] examined Na+ ions effect on the competitive adsorption of various perfluorinated surfactants onto kaolinite. As seen in the graph to the top right on Figure 11, from 0.001 to 1 mol/L NaCl the solid–water distribution coefficient (kd) value was measured in a system with only PFOS present and also in a system with multiple PFAS present: PFOS, PFOA, PFNA, perfluoroheptanoic acid (PFHpA), perfluorodecanoate acid (PFDA), and perfluoroundecanoate acid (PFUnDA). Based on the reported logkd (L/kg) values, when the NaCl concentration was increased, the adsorption of PFAS onto kaolinite increased, but the adsorption increase was more significant in the case when PFOS was alone in the system with NaCl than it was for the multi-PFAS system [42]. This is quantifiable by the logkd (L/kg) of PFOS, where there was a 30% decrease from 1.16 to 0.88 (L/kg) from the single-component system (PFOS alone) and the multi-component system (all PFAS present) [42]. Lower adsorption of perfluorinated surfactants in the multi-PFAS system was attributed to active site competition on the kaolinite surface, where electrostatic effects caused the observed competitive adsorption. These results indicated that, as the Na+ concentration in aqueous solutions increased from 0.001 to 1 mol/L, so would (to an unreported amount) the adsorption of PFOS, PFOA, PFNA, PFHpA, PFDA, and PFUnDA onto kaolinite [42]. As seen on the middle right graph on Figure 11, the zeta potentials of kaolinite, both with and without the presence of PFOS, were negative, as NaCl concentrations increased from 0.001 to 1 mol/L. Xiao et al. [42] observed that short-chain PFAS surfactants adsorbed very little onto mineral surfaces in freshwater environments (Figure 11). In saltwater environments, however, the increase in Na+ ions screened electrostatic repulsions, which promoted the adsorption of short-chain PFAS surfactants onto mineral surfaces. The adsorption characteristics of fluorinated surfactants in the presence of Na+, Ca2+, and other ions are crucial to understand PFAS behavior in saltwater environments.

5.3. Humic Acid Presence during Adsorption

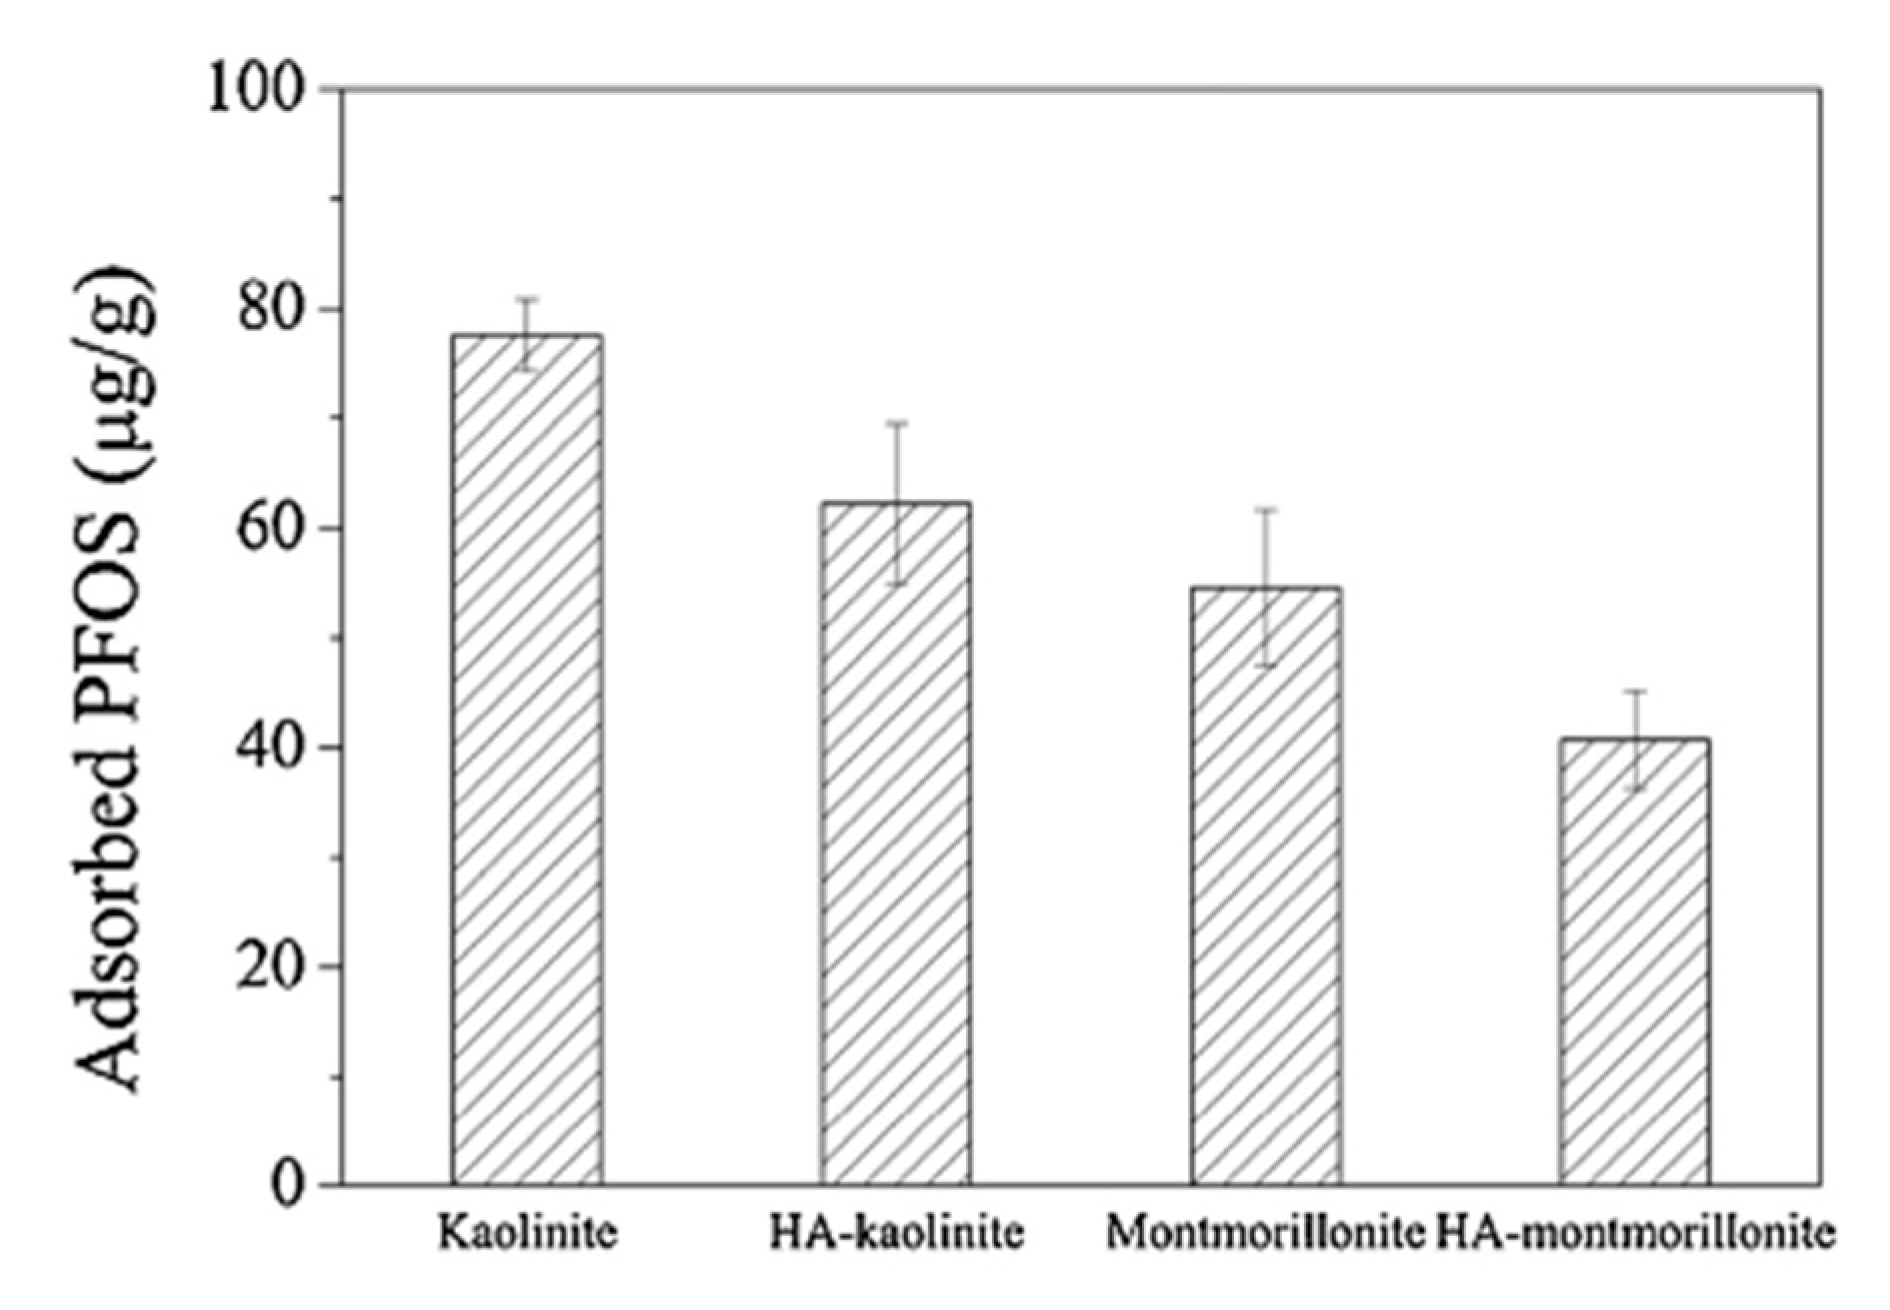
Humic acid (HA) is a naturally occurring organic substance that plays an important role in various physical and chemical process within soils and aquatic environment [78,79,105,106]. Examining the role of HA in pH control and adsorption is important when studying fluorinated surfactant adsorption onto mineral surfaces. The HA concentration varies at different locations in these natural environments, which, in turn, can indicate the major locations where fluorinated surfactants adsorb onto mineral surfaces. Researchers have examined the effects of HA on the adsorption of PFOS onto kaolinite and montmorillonite surfaces (Figure 12) [78]. In a 100 mg/L HA aqueous solution with pH ~7, the amount of PFOS adsorbed onto the kaolinite and montmorillonite surfaces decreased from ~79 µg/g (no HA present) to ~61 µg/g for kaolinite, and from ~58 to ~43 µg/g for montmorillonite [78]. Table 2 allows the comparison of various sets of data in the absence of HA and in the presence of HA. The amount of HA adsorbed by these mineral surfaces was not reported. The decreased PFOS adsorption on both these mineral surfaces in the presence of HA was attributed to HA coating the kaolinite and montmorillonite surfaces, which inhibited PFOS adsorption [78,79]. HA occupied adsorption sites on kaolinite and montmorillonite, which, in turn, increased the electrostatic repulsion between the PFOS molecules and the mineral surfaces in question. It was also observed that the PFOS adsorption onto boehmite was inhibited by an increased HA concentration in water [92]. From 0 to 50 mg/L HA, the PFOS adsorbed amount onto boehmite decreased from ~0.09 to 0.018 µg m−2 [92]. The amount of HA adsorbed on the boehmite surface was not reported.
When an abundance of HA had been already equilibrated with suspended metal oxide surfaces, such as SiO2, Fe2O3, and Al2O3, very little PFOA could adsorb onto these surfaces [79]. Figure 13e depicts that HA covers the metal oxide surface in a manner that PFOA molecules cannot access/adsorb onto it. In the absence of HA, the adsorbed amount of PFOA onto SiO2, Fe2O3, and Al2O3 was 0.85, 0.97, and 1.72 µg m−2, respectively [79]. In the presence of ~5.0 mg/L HA, the amount of PFOA adsorbed onto SiO2, Fe2O3, and Al2O3 was much lower: 0.08, 0.07, and 0.07 µg m−2, respectively [79]. The ability of humic acid to occupy adsorption sites on mineral surfaces can be used as a “natural” means to inhibit fluorinated surfactant adsorption onto mineral surfaces into freshwater environments.
The above results, where HA had been pre-adsorbed onto mineral surfaces, are different in the case where PFAS and HA are introduced concurrently. When PFAS and HA are introduced together into an aqueous system with suspended minerals, PFAS such as PFOA can adsorb onto the surfaces of such minerals. Figure 13d shows the concurrent adsorption of PFOA and HA onto a mineral surface, where it can be seen that both PFOA and HA molecules reside on such mineral surface. Yang et al. [79] examined the adsorption of PFOA onto various metal oxides, such as SiO2, Fe2O3, and Al2O3, in the presence of HA. At an aqueous concentration of ~700 µg/L PFOA with 10 mg/L HA and ~1.1 µg/m2 PFOA, along with an unreported amount of HA, they were found to adsorb onto SiO2 [79]. This was also seen when adsorbing PFOA and HA concurrently onto Al2O3 and Fe2O3. When PFOA and HA were added into the system at the same time, a “competitive partition” allowed PFOA onto the metal oxide surfaces. The hydrophobic moieties of PFOA and HA interacted with each other, which allowed PFOA and HA to “commingle” before they then concurrently co-adsorbed onto the metal oxide surfaces [79]. According to Yang et al. [79], when PFOA and HA are concurrently introduced, the PFOA adsorption onto mineral surfaces is about the same as when PFOA is adsorbed in the absence of HA.

5.4. Surfactant Chemistry

When examining the factors that affect the adsorption of fluorinated surfactants onto minerals, it important to note that the surfactant chemical structure (e.g., length of the C—F chain and surfactant head-group) has an effect on adsorption. For example, in an environment with the same mineral surface and solvent, different fluorinated surfactants adsorb to a different extent (or do not adsorb at all) onto these surfaces [42,66,84]. More specifically, there have been investigations on the adsorption of multiple PFAS with varying chain lengths onto the same mineral surface at similar experimental conditions, i.e., in the same solvents, temperature settings, salt concentrations, etc. [66]. Such studies provide insights on chain-length effects during adsorption. Investigations of PFAS surfactants with similar chain length but different head-groups offer insights on head-group effects during adsorption [42].
The adsorption of several individual PFAS surfactants (PFBA, PFBS, perfluoropentanoic acid (PFPeA), PFHxA, PFHxS, PFHpA, PFOA, PFOS, PFNA, and PFDA, with C—F chain lengths of 3, 4, 5, 5, 6, 6, 7, 8, 8, and 9, respectively) onto an organosilica adsorbent known as swellable organically modified silica (SOMS) in deionized water, at an unspecified temperature and pH, has been investigated [66]. The maximum adsorption capacity for PFBA, PFBS, PFPeA, PFHxA, PFHxS, PFHpA, PFOA, PFOS, PFNA, and PFDA was 0, ~2, ~3, ~3, ~1, ~3.5, ~4, ~6, ~4.5, and ~6.5 mg of adsorbate per g of adsorbent, respectively [66]. The above data are organized in Table 2, where additional adsorption data are reported from adsorption experiments conducted in only deionized water and (in separate experiments) in the presence of 50 mM NaCl in the aqueous solution. These results demonstrate a higher adsorption for the PFAS with longer C—F chain lengths. It was proposed that the increased adsorption onto SOMS of longer-chain PFAS, such as PFOA, PFOS, PFNA, and PFDA, was primarily driven by hydrophobic interactions of the longer C—F chains with the SOMS surface, which can take place in freshwater settings (neutral pH, no salt added) [66]. Typically, the shorter-chain PFAS surfactants, such as PFBA and PFBS, exhibit little to no adsorption in freshwater settings, due to minimal hydrophobic interactions, but, in saltwater settings, they are more compelled to adsorb onto mineral surfaces via ionic interactions [42,66].
A study on the effects of PFAS chain length during competitive adsorption of PFHpA, PFOA, PFNA, PFOS, PFDA, and PFUnDA onto kaolinite found that longer-chain PFAS typically out-competed the shorter-chain PFAS during adsorption when these PFAS were mixed together in an aqueous solution in the presence of 1 mM NaCl and NaHCO3 at pH = 7.5 [42]. This was determined on the basis of the logarithm of the solid–water distribution coefficient (logKd) values of the six PFAS. The reported logKd values of PFHpA, PFOA, PFNA, PFOS, PFDA, and PFUnDA in the multi-compound system were as follows: NA (not applicable), ND (not detectable), 0.30 ± 0.11, 0.88 ± 0.03, 1.05 ± 0.04, and 1.72 ± 0.04 L/kg, respectively [42]. The higher logKd values exhibited by the longer-chain PFAS indicated more adsorption onto kaolinite over the shorter-chain PFAS. According to the authors, the longer-chain PFAS out-competed the shorter-chain PFAS on active sites because of a stronger hydrophobic effect exhibited by the longer-chain PFAS [42]. Lower adsorption of short-chain PFAS in the multi-PFAS system is attributed to active site competition between PFAS on the kaolinite surface, and electrostatic effects. Once the longer-chain PFAS have adsorbed onto the kaolinite surface, shorter-chain PFAS cannot adsorb, because they are electrostatically repelled by the longer-chain adsorbed PFAS [42].
The type of head-group on fluorinated surfactants can be an important factor in adsorption. Table 2 facilitates the comparison of PFAS with the same C—F chain length but different head-group, adsorbing onto to the same mineral surface, under similar experimental conditions. For example, PFOS and PFNA both have 8-carbon C—F chains, but PFOS has a sulfonate head-group, and PFNA has carboxylic acid head-group. Both PFOS and PFNA have been investigated for adsorption on mineral surfaces [12,42,66,85]. Hellsing et al. reported that 0.0035 µg m−2 PFOS and 0.0058 µg m−2 PFNA adsorbed onto alumina (Al2O3) from an aqueous solution at 300 K [12]. Hellsing et al. compared a few characteristics of both PFOS and PFNA during adsorption onto alumina surfaces. The molecular mass of PFOS (500.13 g mol−1) and PFNA (464.08 g mol−1) are both similar, and both surfactants formed densely layered structures on alumina surface. The adsorbed layer of PFOS and PFNA resembled that of a bilayer structure, where a higher concentration of PFOS and PFNA resided at the alumina surface than in the bulk solution. Moreover, the volume fraction of both PFOS and PFNA that resided on the adsorbed layer increased from 0.2 to 0.6 as the bilayer formed, where the remaining volume fraction was water [12]. Hellsing et al. considered the adsorption of PFOS and PFNA to be similar, and they concluded that the differences in head-groups between the two surfactants did not affect adsorption on alumina surfaces [12]. We note, however, that the PFNA adsorbed amount on alumina was about double that of PFOS [12]. Furthermore, Shafique et al. reported that 1.20 × 10⁻² µmol m−2 PFOS and 6.60 × 10⁻⁴ µmol m−2 PFNA adsorbed onto a silica glass surface, at a pH of 5, in room temperature [85]. In this case, the PFNA adsorbed amount on silica was about 20 time less that of PFOS [85]. We can thus conclude that any comparison between head-groups should be done in the context of the specific surface with which the head-groups interact.
When examining the adsorption of fluorinated surfactants onto solid surfaces, one should take into consideration the possible self-assembly in solution of the surfactant molecules into micelles, commencing at surfactant concentrations above the critical micelle concentrations (CMC) [107]. For ionic surfactants, the CMC reflects the balance between hydrophobic “attraction” of the surfactant tail which promotes micellization, and electrostatic repulsion of the surfactant head-groups which opposes micellization [108]. In the micelles, the surfactant hydrophobic parts associate away from the aqueous medium, while the head-groups come in close proximity on the micelle surface, thus creating a local environment which may be competitive to or synergistic to surface adsorption. Indeed, surfactant solution concentrations either below or above the CMC can change the results of adsorption [109,110]. Evenas et al. examined APFO adsorption onto alumina, where they report that, above the APFO CMC (33 mM), the adsorption of APFO onto alumina plateaued at ~5.1 µmol m−2 [83]. As the initial APFO concentration in the aqueous solution increased from below CMC to reach the CMC, the adsorbed amount of APFO on the alumina surface increased until it reached the aforementioned plateau adsorbed concentration [83]. Although this is one case where the adsorption of a PFAS surfactant onto a mineral surface changes below and above the surfactant CMC, there is a lack of research/knowledge pertaining to the effects of the CMC during the PFAS adsorption process onto various mineral surfaces. It is worth noting that the CMC can change (in fact, it can decrease significantly) when the surfactant is brought in proximity with surfaces, e.g., particles or porous materials [80,109,110]. In fact, micelles can form on the surface and can, thus, accommodate more PFAS molecules and increase their adsorbed amount; however, such adsorbed micelles can also block other PFAS from diffusing into porous materials [64].
Manufacturers have been synthesizing and selling PFAS with short C—F chains, specifically perfluorobutanoic acid (PFBA) and perfluorobutane sulfonate (PFBS), which adsorb less onto mineral surfaces than longer-chain PFAS in freshwater environments [42,43,66]. As discussed previously, no PFBA adsorbed onto SOMS surfaces, while PFBS adsorbed very little on the same surface in deionized water with no salt present [66]. Furthermore, in a freshwater setting ~0.01 mmol g−1 PFBS adsorbed onto 0.5 cation exchange capacity montmorillonite surface, (0.5CEC-Mt, where 0.5 denotes the molar ratio of 10 g sodium-montmorillonite and hexadecyltrimethylammonium bromide/CEC), compared to 0.65 mmol g−1 PFOS adsorbing onto the same surface [84]. The much higher adsorption of PFOS was attributed to the hydrophobic interactions’ increase and water solubility decrease upon C—F chain length increase [84].

6. Adsorption Kinetics

Adsorption kinetics follow the adsorption processes over time, until adsorption equilibrium is reached. The kinetics of adsorption vary among different adsorption scenarios and can be described by using different kinetic models, which include pseudo-first-order, pseudo-second-order, and intra-particle diffusion [64,111]. In what follows, we review adsorption kinetics for various adsorbates and adsorbents, as affected by pH changes, and the size and physical characteristics of the adsorbent [13,87,98].
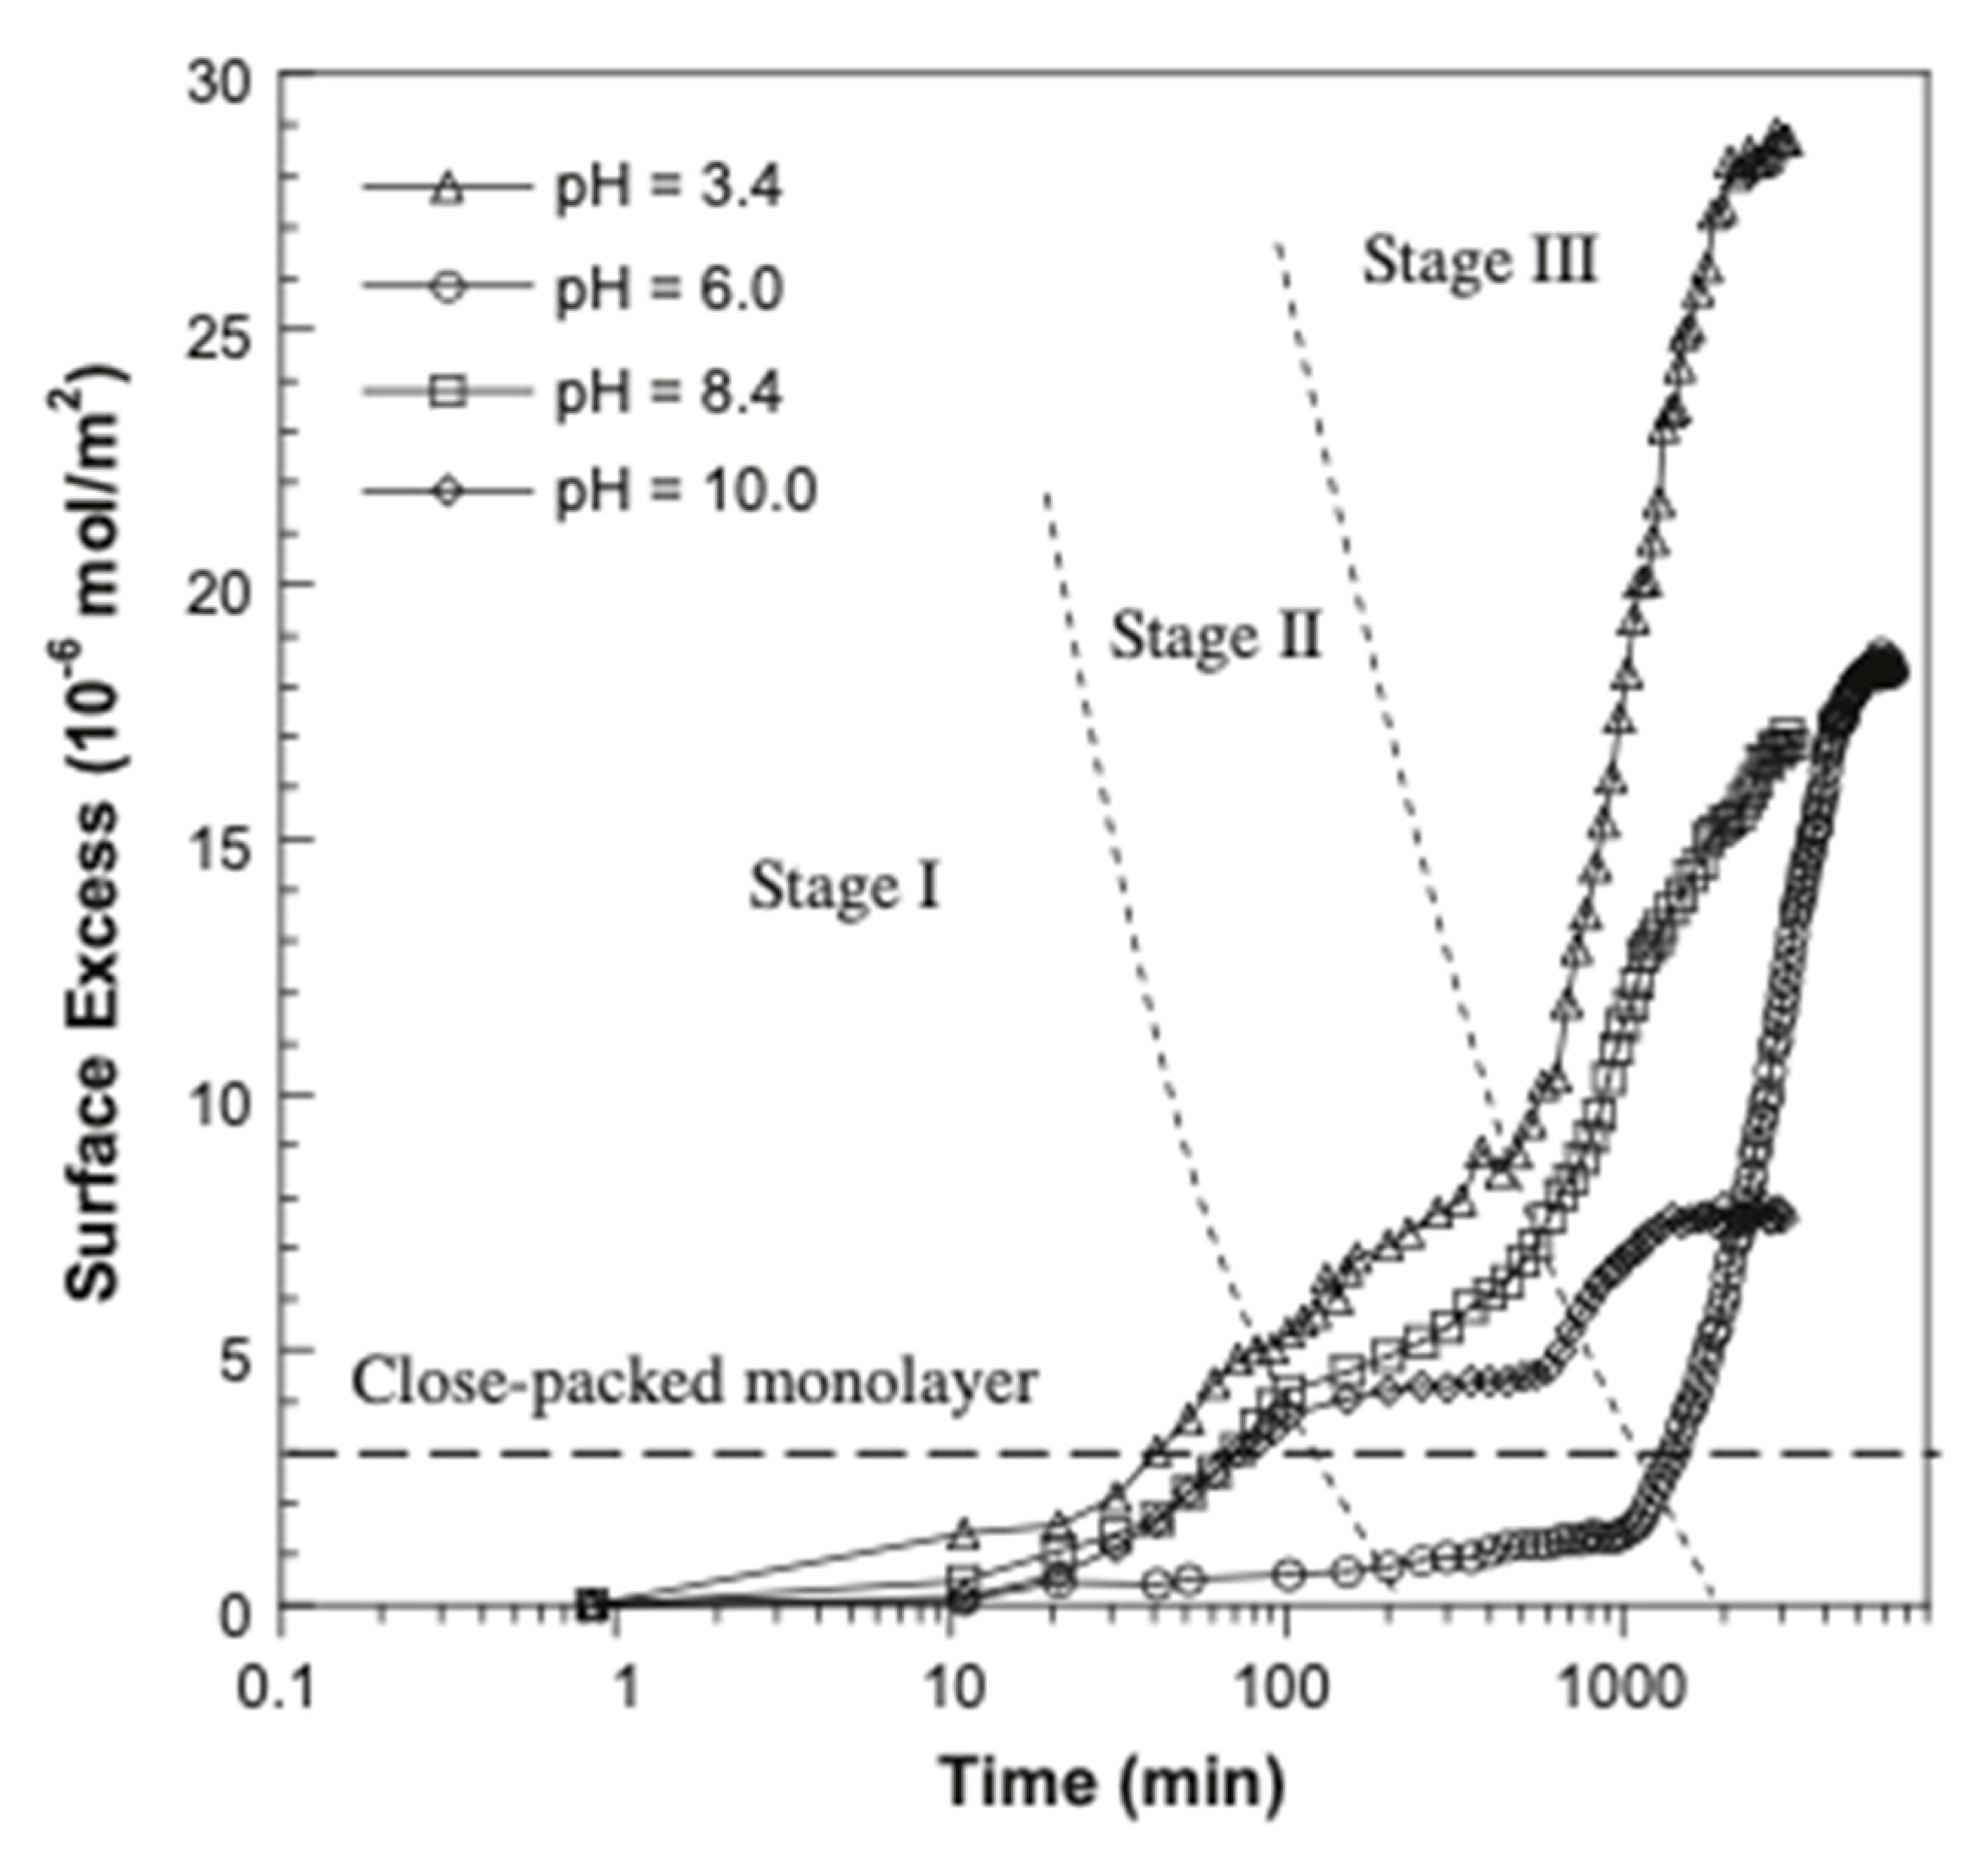
The kinetics of tetraethylammonium perfluorooctylsulfonate (TEA–FOS) adsorption onto hydroxylated germanium and the effects of pH were examined by Xing et al. [13,98]. Three stages were identified: in the first stage, TEA–FOS was rapidly adsorbed onto the surface, followed by a slowdown [98]. The second (middle) stage of adsorption was much slower than the first stage, where the rate of adsorption was constant; the second stage duration increased as the solution TEA–FOS concentration decreased [13]. The third stage began with a “sudden” increase in the adsorption rate; the third stage had the longest duration and exhibited Langmuir-like kinetics until adsorption values became constant [98]. Three-stage adsorption kinetics are typically not exhibited by surfactants, which usually exhibit two-step Langmuir adsorption kinetics. [13,98,112]. Figure 14 shows these three stages during adsorption of TEA-FOS on germanium [98]. At pH 6, it took about 5000 min for adsorption to reach equilibrium. A pH change from 6 to either 3 or 8.4 (adding either HCl or NaOH) reduced the time to reach TEA-FOS adsorption equilibrium from 5000 to ~3000 min. The conditions considered for the time required for the adsorption of TEA-FOS onto germanium to reach equilibrium were the initial aqueous TEA-FOS concentration of 0.5 mM, pH levels of 3 or 8.4, and absence or presence of 1 mM NaCl in the solution. The pH changes from pH 6 to either a pH of 3 or 8.4 increased the initial rate of adsorption. Moreover, ~9 (10−6 mol m−2) (at 3.4 pH) and ~7 (10−6 mol m−2) (at 8.4 pH) TEA-FOS were adsorbed onto germanium surfaces during the first two stages, as compared to ~3 (10−6 mol m−2) when the solution pH = 6 [98]. The shorter equilibration time at pH 3.4 and 8.4 was due to the negatively charged FOS having repulsive interactions with the germanium surface, and also due to the charge density of the germanium surface increasing. The change in pH above or below pH = 6 determined the duration of the second and third stages during TEA-FOS adsorption [98]. Specifically, the total duration of the second stage decreased from 900 min to ~150 min when the pH changed to either 3.4 or 8.4. The duration of the third stage was about 2650–4000 min, depending on the pH. The change in pH also significantly increased the adsorption rate during the third stage of adsorption (Figure 14), until adsorption equilibrium was reached [98]. The adsorbed layer structure also changed between stages: in stage I, a TEA-FOS monolayer formed onto the germanium surface; in stage II, the TEA-FOS molecules formed admicelles; and a multilayer structure of TEA-FOS admicelles formed in stage III [13,98].
The kinetics of TEA-FOS adsorption on germanium in saline environments of 0, 1, 2, 5, 10, 20, or 50 mM NaCl at pH of 3.4 or 10 were also examined [98]. The duration of the first and second stages of adsorption was about ~600–800 min upon a NaCl concentration increase to 5 mM. After ~3000 min, the amount of TEA-FOS adsorbed onto germanium increased from 28.7 µmol m−2 (pH 3.4) and 7.58 µmol m−2 (pH 10), when there was no NaCl present in the solution, to 42.9 µmol m−2 (pH 3.4) and 21.0 µmol m−2 (pH 10), when the solution contained 5 mM NaCl. When the NaCl concentration was 10 mM, the adsorption rate decreased (to an unreported amount), as compared to when there was 0–5 mM of NaCl in the solution. The amount of TEA-FOS adsorbed onto germanium decreased from 25.8 µmol m−2 (pH 3.4) and 19.6 µmol m−2 (pH 10), when the solution contained 10 mM NaCl, to 6.5 µmol m−2 (pH 3.4) and 9.8 µmol m−2 (pH 10), when the solution contained 50 mM after ~3000 min. The decrease in TEA-FOS adsorption rate occurred because of excess NaCl in the bulk solution, where the NaCl “shields” an attraction between TEA-FOS molecules and the germanium surface [98]. This was clearly present when the solution contained 50 mM NaCl in both 3.4 and 10 pH settings. As the pH increased from 3.4 to 10, the TEA-FOS adsorption onto germanium decreased, which was attributed to the germanium surface charge being negative, which resulted in a decrease in the duration (by an unreported amount) of the second stage of adsorption [98].
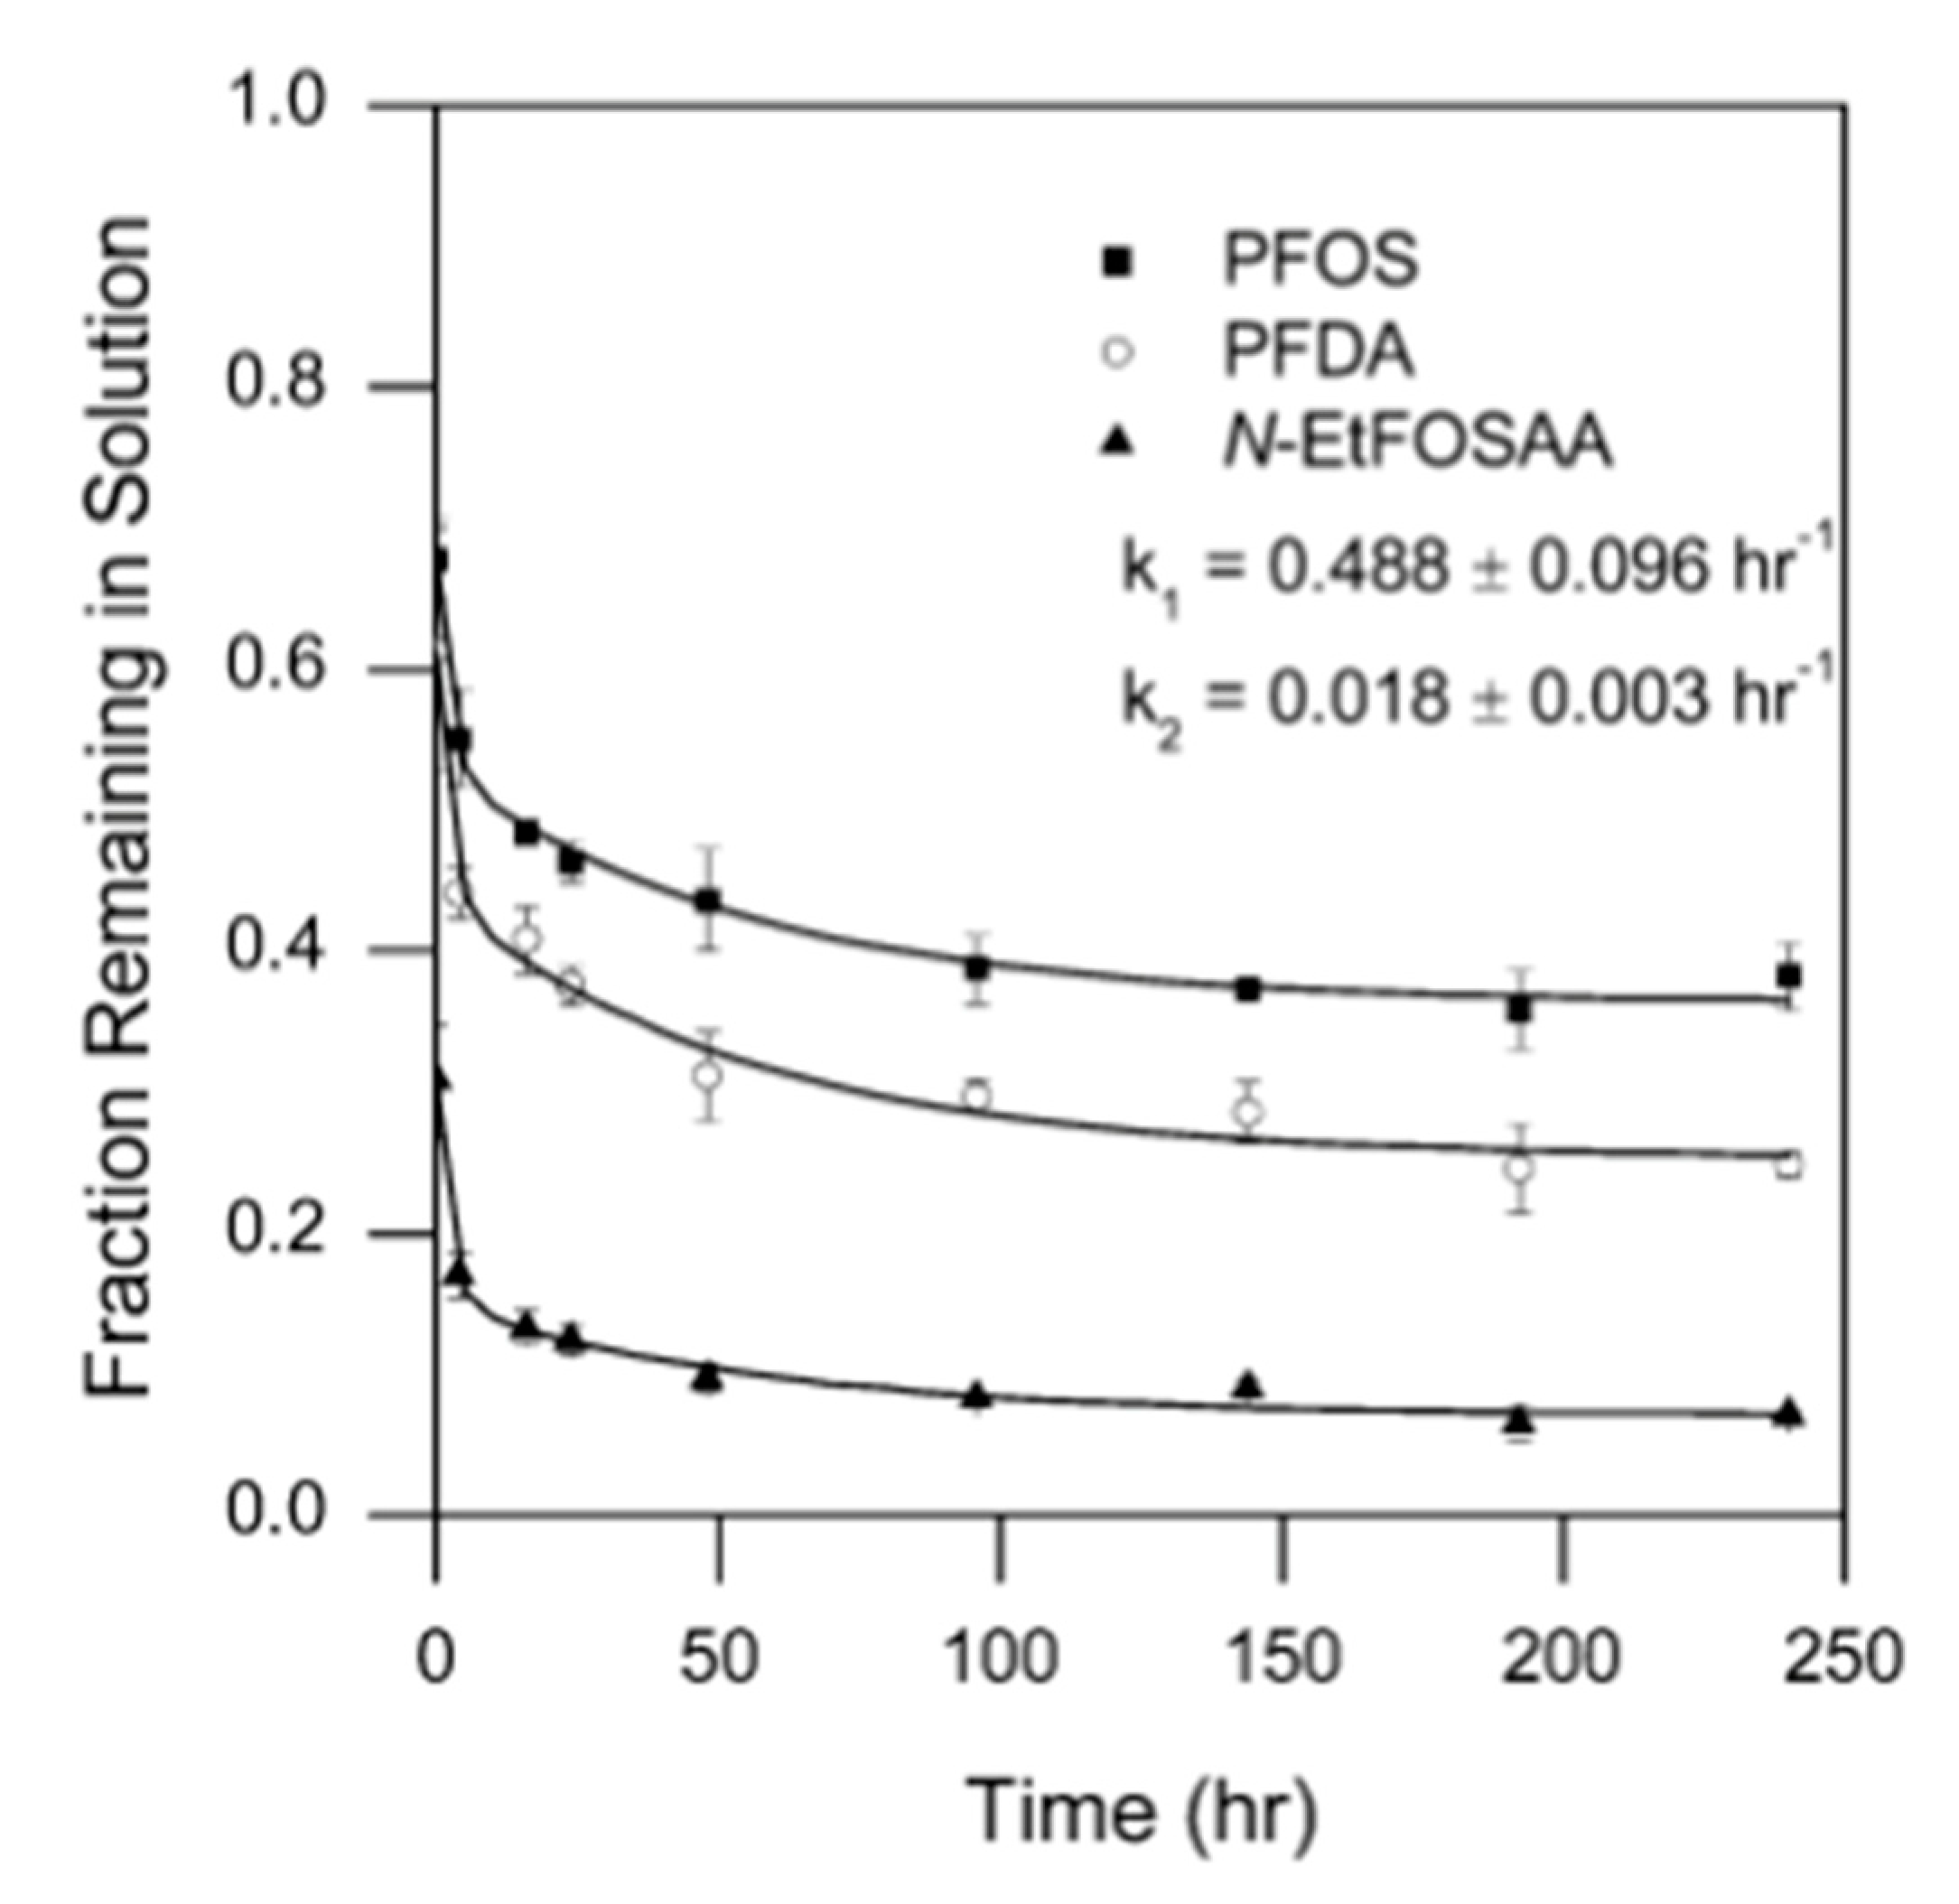
Higgins et al. [113] researched the adsorption kinetics of various fluorinated surfactants onto sediments found in freshwater settings. As seen in Figure 15, the adsorption of PFOS, PFDA, and 2-(N-ethylperfluorooctanesulfonamido) acetic acid (N-EtFOSAA) onto “sediment 1” increased over time, until adsorption equilibrium was reached, following several days of mixing [113]. Moreover, 65–70% of the PFOS, PFDA, and N-EtFOSAA adsorption onto “sediment 1” occurred at 50 h of mixing (for equilibrium to be reached, the sorption experiments ran for ~250 h). Excluding an initial period of rapid adsorption, the kinetic data were described by bi-exponential expressions, with fast k1 and slow k2 uptake rates:
Fw = Fo + F1 ∗ exp(−k1t) + F2 ∗ exp(−k2t)
The fluorinated surfactants examined exhibited similar rate constants, which indicated that the kinetics were similar for PFOS, PFDA, and N-EtFOSAA, where there was significant adsorption. The kinetic characteristics of the PFOS, PFDA, and N-EtFOSAA suggest that initially there was a fast transfer of fluorinated surfactants to the surface boundary layer of “sediment 1”. Once this occurs, PFOS, PFDA, and N-EtFOSAA proceed to a two-step diffusional transport into the “internal water and/organic matter” found in the aggregates of “sediment 1” [113].
Adsorption kinetics of PFOS onto alumina nanoparticles (NPs) and nanowires (NWs) were examined by Jian et al. [87]. At pH = 6, PFOS adsorption was fast, and equilibrium was reached in about 30 min [87]. The short adsorption time indicated that there was no intra-particle diffusion, because the alumina NPs and NWs dimensions were 13 nm (NPs), 2–6 nm (NWs diameter), and 13 nm (NWs length). The maximum adsorbed amount of PFOS onto the alumina NPs at 30, 40, and 50 °C was 589, 485, and 447 mg PFOS per gram of alumina NPs, respectively. The maximum amount of PFOS adsorbed onto the alumina NWs at 30, 40, and 50 °C was 368, 288, 343 mg PFOS per gram of alumina NW, respectively [87]. Jian et al. [87] assumed that if the initial concentration of PFOS in the system was larger, the adsorption duration would be longer, based on Nassar [114], who investigated the adsorption of asphaltenes on alumina nanoparticles, but Jian et al. did not confirm this assumption. Equations (14) and (15) were used to evaluate adsorption kinetics [66,87]:
ln(qe − qt) = lnqe − k1
t/qt = 1/(k2 ∗ qe2) + 1/qe
Equation (14) is pseudo-first-order, and Equation (15) is a pseudo-second-order equation, where qe denotes the quantity of PFOS adsorbed per unit mass of alumina NP and NW at equilibrium, qt is the quantity of PFOS adsorbed per unit mass of alumina NP and NW at time (t), and k1 and k2 are the rate constants of pseudo-first-order and pseudo–second-order models. The PFOS adsorption data fitted the pseudo-second order model better, suggesting that the PFOS adsorbed amount was greater for the alumina NPs than it was for the alumina NWs, and indicating that the particle shape had an influence on the adsorption kinetics [87]. Alumina NPs and NWs cluster together in solution, where clustering of NPs forms “tight aggregates”, whereas the clustering of NWs forms “loose aggregates”. A higher amount of PFOS was able to electrostatically adsorb on the alumina NPs, because NPs “tight aggregates” were able to “trap” more PFOS molecules than the NWs “loose aggregates” [87]. PFOS and PFOA adsorption onto alumina surfaces that were micrometer-size instead of nanometer-size was investigated by Wang et al., who reported that the adsorption equilibrium was reached after 48 h. It can be concluded that PFOS and PFOA adsorption onto alumina surfaces, whether they are nanosize or larger, is a fast process [87,97].

7. Conclusions

Fluorinated surfactants, which are persistent and often toxic compounds, have made their way into the soil, freshwater, and saltwater environments. In response, the removal of PFAS from aqueous environments through the use of granular activated carbon, zeolite, or sludge has been extensively researched [22,56,64]. The adsorption of PFAS onto mineral surfaces is a topic of interest, since PFAS have an affinity for mineral surfaces commonly found in nature. Since PFAS have been shown to adsorb onto such mineral surfaces, research has been carried out to better understand this occurrence, in order to gain better insight on the fate and transport of these toxic compound in different environmental settings. Although promising results have been generated, researchers have continued to study the adsorption of PFAS surfactant onto mineral surfaces, in order to better understand the process, so that experts can remove these compounds from nature.
Adsorption isotherms can be used to indicate the adsorbed amount of PFAS surfactants onto mineral surfaces. PFOS, PFOA, PFNA, PFBS, etc., typically exhibit type I (monolayer) adsorption isotherms when they adsorb onto surfaces such as alumina, silica, iron oxide, and titanium oxide. The adsorbed layer structure is typically inferred from the features of the adsorption isotherm; however, structural characterization studies are lacking. The mechanisms commonly active during PFAS adsorption onto mineral surfaces are electrostatic interactions, hydrophobic interactions, hydrogen bonding, and ligand and ion exchange. Electrostatic interactions are prevalent during the adsorption of anionic PFOS and PFOA onto TiO2 and Al2O3 surfaces that have a net-positive charge. Hydrophobic interactions occur during the adsorption of several anionic PFAS onto negatively charged hydrophobically modified silica surfaces. Hydrogen bonding occurs during the adsorption of PFOS and PFOA onto Al2O3, Fe2O3, SiO2, and TiO2 nanoparticles. Ligand ion exchange was reported during the adsorption of PFOS and PFOA onto boehmite. The adsorption mechanisms are relevant to the fate of toxic PFAS in the environment and the PFAS removal via adsorption on sorbent materials.
The adsorption of fluorinated surfactants onto mineral surfaces depends on the aqueous pH, varying salt and humic acid concentrations, and also the surfactant chemistry. Increasing the solution pH decreased the PFAS adsorbed amount during the adsorption of PFOA, PFHxS, or PFHxA onto kaolinite, montmorillonite, or hematite; PFOS onto alumina; and PFOA onto silica. Increasing salt concentration increased the adsorbed amount during the adsorption of PFOS, PFOA, PFHxS, or PFHxA onto montmorillonite, kaolinite, or hematite, and during the adsorption of PFNA, PFHpA, PFDA, or PFUnDA onto kaolinite. This was due to the screening of electrostatic repulsions, and it is very relevant to the fate of PFAS surfactants as they travel from freshwater to saltwater environments. The presence of pre-adsorbed humic acid (HA) decreased PFAS adsorption, as seen during the adsorption of PFOA onto SiO2, Fe2O3, and Al2O3. This is important to consider, because the concentration of HA varies in different water environments. Increasing the C—F chain length of the surfactant typically increases adsorption onto mineral surfaces, reflecting increased hydrophobic interactions and decreased water solubility of PFAS. In the case of adsorption from a PFAS surfactant mixture, the longer-chain PFAS out-competed the shorter-chain PFAS when adsorbing onto kaolinite surfaces. Once adsorbed onto active sites, the longer-chain PFAS electrostatically repelled the shorter-chain PFAS from such adsorption sites. Shorter-chain PFAS surfactants, such as PFBS and PFBA, adsorb very little onto mineral surfaces in freshwater settings; accordingly, short-chain PFAS are being used as a substitute to currently banned longer-chain PFAS. Variation of the surfactant head-group will affect adsorption, depending on the specific surface with which the head-group interacts.
The information that is reviewed here on the adsorption of fluorinated surfactants onto mineral surfaces informs the transport and fate of PFAS in the aqueous and soil ecosystems, and also wastewater treatment processes for the removal of PFAS from the environment, and drinking water treatment. Further research on PFAS adsorption is required, especially for “emerging” fluorinated surfactants that have been recently introduced as replacements of the “legacy” PFOS and PFOA. Very little is typically known about the aqueous solution properties and interfacial properties of these new fluorinated surfactants. Further research would be beneficial on additives or functional groups that would promote or attenuate PFAS surfactant adsorption on solid surfaces.
The reverse process of adsorption, i.e., desorption, is very relevant to the practical removal of PFAS from aqueous environment via adsorption to a sorbent, such as activated carbon and resins, where the regeneration of the sorbent involves desorption. Upon reviewing the literature, we observed an apparent lack of research that examines the desorption of PFAS surfactants from mineral surfaces, following the use of a stimulus in a system, such as the salinity changes, pH changes, or dilution. This presents a need and provides an opportunity for further research.

Author Contributions

Conceptualization, P.A. and A.V.A.; methodology, P.A. and A.V.A.; investigation, A.V.A.; writing—original draft preparation, A.V.A.; writing—review and editing, P.A. and M.T.; supervision, P.A.; project administration, P.A. and M.T.; funding acquisition, P.A. and M.T. All authors have read and agreed to the published version of the manuscript.

Funding

This research was funded by the US National Science Foundation, grant number CBET-1930959.

Conflicts of Interest

The authors declare no conflict of interest.

References

  1. Villanueva, C.M.; Durand, G.; Coutte, M.B.; Chevrier, C.; Cordier, S. Atrazine in municipal drinking water and risk of low birth weight, preterm delivery, and small-for-gestational-age status. Occup. Environ. Med. 2005, 62, 400–405. [Google Scholar] [CrossRef] [PubMed] [Green Version]
  2. Agency for Toxic Substances and Disease Registry. Toxicological Profile for Arsenic; ATSDR/TP-88/02; CAS Number: 7440-38-2; U.S. Public Health Service: Atlanta, GA, USA, 1989. Available online: https://www.atsdr.cdc.gov/ToxProfiles/tp2.pdf (accessed on 22 September 2020).
  3. Cragin, L.A.; Kesner, J.S.; Bachand, A.M.; Barr, D.B.; Meadows, J.W.; Krieg, E.F.; Reif, J.S. Menstrual cycle characteristics and reproductive hormone levels in women exposed to atrazine in drinking water. Environ. Res. 2011, 111, 1293–1301. [Google Scholar] [CrossRef] [PubMed]
  4. Winchester, P.D.; Huskins, J.; Ying, J. Agrichemicals in surface water and birth defects in the United States. Acta Paediatr. 2009, 98, 664–669. [Google Scholar] [CrossRef] [PubMed]
  5. Vahter, M. Mechanisms of arsenic biotransformation. Toxicology 2002, 18, 211–217. [Google Scholar] [CrossRef]
  6. Tchounwou, P.B.; Yedjou, C.G.; Patlolla, A.K.; Sutton, D.J. Heavy metal toxicity and the environment. Exp. Suppl. 2012, 101, 133–164. [Google Scholar] [CrossRef] [Green Version]
  7. Ali, H.; Khan, E.; Ilahi, I. Environmental chemistry and ecotoxicology of hazardous heavy metals: Environmental persistence, toxicity, and bioaccumulation. J. Chem. 2019, 2019, 6730305. [Google Scholar] [CrossRef] [Green Version]
  8. Ashraf, M.A. Persistent organic pollutants (POPs): A global issue, a global challenge. Environ. Sci. Pollut. Res. 2017, 24, 4223–4227. [Google Scholar] [CrossRef]
  9. Guo, W.; Pan, B.; Sakkiah, S.; Yavas, G.; Ge, W.; Zou, W.; Tong, W.; Hong, H. Persistent organic pollutants in food: Contamination sources, health effects and detection methods. Int. J. Environ. Res. Public Health 2019, 16, 4361. [Google Scholar] [CrossRef] [Green Version]
  10. United States Environmental Protection Agency. DuPont Agrees to Lower Limit of PFOA in Drinking Water, Dupont Washington Works; United States Environmental Protection Agency: Washington, DC, USA, 2009.
  11. Lindstrom, A.B.; Strynar, M.J.; Libelo, E.L. Polyfluorinated compounds: Past, present, and future. Environ. Sci. Technol. 2011, 45, 7954–7961. [Google Scholar] [CrossRef]
  12. Hellsing, M.S.; Josefsson, S.; Hughes, A.V.; Ahrens, L. Sorption of perfluoroalkyl substances to two types of minerals. Chemosphere 2016, 159, 385–391. [Google Scholar] [CrossRef]
  13. Xing, R.; Rankin, S.E. Three stage multilayer formation kinetics during adsorption of an anionic fluorinated surfactant onto germanium. 1. Concentration Effect. J. Phys. Chem. B 2006, 110, 295–304. [Google Scholar] [CrossRef] [PubMed]
  14. Kothawala, N.; Köhler, S.J.; Östlund, A.; Wiberg, K.; Ahres, L. Influence of dissolved organic matter concentration and composition on the removal efficiency of perfluoroalkyl substances (PFASs) during drinking water treatment. Water Res. 2017, 121, 320–328. [Google Scholar] [CrossRef] [PubMed]
  15. MacManus-Spencer, L.A.; Tse, M.L.; Hebert, P.C.; Bischel, H.N.; Luthy, R.G. Binding of perfluorocarboxylates to serum albumin: A comparison of analytical methods. Anal. Chem. 2010, 82, 974–981. [Google Scholar] [CrossRef]
  16. Sorli, J.B.; Lag, M.; Ekeren, L.; Perez-Gil, J.; Haug, L.S.; Da Silva, E.; Matrod, M.N.; Gutzkow, K.B.; Lindeman, B. Per- and polyfluoroalkyl substances (PFASs) modify lung surfactant function and pro-inflammatory responses in human bronchial epithelial cells. Toxicol. In Vitro 2020, 62, 104656. [Google Scholar] [CrossRef]
  17. Kissa, E. Fluorinated Surfactants and Repellents; CRC Press: Boca Raton, FL, USA, 2001. [Google Scholar]
  18. Mukerjee, P.; Gumkowski, M.J.; Chan, C.C.; Sharma, R. Determination of critical micellization concentrations of perfluorocarboxylates using ultraviolet spectroscopy: Some unusual counterion effects. J. Phys. Chem. 1990, 94, 8832–8835. [Google Scholar] [CrossRef]
  19. Wang, Z.; MacLeod, M.; Cousins, I.T.; Scheringer, M.; Hungerbühler, K. Using COSMOtherm to predict physicochemical properties of poly- and perfluorinated alkyl substances (PFASs). Environ. Chem. 2011, 8, 389–398. [Google Scholar] [CrossRef]
  20. Centers for Disease Control and Prevention. An Overview of Perfluoroalkyl and Polyfluoroalkyl Substances and Interim Guidance for Clinicians Responding to Patient Exposure Concerns. 2017. Available online: https://stacks.cdc.gov/view/cdc/77114 (accessed on 22 September 2020).
  21. Interstate Technology and Regulatory Council. History and Use of Per- and Polyfluoroalkyl Substances (PFAS). 2017. Available online: https://pfas-1.itrcweb.org/fact_sheets_page/PFAS_Fact_Sheet_History_and_Use_April2020.pdf (accessed on 22 September 2020).
  22. Du, Z.W.; Deng, S.B.; Bei, Y.; Huang, Q.; Wang, B.; Huang, J.; Yu, G. Adsorption behavior and mechanism of perfluorinated compounds on various adsorbents—A review. J. Hazard. Mater. 2014, 274, 443–454. [Google Scholar] [CrossRef]
  23. Trudel, D.; Horowitz, L.; Wormuth, M.; Scheringer, M.; Cousins, I.T.; Hungerbuhler, K. Estimating consumer exposure to PFOS and PFOA. Risk Anal. 2008, 28, 251–269. [Google Scholar] [CrossRef]
  24. Hu, X.C.; Andrews, D.Q.; Lindstrom, A.B.; Bruton, T.A.; Schaider, L.A.; Grandjean, P.; Lohmann, R.; Carignan, C.C.; Blum, A.; Balan, S.A.; et al. Detection of poly- and perfluoroalkyl substances (PFASs) in U.S. drinking water linked to industrial sites, military fire training areas, and wastewater treatment plants. Environ. Sci. Technol. Lett. 2016, 3, 344–350. [Google Scholar] [CrossRef]
  25. Banzhaf, S.; Filipovic, M.; Lewis, J.; Sparrenbom, C.J.; Barthel, R. A review of contamination of surface-, ground-, and drinking water in Sweden by perfluoroalkyl and polyfluoroalkyl substances (PFASs). Ambio 2017, 46, 335–346. [Google Scholar] [CrossRef] [Green Version]
  26. Oliaei, F.; Kriens, D.; Weber, R.; Watson, A. PFOS and PFC releases and associated pollution from a PFC production plant in Minnesota (USA). Environ. Sci. Pollut. Res. 2013, 20, 1977–1992. [Google Scholar] [CrossRef] [PubMed]
  27. Steenland, K.; Fletcher, T.; Savitz, D.A. Epidemiologic evidence on the health effects of perfluorooctanoic acid (PFOA). Environ. Health Perspect. 2010, 118, 1100–1108. [Google Scholar] [CrossRef] [PubMed]
  28. United States Environmental Protection Agency. Technical Fact Sheet-Perfluorooctane Sulfonate (PFOS) and Perfluorooctanoic Acid (PFOA); EPA: Washington, DC, USA, 2017.
  29. Buck, R.C.; Franklin, J.; Berger, U.; Conder, J.M.; Cousins, I.T.; De Voogt, P.; Jensen, A.A.; Kannan, K.; Mabury, S.A.; Van Leeuwen, S.P. Perfluoroalkyl and polyfluoroalkyl substances in the environment: Terminology, classification, and origins. Integr. Environ. Assess. Manag. 2011, 7, 513–541. [Google Scholar] [CrossRef] [PubMed]
  30. Higgins, C.P.; Field, J.A.; Criddle, C.S.; Luthy, R.G. Quantitative determination of perfluorochemicals in sediments and domestic sludge. Environ. Sci. Technol. 2005, 39, 3946–3956. [Google Scholar] [CrossRef] [PubMed]
  31. Moody, C.A.; Hebert, G.N.; Strauss, S.H.; Field, J.A. Occurrence and persistence of perfluorooctanesulfonate and other perfluorinated surfactants in groundwater at a fire-training area at Wurtsmith Air Force Base, Michigan, USA. J. Environ. Monit. 2003, 5, 341–345. [Google Scholar] [CrossRef]
  32. Moody, C.A.; Martin, J.W.; Kwan, W.C.; Muir, D.C.; Mabury, S.A. Monitoring perfluorinated surfactants in biota and surface water samples following an accidental release of fire-fighting foam into Etobicoke Creek. Environ. Sci. Technol. 2002, 36, 545–551. [Google Scholar] [CrossRef]
  33. Wang, Z.Y.; DeWitt, J.C.; Higgins, C.P.; Cousins, I.T. A never-ending story of per- and polyfluoroalkyl substances (PFASs)? Environ. Sci. Technol. 2017, 51, 2508–2518. [Google Scholar] [CrossRef]
  34. 3M Company. Fluorochemical Use, Distribution and Release Overview; US EPA Public Docket AR226–0550; 3M Company: Saint Paul, MN, USA, 1999. [Google Scholar]
  35. Favreau, P.; Poncioni-Rothlisberger, C.; Place, B.J.; Bouchex-Bellomie, H.; Weber, A.; Tremp, J.; Field, J.A.; Kohler, M. Multianalyte profiling of per- and polyfluoroalkyl substances (PFASs) in liquid commercial products. Chemosphere 2017, 171, 491–501. [Google Scholar] [CrossRef]
  36. Bečanová, J.; Melymuk, L.; Vojta, Š.; Komprdová, K.; Klánová, J. Screening for perfluoroalkyl acids in consumer products, building materials and wastes. Chemosphere 2016, 164, 322–329. [Google Scholar] [CrossRef]
  37. United States Environmental Protection Agency. Lifetime Health Advisories and Health Effects Support Documents for Perfluorooctanoic Acid and Perfluorooctane Sulfonate; Document Number: 2016-12361; Environmental Protection Agency: Washington, DC, USA, 2016; pp. 33250–33251. Available online: https://www.federalregister.gov/documents/2016/05/25/2016-12361/lifetime-health-advisories-and-health-effects-support-documents-for-perfluorooctanoic-acid-and (accessed on 22 September 2020).
  38. Blum, A.; Balan, S.A.; Scheringer, M.; Trier, X.; Goldenman, G.; Cousins, I.T.; Diamond, M.; Fletcher, T.; Higgins, C.; Lindeman, A.E.; et al. The Madrid statement on poly- and perfluoroalkyl substances (PFASs). Environ. Health Perspect. 2015, 123, A107–A111. [Google Scholar] [CrossRef]
  39. Ng, C.; Hungerbuhler, K. Bioaccumulation of perfluorinated alkyl acids: Observations and models. Environ. Sci. Technol. 2014, 48, 4637–4648. [Google Scholar] [CrossRef]
  40. Chang, E.T.; Adami, H.-O.; Boffetta, P.; Cole, P.; Starr, T.B.; Mandel, J.S. A critical review of perfluorooctanoate and perfluorooctanesulfonate exposure and cancer risk in humans. Crit. Rev. Toxicol. 2014, 44, 1–81. [Google Scholar] [CrossRef] [PubMed] [Green Version]
  41. Chang, E.T.; Adami, H.O.; Boffetta, P.; Wedner, H.J.; Mandel, J.S. A critical review of perfluorooctanoate and perfluorooctanesulfonate exposure and immunological health conditions in humans. Crit. Rev. Toxicol. 2016, 46, 279–331. [Google Scholar] [CrossRef] [PubMed]
  42. Xiao, F.; Zhang, X.R.; Penn, L.; Gulliver, J.S.; Simcik, M.F. Effects of monovalent cations on the competitive adsorption of perfluoroalkyl acids by kaolinite: Experimental studies and modeling. Environ. Sci. Technol. 2011, 45, 10028–10035. [Google Scholar] [CrossRef] [PubMed]
  43. Mudumbi, J.B.N.; Ntwampe, S.K.O.; Matsha, T.; Mekuto, L.; Itoba-Tombo, E.F. Recent developments in polyfluoroalkyl compounds research: A focus on human/environmental health impact, suggested substitutes and removal strategies. Environ. Monit. Assess. 2017, 189, 1–29. [Google Scholar] [CrossRef]
  44. Li, F.; Duan, J.; Tian, S.; Ji, H.; Zhu, Y.; Wei, Z.; Zhao, D. Short-chain per- and polyfluoroalkyl substances in aquatic systems: Occurrence, impacts and treatment. Chem. Eng. J. 2020, 380, 122506. [Google Scholar] [CrossRef]
  45. Bowman, J.S. Fluorotechnology is critical to modern life: The FluoroCouncil counterpoint to the Madrid statement. Environ. Health Perspect. 2015, 123, A112–A113. [Google Scholar] [CrossRef] [Green Version]
  46. Cousins, I.T.; Goldenman, G.; Herzke, D.; Lohmann, R.; Miller, M.; Ng, C.A.; Patton, S.; Scheringer, M.; Trier, X.; Vierke, L.; et al. The concept of essential use for determining when uses of PFASs can be phased out. J. Environ. Monit. 2019, 21, 1803–1815. [Google Scholar] [CrossRef]
  47. Ritscher, A.; Wang, Z.; Scheringer, M.; Boucher, J.M.; Ahrens, L.; Berger, U.; Bintein, S.; Bopp, S.K.; Borg, D.; Buser, A.M.; et al. Zurich statement on future actions on per- and polyfluoroalkyl substances (PFASs). Environ. Health Perspect. 2018, 126, 084502. [Google Scholar] [CrossRef]
  48. Zhang, D.; Luo, Q.; Gao, B.; Chiang, S.-Y.D.; Woodward, D.; Huang, Q. Sorption of perfluorooctanoic acid, perfluorooctane sulfonate and perfluoroheptanoic acid on granular activated carbon. Chemosphere 2016, 144, 2336–2342. [Google Scholar] [CrossRef] [Green Version]
  49. Wang, Y.J.; Niu, J.F.; Li, Y.; Zheng, T.J.; Xu, Y.; Liu, Y. Performance and mechanisms for removal of perfluorooctanoate (PFOA) from aqueous solution by activated carbon fiber. RSC Adv. 2015, 5, 86927–86933. [Google Scholar] [CrossRef]
  50. Rattanaoudom, R.; Visvanathan, C.; Boontanon, S.K. Removal of concentrated PFOS and PFOA in synthetic industrial wastewater by powder activated carbon and hydrotalcite. J. Water Sustain. 2012, 2, 245–258. [Google Scholar]
  51. Yu, J.; Lv, L.; Lan, P.; Zhang, S.; Pan, B.; Zhang, W. Effect of effluent organic matter on the adsorption of perfluorinated compounds onto activated carbon. J. Hazard. Mater. 2012, 225–226, 99–106. [Google Scholar] [CrossRef] [PubMed]
  52. Liu, L.; Liu, Y.; Gao, B.; Ji, R.; Li, C.; Wang, S. Removal of perfluorooctanoic acid (PFOA) and perfluorooctane sulfonate (PFOS) from water by carbonaceous nanomaterials: A review. Crit. Rev. Environ. Sci. Technol. 2019, 50, 1–36. [Google Scholar] [CrossRef]
  53. Ateia, M.; Alsbaiee, A.; Karanfil, T.; Dichtel, W. Efficient PFAS removal by amine-functionalized sorbents: Critical review of the current literature. Environ. Sci. Technol. Lett. 2019, 6, 688–695. [Google Scholar] [CrossRef]
  54. Zhi, Y.; Liu, J. Adsorption of perfluoroalkyl acids by carbonaceous adsorbents: Effect of carbon surface chemistry. Environ. Pollut. 2015, 202, 168–176. [Google Scholar] [CrossRef]
  55. Saeidi, N.; Kopinke, F.-D.; Georgi, A. Understanding the effect of carbon surface chemistry on adsorption of perfluorinated alkyl substances. Chem. Eng. J. 2020, 381, 122689. [Google Scholar] [CrossRef]
  56. Ochoa-Herrera, V.; Sierra-Alvarez, R. Removal of perfluorinated surfactants by sorption onto granular activated carbon, zeolite and sludge. Chemosphere 2008, 72, 1588–1593. [Google Scholar] [CrossRef]
  57. Ji, B.; Kang, P.; Wei, T.; Zhao, Y. Challenges of aqueous per- and polyfluoroalkyl substances (PFASs) and their foreseeable removal strategies. Chemosphere 2020, 250, 126316. [Google Scholar] [CrossRef]
  58. Sunderland, E.M.; Hu, X.C.; Dassuncao, C.; Tokranov, A.K.; Wagner, C.C.; Allen, J.G. A review of the pathways of human exposure to poly- and perfluoroalkyl substances (PFASs) and present understanding of health effects. J. Expo. Sci. Environ. Epidemiol. 2019, 29, 131–147. [Google Scholar] [CrossRef] [Green Version]
  59. Brusseau, M.L.; Khan, N.; Wang, Y.; Yan, N.; Van Glubt, S.; Carroll, K.C. Nonideal transport and extended elution tailing of PFOS in soil. Environ. Sci. Technol. 2019, 53, 10654–10664. [Google Scholar] [CrossRef] [PubMed]
  60. Lyu, X.; Liu, X.; Sun, Y.; Ji, R.; Gao, B.; Wu, J. Transport and retention of perfluorooctanoic acid (PFOA) in natural soils: Importance of soil organic matter and mineral contents, and solution ionic strength. J. Contam. Hydrol. 2019, 225, 103477. [Google Scholar] [CrossRef]
  61. Kwok, K.Y.; Yamazaki, E.; Yamashita, N.; Taniyasu, S.; Murphy, M.B.; Horii, Y.; Petrick, G.; Kallerborn, R.; Kannan, K.; Murano, K.; et al. Transport of perfluoroalkyl substances (PFAS) from an arctic glacier to downstream locations: Implications for sources. Sci. Total Environ. 2013, 447, 46–55. [Google Scholar] [CrossRef] [PubMed]
  62. Simon, J.A.; Abrams, S.; Bradburne, T.; Bryant, D.; Burns, M.; Cassidy, D.; Cherry, J.; Chiang, S.Y.; Cox, D.; Crimi, M.; et al. PFAS Experts Symposium: Statements on regulatory policy, chemistry and analytics, toxicology, transport/fate, and remediation for per- and polyfluoroalkyl substances (PFAS) contamination issues. Remediation 2019, 29, 31–48. [Google Scholar] [CrossRef]
  63. Liu, T.; Gu, Y.; Xing, D.; Dong, W.; Wu, X. Rapid and high-capacity adsorption of PFOS and PFOA by regenerable ammoniated magnetic particle. Environ. Sci. Pollut. Res. 2018, 25, 13813–13822. [Google Scholar] [CrossRef] [PubMed]
  64. Zhang, D.Q.; Zhang, W.L.; Liang, Y.N. Adsorption of perfluoroalkyl and polyfluoroalkyl substances (PFASs) from aqueous solution—A review. Sci. Total Environ. 2019, 694, 133606. [Google Scholar] [CrossRef] [PubMed]
  65. Chen, H.; Zhang, C.; Yu, Y.X.; Han, J.B. Sorption of perfluorooctane sulfonate (PFOS) on marine sediments. Mar. Pollut. Bull. 2012, 64, 902–906. [Google Scholar] [CrossRef]
  66. Stebel, E.K.; Pike, K.A.; Huan, N.; Hartmann, H.A.; Klonowski, M.J.; Lawrence, M.G.; Collins, R.M.; Hefner, C.E.; Edmiston, P.L. Absorption of short-chain to long-chain perfluoroalkyl substances using swellable organically modified silica. Environ. Sci. Water Res. Technol. 2019, 5, 1854–1866. [Google Scholar] [CrossRef]
  67. Mejia-Avendano, S.; Zhi, Y.; Yan, B.; Liu, J. Sorption of polyfluoroalkyl surfactants on surface soils: Effect of molecular structures, soil properties, and solution chemistry. Environ. Sci. Technol. 2020, 54, 1513–1521. [Google Scholar] [CrossRef]
  68. Xiao, F.; Jin, B.; Golovko, S.A.; Golovko, M.Y.; Xing, B. Sorption and desorption mechanisms of cationic and zwitterionic per- and polyfluoroalkyl substances in natural soils: Thermodynamics and hysteresis. Environ. Sci. Technol. 2019, 53, 11818–11827. [Google Scholar] [CrossRef]
  69. Oliver, D.P.; Li, Y.; Orr, R.; Nelson, P.; Barnes, M.; McLaughlin, M.J.; Kookana, R.S. The role of surface charge and pH changes in tropical soils on sorption behaviour of per- and polyfluoroalkyl substances (PFASs). Sci. Total Environ. 2019, 673, 197–206. [Google Scholar] [CrossRef] [PubMed]
  70. Li, K.; Wang, P.; Qian, J.; Wang, C.; Xing, L.; Liu, J.; Tian, X.; Lu, B.; Tang, W. Effects of sediment components and TiO2 nanoparticles on perfluorooctane sulfonate adsorption properties. J. Soils Sediments 2019, 19, 2034–2047. [Google Scholar] [CrossRef]
  71. Li, F.; Fang, X.; Zhou, Z.; Liao, X.; Zou, J.; Yuan, B.; Sun, W. Adsorption of perfluorinated acids onto soils: Kinetics, isotherms, and influences of soil properties. Sci. Total Environ. 2019, 649, 504–514. [Google Scholar] [CrossRef] [PubMed]
  72. Wei, C.; Song, X.; Wang, Q.; Hu, Z. Sorption kinetics, isotherms and mechanisms of PFOS on soils with different physicochemical properties. Ecotoxicol. Environ. Saf. 2017, 142, 40–50. [Google Scholar] [CrossRef]
  73. Ahrens, L.; Yeung, L.W.Y.; Taniyasu, S.; Lam, P.K.S.; Yamashita, N. Partitioning of perfluorooctanoate (PFOA), perfluorooctane sulfonate (PFOS) and perfluorooctane sulfonamide (PFOSA) between water and sediment. Chemosphere 2011, 85, 731–737. [Google Scholar] [CrossRef]
  74. Xiang, L.; Xiao, T.; Yu, P.-F.; Zhao, H.-M.; Mo, C.-H.; Li, Y.-W.; Li, H.; Cai, Q.-Y.; Zhou, D.-M.; Wong, M.-H. Mechanism and implication of the sorption of perfluorooctanoic acid by varying soil size fractions. J. Agric. Food Chem. 2018, 66, 11569–11579. [Google Scholar] [CrossRef]
  75. Ololade, I.A.; Zhou, Q.; Pan, G. Influence of oxic/anoxic condition on sorption behavior of PFOS in sediment. Chemosphere 2016, 150, 798–803. [Google Scholar] [CrossRef] [Green Version]
  76. Li, Y.; Oliver, D.P.; Kookana, R.S. A critical analysis of published data to discern the role of soil and sediment properties in determining sorption of per and polyfluoroalkyl substances (PFASs). Sci. Total Environ. 2018, 628–629, 110–120. [Google Scholar] [CrossRef]
  77. Knight, E.R.; Janik, L.J.; Navarro, D.A.; Kookana, R.S.; McLaughlin, M.J. Predicting partitioning of radiolabelled 14C-PFOA in a range of soils using diffuse reflectance infrared spectroscopy. Sci. Total Environ. 2019, 686, 505–513. [Google Scholar] [CrossRef]
  78. Zhang, R.M.; Yan, W.; Jing, C.Y. Mechanistic study of PFOS adsorption on kaolinite and montmorillonite. Colloid Surf. A-Physicochem. Eng. Asp. 2014, 462, 252–258. [Google Scholar] [CrossRef]
  79. Yang, K.H.; Ruan, C.J.; Lin, Y.C.; Fang, M.D.; Wu, C.H.; Hong, P.K.A.; Lin, C.F. Role of dissolved organic matter in sorption of perfluorooctanoic acid to metal oxides. Water Environ. Res. 2016, 88, 779–784. [Google Scholar] [CrossRef] [PubMed]
  80. Bodratti, A.M.; Sarkar, B.; Alexandridis, P. Adsorption of poly(ethylene oxide)-containing amphiphilic polymers on solid-liquid interfaces: Fundamentals and applications. Adv. Colloid Interface Sci. 2017, 244, 132–163. [Google Scholar] [CrossRef] [PubMed]
  81. Zhang, R.; Somasundaran, P. Advances in adsorption of surfactants and their mixtures at solid/solution interfaces. Adv. Colloid Interface Sci. 2006, 123, 213–229. [Google Scholar] [CrossRef]
  82. Chang, Z.Y.; Chen, X.M.; Peng, Y.J. The adsorption behavior of surfactants on mineral surfaces in the presence of electrolytes—A critical review. Miner. Eng. 2018, 121, 66–76. [Google Scholar] [CrossRef]
  83. Evenas, L.; Furo, I.; Stilbs, P.; Valiullin, R. Adsorption isotherm and aggregate properties of fluorosurfactants on alumina measured by F-19 NMR. Langmuir 2002, 18, 8096–8101. [Google Scholar] [CrossRef]
  84. Zhou, Q.; Deng, S.B.; Yu, Q.; Zhang, Q.Y.; Yu, G.; Huang, J.; He, H.P. Sorption of perfluorooctane sulfonate on organo-montmorillonites. Chemosphere 2010, 78, 688–694. [Google Scholar] [CrossRef]
  85. Shafique, U.; Dorn, V.; Paschke, A.; Schuurmann, G. Adsorption of perfluorocarboylic acids at the silica surface. Chem. Commun. 2017, 53, 589–592. [Google Scholar] [CrossRef]
  86. De Gisi, S.; Lofrano, G.; Grassi, M.; Notarnicola, M. Characteristics and adsorption capacities of low-cost sorbents for wastewater treatment: A review. Sustain. Mater. Technol. 2016, 9, 10–40. [Google Scholar] [CrossRef] [Green Version]
  87. Jian, J.M.; Zhang, C.; Wang, F.; Lu, X.W.; Wang, F.; Zeng, E.Y. Effect of solution chemistry and aggregation on adsorption of perfluorooctanesulphonate (PFOS) to nano-sized alumina. Environ. Pollut. 2019, 251, 425–433. [Google Scholar] [CrossRef]
  88. Elmorsi, T.M. Equilibrium isotherms and kinetic studies of removal of methylene blue dye by adsorption onto miswak leaves as a natural adsorbent. J. Environ. Prot. 2011, 2, 817–827. [Google Scholar] [CrossRef] [Green Version]
  89. Kruk, M.; Jaroniec, M. Gas adsorption characterization of ordered organic-inorganic nanocomposite materials. Chem. Mater. 2001, 13, 3169–3183. [Google Scholar] [CrossRef]
  90. Johnson, R.L.; Anschutz, A.J.; Smolen, J.M.; Simcik, M.F.; Penn, R.L. The adsorption of perfluorooctane sulfonate onto sand, clay, and iron oxide surfaces. J. Chem. Eng. Data 2007, 52, 1165–1170. [Google Scholar] [CrossRef]
  91. Wang, F.; Liu, C.S.; Shih, K.M. Adsorption behavior of perfluorooctanesulfonate (PFOS) and perfluorooctanoate (PFOA) on boehmite. Chemosphere 2012, 89, 1009–1014. [Google Scholar] [CrossRef] [PubMed]
  92. Shih, K.M.; Wang, F. Adsorption behavior of perfluorochemicals (PFCs) on boehmite: Influence of solution chemistry. Procedia Environ. Sci. 2013, 18, 106–113. [Google Scholar] [CrossRef] [Green Version]
  93. Qian, J.; Shen, M.M.; Wang, P.F.; Wang, C.; Hu, J.; Hou, J.; Ao, Y.H.; Zheng, H.; Li, K.; Liu, J.J. Co-adsorption of perfluorooctane sulfonate and phosphate on boehmite: Influence of temperature, phosphate initial concentration and pH. Ecotoxicol. Environ. Saf. 2017, 137, 71–77. [Google Scholar] [CrossRef]
  94. IUPAC Commission on Colloid and Surface Chemistry Including Catalysis. Reporting physisorption data for gas/solid systems with special reference to the determination of surface area and porosity (Recommendations 1984). Pure Appl. Chem. 1985, 57, 603–619. [Google Scholar] [CrossRef]
  95. Lu, X.Y.; Deng, S.B.; Wang, B.; Huang, J.; Wang, Y.J.; Yu, G. Adsorption behavior and mechanism of perfluorooctane sulfonate on nanosized inorganic oxides. J. Colloid Interface Sci. 2016, 474, 199–205. [Google Scholar] [CrossRef]
  96. Zhao, L.X.; Bian, J.N.; Zhang, Y.H.; Zhu, L.Y.; Liu, Z.T. Comparison of the sorption behaviors and mechanisms of perfluorosulfonates and perfluorocarboxylic acids on three kinds of clay minerals. Chemosphere 2014, 114, 51–58. [Google Scholar] [CrossRef]
  97. Wang, F.; Shih, K.M. Adsorption of perfluorooctanesulfonate (PFOS) and perfluorooctanoate (PFOA) on alumina: Influence of solution pH and cations. Water Res. 2011, 45, 2925–2930. [Google Scholar] [CrossRef]
  98. Xing, R.; Rankin, S.E. Three stage multilayer formation kinetics during adsorption of an anionic fluorinated surfactant onto germanium: Solution pH and salt effects. J. Colloid Interface Sci. 2013, 401, 88–96. [Google Scholar] [CrossRef]
  99. He, G.Z.; Pan, G.; Zhang, M. Assembling structures and dynamics properties of perfluorooctane sulfonate (PFOS) at water–titanium oxide interfaces. J. Colloid Interface Sci. 2013, 405, 189–194. [Google Scholar] [CrossRef] [PubMed]
  100. He, G.Z.; Zhang, M.Y.; Zhou, Q.; Pan, G. Molecular dynamics simulations of structural transformation of perfluorooctane sulfonate (PFOS) at water/rutile interfaces. Chemosphere 2015, 134, 272–278. [Google Scholar] [CrossRef] [PubMed] [Green Version]
  101. He, Z.; Alexandridis, P. Micellization thermodynamics of Pluronic P123 (EO20PO70EO20) amphiphilic block copolymer in aqueous ethylammonium nitrate (EAN) solutions. Polymers 2018, 10, 32. [Google Scholar] [CrossRef] [PubMed] [Green Version]
  102. Deng, S.B.; Zhang, Q.Y.; Nie, Y.; Wei, H.R.; Wang, B.; Huang, J.; Yu, G.; Xing, B.S. Sorption mechanisms of perfluorinated compounds on carbon nanotubes. Environ. Pollut. 2012, 168, 138–144. [Google Scholar] [CrossRef]
  103. Gao, X.D.; Chorover, J. Adsorption of perfluorooctanoic acid and perfluorooctanesulfonic acid to iron oxide surfaces as studied by flow-through ATRFTIR spectroscopy. Environ. Chem. 2012, 9, 148–157. [Google Scholar] [CrossRef]
  104. Li, K.X.; Zeng, Z.X.; Xiong, J.J.; Yan, L.S.; Guo, H.Q.; Liu, S.F.; Dai, Y.H.; Chen, T. Fabrication of mesoporous Fe3O4, SiO2, CTAB-SiO2 magnetic microspheres with a core/shell structure and their efficient adsorption performance for the removal of trace PFOS from water. Colloids Surf. A Physicochem. Eng. Asp. 2015, 465, 113–123. [Google Scholar] [CrossRef]
  105. Trevisan, S.; Francioso, O.; Quaggiotti, S.; Nardi, S. Humic substances biological activity at the plant-soil interface: From environmental aspects to molecular factors. Plant Signal. Behav. 2010, 5, 635–643. [Google Scholar] [CrossRef] [Green Version]
  106. Zhang, Y.; Zhi, Y.; Liu, J.; Ghoshal, S. Sorption of perfluoroalkyl acids to fresh and aged nanoscale zerovalent iron particles. Environ. Sci. Technol. 2018, 52, 6300–6308. [Google Scholar] [CrossRef]
  107. McNaught, A.D.; Wilkinson, A. IUPAC, Critical Micelle Concentration, Compendium of Chemical Terminology, 2nd ed.; Blackwell Scientific Publications: Oxford, UK, 1997; Available online: http://goldbook.iupac.org/terms/view/C01395 (accessed on 22 September 2020).
  108. Kancharla, S.; Canales, E.; Alexandridis, P. Perfluorooctanoate in aqueous urea solutions: Micelle formation, structure, and microenvironment. Int. J. Mol. Sci. 2019, 20, 5761. [Google Scholar] [CrossRef] [Green Version]
  109. Lin, Y.; Smith, T.W.; Alexandridis, P. Adsorption properties of a polymeric siloxane surfactant onto carbon black particles dispersed in mixtures of water with polar solvents. J. Colloid Interface Sci. 2002, 255, 1–9. [Google Scholar] [CrossRef]
  110. Sarkar, B.; Venugopal, V.; Tsianou, M.; Alexandridis, P. Adsorption of Pluronic block copolymers on silica nanoparticles. Colloids Surf. A Physicochem. Eng. Asp. 2013, 422, 155–164. [Google Scholar] [CrossRef]
  111. Reddy, D.H.K.; Lee, S.M. Application of magnetic chitosan composites for the removal of toxic metal and dyes from aqueous solutions. Adv. Colloid Interface Sci. 2013, 201, 68–93. [Google Scholar] [CrossRef] [PubMed]
  112. Atkins, R.; Craig, V.S.J.; Wanless, E.J.; Biggs, S. Mechanism of cationic surfactant adsorption at the solid-aqueous interface. Adv. Colloid Interface Sci. 2003, 103, 219–304. [Google Scholar] [CrossRef]
  113. Higgins, C.P.; Luthy, R.G. Sorption of perfluorinated surfactants on sediments. Environ. Sci. Technol. 2006, 40, 7251–7256. [Google Scholar] [CrossRef] [PubMed]
  114. Nassar, N.N. Asphaltene adsorption onto alumina nanoparticles: Kinetics and thermodynamic studies. Energy Fuels 2010, 24, 4116–4122. [Google Scholar] [CrossRef]
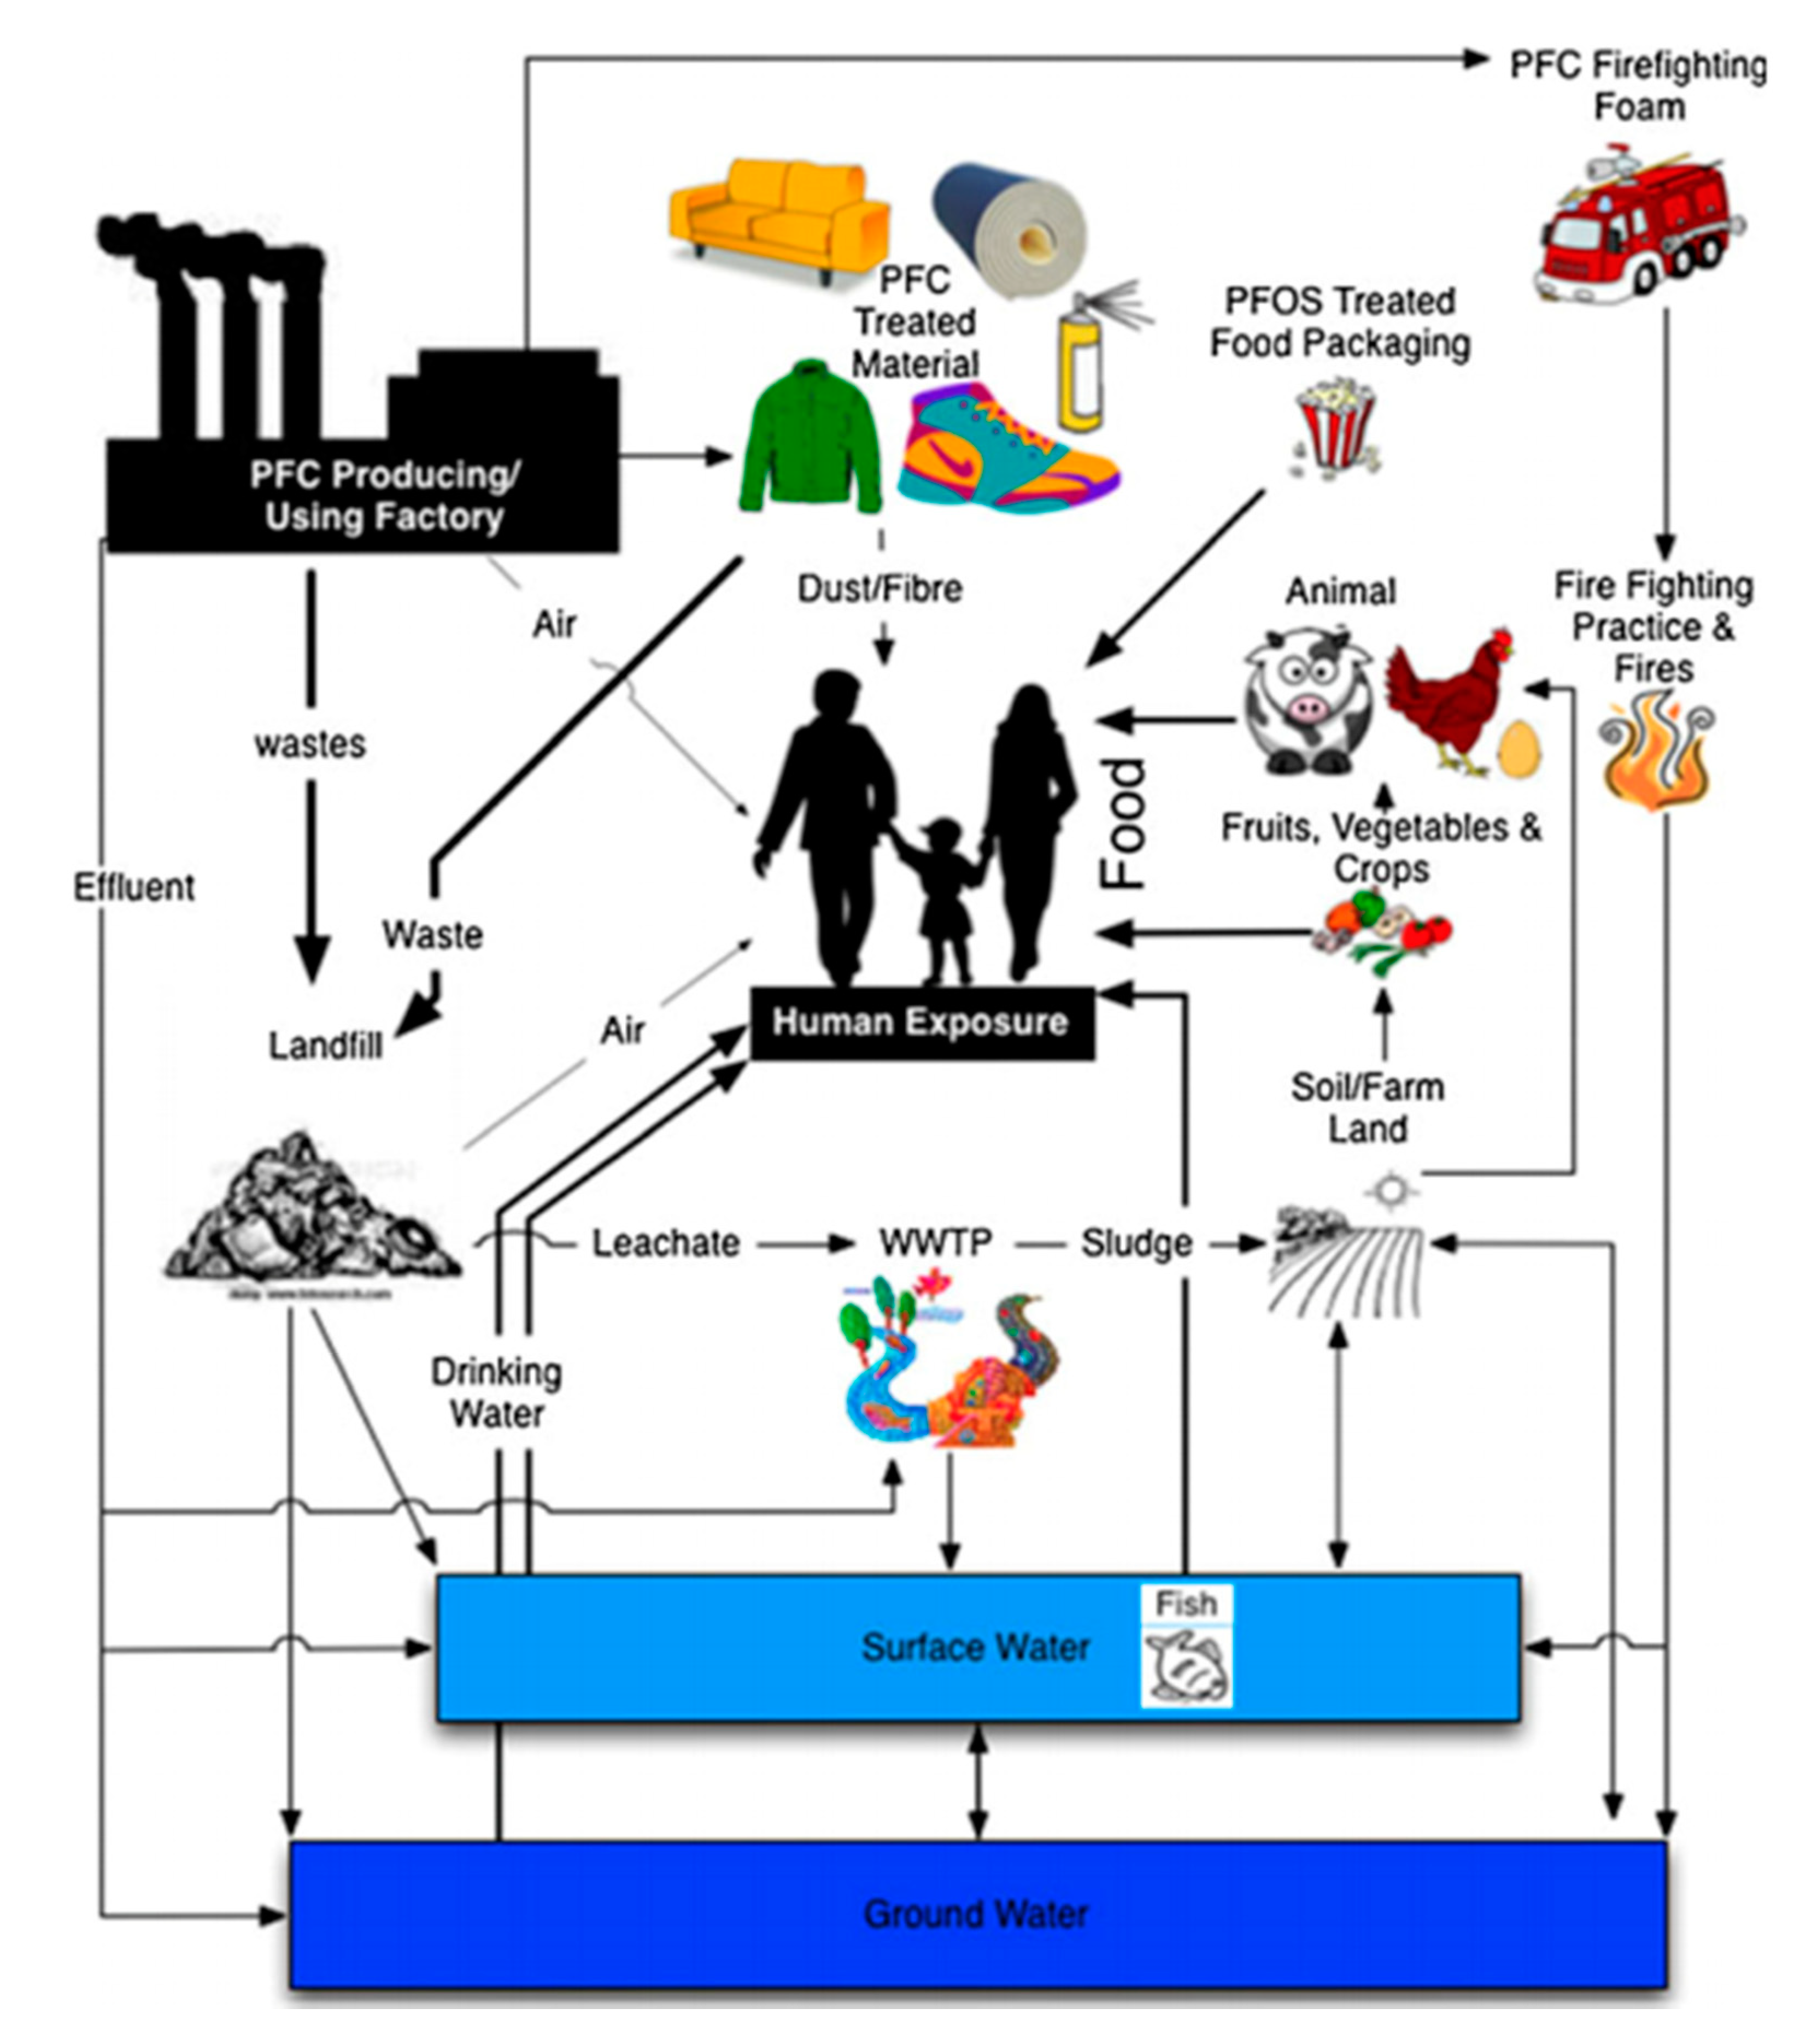
Figure 1. Main sources of perfluorinated compounds (PFC) and general pathways that these compounds may take toward human exposure [26]. Reprinted with permission. Copyright, 2013, Springer.
Surfaces 03 00037 g001
Figure 2. Adsorption isotherms: type I isotherm indicates monolayer adsorption on microporous surfaces, type II indicates monolayer–multilayer adsorption on non-porous and macroporous surfaces, type III indicates multilayer formations of adsorbate on porous surfaces, type IV indicates multilayer adsorption on mesoporous surfaces, and type V isotherm indicates monolayer–multilayer adsorption on porous surfaces [89,94]. Reprinted with permission. Copyright, 2001, American Chemical Society.
Surfaces 03 00037 g002
Figure 3. Adsorption isotherm schematic: c is surfactant concentration, and Γ represents the adsorbed amount of surfactant onto a surface. At (A), adsorption is primarily due to electrostatic interactions; at (B), it is due to electrostatic and hydrophobic interactions; (C) is where zero-point charge occurs on the surface; and (D) is the beginning of micelle formation in the bulk [83]. Reprinted with permission. Copyright, 2002, American Chemical Society.
Surfaces 03 00037 g003
Figure 4. Adsorption isotherms of PFOS onto various mineral surfaces in aqueous solutions. The PFOS adsorbed amount (mg/m2) on each mineral surface is plotted vs. the equilibrium concentration (ppm) of PFOS in solution [90]. Reprinted with permission. Copyright, 2007, American Chemical Society.
Surfaces 03 00037 g004
Figure 5. Molecular Dynamics simulation results for PFOS adsorption onto TiO2 surface. The PFOS molecules are electrostatically adsorbed onto the rutile–water surfaces at the (110) (a), (001) (b), and (100) (c) planes. The simulation was performed in water at 300 K, with PFOS and K+ ions present in the aqueous solution. The concentrations of PFOS and K+ ions within this simulation were unstated. Yellow balls with three red balls represent sulfonate head-groups, blue-gray sticks represent C—F chains, small purple circles represent K+ ions, red-gray sticks represent water molecules, and red-gray balls represent the water–rutile surface [99]. Reprinted with permission. Copyright, 2013, Elsevier B.V.
Surfaces 03 00037 g005
Figure 6. Hydrophobic push of perfluorinated surfactants onto silica glass surfaces, caused by the hydrophobic effect, where the hydrophobic parts of surfactants are pushed away from bulk water molecules and toward an interface. Surfactants exhibit such behavior because these compounds naturally want to minimize an entropy penalty that is related to a water layer that is strongly H-bonded around a solute. Orange arrows represent hydrophobic interactions, blue arrows represent ion-dipole or hydrophilic interactions, and red arrows represent electrostatic repulsion. (A) Shows surfactants with C—F chains that are hydrophobically attracted to a surface, while their head-groups are electrostatically repulsed by each other, but are hydrophilic toward water molecules. (B) Depicts C—F chains of perfluorinated surfactants that are hydrophobically attracted to siloxane patches on silica glass/fused quartz surfaces, while their head-groups are electrostatically repulsed by silanol patches on the same surface [85]. Reprinted with permission. Copyright, 2017, Royal Society of Chemistry.
Surfaces 03 00037 g006
Figure 7. Effect of pH on PFOS adsorption on goethite and kaolinite. The PFOS concentration in all aqueous solutions containing solids was 1.1 μg/mL [90]. Reprinted with permission. Copyright, 2007, American Chemical Society.
Surfaces 03 00037 g007
Figure 8. Effects of pH on the amount of PFOS adsorbed on nanosize alumina nanoparticles (NPs) and nanowires (NWs) at adsorption, at equilibrium. The PFOS concentration in the aqueous solution was 50 mg/L. The inset shows an expanded Y scale for the adsorption of PFOS on NWs [87]. Reprinted with permission. Copyright, 2019, Elsevier Ltd.
Surfaces 03 00037 g008
Figure 9. Effects of Na+ and Ca2+ on perfluorinated surfactant adsorption onto various mineral surfaces. MM, montmorillonite; KL, kaolinite; HM, hematite, until equilibrium was achieved. The maximum sorption amount of each surfactant (Cs) at different concentration of Na+/Ca2+ in solution is shown. The concentration of perfluorinated surfactants in solution was in the 10–1200 μg/L range [96]. Reprinted with permission. Copyright, 2014, Elsevier Ltd.
Surfaces 03 00037 g009
Figure 10. Effects of saline seawater dilutions, concentration of monovalent Na+ and K+ ions (A), and concentration of divalent Ca2+ and Mg2+ ions (B) on the adsorption coefficient (Kd) for PFOS adsorption onto various “marine sediments” [65]. Reprinted with permission. Copyright, 2012, Elsevier Ltd.
Surfaces 03 00037 g010aSurfaces 03 00037 g010b
Figure 11. (Top-right plot) Effects of NaCl on PFOS adsorption (Kd: distribution coefficient) onto kaolinite in single and multi-compound systems. The PFOS adsorption increased with NaCl concentration. (Middle-right plot) Sodium effects on kaolinite surface charge at varying ionic strengths, where the data were collected both with and without the presence of PFOS in the aqueous solution. The results of the top-right and middle-right graph were obtained at pH 7.5, with an initial PFOS concentration of 1E-6 mol/L. The top-left cartoon shows anionic PFOS approaching the kaolinite surface that has net negative charge in an environment that has low ionic strength. PFOS approaches the kaolinite surface oriented in a way where its hydrophilic/negatively charged head-group is toward the aqueous solution. The negatively charged PFOS head-group makes minimal contact with the negatively charged kaolinite surface. Beyond the dashed line is the aqueous solution with low PFOS concentrations. Na+ ions reside near the negatively charged PFOS head-groups and along the kaolinite surface. The background cartoon depicts the increasing adsorption of perfluoroalkyl acids (PFAA) as these compounds travel from fresh waters to salt waters. The cartoon shows that perfluorinated surfactants that are introduced into freshwater settings, such as rivers, can then travel to saltwater settings, like oceans. This is significant because the increased NaCl concentration causes increased adsorption [42]. Reprinted with permission. Copyright, 2011, American Chemical Society.
Surfaces 03 00037 g011
Figure 12. Humic acid effect on PFOS adsorption onto kaolinite and montmorillonite. The concentration of PFOS in all solutions containing each solid was 1.0 mg/L with 60 μg/g HA for kaolinite, and 30 μg/g HA for montmorillonite [78]. Reprinted with permission. Copyright, 2014, Elsevier B.V.
Surfaces 03 00037 g012
Figure 13. Schematic of adsorption of PFOA and/or humic acid (HA) onto a mineral surface: (a) introduction of PFOA molecules to the mineral suspension; (b) equilibrated PFOA adsorption onto the mineral surfaces; (c) introduction of both PFOA and HA molecules to the mineral suspension; (d) PFOA and HA concurrently reaching adsorption equilibrium when both molecules are introduced to the system simultaneously; (e) PFOA not able to adsorb on the mineral surface when HA was introduced before PFOA to the mineral suspension; (f) HA adsorption in the case when HA was introduced into a system that was already equilibrated with adsorbed PFOA; this results in HA displacement that entraps the PFOA molecules that are adsorbed onto the mineral surface [79]. Reprinted with permission. Copyright, 2016, Water Environment Federation.
Surfaces 03 00037 g013
Figure 14. Time evolution of TEA-FOS adsorption from 0.5 mM aqueous solution onto hydroxylated germanium surfaces. A finite number of adsorption sites reside on the germanium surface that TEA-FOS can adsorb to. This suggests that the observed three stages of adsorption exhibit characteristics of Langmuir kinetics. Stage I indicates initial rapid adsorption of TEA-FOS molecules, followed by a slowdown period. The duration of stage I was ~200 min. Stage II is a period where the slowing of adsorption continues until a sudden increase in the rate of adsorption, which indicates the beginning of the third stage of adsorption. The duration of stage II was ~1000 min. Stage III indicates a sudden increase in adsorption rate, and it lasts longer than the previous two stages, up to ~4000 min, until adsorption equilibrium was achieved. By stage III, a multilayer of TEA-FOS molecules is formed on the hydroxylated germanium surface [13,98]. Reprinted with permission. Copyright, 2013, Elsevier B.V.
Surfaces 03 00037 g014
Figure 15. Time evolution of PFOS, PFOA, and N-EtFOSAA adsorption onto “sediment 1” (made up of mostly sand, silt, and clay), at initial concentrations of 5 μg/L, each perfluorinated surfactant [113]. The surfactant concentrations used in these experiments is below their CMC. Reprinted with permission. Copyright, 2006, American Chemical Society.
Surfaces 03 00037 g015
Table 1. Chemical structure and physiochemical properties of various perfluorinated surfactants. CMC is the critical micelle concentration, and Koc is the fluorinated surfactant organic carbon–water partitioning coefficient. (a) Xing et al. [13], (b) Hellsing et al. [12], (c) Kothawala et al. [14], (d) MacManus-Spencer et al. [15], (e) Sorli et al. [16], (f) Kissa [17], (g) Mukerjee et al. [18], and (h) obtained from Scifinder, calculated by using Advanced Chemistry Development.
Perfluorinated SurfactantFull NameChemical FormulaChemical StructureMolecular Weight (g/mol)CMC (mM)KOC
PFBAPerfluorobutanoic acidC4HF7O2 Surfaces 03 00037 i001214.04750 (f)1.12 (c)
PFBSPerfluorobutanesulfonic acidC4HF9O3S Surfaces 03 00037 i002300.1022 (e)1.14 × 10⁻⁴ (c)
PFPeAPerfluoropentanoic acidC5HF9O2 Surfaces 03 00037 i003264.05~2500.79 (c)
PFHxAPerfluorohexanoic acidC6HF11O2 Surfaces 03 00037 i004314.0582 (b)6.92 (c)
PFHxSPerfluorohexanesulfonic acidC6HF13O3S Surfaces 03 00037 i005400.1212 (e)3.55 × 10⁻⁴ (c)
PFHpAPerfluoroheptanoic acidC7HF13O2 Surfaces 03 00037 i006364.0633 (g)6.61 (c)
PFOAPerfluorooctanoic acidC8HF15O2 Surfaces 03 00037 i007414.079 (b)7.94 (c)
PFNAPerfluorononanoic acidC9HF17O Surfaces 03 00037 i008464.083.1 (b)245.47 (c)
PFOSPerfluorooctanesulfonic acidC8HF17O3S Surfaces 03 00037 i009500.133.1 (b)3.89 × 10⁻⁴ (c)
TEA-FOSTetraethylammonium Perfluorooctylsulfonate[C8F17O3S]
[C8NH12]+
Surfaces 03 00037 i010629.401.0 (a)
PFDAPerfluorodecanoic acidC10HF19O2 Surfaces 03 00037 i011514.081.5 (d)575.44 (c)
PFUnDAPerfluoroundecanoic acidC11HF21O2 Surfaces 03 00037 i012564.090.32 (d)1995.26 (c)
PFDoDAPerfluorododecanoic acidC12HF23O2 Surfaces 03 00037 i013614.10~0.1527 (h)
Table 2. Information on the adsorption of perfluorinated surfactants onto various mineral surfaces. Each row applies to the adsorption of a specific surfactant onto a specific surface. The “Solvent” column lists the solvent(s) used, salt types and concentrations, temperature, pH levels, and/or humic acid (HA) concentrations, if applicable. The “Mineral Surface Properties” column specifies whether the mineral surface examined was flat or curved (particle), and it includes other structural properties (if available), such as particle shape and size, pore diameter, and specific area. The “Key Results” column reports the adsorbed amount, adsorption capacity, or surface excess of the surfactant, onto the mineral surface under different conditions (if applicable), such as varying pH, salt, or HA concentrations. The “Structure” column reports the structure of the adsorbed layer: monolayer, bilayer, or multilayer. The “Comments” column contains some comments about specific studies. The “Reference” column lists the lead author and year of the publication that reported the data in a specific row. The perfluorinated surfactants that are reported in this table include (in order of increasing C—F chain length): perfluorobutanoic acid (PFBA); perfluorobutanesulfonic acid, which is also known as perfluorobutane sulfonate (PFBS); perfluoropentanoic acid (PFPeA); perfluorohexanoic acid (PFHxA); perfluorohexanesulfonic acid or perfluorohexane sulfonate (PFHxS); perfluoroheptanoic acid (PFHpA); perfluorooctanoic acid (PFOA); perfluorononanoic acid (PFNA); perfluorooctanesulfonic acid, also known as heptadecafluorooctanesulfonic acid or perfluorooctane sulfonate (PFOS); tetraethylammonium perfluorooctylsulfonate (TEA-FOS); perfluorodecanoic acid (PFDA); perfluoroundecanoic acid (PFUnDA); and perfluorododecanoic acid (PFDoDA). The mineral surfaces reported in this table are alumina (Al2O3), boehmite (y-AlO(OH)), F-SOMS (fluoroalkyl modified (1, 2) organosilica), goethite (α-FeO(OH)), hematite (Fe2O3), high-iron sand (Fe3O4), kaolinite (Al2Si2O5(OH)4), Lake Michigan sediment, montmorillonite ((Na,Ca)0.33(Al,Mg)2(Si4O10)(OH)2*nH2O), Ottawa sand (SiO2), silica (SiO2), and SOMS (modified organosilica).
Perfluorinated SurfactantSolventMineral Surface (Adsorbent)Mineral Surface PropertiesKey Results: Adsorbed Amount/Adsorption CapacityAdsorbed Layer StructureCommentsReference
PFBAWater,
Temperature: 25 °C, pH: 6.3
Organo-montmorillonites (0.5CEC-Mt)Particle surfaceAdsorption capacity: ~0.02 mmol/gNot reportedSurfaces not well-definedZhou et al. (2010) [84]
PFBADeionized water (alone) and NaCl (50 mM) (separate experiments), Temperature: not reported,
pH: not reported
SOMS (organosilica adsorbent)Particle surface, Particle size: 250–450 µm; Surface area: 650 m2/g,
Pore volume: 1.03 mL/g
Adsorption capacity: 0 mg/g (in deionized water), 0 mg/g (in 50 mM NaCl)Not reported Stebal et al. (2019) [66]
PFBADeionized water (alone) and NaCl (50 mM) (separate experiments), Temperature: not reported,
pH: not reported
F-SOMS (fluoroalkyl modified)Particle surface, Particle size: 250–450 µm; Surface area: 660 m2/g;
Pore volume: 1.04 mL/g
Adsorption capacity: 0 mg/g (in deionized water), 0 mg/g (in 50 mM NaCl)Not reported Stebal et al. (2019) [66]
PFBSWater,
Temperature: 25 °C, pH: 6.3
Organo-montmorillonites (0.5CEC-Mt)Particle surfaceAdsorption capacity: ~0.15 mmol/gNot reportedSurfaces not well-definedZhou et al. (2010) [84]
PFBSDeionized water (alone) and NaCl (50 mM) (separate experiments), Temperature: not reported,
pH: not reported
SOMS (organosilica adsorbent)Particle surface, Particle size: 250–450 µm, Surface area: 650 m2/g;
Pore volume: 1.03 mL/g,
Adsorption capacity: ~3 mg/g (in deionized water), ~1 mg/g (in 50 mM NaCl)Not reported Stebal et al. (2019) [66]
PFBSDeionized water (alone) and NaCl (50 mM) (separate experiments), Temperature: not reported,
pH: not reported
F-SOMS (fluoroalkyl modified)Particle surface, Particle size: 250–450 µm, Surface area: 660 m2/g, Pore volume: 1.04 mL/gAdsorption capacity: ~1 mg/g (in deionized water), ~1 mg/g (in 50 mM NaCl)Not reported Stebal et al. (2019) [66]
PFPeADeionized water (alone) and NaCl (50 mM) (separate experiments). Temperature: not reported,
pH: not reported
SOMS (organosilica adsorbent)Particle surface, Particle size: 250–450 µm, Surface area: 650 m2/g,
Pore volume: 1.03 mL/g
Adsorption capacity: ~3 mg/g (in deionized water), ~0.5 mg/g (in 50 mM NaCl)Not reported Stebal et al. (2019) [66]
PFPeADeionized water (alone) and NaCl (50 mM) (separate experiments), Temperature: not reported,
pH: not reported
F-SOMS (fluoroalkyl modified)Particle surface, Particle size: 250–450 µm, Surface area: 660 m2/g,
Pore volume: 1.04 mL/g
Adsorption capacity: ~1 mg/g (in deionized water), ~1 mg/g (in 50 mM NaCl)Not reported Stebal et al. (2019) [66]
PFHxAWater and D2O, Temperature: 300 KSilica (SiO2)Crystal surface, Crystal dimensions: 50 × 50 × 10 nm3Not applicableNot applicable Hellsing et al. (2016) [12]
PFHxAWater and D2O (studied separately), Temperature: 300 KAlumina (Al2O3)Crystal surface, Crystal dimensions: 50 × 50 × 10 nm30.0033 µg/m2Monolayer Hellsing et al. (2016) [12]
PFHxAWater, CaCl2, and NaCl, (0.01–10 mM), (0.1–100 mM), Temperature: 25 °C, pH: 5.5–6.5 (adsorption isotherm experiment), 2.27, 4.14, 5.99, 6.04, 9.08, and 11.16 (pH-effects experiment)HematiteParticle surface, Specific area: 9.9 m2/g,
Purity: 70%
34–59 µg/g (sorption isotherm), at pH 2.27 and 11.16: ~21 µg/g and ~17 µg/g, from Na+ concentration 0 and 100 mmol/L: ~22 and 22 µg/g, from Ca2+ concentration 0, 1, 10 mmol/L: ~24, 24, and 24 µg/gMonolayerSurfaces not well-definedZhao et al. (2014) [96]
PFHxAWater, CaCl2, and NaCl, (0.01–10 mM), (0.1–100 mM), Temperature: 25 °C, pH: 5.5–6.5 (adsorption isotherm experiment), 2.27, 4.14, 5.99, 6.04, 9.08, and 11.16 (pH-effects experiment)KaoliniteParticle surface, Specific area: 23.11 m2/g, Purity: >95%34–59 µg/g (sorption isotherm), from pH 2.27 and 11.16: ~19 µg/g and ~12 µg/g, from Na+ concentration 0 and 100 mmol/L: ~19 and 19 µg/g, from Ca2+ concentration 0, 1, 10 mmol/L: ~19, 19, and 18 µg/gMonolayerSurfaces not well-definedZhao et al. (2014) [96]
PFHxAWater, CaCl2, and NaCl, (0.01–10 mM), (0.1–100 mM), Temperature: 25 °C, pH: 5.5–6.5 (adsorption isotherm experiment), 2.27, 4.14, 5.99, 6.04, 9.08, and 11.16 (pH-effects experiment)MontmorilloniteParticle surface, Specific area: 67.52 m2/g, Purity: 99%34–59 µg/g (sorption isotherm), at pH 2.27 and 11.16: ~18 µg/g ~16 µg/g, from Na+ concentration 0 and 100 mmol/L: ~20 and 19 µg/g, from Ca2+ concentration 0, 1, 10 mmol/L: ~19, 19, and 19 µg/gMonolayerSurfaces not well-definedZhao et al. (2014) [96]
PFHxAWater,
Temperature: 25 °C, pH: 6.3
Organo-montmorillonites (0.5CEC-Mt)Particle surfaceAdsorption capacity: ~0.03 mmol/gNot reportedSurfaces not well-definedZhou et al. (2010) [84]
PFHxADeionized water (alone) and NaCl (50 mM) (separate experiments) Temperature: not reported,
pH: not reported
SOMS (organosilica adsorbent)Particle surface, Particle size: 250–450 µm Surface area: 650 m2/g,
Pore volume: 1.03 mL/g
Adsorption capacity: ~3 mg/g (in deionized water), ~1 mg/g (in 50 mM NaCl)Not reported Stebal et al. (2019) [66]
PFHxADeionized water (alone) and NaCl (50 mM) (separate experiments), Temperature: not reported
pH: not reported
F-SOMS (fluoroalkyl modified)Particle surface, Particle size: 250–450 µm Surface area: 660 m2/g,
Pore volume: 1.04 mL/g
Adsorption capacity: ~3.5 mg/g (in deionized water), ~3 mg/g (in 50 mM NaCl)Not reported Stebal et al. (2019) [66]
PFHxS potassium saltWater, CaCl2, and NaCl, (0.01–10 mM), (0.1–100 mM), Temperature: 25 °C, pH: 6.8–7.1 (adsorption isotherm experiment), 2.27, 4.14, 5.99, 6.04, 9.08, and 11.16 (pH-effects experiment)HematiteParticle surface, Specific area: 9.9 m2/g,
Purity: 70%
312–370 µg/g (sorption isotherm), at pH 2.27 and 11.16: ~33 µg/g and ~29 µg/g, from Na+ concentration 0 and 100 mmol/L: ~30 and 34 µg/g, from Ca2+ concentration 0, 1, 10 mmol/L: ~31, 32, and 35 µg/gMonolayerSurfaces not well-definedZhao et al. (2014) [96]
PFHxS potassium saltWater, CaCl2, and NaCl, (0.01–10 mM), (0.1–100 mM), Temperature: 25 °C, pH: 6.8–7.1 (adsorption isotherm experiment), 2.27, 4.14, 5.99, 6.04, 9.08, and 11.16 (pH-effects experiment)KaoliniteParticle surface, Specific area: 23.11 m2/g, Purity: >95%312–370 µg/g (sorption isotherm), at pH 2.27 and 11.16: ~27 µg/g and ~26 µg/g, from Na+ concentration 0 and 100 mmol/L: ~27 and 27 µg/g, from Ca2+ concentration 0, 1, 10 mmol/L: ~26, 26, and 26 µg/gMonolayerSurfaces not well-definedZhao et al. (2014) [96]
PFHxS potassium saltWater, CaCl2, and NaCl, (0.01–10 mM), (0.1–100 mM), Temperature: 25 °C, pH: 6.8–7.1 (adsorption isotherm experiment), 2.27, 4.14, 5.99, 6.04, 9.08, and 11.16 (pH-effects experiment)MontmorilloniteParticle surface, Specific area: 67.52 m2/g, Purity: 99%312–370 µg/g (sorption isotherm), at pH 2.27 and 11.16: ~31 µg/g and ~29 µg/g, from Na+ concentration 0 and 100 mmol/L: ~29 and 29 µg/g, from Ca2+ concentration 0, 1, 10 mmol/L: ~29, 30, and 29 µg/gMonolayerSurfaces not well-definedZhao et al. (2014) [96]
PFHxSWater,
Temperature: 25 °C, pH: 6.3
Organo-montmorillonites (0.5CEC-Mt)Particle surfaceAdsorption capacity: ~0.44 mmol/gNot reportedSurfaces not well-definedZhou et al. (2010)
PFHxSDeionized water (alone) and NaCl (50 mM) (separate experiments), Temperature: not reported,
pH: not reported
SOMS (organosilica adsorbent)Particle surface, Particle size: 250–450 µm, Surface area: 650 m2/g,
Pore volume: 1.03 mL/g
Adsorption capacity: ~1 mg/g (in deionized water), ~2 mg/g (in 50 mM NaCl)Not reported Stebal et al. (2019) [66]
PFHxSDeionized water (alone) and NaCl (50 mM) (separate experiments), Temperature: not reported, pH: not reportedF-SOMS (fluoroalkyl modified)Particle surface, Particle size: 250–450 µm, Surface area: 660 m2/g
Pore volume: 1.04 mL/g
Adsorption capacity: ~2 mg/g (in deionized water), ~3 mg/g (in 50 mM NaCl)Not reported Stebal et al. (2019) [66]
PFHpAWater and NaHCO3/NaCl (1.0 mM),
Temperature: ~22.2 °C,
pH: 7.5
KaoliniteParticle surface, Mean diameter: 1.1 µm (narrow size distribution) Surface area: 10 m2/gSolid–water distribution coefficients (logkd): Single compound system = not detectable, Multi-compound system = not applicableNot reported Xiao et al. (2011) [42]
PFHpADeionized water (alone) and NaCl (50 mM) (separate experiments). Temperature: not reported,
pH: not reported
SOMS (organosilica adsorbent)Particle surface, Particle size: 250–450 µm, Surface area: 650 m2/g
Pore volume: 1.03 mL/g,
Adsorption capacity: ~3 mg/g (in deionized water), ~9 mg/g (in 50 mM NaCl)Not reported Stebal et al. (2019) [66]
PFHpADeionized water (alone) and NaCl (50 mM) (separate experiments), Temperature: not reported,
pH: not reported
F-SOMS (fluoroalkyl modified)Particle surface, Particle size: 250–450 µm, Surface area: 660 m2/g,
Pore volume: 1.04 mL/g
Adsorption capacity: ~3 mg/g (in deionized water), ~5 mg/g (in 50 mM NaCl)Not reported Stebal et al. (2019) [66]
PFOAWater and D2O (studied separately), Temperature: 300 KSilica (SiO2)Crystal surface, Crystal dimensions: 50 × 50 × 10 nm30 µg/m2Not applicable Hellsing et al. (2016) [12]
PFOAWater,
pH: 6,
Initial HA concentration: 10 mg/L
SiO2Particle surface, Particle size: 2.3 µm
Specific surface area: 6.1 m2/g
0.851 µg/m2 (no HA present),
Sorption density: 0.08 mg/m2 (HA added before PFOA), ~1.1 µg/m2 (concurrent addition of PFOA and HA) (at equilibrium concentration ~700 µg/L of PFOA)
Monolayer (no HA), No structure reported (HA present) Yang et al. (2016) [79]
PFOAWater,
Temperature: 20–45 °C,
pH: 5, 10.2, and 1.3
Glass silica (siloxane, silanol patches)Flat surface; siloxane and silanol patchesSurface excess: 217 molecules/µm2, Adsorbed amount: 3.60 × 10⁻⁴ µmol/m2 (pH 5.0), 1.33 × 10⁻⁴ µmol/m2, 7.46 × 10⁻⁴ µmol/m2 (pH 10.2, 1.3)MonolayerSchematics are the only available information on the adsorbed structureShafique et al. (2017) [85]
PFOAWater and D2O (studied separately), Temperature: 300 KAlumina (Al2O3)Crystal surface, Crystal dimensions: 50 × 50 × 10 nm30.0036 µg/m2Monolayer Hellsing et al. (2016) [12]
PFOAWater,
pH: 6,
Initial HA concentration: 10 mg/L
Al2O3Particle surface, Particle size: 1.7 µm,
Specific surface area: 6.0 m2/g
1.72 µg/m2 (no HA present), Sorption density: 0.07 mg/m2 (HA added before PFOA), ~1.9 µg/m2 (concurrent addition of PFOA and HA into the aqueous system) (at equilibrium concentration ~700 µg/L of PFOA)Monolayer (no HA), No structure reported (HA present) Yang et al. (2016) [79]
PFOAWater, NaCl, KCl, CaCl2, and MgCl2 (0.001 M-0.1 M) (separate experiments), Temperature: 25 °C, pH: 4.3–7.2Alumina (Al2O3)Particle surface, Surface area: ~88.6 m2/g, Average particle size: 87.05 µm, non-crystalline0.157 µg/m2, In 0.001 M and 0.1 M NaCl, KCl, CaCl2, MgCl2: ~0.065 µg/m2 and ~0.001 µg/m2, During pH experiments: ~0.078 µg/m2 (pH 4.3) and ~0.004 µg/m2 (pH 7.2)Monolayer Wang et al. (2011) [97]
PFOA ammonium saltDeionized water, pH: ~3.9, Temperature: 255–273 KPorous alumina (Al2O3)Particle surface, Particle size: 0.063–0.200 mm, Pore diameter: ~90 Å,
Specific area: 120 m2/g
Adsorbed amount (Γ) = 0.46, 0.92, 1.37, 1.84, 2.58, 3.26, 4.5, 5.1, 5.1, 5.3, 5.1, 5.2 µmol/m2Bilayer Evenas et al. (2002) [85]
PFOAWater, NaCl, and CaCl2 (0.0001–0.1 M),
Temperature: 25 °C, pH: 4–7.5 (pH experiment) and 7 (all other experiments)
BoehmiteParticle surface, Surface area: ~299.2 m2/g, Average particle size: 37.02 µmAdsorption capacity: 0.633 µg/m2, Adsorbed amount from kinetic experiment: 0.09 µg/m2, at pH 4 and 7.5: ~0.108 µg/m2 and ~0.09 µg/m2, In 0.0001 M NaCl and 0.1 M NaCl: ~0.0 µg/m2 and ~0.05 µg/m2, In 0.0001 M CaCl2 and 0.1 M CaCl2: ~0.0 µg/m2 and ~0.043 µg/m2MonolayerSurfaces not well-definedWang et al. (2012) [91]
PFOAWater,
pH: 6,
Initial HA concentration: 10 mg/L
Fe2O3Particle surface, Particle size: 1.2 µm,
Specific surface area: 6.0 m2/g
0.97 µg/m2 (no HA present), Sorption density: 0.07 mg/m2 (HA added before PFO, ~2.3 µg/m2 (concurrent addition of PFOA and HA) (at equilibrium concentration ~700 µg/L of PFOA)Monolayer (no HA), No structure reported (HA present) Yang et al. (2016) [79]
PFOAWater, CaCl2, and NaCl, (0.01–10 mM), (0.1–100 mM), Temperature: 25 °C, pH: 5.5–6.5 (adsorption isotherm experiment), 2.27, 4.14, 5.99, 6.04, 9.08, and 11.16 (pH-effects experiment)HematiteParticle surface, Specific area: 9.9 m2/g,
Purity: 70%
104–112 µg/g (sorption isotherm), at pH 2.27 and 11.16: ~28 µg/g and ~18 µg/g, from Na+ concentration 0 and 100 mmol/L: ~21 and 22 µg/g, from Ca2+ concentration 0, 1, 10 mmol/L: ~23, 24, and 25 µg/gMonolayerSurfaces not well-definedZhao et al. (2014) [96]
PFOAWater and NaHCO3/NaCl (1.0 mM),
Temperature: ~22.2 °C,
pH: 7.4
KaoliniteParticle surface, Mean diameter: 1.1 µm (narrow size distribution), Surface area: 10 m2/gSolid-Water Distribution Coefficients (logkd): Single compound system = ~0.36 L/kg, Multi-compound system = not detectableNot reported Xiao et al. (2011) [42]
PFOAWater, CaCl2, and NaCl, (0.01–10 mM), (0.1–100 mM), Temperature: 25 °C, pH: 5.5–6.5 (adsorption isotherm experiment), 2.27, 4.14, 5.99, 6.04, 9.08, and 11.16 (pH-effects experiment)KaoliniteParticle surface, Specific area: 23.11 m2/g,
Purity: >95%
104-112 µg/g (sorption isotherm), at pH 2.27 and 11.16: ~24 µg/g and ~16 µg/g, from Na+ concentration 0 and 100 mmol/L: ~19 and 19 µg/g from Ca2+ concentration 0, 1, 10 mmol/L: ~18, 21, and 22 µg/gMonolayerSurfaces not well-definedZhao et al. (2014) [96]
PFOAWater, CaCl2, and NaCl, (0.01–10 mM), (0.1–100 mM), Temperature: 25 °C, pH: 5.5–6.5 (adsorption isotherm experiment), 2.27, 4.14, 5.99, 6.04, 9.08, and 11.16 (pH-effects experiment)MontmorilloniteParticle surface, Specific area: 67.52 m2/g, Purity: 99%104–112 µg/g (sorption isotherm), at pH 2.27 and 11.16: ~23 µg/g and ~12 µg/g, from Na+ concentration 0 and 100 mmol/L: ~15 µg/g and 15 µg/g, from Ca2+ concentration 0, 1, 10 mmol/L: ~15, 16, and 15 µg/gMonolayerSurfaces not well-definedZhao et al. (2014) [96]
PFOAWater,
Temperature: 25 °C,
pH: 6.3
Organo-montmorillonites (0.2CEC-Mt)Particle surfaceAdsorption capacity: ~0.08 mmol/gNot reportedSurfaces not well-definedZhou et al. (2010) [84]
PFOAWater,
Temperature: 25 °C, pH: 6.3
Organo-montmorillonites (0.5CEC-Mt)Particle surfaceAdsorption capacity: ~0.12 mmol/gNot reportedSurfaces not well-definedZhou et al. (2010) [84]
PFOAWater,
Temperature: 25 °C, pH: 6.3
Organo-montmorillonites (1.0CEC-Mt)Particle surfaceAdsorption capacity: ~0.35 mmol/gNot reportedSurfaces not well-definedZhou et al. (2010) [84]
PFOADeionized water (alone) and NaCl (50 mM) (separate experiments). Temperature: not reported,
pH: not reported
SOMS (organosilica adsorbent)Particle surface, Particle size: 250–450 µm, Surface area: 650 m2/g,
Pore volume: 1.03 mL/g
Adsorption capacity: ~3 mg/g (in deionized water), ~23 mg/g (in 50 mM NaCl)Not reported Stebal et al. (2019) [66]
PFOADeionized water (alone) and NaCl (50 mM) (separate experiments), Temperature: not reported,
pH: not reported
F-SOMS (fluoroalkyl modified)Particle surface, Particle size: 250–450 µm, Surface area: 660 m2/g,
Pore volume: 1.04 mL/g
Adsorption capacity: ~3 mg/g (in deionized water), ~23 mg/g (in 50 mM NaCl)Not reported Stebal et al. (2019) [66]
PFOSWater and D2O (studied separately), Temperature: 300 KSilica (SiO2)Crystal surface, Crystal Dimensions: 50 × 50 × 10 nm30 µg/m2Not applicable Hellsing et al. (2016) [12]
PFOSWater and NaNO3 (0.1 mmol/L),
pH: 7,
Temperature: 298K
Nanosize SiO2Particle surface, Average diameter: 15 nm,
Surface hydroxyl density: 35.5 µmol/m2,
Surface area: 64.1 m2/g
0.1 µg/m2 (initial PFOS concentration of 0.2 µmol/L)Bilayer Lu et al. (2016) [95]
PFOSWater and NaCl (0.1 M),
Temperature: 20–45 °C,
pH: 4
Glass silica (siloxane, silanol patches)Flat surface; siloxane and silanol patchesSurface excess: 7241 molecules/µm2, Adsorbed amount: 1.20 × 10⁻² µmol/m2 (pH 5.0)MultilayerSchematics are the only available information on the adsorbed surface structureShafique et al. (2017) [85]
PFOS potassium saltWater and KNO3 (0.01–0.1 M)Ottawa sand (SiO2)Particle surface, Surface area: 2 × 10⁻³ m2/gAdsorption isotherm experiment: 10 PFOS molecules/nm2Monolayer Johnson et al. (2007) [90]
PFOSWater and KCl (concentration not reported), Temperature: 298 KTiO2Flat surface; (110), (001), (100) plane, ~41 × 40 × 12 Å3 (Lx, Ly, Lz)Not reportedMonolayerMolecular Dynamics simulationsHe et al. (2013) [99]
PFOSWater and CaCl2 (concentration not reported), Temperature: 298 KTiO2Flat surface; (110) plane, ~4.1 ×3.9 × 1.4 nm3 (Lx, Ly, Lz)Not reportedMultilayerMolecular Dynamics simulationsHe et al. (2015) [100]
PFOSWater and NaNO3 (0.1 mmol/L),
pH: 7,
Temperature: 298 K
Nanosize TiO2Particle surface, Average diameter: 25 nm,
Surface hydroxyl density: 18.3 µmol/m2,
Surface area: 278 m2/g
0.7 µg/m2 (Initial PFOS concentration of 0.2 µmol/L)Bilayer Lu et al. (2016) [95]
PFOSWater and D2O (studied separately), Temperature: 300 KAlumina (Al2O3)Crystal surface, Crystal dimensions: 50 × 50 × 10 nm30.0035 µg/m2Monolayer Hellsing et al. (2016) [12]
PFOS potassium saltWater, NaCl, KCl, CaCl2, and MgCl2 (0.001 M-0.1 M) (separate experiments), Temperature: 25 °C, pH: ~4.5–7Alumina (Al2O3)Particle surface, Surface area: ~88.6 m2/g, Average particle size: 87.05 µm, non-crystalline0.252 µg/m2; In 0.001 M and 0.1 M NaCl, KCl, CaCl2, MgCl2: 0.085 µg/m2 and 0.025 µg/m2, during pH experiments: ~0.09 µg/m2 (pH 4.5) and ~0.02 µg/m2 (pH 7)Monolayer Wang et al. (2011) [97]
PFOSWater and NaNO3 (0.1 mmol/L),
pH: 7,
Temperature: 298 K
Nanosize Al2O3Particle surface, Average diameter: 50 nm,
Surface hydroxyl density: 31.2 µmol/m2,
Surface area: 198 m2/g
1.1 µg/m2 (initial PFOS concentration of 0.2 µmol/L)Bilayer Lu et al. (2016) [95]
PFOS sodium saltWater,
Temperatures: 30 °C, 40 °C, 50 °C (isotherm equilibrium experiment), and 25 °C (all other experiments),
pH: 4–10 (pH-effects experiment),
Humic acid concentration: 1–50 mg/L (humic acid–effects experiment), 0.001–0.1 M NaCl (salt-effects experiment)
Alumina nanoparticlesParticle surface, Particle size: 13 nm,
Surface area: 83 m2 g−1
At 30 °C: 589 mg/g, at 40 °C: 485 mg/g, at 50 °C: 447mg/g (mg/g absorbate on absorbent), At pH 4 and 10: ~240 µg/g and ~80 µg/g, In 1 mg/L and 50 mg/L HA: ~143 µg/g and 45 µg/g (pH 4), ~37 µg/g and ~27 µg/g (pH 7), ~19 µg/g and ~16 µg/g (pH 10), In 0.001 M and 0.1 M NaCl: ~180 µg/g and ~25 µg/gMonolayer Jian et al. (2019) [87]
PFOS sodium saltWater,
Temperature: 30 °C, 40 °C, 50 °C (isotherm equilibrium experiment), and 25 °C (all other experiments),
pH: 4–10 (pH change experiment) Humic acid concentration: 1–50 mg/L (humic acid effects experiment), 0.001–0.1 M NaCl (salt-effects experiment)
Alumina nanowiresParticle surface, Particle size: 2–6 nm (diameter) 13 nm (length), Surface area: 124.9 m2g−1At 30 °C: 589, at 40 °C: 485, at 50 °C: 447 (mg/g absorbate on absorbent), At pH 4 and 10: ~30 µg/g and ~5 µg/g, In 1 mg/L and 50 mg/L HA: ~27 µg/g and 8 µg/g (pH 4), ~9 µg/g and ~2 µg/g (pH 7), ~4 µg/g and ~1 µg/g (pH 10), In 0.001 M and 0.1 M NaCl: ~10 µg/g and ~10 µg/gMonolayerSodium perfluoro-[13C8]-octanesulfonate (M8PFOS)Jian et al. (2019) [87]
PFOSWater and KH2PO4 (50 mg/L) (all experiments), Temperatures: 303 K (pH experiment), 293 K, 303 K, and 313 K (kinetic experiments),
pH: 4.3 (kinetic experiment), 3–10.5 (pH experiment)
BoehmiteParticle surface, Surface area: ~299.2 m2/g, Average particle size: 37.02 µmAdsorption capacity: 0.1529 µg/m2 (at 293K), 0.1176 µg/m2 (at 303K), 0.0980 µg/m2 (at 303 K), Adsorbed amount at pH 3 and 10.5: ~0.31 µg/m2 and ~0.07 µg/m2MonolayerSurfaces not well-definedQian et al. (2017) [93]
PFOS potassium saltWater, NaCl, and CaCl2 (0.0001 M–0.1 M),
Temperature: 25 °C, pH: 4–7.5 (pH experiment) and 7 (all other experiments)
BoehmiteParticle surface, Surface area: ~299.2 ± 1.8 m2/g,
Average particle size: 37.02 µm
Adsorption capacity: 0.877 µg/m2, Adsorbed amount from kinetic experiment: 0.105 µg/m2, at pH 4 and 7.5: ~0.125 µg/m2 and ~0.105 µg/m2, In 0.0001 M NaCl and 0.1 M NaCl: ~0.0 µg/m2 and ~0.07 µg/m2, In 0.0001 M CaCl2 and 0.1 M CaCl2: ~0.0 µg/m2 and ~0.055 µg/m2MonolayerSurfaces not well-definedWang et al. (2012) [91]
PFOS potassium saltWater, NaCl, and CaCl2 (0.0001 M–0.1 M),
Temperature: 25 °C pH: 4–7.5, (pH experiment) and 7 (all other experiments),
HA concentration: 2–50 mg/L
BoehmiteParticle surface, Surface area: ~299.2 m2/g, Average particle size: 37.02 µmAdsorption capacity: 0.877 µg/m2, Adsorbed amount from kinetic experiment: 0.105 µg/m2, at pH 4 and 7.5: ~0.125 µg/m2 and ~0.105 µg/m2, In 0.0001 M NaCl and 0.1 M NaCl: ~0.0 µg/m2 and ~0.07 µg/m2, In 0.0001 M CaCl2 and 0.1 M CaCl2: ~0.0 µg/m2 and ~0.055 µg/m2, HA concentration 2 and 50 mg/L: ~0.09 µg/m2 and ~0.018 µg/m2MonolayerSurfaces not well-definedShih et al. (2013) [92]
PFOS potassium saltWater, CaCl2, and NaCl, (0.01–10 mM), (0.1–100 mM), Temperature: 25 °C, pH: 6.8–7.1 (adsorption isotherm experiment), 2.27, 4.14, 5.99, 6.04, 9.08, and 11.16 (pH-effects experiment)HematiteParticle surface, Specific area: 9.9 m2/g,
Purity: 70%
294–312 µg/g (sorption isotherm), at pH 2.27 and 11.16: ~63 µg/g and ~22 µg/g, from Na+ concentration 0 and 100 mmol/L: ~42 and 59 µg/g, from Ca2+ concentration 0, 1, 10 mmol/L: ~42, 51, and 56 µg/gMonolayerSurfaces not well-definedZhao et al. (2014) [96]
PFOSWater and NaNO3 (0.1 mmol/L),
pH: 7,
Temperature: 298K
Nanosize Fe2O3Particle surface, Average diameter: 75, Surface hydroxyl density: 21 µmol/m2,
Surface area: 41.7 m2/g
4.0 µg/m2 (initial PFOS concentration of 0.2 µmol/L)Bilayer Lu et al. (2016) [95]
PFOS potassium saltWater and KNO3 (0.01–0.1 M),
pH: 4.1-8.6
Goethite (α-FeO(OH))Particle surface, Surface area: 58 m2/gAdsorption isotherm experiment: 1.4 × 10⁻³ PFOS molecules/nm2, Mass adsorbed: (pH dependence experiments) ~3.7 µg (pH 4.1) and ~1.7 µg (pH 8.6)Monolayer Johnson et al. (2007) [90]
PFOS potassium saltWater and KNO3 (0.01–0.1 M)High-iron sand (Fe3O4)Particle surface, Surface area: 6 m2/gAdsorption isotherm experiment: 5 × 10⁻³ PFOS molecules/nm2Multilayer Johnson et al. (2007) [90]
PFOSWater and NaHCO3/NaCl (1.0 mM),
Temperature: ~22.2 °C,
pH: 7.5
KaoliniteParticle surface, Mean diameter: 1.1 µm (narrow size distribution), Surface area: 10 m2/gSolid–water distribution coefficients (logkd): Single compound system = ~1.16 L/kg, Multi-compound system = ~0.88 L/kgNot reported Xiao et al. (2011) [42]
PFOS potassium saltWater and KNO3 (0.01–0.1 M),
pH: 2.2-7.4
Kaolinite (Al2Si2O5(OH)4)Particle surface, Surface area: 10 m2/gAdsorption isotherm experiment: 6.0 × 10⁻³ PFOS molecules/nm2, Mass adsorbed during pH dependence experiments: ~4.4 µg (pH 2.2) and ~2.8 µg (pH 7.4)Monolayer Johnson et al. (2007) [90]
PFOS potassium saltWater and NaCl (10 mM),
Temperature: unreported (adsorption experiments), 22 °C (adsorption experiments with HA),
pH: 7 (adsorption experiments) and 3–11 (zeta potential experiments)
HA concentration: 100mg/L
KaoliniteParticle surface, particle size: 1187 ± 380 nm, Surface area: 11.9 m2/g77.6 ± 3.3 µg/g (without HA in solution), ~63 ± 8 µg/g (with HA in solution)Not reported Zhang et al. (2014) [78]
PFOS potassium saltWater, CaCl2, and NaCl, (0.01–10 mM), (0.1–100 mM), Temperature: 25 °C, pH: 6.8–7.1 (adsorption isotherm experiment), 2.27, 4.14, 5.99, 6.04, 9.08, and 11.16 (pH-effects experiment)KaoliniteParticle surface, Specific area: 23.11 m2/g,
Purity: >95%
294–312 µg/g (sorption isotherm), at pH 2.27 and 11.16: ~34 µg/g and ~17 µg/g, from Na+ concentration 0 and 100 mmol/L: ~19 and 23 µg/g, from Ca2+ concentration 0, 1, 10 mmol/L: ~21, 26, and 27 µg/gMonolayerSurfaces not well-definedZhao et al. (2014) [96]
PFOS potassium saltWater and NaCl (10 mM),
Temperature: unreported (adsorption experiments) and 22 °C (adsorption experiments with HA),
pH: 7 (adsorption experiment) and 3–11 (zeta potential experiment),
HA concentration: 100 mg/L
MontmorilloniteParticle surface, particle size: 842.9 ± 125.9 nm,
Surface area: 82.9 m2/g
54.5 ± 7.2 µg/g (without HA in solution), ~41 ± 5 µg/g (with HA in solution)Not reported Zhang et al. (2014) [78]
PFOS potassium saltWater, CaCl2, and NaCl, (0.01–10 mM), (0.1–100 mM), Temperature: 25 °C, pH: 6.8–7.1 (adsorption isotherm experiment), 2.27, 4.14, 5.99, 6.04, 9.08, and 11.16 (pH-effects experiment)MontmorilloniteParticle surface, Specific area: 67.52 m2/g,
Purity: 99%
294–312 µg/g (sorption isotherm), at pH 2.27 and 11.16: ~37 µg/g ~17 µg/g, from Na+ concentration 0 and 100 mmol/L: ~19 and 24 µg/g, from Ca2+ concentration 0, 1, 10 mmol/L: ~19, 23, and 26 µg/gMonolayerSurfaces not well-definedZhao et al. (2014) [96]
PFOS potassium saltWater,
Temperature: 25 °C, pH: 6.3
Organo-montmorillonites (Na-Mt)Particle surfaceAdsorption capacity: 0.239 mmol/gMonolayerSurfaces not well-definedZhou et al. (2010) [84]
PFOS potassium saltWater,
Temperature: 25° C, pH: 6.3
Organo-montmorillonites (0.2CEC-Mt)Particle surfaceAdsorption capacity: 0.550 mmol/gMonolayerSurfaces not well-definedZhou et al. (2010) [84]
PFOS potassium saltWater,
Temperature: 25 °C, pH: 6.3
Organo-montmorillonites (0.5CEC-Mt)Particle surfaceAdsorption capacity: 0.912 mmol/gMonolayerSurfaces not well-definedZhou et al. (2010) [84]
PFOS potassium saltWater,
Temperature: 25 °C, pH: 6.3
Organo-montmorillonites (1.0CEC-Mt)Particle surfaceAdsorption capacity: 1.492 mmol/gMonolayerSurfaces not well-definedZhou et al. (2010) [84]
PFOS potassium saltWater,
Temperature: 25 °C, pH: 6.3
Organo-montmorillonites (2.5CEC-Mt)Particle surfaceAdsorption capacity: 1.71 mmol/gMonolayerSurfaces not well-definedZhou et al. (2010) [84]
PFOSDeionized water (alone) and NaCl (50 mM) (separate experiments), Temperature: not reported,
pH: not reported
SOMS (organosilica adsorbent)Particle surface, Particle size: 250–450 µm, Surface area: 650 m2/g,
Pore volume: 1.03 mL/g
Adsorption capacity: ~7 mg/g (in deionized water), ~55 mg/g (in 50 mM NaCl)Not Reported Stebal et al. (2019) [66]
PFOSDeionized water (alone) and NaCl (50 mM) (separate experiments), Temperature: not reported,
pH: not reported
F-SOMS (fluoroalkyl modified)Particle surface, Particle size: 250–450 µm, Surface area: 660 m2/g,
Pore volume: 1.04 mL/g
Adsorption capacity: ~7 mg/g (in deionized water), ~68 mg/g (in 50 mM NaCl)Not Reported Stebal et al. (2019) [66]
PFOS potassium saltWater and KNO3 (0.01–0.1 M)Lake Michigan a=sedimentParticle surface, Surface area: not reportedNot reported, “unpredictable nature of the compound”Monolayer Johnson et al. (2007) [90]
TEA-FOSWater and NaCl (0–50 mM), Temperature: 21 °C, pH: 3.4 and 10Hydroxylated germaniumFlat Surface, 45-degree trapezoidal Ge, Dimensions: 80 × 10 × 4 mm, referred to as an internal reflection element (IRE). Ge surface was placed in a flow-through cell coated with Teflon.At pH 3.4: 28.7 µg/m2 (in 0 mM NaCl), 31.9 µg/m2 (in 1 mM NaCl), 35.9 µg/m2 (in 2 mM NaCl), 42.9 µg/m2 (in 5 mM NaCl), 25.8 mM (in 10 mM Nacl), 23.0 µg/m2 (in 20 mM NaCl), 6.47 µg/m2 (in 50 mM NaCl). At pH 10: 7.58 µg/m2 (in 0 mM NaCl), 10.2 µg/m2 (in 1 mM NaCl), 12.2 µg/m2 (in 2 mM NaCl), 21.0 µg/m2 (in 5 mM NaCl), 19.6 mM (in 10 mM NaCl), 16.9 µg/m2 (in 20 mM NaCl), 9.83 µg/m2 (in 50 mM NaCl)Multilayer Xing et al. (2013) [98]
PFNAWater and D2O (studied separately), Temperature: 300 KSilica (SiO2)Crystal surface, Crystal dimensions: 50 × 50 × 10 nm3Not applicableNot applicable Hellsing et al. (2016) [12]
PFNAWater,
Temperature: 20–45 °C,
pH: 5
Glass silica (siloxane, silanol patches)Flat surface; siloxane and silanol patchesSurface excess: 397 molecules/µm2, Adsorbed amount: 6.60 × 10⁻⁴ µmol/m2 (pH 5.0)MonolayerSchematics are the only available information on the adsorbed surface structureShafique et al. (2017) [85]
PFNAWater and D2O (studied separately), Temperature: 300 KAlumina (Al2O3)Crystal surface, Crystal dimensions: 50 × 50 × 10 nm30.0058 µg/m2Monolayer Hellsing et al. (2016) [12]
PFNAWater and NaHCO3/NaCl (1.0 mM),
Temperature: ~22.2 °C,
pH: 7.5
KaoliniteParticle surface, Mean diameter: 1.1 µm (narrow size distribution), Surface area: 10 m2/gSolid–water distribution coefficients (logkd): Single compound system = ~0.74 L/kg, Multi-compound system = ~0.30 L/kgNot reported Xiao et al. (2011) [42]
PFNADeionized water (alone) and NaCl (50 mM) (separate experiments), Temperature: not reported,
pH: not reported
SOMS (organosilica adsorbent)Particle surface, Particle size: 250–450 µm, Surface area: 650 m2/g,
Pore volume: 1.03 mL/g
Adsorption capacity: ~4 mg/g (in deionized water), ~13 mg/g (in 50 mM NaCl)Not Reported Stebal et al. (2019) [66]
PFNADeionized water (alone) and NaCl (50 mM) (separate experiments), Temperature: not reported,
pH: not reported
F-SOMS (fluoroalkyl modified)Particle surface, Particle size: 250–450 µm, Surface area: 660 m2/g,
Pore volume: 1.04 mL/g
Adsorption capacity: ~0.2 mg/g (in deionized water), ~15 mg/g (in 50 mM NaCl)Not Reported Stebal et al. (2019) [66]
PFDAWater,
Temperature: 20–45 °C,
pH: 5
Glass silica (siloxane, silanol patches)Flat surface; siloxane and silanol patchesSurface excess: 499 molecules/µm2, Adsorbed amount: 8.28 × 10⁻⁴ µg/m2 (pH 5.0)MonolayerSchematics are the only available information on the adsorbed surface structureShafique et al. (2017) [85]
PFDAWater and NaHCO3/NaCl (1.0 mM),
Temperature: ~22.2 °C,
pH: 7.5
KaoliniteParticle surface, Mean diameter: 1.1 µm (narrow size distribution), Surface area: 10 m2/gSolid–water distribution coefficients (logkd): Single compound system = ~1.30 L/kg, Multi-compound system = 1.05 L/kgNot reported Xiao et al. (2011) [42]
PFDADeionized water (alone) and NaCl (50 mM) (separate experiments), Temperature: not reported,
pH: not reported
SOMS (organosilica adsorbent)Particle surface, Particle size: 250–450 µm, Surface area: 650 m2/g,
Pore volume: 1.03 mL/g
Adsorption capacity: ~7 mg/g (in deionized water), ~17 mg/g (in 50 mM NaCl)Not Reported Stebal et al. (2019) [66]
PFDADeionized water (alone) and NaCl (50 mM) (separate experiments), Temperature: not reported,
pH: not reported
F-SOMS (fluoroalkyl modified)Particle surface, Particle size: 250–450 µm, Surface area: 660 m2/g,
Pore volume: 1.04 mL/g
Adsorption capacity: ~0.2 mg/g (in deionized water), ~21 mg/g (in 50 mM NaCl)Not Reported Stebal et al. (2019) [66]
PFUnDAWater,
Temperature: 20–45 °C,
pH: 5
Glass silica (siloxane, silanol patches)Flat surface; siloxane and silanol patchesSurface excess: 2845 molecules/µm2, Adsorbed amount: 4.73 × 10⁻³ µmol/m2 (pH 5.0)MultilayerSchematics are the only available information on the adsorbed surface structureShafique et al. (2017) [85]
PFUnDAWater and NaHCO3/NaCl (1.0 mM),
Temperature: ~22.2 °C,
pH: 7.5
KaoliniteParticle surface, Mean diameter: 1.1 µm (narrow size distribution), Surface area: 10 m2/gSolid–water distribution coefficients (logkd): Single compound system = ~1.70 L/kg, Multi-compound system = ~1.72 L/kgNot reported Xiao et al. (2011) [42]
PFDoDAWater,
Temperature: 20–45 °C,
pH: 5
Glass silica (siloxane, silanol patches)Flat surface; siloxane and silanol patchesSurface Excess: 3337 molecules/µm2, Adsorbed Amount: 5.54 × 10⁻³ µmol/m2 (pH 5.0),MultilayerSchematics are the only available information on the adsorbed surface structureShafique et al. (2017) [85]
PFDoDAWater,
Temperature: 25 °C, pH: 6.3
Organo-montmorillonites (0.5CEC-Mt)Particle surfaceAdsorption capacity: ~0.16 mmol/gNot reportedSurfaces not well-definedZhou et al. (2010) [84]