Article

Ni-Doped Titanium Dioxide Films Obtained by Plasma Electrolytic Oxidation in Refrigerated Electrolytes

1
Department of Chemistry, Materials and Chemical Engineering “G. Natta”, Politecnico di Milano, 20133 Milano, Italy
2
Department of Chemistry, Università degli Studi di Milano, 20122 Milano, Italy
3
Department of Physics, Politecnico di Milano, 20133 Milano, Italy
4
Department of Experimental Physics, The Weinberg Research Center, Tomsk Polytechnic University, Lenin Avenue 2a, 634050 Tomsk, Russia
*
Author to whom correspondence should be addressed.
Surfaces 2020, 3(2), 168-181; https://doi.org/10.3390/surfaces3020013
Submission received: 25 February 2020 / Revised: 22 March 2020 / Accepted: 31 March 2020 / Published: 17 April 2020
(This article belongs to the Special Issue Surface Aspects of Semiconductor Photochemistry)

Abstract

:
Porous crystalline Ni-doped TiO2 films were produced using DC plasma electrolytic oxidation in refrigerated H2SO4 aqueous solutions containing NiSO4. The crystalline phase structure consisted of a mixture of anatase and rutile, ranging from ~30 to ~80 wt % rutile. The oxide films obtained at low NiSO4 concentration showed the highest photocurrent values under monochromatic irradiation in the UV-vis range, outperforming pure TiO2. By increasing NiSO4 concentration above a threshold value, the photoelectrochemical activity of the films decreased below that of undoped TiO2. Similar results were obtained using cyclic voltammetry upon polychromatic UV-vis irradiation. Glow discharge optical emission spectrometry (GD-OES) analysis evidenced a sulfur signal peaking at the TiO2/Ti interface. XPS spectra revealed that oxidized Ni2+, S4+ and S6+ ions were included in the oxide films. In agreement with photocurrent measurements, photoluminescence (PL) spectra confirmed that less intense PL emission, i.e., a lower electron-hole recombination rate, was observed for Ni-doped samples, though overdoping was detrimental.

Graphical Abstract

1. Introduction

For several decades the two main drawbacks of titanium dioxide, i.e., its relatively high band gap (3.0–3.2 eV) and low quantum efficiency in photocatalytic reactions, hindered the development of practical applications of photocatalysis. In order to tune the band gap and regulate the electronic activity of TiO2, several strategies have been explored such as sensitization with dyes [1,2] and graphene [3,4], the synthesis of nanocomposites [5,6] and doping using metals [7] or non-metals [8,9].
Nickel is among the metal ions investigated for potential doping of TiO2. Based on the calculated total density of states of pure TiO2 and Ni-TiO2 with/without oxygen vacancies, Ni is expected to introduce new defect states within the band-gap and to strengthen the intra-band states generated by intrinsic oxygen vacancies due to hybridization of the Ni 3d orbitals with the intrinsic defect states [10,11]. Ni-doping also showed enhanced adsorption in the visible region [12] and photocatalytic degradation rates under visible light about one order of magnitude higher than pristine TiO2 [13]. Since metal doping affects the photoactivity of TiO2 following a complex function of several features of the dopant, namely, (i) concentration and distribution in the lattice; (ii) the energy level within the lattice; (iii) the d electron configuration; (iv) the electron donor density and the incident light intensity [13], it is reasonable to expect that the specific preparation method has significant impact on the photoactivity of doped TiO2. Ni-doped TiO2 has been prepared in the form of nanotubes obtained using hydrothermal synthesis [14]; in the form of powders using the sol-gel method [15], calcination of oxide mixtures [12] or mechanical alloying [10]; in the form of films using magnetron sputtering [16] and as nanotube arrays using conventional anodization [17].
Plasma electrolytic oxidation (PEO) has seldom been considered for the synthesis of Ni-doped TiO2 layers. The only study focusing on Ni-doping using PEO was proposed by Yao et al. [18], who reported that Ni-doping increases the H2 production rate of TiO2-based catalysts under UV-A irradiation. PEO was carried out in AC galvanostatic mode in alkaline electrolytes containing nickel acetate as source of Ni. Ni-doping is also briefly mentioned in a work from Xiang et al., where PEO was carried out in phosphate and fluoride-based electrolytes in DC potentiostatic mode at high voltages (330–450 V). It was reported that Ni was among the metals inducing the highest photocatalytic activity under UV-vis irradiation but no further investigation was carried out on the optical and photoelectrochemical properties of the Ni-doped layers [19].
The relatively poor literature on Ni-doping using PEO is quite surprising considering the promising results reported so far on metal-doping using PEO [19,20,21,22,23,24], but also the significant industrial impact of PEO [25]. Indeed, PEO can be seen as in between a low voltage conventional anodic oxidation and high-energy plasma coating under dry conditions in controlled gas pressure. Compared to traditional anodizing resulting in TiO2 nanotube arrays [26,27], the PEO process works at higher currents and higher voltages, but also requires a very short processing time (less than 10 min), allowing high growth rate (roughly 1 µm min−1). Furthermore, the high pressure and temperature locally induced by sparking can significantly affect the oxide morphology and crystal structure and composition, promoting instantaneous oxide crystallization [28,29,30] and incorporation of chemical species from the electrolyte [25,30,31,32,33,34,35,36]. For these reasons, PEO has been widely applied at the industrial scale for the synthesis of protective coatings on Mg and Al alloys, and more recently it was successfully applied to the synthesis of large area electrodes for photo(electro)catalytic water treatment [37,38,39,40].
Aiming at exploring the potential of Ni-doping using PEO and considering that PEO operating parameters introduce a great variability on the properties of the obtained layers [28,29], in the present study a systematic investigation of the optical and photoelectrochemical properties of Ni-doped TiO2 layers obtained using PEO is presented.

2. Materials and Methods

2.1. Preparation of Ni-Doped TiO2 Films

Ni-doped TiO2 films were prepared using PEO of commercially pure (Grade I) titanium sheets (Industrie DeNora S.p.A., Milano, Italy). Prior to PEO, Ti specimens were etched in a dilute HF aqueous solution. PEO was conducted in DC mode at 150 V for 10 min processing time. During PEO, the maximum current was set at 10 A. The anode was a titanium sheet with 6 cm2 exposed area, while the cathode was a titanium mesh. The electrolyte consisted of aqueous solutions containing 1.5 M H2SO4 and 0–0.6 mM NiSO4, having a total volume of 1 L. During PEO, the electrolyte temperature was set at −5 °C by means of a cryostat (HAAKE D10, Thermo Electron Corp., Karlsruhe, Germany). After PEO, the samples were rinsed with water and dried in an air stream. Reference samples consisting of pure anatase and pure rutile were obtained using PEO at a constant voltage of 120 V and 180 V, respectively. All samples were prepared in duplicate. The obtained films were labeled from S0 to S6 as a function of the NiSO4 concentration in the electrolyte, as specified in Table 1. Similarly, pure anatase and pure rutile samples were labeled as SA and SR, respectively.

2.2. Characterization of TiO2 Photoanodes

The surface morphology of the TiO2 films was investigated using scanning electron microscopy (SEM, EVO 50, Carl Zeiss Jena GmbH, Jena, Germany). Film thickness and in-depth elemental composition were determined using glow discharge optical emission spectrometry (GD-OES) using a Spectrum GDA750 analyzer (SPECTRO Analytical Instruments Inc., Kleve, Germany) operated at 700 V in argon atmosphere at 230 Pa. Energy-dispersive X-ray spectroscopy (EDX) and X-ray photoemission spectroscopy (XPS) were also carried out to assess the elemental composition. Both techniques are characterized by similar detection limits (in the 0.1–1 at % range [41,42]), nonetheless XPS is a stand-alone tool that provides higher sensitivity and accuracy for the elemental compounds analysis. XPS was performed in a dedicated ultra-high vacuum system (base pressure in the low 10−8 Pa) by exciting electrons with an Al-Kα source ( = 1486.6 eV) and analyzing them with a 150 mm hemispherical analyzer from SPECS GmbH (Berlin, Germany) [43]. We accounted for possible charging effects by setting the peak from adventitious carbon to 285 eV [44].
X-ray diffraction (XRD) patterns were acquired at the scanning rate of 2.5° min−1 with CuKα1 radiation in the 20°–60° 2θ range by means of a PW1830 diffractometer (Malvern Panalytical Ltd., Malvern, UK and Almelo, The Netherlands) operating at 40 kV voltage and 40 mA filament current. The XRD patterns were indexed according to the powder diffraction files released by the International Center for Diffraction Data (Newtown, PA, USA) for titanium (PDF 44-1294), anatase (PDF 21-1272) and rutile phases (PDF 21-1276). The weight fraction of anatase (fA) was calculated according to Equation (1) [45], where IR is the intensity of the (110) rutile reflection and IA is the intensity of the (101) anatase reflection.
f A = 1 ( 1 + 1.26   ( I R ) ( I A ) )   %
UV-vis-NIR diffuse reflectance spectra (DRS) were recorded in the 220–2600 nm range with a UV3600 Plus spectrophotometer from Shimadzu Corp. (Kyoto, Japan) equipped with an ISR-603 integrating sphere. The band gap was calculated based on the UV-vis reflectance spectra after Kubelka-Munk conversion using the Tauc plot method [46].
Photoluminescence (PL) spectra were recorded with an FLS980 spectrofluorometer (Edinburgh Instrument Ltd., Livingston, UK) in the range starting from 20 nm above the excitation wavelength (300 and 380 nm, respectively) up to 850 nm.
Electrochemical impedance spectroscopy (EIS) measurements were performed in the dark and in 1.0 M NaOH aqueous solutions at the open circuit potential (OCP) of each specimen. The amplitude perturbation was 10 mV and the frequency ranged from 300 kHz to 10 mHz using a ModuLab® XM ECS high-performance potentiostat/galvanostat system (Solartron Analytical, XM PSTAT 1 MS/s, Ametek Inc., Berwyn, IL, USA). The instrument was coupled with a frequency response analyzer (Solartron Analytical, XM FRA 1MHz, Ametek Inc., Berwyn, IL, USA) for AC measurements. The EIS results were fitted with a Randles-type equivalent circuit with Zview software (Ametek Inc., Berwyn, IL, USA).
The photocurrent density as a function of the irradiation wavelength was measured in a 1.0 M NaOH aqueous solution using an optical bench equipped with a 300 W Xe lamp (Quantum Design Europe GmbH, Darmstadt, Germany), a monochromator (Omni-λ 150, Quantum Design Europe GmbH, Darmstadt, Germany), a shutter (SC10, Thorlabs Inc., Newton, MA, USA) and a homemade three electrode two compartment Plexiglas cell together with an optical Pyrex glass window. A PEO TiO2 photoelectrode was used as working electrode, and a platinum foil and a saturated calomel electrode (SCE) were used as counter and reference electrodes, respectively. Electrochemical measurements were conducted at room temperature on both biased and unbiased TiO2 photoelectrodes using a 2549 potentiostat/galvanostat from Amel S.r.l. (Milano, Italy) and a DMM4040 digital multimeter from Tektronix (Beaverton, OR, USA). The incident wavelength values ranged from 250 to 450 nm with a 2 nm step and a 4 s per step dwell time. The incident light power was measured using a calibrated Thorlabs S130VC photodiode connected to a PM200 power meter (Thorlabs Inc., Newton, MA, USA) placed at exactly the same distance as the TiO2 electrode, with the Pyrex window in between to account for the transmittance of the cell window. The incident photon-to-current efficiency (IPCE) at each wavelength was calculated using the following Equation:
I P C E ( % ) = h   c e × I P   λ
where h (kg m2 s−1) is the Planck constant, c (m s−1) is the speed of light, e (C) is the electron charge, I (A m−2) is the steady-state photocurrent density, P (W m−2) is the light intensity and λ (m) is the incident wavelength.
Linear sweep voltammetry (LSV) was carried out in a three electrodes cell containing 4 mM KCl aqueous solution. LSV was conducted from −0.5 to 1 V vs. SCE at a scan rate of 10 mV s−1 and room temperature. The working electrode was a titanium dioxide sheet obtained using PEO. The counter electrode was platinum foil, and the reference electrode was a saturated calomel electrode (SCE). The photocurrent was calculated as difference between the current response in the dark and under irradiation, as a function of the polarization potential. For the measurements, a 2549 potentiostat/galvanostat (Amel S.r.l., Milano, Italy) was used. The irradiation was achieved by means of a polychromatic commercial Xenon lamp. The irradiance of the samples was 100 mW cm−2, as measured by a calibrated Thorlabs S130VC photodiode connected to a Thorlabs PM200 power meter placed at exactly the same distance as the investigated films. The exposed area during LSV was 5 cm2. All measurements were repeated twice.

3. Results and Discussion

3.1. Morphology and Composition

Figure 1 shows the SEM micrographs and EDX spectra of sample S0 (Figure 1a) and S6 (Figure 1b). SEM analysis revealed a surface morphology typical of PEO coatings. Indeed, they are homogeneous and porous, the pores having sub-micrometric dimensions and a branched structure. Apparently, the concentration of Ni sulfate in the electrolyte did not affect the morphology of the obtained film. Based on the EDX elemental analysis, the TiO2 films consisted of Ti and O elements. No emission from Ni or S was detected; however, a very low concentration of these species could not be ruled out.
The GD-OES in-depth composition profiles of samples S0 and S6 are shown in Figure 2a,b, respectively. In addition to the expected signals for titanium and oxygen elements, both samples revealed a signal corresponding to sulfur, peaking in proximity of the TiO2/Ti interface. This signal showed a wide tail spreading across the film thickness and barely reached the TiO2 surface. The presence of sulfur can be reasonably ascribed to sulfuric acid contained in the electrolyte, while the shape of the sulfur signal might be reasonably explained by blending of the oxide layer taking place during PEO. Indeed, the intense sparking occurring at the operating conditions locally melted the oxide, probably moving sulfur-containing species initially included in the TiO2 film up to the surface of the oxide. Unexpectedly, in sample S6 the Ni element was not detected. Film thickness, as assessed using the GD-OES composition profiles, was ~3.3 μm regardless of the Ni concentration in the electrolyte.
A more detailed elemental investigation was performed using XPS. The survey scans of samples S0 and S6 are shown in Figure 3a, where the binding energy (BE) position of photoemission signals from Ni, O, Ti, C and S is also highlighted. The observed C 1s signal is attributed to adventitious carbon. The BE position of O 1s and Ti 2p3/2 peaks is consistent with the values reported in the literature for TiO2 [47,48]. The presence of Ni in sample S6 is testified by the detection of a small photoemission signal from the Ni 2p3/2 orbital, as shown in the detailed scan of Figure 3b. The BE position of the Ni feature (about 856 eV) is typical of oxidized Ni2+ species [16]. As shown in the inset of Figure 3d, the intensity of photoemission signal from Ni 2p3/2 increases in the order S0 < S2 < S4 < S6, thus demonstrating that the concentration of NiSO4 impacts on the amount of Ni ions included in the oxide films. The S 2p region (Figure 3c) shows a feature located at a BE of about 169 eV, which is compatible with the presence of photoemission signals from both tetravalent S4+ and hexavalent S6+ sulfur (at the very close BE of 168.8 eV and 169.5 eV, respectively), as also reported in literature [49]. Considering these two possible contributions, the strongest peak at 169.5 eV is usually assigned to SO42− groups adsorbed on the TiO2 surface [50]. This assignment is reasonable in the present case, considering that PEO of titanium was carried out in sulfuric acid solutions. As for the tetravalent sulfur signal, S4+ species can be incorporated into TiO2 either interstitially or at the Ti4+ lattice site [51].
Electrochemical impedance spectroscopy tests were carried out to investigate the electrochemical properties of the oxide films. The resulting Nyquist plots shown in Figure 4 exhibit a typical semicircle shape. The semicircle obtained for sample S2 is smaller than that recorded for samples S0, S4 and S6, suggesting lower charge transfer resistance allowing a more efficient transport and separation of electron-hole pairs.

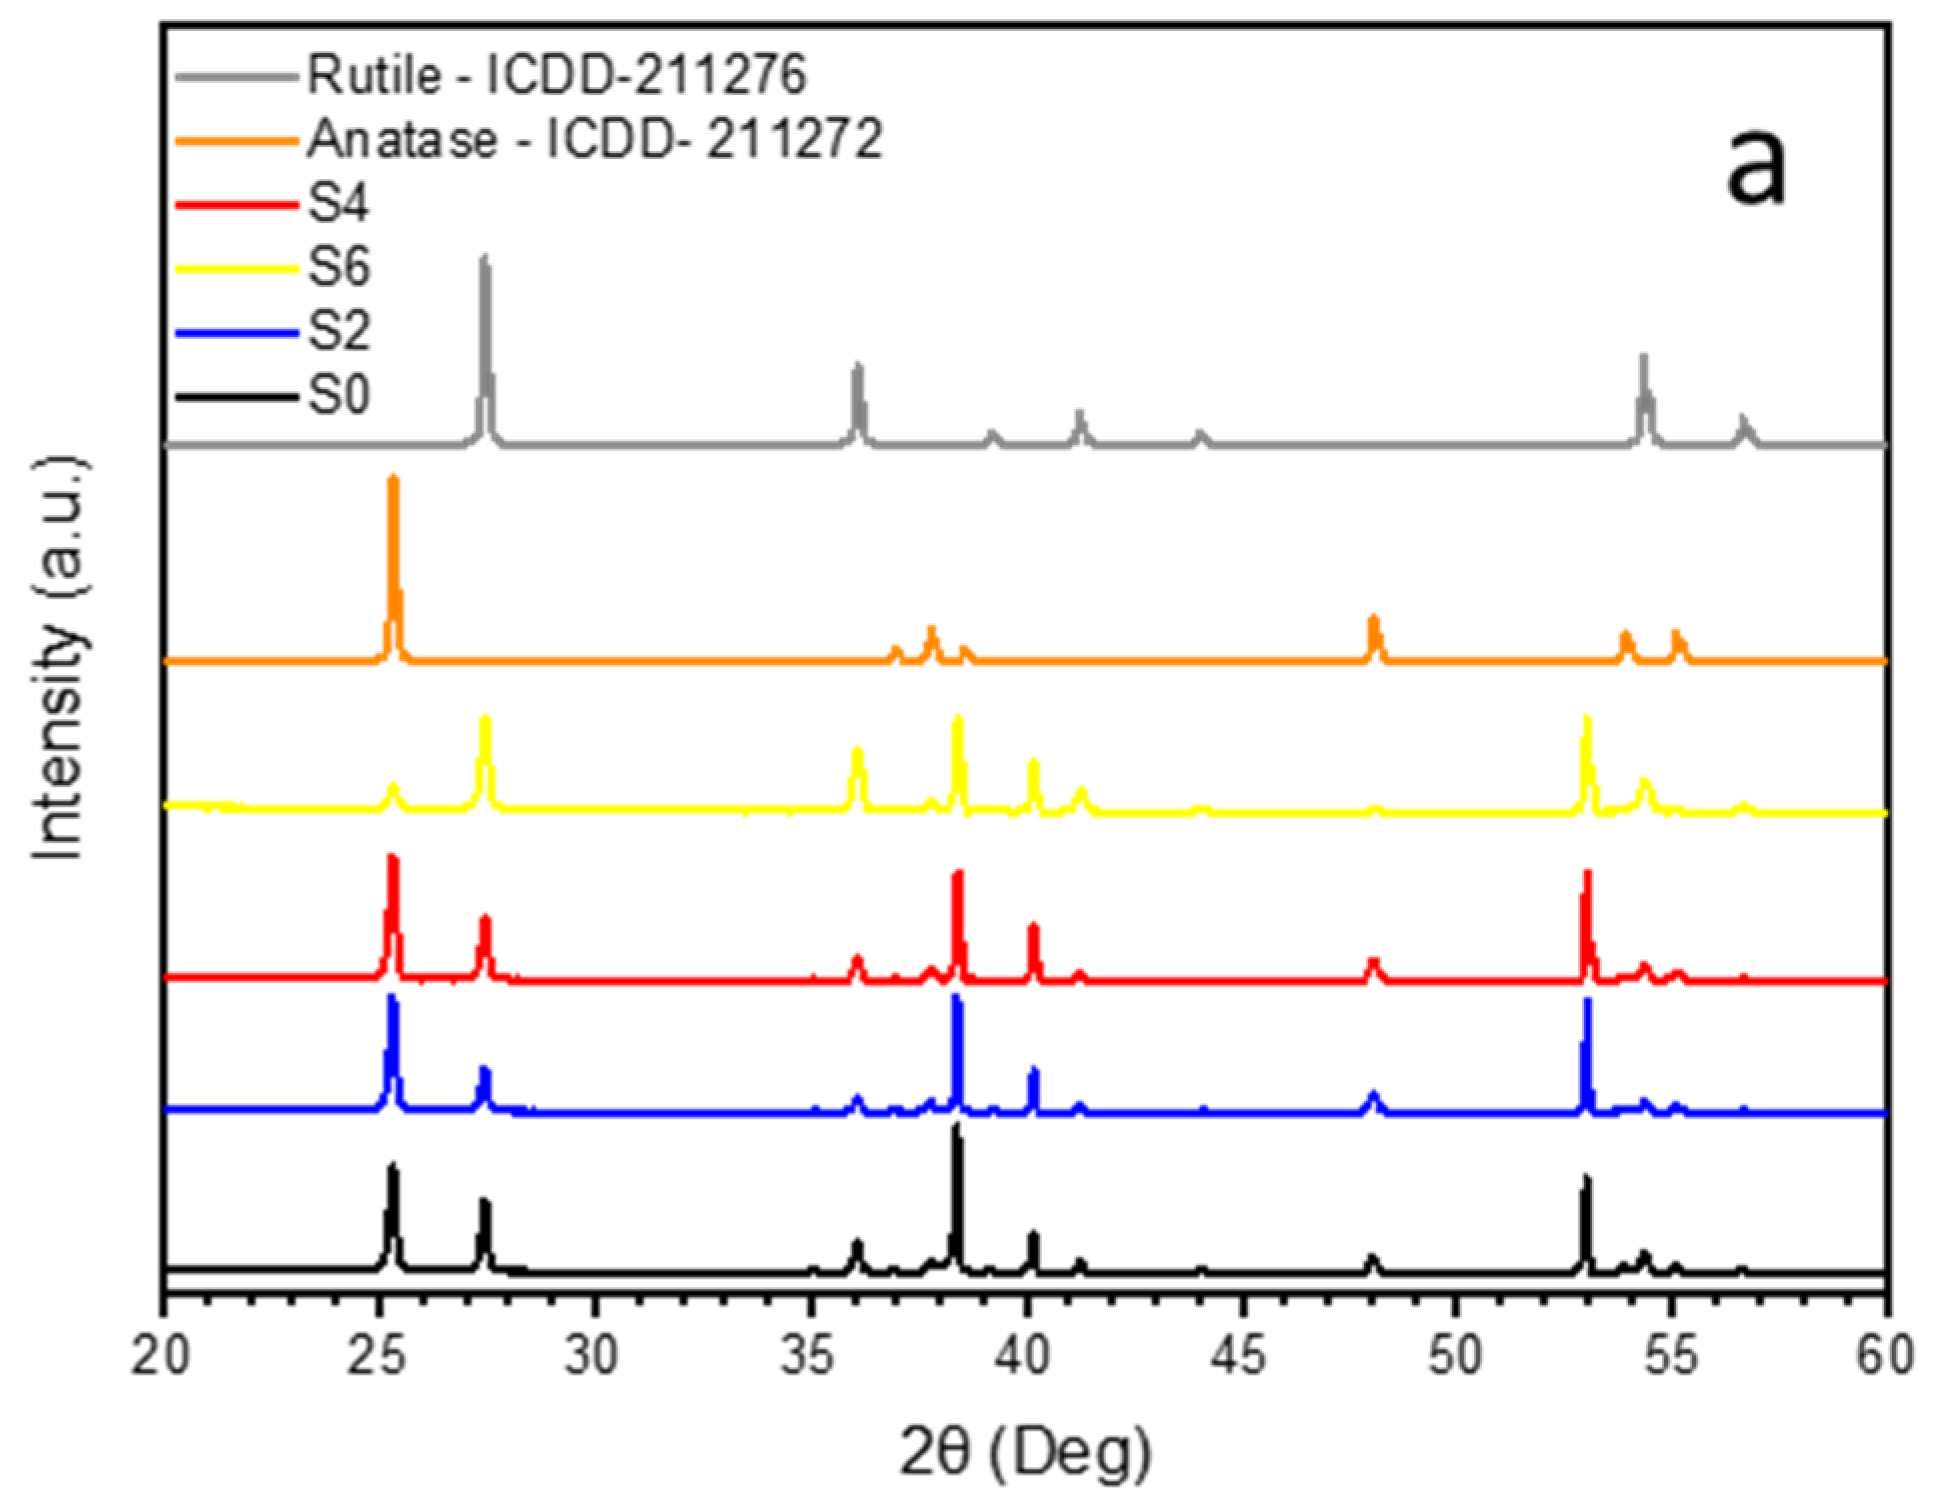
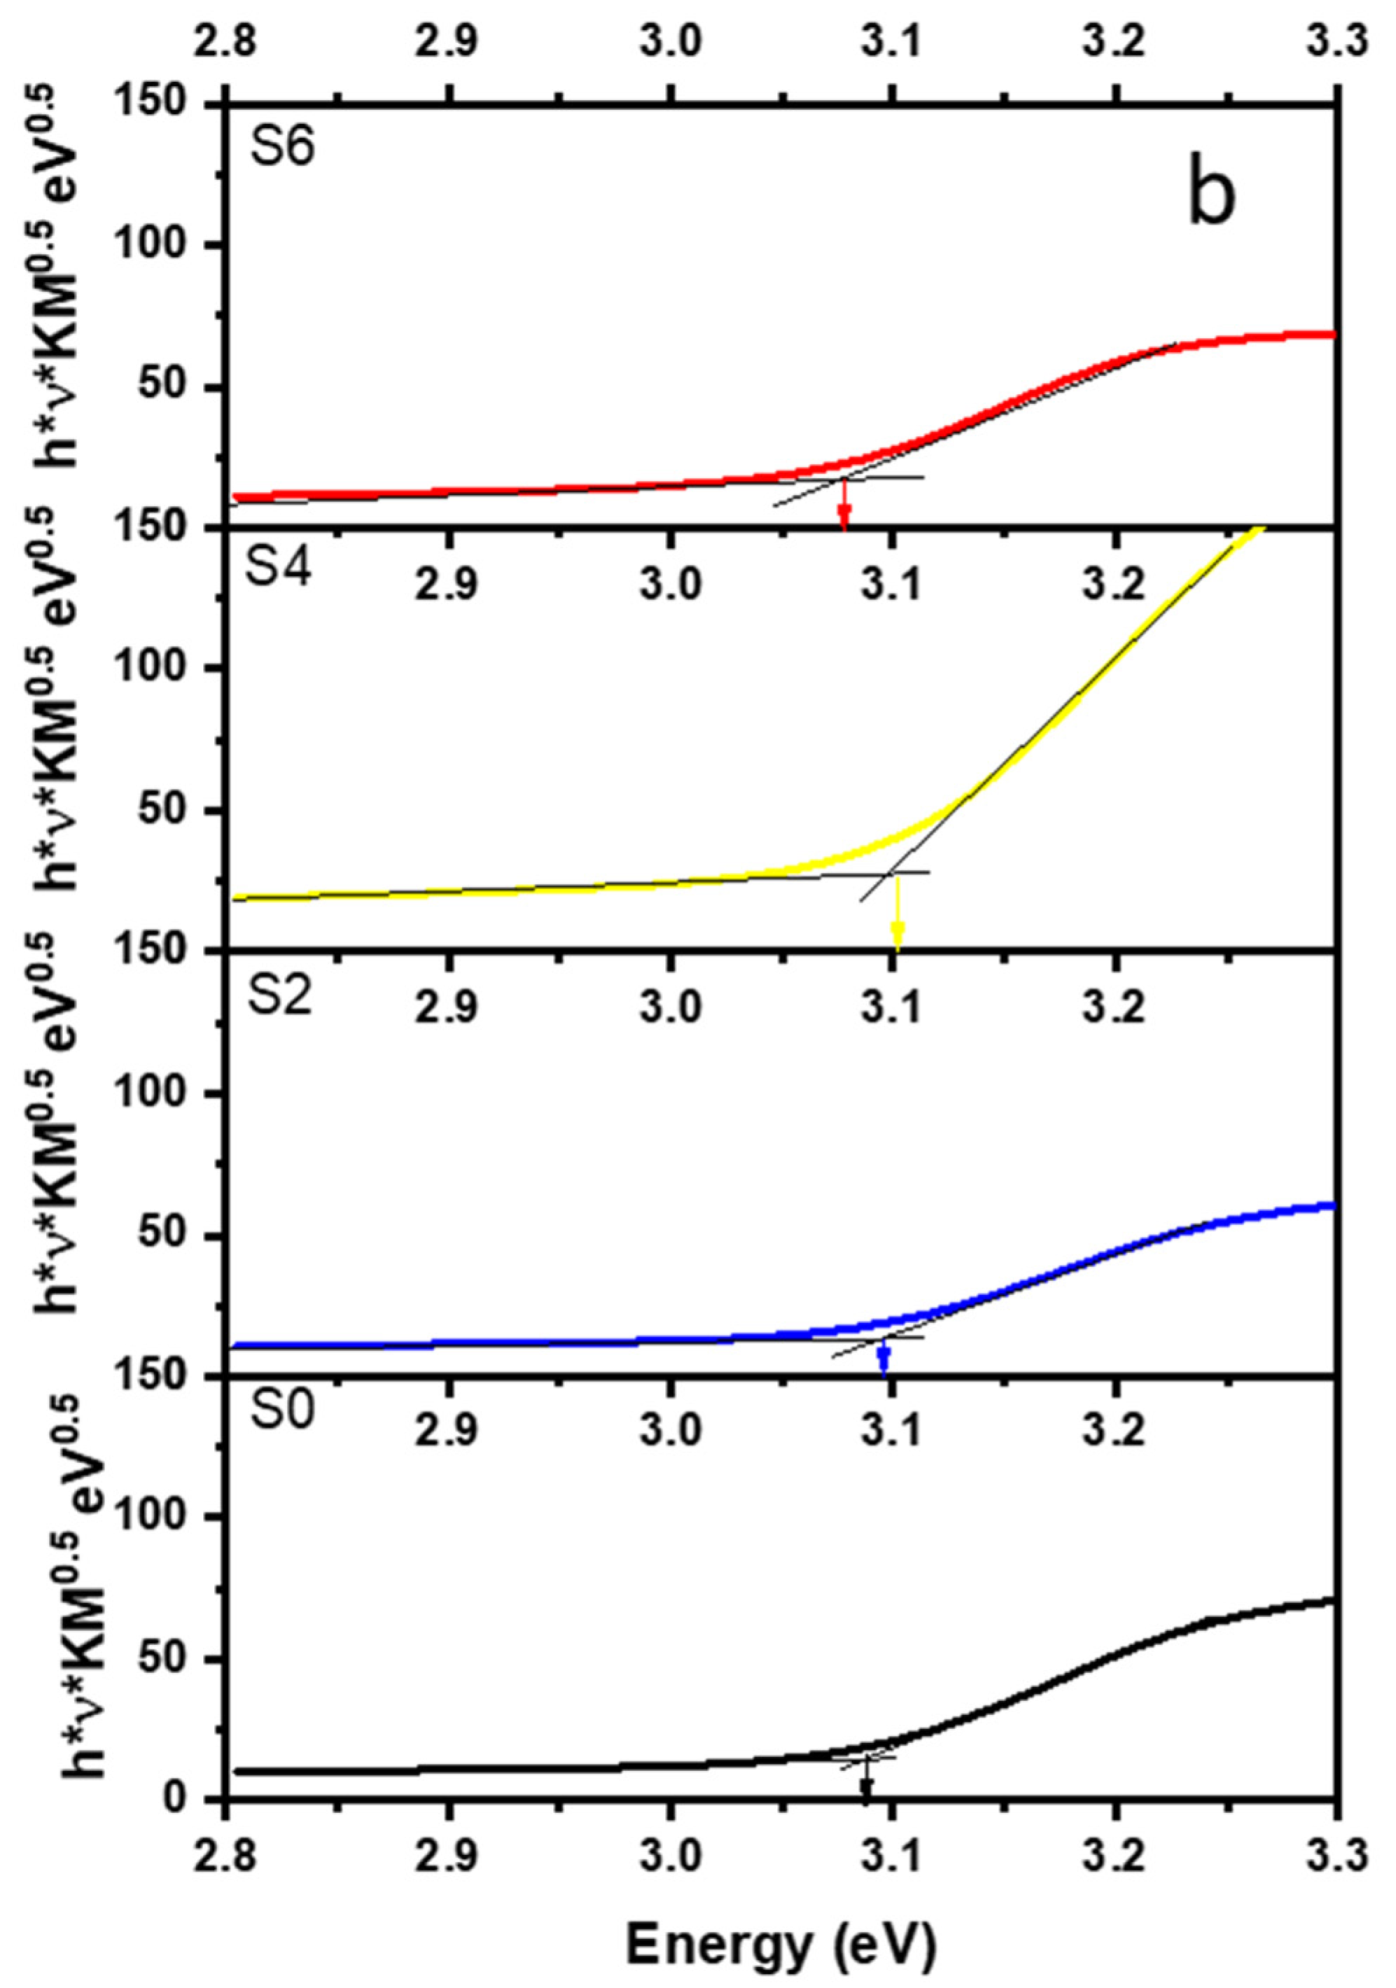
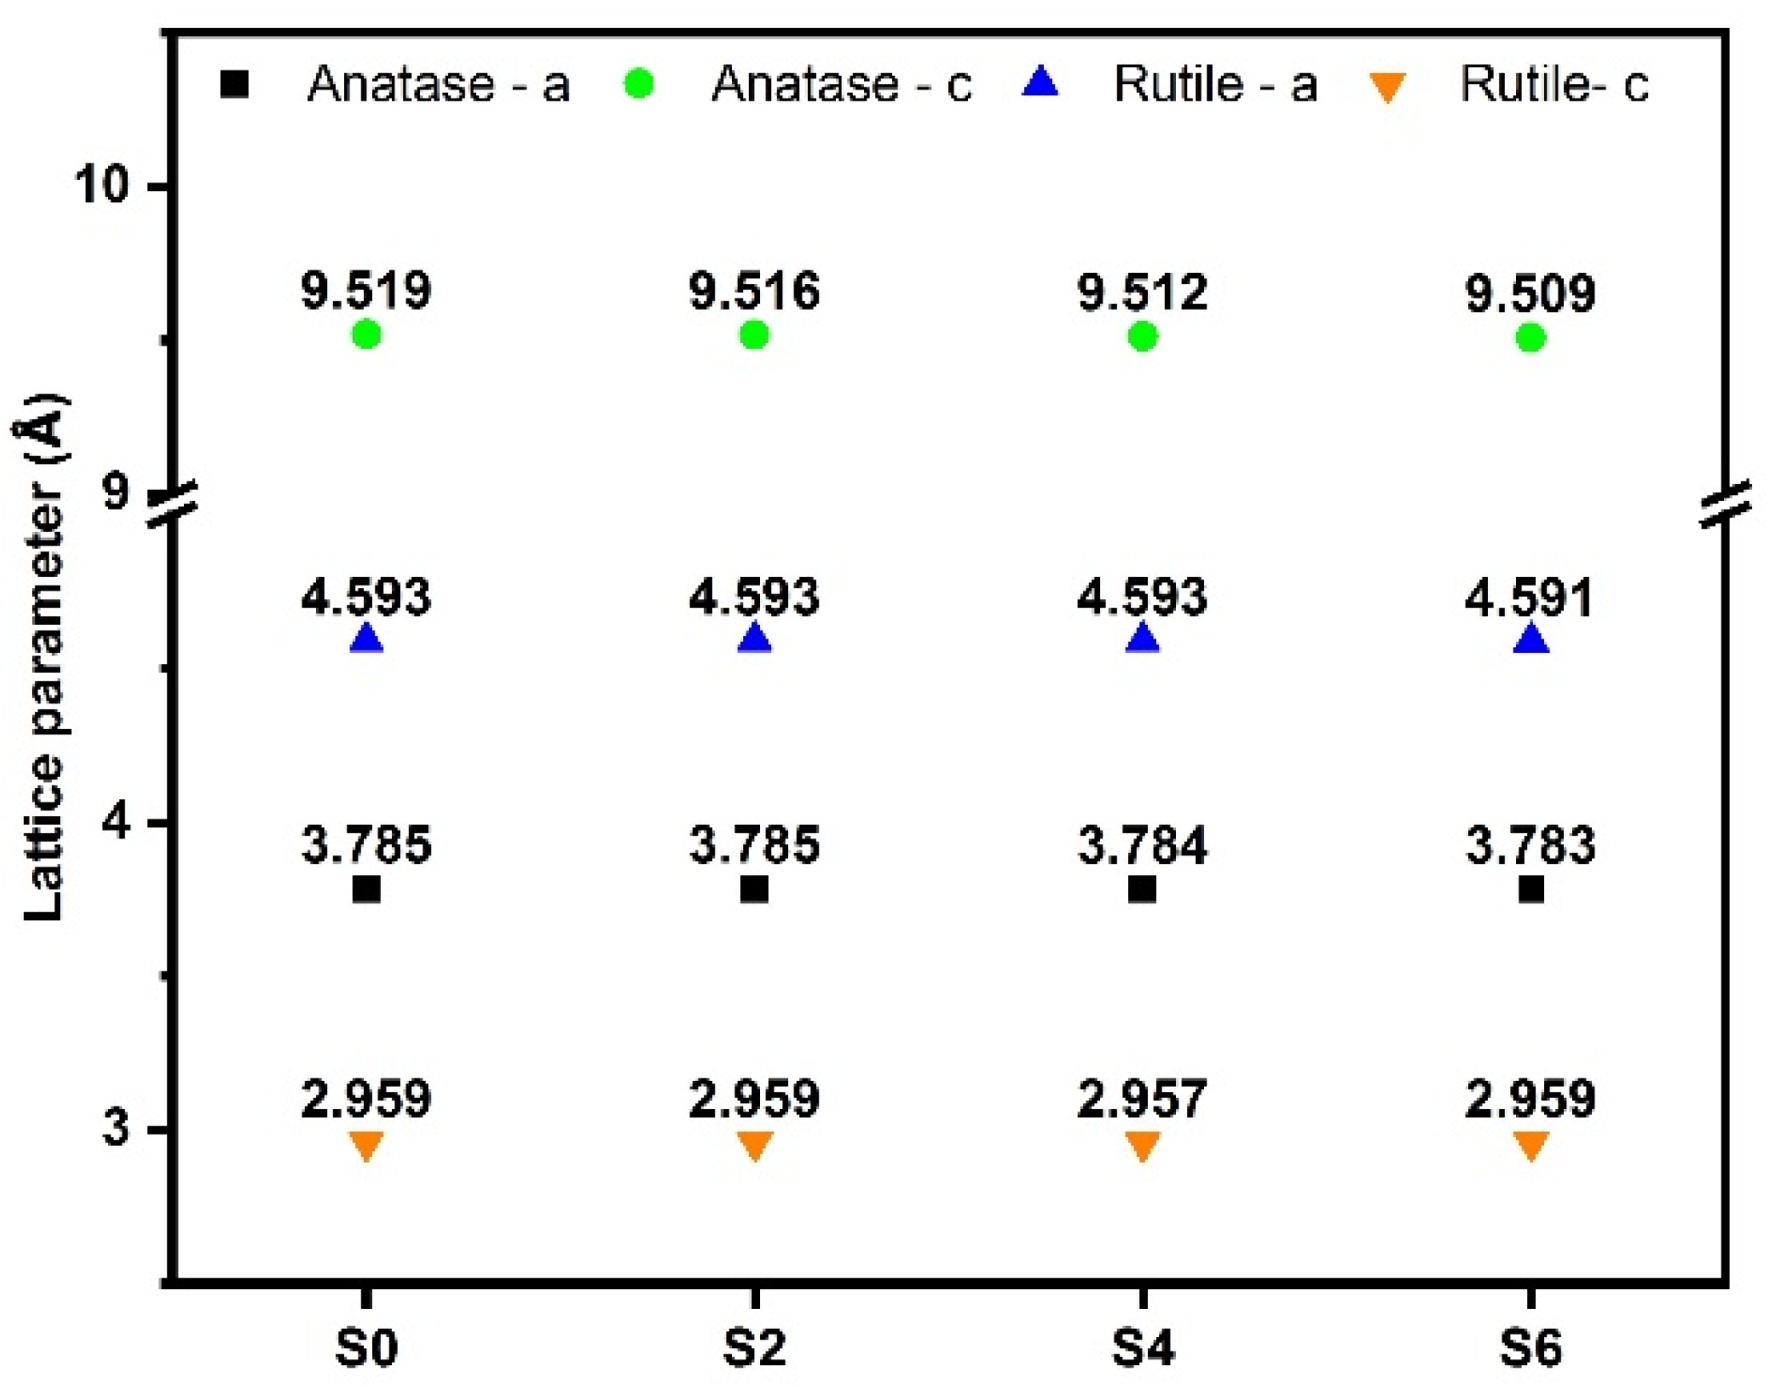
3.2. Crystal Structure and Band-Gap Determination

XRD results on doped and undoped TiO2 films are shown in Figure 5a. The TiO2 films were mainly crystalline in structure and consisted of a mixture of anatase and rutile allotropic phases, even though the presence of a minor amorphous component in the TiO2 film structure cannot be completely ruled out. The XRD peaks at 2θ ≈ 25.31°, 48.06° and 55.11° were attributed to the anatase phase, those at 2θ ≈ 27.44°, 36.09°, 41.26° and 54.33° to the rutile phase, and finally those at 2θ ≈ 35.06°, 38.40°, 40.17° and 53.01° to the Ti substrate. No Ni-containing phases were detected in the PEO layers. As shown in Figure A1 (Appendix A), no lattice distortion was observed by increasing the NiSO4 concentration. Indeed, substitutional Ni ions at Ti4+ sites are not expected to induce lattice distortion as they have similar ionic radii, i.e., 0.61 and 0.69 Å for Ti4+ and Ni2+, respectively. In agreement with literature, at the highest nickel sulfate concentration (S6) the rutile reflections centered at 2θ ≈ 27.44° and 36.09 became stronger, indicating that a higher Ni-doping favors the formation of the rutile phase [15]. The weight percentage of anatase and rutile phases obtained using Equation (1) is reported in Table 1. The rutile percentage increased from ~30% to ~80% at increasing nickel sulfate concentration. Figure 5b shows the UV-vis-NIR diffuse reflectance spectra of the investigated samples as Tauc-plots of the Kubelka–Munk transform. As expected, the calculated band-gap values reported in Table 1 are in good agreement with the corresponding phase composition.

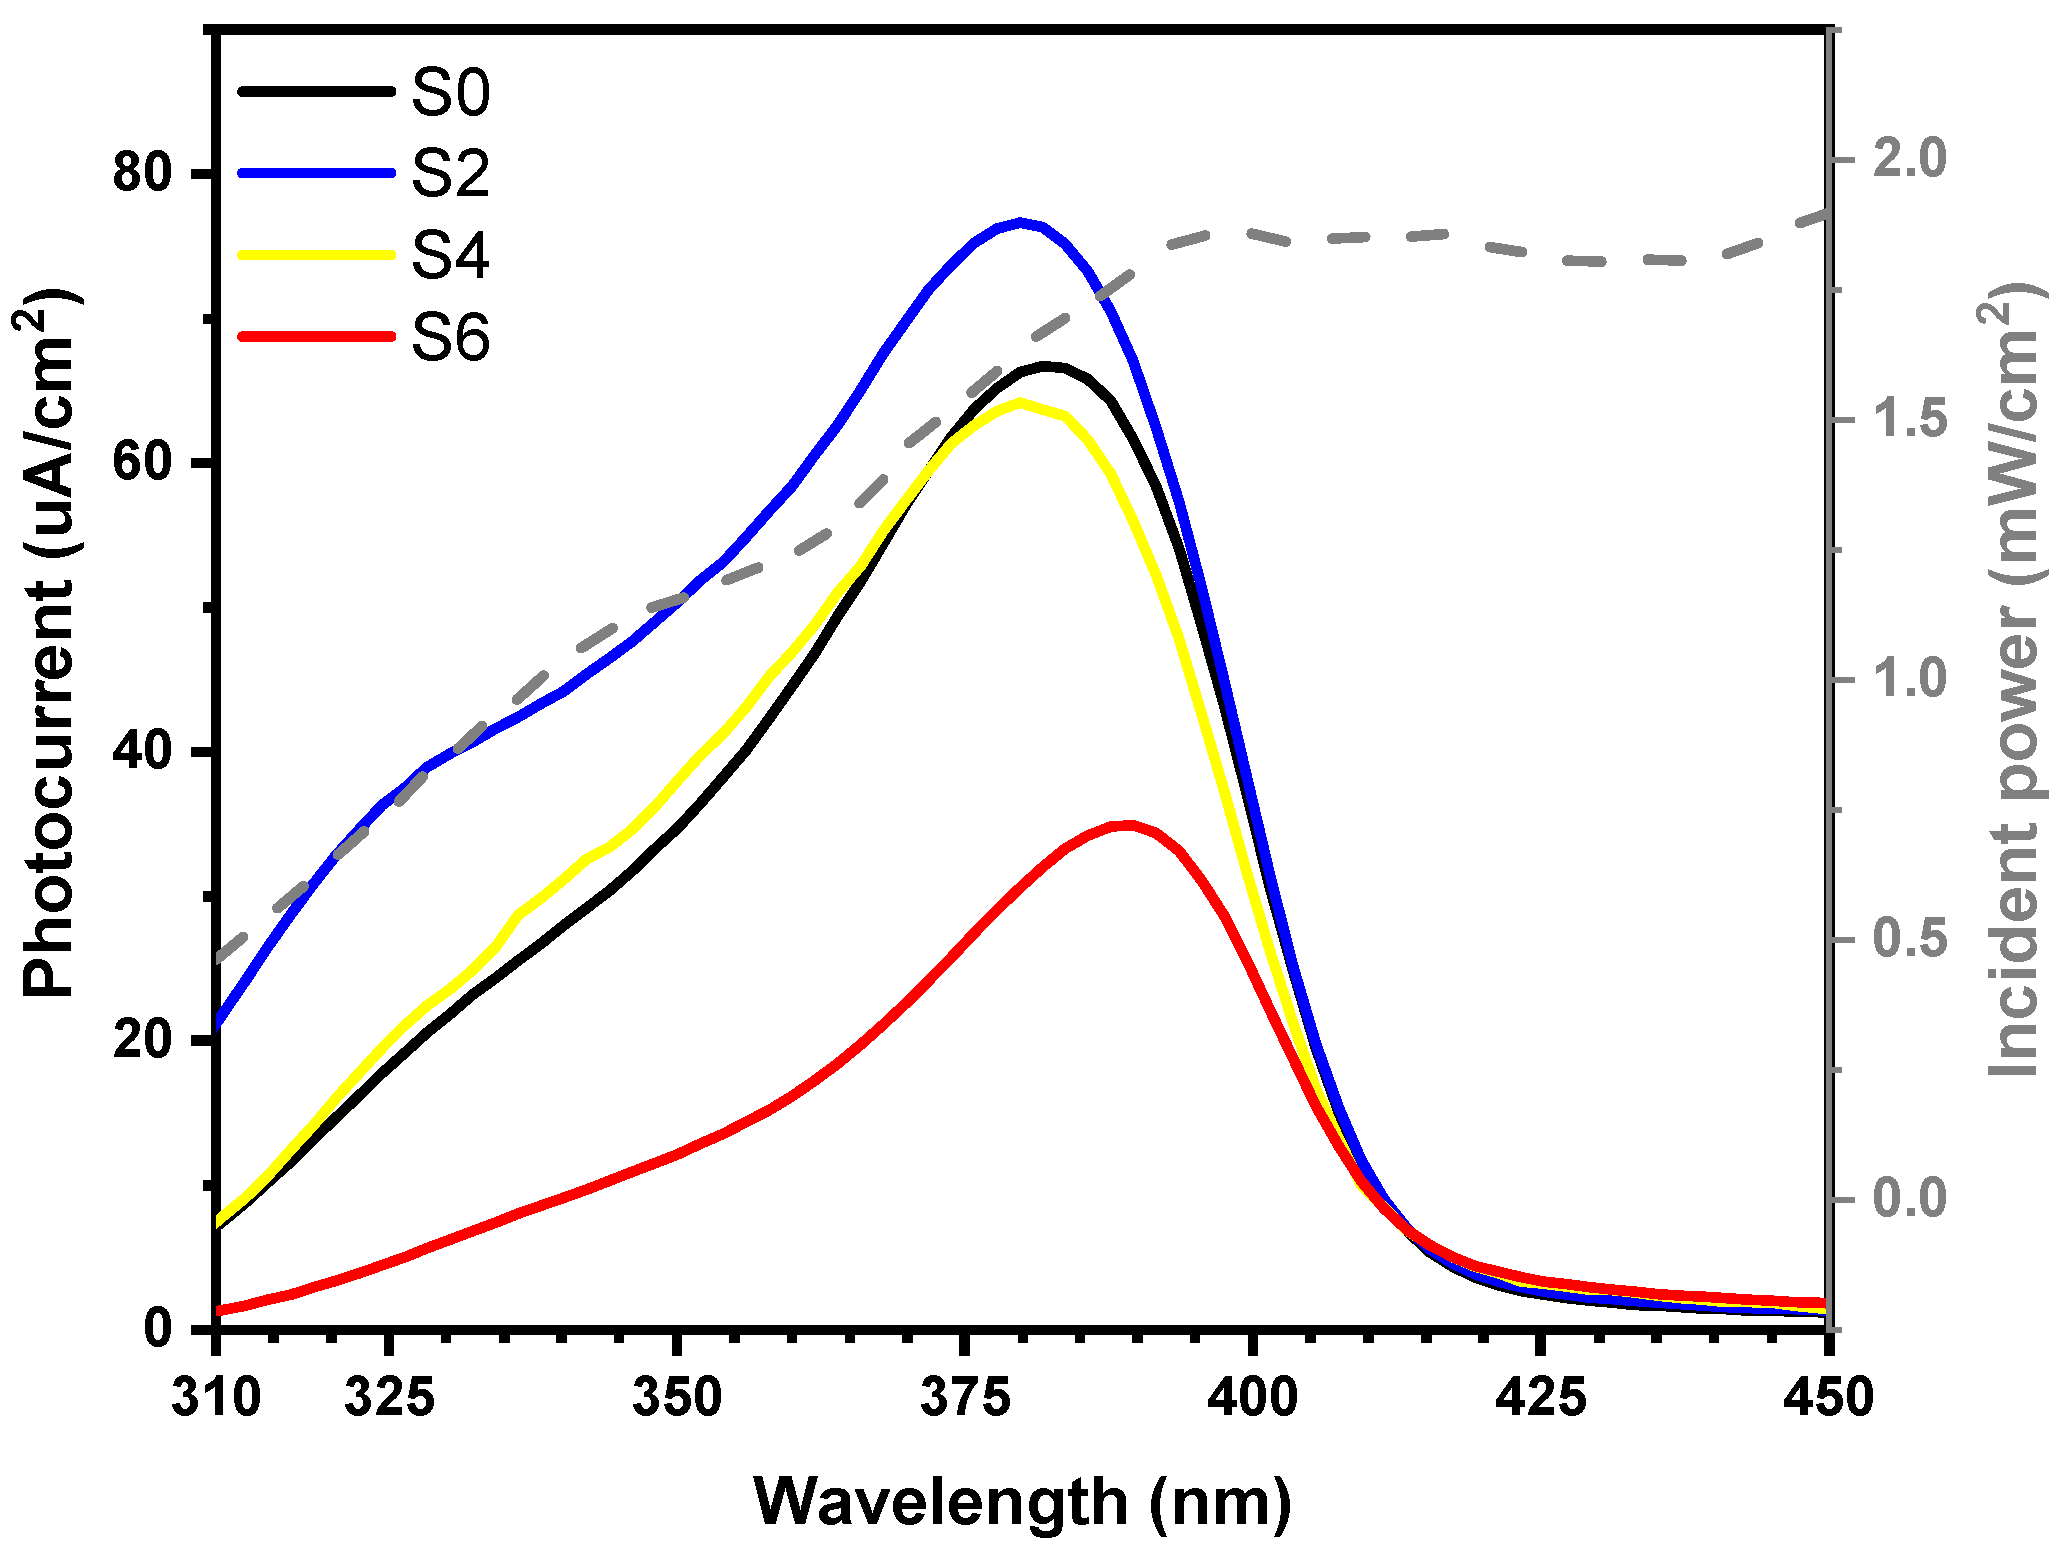
3.3. Photocurrent and IPCE

Figure A2 shows the photocurrent density values measured for all samples as a function of the irradiation wavelength and under a 0.6 V vs. SCE applied bias. The corresponding light power is also reported on the right y-axis of the same figure. The corresponding IPCE curves calculated using Equation (2) are plotted in Figure 6a. The investigated samples exhibit a bimodal curve. According to literature [52,53], the absorption peaks around 325 and 380 nm can be attributed to the anatase and rutile phases, respectively. Thus, in the present case the curve shapes and the relative intensity of the two maxima well reflect the crystalline structure of the films. The highest IPCE values were observed for sample S2, reaching 55% depending on the irradiation wavelength. Samples S0 and S4 showed very similar IPCE values, while the lowest values were measured for S6, which mainly consisted of rutile phase. The photocurrent onset is below 414 nm, in partial agreement with the calculated band gap reported in Table 1.
LSV curves recorded from −0.5 to 1 V vs. SCE under continuous Xenon light irradiation are shown in Figure 6b. LSV tests were repeated twice and good reproducibility was assessed. Comparing the LSV results of all samples, three main considerations can be made: (i) in agreement with the IPCE data reported in Figure 6a the maximum photocurrent density decreased following the order S2 > S4 > S0 > S6; (ii) only S0 and S6 reached photocurrent saturation; (iii) the photocurrent potential onset shifted towards more positive values for Ni-doped TiO2 films compared to undoped films, except for sample S2. The CBedge values were −0.28 VSCE, pH=7 in S0, −0.31 VSCE, pH=7 in S2, −0.23 VSCE, pH=7 in S4 and in S6, which correspond to −0.45 VNHE, pH=0, -0.48 VNHE, pH=0 and −0.40 VNHE, pH=0, respectively. As the potential onset is representative of the conduction band edge energy, the shift towards more positive values (i.e., lower energies) would partially account for the correspondingly smaller band-gap energy values.
Overall, S2 shows a better photocurrent response, both as a function of the irradiation wavelength and under continuous polychromatic irradiation. In addition to the optimum crystalline phase composition, this might also be partially attributed to the lower charge transfer resistance estimated on the basis of the Nyquist curves shown in Figure 4.

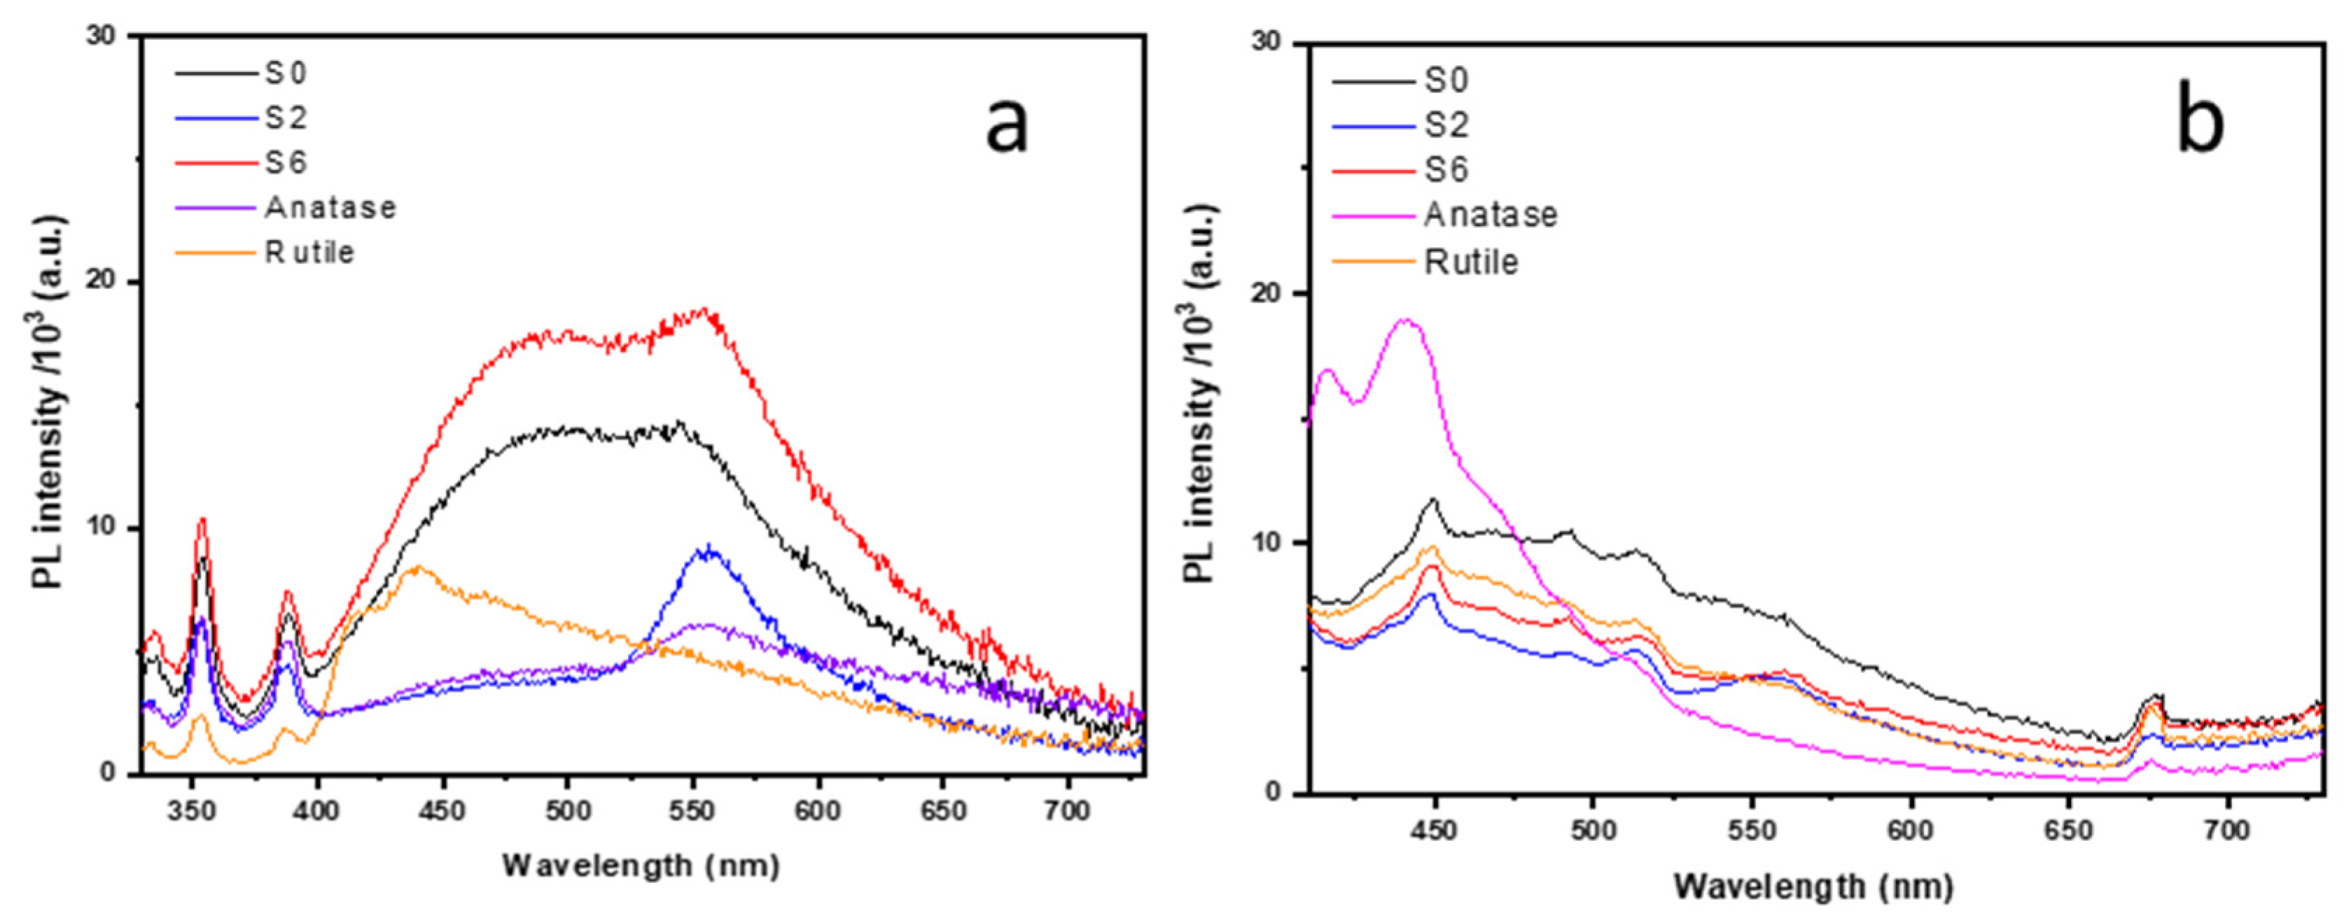
3.4. Photoluminescence Spectroscopy

In order to achieve a better insight on the effectiveness of trapping, migration and transfer of charge carriers in the investigated films, the photoluminescence (PL) spectra of some representative samples were acquired upon excitation at 300 nm. They are reported in Figure 7a, together with the spectra of PEO TiO2 films consisting in either pure anatase or almost pure rutile. The first emission peak at 354 nm (3.51 eV), observed for all samples, can be attributed to direct recombination with holes of hot electrons excited in the conduction band (CB), i.e., electrons not fully relaxed to the bottom of the CB. The second peak at 388 nm (3.19 eV) reflects the recombination between electrons at the bottom of the CB and holes in the valence band (VB) of the anatase phase and was detected for all samples, in agreement with the crystalline phase composition. The other emission signals must be necessarily ascribed to electronic transitions involving intra-band energy states. The peak at ~555 nm (2.23 eV) measured for all samples with the exception of sample SR, might be tentatively attributed to a transition from the CB to mid-gap states corresponding to oxygen vacancies generated by the replacement of S6+ for Ti4+ [54]. The broad emission band observed between 400 and ~700 nm (i.e., 3.10 eV ÷ 1.77 eV) can be attributed to oxygen vacancies and/or defects. In fact, oxygen vacancies and defects can bind the electrons photoexcited in the CB to form excitons, thus increasing the PL emission [55].
However, based on first-principle band calculations, the presence in the same region of additional intra-band states due to Ti1-xSxO2 deriving from substitutional tetravalent S4+ species cannot be ruled out [56]. S-doping involving both S6+ and S4+ species would also be in agreement with the XPS scans shown in Figure 3. According to DFT calculations reported in literature, Ni-doping also induces intra-band Ni 3d states generated by hybridization with the O 2p orbitals [57]. Ni ions can be included in the oxide lattice sites as a substitutional defect, either as Ni2+ or as Ni3+, where Ni2+ can introduce donor levels above the VB, while Ni3+ can trap photopromoted electrons [12]. The PL intensity of sample S2 is significantly lower than that of the undoped TiO2 film, while the contrary was obtained for sample S6. This confirms that doping can effectively suppress the recombination of photogenerated electrons and holes tentatively due to a better oxide stoichiometry, though above a certain threshold value it can have a detrimental effect probably due to charge unbalance [58].
PL emission spectra acquired upon irradiation at 380 nm are also reported (Figure 7b). In this case it is even clearer that by Ni-doping the PL emission decreased with respect to pure TiO2 and that overdoping (sample S6) was somehow detrimental. This is in agreement with literature [59], where it is reported that an excess of dopant corresponds to an excess of structure defects which can play a detrimental role in favoring the undesired electron-hole recombination process.
It is well-known that the PL emission results from the recombination of excited electrons and holes and that high PL intensity corresponds to a high recombination rate. Interestingly, the PL results are in good agreement with the IPCE data reported in Figure 6a. Indeed, higher photocurrent is expected for films showing lower PL emission, i.e., lower electron-hole recombination rate. In the case of the investigated TiO2 films, the optimum doping can be obtained with 0.2 mM NiSO4 in the electrolytic bath.

4. Conclusions

Crystalline Ni-doped TiO2 films were successfully obtained using PEO carried out in DC mode in refrigerated electrolytes containing 1.5 M H2SO4 and NiSO4 in the 0–0.6 mM range, as a source of nickel. The oxide showed a branched and sub-micrometric porous surface morphology, typical of PEO oxides. The as-prepared oxides were crystalline and mainly consisted of a mixture of anatase and rutile. By adding NiSO4 to the electrolytic bath, the relative amount of anatase was initially only marginally affected and not correlated to the electrolyte composition, although at the highest NiSO4 concentration value a clear stabilization of the rutile phase occurred. In addition to the expected oxygen and titanium signals, GD-OES in-depth profile analysis revealed a sulfur signal peaking in proximity of the TiO2/Ti interface. XPS analysis demonstrated that S-containing species consisted of both substitutional S4+ ions and S6+ ions, probably due to SO42− adsorbed groups. XPS analysis also evidenced the presence of oxidized Ni2+ ions, the intensity of the corresponding photoemission signal increasing with the NiSO4 concentration in the electrolytic bath. Photocurrent measured as a function of the irradiation wavelength showed a bimodal shape peaking at 320 and 375 nm, in agreement with the phase composition. The photocurrent values varied depending on the concentration of NiSO4 in the electrolytic bath, exceeding those of pure TiO2 at the lowest NiSO4 concentration. Maximum IPCE values of 55% were calculated for 0.2 mM NiSO4. Similar photocurrent results were obtained under UV-vis polychromatic irradiation, where the saturation photocurrent increased with respect to bare TiO2 by addition of NiSO4, with the only exception being the highest concentration. Photoluminescence spectra confirmed that doped oxides developing the highest photocurrent values were also less photoluminescent, i.e., they were characterized by lower electron-hole recombination rates. Therefore, provided that NiSO4 is kept below a certain threshold value, Ni-doping using DC PEO increases the photoactivity of the oxide under UV-vis irradiation with respect to undoped TiO2.

Author Contributions

Conceptualization S.F.; formal analysis H.A., G.L.C., A.C. and G.B. (Gianlorenzo Bussetti); investigation H.A., G.L.C., G.B. (Giacomo Bomboi), A.C., G.B. (Gianlorenzo Bussetti) and G.A.; resources M.B. and E.S.; supervision S.F., M.B., G.L.C. and E.S.; writing—original drat S.F.; writing—reviewing/editing E.S. and M.B. All authors have read and agreed to the published version of the manuscript.

Funding

This research was partially funded by the MIUR PRIN 2015K7FZLH SMARTNESS project and the MIUR PRIN 20173397R7 MULTI-e project.

Acknowledgments

The use of instrumentation purchased through the SmartMatLab project, Fondazione Cariplo grant 2013-1766, is gratefully acknowledged.

Conflicts of Interest

The authors declare no conflicts of interest.

Appendix A

Figure A1. Lattice parameters a and c of the anatase and rutile phases for samples S0, S2, S4 and S6.
Surfaces 03 00013 g0a1
Figure A2. Photocurrent vs. irradiation wavelength curves measured for samples S0, S2, S4 and S6 (left ordinate axis) and corresponding light power (right ordinate axis).
Surfaces 03 00013 g0a2

References

  1. Brady, M.D.; Sampaio, R.N.; Wang, D.; Meyer, T.J.; Meyer, G.J. Dye-Sensitized Hydrobromic Acid Splitting for Hydrogen Solar Fuel Production. J. Am. Chem. Soc. 2017, 139, 15612–15615. [Google Scholar] [CrossRef] [PubMed]
  2. Jaafar, S.N.H.; Minggu, L.J.; Arifin, K.; Kassim, M.B.; Wan, W.R.D. Natural dyes as TIO2 sensitizers with membranes for photoelectrochemical water splitting: An overview. Renew. Sustain. Energy Rev. 2017, 78, 698–709. [Google Scholar] [CrossRef]
  3. Lang, Q.; Chen, Y.; Huang, T.; Yang, L.; Zhong, S.; Wu, L.; Chen, J.; Bai, S. Graphene “bridge” in transferring hot electrons from plasmonic Ag nanocubes to TiO2 nanosheets for enhanced visible light photocatalytic hydrogen evolution. Appl. Catal. B Environ. 2018, 220, 182–190. [Google Scholar] [CrossRef]
  4. Lu, Y.; Ma, B.; Yang, Y.; Huang, E.; Ge, Z.; Zhang, T.; Zhang, S.; Li, L.; Guan, N.; Ma, Y.; et al. High activity of hot electrons from bulk 3D graphene materials for efficient photocatalytic hydrogen production. Nano Res. 2017, 10, 1662–1672. [Google Scholar] [CrossRef]
  5. Mulewa, W.; Tahir, M.; Amin, N.A.S. MMT-supported Ni/TiO2 nanocomposite for low temperature ethanol steam reforming toward hydrogen production. Chem. Eng. J. 2017, 326, 956–969. [Google Scholar] [CrossRef]
  6. Xing, X.; Zhang, M.; Hou, L.; Xiao, L.; Li, Q.; Yang, J. Z-scheme BCN-TiO2 nanocomposites with oxygen vacancy for high efficiency visible light driven hydrogen production. Int. J. Hydrog. Energy 2017, 42, 28434–28444. [Google Scholar] [CrossRef]
  7. Kumaravel, V.; Mathew, S.; Bartlett, J.; Pillai, S.C. Photocatalytic hydrogen production using metal doped TiO2: A review of recent advances. Appl. Catal. B Environ. 2019, 244, 1021–1064. [Google Scholar] [CrossRef]
  8. Dozzi, M.V.; Selli, E. Doping TiO2 with p-block elements: Effects on photocatalytic activity. J. Photochem. Photobiol. C Photochem. Rev. 2013, 14, 13–28. [Google Scholar] [CrossRef]
  9. Di Valentin, C.; Pacchioni, G. Trends in non-metal doping of anatase TiO2: B, C, N and F. Catal. Today 2013, 206, 12–18. [Google Scholar] [CrossRef]
  10. Hyun Kim, D.; Sub Lee, K.; Kim, Y.-S.; Chung, Y.-C.; Kim, S.-J. Photocatalytic Activity of Ni 8 wt%-Doped TiO2 Photocatalyst Synthesized by Mechanical Alloying Under Visible Light. J. Am. Ceram. Soc. 2006, 89, 515–518. [Google Scholar] [CrossRef]
  11. Gao, L.; Li, Y.; Ren, J.; Wang, S.; Wang, R.; Fu, G.; Hu, Y. Passivation of defect states in anatase TiO2 hollow spheres with Mg doping: Realizing efficient photocatalytic overall water splitting. Appl. Catal. B Environ. 2017, 202, 127–133. [Google Scholar] [CrossRef]
  12. Niishiro, R.; Kato, H.; Kudo, A. Nickel and either tantalum or niobium-codoped TiO2 and SrTiO3 photocatalysts with visible-light response for H2 or O2 evolution from aqueous solutions. Phys. Chem. Chem. Phys. 2005, 7, 2241–2245. [Google Scholar] [CrossRef] [PubMed]
  13. Choi, J.; Park, H.; Hoffmann, M.R. Effects of single metal-ion doping on the visible-light photoreactivity of TiO2. J. Phys. Chem. C 2010, 114, 783–792. [Google Scholar] [CrossRef] [Green Version]
  14. Shaban, M.; Ahmed, A.M.; Shehata, N.; Betiha, M.A.; Rabie, A.M. Ni-doped and Ni/Cr co-doped TiO2 nanotubes for enhancement of photocatalytic degradation of methylene blue. J. Colloid Interface Sci. 2019, 555, 31–41. [Google Scholar] [CrossRef] [PubMed]
  15. Manzoor, M.; Rafiq, A.; Ikram, M.; Nafees, M.; Ali, S. Structural, optical, and magnetic study of Ni-doped TiO2 nanoparticles synthesized by sol-gel method. Int. Nano Lett. 2018, 8, 1–8. [Google Scholar] [CrossRef] [Green Version]
  16. Macovei, D.; Tiron, V.; Adomnitei, C.; Luca, D.; Dobromir, M.; Antohe, S.; Mardare, D. On the hydrophilicity of Ni-doped TiO2 thin films. A study by X-ray absorption spectroscopy. Thin Solid Films 2018, 657, 42–49. [Google Scholar] [CrossRef]
  17. Dong, Z.; Ding, D.; Li, T.; Ning, C. Ni-doped TiO2 nanotubes photoanode for enhanced photoelectrochemical water splitting. Appl. Surf. Sci. 2018, 443, 321–328. [Google Scholar] [CrossRef]
  18. Yao, Z.; Jia, F.; Tian, S.; Li, C.; Jiang, Z.; Bai, X. Microporous Ni-Doped TiO2 film photocatalyst by plasma electrolytic oxidation. ACS Appl. Mater. Interfaces 2010, 2, 2617–2622. [Google Scholar] [CrossRef]
  19. Xiang, N.; Zhuang, J.J.; Song, R.G.; Xiang, B.; Xiong, Y.; Su, X.P. Fabrication and photocatalytic activity of MAO–TiO2 films formed on titanium doped with cations. Mater. Technol. 2016, 31, 332–336. [Google Scholar] [CrossRef]
  20. Soejima, T.; Yagyu, H.; Ito, S. One-pot synthesis and photocatalytic activity of Fe-doped TiO2 films with anatase-rutile nanojunction prepared by plasma electrolytic oxidation. J. Mater. Sci. 2011, 46, 5378–5384. [Google Scholar] [CrossRef]
  21. Yao, Z.; Jia, F.; Jiang, Y.; Li, C.; Jiang, Z.; Bai, X. Photocatalytic reduction of potassium chromate by Zn-doped TiO2/Ti film catalyst. Appl. Surf. Sci. 2010, 256, 1793–1797. [Google Scholar] [CrossRef]
  22. Stojadinović, S.; Tadić, N.; Radić, N.; Grbić, B.; Vasilić, R. Effect of Tb3+ doping on the photocatalytic activity of TiO2 coatings formed by plasma electrolytic oxidation of titanium. Surf. Coatings Technol. 2018, 337, 279–289. [Google Scholar] [CrossRef]
  23. Bayati, M.R.; Molaei, R.; Golestani-Fard, F. Enhancing photoinduced hydrophilicity of micro arc oxidized TiO2 nanostructured porous layers by V-doping. Colloids Surf. A Physicochem. Eng. Asp. 2011, 373, 51–60. [Google Scholar] [CrossRef]
  24. Vasilić, R.; Stojadinović, S.; Radić, N.; Stefanov, P.; Dohčević-Mitrović, Z.; Grbić, B. One-step preparation and photocatalytic performance of vanadium doped TiO2 coatings. Mater. Chem. Phys. 2015, 151, 337–344. [Google Scholar] [CrossRef]
  25. Yerokhin, A.L.; Nie, X.; Leyland, A.; Matthews, A.; Dowey, S.J. Plasma Electrolysis for Surface Engineering. Surf. Coat. Technol. 1999, 122, 73–93. [Google Scholar] [CrossRef]
  26. Bestetti, M.; Franz, S.; Cuzzolin, M.; Arosio, P.; Cavallotti, P.L. Structure of nanotubular titanium oxide templates prepared by electrochemical anodization in H2SO4/HF solutions. Thin Solid Films 2007, 515, 5253–5258. [Google Scholar] [CrossRef]
  27. Eskandarloo, H.; Hashempour, M.; Vicenzo, A.; Franz, S.; Badiei, A.; Behnajady, M.A.; Bestetti, M. High-temperature stable anatase-type TiO2 nanotube arrays: A study of the structure-activity relationship. Appl. Catal. B Environ. 2016, 185, 119–132. [Google Scholar] [CrossRef]
  28. Franz, S.; Perego, D.; Marchese, O.; Lucotti, A.; Bestetti, M. Photoactive TiO2 coatings obtained by Plasma Electrolytic Oxidation in refrigerated electrolytes. Appl. Surf. Sci. 2016, 385, 498–505. [Google Scholar] [CrossRef]
  29. Franz, S.; Arab, H.; Lucotti, A.; Castiglioni, C.; Vicenzo, A.; Morini, F.; Bestetti, M. Exploiting Direct Current Plasma Electrolytic Oxidation to Boost Photoelectrocatalysis. Catalysts 2020, 10, 325. [Google Scholar] [CrossRef] [Green Version]
  30. Mirelman, L.K.; Curran, J.A.; Clyne, T.W. The production of anatase-rich photoactive coatings by plasma electrolytic oxidation. Surf. Coat. Technol. 2012, 207, 66–71. [Google Scholar] [CrossRef]
  31. Sundararajan, G.; Rama Krishna, L. Mechanisms underlying the formation of thick alumina coatings through the MAO coating technology. Surf. Coat. Technol. 2003, 167, 269–277. [Google Scholar] [CrossRef]
  32. Bayati, M.R.; Moshfegh, A.Z.; Golestani-Fard, F. In situ growth of vanadia-titania nano/micro-porous layers with enhanced photocatalytic performance by micro-arc oxidation. Electrochim. Acta 2010, 55, 3093–3102. [Google Scholar] [CrossRef]
  33. He, J.; Cai, Q.Z.; Ji, Y.G.; Luo, H.H.; Li, D.J.; Yu, B. Influence of fluorine on the structure and photocatalytic activity of TiO2 film prepared in tungstate-electrolyte via micro-arc oxidation. J. Alloys Compd. 2009, 482, 476–481. [Google Scholar] [CrossRef]
  34. Li, J.F.; Wan, L.; Feng, J.Y. Study on the preparation of titania films for photocatalytic application by micro-arc oxidation. Sol. Energy Mater. Sol. Cells 2006, 90, 2449–2455. [Google Scholar] [CrossRef]
  35. Wu, X.; Ding, X.; Qin, W.; He, W.; Jiang, Z. Enhanced photo-catalytic activity of TiO2 films with doped La prepared by micro-plasma oxidation method. J. Hazard. Mater. 2006, 137, 192–197. [Google Scholar] [CrossRef]
  36. Wu, X.; Wei, Q.; Zhaohua, J. Influence of Fe3+ ions on the photocatalytic activity of TiO2 films prepared by micro-plasma oxidation method. Thin Solid Films 2006, 496, 288–292. [Google Scholar] [CrossRef]
  37. Franz, S.; Perego, D.; Marchese, O.; Bestetti, M. Photoelectrochemical advanced oxidation processes on nanostructured TiO2 catalysts: Decolorization of a textile azo-dye. J. Water Chem. Technol. 2015, 37, 108–115. [Google Scholar] [CrossRef] [Green Version]
  38. Murgolo, S.; Franz, S.; Arab, H.; Bestetti, M.; Falletta, E.; Mascolo, G. Degradation of emerging organic pollutants in wastewater effluents by electrochemical photocatalysis on nanostructured TiO2 meshes. Water Res. 2019, 164, 114920. [Google Scholar] [CrossRef]
  39. Collivignarelli, M.C.; Abbà, A.; Carnevale Miino, M.; Arab, H.; Bestetti, M.; Franz, S. Decolorization and biodegradability of a real pharmaceutical wastewater treated by H2O2-assisted photoelectrocatalysis on TiO2 meshes. J. Hazard. Mater. 2020, 387, 121668. [Google Scholar] [CrossRef]
  40. Franz, S.; Falletta, E.; Arab, H.; Murgolo, S.; Bestetti, M.; Mascolo, G. Degradation of Carbamazepine by Photo(electro)catalysis on Nanostructured TiO2 Meshes: Transformation Products and Reaction Pathways. Catalysts 2020, 10, 169. [Google Scholar] [CrossRef] [Green Version]
  41. Shard, A.G. Detection limits in XPS for more than 6000 binary systems using Al and Mg Kα X-rays. Surf. Interface Anal. 2014, 46, 175–185. [Google Scholar] [CrossRef]
  42. Energy Dispersive X-ray Spectroscopy tutorial EAG Laboratories. Available online: https://www.eag.com/techniques/spectroscopy/energy-dispersive-x-ray-spectroscopy-eds/ (accessed on 20 March 2020).
  43. Berti, G.; Calloni, A.; Brambilla, A.; Bussetti, G.; Duò, L.; Ciccacci, F. Direct observation of spin-resolved full and empty electron states in ferromagnetic surfaces. Rev. Sci. Instrum. 2014, 85, 073901. [Google Scholar] [CrossRef] [PubMed]
  44. Galenda, A.; Visentin, F.; Gerbasi, R.; Battiston, S.; Habra, N. El Effective and Low-Cost Synthesis of Sulphur-Modified TiO2 Nanopowder with Improved Photocatalytic Performances in Water Treatment Applications. Water Air Soil Pollut. 2017, 228, 416. [Google Scholar] [CrossRef]
  45. Spurr, R.A.; Myers, H. Quantitative analysis of anatase-rutile mixtures with an X-ray diffractometer. Anal. Chem. 1957, 29, 760–762. [Google Scholar] [CrossRef]
  46. Tauc, J. Optical properties and electronic structure of amorphous Ge and Si. Mater. Res. Bull. 1968, 3, 37–46. [Google Scholar] [CrossRef]
  47. Saha, N.C.; Tompkins, H.G. Titanium nitride oxidation chemistry: An x-ray photoelectron spectroscopy study. J. Appl. Phys. 1992, 72, 3072–3079. [Google Scholar] [CrossRef]
  48. Biesinger, M.C.; Lau, L.W.M.; Gerson, A.R.; Smart, R.S.C. Resolving surface chemical states in XPS analysis of first row transition metals, oxides and hydroxides: Sc, Ti, V, Cu and Zn. Appl. Surf. Sci. 2010, 257, 887–898. [Google Scholar] [CrossRef]
  49. Topalian, Z.; Niklasson, G.A.; Granqvist, C.G.; Österlund, L. Spectroscopic Study of the Photofixation of SO2 on Anatase TiO2 Thin Films and Their Oleophobic Properties. ACS Appl. Mater. Interfaces 2012, 4, 672–679. [Google Scholar]
  50. Randeniya, L.K.; Murphy, A.A.B.; Plumb, A.I.C. A study of S-doped TiO2 for photoelectrochemical hydrogen generation from water. J. Mater. Sci. 2008, 43, 1389–1399. [Google Scholar] [CrossRef]
  51. Ohno, T.; Akiyoshi, M.; Umebayashi, T.; Asai, K.; Mitsui, T.; Matsumura, M. Preparation of S-doped TiO2 photocatalysts and their photocatalytic activities under visible light. Appl. Catal. A Gen. 2004, 265, 115–121. [Google Scholar] [CrossRef]
  52. Chiarello, G.L.; Zuliani, A.; Ceresoli, D.; Martinazzo, R.; Selli, E. Exploiting the Photonic Crystal Properties of TiO2 Nanotube Arrays to Enhance Photocatalytic Hydrogen Production. ACS Catal. 2016, 6, 1345–1353. [Google Scholar] [CrossRef]
  53. Murata, Y.; Fukuta, S.; Ishikawa, S.; Yokoyama, S. Photoelectrochemical properties of TiO2 rutile microalloyed with 4d and 5d transition elements. Sol. Energy Mater. Sol. Cells 2000, 62, 157–165. [Google Scholar] [CrossRef]
  54. Seetharaman, A.; Sivasubramanian, D.; Gandhiraj, V.; Rao Soma, V. Tunable Nanosecond and Femtosecond Nonlinear Optical Properties of C−N−S-Doped TiO2 Nanoparticles. J. Phys. Chem. C 2017, 121, 24192–24205. [Google Scholar] [CrossRef]
  55. Khan, M.M.; Ansari, S.A.; Pradhan, D.; Ansari, M.O.; Han, D.H.; Lee, J.; Cho, H. Band gap engineered TiO2 nanoparticles for visible light induced photoelectrochemical and photocatalytic studies. J. Mater. Chem. A 2014, 2, 637–644. [Google Scholar] [CrossRef]
  56. Matsushima, S.; Takehara, K.; Yamane, H.; Yamada, K.; Nakamura, H.; Arai, M.; Kobayashi, K. First-principles energy band calculation for undoped and S-doped TiO2 with anatase structure. J. Phys. Chem. Solids 2007, 68, 206–210. [Google Scholar] [CrossRef]
  57. Lin, Y.M.; Jiang, Z.Y.; Zhu, C.Y.; Hu, X.Y.; Zhang, X.D.; Fan, J. Visible-light photocatalytic activity of Ni-doped TiO2 from ab initio calculations. Mater. Chem. Phys. 2012, 133, 746–750. [Google Scholar] [CrossRef]
  58. Sun, T.; Fan, J.; Liu, E.; Liu, L.; Wang, Y.; Dai, H.; Yang, Y.; Hou, W.; Hu, X.; Jiang, Z. Fe and Ni co-doped TiO2 nanoparticles prepared by alcohol-thermal method: Application in hydrogen evolution by water splitting under visible light irradiation. Powder Technol. 2012, 228, 210–218. [Google Scholar] [CrossRef]
  59. Serpone, N.; Pelizzetti, E. Photocatalysis: Fundamentals and Applications; Wiley: New York, NY, USA, 1989; ISBN 0471626031. [Google Scholar]
Figure 1. Scanning electron microscopy (SEM) micrographs and energy-dispersive X-ray spectroscopy (EDX) analysis (inset) of sample (a) S0 and (b) S6.
Surfaces 03 00013 g001
Figure 2. Glow discharge optical emission spectrometry (GD-OES) in-depth analysis for sample (a) S0 and (b) S6.
Surfaces 03 00013 g002
Figure 3. XPS spectra taken from samples S0 (red) and S6 (blue): (a) wide scans; (b,c) detailed scans of the Ni 2p3/2 and S 2p binding energy regions. The photoemission signal from Ni is highlighted in panel (b) by fitting a peak function to the experimental data. (d) XPS spectra taken from samples S0 (red), S2 (orange), S4 (green) and S6 (blue) and Ni peak height as a function of the Ni concentration. The spectra of panels (b) and (d), shown after the subtraction of a linear background, have been additionally smoothed to enhance the visibility of the Ni line shape. Spectra from different samples are vertically offset for clarity.
Surfaces 03 00013 g003
Figure 4. Nyquist plots of experimental (symbols) and fitted (lines) data for samples S0, S2, S4 and S6.
Surfaces 03 00013 g004
Figure 5. (a) XRD pattern of samples S0, S2, S4 and S6 obtained at various nickel sulfate concentrations in the electrolyte. (b) UV-vis-NIR diffuse reflectance spectra (DRS) for some representative TiO2 samples as Tauc-plots of the Kubelka–Munk transform.
Surfaces 03 00013 g005aSurfaces 03 00013 g005b
Figure 6. (a) Incident photon-to-current efficiency (IPCE) vs. irradiation wavelength curves and (b) linear sweep voltammetry (LSV) curves recorded from −0.5 to 1 V vs. SCE at 5 mV s−1 upon continuous Xenon light irradiation, measured for samples S0, S2, S4 and S6.
Surfaces 03 00013 g006
Figure 7. Photoluminescence (PL) spectra of some representative samples (S0, S2 and S6) and samples consisting of anatase phase (SA) and rutile phase (SR), obtained upon excitation at (a) 300 nm and (b) 380 nm.
Surfaces 03 00013 g007
Table 1. Sample labelling, corresponding NiSO4 concentration in the electrolyte, anatase/rutile weight fraction, band-gap energy (EBG), conduction band edge (CBedge).
SampleNiSO4 (mM)/(g L−1)Anatase/Rutile (wt %)EBG (eV)CBedge (VSCE, pH=7)
S00/055.1/44.93.08−0.28
S20.2/0.05466.4/33.63.09−0.31
S40.4/0.112360.7/39.33.10−0.23
S60.6/0.169518.0/82.03.06−0.23
SA0/0100/03.18-
SR0/00/1002.94-

