Article

A Cross-Comparative Framework to Explore Land Use Histories of the Northeastern Peloponnese, Greece

1
Center for Historical Landscapes, College of Charleston, 66 George Street, Charleston, SC 29424, USA
2
Department of Mathematics, College of Charleston, 66 George Street, Charleston, SC 29424, USA
3
Program in Environmental and Sustainability Studies, College of Charleston, 66 George Street, Charleston, SC 29424, USA
4
Department of History, College of Charleston, 66 George Street, Charleston, SC 29424, USA
5
Stantec, 555 Capital Mall, Suite 650, Sacramento, CA 95816, USA
6
Department of Classical Studies, Tufts University, 5 The Green, Medford, MA 02155, USA
*
Author to whom correspondence should be addressed.
Heritage 2025, 8(8), 298; https://doi.org/10.3390/heritage8080298
Submission received: 7 April 2025 / Revised: 30 June 2025 / Accepted: 10 July 2025 / Published: 25 July 2025
(This article belongs to the Special Issue The Archaeology of Climate Change)

Abstract

Calls for an “archaeology of climate change” highlight the interest in integrating human land use histories with the paleoenvironmental record. Shifts in land use patterns, observed via regional archaeological surveys, have been used in studies exploring the relationships between human and environmental systems, often via the Adaptive Cycle (AC). Recent work has combined datasets from separate surveys to examine macroregional patterns, which can then be integrated with environmental proxy data. However, efforts at aggregating archaeological data are often problematized due to projects’ differing collection methods and periodizations. This study ascribes the formal constructs of the AC to survey data to minimize data aggregation issues and maintain local integrity. Aoristic sum functions were performed individually on data from four projects in the northeastern Peloponnese to identify local patterns. These data were then aggregated, allowing for changes in land use to be observed at the macro and regional levels. Further measurements relating to land use abandonment, continuity, expansion, and potential serve as proxy data to identify the AC constructs of organization, exploitation, conservation, and release. The approach allows for cross-comparative regional analysis and the creation of an aggregated dataset that describes macroregional trends, essential to integrating human and paleoenvironmental narratives over time.

1. Introduction

The ways human and environmental systems change over time, how and why changes occur, and the lessons they may impart to our condition have received significant interest. This has led to a call for an “archaeology of climate change”, which seeks not only to understand past relationships between climate and human systems, but to elucidate potential solutions to our current condition [1]. In the last 20 years, and the previous 10 years in particular, theoretical constructs and methodological approaches have turned towards thinking of the interplay between social and environmental changes, eroding what had become a dualist approach to studying ecological and human evolution [2]. Many of these studies (e.g., Refs. [1,2,3,4,5,6,7,8,9]) point to the need for developing integrated approaches to analyzing human and environmental datasets.
This work is often at broad geographical and/or temporal scales, with an interest in assessing landscape use within a quantitative framework [3,8,10], in some part owing to the desire to integrate human and environmental data using theoretical models drawn from ecology [3,4,5]. Often, central to these studies are three processes: the amalgamation of archaeological data from various projects; the synthesis and interpolation of paleoenvironmental data; and the placement of these data within theoretical constructs that can associate both human and environmental processes, allowing the exploration of causal relationships without the overt imposition of deterministic paradigms. Thus, two things need to happen to investigate the long-term relationship between humans and the environment substantively.
  • A means of aggregation that obviates or mitigates the methodological barriers between survey projects needs to be developed.
  • Once configured, the data must be implemented within an interpretative framework that can couple human and environmental information.
This paper presents a method by which legacy archaeological survey data from multiple projects can be assessed within a common framework, enabling cross-comparisons of human activity across the longue durée. Placed within a framework that has been applied to both human and environmental systems, this approach can provide a means of integration with paleoenvironmental records to discuss possible responses to climatic fluctuations.

1.1. Prior Approaches

In the Aegean, aggregating survey data has been considered important yet problematic. In this region, archaeological surveys are limited to comparatively small areas (often between 10 and 40 km2) and occur in relatively short time frames (3–5 years). This observation scale is small compared to other places, such as Mesoamerica (e.g., the Oaxaca survey, which took place over nine years and covered 2150 km2) [11]. If a goal of landscape studies is to develop a broad understanding of how societies engage with their environment and explore the reasons for regional differences and broad similarities [12], it is necessary to develop interpretative frameworks that reach across multiple projects [13,14]. This matter was brought to the fore via the publications of the POPULUS project [15,16] and the subsequent publication of an edited volume exploring the efficacy of intra-project syntheses [17]. Reviews on the efficacy of combining survey data have identified difficulties such as the lack of consistent methods related to data collection, chronological periodization, and descriptions/definitions of discrete areas of activity [7,14,18,19,20,21,22]. Beyond methodological considerations, the permanence of past activity can be difficult to measure; a concentration of Late Roman sherds, for example, does not imply constant ongoing activity over the entirety of the 200 (or 400) year extent of time [7,23,24,25,26]. An additional consideration lies in geographic and temporal interest. While a significant amount of energy has been expended studying a given region or period (e.g., the Late Bronze Age Argolid), the lack of similar focus in other areas and periods leaves disparities in resolution across time and space, complicating data comparison [21]. These considerations have confounded attempts at integrating data, leading some to view the process as highly problematic or untenable [21,27,28]. Recent reviews of landscape archaeology in the Mediterranean point towards data interoperability as an area requiring development [6,29,30].
The issues with data interoperability have not prevented the generation of significant works synthesizing survey and other data to explore such topics as Roman Greece [31], the Late Bronze Age to Early Iron Age economy [32], or cultural evolution in central Greece [13], but researchers are careful to discuss the limitations of the data caused by differing collection methods and research foci that generated the data. More recently, Attema et al. have proposed a set of ‘good practices’ to encourage consistency [33] and developed a means by which three major surveys in Latium could be brought into a condition of interoperability [14]. De Haas and van Leusen produced data publishing protocols according to FAIR (Findable, Accessible, Interoperable, and Reusable) principles [22]. While these initiatives may assist in developing future datasets (but also noting concerns about a defined set of ‘best practices’ [18,34]), outside of the expense of great energy exemplified by the Roman Hinterland Project, legacy datasets remain problematic yet significant sources of information.
Considering work integrating patterns of human activity from multiple survey datasets with environmental information [3,5,6], Izdebski, Pickett, et al. [10] sought to review settlement and environmental changes in southern Anatolia and the Levant between the third and ninth centuries using archaeological surveys and paleoenvironmental evidence, as did Roberts et al. for sixth- to ninth-century Anatolia [8]. Similarly, contemporaneous work in the Aegean on pre-classical and classical periods sought to integrate archaeological and paleoenvironmental data [35,36,37,38,39]. Within these works was a desire to engage human and environmental data to develop a broad understanding of how human and ecological systems engage to impact the configuration of the other and how such changes affect the socio-environmental system (SES) at multiple scales of time and space, from the local (e.g., Ref. [40]) to global [41].
In compiling land use data across multiple projects, these efforts used aoristic sum analysis (e.g., Refs. [42,43,44]), which divides an observation (e.g., the presence of a feature) by the extent of time during which that observation could have occurred. This transformation distributes the probability of an archaeological site uniformly over a given archaeological phase [35], yielding patterns that account for the varying lengths of archaeological periods (compare bar graphs a and b in Figure 1).
Using this approach, Weiberg, Bevan, et al. investigated the differences between northern and southern Greece between the Neolithic and Roman periods and the possible correlations to climate fluctuations [35]. Within this study, survey data were combined by period to derive aoristic sum values, which were used to track the increase/decrease in the number of features (i.e., sites) over time. The study employed a uniform periodization. When considering variability at such a scale, temporal and spatial resolutions can withstand coarseness. This is possible given the desire to incorporate human with environmental data, the collection of which is idiosyncratic and correlated more to areas where such data can be retrieved rather than where archaeologists choose to conduct investigations. However, the comparison of northern and southern Greece potentially masked subregional variations. This was justifiable given the spatiotemporal resolution under study, and the authors were cautious to note that “variations within these subregions are likely to be non-trivial” [35] (p. 29). Indeed, while a coarse resolution provides an appearance of uniformity, closer scrutiny might reveal localized differences based on local environmental and social conditions. In periods of human history where locally specific conditions were important to the evolution of social systems, an approach at the scale of the local region is required.
A similar situation is found in the exploration of sixth- to ninth-century Anatolia, where survey data from central, southern, and northern Anatolia were combined with paleoenvironmental data to discuss patterns of resilience [8]. While the study identified coincidences and potential correlations in human and environmental shifts, these results were complemented by interrogation of the survey data [7], identifying inconsistencies brought on by vagaries in data collection, periodizations, and other methodological differences. Further interrogation of the aggregated data from northern Anatolia suggested that within that regional pattern, localized human land use patterns differed despite uniformity when the data were combined [25]. The work indicates a need for an approach capable of observing broad patterns of land use while simultaneously preserving regional idiosyncrasies that suggest localized adaptations that inform our broader perspectives of cultural evolution.
Despite these attempts to integrate data from multiple regions, the approaches do not fully assist in modeling regional or macroregional changes in human society. The analysis of landscape use is more than measuring the quantity of land use over time. Equally, if not more important, is how perceptions of the use of the landscape change over time. Reviewing the extent to which land use of a space continues from one period to another suggests persistance of activity. The extent to which spaces are abandoned from one period to the next also implies differing interactions with the land. Adding new spaces of activity implies the expansion of land use or activities that may stand as proxies for increased population or changes to subsistence strategies.
We propose a framework for collating, interpreting, and discussing regional and methodologically variable survey data. This process renders the data comparable across time and space, yielding more holistic interpretations while identifying opportunities for future study. Instead of aggregating land use data from projects, the approach develops an analytical framework that is first applied to the individual projects before aggregation. Instead of a broad regional narrative, the approach thus develops local narratives that are both cross-comparative and capable of broader syntheses [6].

1.2. Theoretical Considerations

Those studying complexity, change, and adaptability have been drawn to the constructs of resilience—how a system meets the demands of changing conditions and how those systems adapt and reconfigure [45,46]. A key framework within this construct is the Adaptive Cycle (AC) [47], which holds several assumptions:
  • A system consists of human and environmental components; the two are interdependent, often termed a ‘social-environmental system’ (SES).
  • An SES moves through the organization (α), expansion (r), conservation (K), and release (Ω) phases.
  • Each phase consists of a combination of forces, termed ‘potential’ and ‘connectedness’. ‘Potential’ refers to the range of opportunities available to an SES to engage. For example, an SES in an organization phase would have several future permutations; a system in expansion, in contrast, having established set systems, has fewer options to respond to changing conditions. ‘Connectedness’ describes the level of engagement and interdependence between an SES and other entities.
Each of the four phases is characterized by the extent to which these elements are found (Figure 2). Thus,
  • α: high potential, low connectedness. An SES is in the process of developing new structures and innovations. The SES is localized and experimental.
  • r: low potential, low connectedness. The SES experiences growth—technological, demographic, or both—social structures become more complex and integrated.
  • K: high potential, high connectedness. The SES is in stasis, with established social structures that reify the status quo. Practices solidify and become resistant to changing circumstances, either internal or external.
  • Ω: low potential, high connectedness. Internal or external pressures become so prevalent that the SES cannot successfully respond, causing a need to reorganize/reconstruct effective structures.
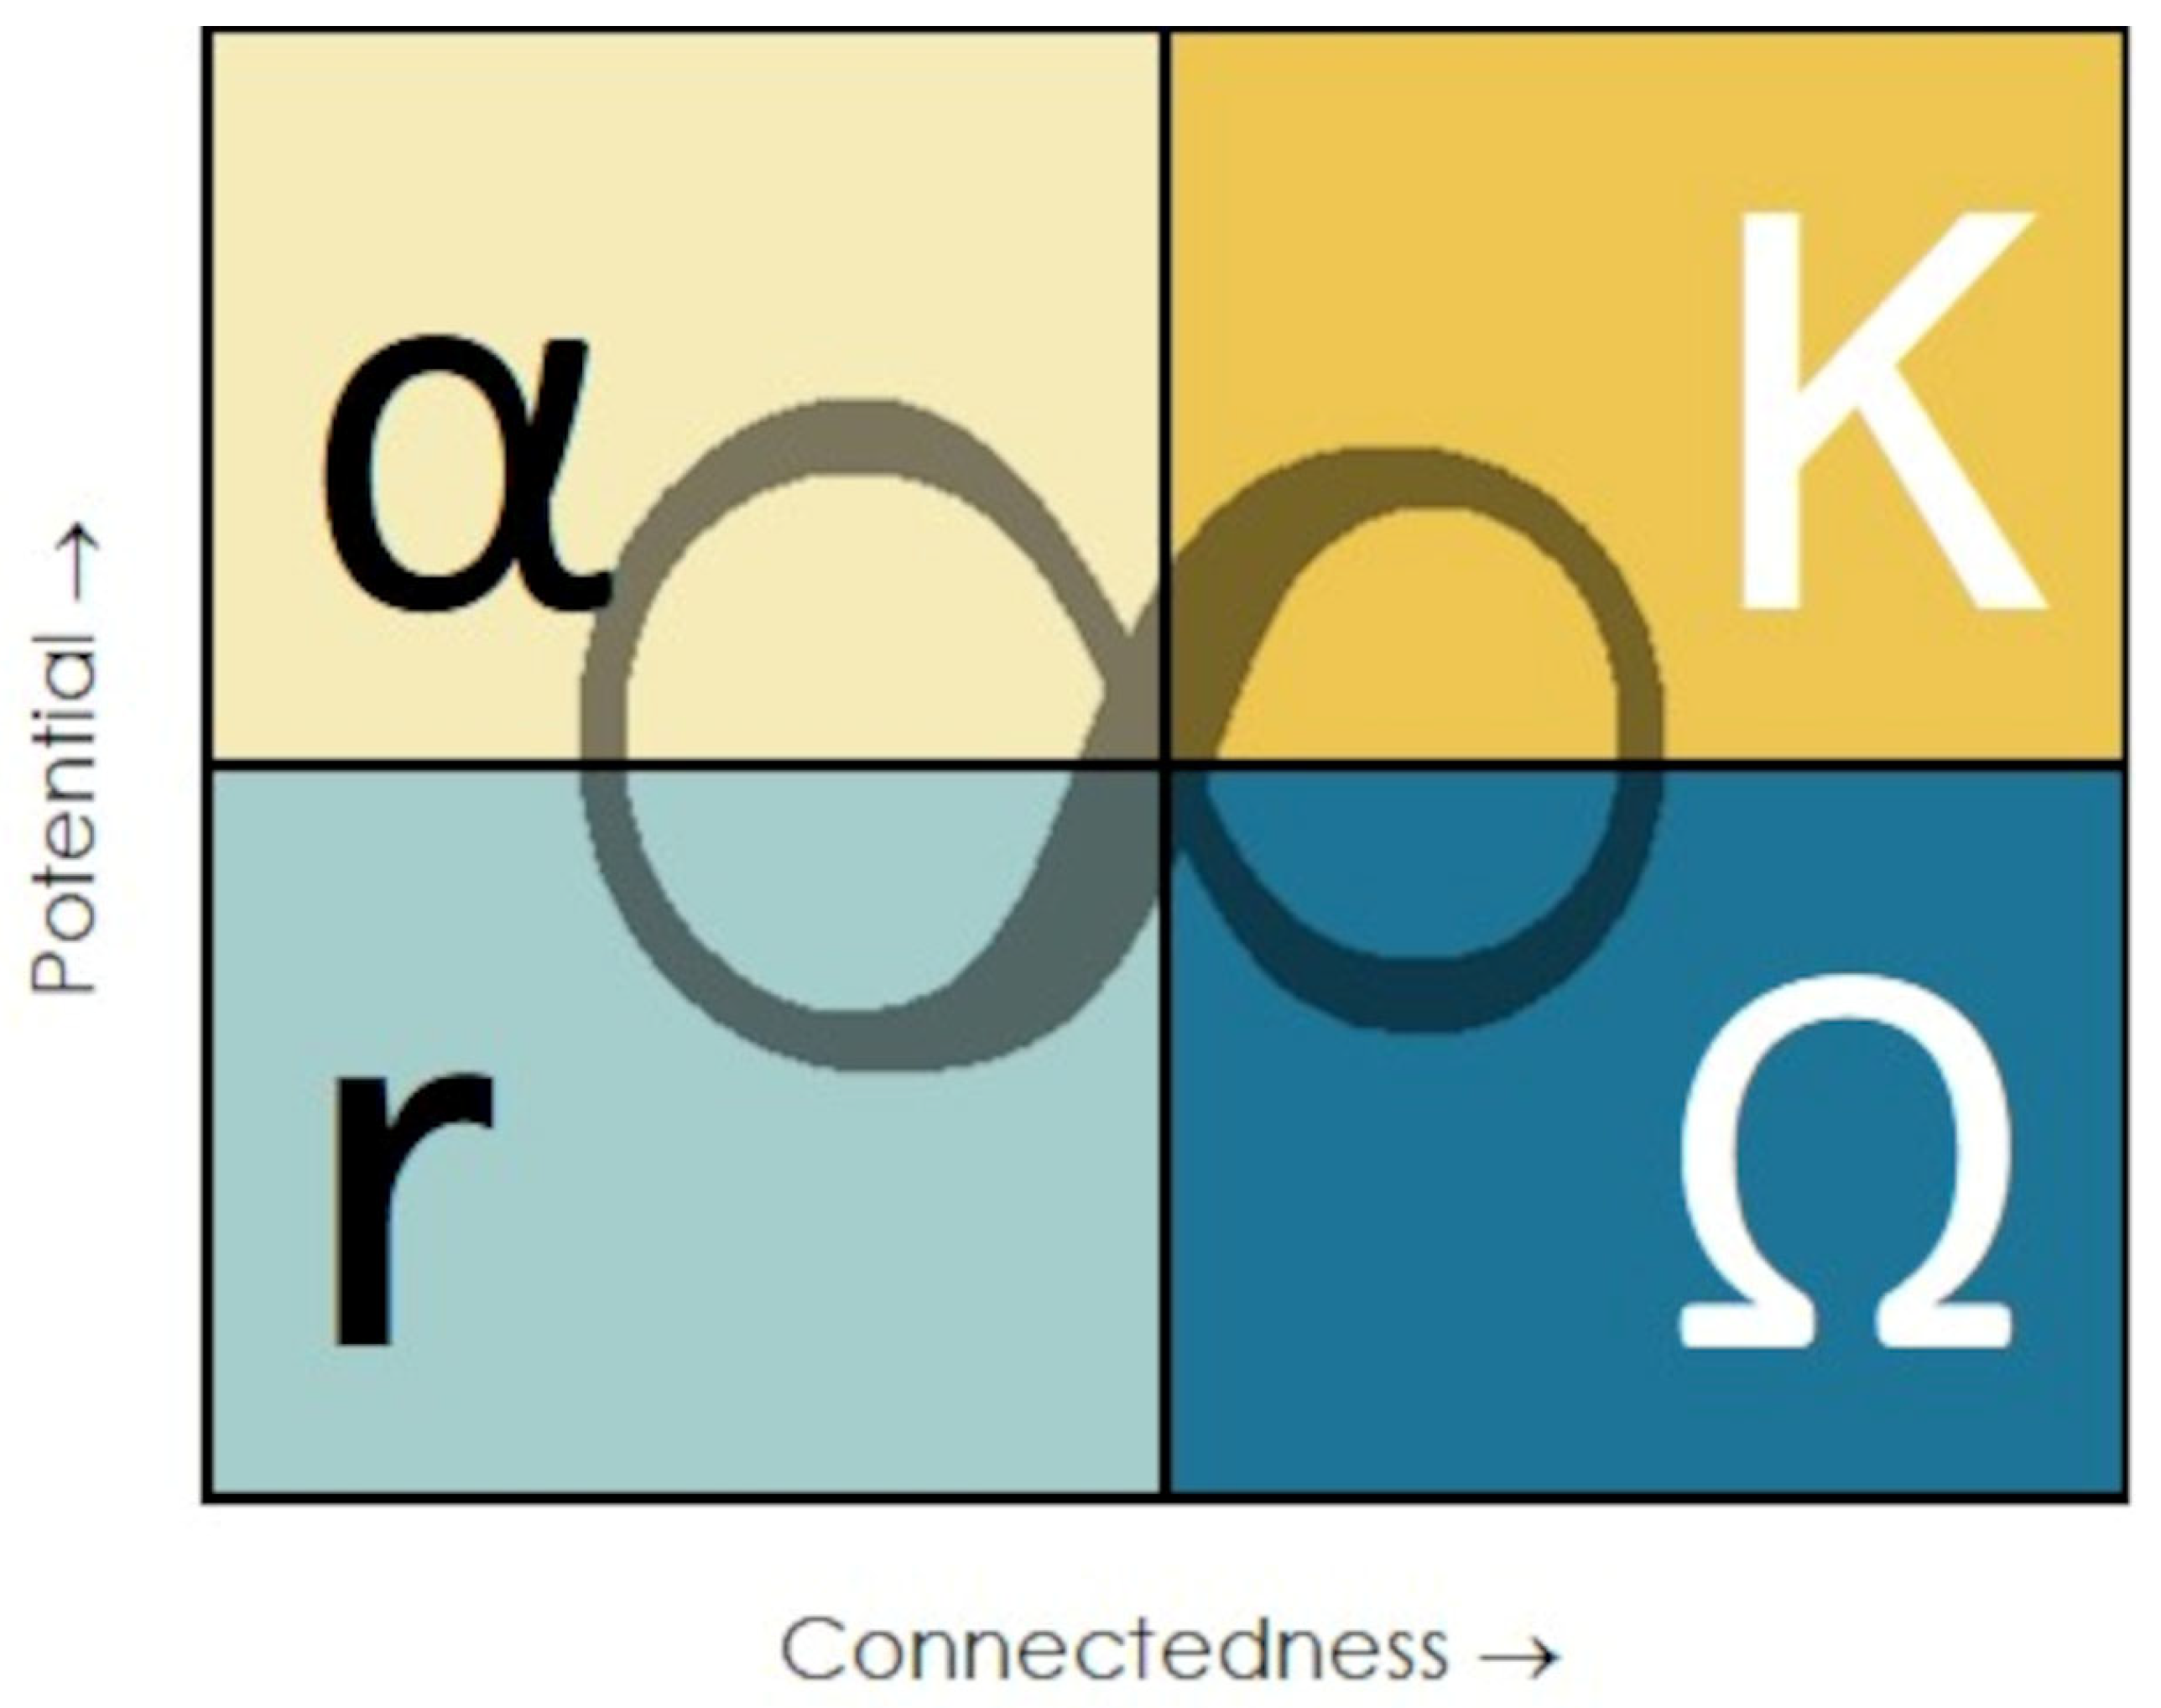
Figure 2. The Adaptive Cycle. Derived from Holling and Gunderson [33], Figures 1–7.
Heritage 08 00298 g002
These four phases can be discussed as a serial development (α → r → K → Ω), operating in a continuous loop [48]. The early proponents emphasized that an SES would not necessarily progress through the phases in the order given; indeed, the strength of the framework was that it offered a way to observe and then interrogate how and why SESs fluctuated between the various phases [49,50]. It is this fluctuation that provides the ability to examine a system’s overall trajectory of adaptation and development [47].

2. Materials and Methods

This study’s approach consists of developing aoristic sum functions (ASFs) for each selected regional project. These local ASFs (LASFs) provide a probabilistic measure of human occupation in the landscape according to localized periodizations. Tied to a timescale, these LASFs were aggregated to form a regional ASF (RASF). The process thus provides a measure of broad trends over time while maintaining regional idiosyncrasies. LASF development involved investigating each project’s dataset in terms of the resolution at which each project reported its data within the context of each project’s periodization.
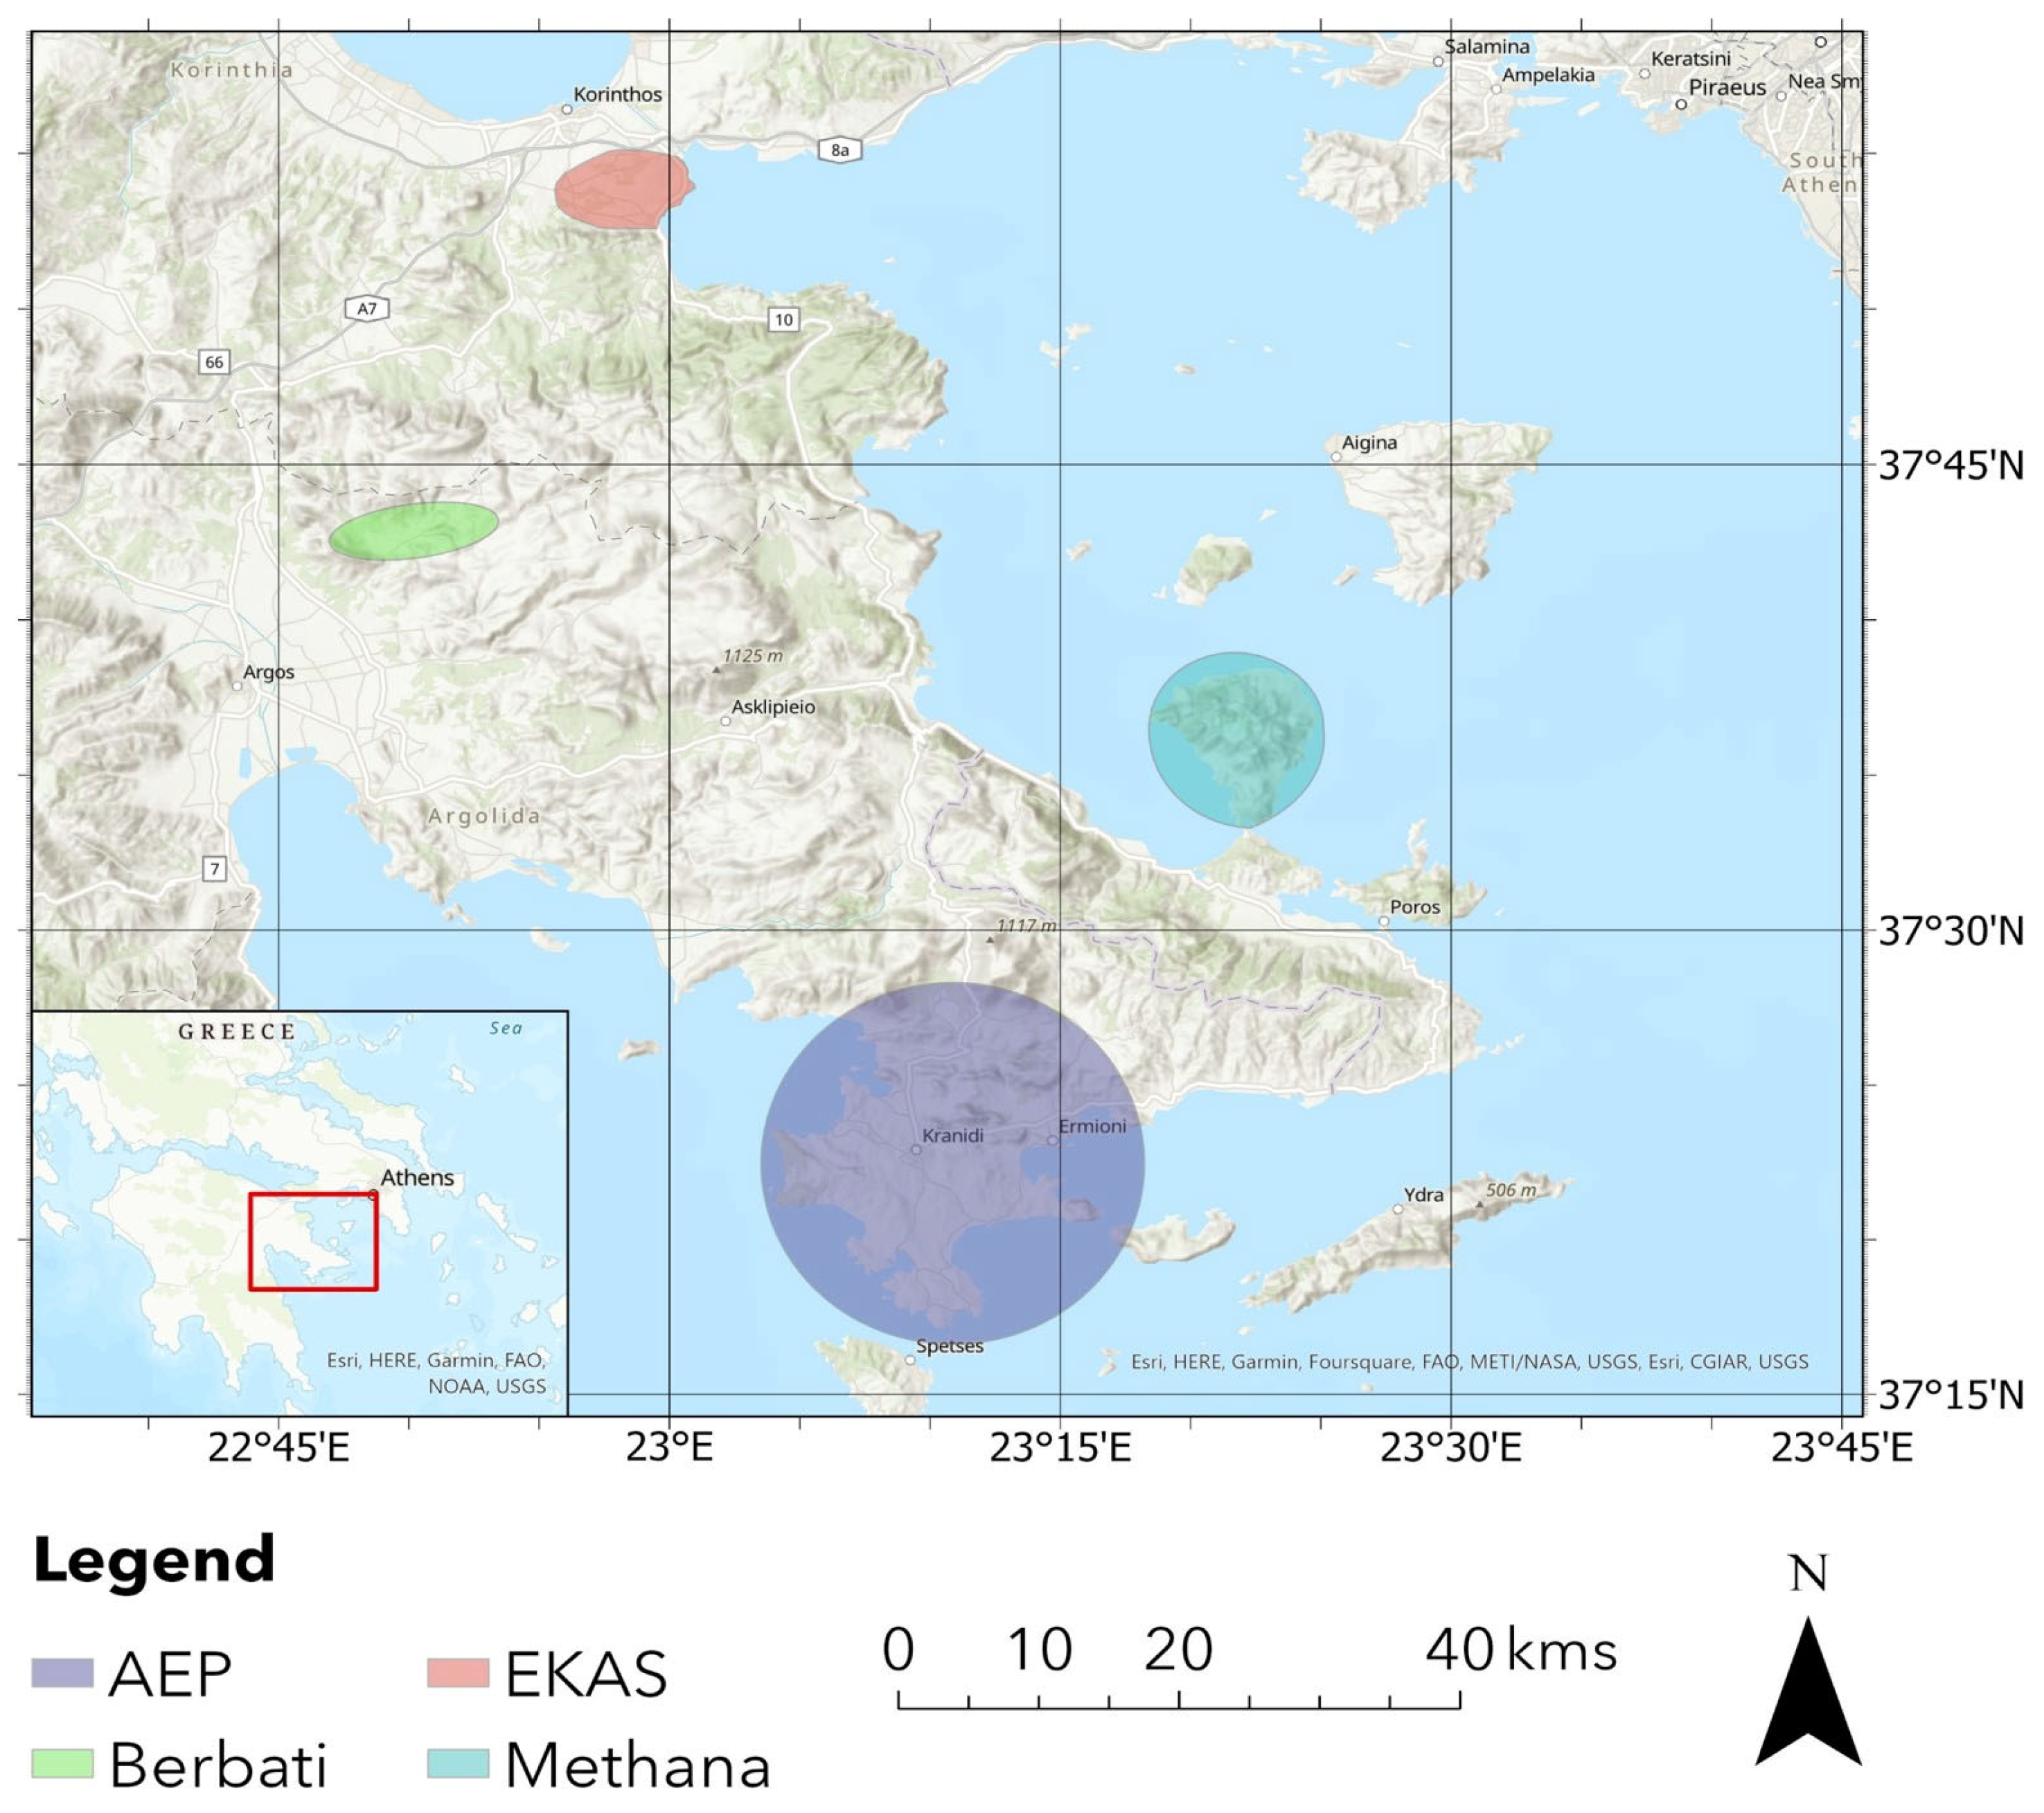
Four projects in the northeastern Peloponnese were selected for analysis (Figure 3): the Southern Argolid Survey (AEP) [51], the Berbati-Limnes Survey [52], the Methana Survey [53], and the Eastern Korinthia Archaeological Survey (EKAS) [54,55]. The projects were selected based on their geographical proximity, publication status, and breadth of time during which the surveys were conducted. Projects near each other were sought, given that one of the ideas to be tested was the extent of regional variability. Projects in relative proximity would have the best opportunity for similarity. When combined, the projects cover the northeastern part of the Peloponnese. While significant gaps in territory remain (notably, the Epidauria to the north of the AEP and the areas surrounding the Argive Plain), the selected projects provide a geographical range of the area in question. The four projects have been published to such a degree that data related to long-term land use for all periods were available. Other projects, notably the Nemea Valley Archaeological Project [56], the Western Argolid Regional Project [24], and the Saronic Harbors Archaeological Project [57], still await complete data publication at the time of writing, although several publications exist that provide data for some projects for some periods (e.g., Refs. [58,59]). The four projects selected also offered a range of methods representing the new wave of projects in the 1980s and 1990s and their immediate descendants [6]. While integrating data with this range of approaches invites questions about data comparability, the span of methods found in these legacy datasets provides a helpful test case.
Since the interest is on observing shifts is primarily demographic, data were cleansed of features identified as solely mortuary, religious, or defensive. The intent was to remove features that, while providing evidence for activity, may skew the data to exaggerate a region’s RASF for a given period. While this may raise concerns about periods where archaeological evidence is scarce except for cemetery data (such as the Early Iron Age), mortuary data (consisting of cemeteries, sarcophagi, and tombs) consisted of 2.1% (N = 13) of the overall sample. Of the total number of features (619), an additional 53 (consisting of such things as chapels/churches, aqueducts, fortification walls) were removed from tabulation (8.7%). Given that the projects vary widely in areal coverage, the data were divided by the area covered for each survey. Although this does not account for the total variance caused by differing levels of intensity in data recovery [60,61], it mitigates against skewing the data in favor of projects with large areal coverage.
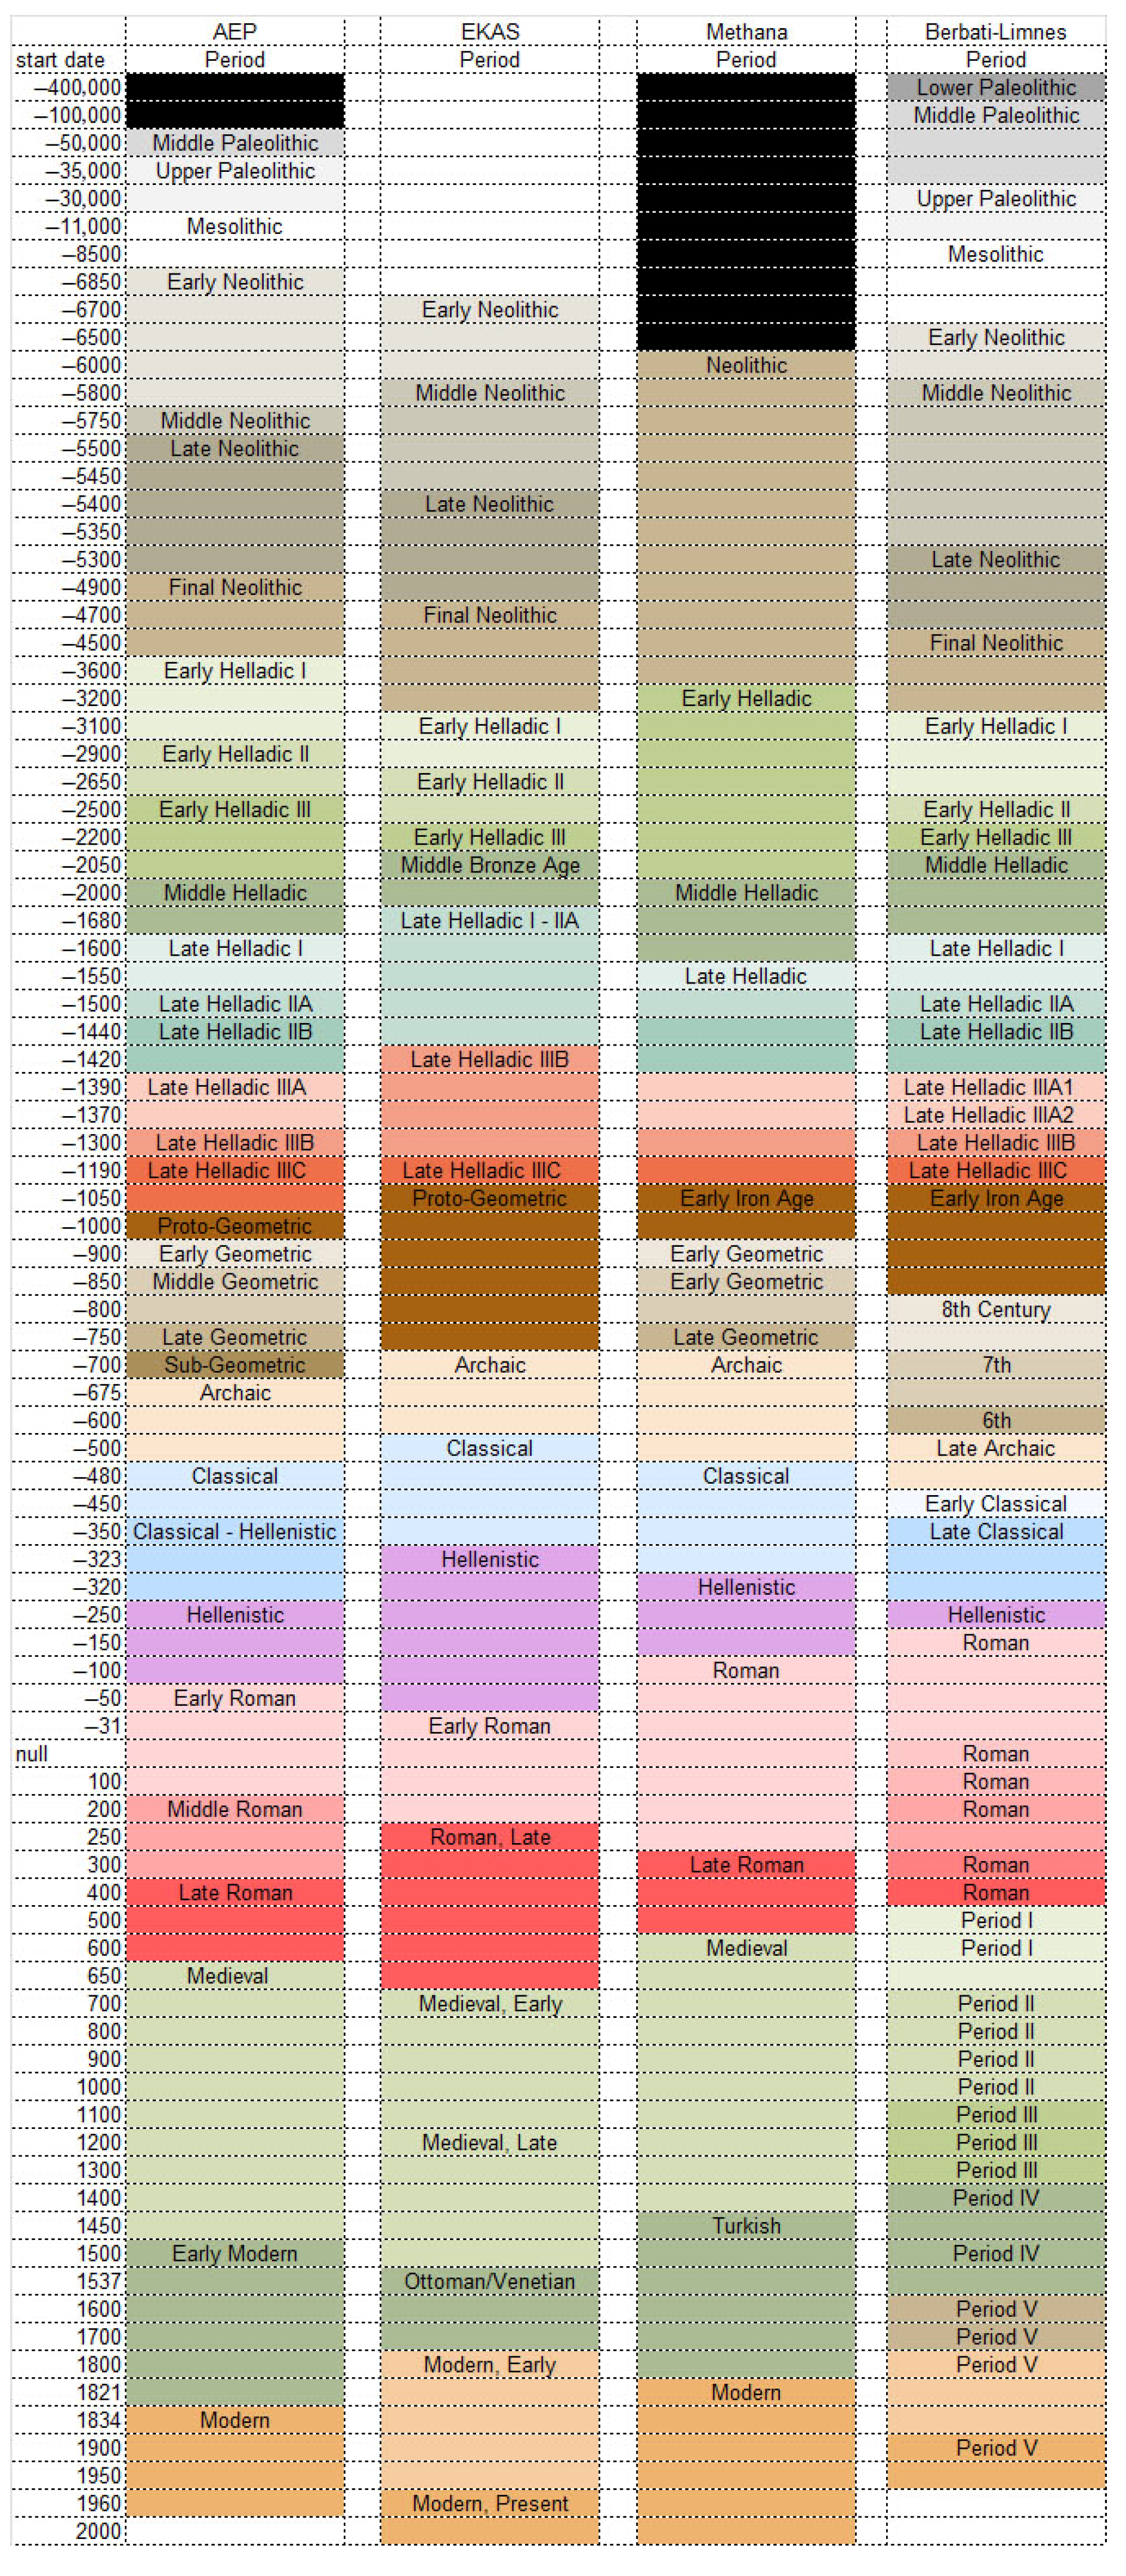
To maintain local integrity, LASFs were applied to each project using each project’s chronological phasing (Figure 4; see Supplementary Materials, periodizations.xlsx). Periodization is viewed as a regional consideration, derived from a process of large-scale understanding of material and historical shifts and specific regional knowledge. In most areas, prehistoric phases are based on relatively dated typological sequences, while later historical divisions are often made based on historical events. Professional opinions on the beginnings and ends of several periods may have shifted between the earliest (AEP) and latest (EKAS) surveys in the study. Given the local knowledge embedded within those frameworks, the best approach was to hold to local periodizations to create regional narratives. On a grand scale, there is general consistency, although there are some significant points of departure. For example, the Early Helladic Period (Early Bronze Age) is undivided in the Methana periodization but subdivided in the others. The period between 1190 and 675 BCE is noted as a single phase (EKAS, Berbati-Limnes) or subdivided into as many as five (AEP). The “Hellenistic” period lasts either 100 years (Berbati-Limnes) or 292 (EKAS), starting close to the ascent of Alexander (EKAS, Methana) or 50 years later in the mid-3rd century BCE (AEP, Berbati-Limnes). The Roman period begins at different times over 119 years (150—31 BCE). Likewise, the assignment of the beginning, end, and divisions within the Late Antique and Medieval periods can vary based on local understandings and historical events. In the context of developing ASFs, conditions where there are more chronological divisions and highly diagnostic pottery will develop higher ASF values.
The Eastern Korinthia Archaeological Survey (EKAS) is the most recently completed project in the study. Conducted between 1997 and 2003, the project data have been archived via OpenContext and are available for free download [54], in addition to a formal publication discussing the impressions and considerations of the data’s integrity and interpretation [55]. The ready availability of data allowed for individual feature (Localized Cultural Anomaly (LOCA),1 in EKAS terminology) review. LOCA and artifact tables were downloaded [62,63]; the former provided a functional and chronological assessment of the LOCA and listed each LOCA’s discovery unit(s). The artifact table, consisting of artifact counts grouped by chronotype and discovery unit, was parsed for each feature, providing a summary count of artifacts for each period. Based on these data, three separate methods for deriving aoristic sum functions could be constructed, which proved informative and helpful in understanding ASFs derived from the data of the other projects. These methods are discussed in Appendix A. The method that measured the presence/absence of activity for a period was deemed most suitable for the study. If evidence was observed at a feature for a given period, regardless of quantity, a value of 1 was recorded. This was then divided by the number of years in the period (Equation (A2)) to obtain a feature’s aoristic value (AV) for the range of years in which the feature indicated activity. The AVs were then summed by year. The resulting ASF removed bias for artifact quantity while preserving a probabilistic measurement based on the length of a given period. While still accentuating periods of short chronological duration, the function presents probabilities of activity for a given year. Thus, it represents the presence and a probabilistic measure of activity.
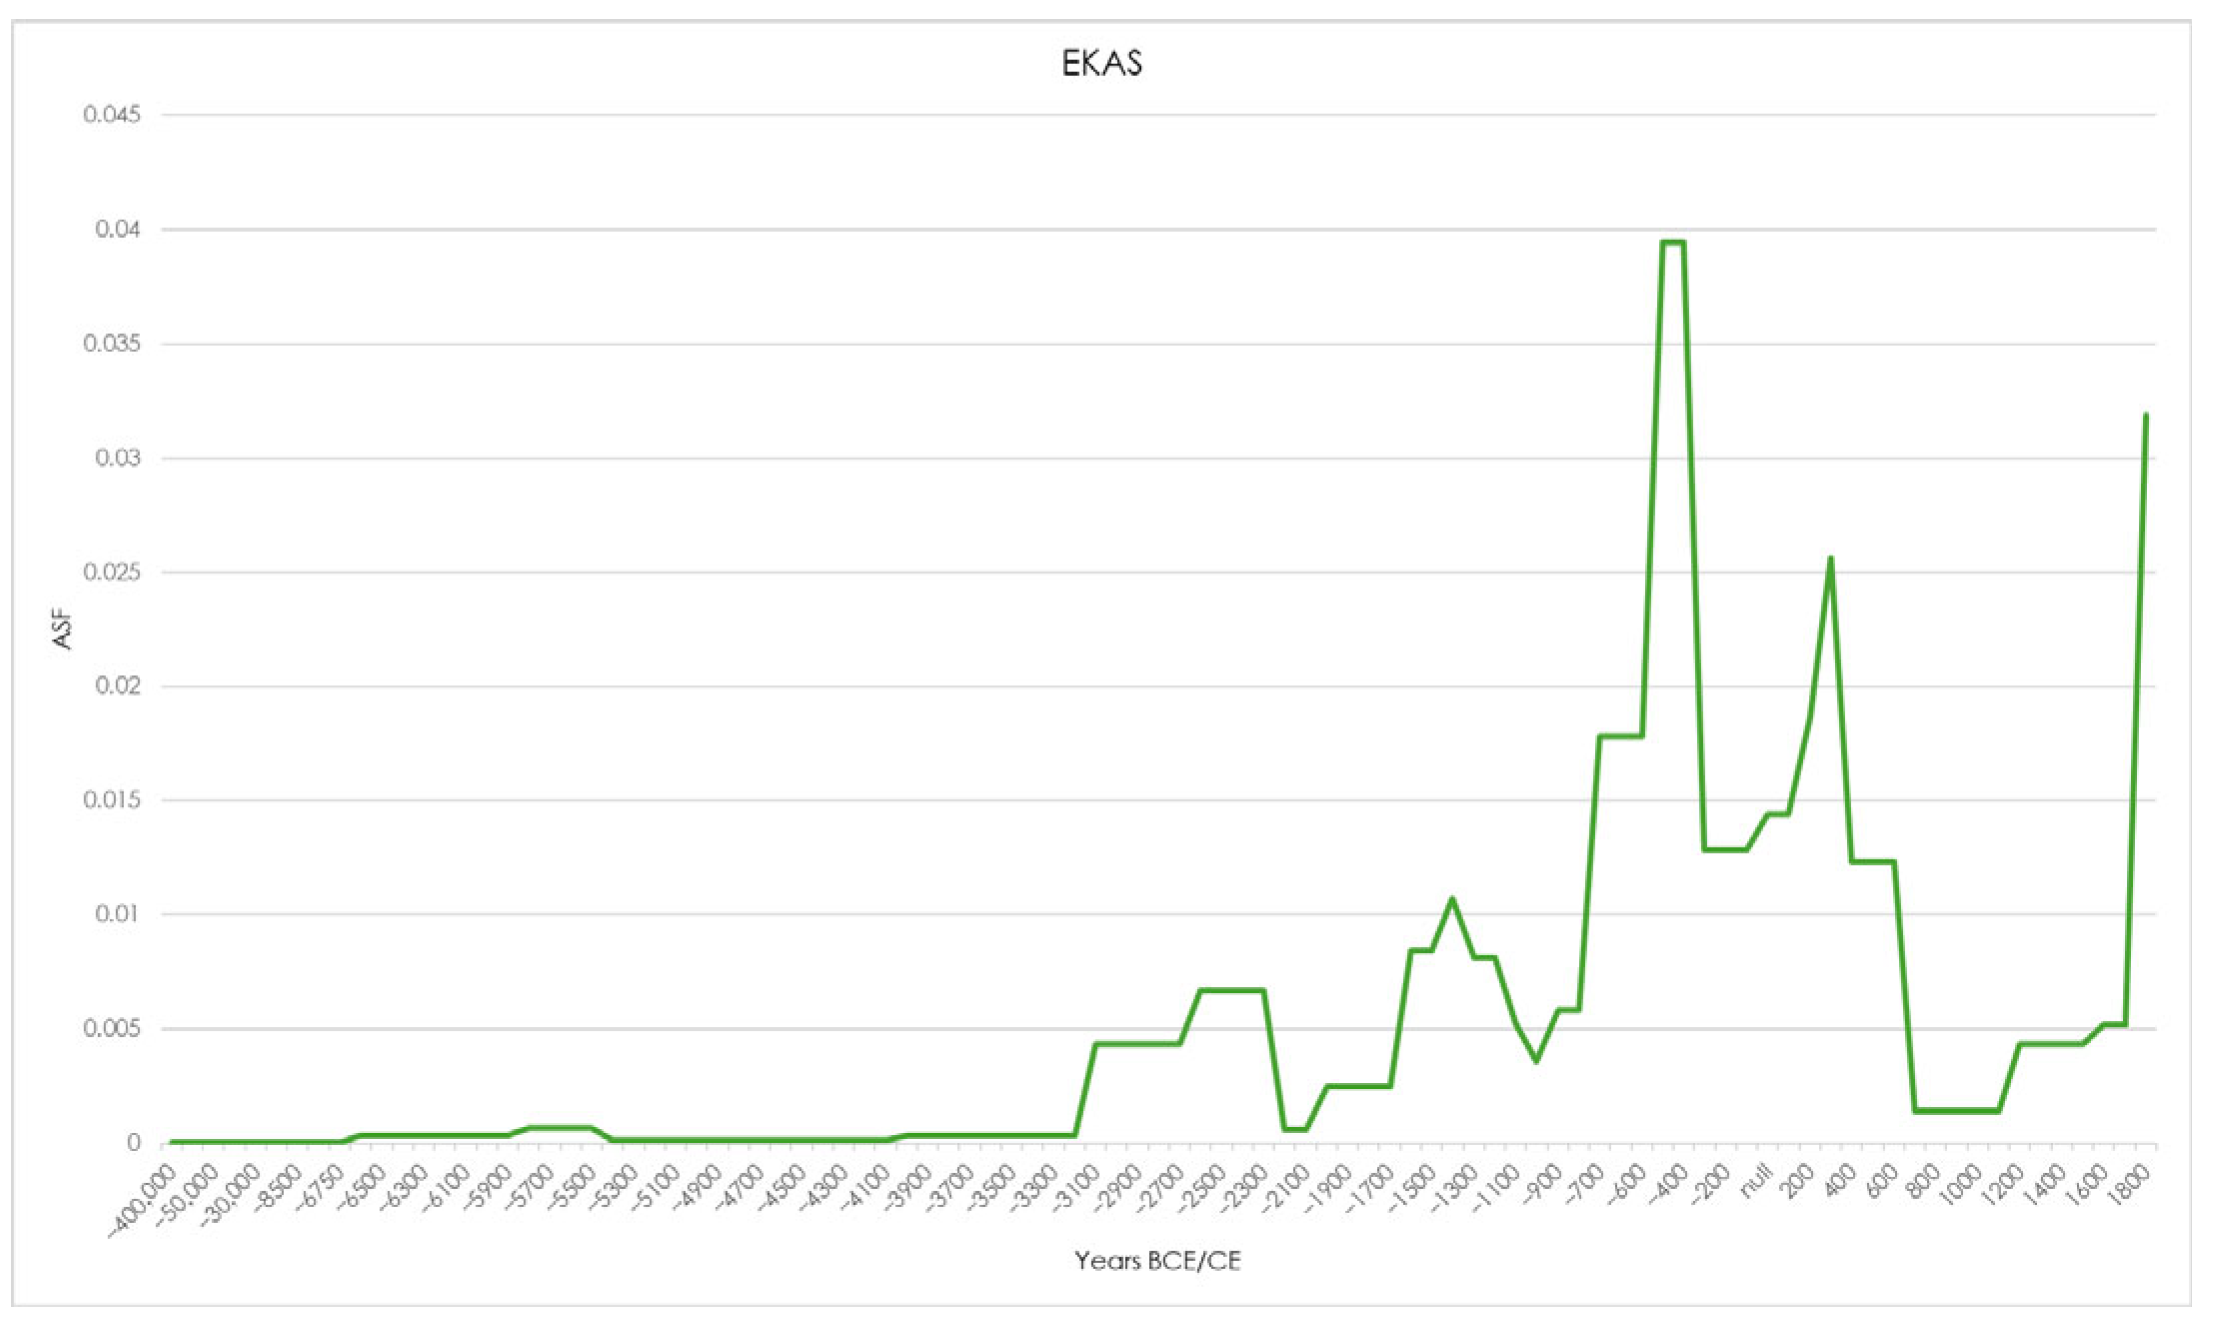
The LASF for EKAS (Figure 5, see Supplementary Materials, EKAS.xlsx) indicates four decreases in activity, at the transitions between Early and Middle Bronze Age (2050 BCE), Late Bronze and Early Iron Age (1050 BCE), the Classical and Hellenistic (323 BCE), and the Roman and Late Roman (250 CE). The ASV increased in the Early Bronze Age and decreased at that period’s end. Aoristic sum values rise throughout the Late Bronze Age, with a decline in the latter half of that phase leading into the Protogeometric (1050 BCE). Aoristic sum values then rise dramatically, brought on by both an increase in the number of identified features and the presence of diagnostic artifacts with high chronological resolution. There is a dramatic decrease in ASV at 323 BC, followed by an increase beginning in the early Roman Period (31 BCE). This increase in ASV continued throughout the Roman period until a dramatic decrease in 400 CE. Further reduction in ASV at 700 CE suggests a region in collapse, which slowly emerges in the Late Medieval (1200 CE).
The Southern Argolid Survey (also known as the Argolid Exploration Project, or AEP) was conducted in 1972 and between 1979 and 1982. Started as a survey around Franchthi Cave, its later iteration included methods of spaced intensive fieldwalking (variable between 5 and 15 m), with subsequent revisits to delineate feature boundaries and recover data related to chronology and function. Data recovery varied between non-random grab samples, “dog leash” sampling (establishing two perpendicular lines within a feature and collecting samples at regular intervals in 1 m radius circles), and gridded collections. The range of methods employed makes internal comparability difficult beyond a regional understanding of the presence of human activity and approximating where such occurrences happened over time.
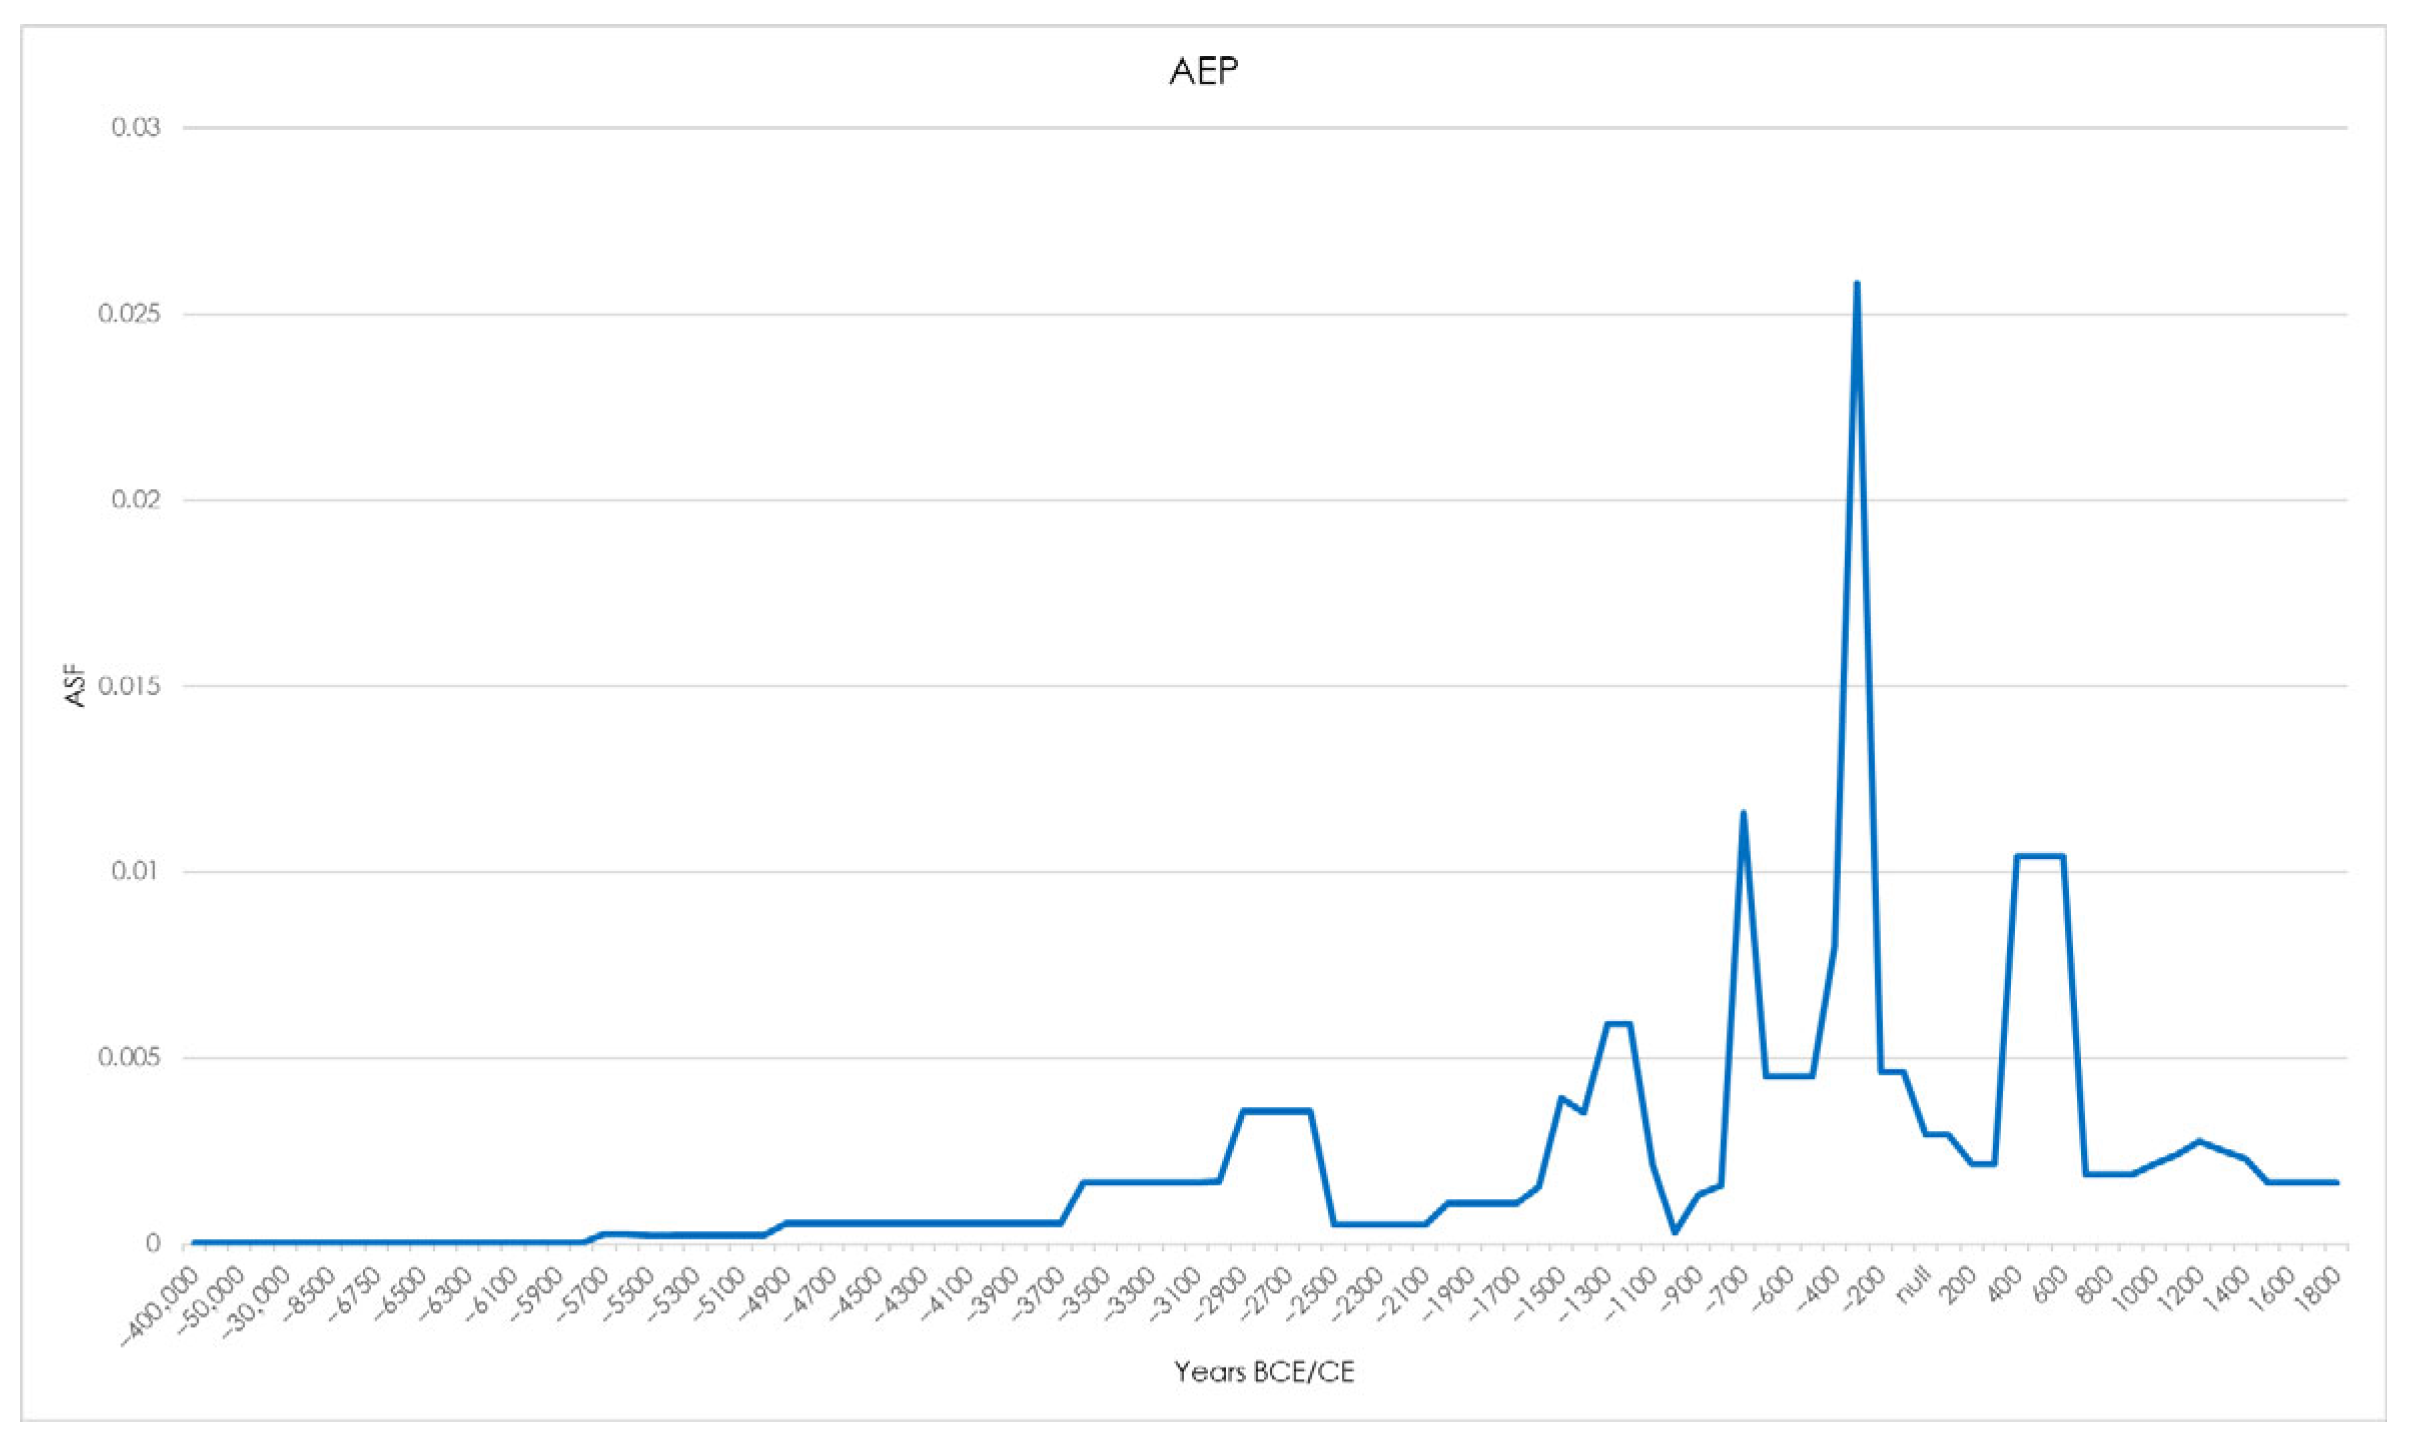
In compiling the LASF for the AEP, the site catalog was reviewed in Jameson et al. [51]. The published artifact catalog for prehistoric phases was consulted to verify the information provided in the site catalog. Site descriptions provided periods of activity. When a range of prehistoric periods was noted, the artifact catalog [64] was reviewed to determine if the designation implied activity that could not be ascribed to greater chronological resolution. The LASF (Figure 6; see Supplementary Materials, AEP.xlsx) presents an increase in AS values beginning in the Early Bronze Age, with a decrease at the end of that period. AS values rise throughout the Late Bronze Age, with a decline in the latter half of that phase leading to a near absence of AS values in the Protogeometric (1000 BCE). AS values then rise dramatically, brought on by both an increase in the number of identified features and the presence of diagnostic artifacts with high chronological resolution. AS values first decreased significantly in the Hellenistic phase (250 BCE), then more gradually, followed by a significant rise at the onset of the Late Roman (400 CE). The Medieval phase (650—1500) shows moderate but sustained AS values before leveling off in the Early Modern (after 1500 CE).
The Berbati-Limnes Survey [52], conducted between 1988 and 1990, surveyed 25 km2 [65] in the territory within the spheres of the villages of Berbati and Limnes in the northern Argolid (Figure 3). Field reconnaissance consisted of dividing the survey area into observation units (tracts) followed by a pedestrian survey at 10 and 15 m intervals, depending on the landscape and vegetation cover. Feature (findspot) delineation was empirically derived in the field based on artifact concentration and other geographical considerations. Site data were presented via chapters organized by period and authored by specialists, resulting in some variety when discussing human activities and their chronological range. The Berbati region is known for an LBA pottery production site, resulting in a highly refined chronological framework for the Late Bronze Age [66]. This feature of the region’s history has ramifications in terms of ASF, given that the ability to ascribe artifacts to narrowly defined periods inflates the aoristic values for those periods.
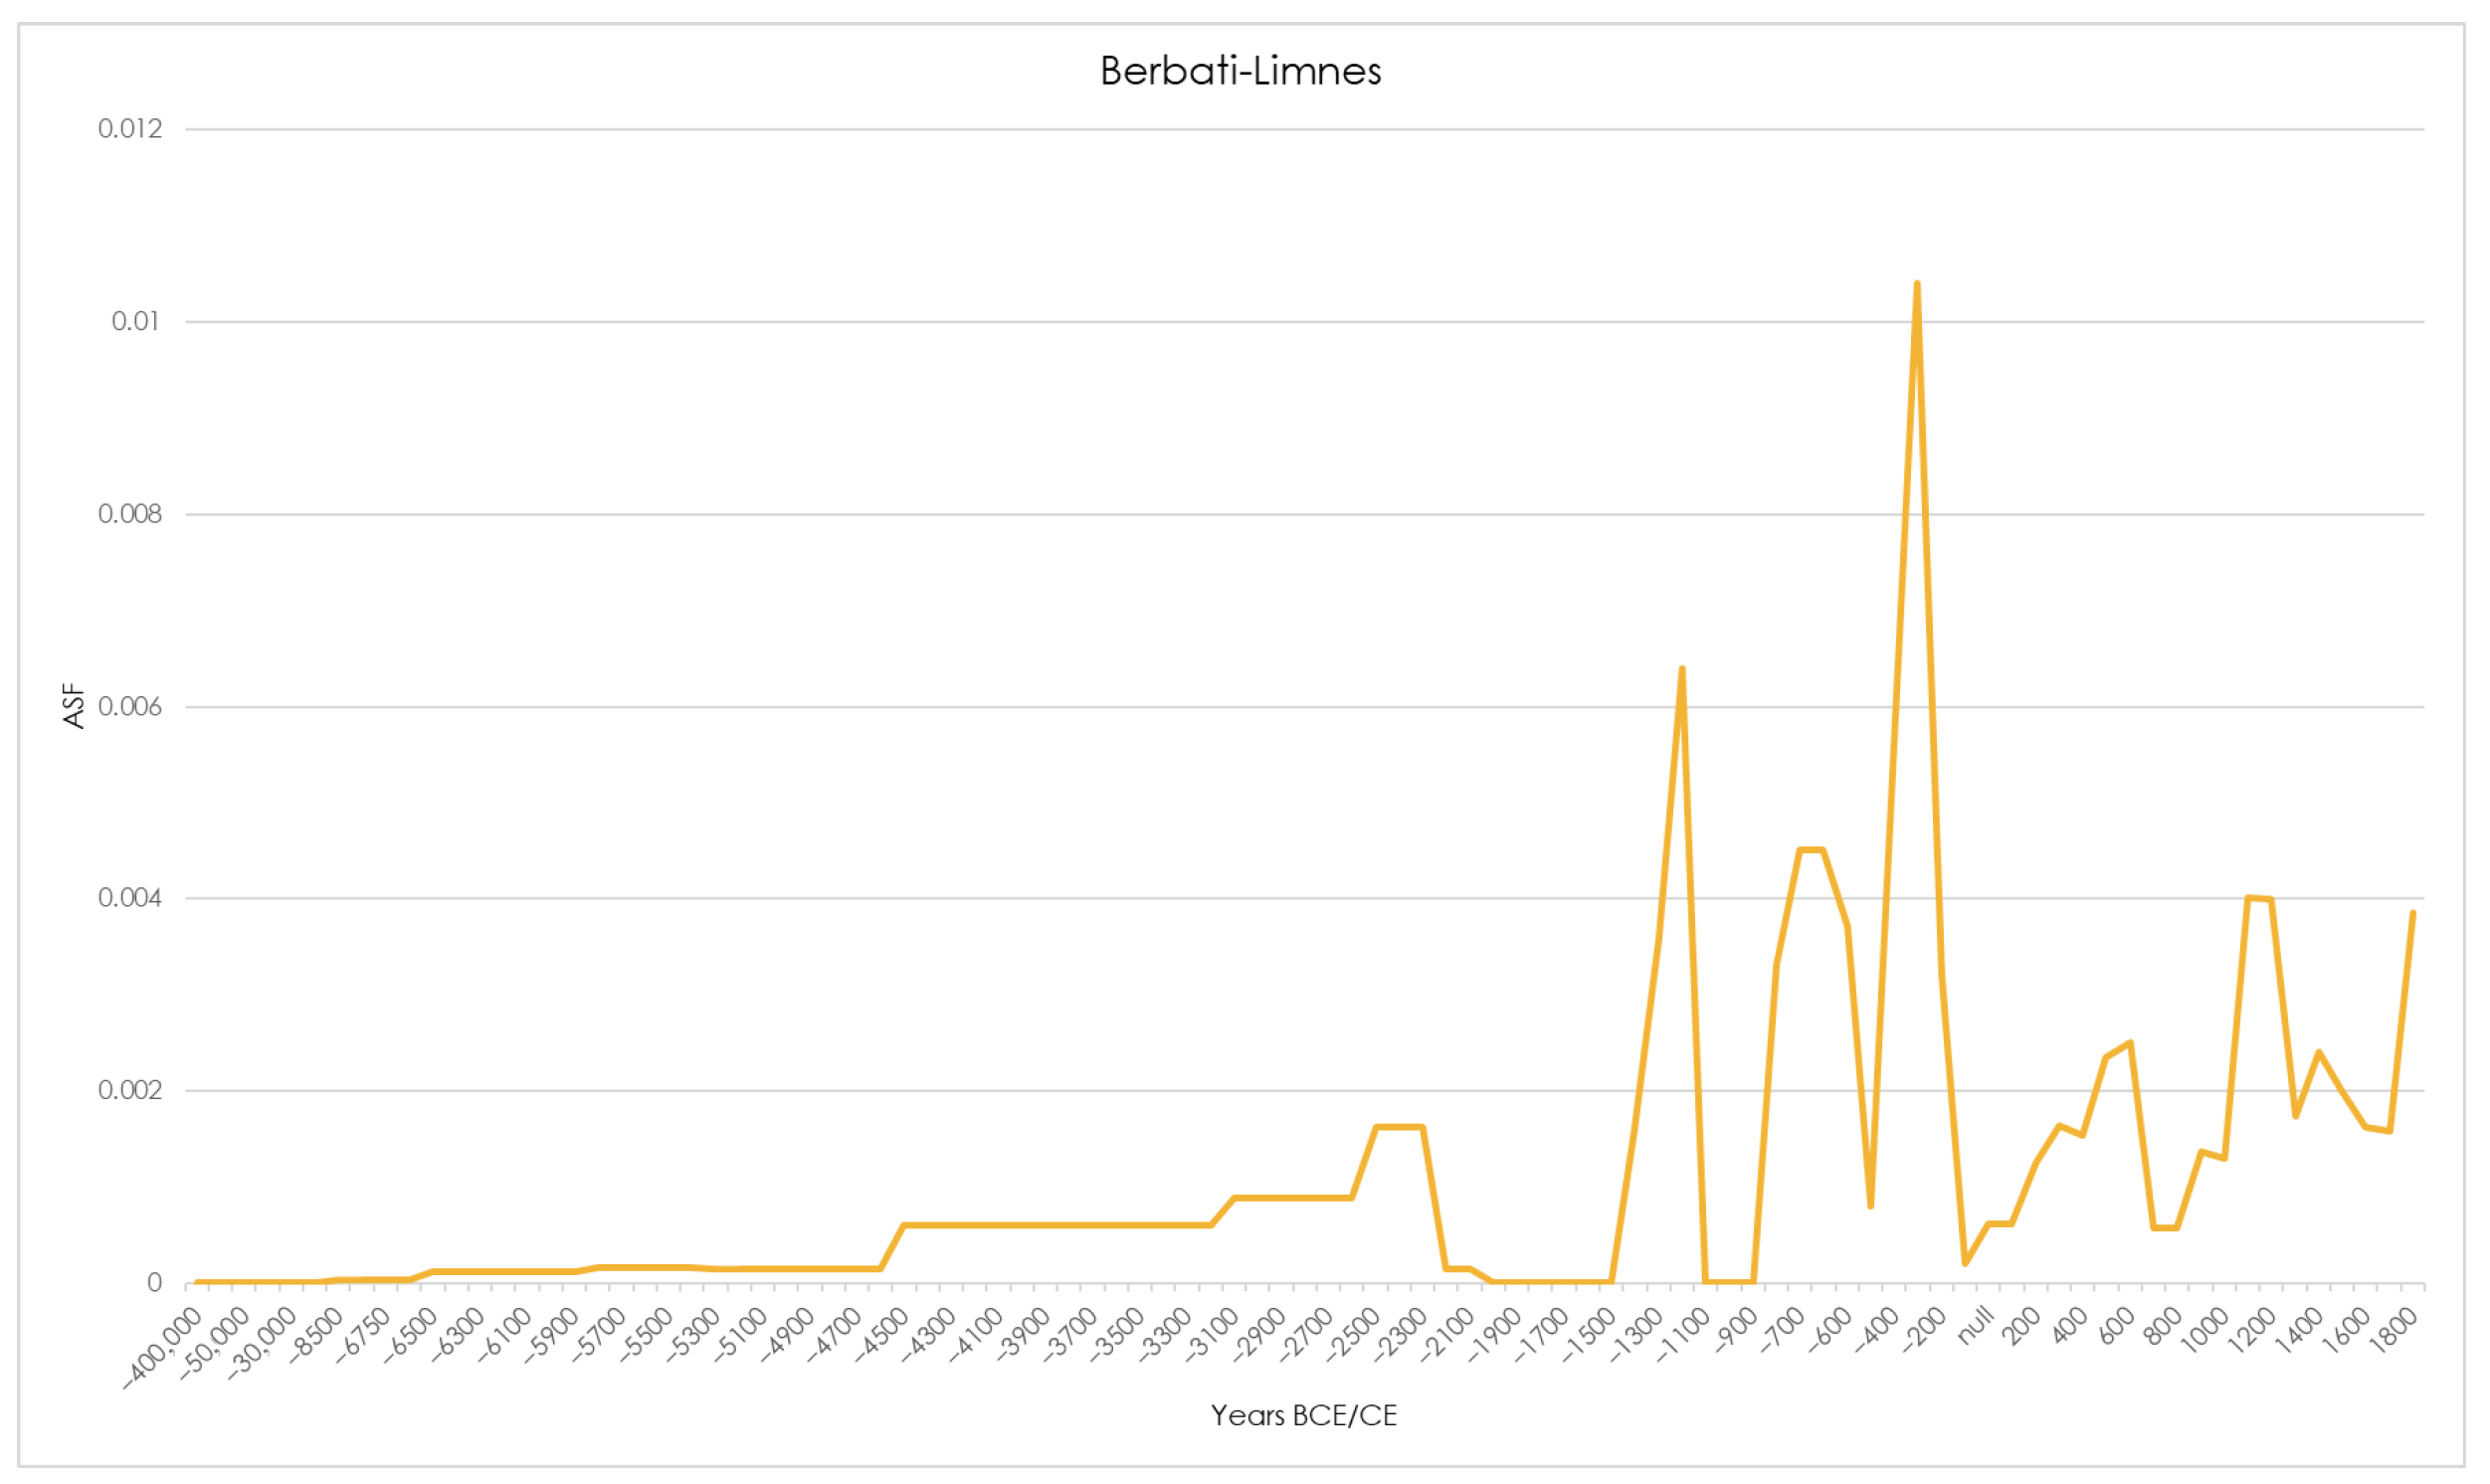
The LASF for Berbati-Limnes (Figure 7; see Supplementary Materials, Berbati_Limnes.xlsx) presents a region with several boom-and-bust phases, with no AS values recorded for several periods. Such examples include the Middle Helladic to LH IIB (2000—1440 BCE) and the LH IIIC middle to last quarter of the Early Iron Age (1150—850 BCE) phases. Another near loss of AS values is found at 100 BCE, at the beginning of the early Roman phase, which slowly began to increase at the start of the Common Era. Significant drops in AS values occurred in Period II of the Medieval (700 CE), followed by a sharp increase in Period III (1100 CE), with another slow decline in AS values beginning at 1300 CE before a sharp rise in the Modern phase.
The Methana Survey [53] was conducted between 1984 and 1986 and surveyed 21% (11 km2) of the Methana peninsula [53,65]. As with the Berbati-Limnes survey, methods of fieldwalking were adapted from the AEP for the steep terrain of the peninsula. Feature (site) identification and delineation were empirically derived while in the field. Feature sampling consisted of laying out perpendicular lines, typically in the cardinal directions, from the feature center and collecting artifacts from 1 m “dog leash” sample units until the artifact count fell below two per square meter. Further collection consisted of random grab samples for diagnostic sherds and lithics across the entirety of the feature. The space was set to a grid of 10 × 10 m units for large features, which were collected at 50 m intervals. All artifacts were collected within the 10 m unit.
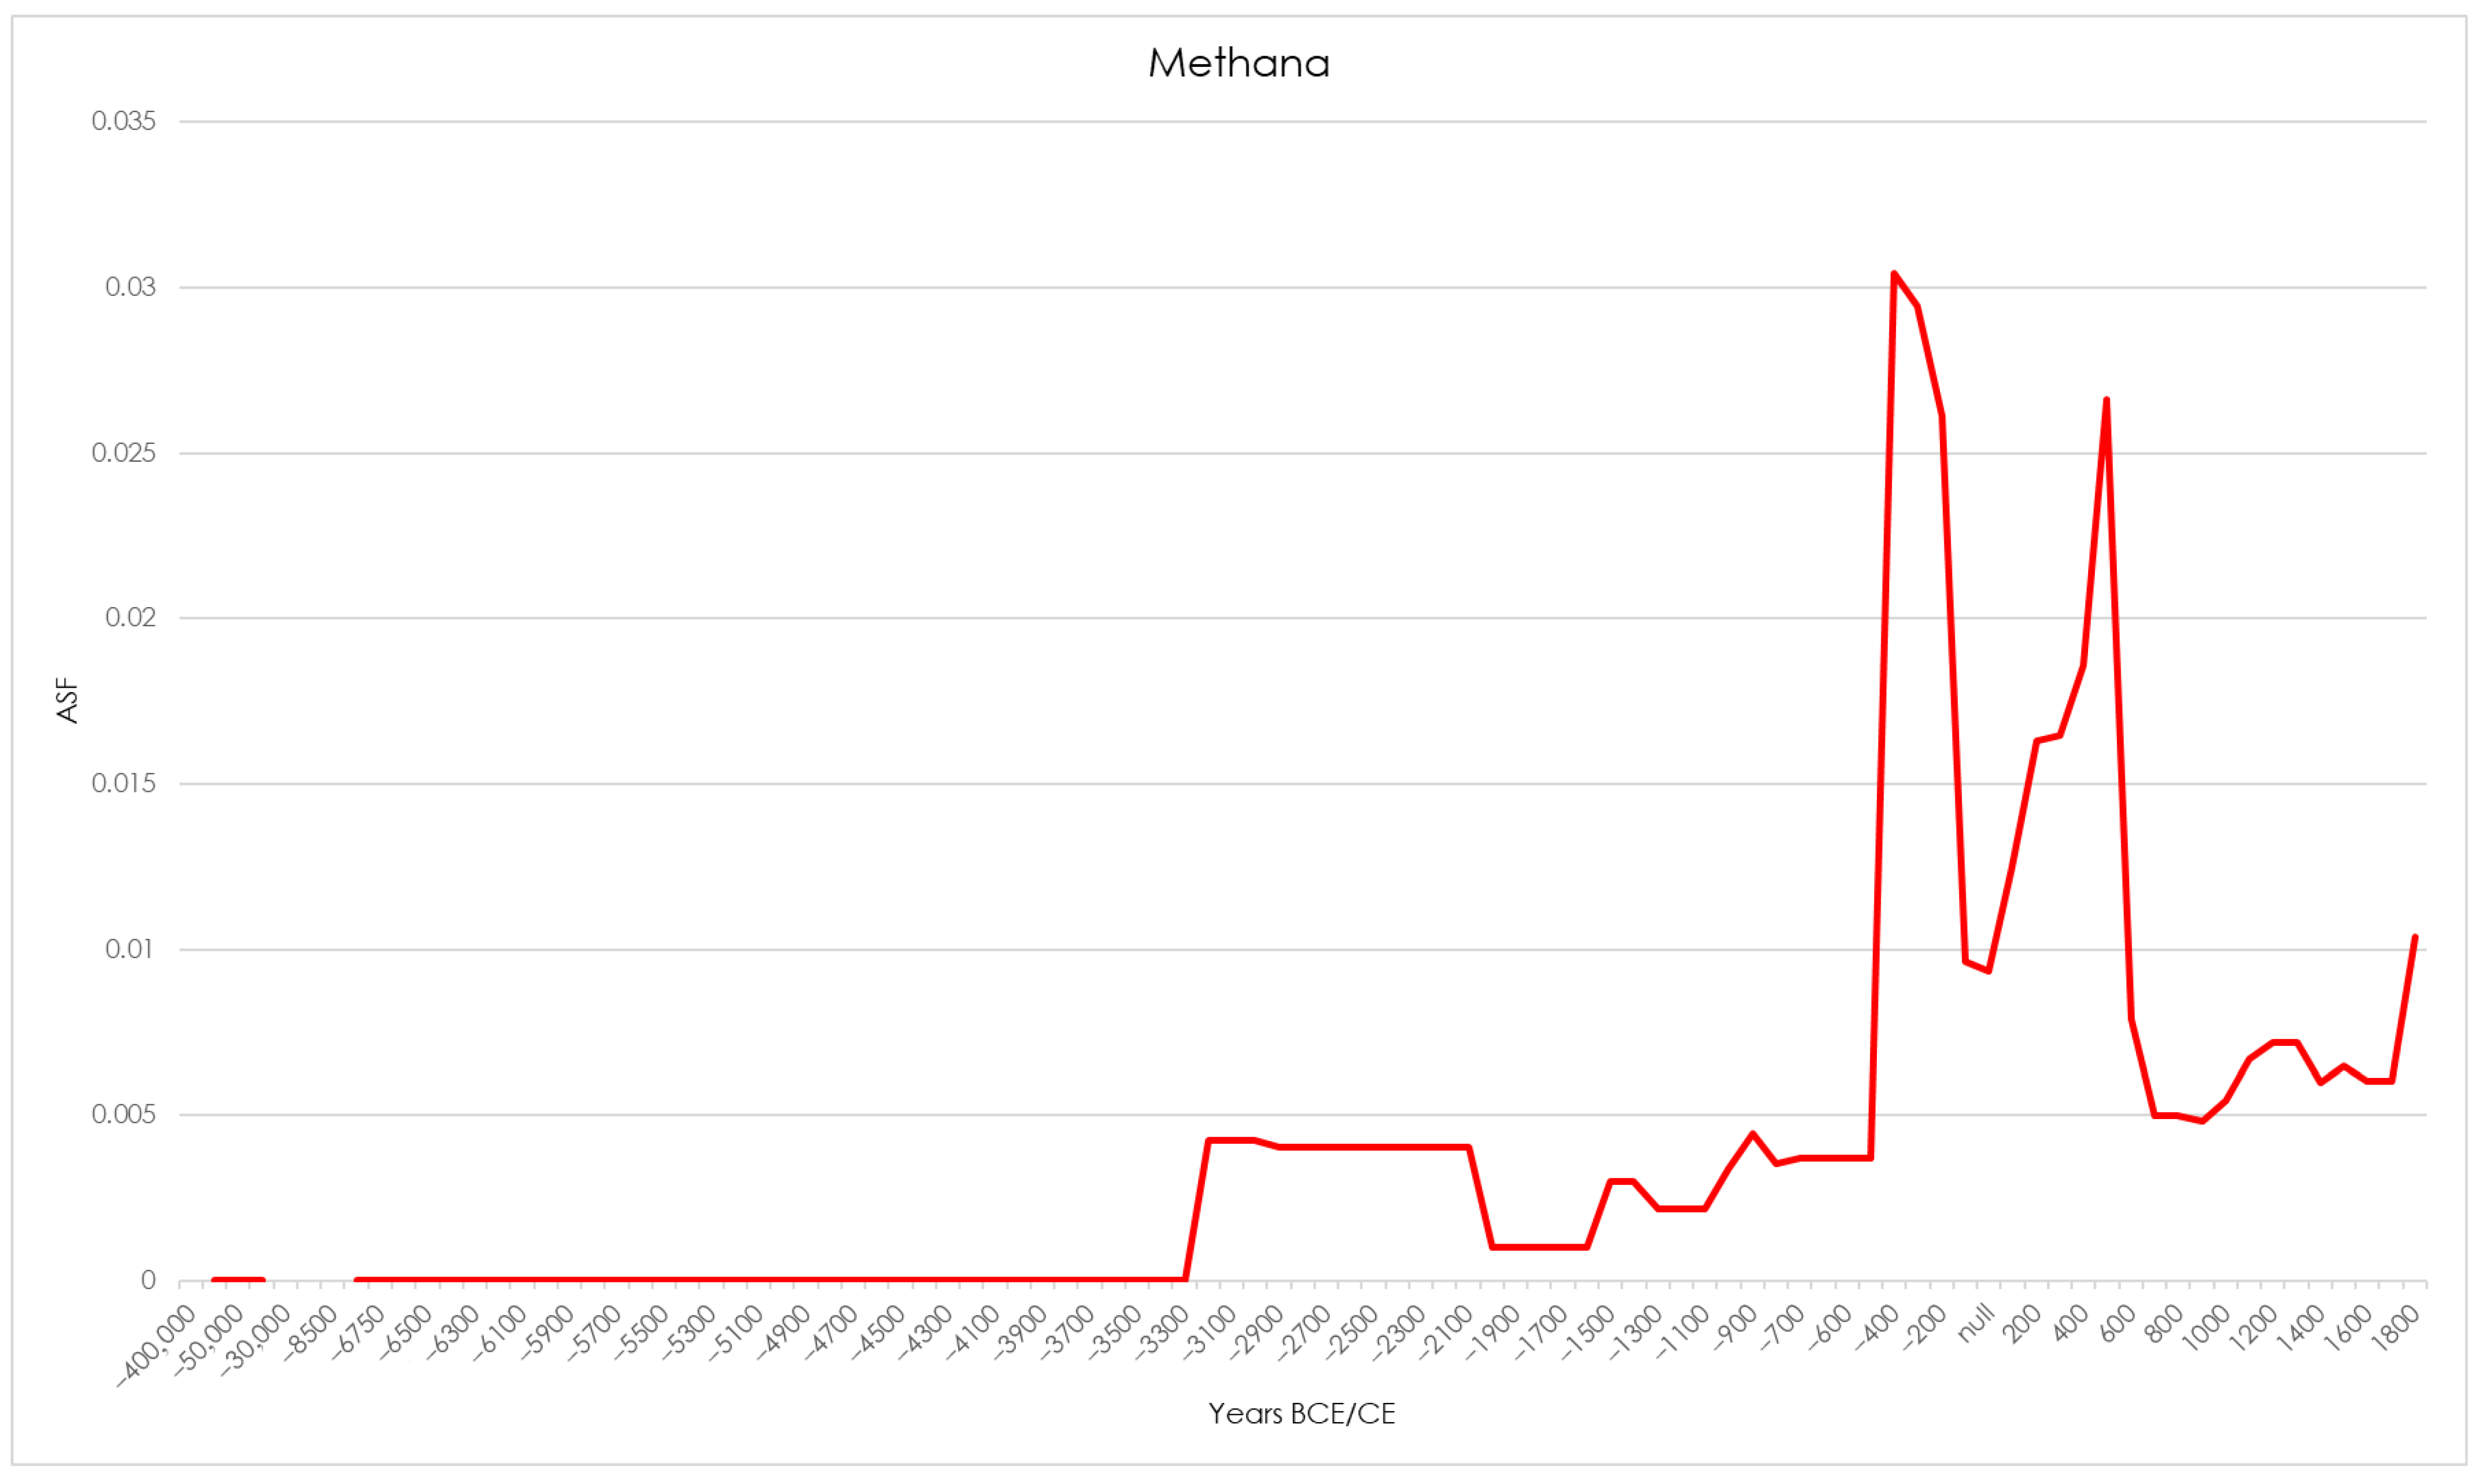
The LASF for Methana (Figure 8; see Supplementary Materials, Methana.xlsx) shows a rise in AS values beginning with the Early Helladic, with a decrease at the end of that phase leading into the Middle Helladic. At this point, a steady increase in AS values occurs through the Late Bronze and early Iron Ages until a dramatic rise in the Classical and Hellenistic periods (480–150 BCE). Following an equally steep decline at the beginning of the Roman period, the peninsula saw a steady rise in AS values from 300 to 600 CE. AS values were largely stable between the Medieval and Ottoman phases (600—1821 CE) before an increase at the beginning of the 19th century.
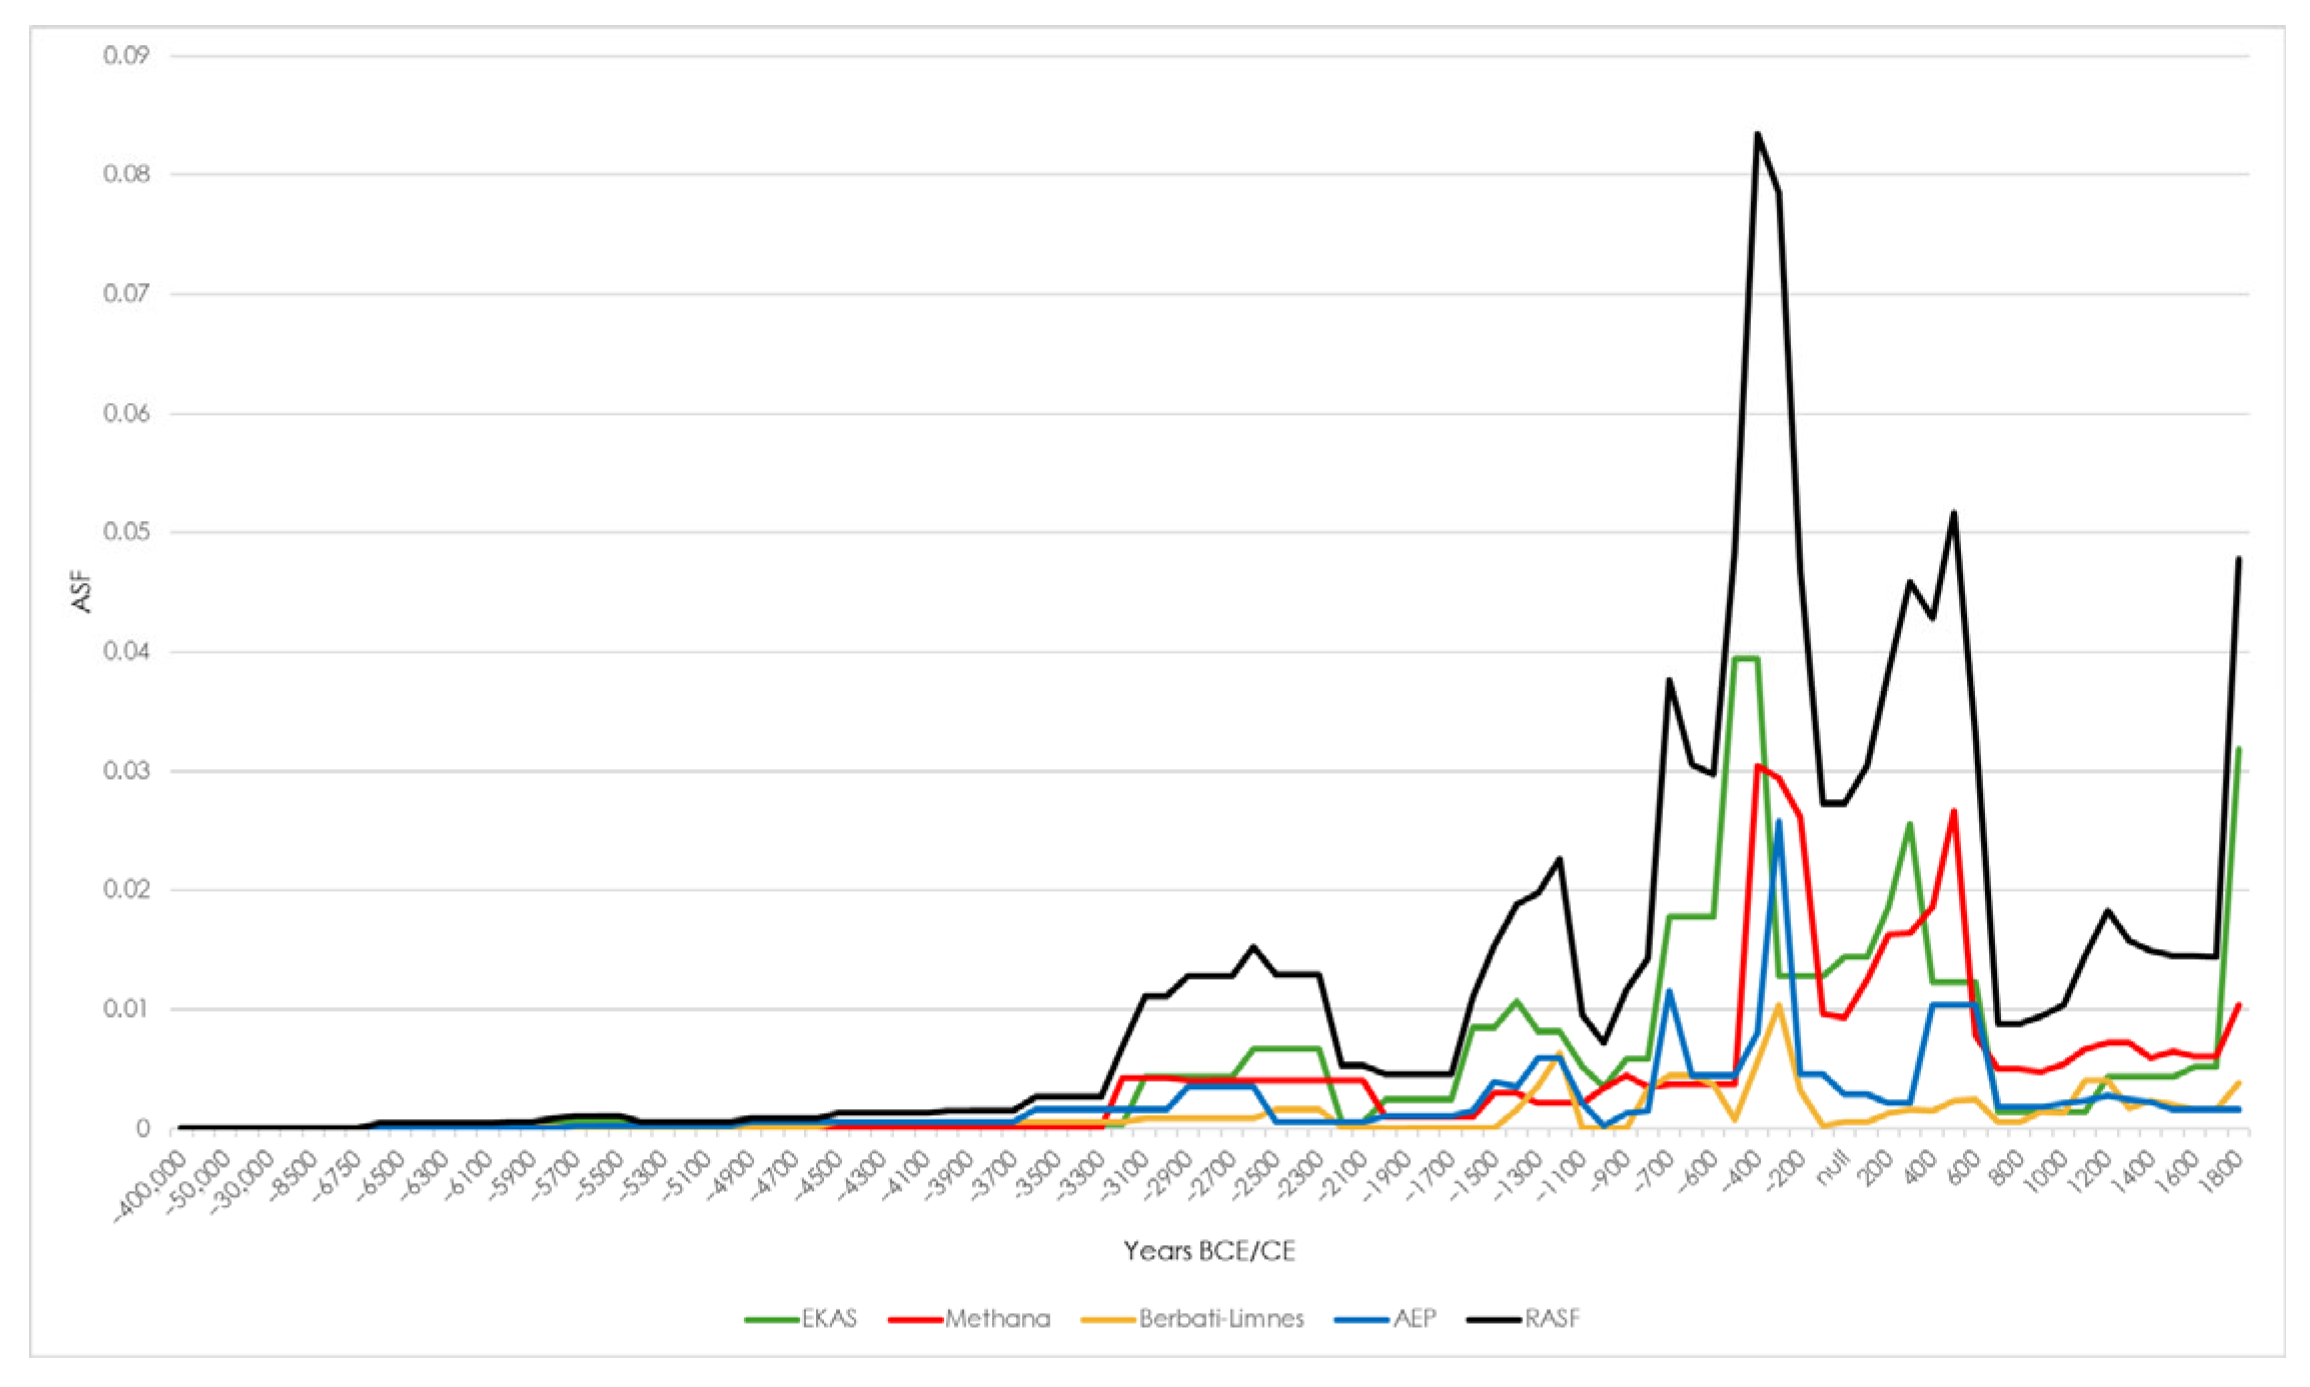
Once these LASFs were calculated, the four survey datasets were aggregated (Figure 9). The trend closely resembled the pattern generated by Weiberg et al. ([38], see Figure 1). Comparing the RASF against the constituent LASFs suggests significant influence from projects in more densely occupied regions and periods where greater chronological resolution developed larger aoristic values.
The RASF and four LASFs provide a probabilistic measure of activity over time. However, these data are not without issues. The aoristic values are impacted by the underlying factors of survey intensity, feature delineation, collection strategy, and reported chronological resolution of the recovered artifacts. When considering the fundamental equation (N of observations/N of years), the first three conditions affect a feature’s identification for a given period (the numerator). The fourth (chronological resolution) impacts the denominator. Given these considerations, the aoristic sum functions hold greater interpretative value at the local level, where intensity, periodization, feature delineation, and collection methods are more consistent. The process has value in a larger regional context as a point of comparison when discussing potential activity, although the underlying determinants can compromise such comparisons.
Furthermore, the ASF is a probabilistic measurement of activity but speaks little to the nature of shifts in that activity over time. Beyond generating a probabilistic measure of activity, ASFs do not assist in understanding the extent to which potential activity from one phase to the next occurs at the same place (continuity), includes new areas of activity (expansion), or discontinues activity at a place (abandonment). Such data would provide potential proxy data to suggest shifts in local dynamics, which can, in turn, be ascribed to phases within the Adaptive Cycle [25].
Each project dataset was therefore assessed for abandonment, expansion, and continuity. The aoristic value (AV) was used to develop these indices. The AV is the probabilistic value each feature holds at a given period, contributing to the region’s aoristic sum (AS) for a given period. Some features, for example, may have a low chronological resolution (generally dating to the Medieval period); others may have diagnostic material that would place activity in the 9th–11th and 14th centuries. The contributions of each site towards a conceptualization of abandonment, expansion, and continuity, therefore, differ in weight. In developing these indices, the focus was not on counting the number of features but calculating their AV contributions. In considering Abandonment, the intent was to gain a measurement of the proportion of total activity that ceased from one period to the next. For each feature i that disappears between period P t and P t + 1 , its weighted contribution to abandonment is given by
δ i , t = A V i , t A S t
Summing over all abandoned features gives the total abandonment index:
δ t = i a b a n d o n e d s i t e s δ i , t
This measure accounts for different chronological resolutions by weighting sites proportionally to their aoristic contributions. Expansion measured the proportion of new activity appearing in a period relative to total activity. For each feature appearing in P t + 1 but absent in P t , its weighted contribution to expansion is
η i , t + 1 = A V i , t + 1 A S t + 1
Summing over all newly appearing features gives the total expansion index:
η t + 1 = i n e w s i t e s δ i , t + 1
This measure adjusts for different chronological resolutions of the constituent features. Subtracting abandonment (Equation (1)) from expansion (Equation (2)) provides a measurement of expressing positive or negative Potential, where 1 (expressing positive potential energy) represents the absence of abandonment, and -1 represents the absence of expansion (expressing negative potential energy). Expressions of energy (positive or negative) align with the low potential AC phases (r and Ω). A value of zero represents no expression of energy, either because there is neither abandonment nor expansion, or because the quantity of abandonment and expansion are equal. This corresponds to the AC high potential characteristics identified for phases of α and K. Continuity was assessed by measuring the contribution of AV to the overall ASV for features persisting between adjacent periods, accounting for different resolutions. For each feature Si that appears in both periods P t , and P t + 1 , its contribution to continuity is
α i , t = A V i , t A S t + A V i , t + 1 A S t + 1
Dividing a feature’s AV by the AS value for a given time yields a percentage contribution of that feature to a given period. The average contribution of the feature across the two periods is, therefore,
β i , t = α i , t 2
Summing overall continuing features and multiplying them by the percentage of sites continuing from one period to the next gives the total continuity index:
γ t = i c o n t i n u i n g s i t e s β i , t × T o t a l c o n t i n u i n g s i t e s P t P t + 1 T o t a l s i t e s P t
This formulation ensures that features with low chronological resolution contribute less to continuity. In addition, the index is adjusted for the probabilistic presence of features rather than raw counts. Thus, the continuity index represents the AV moving from one period to the next, considering the chronological resolution of the initial features and the overall percentage of features persisting from one period to the next. High values will be generated from many features that continue to provide evidence for presence between the two periods.
Given that the indices were products of assessing a portion of the AV against the total AS, the indices were presented as percentages. This allowed for the evaluation of the distribution of values using quantitative methods. Employing Jenks Natural Breaks Optimization, each value for abandonment, expansion, and continuity was classified as exhibiting a high, medium, or low value (Table 1). The classification method was applied in two ways: one in which the values were classified for each project independently, and a second iteration, in which the values were classified using all values for a given index from all four projects. To demonstrate the approach, this study will employ the second classification method.
Along with potential, these values were applied to the phases of the AC (Table 2). A region entering a reorganization phase (α) will be in the process of re-establishing organizational structures. These systems could be somewhat different than prior organizations. One would anticipate new settlement or land use activities elsewhere than in the preceding period. Therefore, we would expect a low continuity index and a high number of new features (expansion). Abandonment will also be of medium-to-high value. Entering exploitation (r), a region will capitalize on a successfully organized system. Therefore, we would expect to see high continuity values and a relatively high number of new features, representing a continuation and expansion of the previously established system. Since exploitation is viewed as capitalizing on a previously established process, abandonment will be low, and potential values will be high. A region experiencing conservation (K) will be in a state of stasis—continuity indices will be relatively high, and expansion and abandonment indices will be moderate to low. Alternatively, a system may see a consistent, moderate measurement in expansion and abandonment with moderate to high indices in continuity. Potential values will be near zero, either from slight expansion or abandonment, or from those activities canceling each other out. Regions experiencing a release phase (Ω) will have significant disruption from a prior period. The system is dismantling the previous structures but has not yet fully developed a new set of processes. Land use/settlement would exhibit low values for continuity and expansion and high values for abandonment. Potential values would be significantly below zero.

3. Results

Figure 10 presents the data from each survey as they correspond with the phases of the Adaptive Cycle (see Supplementary Materials, periodizations.xlsx). This study places the datasets within a standard quantitative frame of reference that allows for a measure of cross-comparison. While the results present disparities in local AC phasing, some broader trends exist. After 300 CE, periods of conservation predominate. Except for Methana, all other areas present a canonical Adaptive Cycle pattern in the Late Bronze Age. For all but Berbati-Limnes, the release phase at the end of the Bronze Age is relatively short, leading to processes of reorganization and expansion. All areas entered a release phase between 2500 and 2100 BCE, at the interface between the Early Helladic II and Early Helladic III periods (i.e., the latter third of the Early Bronze Age). In only one period, between 1300 and 1100 BCE, there is a consistent phase (K) across all four regional datasets.
The eastern Korinthia expressed long periods of alternating reorganization and expansion, punctuated by periods of release at the Late/Final Neolithic (5400–4000 BCE), EH III (2200–2150 BCE), and LH IIIC (1190–1050 BCE). Though the other regions displayed considerable changes, it is thought that the proximity to a larger city allowed for more stability [67]. It is noteworthy that the results of this study reinforce a landscape of relative stability in the Late Roman phase, consistent with Pettegrew’s re-analysis [68]. The ensuing period (700–1200 CE) is identified as a phase of reorganization, consistent with larger socio-economic changes to the Korinthia [69].
As seen also from the LASF, data from Berbati-Limnes express periods of release in the EH III—early Late Helladic (2200–1440 BCE) and Early Iron Age (1150–850 BCE). The period from 850 BCE to 1200 CE presents several classic AC cycles of organization, exploitation, conservation, and release phases at 850–500 CE and 800–1200 CE, after which the region is observed to be in a condition of conservation until the 19th century. The condition between these periods (500 BCE–800 CE) is characterized by alternating α and K phases, a condition where the systems have high potential (potential indices near zero), but alternate between phases of high and low connectedness (high to low values for abandonment, expansion, and continuity). The boom-and-bust activity in the area, as indicated by the LASF, is supported by continuity, expansion, and abandonment indices. Like the eastern Korinthia, the project directors ascribe this feature of the landscape to external relationships, in this case with the nearby Argive Plain [52].
After experiencing a release phase in the Middle Helladic (2000–1550 BCE), the Methana peninsula experienced a conservation period until a period of expansion in the Archaic/Early Classical (700–450 BCE). With minor phases of release at the beginning of the Roman (100–50 BCE) and Turkish (1450–1500 CE) periods, the region maintained a conservation phase for most of the historical periods. Notably, the “collapse” of the Late Bronze Age (c. 1100 BCE) is not observed here, which parallels other regions such as Achaea [70,71], the Euboean Gulf [72], and parts of Boeotia [13,73].
The southern Argolid experienced several Adaptive Cycles, beginning with the Early Neolithic through EH III (6850–2000 BCE) and the Middle through Late Helladic (2000–1000 BCE). The Protogeometric through Early Roman (1000–100 BCE) period presents as a series of reorganization, exploitation, and conservation phases before a release phase that began in the Hellenistic (250–50 BCE) period. The Roman and Medieval phases alternate between conservation and release before a reorganization beginning in the 19th century.

4. Discussion

The way in which the patterns expressed within the survey data map onto climatic events is thought-provoking. These events (the 4.2 ka event, the 3.2 ka crisis, and the Roman Climatic Optimum) are often mentioned when discussing human-environmental history in the eastern Mediterranean.
While there is debate on its global and regional uniformity and impact [74,75,76], evidence exists for a series of oscillations for the eastern Mediterranean Basin between 4.3 and 3.8 ka [74,77]. Although the chronological resolution of the survey data is coarser than for other periods,2 each of the four regions records a release phase between 2500 and 2100 BCE, which aligns with prior work that presents this period as a time of cultural change (e.g., Refs. [79,80,81]). Given the debates over the climatological record and several culturally focused explanations to describe the shifts in the human record, establishing a causal relationship between environment and society in this instance is tenuous.
A second potential shift in regional climate patterns potentially occurred in the late second to early first millennium BCE [36,82,83], known often as the 3.2 ka crisis [84]. This shift appears to have been an extended period of drier weather [83]. This phase coincides with a series of cultural transformations in the Mediterranean, often discussed as a collapse event at the end of the Late Bronze Age. During this period, historical and archaeological evidence points towards widespread stresses in social and political institutions [32,85,86,87,88]. While the hyper-connective nature of societies could likely have caused a cascading effect at the scale of the wider eastern Mediterranean [89], localized impacts were more varied [13,32,48,71,90,91]. While climate has been argued as a significant determinant [92], other stresses (such as economic or political, e.g., Refs. [86,93]) or a combination of circumstances [85] have been suggested. Three regions under study experienced a period of release circa 1100 BCE. In the Berbati-Limnes survey area, the release phase lasted several hundred years, whereas the phase was much shorter in the southern Argolid and eastern Korinthia. Methana stands out as experiencing a conservation phase throughout this time frame. Methana’s situation falls in line with patterns observed elsewhere in Greece, often interpreted as the result of decreased authority of the centralized palatial systems [70,72]. It could be suggested that the key to Methana’s resilience, as in the larger regions of Achaea or Euboea, was attributed to its relative peripherality to the palatial systems.
Europe and the Mediterranean generally experienced a period of warming temperatures between the third century BCE and fourth century CE (approximately 250 BCE–400 CE), referred to as the Roman Climatic Optimum, also known as the Roman Warm period (e.g., Ref. [75]). The period presents a series of phases of organizations, exploitation, and conservation for the areas within this study. No consistent, broad pattern emerges across the region. Methana, again notably, except for a release phase circa 100 BCE (shared with the southern Argolid), exhibits a continuous conservation phase. If there is a benefit to the Roman Climatic Optimum, the survey data would suggest that it is incorporated within localized adaptations and subsumed by other socio-political factors.
The approach has its caveats. As opposed to an authoritative assessment, the results guide future interrogation. As in any synthetic approach, the “narratives are limited by the rules that govern their construction” [4] (p. 8). Dramatic increases or decreases in AS values may be responses more often to shifts in periodizations than to an immediate change in human activity. Bayesian approaches [94], which provide a Gaussian smoothing to these abrupt shifts, may provide possible solutions. The method focuses on the presence/absence of features. Other aspects, such as data expressing complexity or internal/external connectivity (e.g., measures of standardization/skill, local/non-local production and exchange of ceramics, signaling territoriality as per Ref. [11]) or hierarchy (as per Ref. [13]) were not considered. Other variables related to size and similarity of features at different periods (as suggested by Ref. [21]) could not be applied, given the variety of methods in recording across the four projects. Not all projects reported these variables, and those that did often provided areal data for a single feature, even though it cannot be guaranteed that a feature remained the same size over time in multi-component contexts. Previous approaches using data with this information employed similarity indices to provide additional nuance to continuity, abandonment, and expansion [25]. Survey practices may have disadvantaged specific periods of activity, such as early prehistoric phases and the Medieval, which are increasingly viewed as having different approaches to the landscape and/or issues with visibility [68,95,96,97,98,99].
Survey data from the Aegean are highly localized in scale and divergent in method. While local narratives are critical and essential to understanding a geographically fragmented landscape, formulating approaches that establish a common framework moves us towards the broader goals of landscape studies as a cross-comparative tool [32]. Aoristic sums and other similar metrics used to measure quantity are helpful and provide a degree of cross-comparability. Employing metrics derived from aoristic sums to contextualize further the activity provides measurements that not only mitigate some of the weaknesses of the aoristic sum approach but bring us closer to a vocabulary that allows engagement between human and environmental data. The study proposes a way to synthesize information from projects conducted under different methodological frameworks. Using aoristic values derived from a feature’s activity for a given period, aoristic sum values for a region are obtained, which can then be used to derive indices of abandonment, continuity, expansion, and potential. These metrics are then combined to express the phases of the Adaptive Cycle. Since each region’s aoristic sums are calculated individually but according to the same process, a level of comparison is possible.
The approach leads us forward to developing a systemized process of analysis that allows for local variations to be observed and interrogated within a broader structure. Employing legacy data limited the study to using aoristic values based on presence/absence. While this may be disappointing, it raises the possibility of incorporating data collected from non-intensive methods to increase areal coverage. Given that survey boundaries are themselves problematic and rarely fully encompass a complete socio-economic system [21,60,61], incorporating non-intensive data would allow boundaries of analysis to become more easily amended and altered for a given period. Harnessing datasets such as those developed by Attema et al. [14] or curated by Consoli [100] to investigate chronologically and/or geographically discrete spaces provides interesting paths that move beyond the scope of this paper.

5. Conclusions

Humans do not directly respond to climate change. Instead, they are more reactive to local conditions, be they environmental or social [101]. While possibly influenced by climate change, these local conditions are often the driving factors in human adaptation. Identifying past strategies to mitigate the current effects of climate change is presentist, influenced in part by our modern condition of a highly globalized and hyper-networked world system in which the scientific evidence for a warming planet is undeniable. Seeking solutions via past corollaries requires recognizing that the most appropriate examples may lie in local systems of organization, where human and environmental conditions are most inherently intertwined, and identifying instances where chronological and spatial conditions for both human and environmental data are well defined [102]. When studying the ancient Aegean, variability across regions should be anticipated, as suggested by the results of this study, regional narratives detailed elsewhere (e.g., Refs. [13,90,91]), and recent paleoenvironmental studies [103]. Resilience involves the study of socio-environmental condition, a construct that views human and environmental elements as agents within an interdependent system. Understanding long-term changes in the human element, framed within a theoretical construct that can enable comparisons with paleoenvironmental conditions, is a critical step in developing a region’s combined human and environmental history. Developing a process that can conceptualize macroregional trends while preserving the ability to engage in regional cross-comparative analyses enables us to discuss broad trends in human history and local responses to microregional variation.

Supplementary Materials

The following supporting information can be downloaded at https://www.mdpi.com/article/10.3390/heritage8080298/s1, AEP.xlsx; Berbati_Limnes.xlsx; EKAS.xlsx; Methana.xlsx; periodizations.xlsx.

Author Contributions

Conceptualization, J.N. and A.L.; methodology, J.N., T.T., A.L., H.B., K.C., E.J. and M.T.; validation, J.N. and T.T.; formal analysis, J.N., T.T., H.B., K.C., E.J. and M.T.; investigation, A.L., H.B., K.C., E.J. and M.T.; resources, J.N.; data curation, J.N.; writing—original draft preparation, J.N., T.T., A.L., and M.T.; writing—review and editing, J.N., T.T., A.L., H.B., K.C., E.J. and M.T.; visualization, J.N., T.T., M.T. and A.L.; supervision, J.N.; project administration, J.N. All authors have read and agreed to the published version of the manuscript.

Funding

This research received no external funding.

Data Availability Statement

The original contributions presented in this study are included in the article/Supplementary Material. Further inquiries can be directed to the corresponding author.

Acknowledgments

The authors wish to acknowledge the work of Xelyn Rogers and Juliet Riddle, whose initial efforts in operationalizing the phases of the Adaptive Cycle based on the constructs of continuity and change were instrumental in the final product. We wish to thank the editors of this special issue, Sharon Steadman and John Haldon, for their interest and encouragement, and the anonymous reviewers whose suggestions were invaluable. Data processing and analysis were facilitated by the computational lab at the Center for Social Science Research at the College of Charleston and the data storage facilities maintained by the Center for Historical Landscapes. Support for Open Access publication was provided by the Archaeology Program at the College of Charleston and its private donors.

Conflicts of Interest

Kelsey Campbell is affiliated with Stantec. The authors declare that the study was independently designed and analyzed by the team. The findings and conclusions presented in this paper are based solely on the analyzed data and do not reflect the interests of affiliated companies.

Abbreviations

The following abbreviations are used in this manuscript:
ACAdaptive Cycle
ASFAoristic Sum Function
ASVAoristic Sum Value
AVAoristic Value
LASFLocal Aoristic Sum Function
RASFRegional Aoristic Sum Function

Appendix A

Appendix A.1. Deriving Aoristic Sum Functions

The Eastern Korinthia Archaeological Survey (EKAS) is the most recently completed project in the study. As noted, the project data has been archived via OpenContext and is available for free download [54]. The data allowed for individual feature (Localized Cultural Anomaly (LOCA), in EKAS terminology) review at a more intensive level of analysis than other projects, allowing the researchers to review different means of developing aoristic sum functions. The analysis used the LOCA and artifact tables [62,63]. The former provided a functional and chronological assessment of each LOCA and a listing of the LOCA’s discovery unit(s). The artifact table, consisting of artifact counts grouped by chronotype and discovery unit, was parsed for each feature, providing a summary count of artifacts for each period (see Supplementary Materials, EKAS.xlsx). Based on these data, three separate aoristic sum functions could be constructed, which proved informative and helpful in understanding how different ASFs can be derived from survey data, their implications for future applications, and how to best apply the approach given the varied extent to which the four projects have collected and published their data.
The first ASF (ASF1) consisted of taking each summary count for each period and deriving an aoristic value using Equation (A1). For an artifact i with a temporal range t i s t a r t , t i e n d , its contribution to the year t is given by
C i t = 1 t i e n d t i s t a r t , i f t t i s t a r t , t i e n d , 0 , o t h e r w i s e .
where:
  • t i s t a r t : Start year of the artifact’s temporal range.
  • t i e n d : End year of the artifact’s temporal range.
  • The aoristic sum function (ASF) for a given year t is calculated by summing the contributions from all n artifacts:
    A t = i = 0 n C i t = i = 0 n 1 t i e n d t i s t a r t , i f t t i s t a r t , t i e n d , 0 , o t h e r w i s e .
    This equation is applied to all artifacts, including those with broad or imprecise chronological ranges (e.g., ceramic age, spanning 6700 BCE–2000 CE), ensuring the resulting aoristic sum function (ASF) incorporates all data, even those with poor chronological resolution (Figure A1).
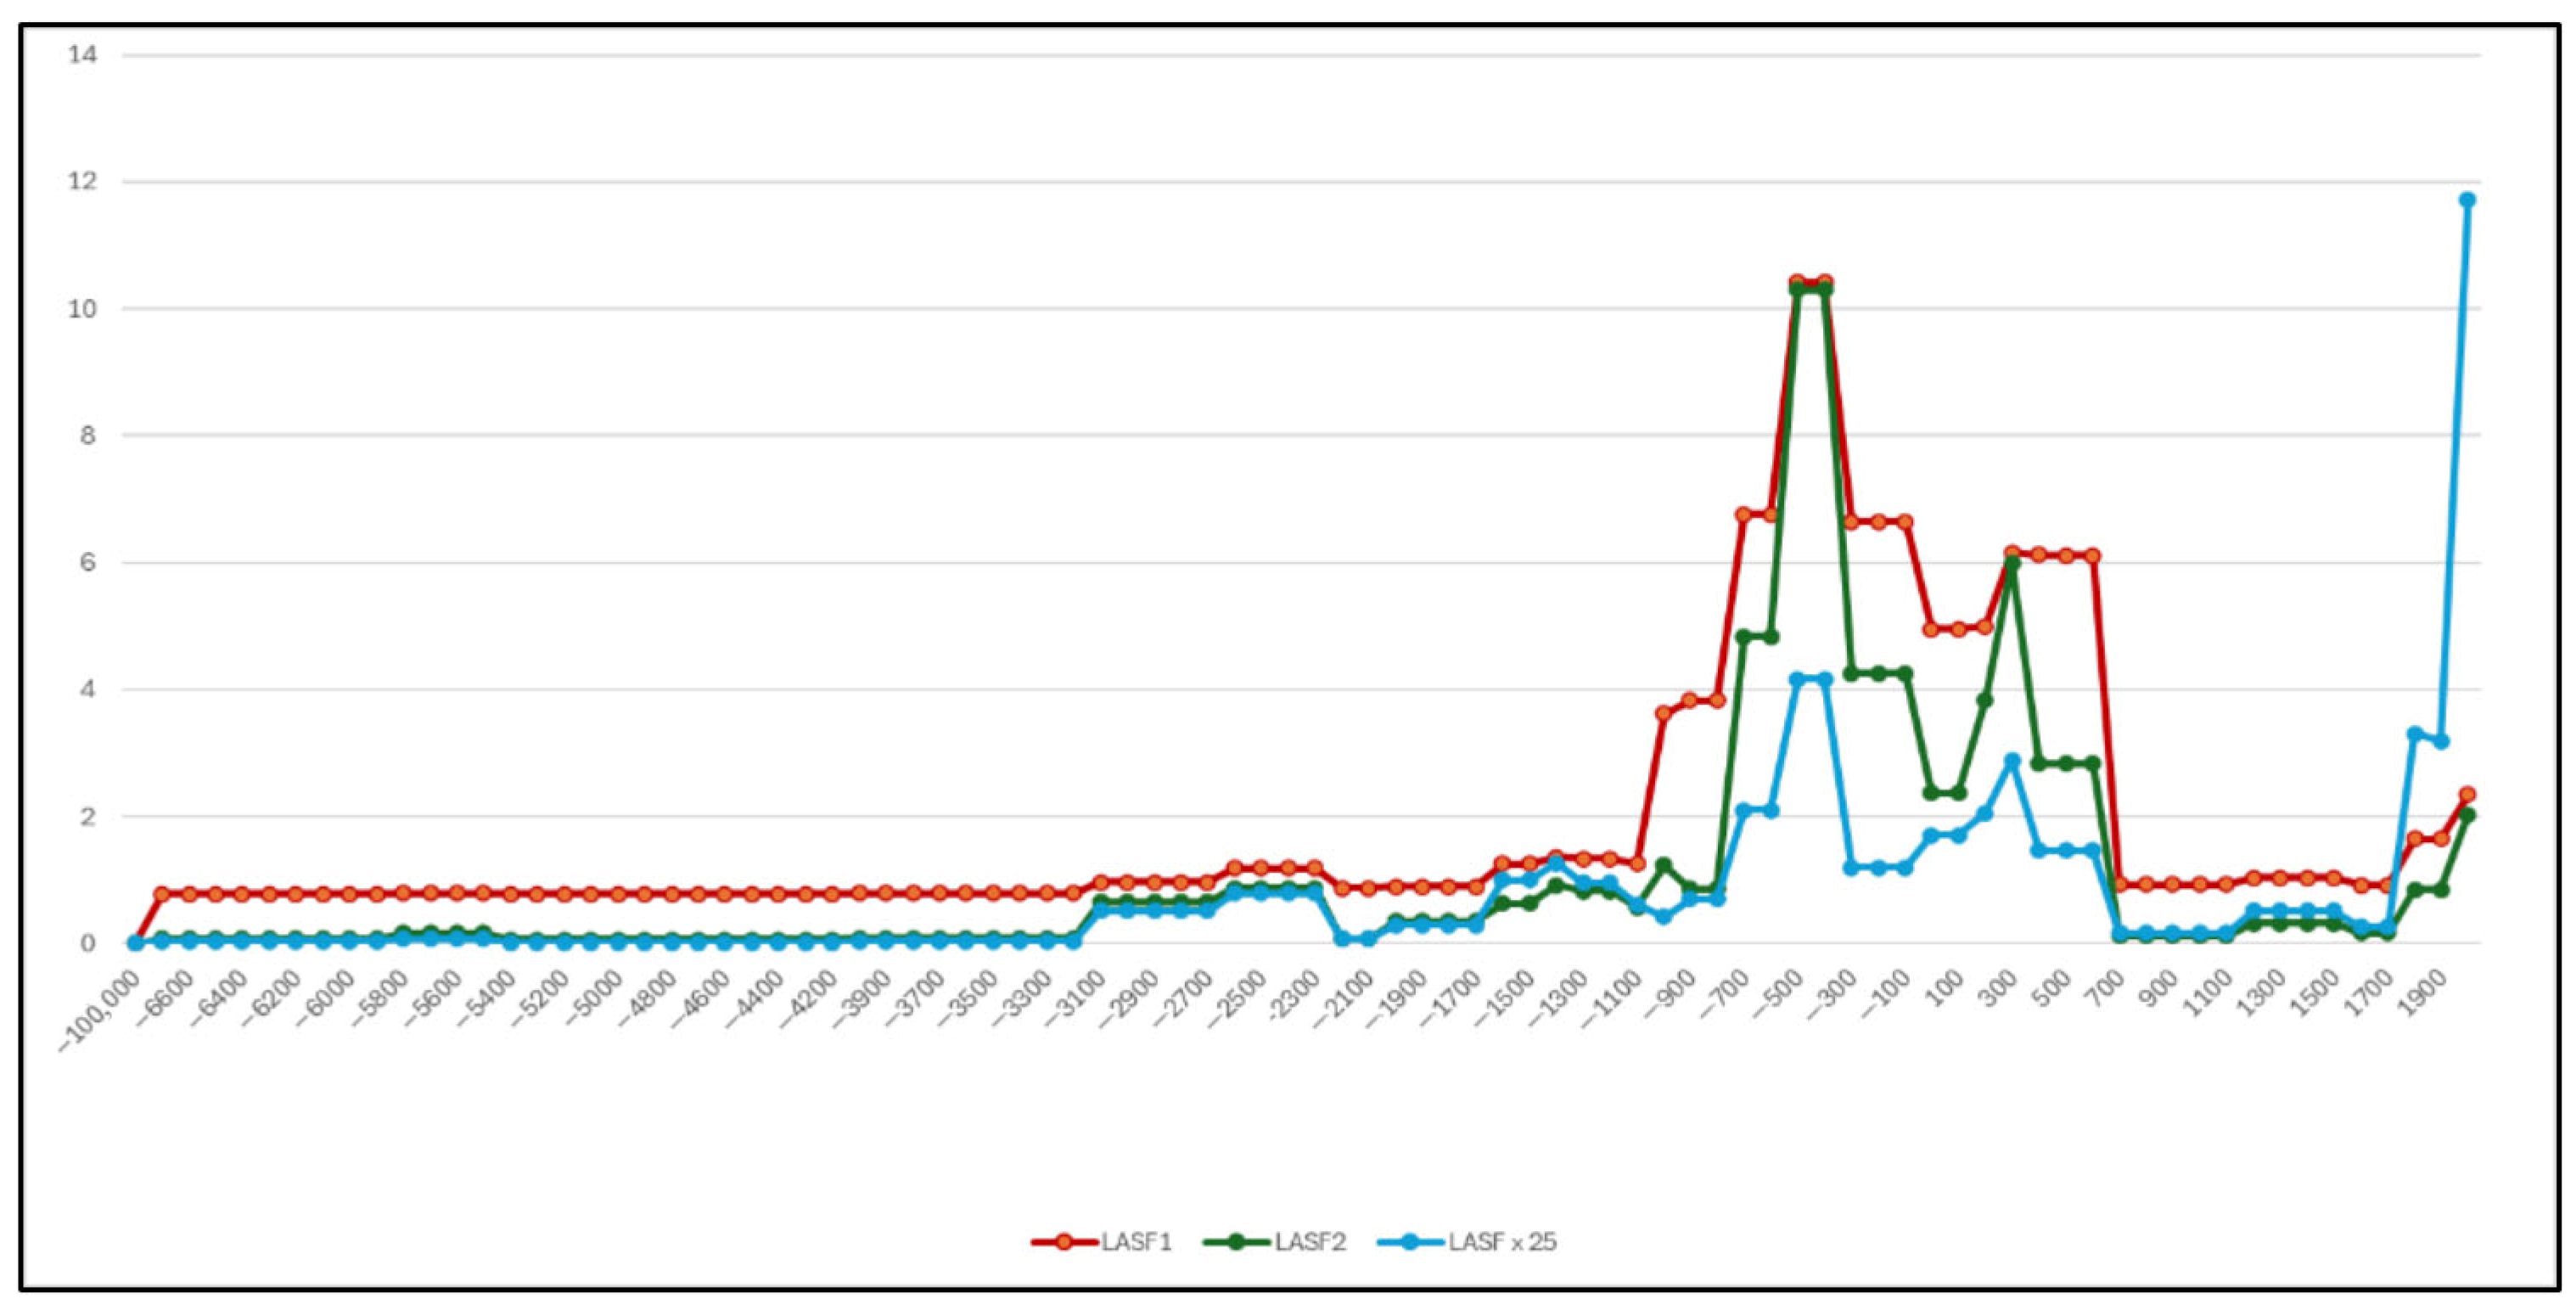
Figure A1. LASFs for EKAS. LASF 3 is multiplied by 25 to show patterns relative to LASF1 and LASF2.
Heritage 08 00298 g0a1
The second ASF (ASF2) focused on discrete phases of activity. By looking at the most chronologically constrained artifact types, a date range when activity at a LOCA would have most likely occurred was derived, consistent with principles for multicomponent activities [104]. ASF2 consisted of only those aoristic values for periods of defined activity (see Figure A1). It must be noted that Equation (A1) accentuates the values for periods that contain large numbers of artifacts and/or are of short duration. Thus, a single sherd from the Early Helladic Period (1600 years) results in an extremely low aoristic value, whereas five sherds dated to the Archaic (200 years) result in a significantly higher value. Therefore, the aoristic sums capture as much of a given period’s visibility as its human activity.
The third ASF measured the presence/absence of activity for a period. If evidence was observed, regardless of quantity, a value of 1 was recorded, which was then divided by the number of years for the period.
1 ÷ N o f y e a r s p e r i o d
The resulting ASF removed bias for artifact quantity while preserving a probabilistic measurement based on the length of a given period (see Figure A1). While still accentuating periods of short chronological duration, the function presents probabilities of activity for a given year. Thus, it represents the presence and a probabilistic measure of activity.
The three derived ASFs for each LOCA were summed to form three versions of a region’s LASF (Figure A1). In general, all three computations present similar patterns apart from three instances: the Late Bronze Age–Early Iron Age (LBA-EIA; 1100–900 BCE), the Hellenistic–Early Roman (100 BCE–100 CE), and the Early Modern–Modern (1800–2000 CE) transitions. In the first instance (LBA-EIA transition), LASF1 and LASF2 increase, whereas LASF3 decreases. This can be explained by the number of artifacts with poor chronological resolution beyond such designations as “historic.” Given that values in LASF3 are determined by the presence or absence of pottery with distinct chronological ranges, the aoristic value is lower. In the case of the Early Modern-Modern transition, the increase in aoristic sum values (AS) results from the short duration of the periods, which inflates the aoristic values (AV) for features.
The third formulation represents the computation most amenable to the work at hand. While limiting the impact of data with poor chronological resolution and accentuating data with high resolution, it provides some normalization by removing the quantity of diagnostic artifacts for a period from the equation. It thus mitigates against accentuating ASFs for periods where artifacts are highly diagnostic. The most compelling reason, however, came from data accessibility. All artifacts analyzed by EKAS were fully published and made available; this was not replicable for all projects. Of the three approaches, the third computation could be replicated across all projects in the study.

Notes

1
The term for an area of interest, consisting of a concentration of artifacts or other signs of human activity is known by many terms—site, feature, locus, POSI, LOCA, etc. This paper will employ the term ‘feature’ to refer generally to this element. When speaking about individual project findings, the project-specific term will be used.
2
It should be noted that this study employs the relative chronology originally used by the surveys in the study, with the exception of the Late Bronze Age (see Ref. [78]). See Weiberg and Finné [37] on the impact of relative chronologies in discussing connections between human and environmental events.

References

  1. Burke, A.; Peros, M.C.; Wren, C.D.; Pausata, F.S.R.; Riel-Salvatore, J.; Moine, O.; de Vernal, A.; Kageyama, M.; Boisard, S. The Archaeology of Climate Change: The Case for Cultural Diversity. Proc. Natl. Acad. Sci. USA 2021, 118, e2108537118. [Google Scholar] [CrossRef] [PubMed]
  2. Burke, A.; Grove, M.; Maier, A.; Wren, C.; Drapeau, M.; Poisot, T.; Moine, O.; Boisard, S.; Bruxelles, L. The Archaeology of Climate Change: A Blueprint for Integrating Environmental and Cultural Systems. Nat. Commun. 2025, 16, 5289. [Google Scholar] [CrossRef] [PubMed]
  3. Weiberg, E.; Unkel, I.; Kouli, K.; Holmgren, K.; Avramidis, P.; Bonnier, A.; Dibble, F.; Finné, M.; Izdebski, A.; Katrantsiotis, C.; et al. The Socio-Environmental History of the Peloponnese during the Holocene: Towards an Integrated Understanding of the Past. Quat. Sci. Rev. 2016, 136, 40–65. [Google Scholar] [CrossRef]
  4. Izdebski, A.; Holmgren, K.; Weiberg, E.; Stocker, S.R.; Büntgen, U.; Florenzano, A.; Gogou, A.; Leroy, S.A.G.; Luterbacher, J.; Martrat, B.; et al. Realising Consilience: How Better Communication between Archaeologists, Historians and Natural Scientists Can Transform the Study of Past Climate Change in the Mediterranean. Quat. Sci. Rev. 2016, 136, 5–22. [Google Scholar] [CrossRef]
  5. Haldon, J.F.; Roberts, N.; Izdebski, A.; Fleitmann, D.; McCormick, M.; Cassis, M.; Doonan, O.; Eastwood, W.; Elton, H.; Ladstätter, S.; et al. The Climate and Environment of Byzantine Anatolia: Integrating Science, History, and Archaeology. J. Interdiscip. Hist. 2014, 45, 113–161. [Google Scholar] [CrossRef]
  6. Knodell, A.R.; Wilkinson, T.C.; Leppard, T.P.; Orengo, H.A. Survey Archaeology in the Mediterranean World: Regional Traditions and Contributions to Long-Term History. J. Archaeol. Res. 2023, 31, 263–329. [Google Scholar] [CrossRef]
  7. Cassis, M.; Doonan, O.; Elton, H.; Newhard, J. Evaluating Archaeological Evidence for Demographics, Abandonment, and Recovery in Late Antique and Byzantine Anatolia. Hum. Ecol. 2018, 46, 381–398. [Google Scholar] [CrossRef]
  8. Roberts, N.; Cassis, M.; Doonan, O.; Eastwood, W.; Elton, H.; Haldon, J.F.; Izdebski, A.; Newhard, J. Not the End of the World? Post-Classical Decline and Recovery in Rural Anatolia. Hum. Ecol. 2018, 46, 305–322. [Google Scholar] [CrossRef]
  9. Haldon, J.F.; Rosen, A. Society and Environment in the East Mediterranean ca 300–1800 CE. Problems of Resilience, Adaptation and Transformation. Introductory Essay. Hum. Ecol. 2018, 46, 275–290. [Google Scholar] [CrossRef]
  10. Izdebski, A.; Pickett, J.; Roberts, N.; Waliszewski, T. The Environmental, Archaeological and Historical Evidence for Regional Climatic Changes and Their Societal Impacts in the Eastern Mediterranean in Late Antiquity. Quat. Sci. Rev. 2016, 136, 189–208. [Google Scholar] [CrossRef]
  11. Blanton, R.; Feinman, G.; Kowalewski, S.; Nicholas, L. Ancient Oaxaca. The Monte Albán State; Case Studies in Early Societies; Cambridge University Press: Cambridge, UK, 1999. [Google Scholar]
  12. Cherry, J.F. Frogs Round the Pond: Perspectives on Current Archaeological Survey Projects in the Mediterranean Region. In Archaeological Survey in the Mediterranean Area; Keller, D.R., Rupp, D.W., Eds.; BAR international series; British Archaeological Reports: Oxford, UK, 1983; pp. 375–416. [Google Scholar]
  13. Knodell, A.R. Societies in Transition in Early Greece: An Archaeological History; University of California Press: Oakland, CA, USA, 2021. [Google Scholar]
  14. Attema, P.A.J.; Carafa, P.; Jongman, W.M.; Smith, C.J.; Bronkhorst, A.J.; Capanna, M.C.; de Haas, T.C.A.; van Leusen, P.M.; Tol, G.W.; Witcher, R.E.; et al. The Roman Hinterland Project: Integrating Archaeological Field Surveys around Rome and Beyond. Eur. J. Archaeol. 2022, 25, 238–258. [Google Scholar] [CrossRef]
  15. Bintliff, J.; Sbonias, K. (Eds.) Introduction to Issues in Demography and Survey; The Archaeology of Mediterranean Landscapes; Oxbow: Oxford, UK, 1999. [Google Scholar]
  16. Francovich, R.; Patterson, H. (Eds.) Extracting Meaning from Ploughsoil Assemblages; The Archaeology of Mediterranean Landscapes; Oxbow: Oxford, UK, 2000; ISBN 978-1-900188-75-3. [Google Scholar]
  17. Alcock, S.E.; Cherry, J.F. (Eds.) Side-by-Side Survey: Comparative Regional Studies in the Mediterranean World; Oxbow: Havertown, PA, USA, 2004; ISBN 978-1-78570-158-0. [Google Scholar]
  18. Alcock, S.E.; Cherry, J.F. Introduction. In Side-by-Side Survey: Comparative Regional Studies in the Mediterranean World; Alcock, S.E., Cherry, J.F., Eds.; Oxbow: Havertown, PA, USA, 2004; pp. 1–9. ISBN 978-1-78570-474-1. [Google Scholar]
  19. Stone, D.L. Problems and Possibilities in Comparative Survey: A North African Perspective. In Side-by-Side Survey: Comparative Regional Studies in the Mediterranean World; Alcock, S.E., Cherry, J.F., Eds.; Oxbow: Havertown, PA, USA, 2004; pp. 132–143. ISBN 978-1-78570-474-1. [Google Scholar]
  20. Terrenato, N. Sample Size Matters! The Paradox of Global Trends and Local Surveys. In Side-by-Side Survey: Comparative Regional Studies in the Mediterranean World; Alcock, S.E., Cherry, J.F., Eds.; Oxbow: Havertown, PA, USA, 2004; pp. 36–48. ISBN 978-1-78570-474-1. [Google Scholar]
  21. Wright, J. Comparative Settlement Patterns during the Bronze Age in the Northeastern Peloponnesos, Greece. In Side-by-Side Survey: Comparative Regional Studies in the Mediterranean World; Alcock, S.E., Cherry, J.F., Eds.; Oxbow: Oxford, UK, 2004; pp. 114–131. ISBN 978-1-78570-158-0. [Google Scholar]
  22. de Haas, T.; van Leusen, M. FAIR Survey: Improving Documentation and Archiving Practices in Archaeological Field Survey through CIDOC CRM. Fasti Online Doc. Res. 2020, 12. Available online: https://www.fastionline.org/folder/FOLDER-sur-2020-12 (accessed on 23 June 2025).
  23. Chapman, J. Archaeological Proxy-Data for Demographic Reconstructions: Facts, Factoids or Fiction? In Reconstructing Past Population Tresnds in Mediterranean Europe (3000 BC–AD 1800); Bintliff, J.L., Sbonias, K., Eds.; The Archaeology of Mediterranean Landscapes; Oxbow: Oxford, UK, 1999; pp. 65–76. [Google Scholar]
  24. James, S.A.; Nakassis, D.; Caraher, W.R.; Gallimore, S.C.; Erny, G.; Fernandez, R.; Frankl, J.; Friedman, A.; Godsey, M.; Gradoz, M. Landscape Histories and Terrestrial Networks in the Peloponnese: Results from the Western Argolid Regional Project. Hesperia 2024, 93, 145–190. [Google Scholar] [CrossRef]
  25. Newhard, J.; Elton, H.; Haldon, J. Assessing Continuity and Change in the Sixth to Ninth Century Landscape of North-Central Anatolia. In Winds of Change: Environment and Society in Anatolia. 15th International ANAMED Annual Symposium; Roosevelt, C., Haldon, J., Eds.; Koç University Research Center for Anatolian Civilization: Istanbul, Turkey, 2021; pp. 141–157. [Google Scholar]
  26. Sbonias, K. Introduction to Issues in Demography and Survey. In Reconstructing Past Population Trends in Mediterranean Europe (3000 BC–AD 1800); Bintliff, J.L., Sbonias, K., Eds.; The Archaeology of Mediterranean Landscapes; Oxbow: Oxford, UK, 1999; pp. 1–20. [Google Scholar]
  27. Given, M. Mapping and Manuring: Can We Compare Sherd Density Figures? In Side-by-Side Survey: Comparative Regional Studies in the Mediterranean World; Alcock, S.E., Cherry, J.F., Eds.; Oxbow: Havertown, PA, USA, 2004; pp. 13–21. ISBN 978-1-78570-474-1. [Google Scholar]
  28. Meyer, N. Finding Sites in Mediterranean Survey. J. Mediterr. Archaeol. 2022, 35, 143–168. [Google Scholar] [CrossRef]
  29. Leppard, T.P.; Knodell, A.R. Retrospect and Prospect in Regional Archaeology. In Regional Approaches to Society and Complexity: Studies in Honor of John F. Cherry; Knodell, A.R., Leppard, T.P., Eds.; Monographs in Mediterranean Archaeology; Equinox: Sheffield, UK, 2018; pp. 320–337. ISBN 978-1-78179-527-9. [Google Scholar]
  30. Knodell, A.R.; Leppard, T.P. Regional Approaches to Society and Complexity: Setting an Agenda. In Regional Approaches to Society and Complexity: Studies in Honor of John F. Cherry; Knodell, A.R., Leppard, T.P., Eds.; Monographs in Mediterranean Archaeology; Equinox: Sheffield, UK, 2018; pp. 1–31. ISBN 978-1-78179-527-9. [Google Scholar]
  31. Alcock, S.E. Graecia Capta: The Landscapes of Roman Greece; Cambridge University Press: Cambridge, UK, 1993. [Google Scholar]
  32. Murray, S. The Collapse of the Mycenaean Economy: Imports, Trade, and Institutions, 1300–1700 BCE; Cambridge University Press: New York, NY, USA, 2017; ISBN 978-1-316-94686-2. [Google Scholar]
  33. Attema, P.; Bintliff, J.; van Leusen, M.; Bes, P.; de Haas, T.; Donev, D.; Jongman, W.; Kaptijn, E.; Mayoral, V.; Menchelli, S.; et al. A Guide to Good Practice in Mediterranean Surface Survey Projects. J. Greek Archaeol. 2020, 5, 1–62. [Google Scholar] [CrossRef]
  34. Millett, M. Dating, Quantifying and Utilizing Pottery Assemblages from Surface Survey. In Extracting Meaning from Ploughsoil Assemblages; Francovich, R., Patterson, H., Eds.; Archaeology of Mediterranean landscapes; Oxbow: Oxford, UK, 2000; pp. 53–59. ISBN 978-1-900188-75-3. [Google Scholar]
  35. Weiberg, E.; Bevan, A.; Kouli, K.; Katsianis, M.; Woodbridge, J.; Bonnier, A.; Engel, M.; Finné, M.; Fyfe, R.; Maniatis, Y.; et al. Long-Term Trends of Land Use and Demography in Greece: A Comparative Study. Holocene 2019, 29, 742–760. [Google Scholar] [CrossRef]
  36. Weiberg, E.; Finné, M. Resilience and Persistence of Ancient Societies in the Face of Climate Change: A Case Study from Late Bronze Age Peloponnese. World Archaeol. 2018, 50, 584–602. [Google Scholar] [CrossRef]
  37. Weiberg, E.; Finné, M. Vulnerability to Climate Change in Late Bronze Age Peloponnese (Greece). In Climate Change and Ancient Societies in Europe and the Near East: Diversity in Collapse and Resilience; Erdkamp, P., Manning, J.G., Verboven, K., Eds.; Palgrave Studies in Ancient Economies; Springer International Publishing: Cham, Switzerland, 2021; pp. 215–242. ISBN 978-3-030-81103-7. [Google Scholar]
  38. Weiberg, E.; Hughes, R.E.; Finné, M.; Bonnier, A.; Kaplan, J.O. Mediterranean Land Use Systems from Prehistory to Antiquity: A Case Study from Peloponnese (Greece). J. Land Use Sci. 2019, 14, 1–20. [Google Scholar] [CrossRef]
  39. Bonnier, A.; Finné, M. Climate Variability and Landscape Dynamics in the Late Hellenistic and Roman North-Eastern Peloponnese. Antiquity 2020, 94, 1482–1500. [Google Scholar] [CrossRef]
  40. Gyucha, A.; Duffy, P.R.; Parkinson, W.A. Prehistoric Human-Environmental Interactions on the Great Hungarian Plain. Anthropologie 2013, 51, 157–168. [Google Scholar]
  41. Riris, P.; Silva, F.; Crema, E.; Palmisano, A.; Robinson, E.; Siegel, P.E.; French, J.C.; Jørgensen, E.K.; Maezumi, S.Y.; Solheim, S.; et al. Frequent Disturbances Enhanced the Resilience of Past Human Populations. Nature 2024, 629, 837–842. [Google Scholar] [CrossRef] [PubMed]
  42. Crema, E.R. Modelling Temporal Uncertainty in Archaeological Analysis. J. Archaeol. Method Theory 2012, 19, 440–461. [Google Scholar] [CrossRef]
  43. Johnson, I. Aoristic Analysis: Seeds of a New Approach to Mapping Archaeological Distributions through Time. In Enter the Past: The E-Way into the four Dimensions of Cultural Heritage: CAA2003; der Stadt Wien, M., Erbe, R.K., Wien, S., Eds.; BAR international series; Archaeopress: Oxford, UK, 2004; pp. 448–452. [Google Scholar]
  44. Palmisano, A.; Bevan, A.; Shennan, S. Comparing Archaeological Proxies for Long-Term Population Patterns: An Example from Central Italy. J. Archaeol. Sci. 2017, 87, 59–72. [Google Scholar] [CrossRef]
  45. Bradtmöller, M.; Grimm, S.; Riel-Salvatore, J. Resilience Theory in Archaeological Practice—An Annotated Review. Quat. Int. 2017, 446, 3–16. [Google Scholar] [CrossRef]
  46. Redman, C.; Kinzig, A. Resilience of Past Landscapes: Resilience Theory, Society, and the Longue Durée. Conserv. Ecol. 2003, 7, 14. [Google Scholar] [CrossRef]
  47. Gunderson, L.H.; Holling, C.S. (Eds.) Panarchy: Understanding Transformations in Human and Natural Systems; Island Press: London, UK, 2002. [Google Scholar]
  48. Newhard, J.; Cline, E.H. Panarchy and the Adaptive Cycle: A Case Study from Mycenaean Greece. In Perspectives on Public Policy in Societal-Environmental Crises; Izdebski, A., Haldon, J.F., Filipkowski, P., Eds.; Risk, Systems and Decisions; Springer: New York, NY, USA, 2022; pp. 225–235. [Google Scholar]
  49. Holling, C.S.; Gunderson, L.H. Resilience and Adaptive Cycles. In Panarchy: Understanding Transformations in Human and Natural Systems; Gunderson, L.H., Holling, C.S., Eds.; Island Press: London, UK, 2002; pp. 25–62. [Google Scholar]
  50. Iannone, G. Release and Reorganization in the Tropics: A Comparative Perspective from Southeast Asia. In Beyond Collapse: Archaeological Perspectives on Resilience, Revitalization, and Transformation in Complex Societies; Faulseit, R.K., Ed.; Southern Illinois University: Carbondale, IL, USA, 2016; pp. 179–212. [Google Scholar]
  51. Runnels, C.N. Appendix A. A Register of Sites. In A Greek Countryside: The Southern Argolid from Prehistory to the Present Day; Jameson, M.H., Runnels, C.N., van Andel, T.H., Eds.; Stanford University Press: Stanford, CA, USA, 1994; pp. 415–538. [Google Scholar]
  52. Wells, B. (Ed.) The Berbati-Limnes Archaeological Survey, 1988–1990; Paul Åströms Förlag: Jonsered, Sweden, 1996. [Google Scholar]
  53. Mee, C.; Forbes, H. (Eds.) A Rough and Rocky Place: The Landscape and Settlement History of the Methana Peninsula, Greece; Liverpool Monographs in Archaeology and Oriental Studies; Liverpool University Press: Liverpool, UK, 1997. [Google Scholar]
  54. Pettegrew, D.K.; Gregory, T.E.; Pullen, D.J.; Rothaus, R.; Tartaron, T.F. The Eastern Korinthia Archaeological Survey 2021. OpenContext. Available online: https://opencontext.org/projects/bc71c724-eb1e-47d6-9d45-b586ddafdcfe (accessed on 21 December 2022).
  55. Pettegrew, D.K. Corinthian Countrysides: Linked Open Data and Analysis from the Eastern Korinthia Archaeological Survey; University of North Dakota Digital Press: Grand Forks, ND, USA, 2024. [Google Scholar]
  56. Wright, J.C.; Cherry, J.F.; Davis, J.L.; Mantzourani, E.; Sutton, S.B.; Robert, F.S., Jr. The Nemea Valley Archaeological Project: A Preliminary Report. Hesperia 1990, 59, 579–659. [Google Scholar] [CrossRef]
  57. Tartaron, T.F.; Tzortzopoulou-Gregory, L.; Pullen, D.J.; Dill, A.; Dunn, R.K.; Boyce, J.I. The Saronic Harbors Archaeological Research Project (SHARP) Investigations at Mycenaean Kalamianos, 2007–2009. Hesperia 2011, 80, 559–634. [Google Scholar] [CrossRef]
  58. Athanassopoulos, E.F. Landscape Archaeology and the Medieval Countryside: Settlement and Abandonment in the Nemea Region. Int. J. Histor. Archaeol. 2010, 14, 255–270. [Google Scholar] [CrossRef]
  59. Cloke, C. The Landscape of the Lion: Economies of Religion and Politics in the Nemean Countryside (800 B.C. to A.D. 700). Doctoral Dissertation, University of Cincinnati, Cincinnati, OH, USA, 2016. [Google Scholar]
  60. Plog, S.; Plog, F.; Wait, W. Decision Making in Modern Surveys. Adv. Archaeol. Method Theory 1978, 1, 383–421. [Google Scholar]
  61. Banning, E.B.; Hawkins, A.L.; Stewart, S.T. Detection Functions for Archaeological Survey. Am. Antiq. 2006, 71, 723–742. [Google Scholar] [CrossRef]
  62. Pettegrew, D.K.; Gregory, T.E.; Pullen, D.J.; Rothaus, R.; Tartaron, T.F. EKAS Finds Data Table; Dataset; OpenContext; csv. 2025. Available online: https://opencontext.org/tables/a5ab46c5-8c9b-4f32-8522-3181afe83745 (accessed on 18 January 2025).
  63. Pettegrew, D.K.; Gregory, T.E.; Pullen, D.J.; Rothaus, R.; Tartaron, T.F. EKAS LOCAs Data Table; Dataset; OpenContext; csv. 2025. Available online: https://opencontext.org/tables/bd646482-d079-4430-ada4-5b8713821d04 (accessed on 18 January 2025).
  64. Runnels, C.N.; Pullen, D.J.; Langdon, S. Appendix 2. Assemblage Tables for Chapters 1-4. In Artifact and Assemblage: The Finds from a Regional Survey of the Southern Argolid, Greece; Runnels, C.N., Pullen, D.J., Langdon, S., Eds.; Stanford University Press: Stanford, CA, USA, 1995; pp. 223–319. [Google Scholar]
  65. Timonen, R.E. Plain of Plenty. Farming Practices, Food Production, and the Agricultural Potential of the Late Bronze Age (1600–1200 BCE) Argive Plain, Greece; Archaeopress: Oxford, UK, 2024; p. 25. [Google Scholar]
  66. Bonnier, A.; Finné, M.; Weiberg, E. Examining Land-Use through GIS-Based Kernel Density Estimation: A Re-Evaluation of Legacy Data from the Berbati-Limnes Survey. J. Field Archaeol. 2019, 44, 70–83. [Google Scholar] [CrossRef]
  67. Tartaron, T.F.; Gregory, T.E.; Pullen, D.J. The Eastern Korinthia Archaeological Survey: Integrated Methods for a Dynamic Landscape. Hesperia 2006, 75, 453–523. [Google Scholar] [CrossRef]
  68. Pettegrew, D.K. The Busy Countryside of Late Roman Corinth: Interpreting Ceramic Data Produced by Regional Archaeological Surveys. Hesperia 2007, 76, 743–784. [Google Scholar] [CrossRef]
  69. Pettegrew, D.K. The End of Ancient Corinth? Views from the Landscape. In Methods and Meaning in Medieval and Post Medieval Greece: A Tribute to Timothy E. Gregory; Hall, L.J., Caraher, W.R., Moore, R.S., Eds.; Ashgate: Aldershot, UK, 2008; pp. 455–481. [Google Scholar]
  70. Arena, E. Mycenaean Achaea before and after the Collapse. In Collapse and Transformation: The Late Bronze Age to Early Iron Age in the Aegean; Middleton, G.D., Ed.; Oxbow Books: Oxford, UK, 2020; pp. 35–43. ISBN 978-1-78925-425-9. [Google Scholar]
  71. Arena, E. Mycenaean Peripheries during the Palatial Age. Hesperia 2015, 84, 1–46. [Google Scholar] [CrossRef]
  72. Kramer-Hajos, M. The Euboean Gulf. In Collapse and Transformation: The Late Bronze Age to Early Iron Age in the Aegean; Middleton, G.D., Ed.; Oxbow Books: Oxford, UK, 2020; pp. 77–85. ISBN 978-1-78925-425-9. [Google Scholar]
  73. Maggidis, C. Glas and Boeotia. In Collapse and Transformation: The Late Bronze Age to Early Iron Age in the Aegean; Middleton, G.D., Ed.; Oxbow Books: Oxford, UK, 2020; pp. 107–120. ISBN 978-1-78925-425-9. [Google Scholar]
  74. McKay, N.P.; Kaufman, D.S.; Arcusa, S.H.; Kolus, H.R.; Edge, D.C.; Erb, M.P.; Hancock, C.L.; Routson, C.C.; Żarczyński, M.; Marshall, L.P.; et al. The 4.2 Ka Event Is Not Remarkable in the Context of Holocene Climate Variability. Nat. Commun. 2024, 15, 6555. [Google Scholar] [CrossRef] [PubMed]
  75. Finné, M.; Holmgren, K.; Sundqvist, H.S.; Weiberg, E.; Lindblom, M. Climate in the Eastern Mediterranean, and Adjacent Regions, during the Past 6000 Years—A Review. J. Archaeol. Sci. 2011, 38, 3153–3173. [Google Scholar] [CrossRef]
  76. Finné, M.; Woodbridge, J.; Labuhn, I.; Roberts, C.N. Holocene Hydro-Climatic Variability in the Mediterranean: A Synthetic Multi-Proxy Reconstruction. Holocene 2019, 29, 847–863. [Google Scholar] [CrossRef]
  77. Bini, M.; Zanchetta, G.; Perşoiu, A.; Cartier, R.; Català, A.; Cacho, I.; Dean, J.R.; Di Rita, F.; Drysdale, R.N.; Finnè, M.; et al. The 4.2 Ka BP Event in the Mediterranean Region: An Overview. Clim. Past 2019, 15, 555–577. [Google Scholar] [CrossRef]
  78. Tartaron, T.F. Aegean Prehistory as World Archaeology: Recent Trends in the Archaeology of Bronze Age Greece. J. Archaeol. Res. 2008, 16, 83–161. [Google Scholar] [CrossRef]
  79. Weiberg, E. Contrasting Histories in Early Bronze Age Aegean: Uniformity, Regionalism and the Resilience of Societies in the Northeast Peloponnese and Central Crete. Camb. Archaeol. J. 2017, 27, 479–494. [Google Scholar] [CrossRef]
  80. Weiberg, E.; Lindblom, M. The Early Helladic II-III Transition at Lerna and Tiryns Revisited: Chronological Differences or Synchronous Variability. Hesperia 2014, 83, 383–407. [Google Scholar] [CrossRef]
  81. Forsen, J. The Twilight of the Early Helladics: A Study of the Disturbances in East-Central and Southern Greece Toward the End of the Early Bronze Age; Paul Astroms Forlag: Jonsered, Sweden, 1992; ISBN 978-91-7081-031-2. [Google Scholar]
  82. Kaniewski, D.; Paulissen, E.; Van Campo, E.; Weiss, H.; Otto, T.; Bretschneider, J.; Van Lerberghe, K. Late Second–Early First Millennium BC Abrupt Climate Changes in Coastal Syria and Their Possible Significance for the History of the Eastern Mediterranean. Quat. Res. 2010, 74, 207–215. [Google Scholar] [CrossRef]
  83. Kaniewski, D.; Marriner, N.; Cheddadi, R.; Morhange, C.; Bretschneider, J.; Jans, G.; Otto, T.; Luce, F.; Van Campo, E. Cold and Dry Outbreaks in the Eastern Mediterranean 3200 Years Ago. Geology 2019, 47, 933–937. [Google Scholar] [CrossRef]
  84. Molloy, B. Was There a 3.2 Ka Crisis in Europe? A Critical Comparison of Climatic, Environmental, and Archaeological Evidence for Radical Change during the Bronze Age–Iron Age Transition. J. Archaeol. Res. 2023, 31, 331–394. [Google Scholar] [CrossRef]
  85. Cline, E.H. 1177 B.C.: The Year Civilization Collapsed; Princeton University Press: Princeton, NJ, USA, 2014. [Google Scholar]
  86. Middleton, G.D. Mycenaean Collapse(s) c. 1200 BC. In Collapse and Transformation: The Late Bronze Age to Early Iron Age in the Aegean; Middleton, G.D., Ed.; Oxbow Books: Oxford, UK, 2020; pp. 9–22. [Google Scholar]
  87. Deger-Jalkotzy, S. Decline, Destruction, Aftermath. In The Cambridge companion to the Aegean Bronze Age; Shelmerdine, C.W., Ed.; Cambridge University Press: Cambridge, UK, 2008; pp. 387–415. [Google Scholar]
  88. Middleton, G.D. The Collapse of Palatial Society in LBA Greece and the Postpalatial Period; BAR International Series; Archaeopress: Oxford, UK, 2010. [Google Scholar]
  89. Linkov, I.; Galaitsi, S.E.; Trump, B.; Pinigina, E.; Rand, K.; Cline, E.H.; Kitsak, M. Are Civilizations Destined to Collapse? Lessons from the Mediterranean Bronze Age. Glob. Environ. Chang. 2024, 84, 102792. [Google Scholar] [CrossRef]
  90. Middleton, G.D. (Ed.) Collapse and Transformation: The Late Bronze Age to Early Iron Age in the Aegean; Oxbow Books: Oxford, UK, 2020; ISBN 978-1-78925-425-9. [Google Scholar]
  91. Lemos, I.S.; Kotsonas, A. (Eds.) A Companion to the Archaeology of Early Greece and the Mediterranean; Blackwell Companions to the Ancient World; Wiley-Blackwell: Hoboken, NJ, USA, 2020; ISBN 978-1-118-76996-6. [Google Scholar]
  92. Kaniewski, D.; Campo, E.V.; Guiot, J.; Burel, S.L.; Otto, T.; Baeteman, C. Environmental Roots of the Late Bronze Age Crisis. PLoS ONE 2013, 8, e71004. [Google Scholar] [CrossRef] [PubMed]
  93. Sherratt, S. Potemkin Palaces and Route-Based Economies. In Economy and Politics in the Mycenaean Palace States. Proceedings of a Conference Held on 1–3 July 199 in the Faculty of Classics, Cambridge; Cambridge Philological Society Supplementary Volume; Cambridge Philological Society: Cambridge, UK, 2001; pp. 214–238. ISBN 0-906014-26-3. [Google Scholar]
  94. Crema, E.R. A Bayesian Alternative for Aoristic Analyses in Archaeology. Archaeometry 2024, 67, 7–30. [Google Scholar] [CrossRef]
  95. Bintliff, J.; Howard, P.; Snodgrass, A. The Hidden Landscape of Prehistoric Greece. J. Mediterr. Archaeol. 1999, 12, 139–168. [Google Scholar] [CrossRef]
  96. Pettegrew, D.K. Chasing the Classical Farmstead: Assessing the Formation and Signature of Rural Settlement in Greek Landscape Archaeology. J. Mediterr. Archaeol. 2001, 14, 189–201. [Google Scholar] [CrossRef]
  97. Bintliff, J.L.; Farinetti, E.; Howard, P.; Sarri, K.; Sbonias, K. Classical Farms, Hidden Prehistoric Landscapes and Greek Rural Survey: A Response and an Update. J. Mediterr. Archaeol. 2002, 15, 259–265. [Google Scholar] [CrossRef]
  98. Runnels, C.N.; Panagopoulou, E.; Murray, P.; Tsartsidou, G.; Allen, S.; Mullen, K.; Tourloukis, E. A Mesolithic Landscape in Greece: Testing a Site-Location Model in the Argolid at Kandia. J. Mediterr. Archaeol. 2005, 18, 259–285. [Google Scholar] [CrossRef]
  99. Kondyli, F.; Craft, S. The Making of a Byzantine Monastic Landscape: A Case Study from the Mazi Plain in Northwest Attica, Greece. J. Mediterr. Archaeol. 2020, 33, 135–159. [Google Scholar] [CrossRef]
  100. Consoli, R. The Mycenaean Atlas Project. Available online: https://helladic.info/index.php (accessed on 10 June 2025).
  101. Kearns, C. Everyday Climates: Household Archaeologies and the Politics of Scale. Heritage 2025, 8, 227. [Google Scholar] [CrossRef]
  102. Manning, S.W. Climate and the Ancient World: Beyond Present Concerns to Complications, Where Details Matter. Heritage 2025, 8, 168. [Google Scholar] [CrossRef]
  103. Vignola, C.; Hättestrand, M.; Bonnier, A.; Finné, M.; Izdebski, A.; Katrantsiotis, C.; Kouli, K.; Liakopoulos, G.C.; Norström, E.; Papadaki, M.; et al. Mid-Late Holocene Vegetation History of the Argive Plain (Peloponnese, Greece) as Inferred from a Pollen Record from Ancient Lake Lerna. PLoS ONE 2022, 17, e0271548. [Google Scholar] [CrossRef] [PubMed]
  104. South, S.A. Method and Theory in Historical Archaeology; Studies in Archaeology; Academic Press: New York, NY, USA, 1977; p. 215. [Google Scholar]
Figure 1. Aoristic sum of sites, adapted from Weiberg et al. [35], Figure 5. The x-axis represents years, the y-axis in (a) indicates counts, and the y-axis in (b) indicates aoristic sum values.
Heritage 08 00298 g001
Figure 3. Approximate locations of archaeological projects used in the study.
Heritage 08 00298 g003
Figure 4. Side-by-side comparison of the periodizations for the four regional surveys.
Heritage 08 00298 g004
Figure 5. LASF for the Eastern Korinthia.
Heritage 08 00298 g005
Figure 6. LASF for the Southern Argolid.
Heritage 08 00298 g006
Figure 7. LASF for the Berbati-Limnes Survey.
Heritage 08 00298 g007
Figure 8. LASF for Methana.
Heritage 08 00298 g008
Figure 9. Graph showing the fluctuations in aoristic sum values over time for the four surveys.
Heritage 08 00298 g009
Figure 10. The phases of the Adaptive Cycle from 6800 BCE to 1900 CE at 100-year intervals for four regions in the northeastern Peloponnese. AC phases are marked at the points in time where indices were measured. Colors represent the phases of the Adaptive Cycle (see Figure 2).
Heritage 08 00298 g010
Table 1. Classification of abandonment, expansion, and continuity according to Jenks Natural Breaks Optimization.
Abandonment
classloweruppercount
low00.1839183
medium0.197860.5343349
high0.59375137
GVF1.5664916.85390.90705
Expansion
classloweruppercount
low00.1993973
medium0.216120.550246
high0.57503151
GVF1.8045217.51750.89699
Continuity
classloweruppercount
low00.3259156
medium0.343250.6974153
high0.71094160
GVF1.5895517.62920.90983
Table 2. Values of abandonment, expansion, continuity, and potential as applied to the Adaptive Cycle.
αrKΩ
AbandonmentMedium to HighLowLow to MediumHigh
ExpansionMedium to HighMedium to HighLow to MediumLow
ContinuityLowMedium to HighMedium to HighLow to Medium
Potential010−1
Disclaimer/Publisher’s Note: The statements, opinions and data contained in all publications are solely those of the individual author(s) and contributor(s) and not of MDPI and/or the editor(s). MDPI and/or the editor(s) disclaim responsibility for any injury to people or property resulting from any ideas, methods, instructions or products referred to in the content.