


Does Water Cleaning Mitigate Atmospheric Degradation of Unstable Heritage Glass? An Experimental Study on Glass Models

 , , ,
, , , 
Abstract

1. Introduction
2. Materials and Methods
2.1. Glass Preparation
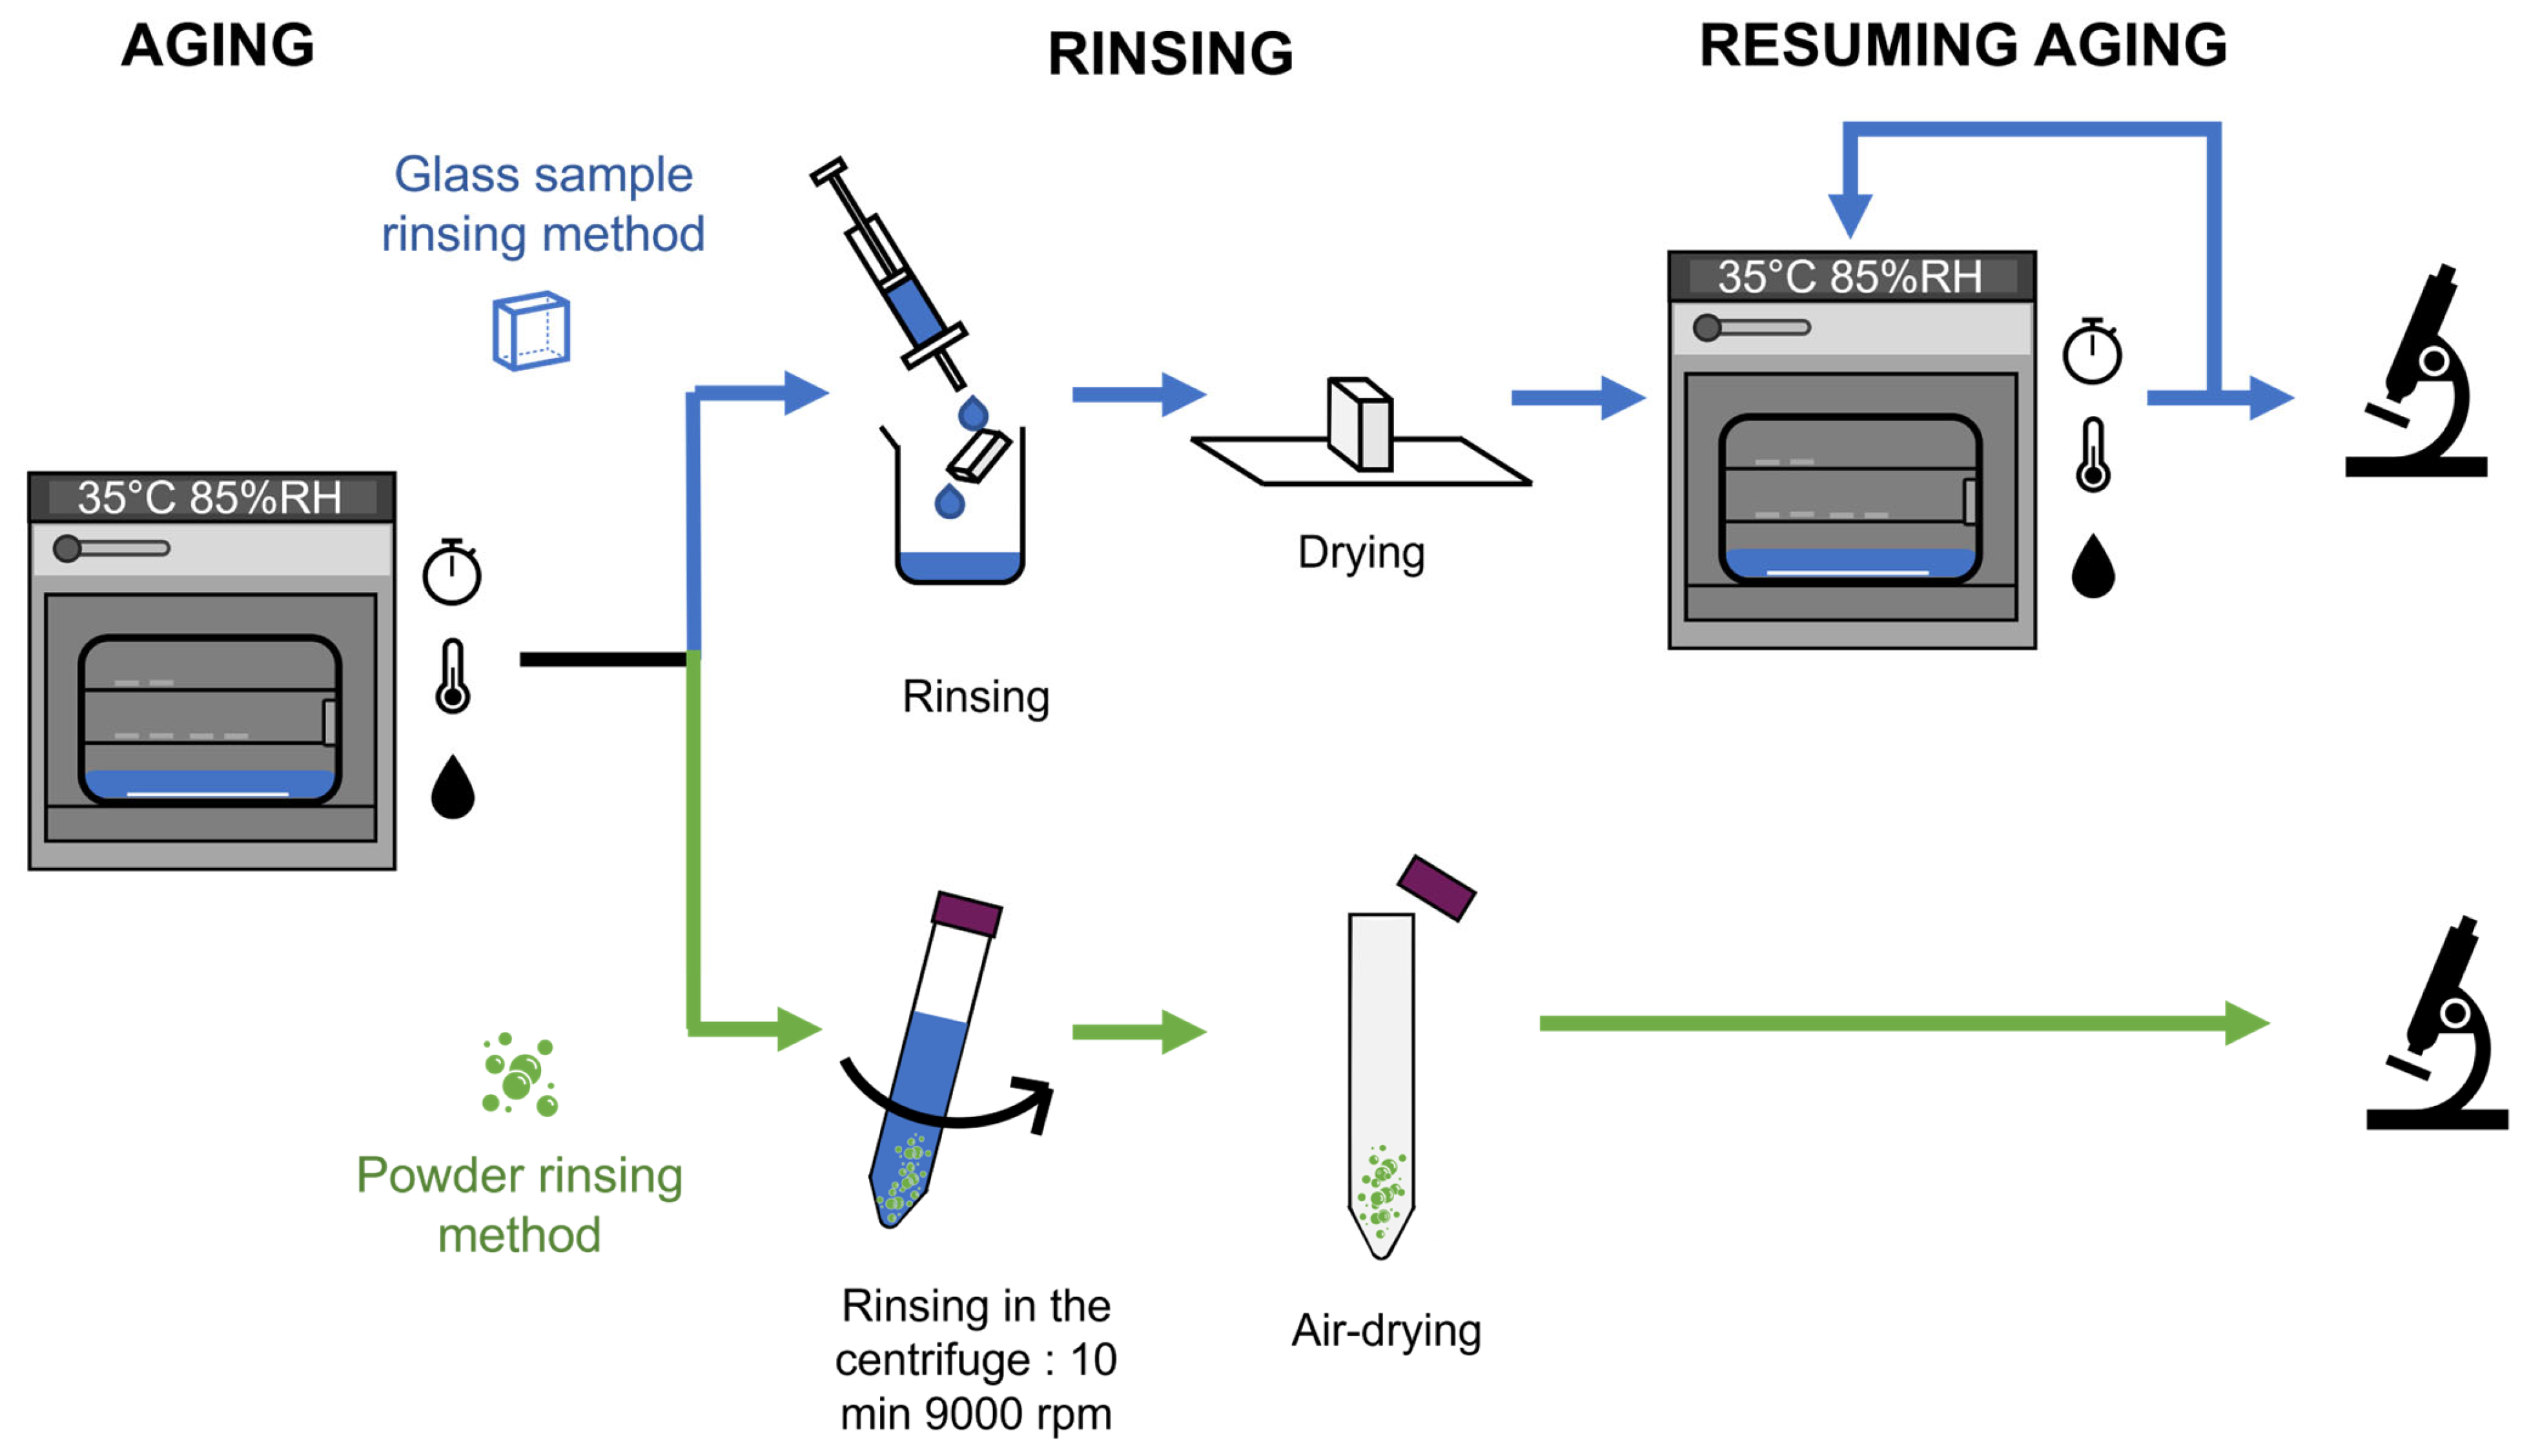
2.2. Accelerated Aging Experiments
2.3. Water Cleaning Protocol
2.4. Characterization Methods
2.4.1. Morphological Studies
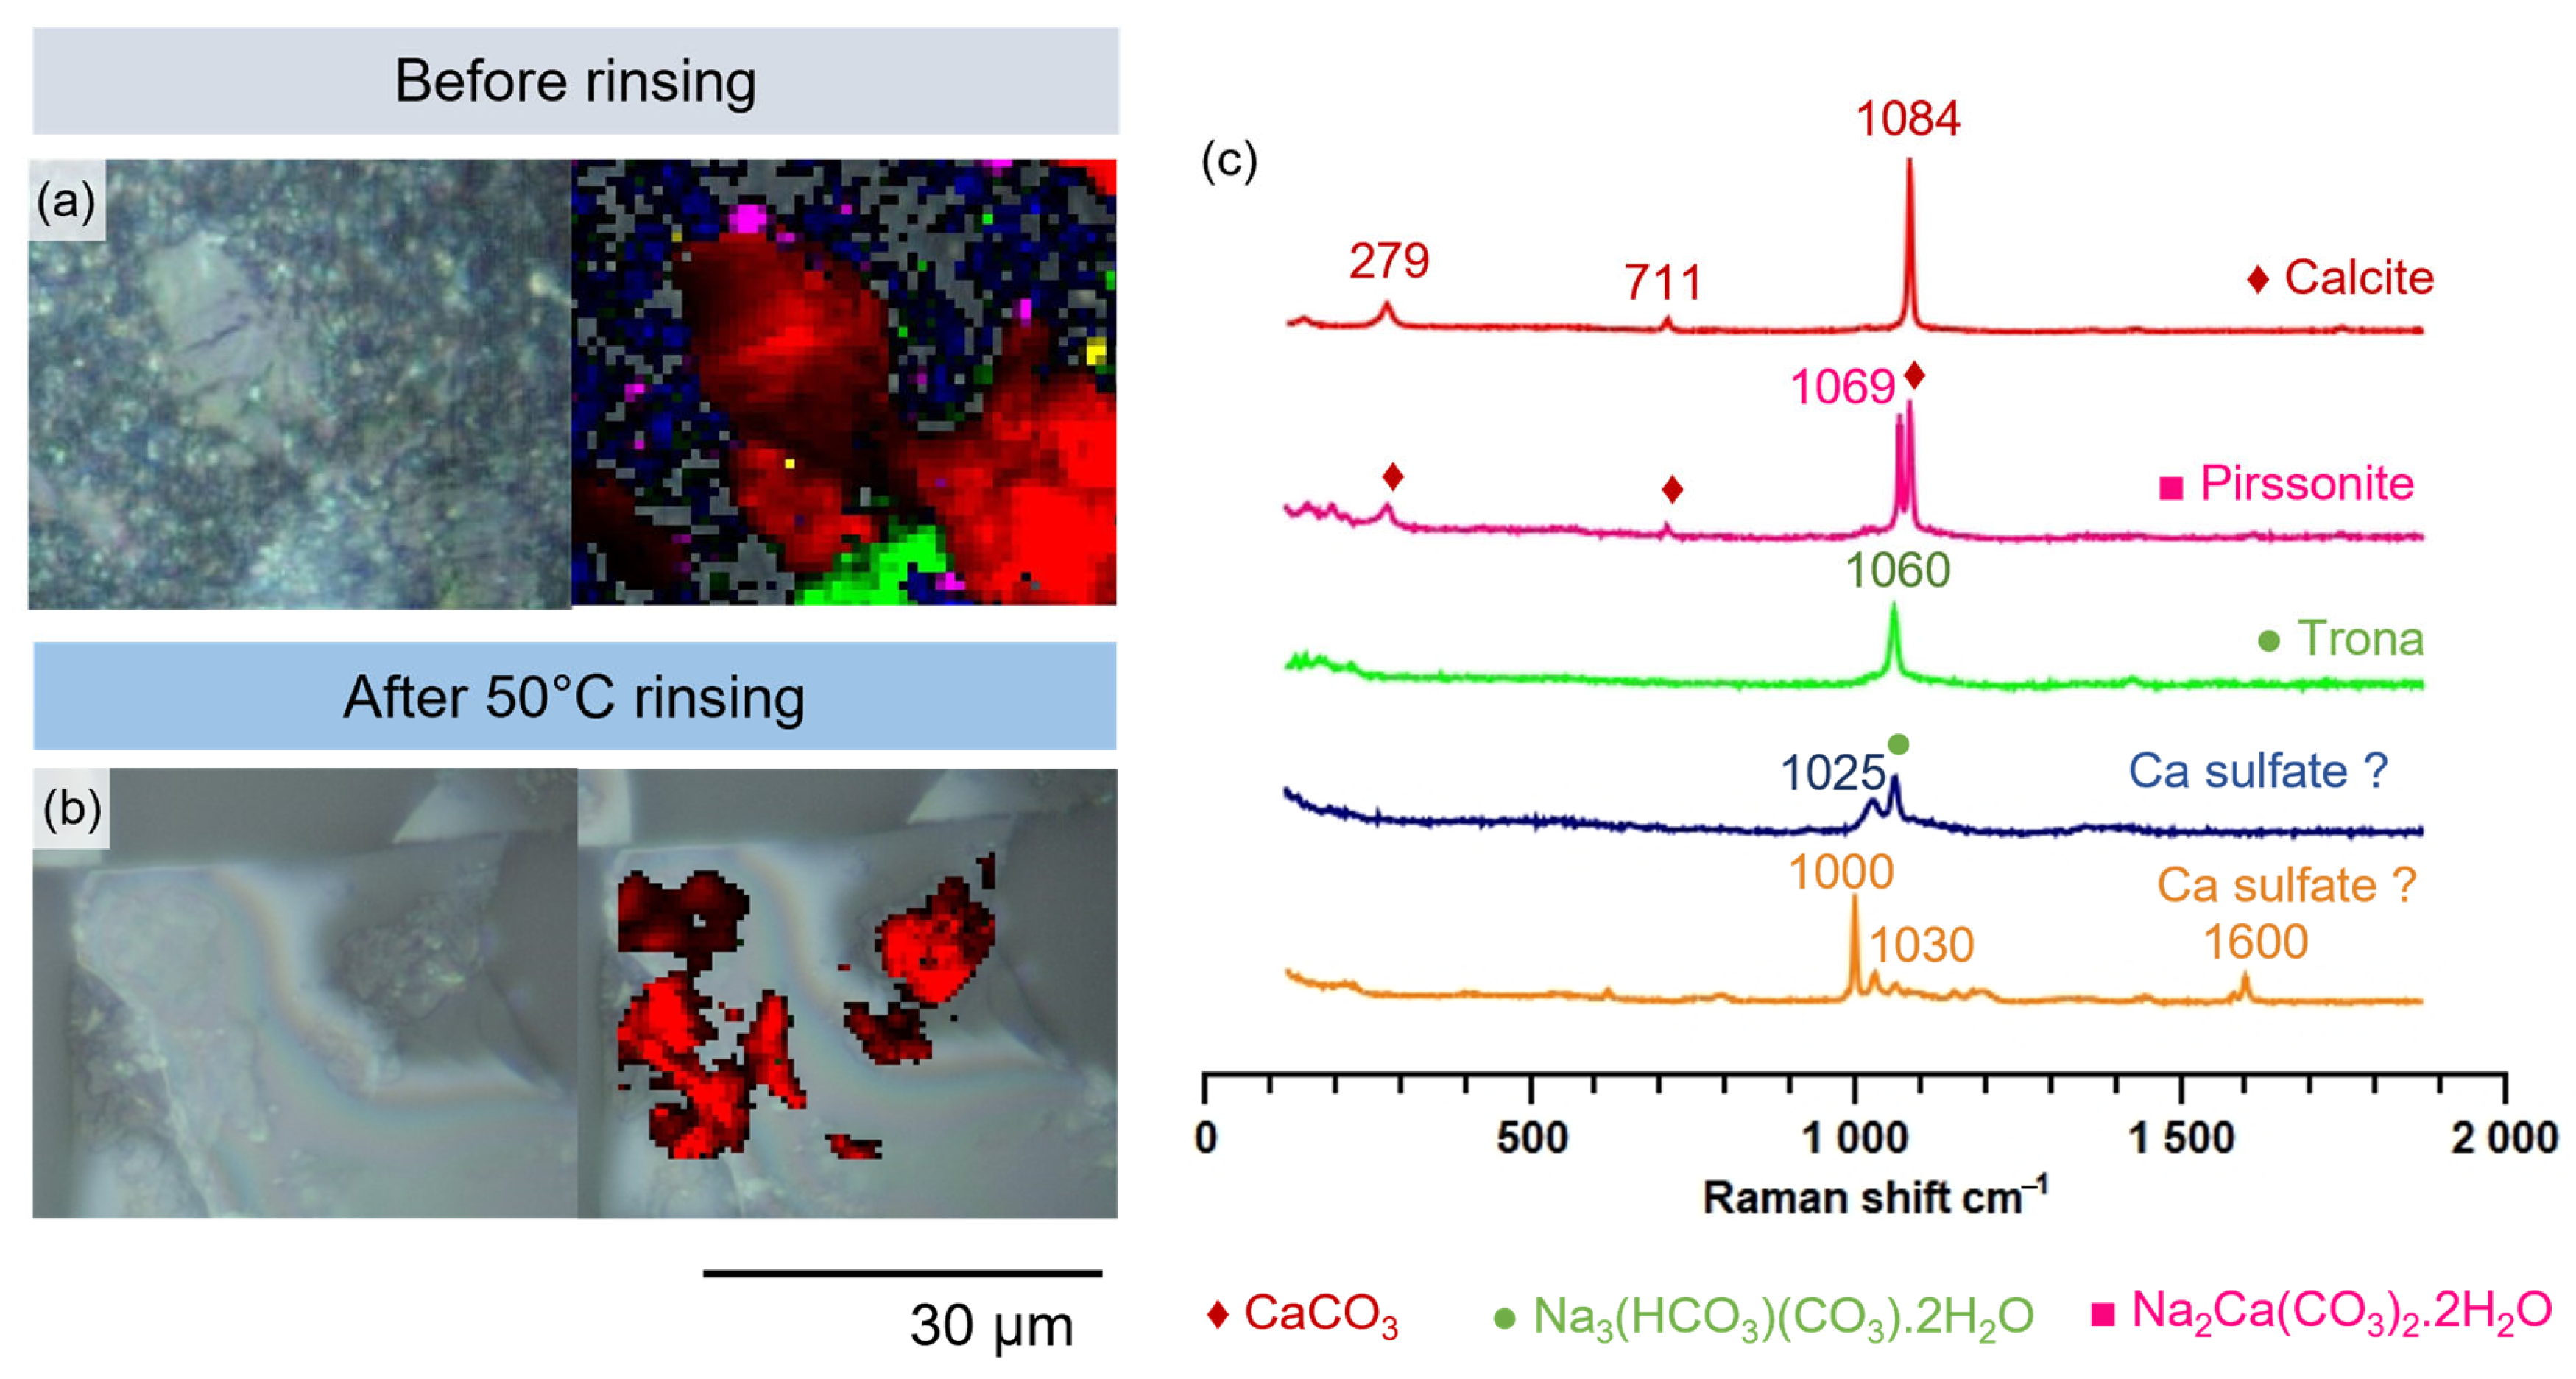
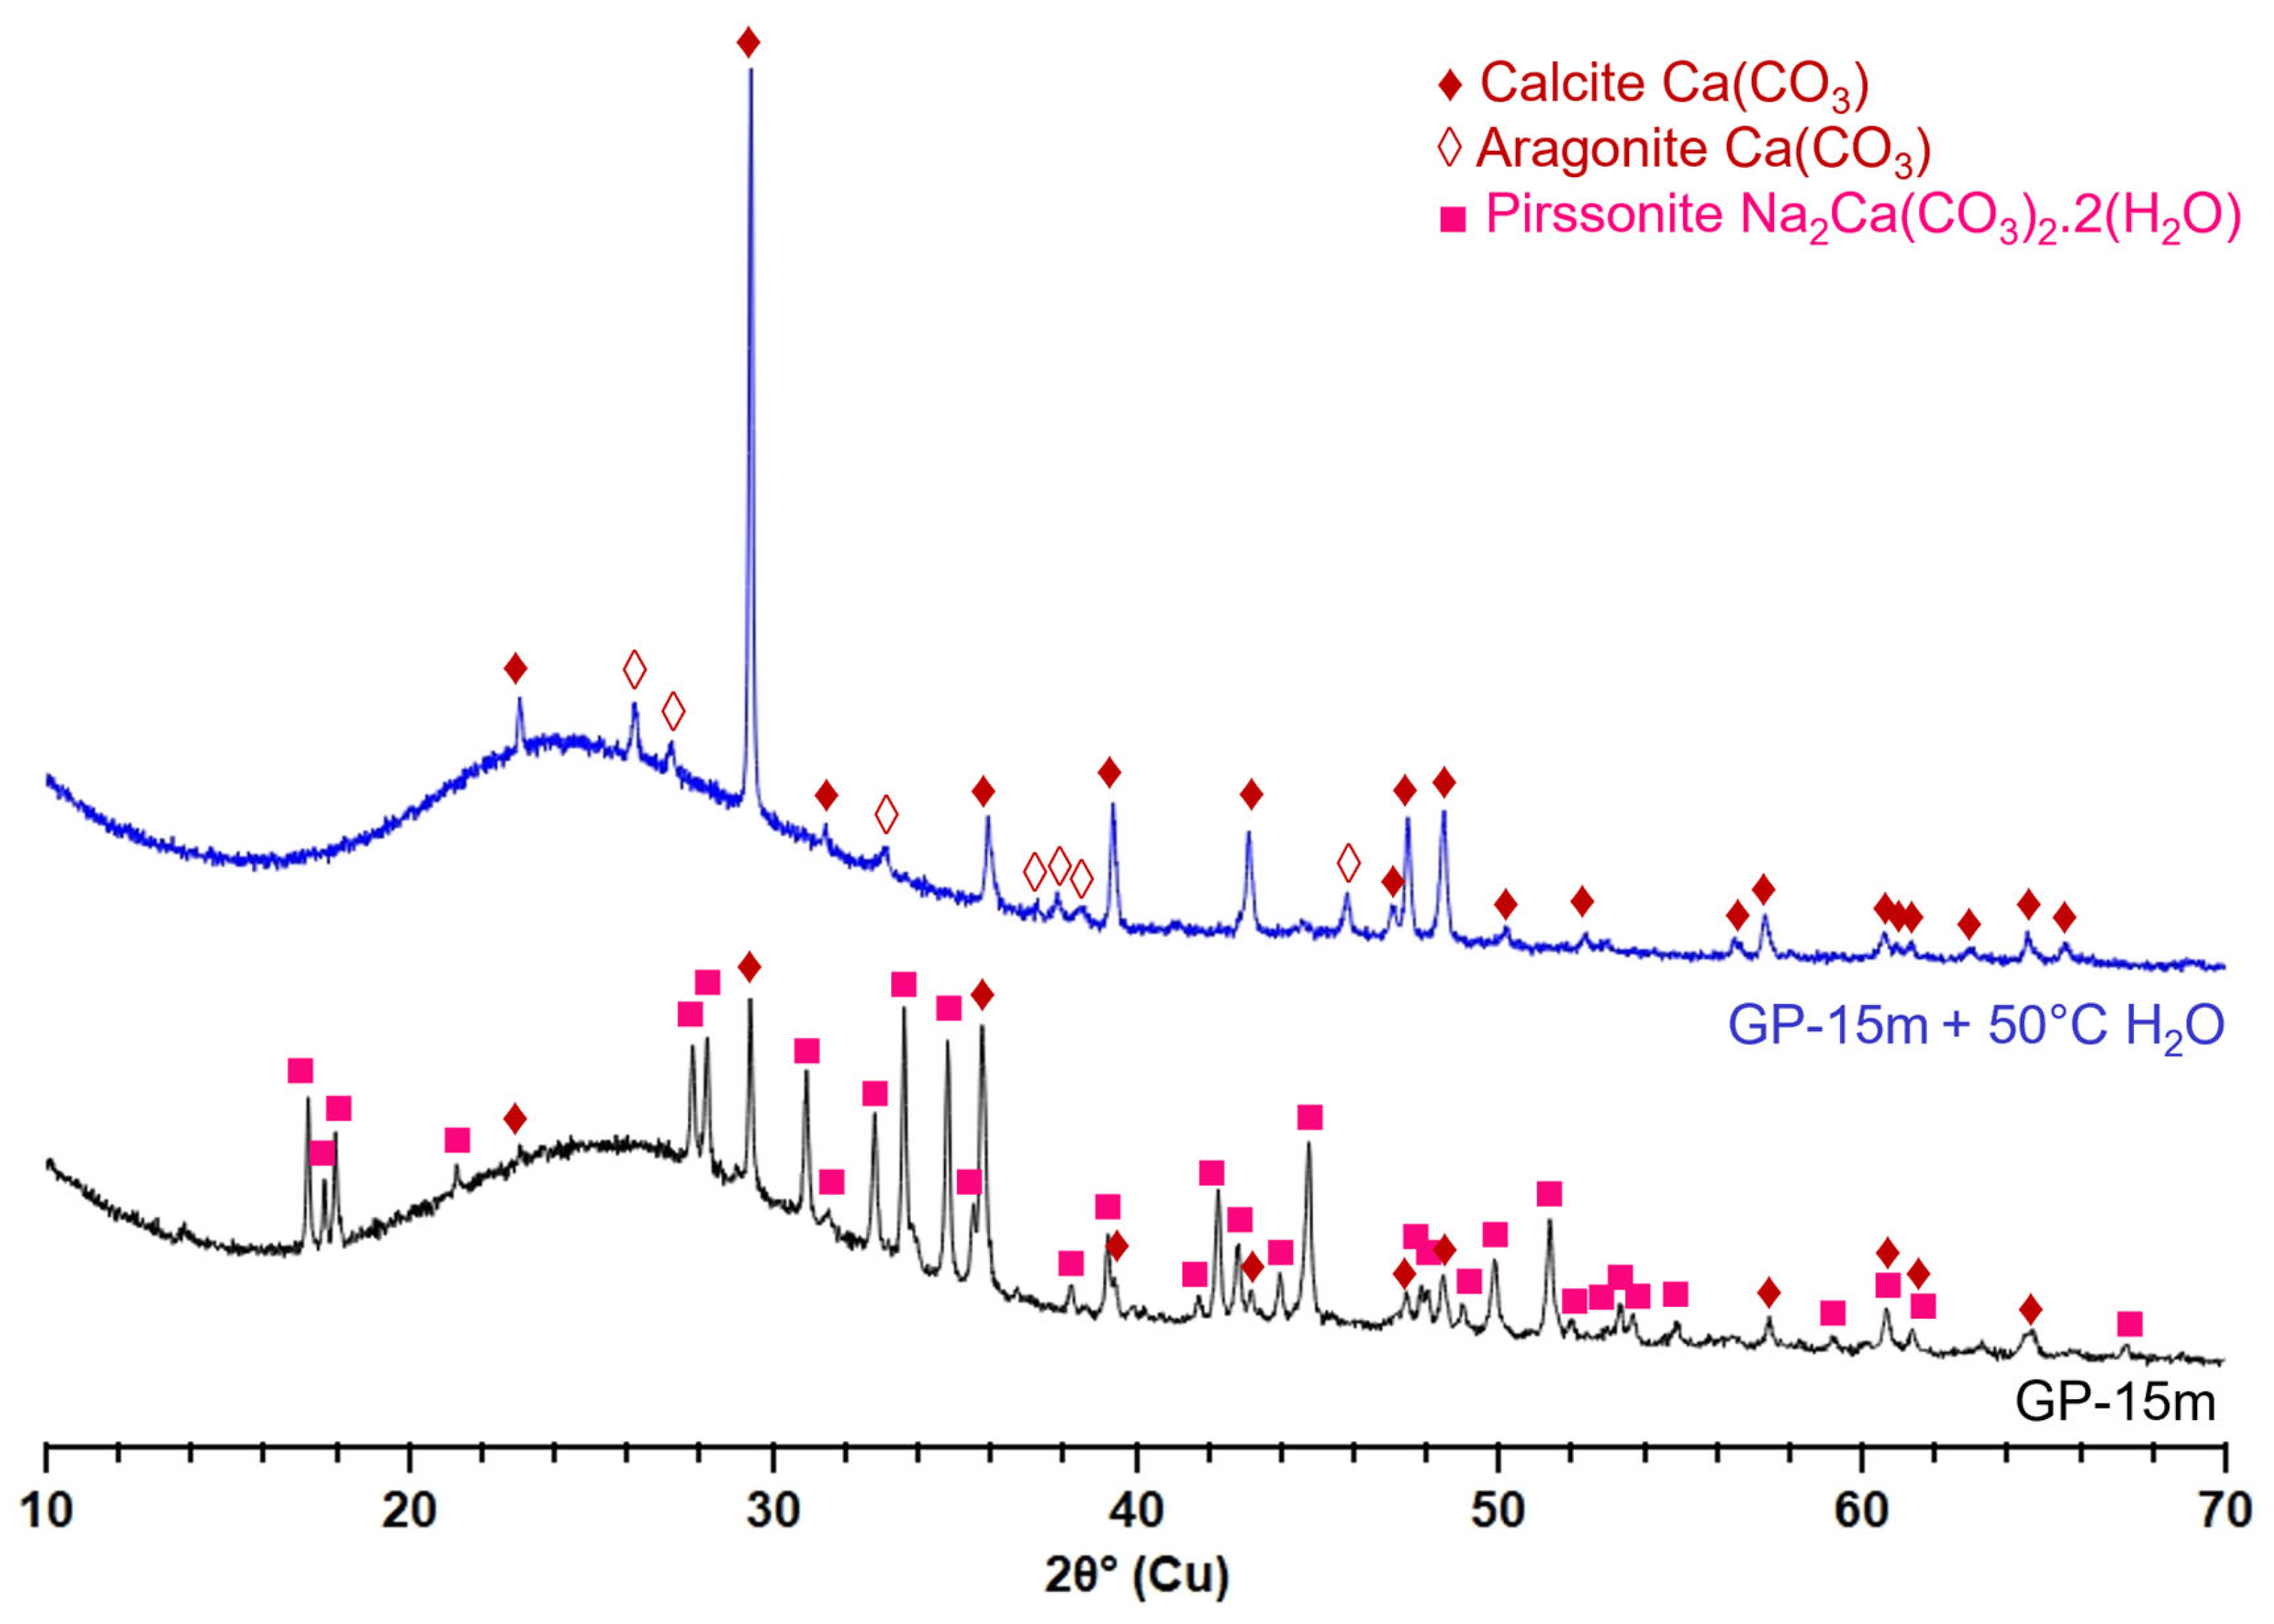
2.4.2. Salts Identification
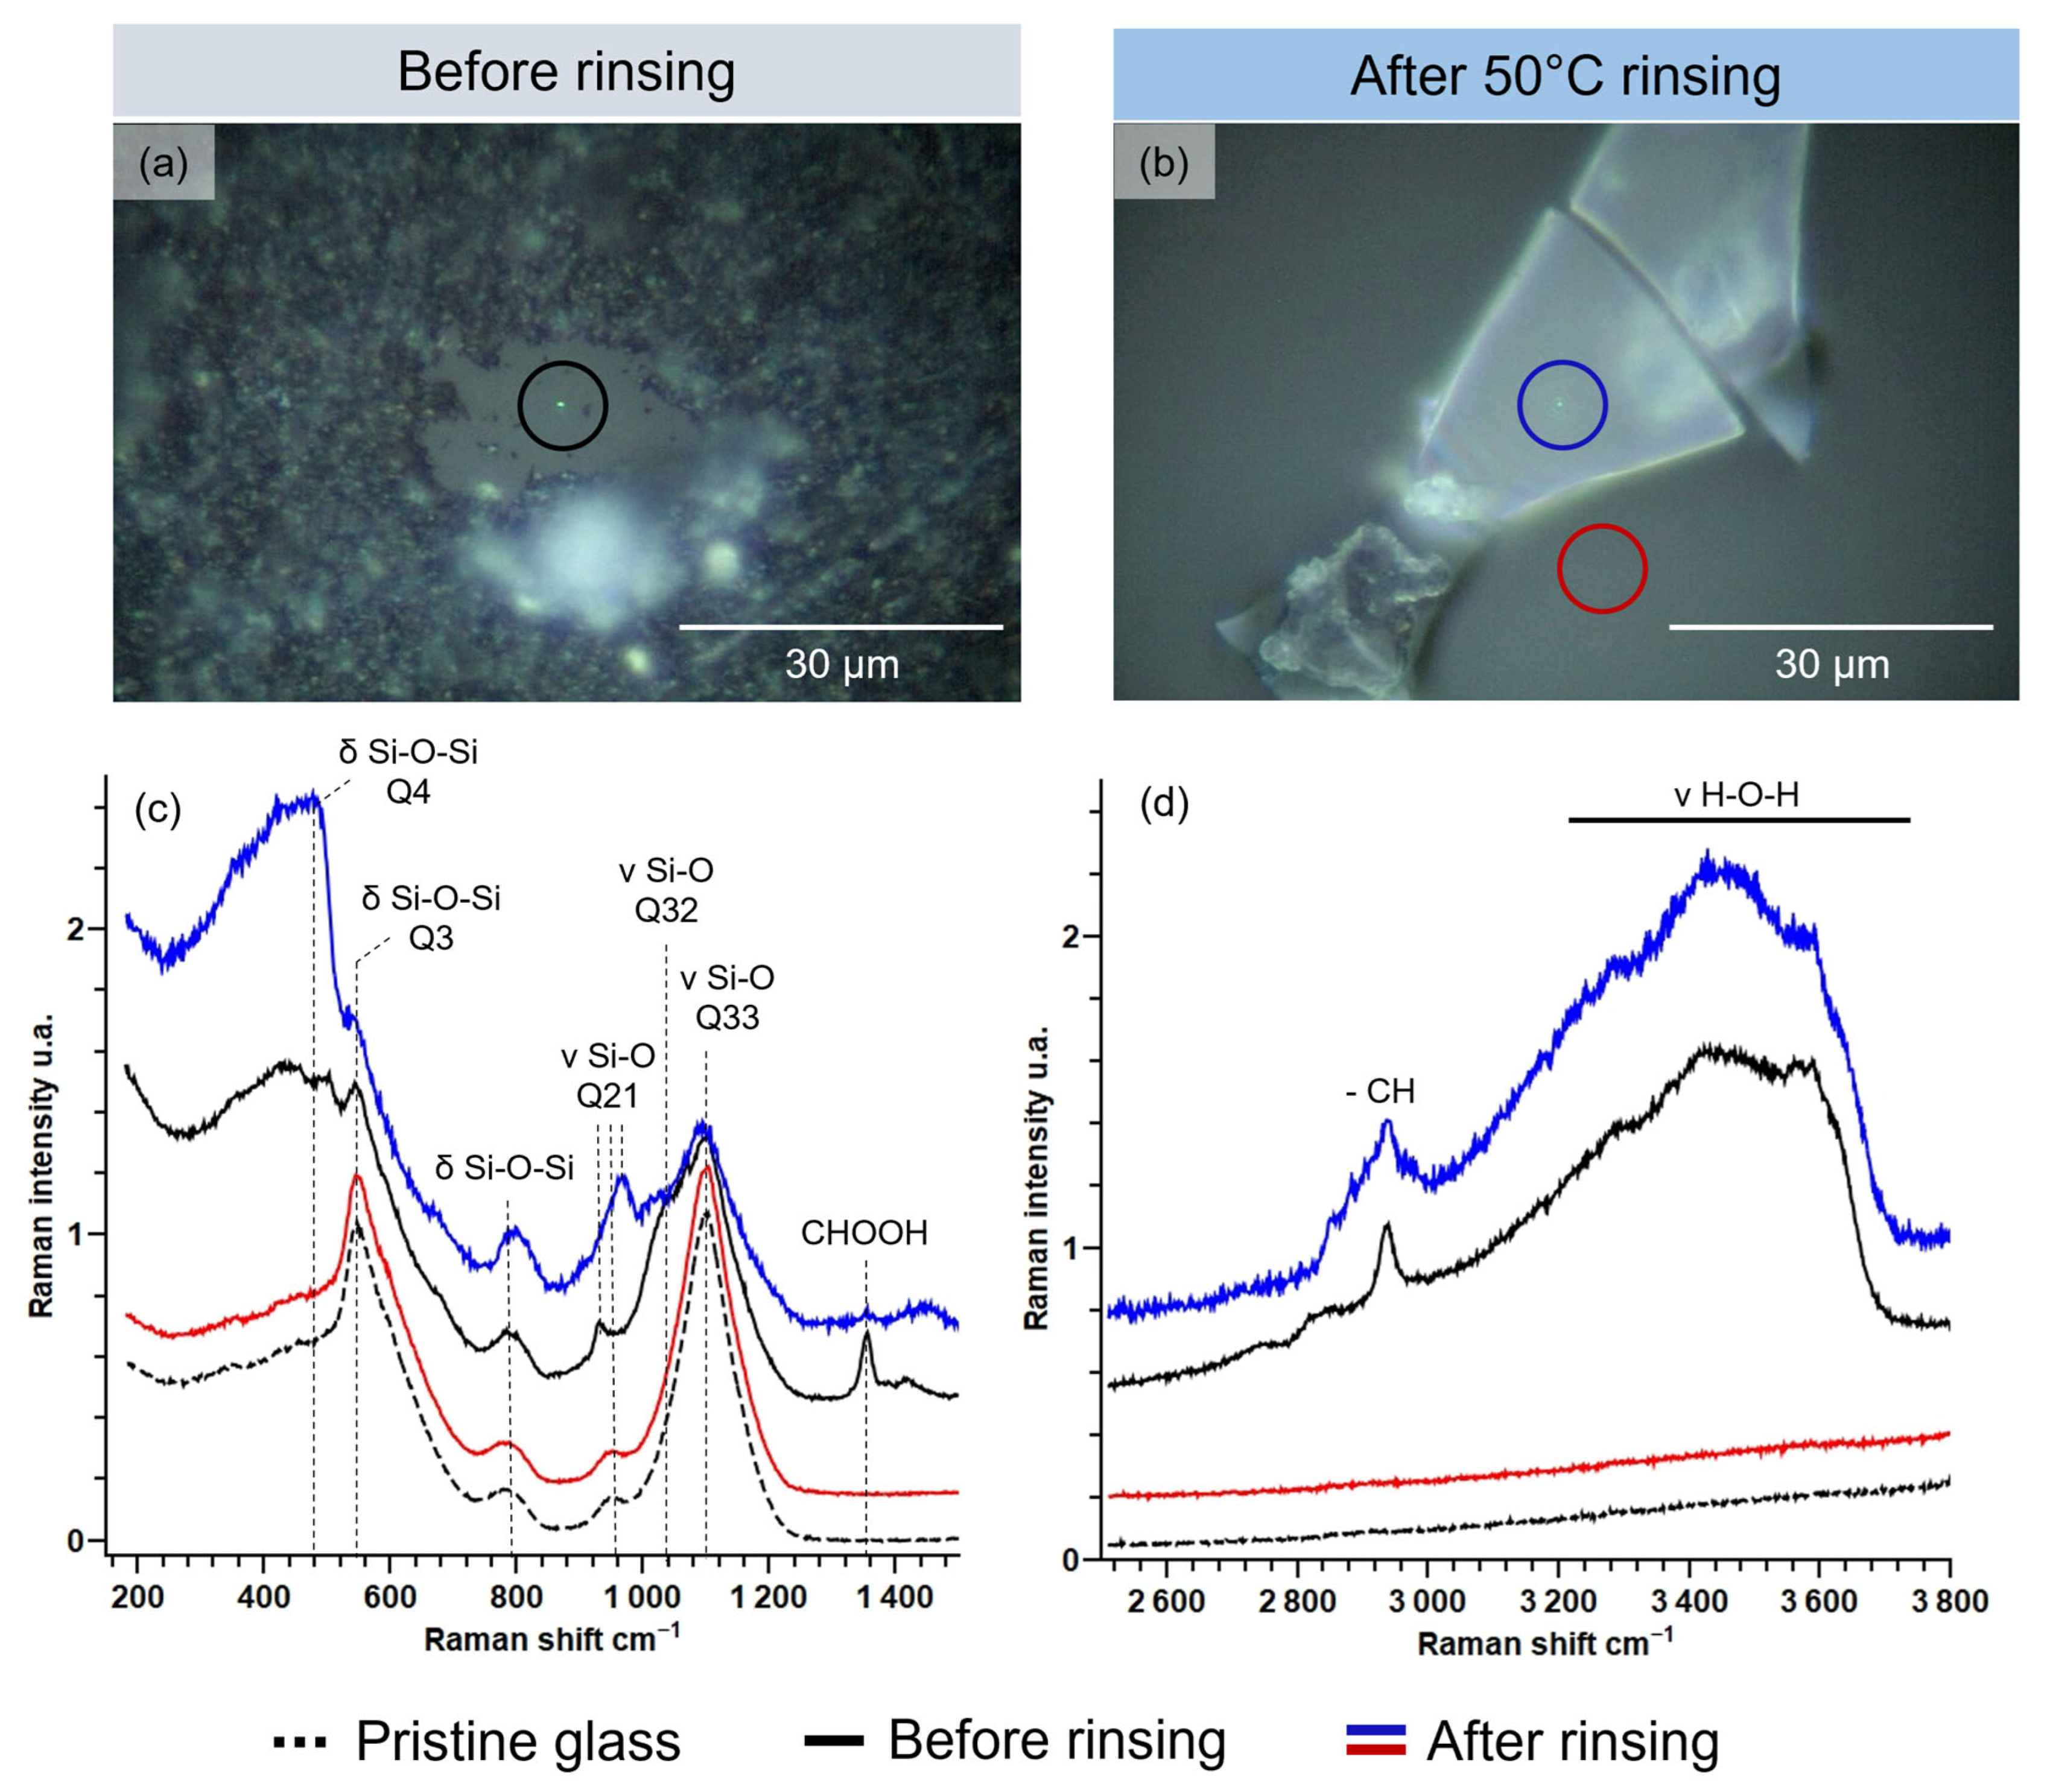
2.4.3. Structural Studies
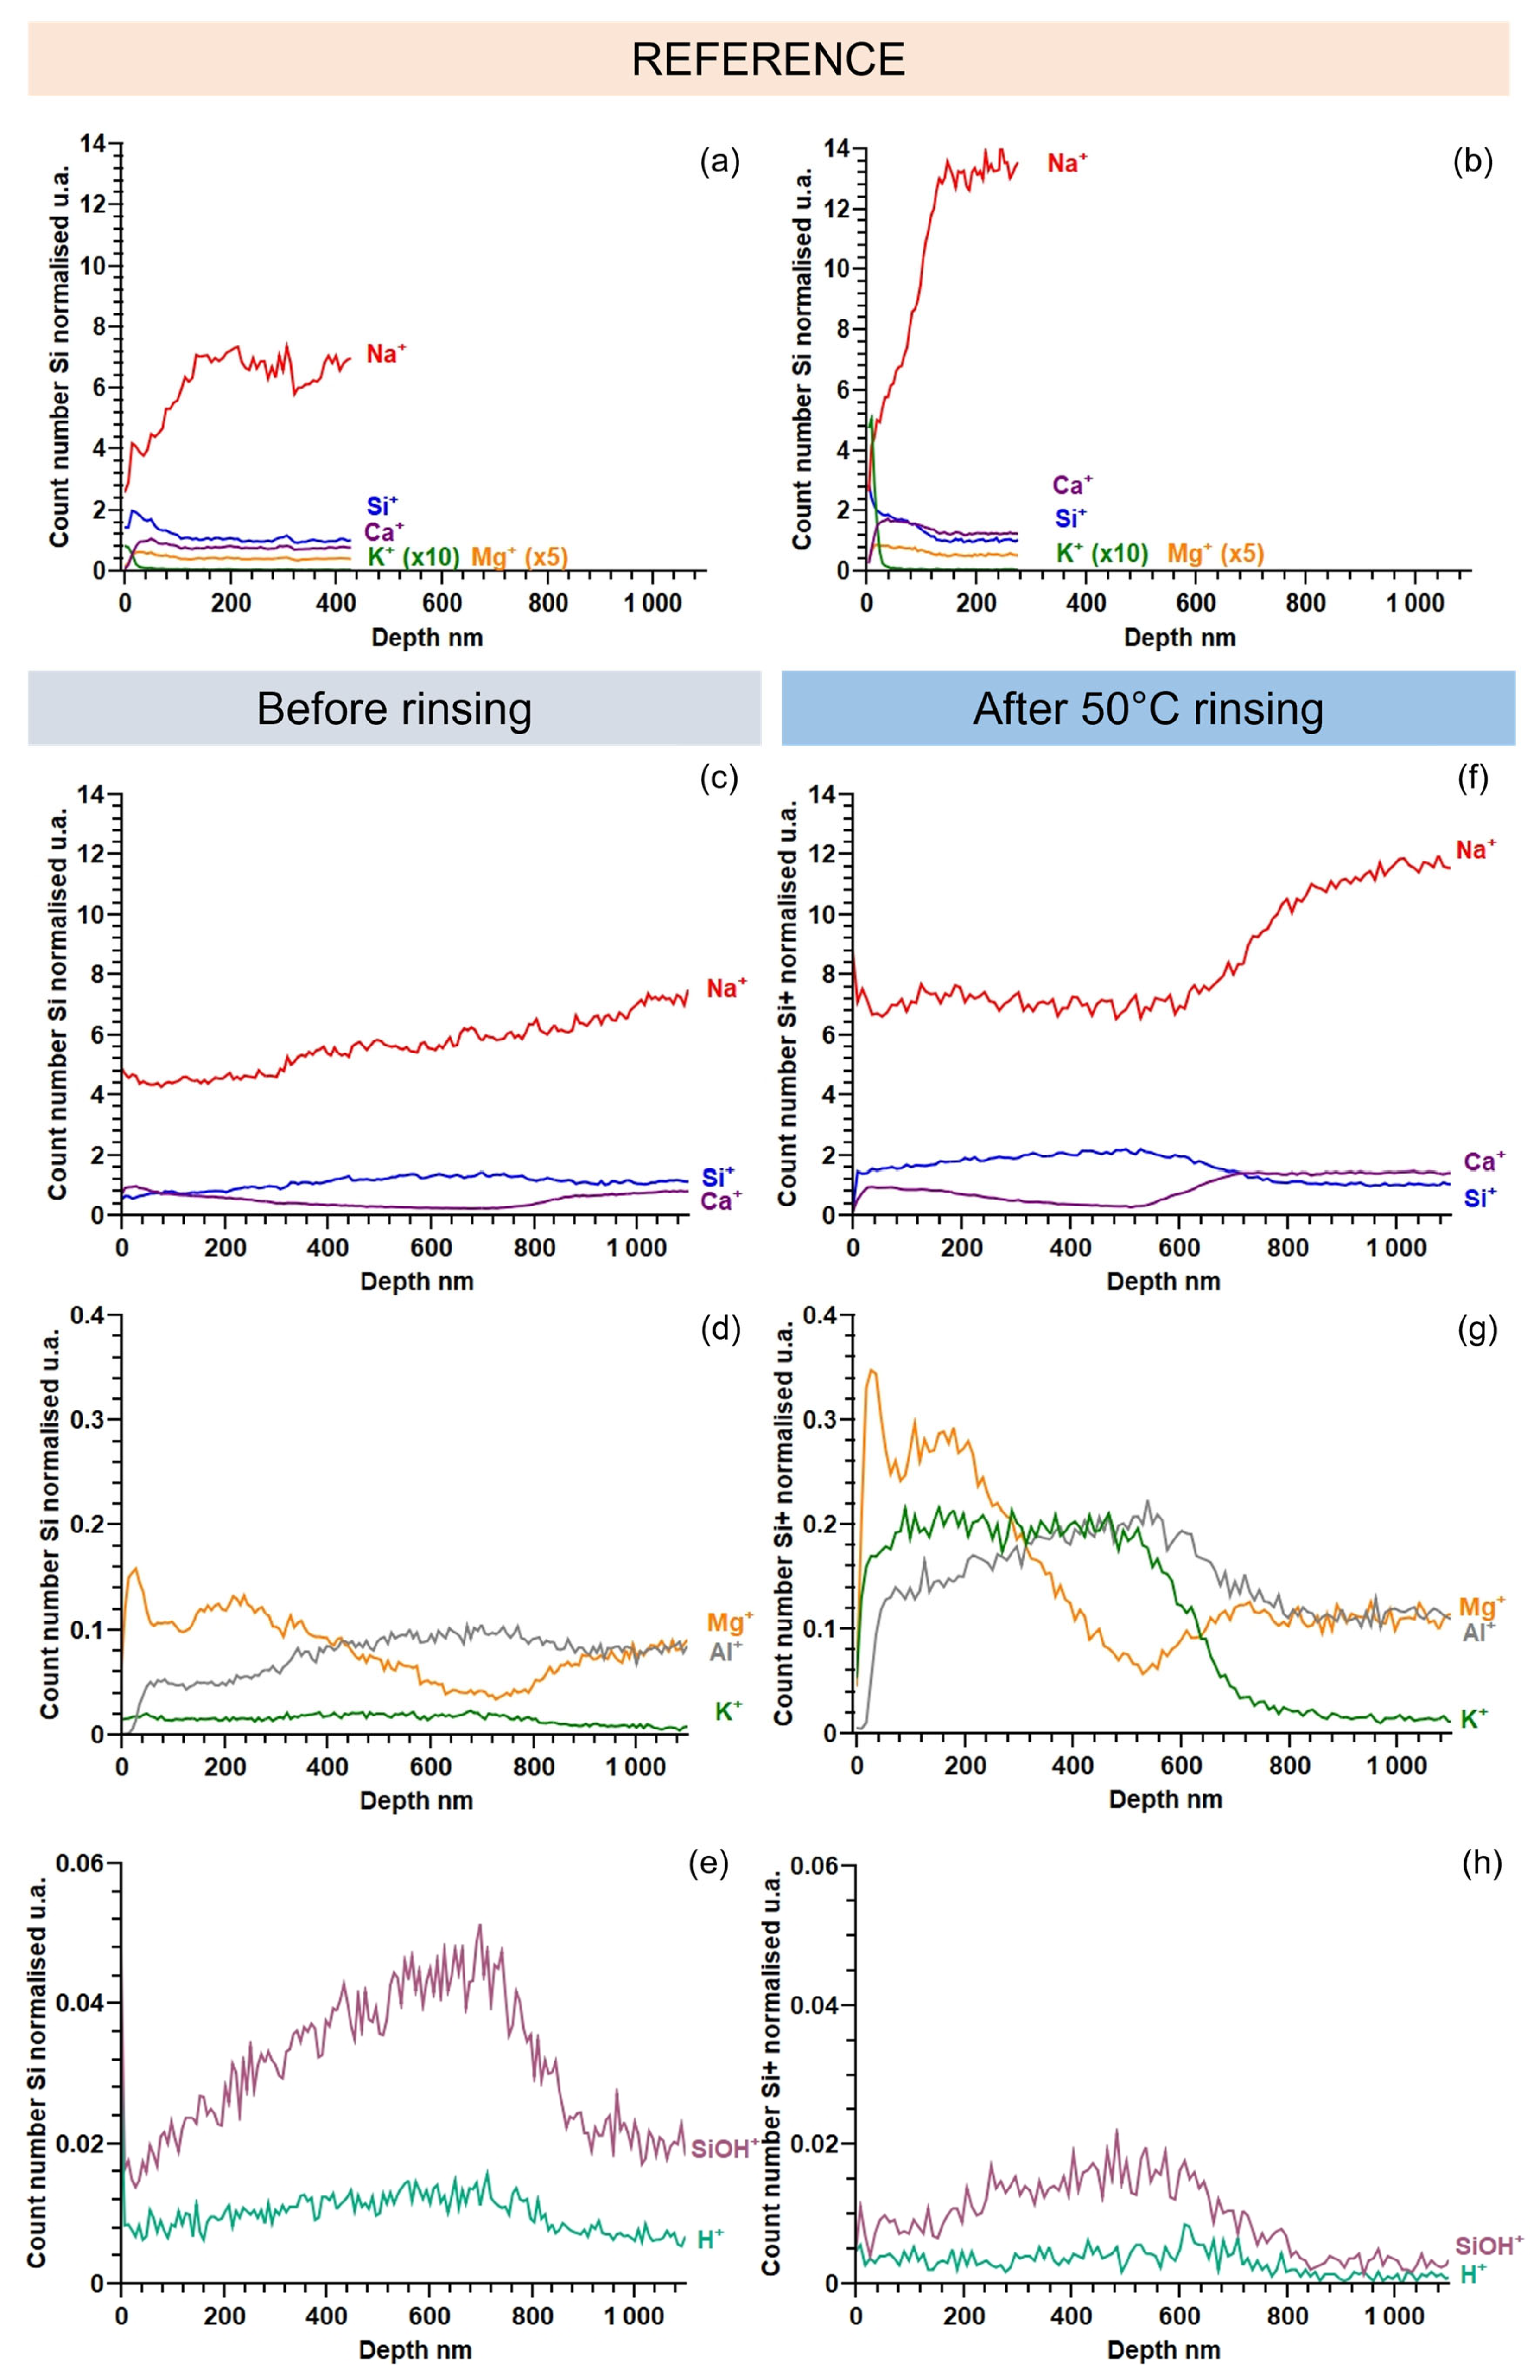
2.4.4. Chemical Analysis of the Alteration Layer
3. Results
3.1. Modifications Induced by Water Cleaning on the Altered Glass Surface
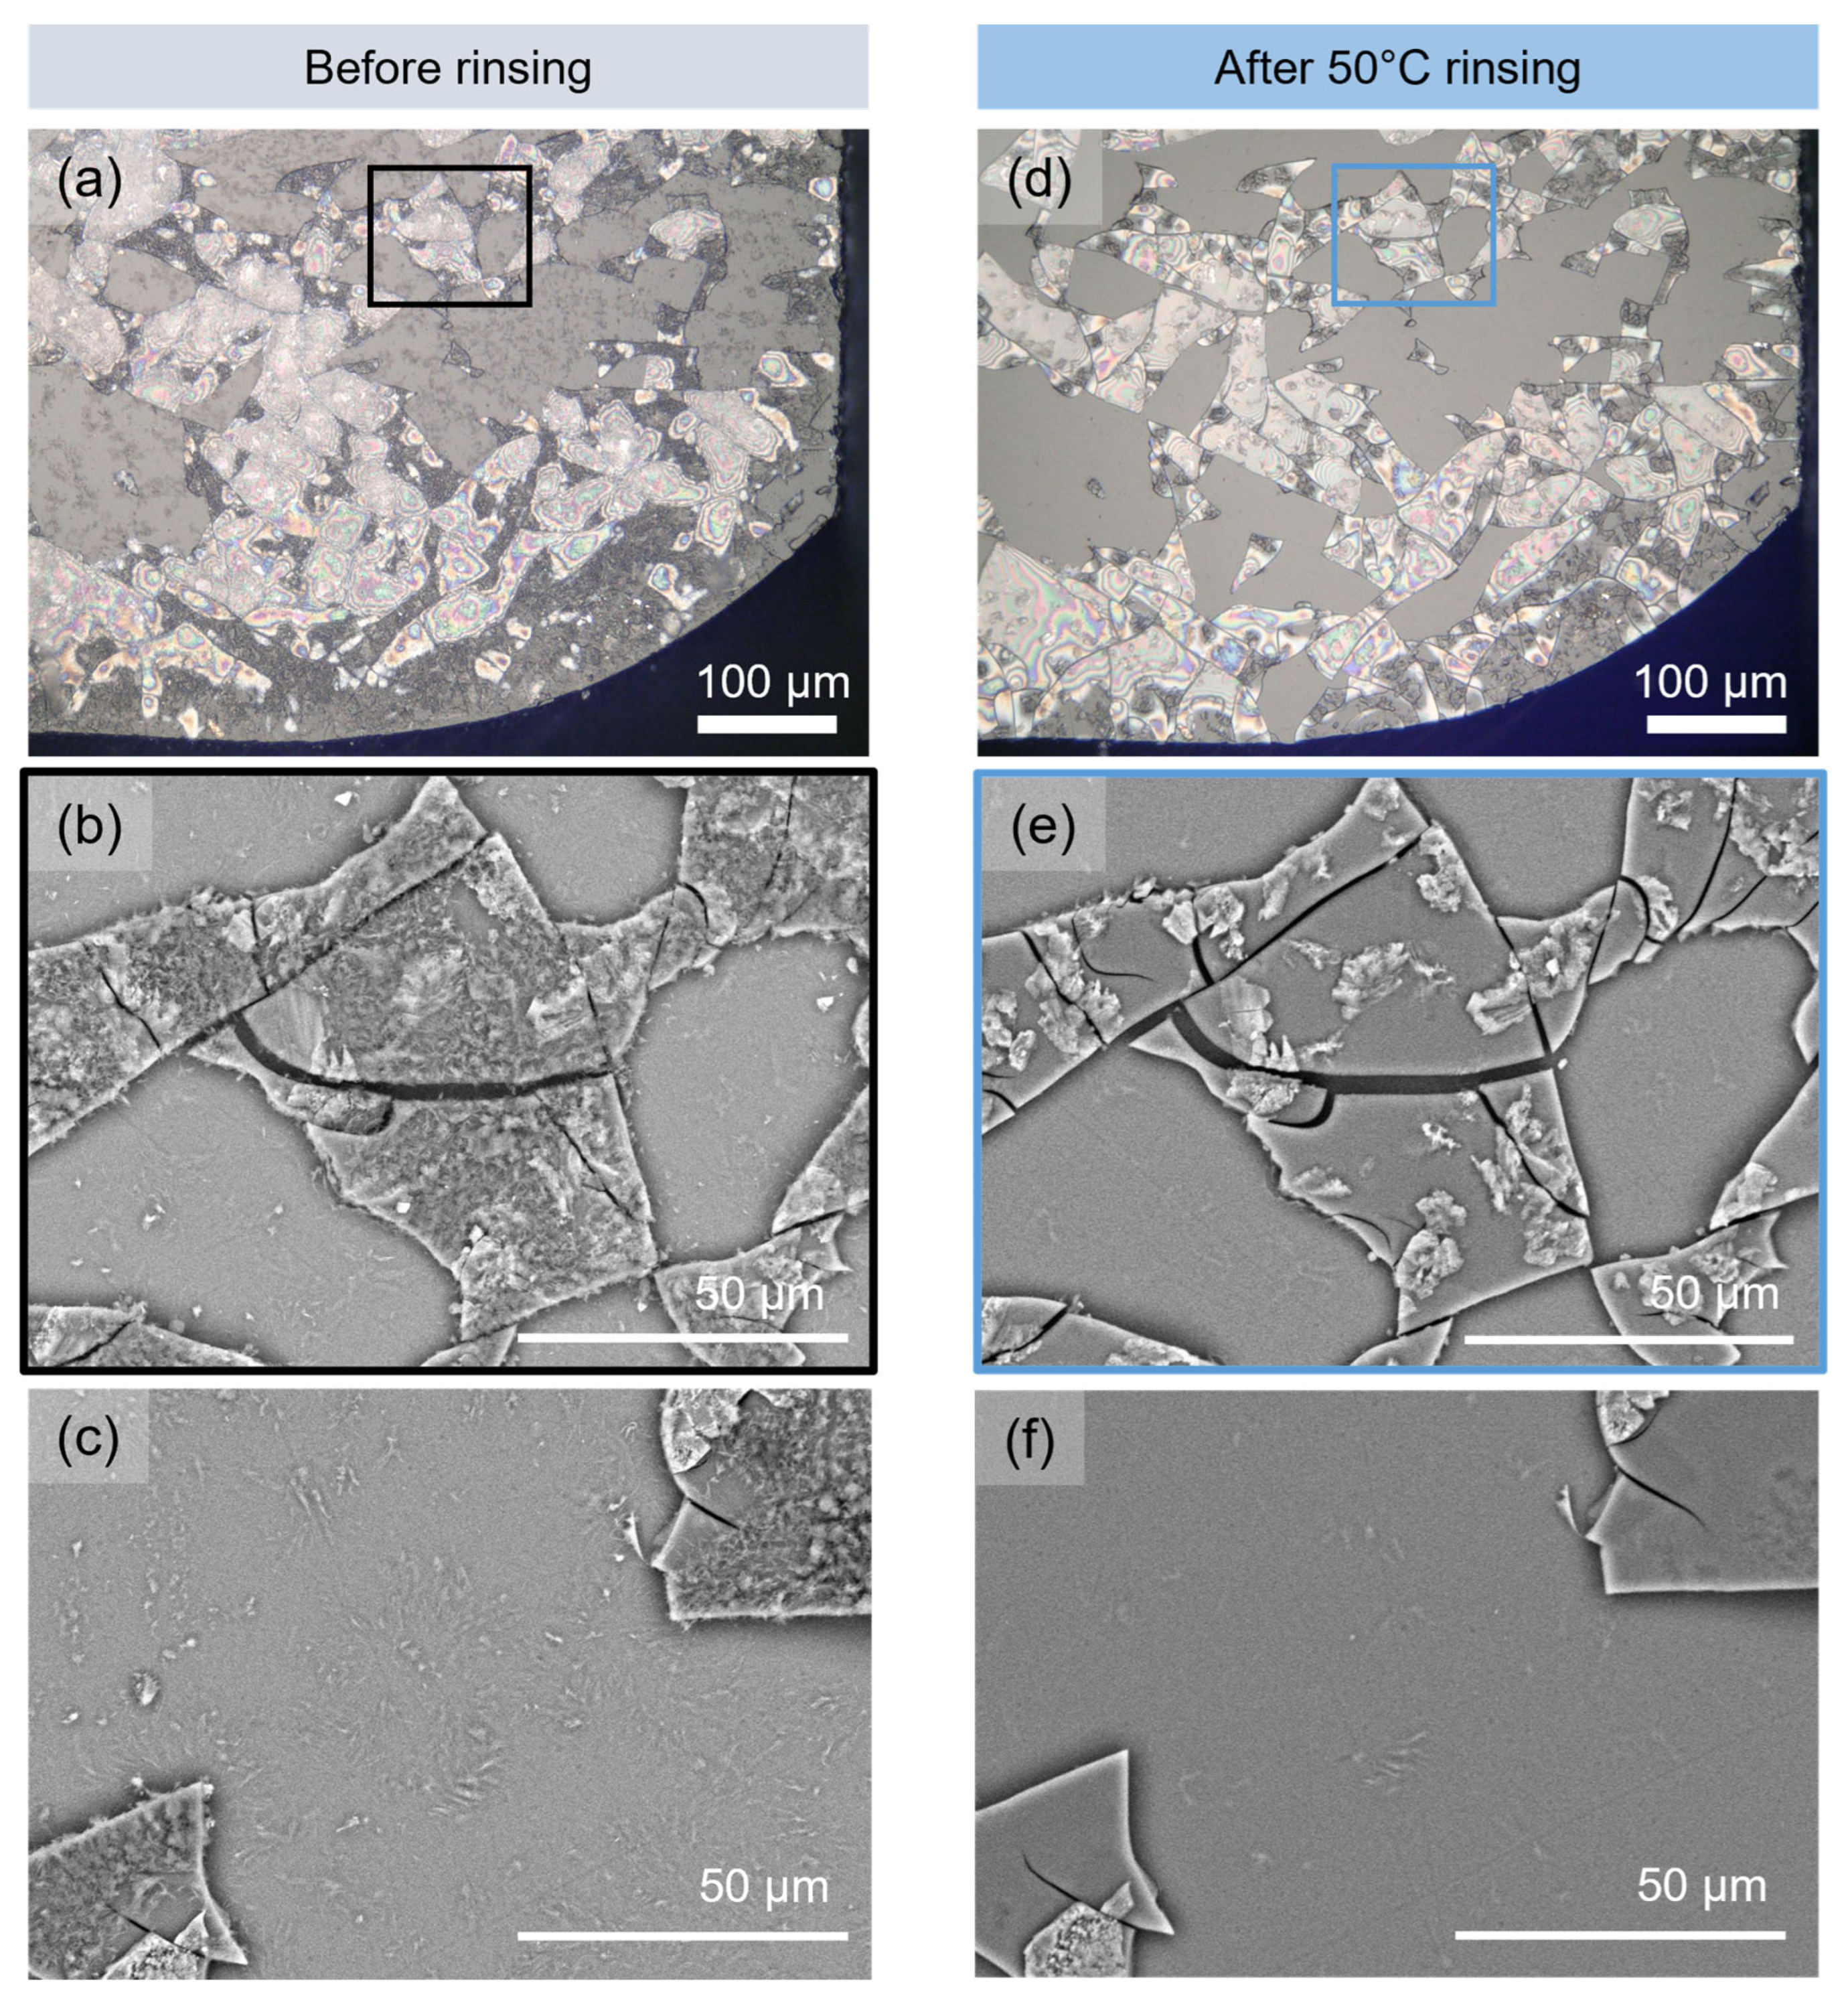
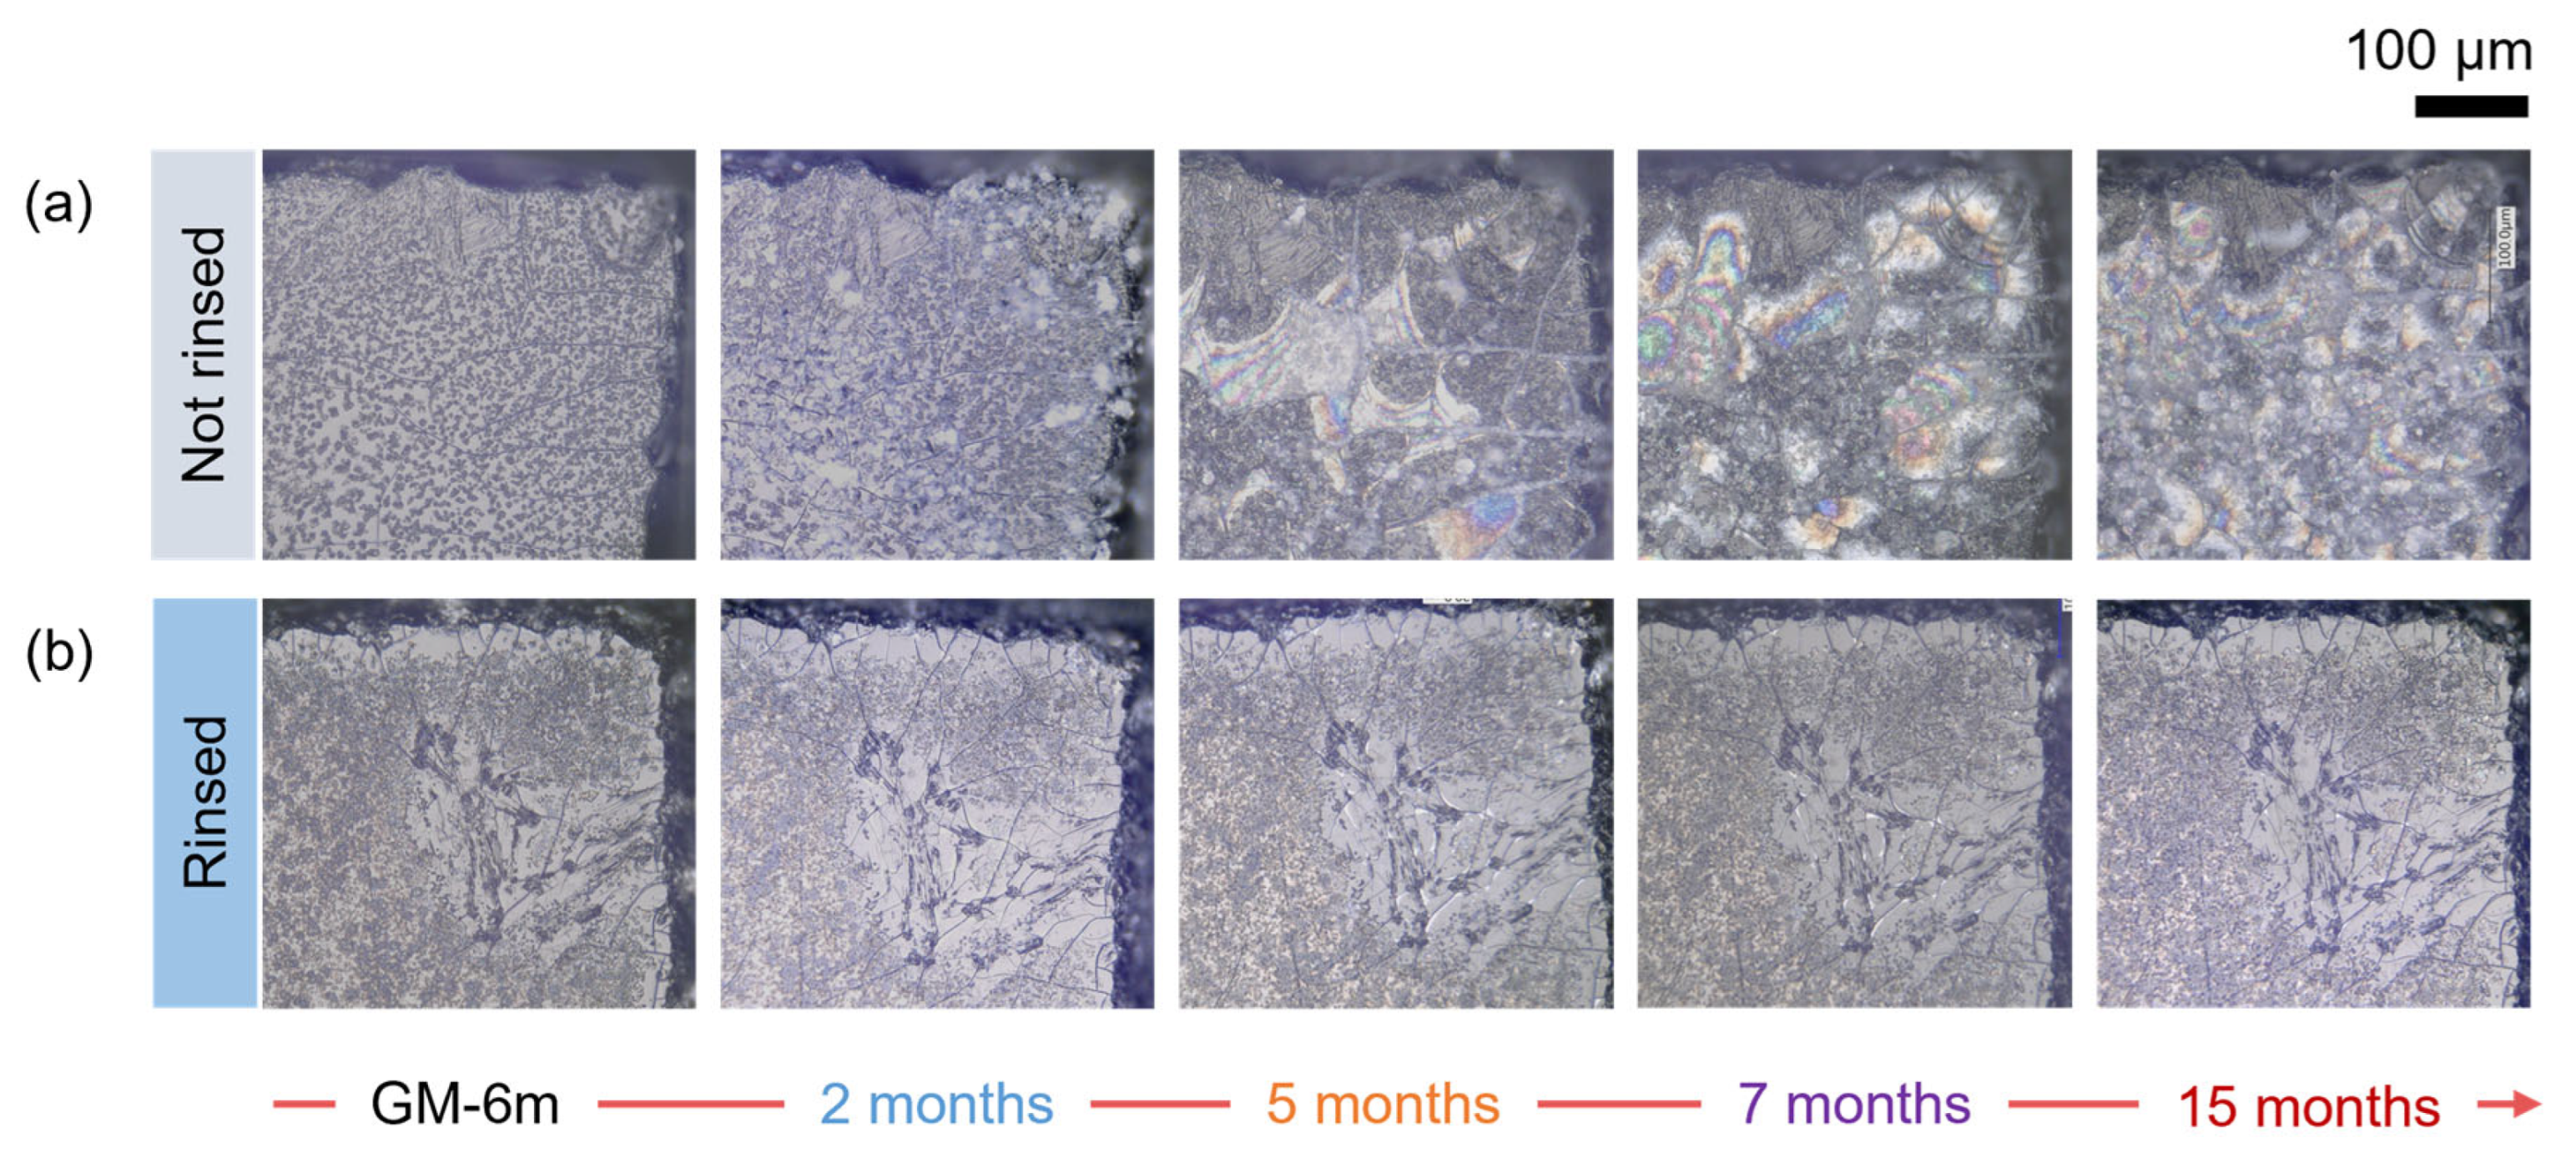
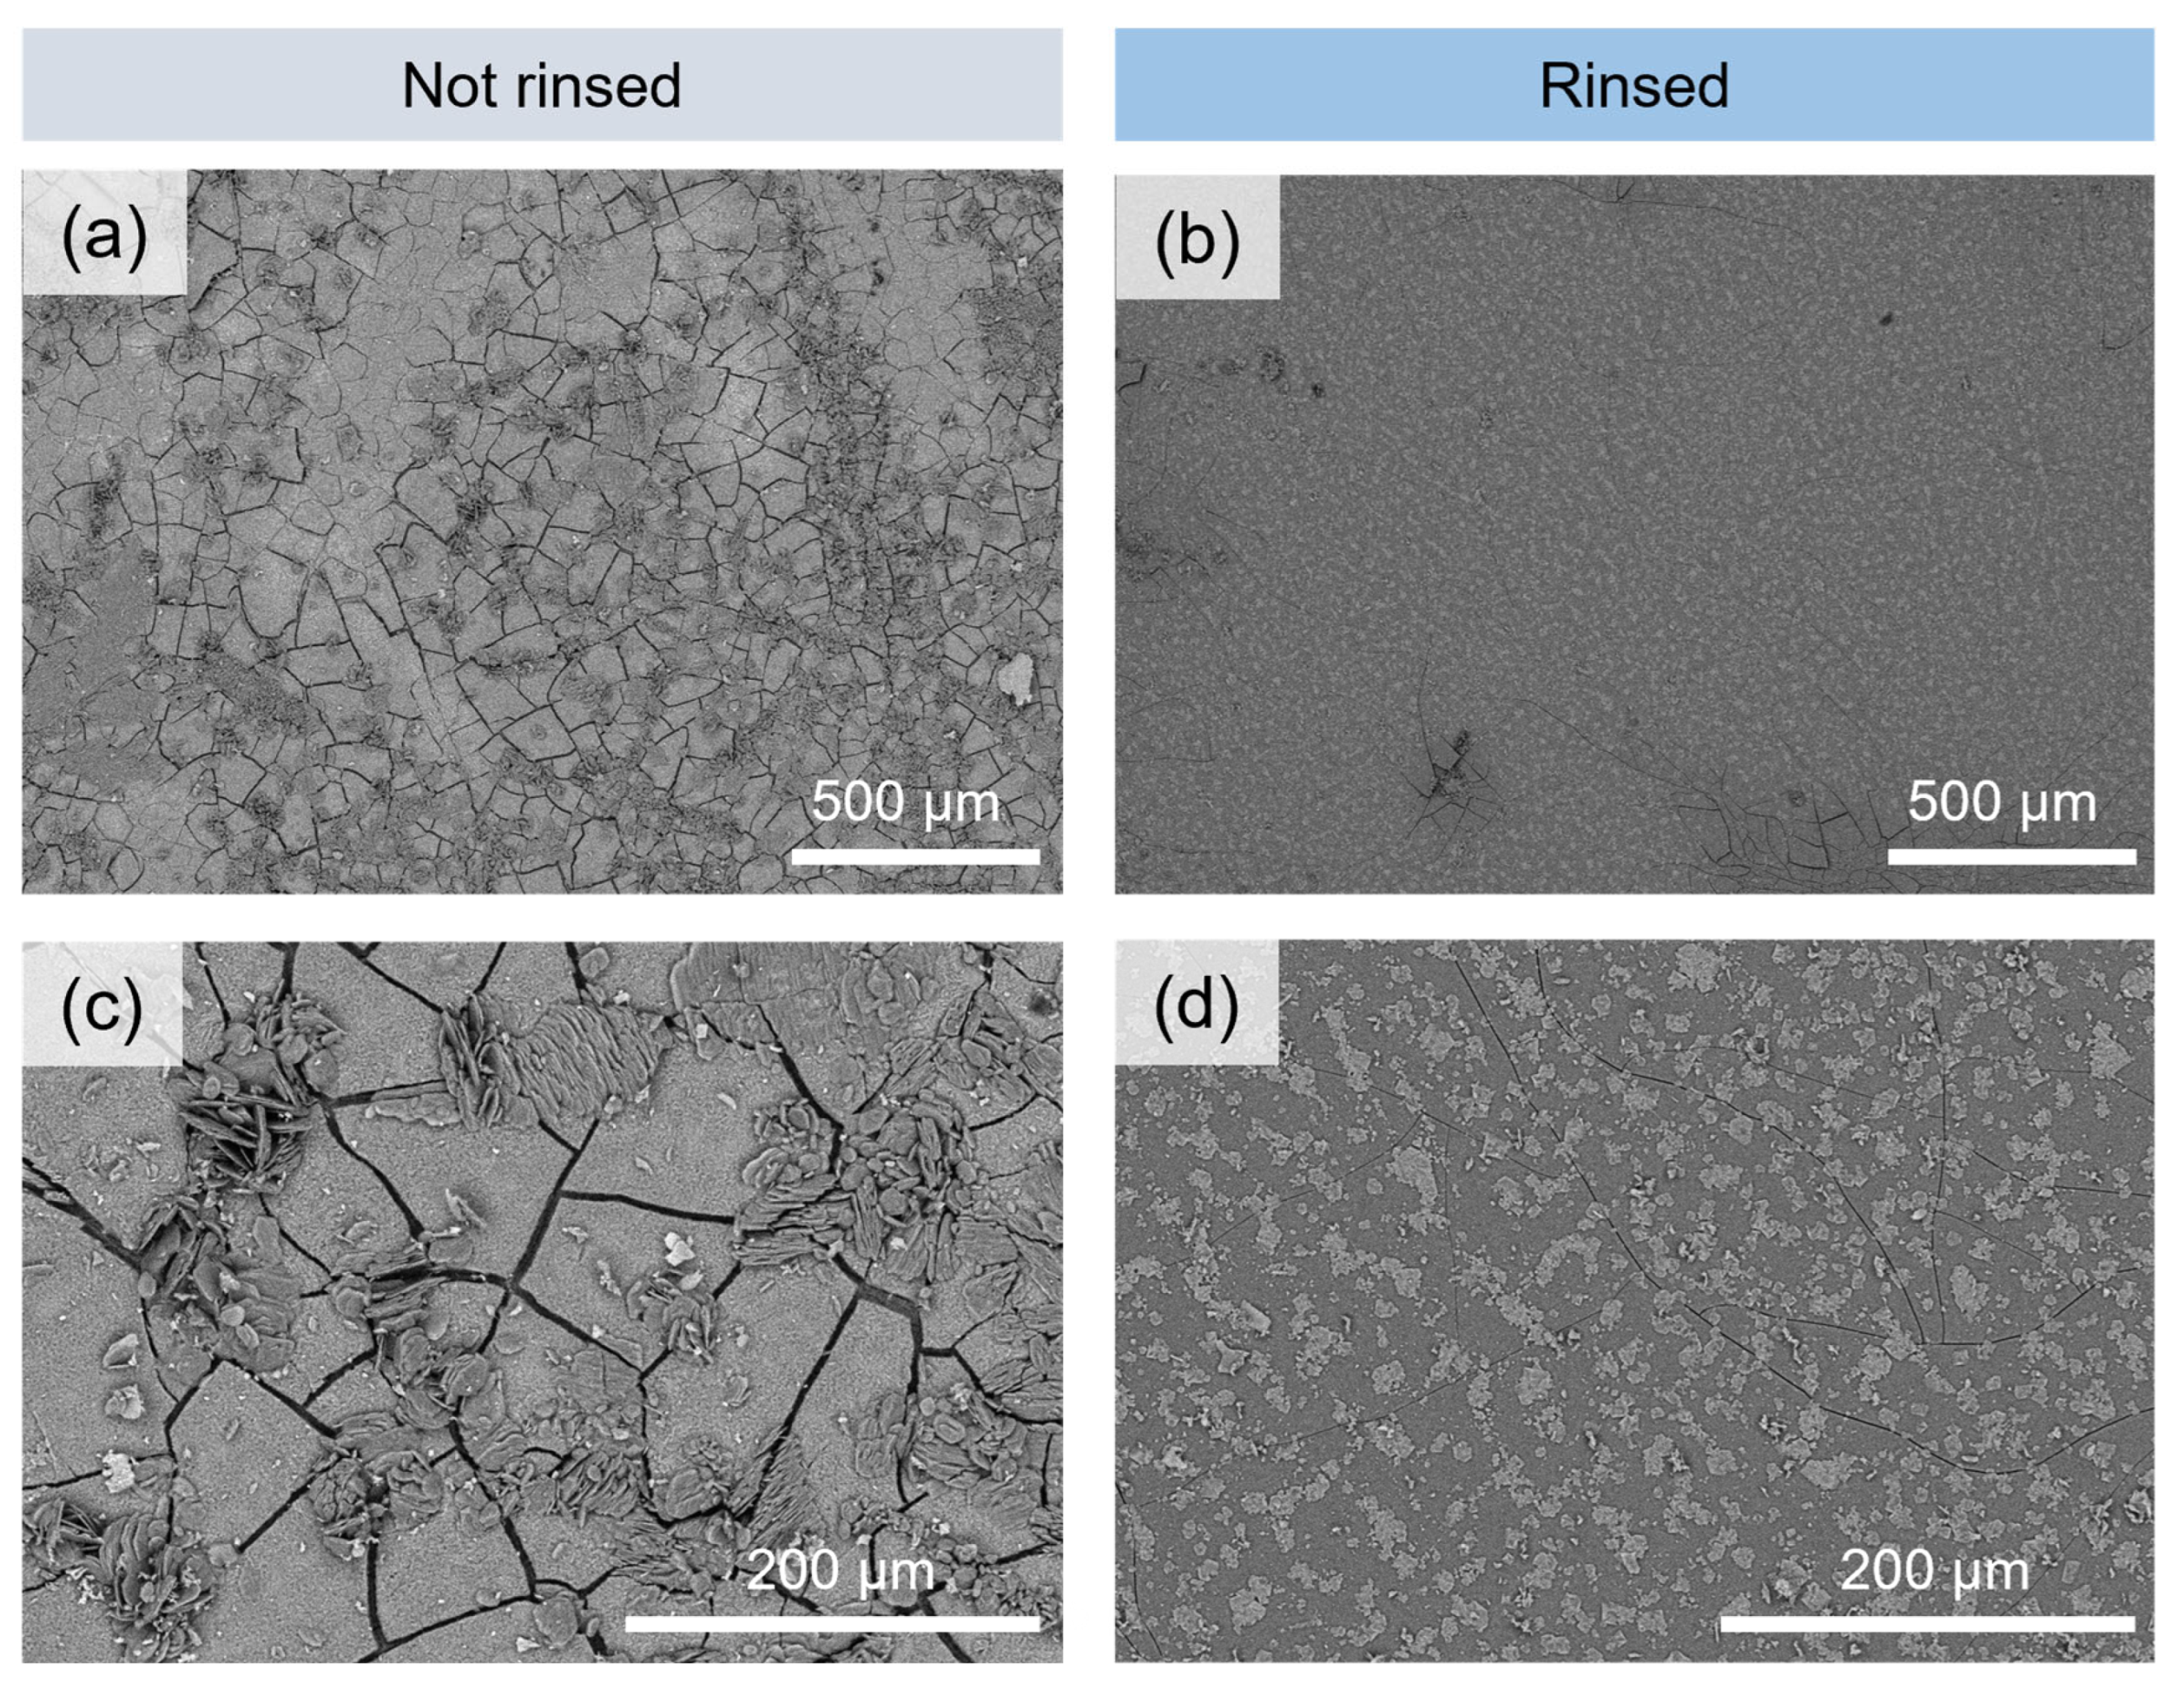
3.1.1. Microscopic Changes of the Surface State and Distribution of Salts
- Monolith samples
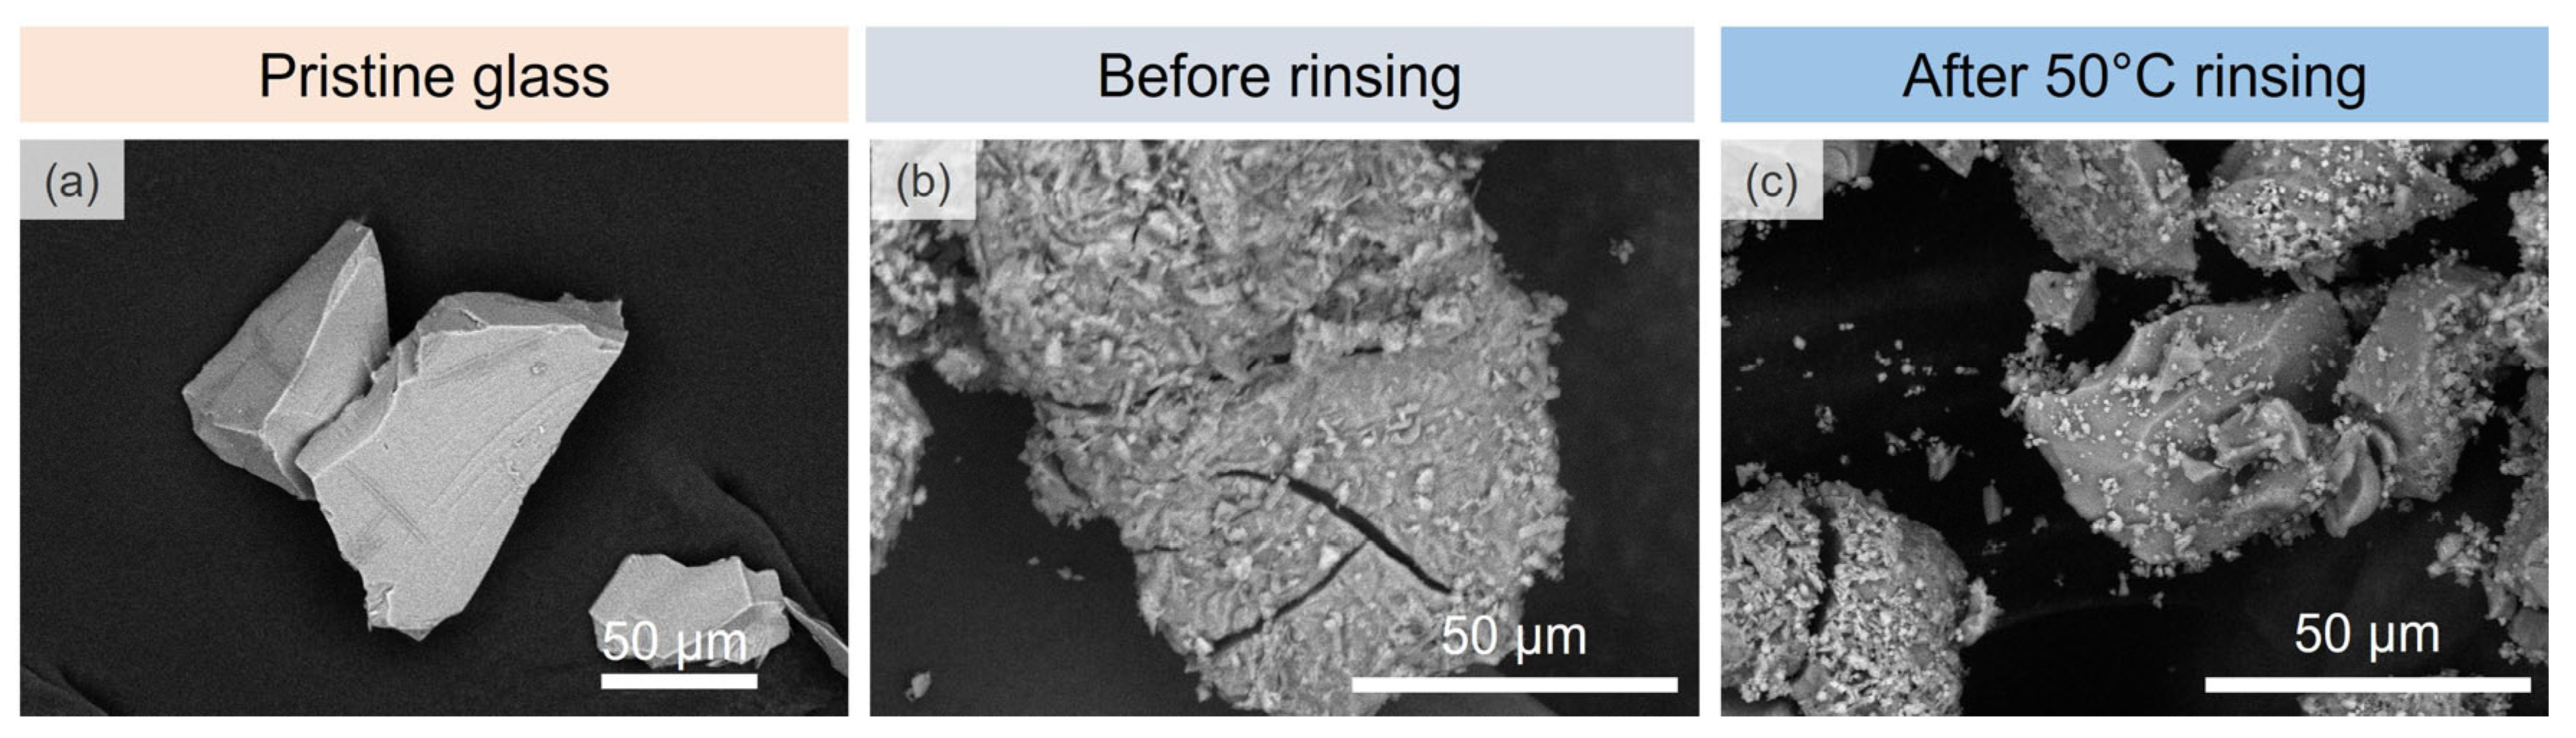
- Glass powders
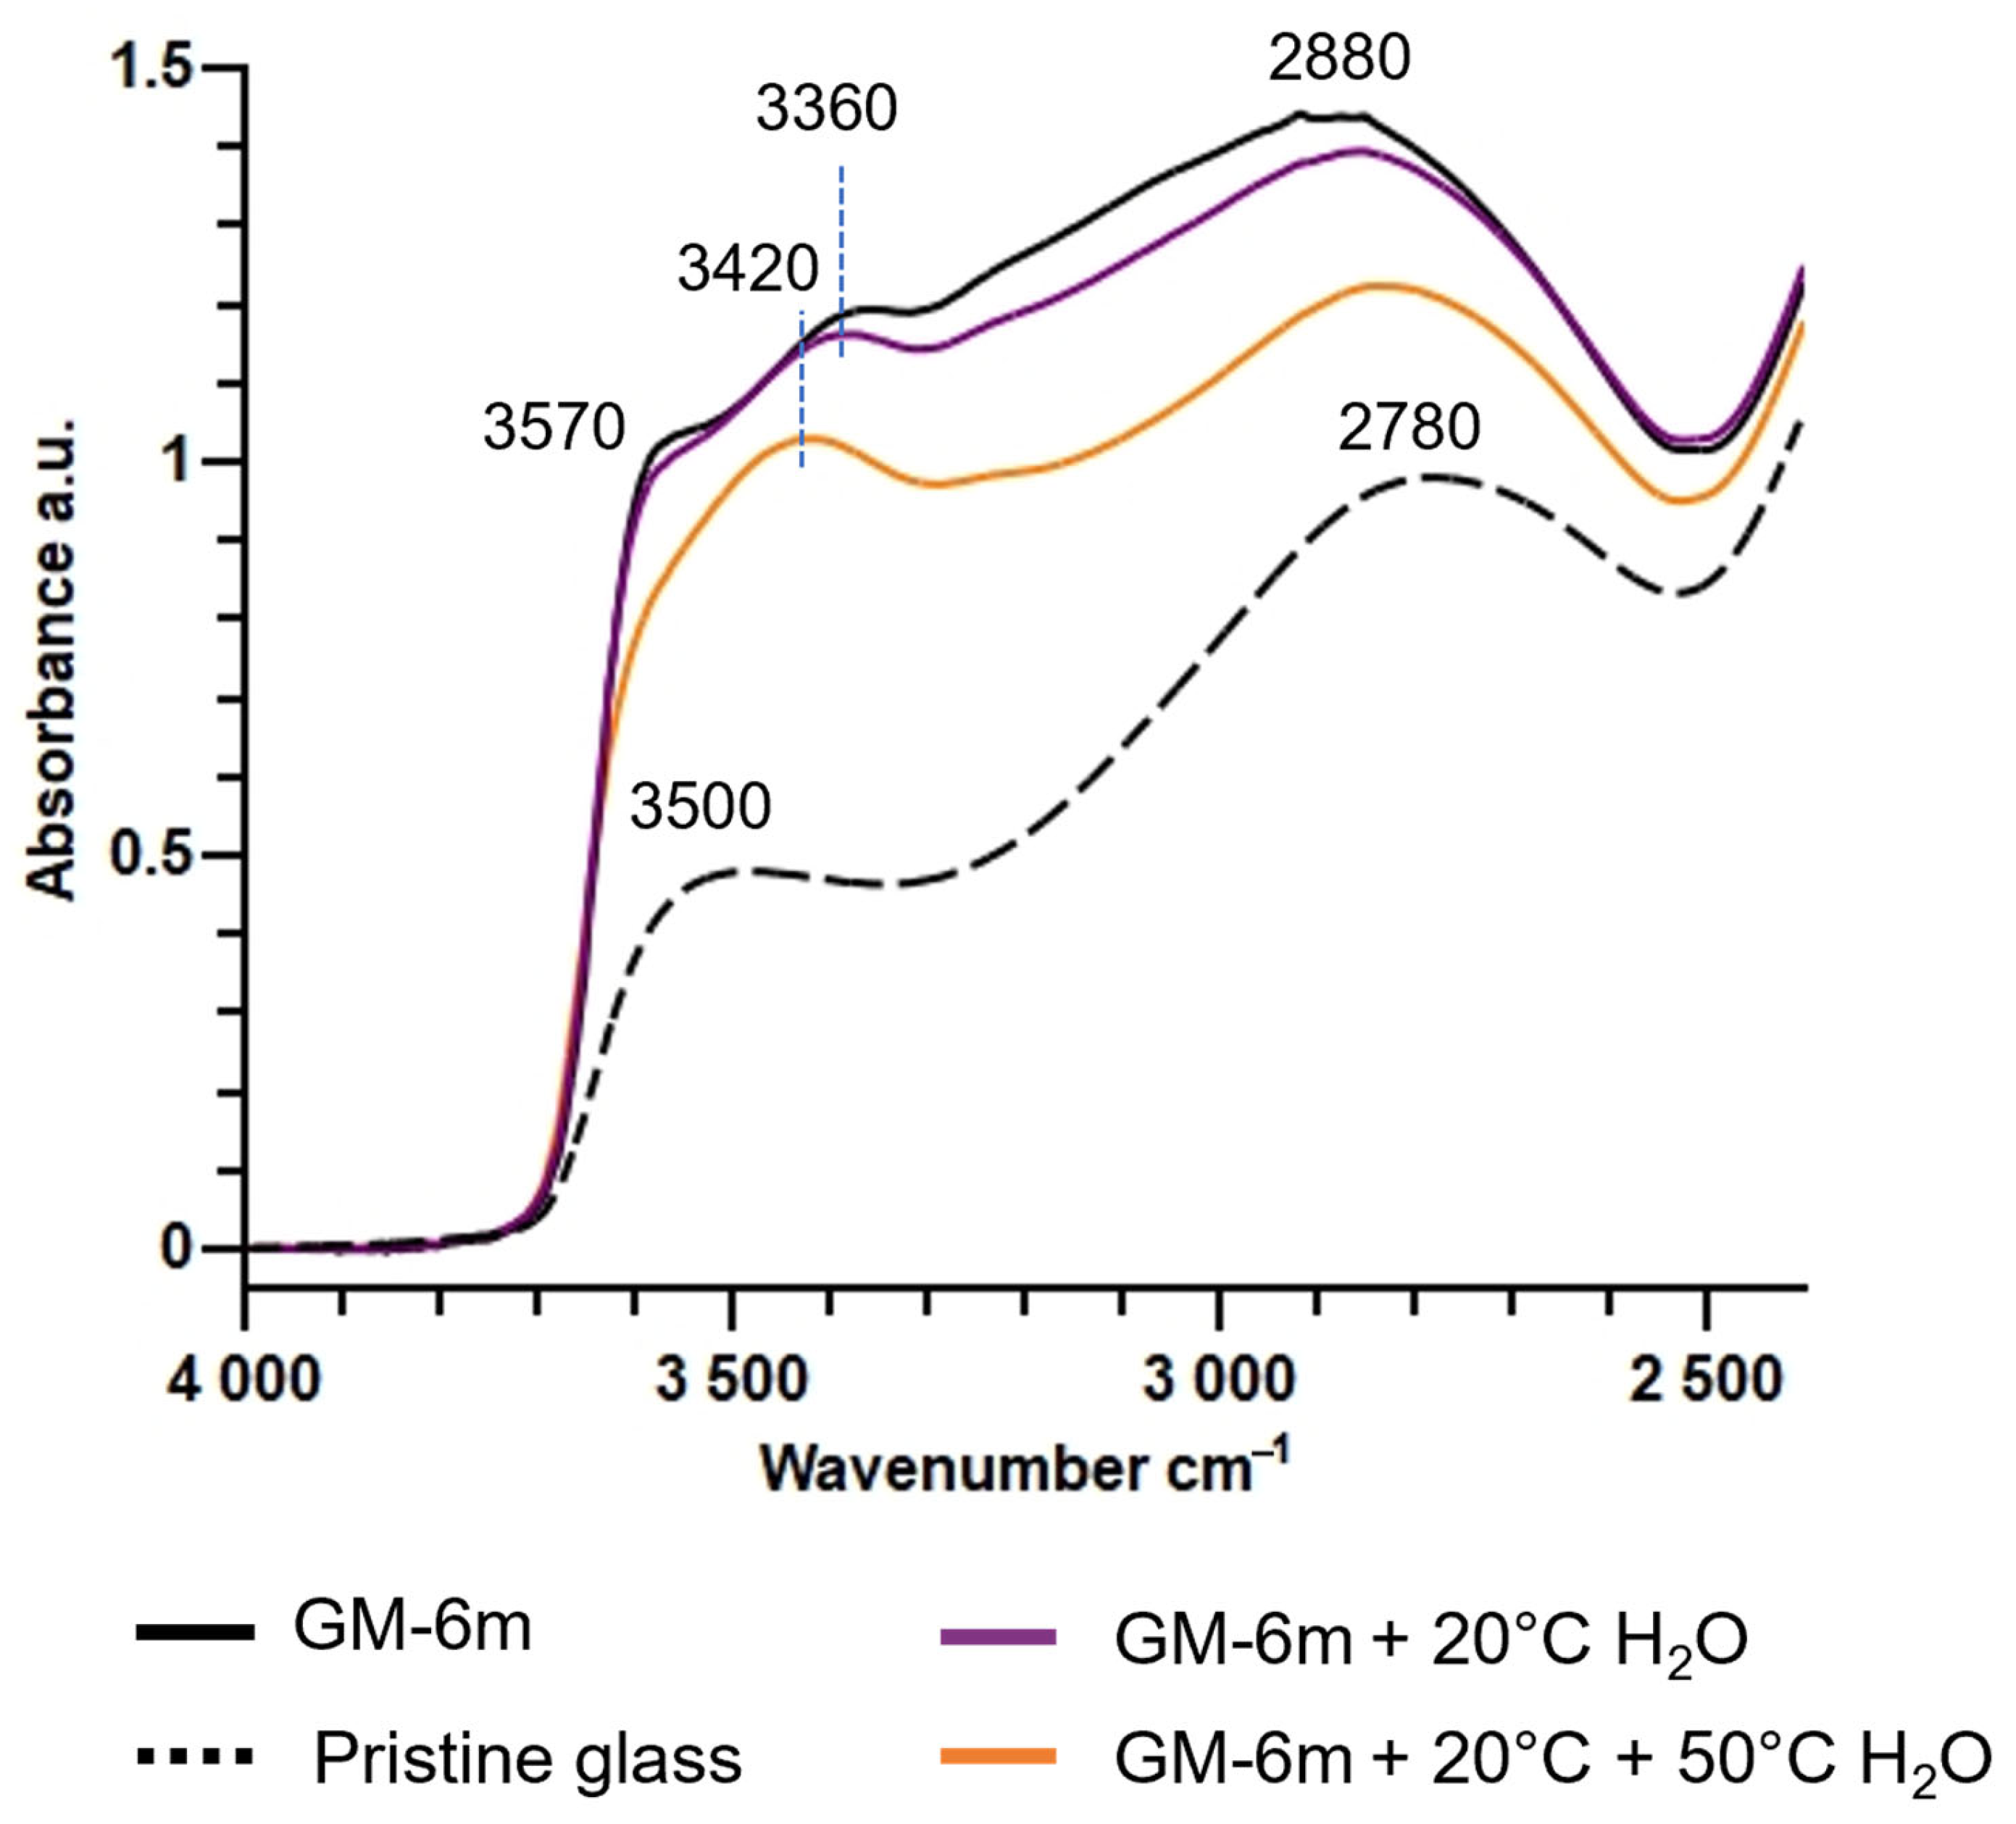
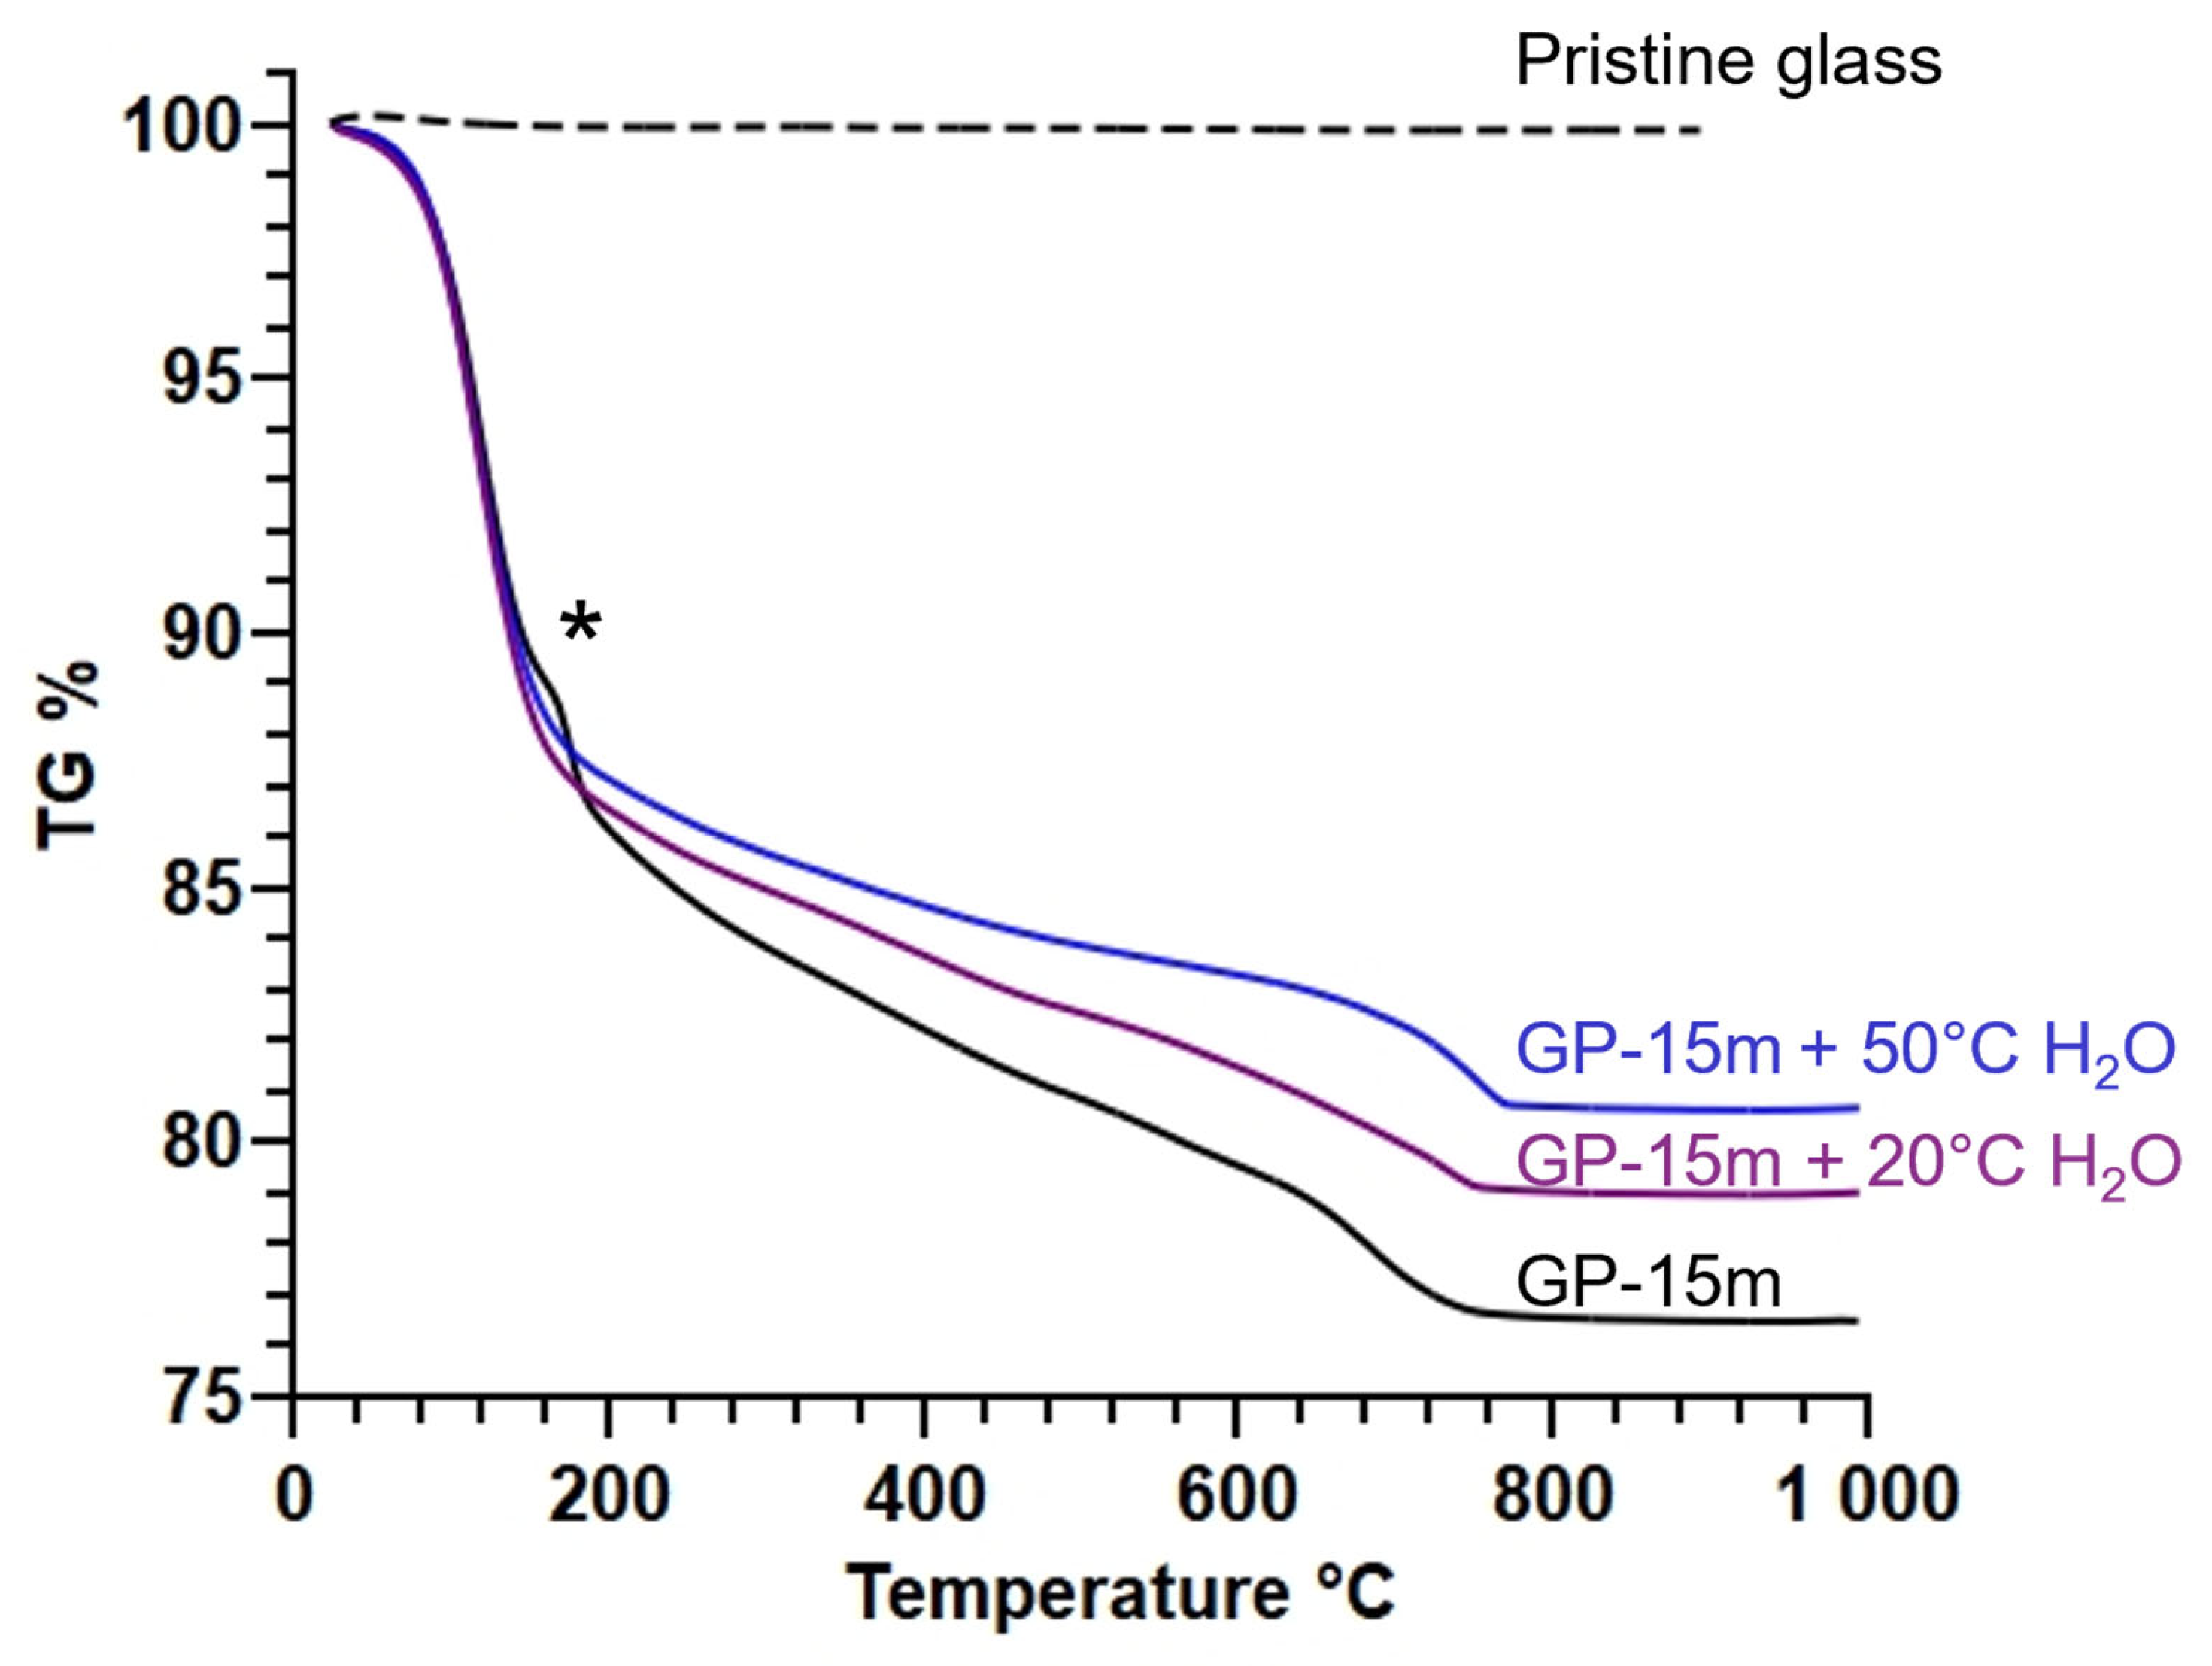
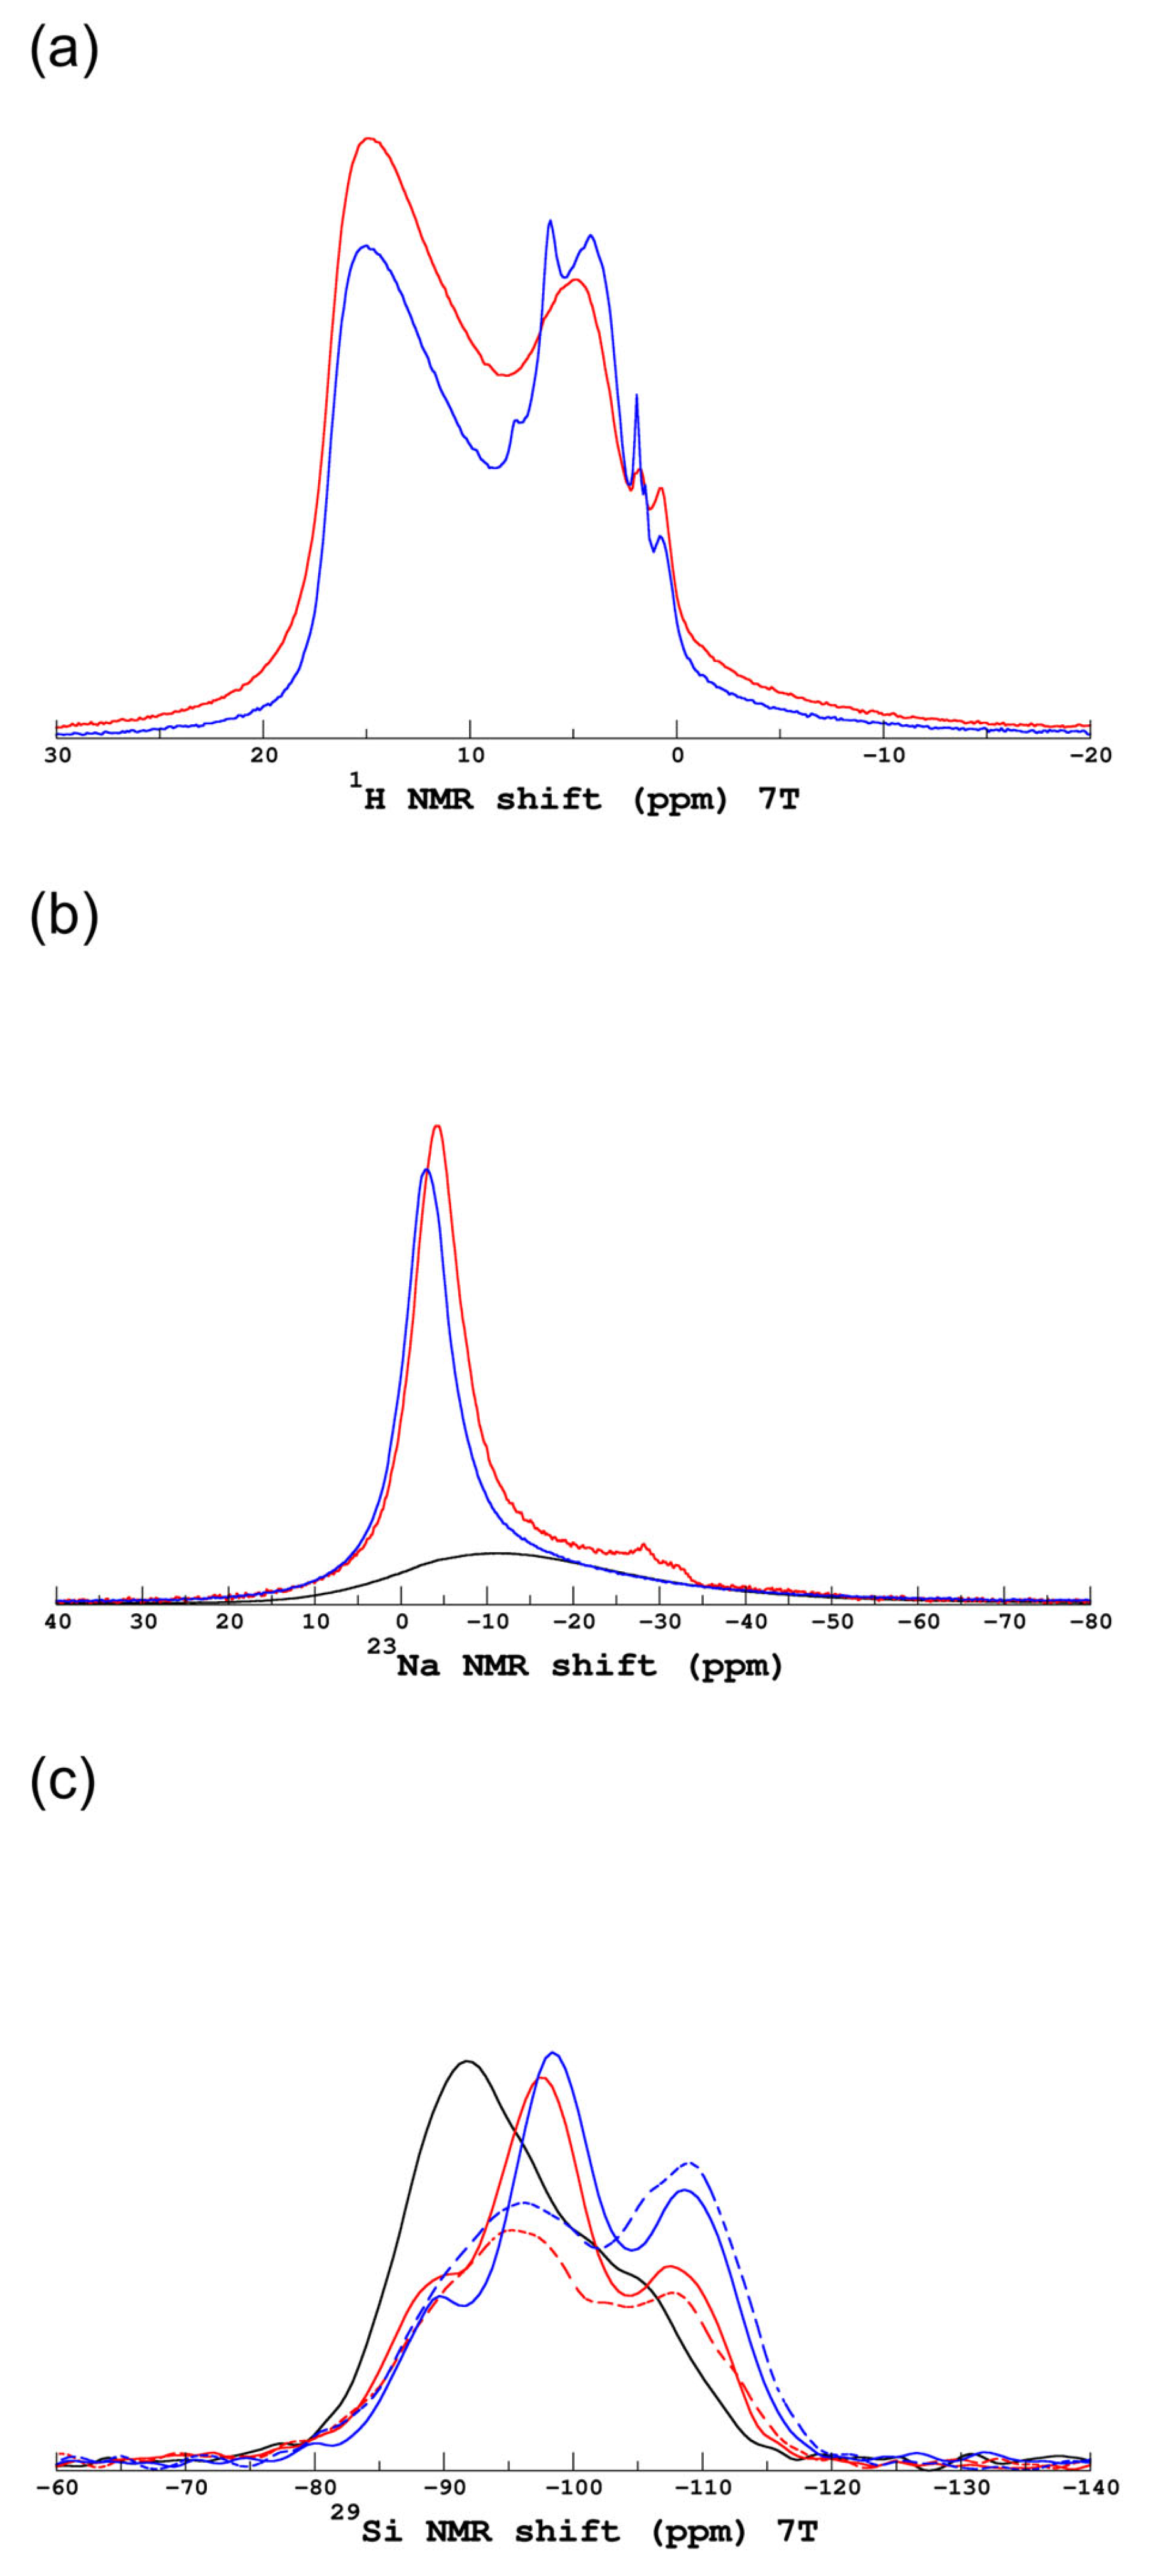
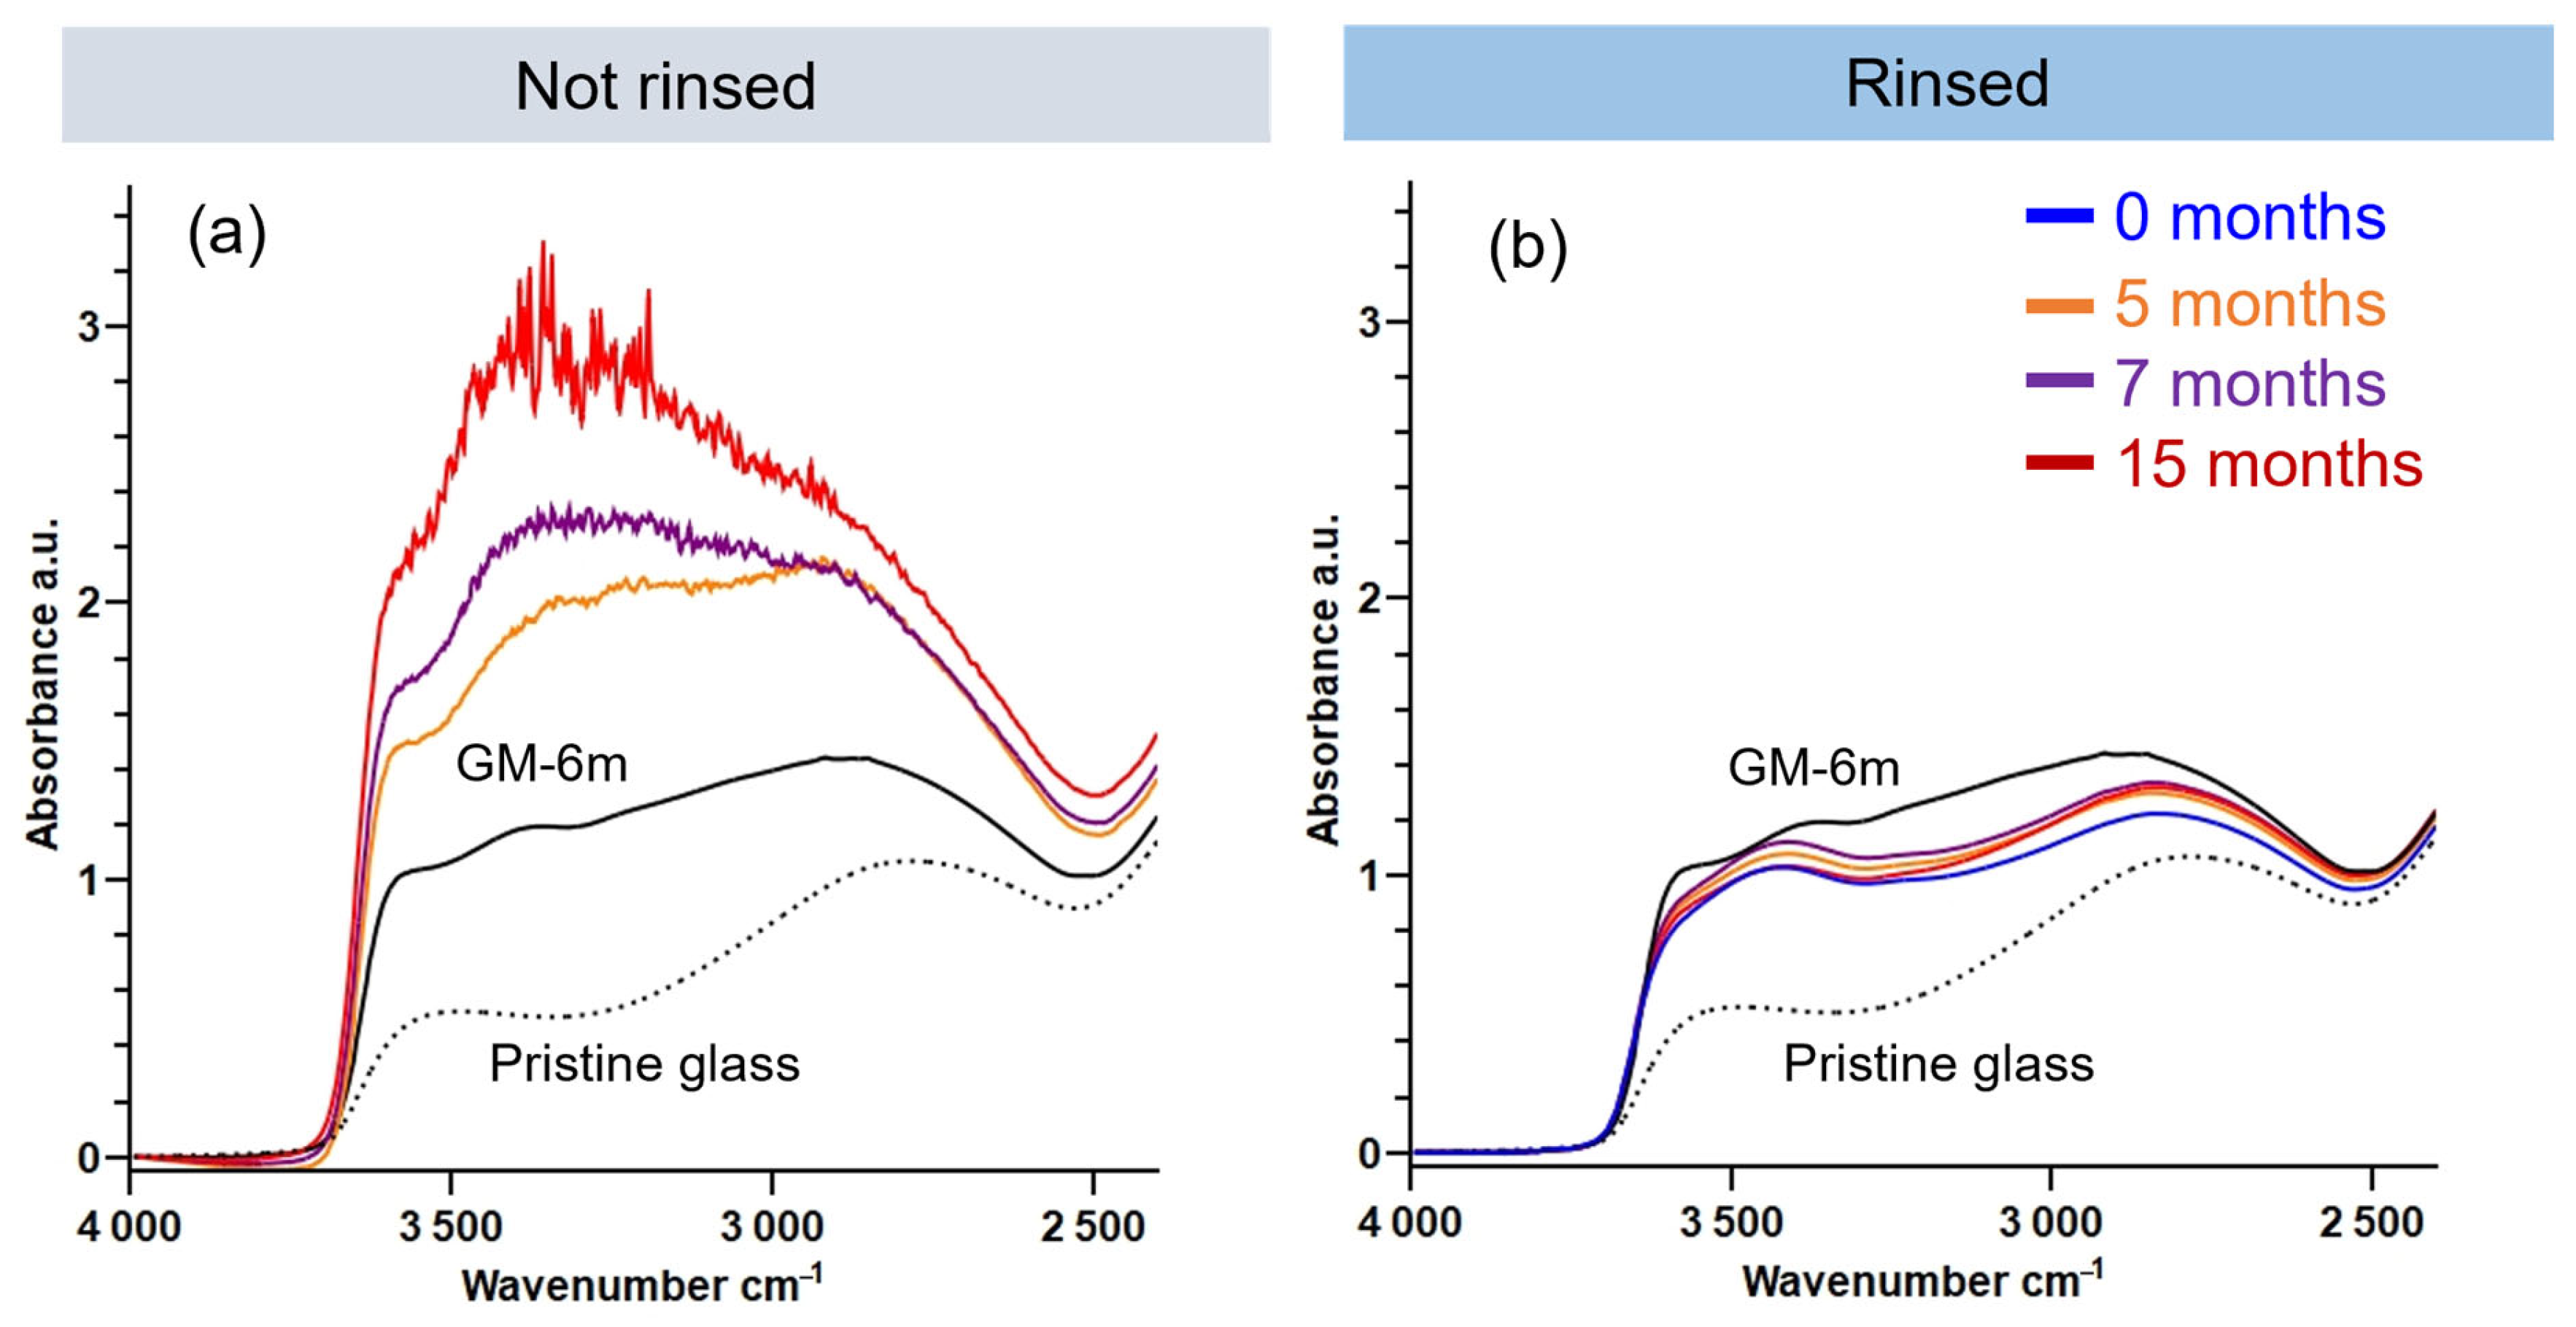
3.1.2. Evolution of the Hydrated Silicate Network
3.2. Impact of Water Cleaning on Further Atmospheric Degradation of Altered Glass
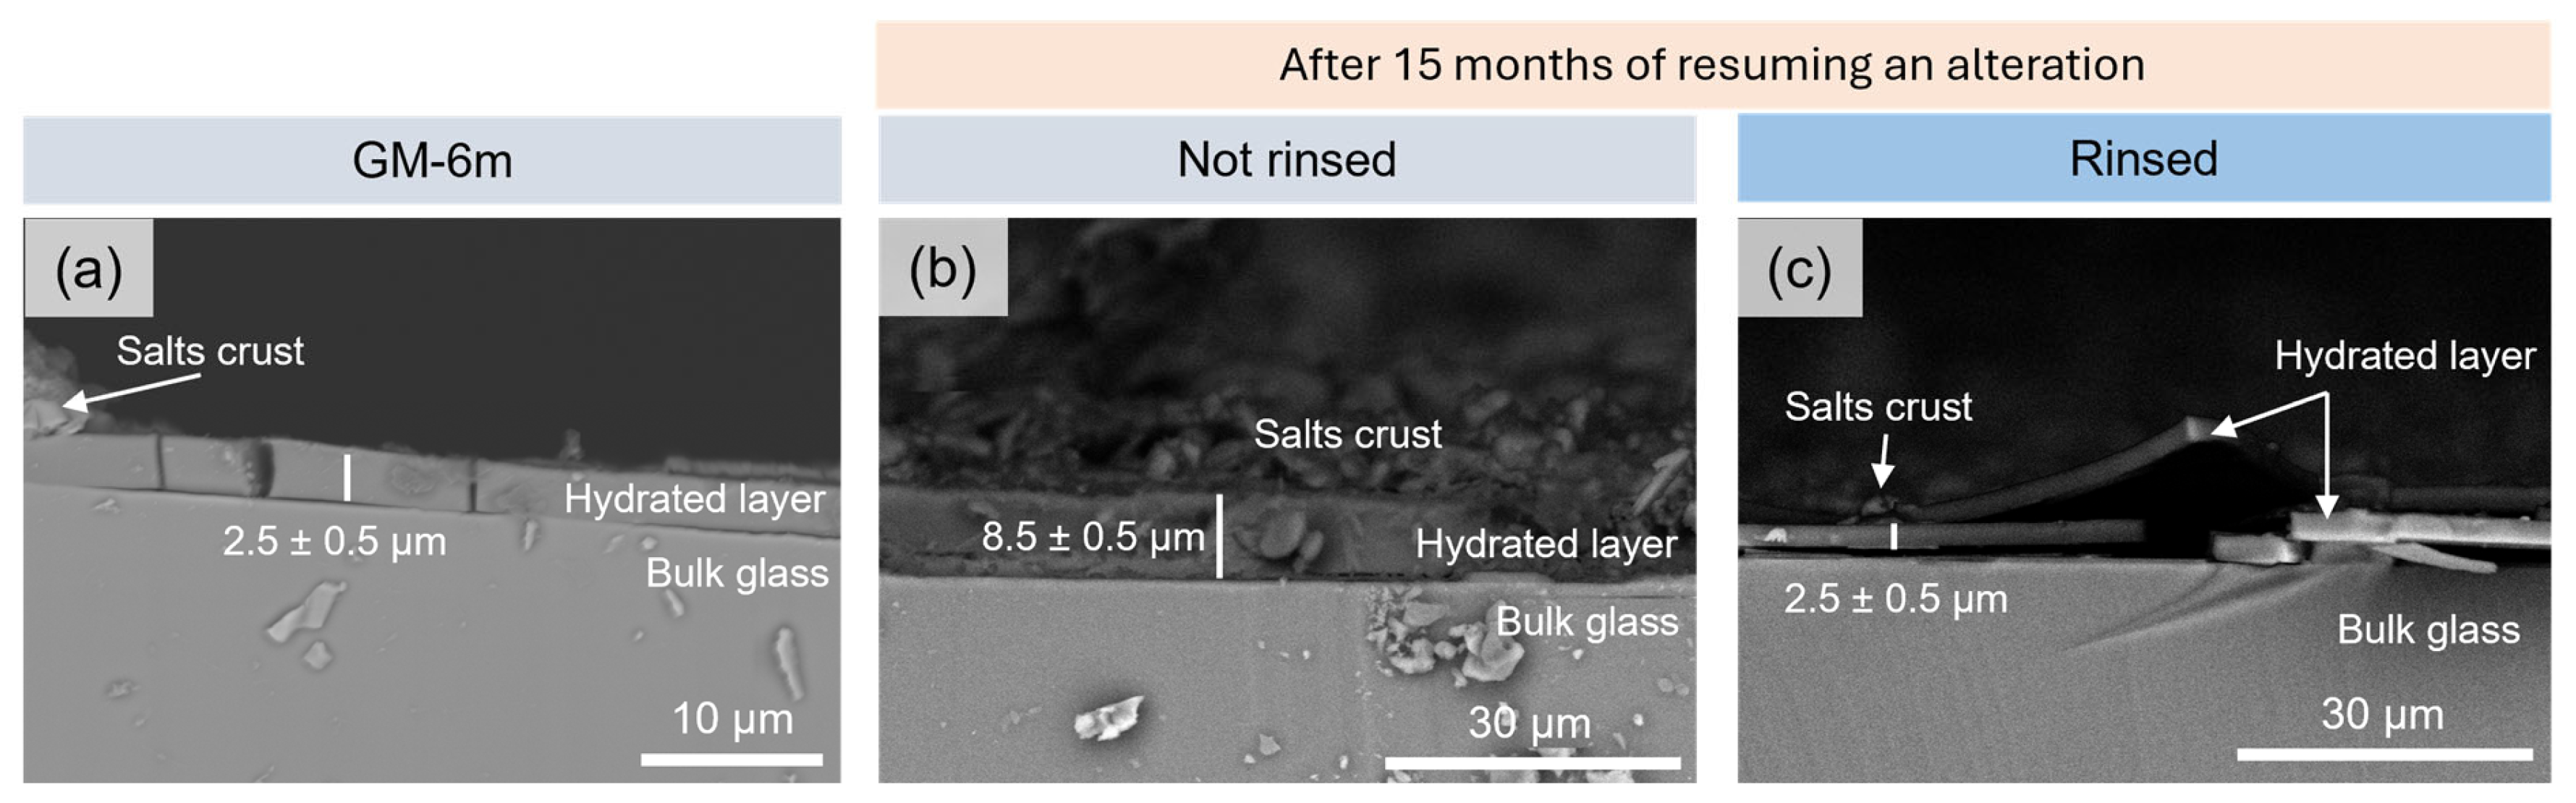
3.2.1. Evolution of the Surface State
3.2.2. Evolution of the Alteration Layer Thickness
4. Discussion
5. Conclusions
Author Contributions
Funding
Data Availability Statement
Acknowledgments
Conflicts of Interest
Abbreviations
| RH | Relative humidity |
| OM | Optical microscopy |
| SEM | Scanning electronic microscopy |
| XRD | X-Ray diffraction |
| ToF-SIMS | Time-of-flight secondary ion mass spectroscopy |
| TR-FTIR | Fourier-transform infrared spectroscopy in transmission mode |
| TGA | Thermal gravimetry analysis |
| NMR | Nuclear magnetic resonance |
| ICP-AES | Inductively coupled plasma atomic emission spectrometry |
| DTA | Differential thermal analysis |
| GM | Glass monolith |
| GP | Glass powder |
| NBO | Non-bridging oxygen |
References
- Majérus, O.; Lehuédé, P.; Biron, I.; Alloteau, F.; Narayanasamy, S.; Caurant, D. Glass Alteration in Atmospheric Conditions: Crossing Perspectives from Cultural Heritage, Glass Industry, and Nuclear Waste Management. npj Mater. Degrad. 2020, 4, 27. [Google Scholar] [CrossRef]
- Zanini, R.; Franceschin, G.; Cattaruzza, E.; Traviglia, A. A Review of Glass Corrosion: The Unique Contribution of Studying Ancient Glass to Validate Glass Alteration Models. npj Mater. Degrad. 2023, 7, 38. [Google Scholar] [CrossRef]
- Laso, E.; Aparicio, M.; Palomar, T. Influence of Humidity in the Alteration of Unstable Glasses. Int. J. Appl. Glass Sci. 2024, 15, 88–103. [Google Scholar] [CrossRef]
- Koob, S.P. Conservation and Care of Glass Objects; Archetype Publication: London, UK, 2006; ISBN 978-1-904982-08-1. [Google Scholar]
- Kunicki-Goldfinger, J.J. Unstable Historic Glass: Symptoms, Causes, Mechanisms and Conservation. Rev. Conserv. 2008, 9, 47–60. [Google Scholar] [CrossRef]
- Oakley, V. Vessel Glass Deterioration at the Victoria and Albert Museum: Surveying the Collection. Conservator 1990, 14, 30–36. [Google Scholar] [CrossRef]
- Kunicki-Goldfinger, J.J.; Kierzek, J.; Malozewska-Bucko, B.; Kasprzak, A.J. Some Observations on Crizzled Glass (Preliminary Results of a Survey of 18th Century Central European Tableware). Glass Technol. 2002, 43C, 364–368. [Google Scholar]
- Robinet, L. The Role of Organic Pollutants in the Alteration of Historic Soda Silicate Glasses. Ph.D. Thesis, University of Edinburgh, Edinburgh, UK, 2006. [Google Scholar]
- Koob, S.P. Crizzling Glasses: Problems and Solutions. Eur. J. Glass Sci. Technol. A 2012, 53, 225–227. [Google Scholar]
- Alloteau, F.; Majérus, O.; Valbi, V.; Biron, I.; Lehuédé, P.; Caurant, D.; Charpentier, T.; Seyeux, A. Evidence for Different Behaviors of Atmospheric Glass Alteration as a Function of Glass Composition. npj Mater. Degrad. 2020, 4, 36. [Google Scholar] [CrossRef]
- Fontaine-Hodiamont, C. La verre ancien: Principes de conservation, d’exposition et d’entretien. In Vade-Mecum Pour la Protection et L’entretien du Patrimoine Artistique; Royal Institue for Cultural Heritage (KIK-IRPA): Brussels, Belgium, 2018; p. 28. [Google Scholar]
- Davison, S.; Newton, R.G. Conservation and Restoration of Glass, 2nd ed.; Conservation of Glass; Taylor and Francis: Hoboken, NJ, USA; London, UK, 2008; ISBN 978-0-08-056931-4. [Google Scholar]
- Palomar, T.; García-Patrón, N.; Pastor, P. Spanish Royal Glasses with Crizzling in Historical Buildings. The Importance of Environmental Monitoring for Their Conservation. Build. Environ. 2021, 202, 108054. [Google Scholar] [CrossRef]
- Justino de Lima, C.; Aldinger, B.; de Haan, P.; Bristogianni, T.; Veer, F. Effects of Composition on the Durability and Weathering of Flat Glass. Glass Struct. Eng. 2022, 7, 139–155. [Google Scholar] [CrossRef]
- Bange, K.; Anderson, O.; Rauch, F.; Lehuédé, P.; Rädlein, E.; Tadokoro, N.; Mazzoldi, P.; Rigato, V.; Matsumoto, K.; Farnworth, M. Multi-Method Characterization of Soda-Lime Glass Corrosion, Part 2. Corrosion in Humidity. Glass Sci. Technol. 2002, 75, 20–33. [Google Scholar]
- Centenaro, S.; Franceschin, G.; Cattaruzza, E.; Traviglia, A. Consolidation and Coating Treatments for Glass in the Cultural Heritage Field: A Review. J. Cult. Herit. 2023, 64, 132–143. [Google Scholar] [CrossRef]
- Lombardo, T.; Rothenhaeusler, U.; Sharma, D.; George, S.; Schmidt-Ott, K. Application of Hyperspectral Imaging to Evaluate Cleaning Methods for Corroded Glass. In Book of Abstracts, 6th International Conference on Innovation in Art Research and Technology; Archaeopress Archaeology: Oslo, Norway, 2024; p. 74. ISBN 978-1-80327-742-4. [Google Scholar]
- Bailly, M. En Verre et Malgré Tout” or the Daily Task of Glass Conservation in a French Museum Context: The Conservator’s Point of View. In Glass Atmospheric Alteration—Cultural Heritage, Industrial and Nuclear Glasses; Hermann: Paris, France, 2019; pp. 134–140. [Google Scholar]
- Verita, M. Ancient Glass and Modern Glass: Long and Short Term Glass Weathering. In Glass Atmospheric Alteration—Cultural Heritage, Industrial and Nuclear Glasses; Hermann: Paris, France, 2019; pp. 73–80. [Google Scholar]
- Gamarra, C.; Van Bennekom, J.; Creange, S.; Verhaar, G. Summary of Initial Investigations into the Effects of Conservation Treatments on Degrading Limoges Enamels at the Rijksmusuem? In Glass Atmospheric Alteration—Cultural Heritage, Industrial and Nuclear Glasses; Hermann: Paris, France, 2019; pp. 151–155. [Google Scholar]
- Abd-Allah, R. Chemical Cleaning of Soiled Deposits and Encrustations on Archaeological Glass: A Diagnostic and Practical Study. J. Cult. Herit. 2013, 14, 97–108. [Google Scholar] [CrossRef]
- O’Hern, R. Red, Blue, and Wound All over: Evaluating Condition Change and Cleaning of Glass Disease on Beads. AIC Objects Spec. Group Postprints 2014, 21, 205–228. [Google Scholar]
- Biron, I.; Alloteau, F.; Lehuédé, P.; Majérus, O.; Caurant, D. Glass Atmospheric Alteration: Cultural Heritage, Industrial and Nuclear Glasses; La nature de l’oeuvre; Hermann: Paris, France, 2019; ISBN 978-2-7056-9794-5. [Google Scholar]
- Koob, S.P. Cleaning Glass: A Many-Faceted Issue. AIC Objects Spec. Group Postprints 2004, 11, 60–70. [Google Scholar]
- Drayman-Weisser, T. The Early Painted Enamels of Limoges in the Walters Art Museum: Historical Context and Observations on Pasttreatments. J. Am. Inst. Conserv. 2003, 42, 279–312. [Google Scholar] [CrossRef]
- Raguin, V. Conservation and Restoration of Stained Glass—An Owner’s Guide; Atlantic Books: London, UK, 1988; pp. 163–185. [Google Scholar]
- Greenspan, L. Humidity Fixed Points of Binary Saturated Aqueous Solutions. J. Res. Natl. Bur. Stand. Sect. A 1977, 81A, 89. [Google Scholar] [CrossRef]
- Alloteau, F.; Lehuédé, P.; Majérus, O.; Biron, I.; Dervanian, A.; Charpentier, T.; Caurant, D. New Insight into Atmospheric Alteration of Alkali-Lime Silicate Glasses. Corros. Sci. 2017, 122, 12–25. [Google Scholar] [CrossRef]
- Schaible, M.J.; Castañeda, A.D.; Menor-Salvan, C.; Pasek, M.A.; Burcar, B.T.; Orlando, T.M. CaCO3 Polymorphs as Mineral Catalysts for Prebiotic Phosphorylation of Uridine. Earth Space Sci. 2023, 10, e2022EA002577. [Google Scholar] [CrossRef]
- Bertoluzza, A.; Monti, P.; Morelli, M.A.; Battaglia, M.A. A Raman and Infrared Spectroscopic Study of Compounds Characterized by Strong Hydrogen Bonds. J. Mol. Struct. 1981, 73, 19–29. [Google Scholar] [CrossRef]
- Frost, R.L.; Dickfos, M. Hydrated Double Carbonates—A Raman and Infrared Spectroscopic Study. Polyhedron 2007, 26, 4503–4508. [Google Scholar] [CrossRef]
- Prieto-Taboada, N.; Gómez-Laserna, O.; Martínez-Arkarazo, I.; Olazabal, M.Á.; Madariaga, J.M. Raman Spectra of the Different Phases in the CaSO4–H2O System. Anal. Chem. 2014, 86, 10131–10137. [Google Scholar] [CrossRef] [PubMed]
- Lombardo, T.; Gentaz, L.; Verney-Carron, A.; Chabas, A.; Loisel, C.; Neff, D.; Leroy, E. Characterisation of Complex Alteration Layers in Medieval Glasses. Corros. Sci. 2013, 72, 10–19. [Google Scholar] [CrossRef]
- Libowitzky, E. Correlation of O-H Stretching Frequencies and O-H…O Hydrogen Bond Lengths in Minerals. Monatshefte Chem. 1999, 130, 1047–1059. [Google Scholar] [CrossRef]
- Davis, K.M.; Tomozawa, M. An Infrared Spectroscopic Study of Water-Related Species in Silica Glasses. J. Non-Cryst. Solids 1996, 201, 177–198. [Google Scholar] [CrossRef]
- Zotov, N.; Keppler, H. The Influence of Water on the Structure of Hydrous Sodium Tetrasilicate Glasses. Am. Mineral. 1998, 83, 823–834. [Google Scholar] [CrossRef]
- Lin, Y.; Smith, N.J.; Banerjee, J.; Agnello, G.; Manley, R.G.; Walczak, W.J.; Kim, S.H. Water Adsorption on Silica and Calcium-boroaluminosilicate Glass Surfaces—Thickness and Hydrogen Bonding of Water Layer. J. Am. Ceram. Soc. 2021, 104, 1568–1580. [Google Scholar] [CrossRef]
- Asay, D.B.; Kim, S.H. Evolution of the Adsorbed Water Layer Structure on Silicon Oxide at Room Temperature. J. Phys. Chem. B 2005, 109, 16760–16763. [Google Scholar] [CrossRef]
- Saleh, A.A.; Abdel-Gawwad, H.A.; Abd EL-Moghny, M.G.; El-Deab, M.S. The Sustainable Utilization of Weathered Cement Kiln Dust in the Cleaner Production of Alkali Activated Binder Incorporating Glass Sludge. Constr. Build. Mater. 2021, 300, 124308. [Google Scholar] [CrossRef]
- Le Losq, C.; Cody, G.D.; Mysen, B.O. Complex IR Spectra of OH- Groups in Silicate Glasses: Implications for the Use of the 4500 Cm-1 IR Peak as a Marker of OH- Groups Concentration. Am. Mineral. 2015, 100, 945–950. [Google Scholar] [CrossRef]
- Efimov, A.M.; Pogareva, V.G.; Shashkin, A.V. Water-Related Bands in the IR Absorption Spectra of Silicate Glasses. J. Non-Cryst. Solids 2003, 332, 93–114. [Google Scholar] [CrossRef]
- Furukawa, T.; Fox, K.E.; White, W.B. Raman Spectroscopic Investigation of the Structure of Silicate Glasses. III. Raman Intensities and Structural Units in Sodium Silicate Glasses. J. Chem. Phys. 1981, 75, 3226–3237. [Google Scholar] [CrossRef]
- McMillan, P.F. Structural Studies of Silicate Glasses and Melts-Applications and Limitations of Raman Spectroscopy. Am. Mineral. 1984, 69, 622–644. [Google Scholar]
- Hehlen, B.; Neuville, D.R.; Kilymis, D.; Ispas, S. Bimodal Distribution of Si–O–Si Angles in Sodo-Silicate Glasses. J. Non-Cryst. Solids 2017, 469, 39–44. [Google Scholar] [CrossRef]
- Grund Bäck, L.; Ali, S.; Karlsson, S.; Möncke, D.; Kamitsos, E.I.; Jonson, B. Mixed Alkali/Alkaline Earth-silicate Glasses: Physical Properties and Structure by Vibrational Spectroscopy. Int. J. Appl. Glass Sci. 2019, 10, 349–362. [Google Scholar] [CrossRef]
- Robinet, L.; Coupry, C.; Eremin, K.; Hall, C. Raman Investigation of the Structural Changes during Alteration of Historic Glasses by Organic Pollutants. J. Raman Spectrosc. 2006, 37, 1278–1286. [Google Scholar] [CrossRef]
- Koroleva, O.N.; Anfilogov, V.N.; Shatskiy, A.; Litasov, K.D. Structure of Na2O–SiO2 Melt as a Function of Composition: In Situ Raman Spectroscopic Study. J. Non-Cryst. Solids 2013, 375, 62–68. [Google Scholar] [CrossRef]
- Halasz, I.; Agarwal, M.; Li, R.; Miller, N. Monitoring the Structure of Water Soluble Silicates. Catal. Today 2007, 126, 196–202. [Google Scholar] [CrossRef]
- Robinet, L.; Eremin, K.; Coupry, C.; Hall, C.; Lacome, N. Effect of Organic Acid Vapors on the Alteration of Soda Silicate Glass. J. Non-Cryst. Solids 2007, 353, 1546–1559. [Google Scholar] [CrossRef]
- Holtz, F.; Bény, J.-M.; Mysen, B.O.; Pichavant, M. High-Temperature Raman Spectroscopy of Silicate and Aluminosilicate Hydrous Glasses: Implications for Water Speciation. Chem. Geol. 1996, 128, 25–39. [Google Scholar] [CrossRef]
- Collin, M.; Fournier, M.; Charpentier, T.; Moskura, M.; Gin, S. Impact of Alkali on the Passivation of Silicate Glass. npj Mater. Degrad. 2018, 2, 16. [Google Scholar] [CrossRef]
- Buckwalter, C.Q.; Pederson, L.R.; McVay, G.L. The Effects of Surface Area to Solution Volume Ratio and Surface Roughness on Glass Leaching. J. Non-Cryst. Solids 1982, 49, 397–412. [Google Scholar] [CrossRef]
- Mohsin, H.; Maron, S.; Maurin, I.; Burov, E.; Tricot, G.; Devys, L.; Gouillart, E.; Gacoin, T. Thermal Behavior of Waterglass: Foaming and Xerogel-to-Glass Evolution. J. Non-Cryst. Solids 2021, 566, 120872. [Google Scholar] [CrossRef]
- Alloteau, F.; Majérus, O.; Biron, I.; Lehuédé, P.; Caurant, D.; Charpentier, T.; Seyeux, A. Temperature-Dependent Mechanisms of the Atmospheric Alteration of a Mixed-Alkali Lime Silicate Glass. Corros. Sci. 2019, 159, 108129. [Google Scholar] [CrossRef]
- Sun, L.; Liu, S.; Wang, Y.; Zhang, S.; Zhu, J.; Guan, X.; Shi, C. Further Hydration Hardening Behavior of CO2-Cured Sodium-Doped Calcium Silicate Compacts. Case Stud. Constr. Mater. 2024, 20, e03143. [Google Scholar] [CrossRef]
- Maekawa, H.; Maekawa, T.; Kawamura, K.; Yokokawa, T. The Structural Groups of Alkali Silicate Glasses Determined from 29Si MAS-NMR. J. Non-Cryst. Solids 1991, 127, 53–64. [Google Scholar] [CrossRef]
- Angeli, F.; Delaye, J.M.; Charpentier, T.; Petit, J.-C.; Ghaleb, D.; Faucon, P. Influence of Glass Chemical Composition on the Na-O Bond Distance: A 23Na 3Q-MAS NMR and Molecular Dynamics Study. J. Non-Cryst. Solids 2000, 276, 132–144. [Google Scholar] [CrossRef]
- Robert, E.; Whittington, A.; Fayon, F.; Pichavant, M.; Massiot, D. Structural Characterization of Water-Bearing Silicate and Aluminosilicate Glasses by High-Resolution Solid-State NMR. Chem. Geol. 2001, 174, 291–305. [Google Scholar] [CrossRef]
- Ai, X.; Deng, F.; Dong, J.; Hu, W.; Xu, H.; Ye, C. One- and Two-Dimensional Solid-State Magic Angle Spinning NMR Studies on the Hydration Process of Layered Sodium Disilicate SKS-6. Solid State Nucl. Magn. Reson. 2004, 25, 216–226. [Google Scholar] [CrossRef]
- Angeli, F.; Gaillard, M.; Jollivet, P.; Charpentier, T. Influence of Glass Composition and Alteration Solution on Leached Silicate Glass Structure: A Solid-State NMR Investigation. Geochim. Cosmochim. Acta 2006, 70, 2577–2590. [Google Scholar] [CrossRef]
- Angeli, F.; Villain, O.; Schuller, S.; Ispas, S.; Charpentier, T. Insight into Sodium Silicate Glass Structural Organization by Multinuclear NMR Combined with First-Principles Calculations. Geochim. Cosmochim. Acta 2011, 75, 2453–2469. [Google Scholar] [CrossRef]
- Ai, X.; Chen, L.; Dong, J.; Ye, C.; Deng, F. Variation of Sodium Coordination during the Hydration Processes of Layered Sodium Disilicates as Studied by 23Na MQMAS and 1H↔23Na CP/MAS NMR spectroscopy. J. Math. Chem. 2003, 13, 614–621. [Google Scholar] [CrossRef]
- Bronnimann, C.E.; Zeigler, R.C.; Maciel, G.E. Proton NMR Study of Dehydration of the Silica Gel Surface. J. Am. Chem. Soc. 1988, 110, 2023–2026. [Google Scholar] [CrossRef]
- Hamad, R.T.; AAl-Rahim, N.S.A.; Moghazy, M.H.; Al-Moneam, H.A. Explosion Effects on Archaeological Glass, Conservation and Protection Strategy. Int. J. Conserv. Sci. 2021, 12, 105–112. [Google Scholar]
- Kunicki-Goldfinger, J.; Targowski, P.; Góra, M.; Karaszkiewicz, P.; Dzierżanowski, P. Characterization of Glass Surface Morphology by Optical Coherence Tomography. Stud. Conserv. 2009, 54, 117–128. [Google Scholar] [CrossRef]
- Gin, S.; Delaye, J.-M.; Angeli, F.; Schuller, S. Aqueous Alteration of Silicate Glass: State of Knowledge and Perspectives. npj Mater. Degrad. 2021, 5, 42. [Google Scholar] [CrossRef]
- Devreux, F.; Ledieu, A.; Barboux, P.; Minet, Y. Leaching of Borosilicate Glasses. II. Model and Monte-Carlo Simulations. J. Non-Cryst. Solids 2004, 343, 13–25. [Google Scholar] [CrossRef]
- Schalm, O.; Nuyts, G.; Janssens, K. Some Critical Observations about the Degradation of Glass: The Formation of Lamellae Explained. J. Non-Cryst. Solids 2021, 569, 120984. [Google Scholar] [CrossRef]
- Gin, S.; Mir, A.H.; Jan, A.; Delaye, J.M.; Chauvet, E.; De Puydt, Y.; Gourgiotis, A.; Kerisit, S. A General Mechanism for Gel Layer Formation on Borosilicate Glass under Aqueous Corrosion. J. Phys. Chem. C 2020, 124, 5132–5144. [Google Scholar] [CrossRef]
- Lenting, C.; Plümper, O.; Kilburn, M.; Guagliardo, P.; Klinkenberg, M.; Geisler, T. Towards a Unifying Mechanistic Model for Silicate Glass Corrosion. npj Mater. Degrad. 2018, 2, 28. [Google Scholar] [CrossRef]
- Bouna, L.; Ettahiri, Y.; Elimbi, A. Role of Washing Process in the Improvement of Surface Properties of Porous Geopolymers. J. Porous Mater. 2024, 31, 13–25. [Google Scholar] [CrossRef]
- Cheng, T.W.; Lee, M.L.; Ko, M.S.; Ueng, T.H.; Yang, S.F. The Heavy Metal Adsorption Characteristics on Metakaolin-Based Geopolymer. Appl. Clay Sci. 2024, 56, 569–576. [Google Scholar] [CrossRef]
- Fearn, S.; McPhail, D.S.; Hagenhoff, B.; Tallarek, E. TOF-SIMS Analysis of Corroding Museum Glass. Appl. Surf. Sci. 2006, 252, 7136–7139. [Google Scholar] [CrossRef]
- Verhaar, G.; Van Bommel, M.R.; Tennent, N.H. Development and Validation of an Analytical Protocol for the Sampling and Quantitative Analysis of Ions on the Surface of Unstable Historic Glass in Museum Collections Using Ion-Exchange Chromatography. J. Chromatogr. A 2020, 1627, 461394. [Google Scholar] [CrossRef]
- Coto, B.; Martos, C.; Peña, J.L.; Rodríguez, R.; Pastor, G. Effects in the Solubility of CaCO3: Experimental Study and Model Description. Fluid Phase Equilibria 2012, 324, 1–7. [Google Scholar] [CrossRef]

| Sample | SiO2 | Al2O3 | MgO | CaO | Na2O | Fe2O3 | Tg (±4 °C) | Density (±0.002 g·cm−3) |
|---|---|---|---|---|---|---|---|---|
| wt% ICP-AES | 74.2 | 0.87 | 0.8 | 5.29 | 18.8 | 0.03 | 2.465 | |
| wt% SEM-EDX | 73.8 | 0.65 | 0.79 | 5.37 | 19.4 | - | 518 | |
| mol% ICP-AES | 74.4 | 0.5 | 1.3 | 5.7 | 18.3 | - |
| Name | Sample Type | Aging Parameters | ||
|---|---|---|---|---|
| Duration | Temperature | RH | ||
| GM-3m | Glass monolith | 3 months | 35 °C | 85% |
| GM-6m | Glass monolith | 6 months | 35 °C | 85% |
| GP-15m | Glass powder | 15 months | 35 °C | 85% |
| % Free Water | % Bound Water | % CO2 | |
|---|---|---|---|
| GP-15m | 13.6 | 12.6 | 4.6 |
| GP-15m + 20 °C H2O | 14.4 | 9.0 | 3.2 |
| GP-15m + 50 °C H2O | 13.5 | 7.2 | 3.2 |
| Reactions of the water with the glass | Si − O − Na + H2O(w) ↔ Si − OH + Na+ + OH− Si − O − (½ Ca) + H2O(w) ↔ Si − OH + ½ Ca2+ + OH− Si − O − Si + H2O(w) ↔ 2 Si − OH | (R.1Na) (R.1Ca) (R.2) |
| Reactions of the water with the atmosphere | H2O(g) ↔ H2O(w) CO2(g) ↔ CO2(w) CO2(w) + H2O ↔ H2CO3 H2CO3 + OH− ↔ HCO3− + H2O HCO3− + OH− ↔ CO32− + H2O | (R.3) (R.4) (R.5) |
| Precipitations in the water film | Ca2+ + 2 Na+ + 2 CO32− + 2 H2O ↔ Na2Ca(CO3)2·2H2O Ca2+ + CO32− ↔ CaCO3 | (R.6) (R.7) |
Disclaimer/Publisher’s Note: The statements, opinions and data contained in all publications are solely those of the individual author(s) and contributor(s) and not of MDPI and/or the editor(s). MDPI and/or the editor(s) disclaim responsibility for any injury to people or property resulting from any ideas, methods, instructions or products referred to in the content. |
© 2025 by the authors. Licensee MDPI, Basel, Switzerland. This article is an open access article distributed under the terms and conditions of the Creative Commons Attribution (CC BY) license (https://creativecommons.org/licenses/by/4.0/).
Share and Cite
Law, T.; Majérus, O.; Godet, M.; Moskura, M.; Charpentier, T.; Seyeux, A.; Caurant, D. Does Water Cleaning Mitigate Atmospheric Degradation of Unstable Heritage Glass? An Experimental Study on Glass Models. Heritage 2025, 8, 276. https://doi.org/10.3390/heritage8070276
Law T, Majérus O, Godet M, Moskura M, Charpentier T, Seyeux A, Caurant D. Does Water Cleaning Mitigate Atmospheric Degradation of Unstable Heritage Glass? An Experimental Study on Glass Models. Heritage. 2025; 8(7):276. https://doi.org/10.3390/heritage8070276
Chicago/Turabian StyleLaw, Thalie, Odile Majérus, Marie Godet, Mélanie Moskura, Thibault Charpentier, Antoine Seyeux, and Daniel Caurant. 2025. "Does Water Cleaning Mitigate Atmospheric Degradation of Unstable Heritage Glass? An Experimental Study on Glass Models" Heritage 8, no. 7: 276. https://doi.org/10.3390/heritage8070276
APA StyleLaw, T., Majérus, O., Godet, M., Moskura, M., Charpentier, T., Seyeux, A., & Caurant, D. (2025). Does Water Cleaning Mitigate Atmospheric Degradation of Unstable Heritage Glass? An Experimental Study on Glass Models. Heritage, 8(7), 276. https://doi.org/10.3390/heritage8070276