1. Introduction
Hatchett’s Brown, invented in 1803 by Charles Hatchett, is one of the pigments based on copper ferrocyanide, developed as a result of advancements in research on metallic cyanide compounds initiated in the 18th century.
This pigment was forgotten for many years and is no longer produced today. Moreover, the literature on its identification using modern analytical methods is scarce. The aim of this publication is to systematize knowledge about this pigment and to identify its presence in several paintings created in the 19th century.
Hatchett’s Brown is a copper and potassium ferrocyanide pigment. It is obtained by precipitating a soluble copper salt with potassium ferrocyanide. Copper salts react with potassium ferrocyanide in the same way as iron salts do; depending on the excess of ferrocyanide or copper salt, different compounds are formed [
1].
This pigment was invented by Charles Hatchett (1765–1847), an English chemist and mineralogy expert, best known for discovering the element niobium [
2]. His extensive scientific achievements also include the invention of a method for producing a red-brown pigment.
Building upon the 1704 discovery of Prussian Blue (iron(III) hexacyanoferrate, Fe
4[Fe(CN)
6]
3·xH
2O) by Johann Jacob Disbach (1670–1748), whose preparation formula was published in 1724, Hatchett began experimenting with a different metal—copper [
3,
4].
As a result of his experiments, he obtained a red pigment with a brownish hue—copper hexacyanoferrate—the synthesis method of which he published in a paper in 1803 [
5]. Depending on the preparation method, different shades of the pigment could be achieved, ranging from red-brown to violet-brown.
Chemically, Van Dyck Red is a hydrated copper(II) hexacyanoferrate(II) with the formula Cu
2Fe(CN)
6·xH
2O and/or a copper dipotassium hexacyanoferrate(II) compound CuK
2Fe(CN)
6 [
6,
7]. This pigment was known by various names, including Prussiate of Copper, Hatchett Brown, Florence Brown, Vandyke Red, Prussian Black, Brun de Prusse, Hatchett’s Braun, Kupferbraun, Chemischbraun, and Breslauerbraun [
1,
6].
Brown pigments could also be obtained from Prussian Blue through a firing process; however, these pigments are not identical to the brown pigment synthesized by Hatchett [
7,
8]. Hatchett’s Brown contained copper and, depending on the preparation method, potassium. Historical sources indicate that a variant of Prussian Brown is copper ferrocyanide, which is not resistant to alkalis and may therefore degrade when paintings are cleaned using alkaline solutions [
9].
Van Dyck Red was prone to color changes under exposure to light and when mixed with other pigments. In the presence of sulfur fumes, it darkened to black [
10,
11,
12].
In the commercial market for artists’ paints, Hatchett’s Brown was most commonly sold under the name Vandyke Red. It has been found in the catalogs of German and Polish manufacturers producing artists’ paints. However, no references to Vandyke Red were found in the catalogs of English companies such as Winsor & Newton [
7,
8]. Instead, Winsor & Newton included Prussian Brown, which was recorded in their catalog around 1861 [
7]. It was not listed in the catalogs of Rowney or Reeves [
7].
Vandyke Red was produced by the German company Dr. Fr. Schoenfeld & Co. (Düsseldorf, Germany) in its lines of paints Celebrated German Oil Colors and Edouard’s Celebrated French Oil Colors. In 1862, Franz Schoenfeld (1834–1911) founded the factory Künstlerfarben Dr. Fr. Schoenfeld GmbH & Co. (Düsseldorf, Germany) in Düsseldorf [
13,
14,
15]. The paints were distributed, among other places, to the United States. They can be found in the catalogs of Frost & Adams (Boston, MA, USA), a Boston-based art materials company founded in 1869, from 1886 [
16] and 1914 [
17]. Additionally, the 1914 catalog listed Vandyke Red among the watercolor paints of H. Schmincke & Co. (Erkrath, Germany) under the name Horadam’s Patent Moist Water Colors [
17]. H. Schmincke & Co. (Erkrath, Germany) was established in 1881, and the watercolors offered in the catalog were developed in 1892 by Josef Horadam [
18].
In the 1895 catalog of Wadsworth Howland & Company (Boston, MA, USA), a company founded by Samuel Wadsworth in 1845 in Boston, Vandyke Red was offered in the Düsseldorf (German) Oil Colors and Edouard’s French Oil Colors lines, likely produced by Dr. Fr. Schoenfeld GmbH & Co. (Düsseldorf, Germany) [
19,
20]. In a 1906 catalog published in Toronto, Canada, by the art supply company Art Metropole (Toronto, ON, Canada), Vandyke Red was featured in the paint line of the German company Gebrüder Heyl & Cie (Berlin, Germany) under the name Heyl’s Artists’ Oil Colors [
21].
Joachim Christian Friedrich Heyl (1741–1789) founded the trading company J. F. Heyl & Co. (Berlin, Germany) in 1765, dealing in paints and painting supplies alongside other goods. His older brother, Johann Jacob Heyl (1725–1775), owned a retail store. After Johann’s death, Joachim adopted the name Johann Friedrich Heyl. Over the years, the company expanded, and in 1883, Ernst Eduard Heyl (1797–1871) established a factory for paints and chemicals in Berlin. By 1865, the company was named Gebrüder Heyl & Cie. (Berlin, Germany). Later, in 1926, Dr. Werner Heyl (1891–1974) founded the pharmaceutical factory Chemisch-pharmazeutische Fabrik Heyl & Co. (Berlin, Germany) [
22,
23].
Vandyke Red was also available in the Polish market. A 1906 catalog of artists’ paints from a factory founded by the painter Józef Karmański (1865–1904) included an oil paint labeled Vandyke Red (English), Van Dyckrot (German), and Rouge Van Dyck (French) under factory number 64 in the Superfine Artists’ Oil Colours line [
24]. It was also listed in the 1914 catalog [
25]. However, its production was later discontinued. A 1934 guide on art materials no longer mentions Vandyke Red, indicating that it had been withdrawn from production [
26].
The paints were manufactured in a factory in Zwierzyniec, Kraków. Over the years, the factory changed owners and names: in 1894, it operated under Józef Karmański (Cracow, Poland), later becoming Karmański & Co. (Cracow, Poland); in 1904, it was renamed Gabryel Górski & Co. (Cracow, Poland); and from 1919, it was known as Iskra and Karmański (Cracow, Poland). Polish-made artists’ paints were also distributed in Vienna, Budapest, Prague, Sofia, Munich, Venice, and Milan [
27].
Table 1 presents a summary of companies supplying artists’ materials and their offerings of Hatchett’s Brown.
The aim of this study is to identify and analyze the presence of Hatchett’s Brown (Van Dyck Red) in 19th-century oil paintings, with a particular focus on works by Henryk Siemiradzki. Through the application of advanced spectroscopic techniques, including XRF, SEM-EDS, and Raman spectroscopy, this research seeks to confirm the pigment’s composition, historical usage, and its role in overpainting practices. Additionally, this study aims to contribute to a broader understanding of the pigment’s historical production and commercial availability.
3. Results
The first object in which Hatchett’s Brown was identified was Portrait of a Woman on a Palette by Henryk Siemiradzki. The uniqueness of this artwork does not stem solely from its subject, a portrait of a young woman, which is a frequently encountered motif in the artist’s sketch-like works created as preparation for larger compositions or as a workshop exercise. The distinctive nature of the piece, particularly from a research perspective, lies in the fact that the painting was executed directly on an artist’s palette, which still retains remnants of squeezed-out paints.
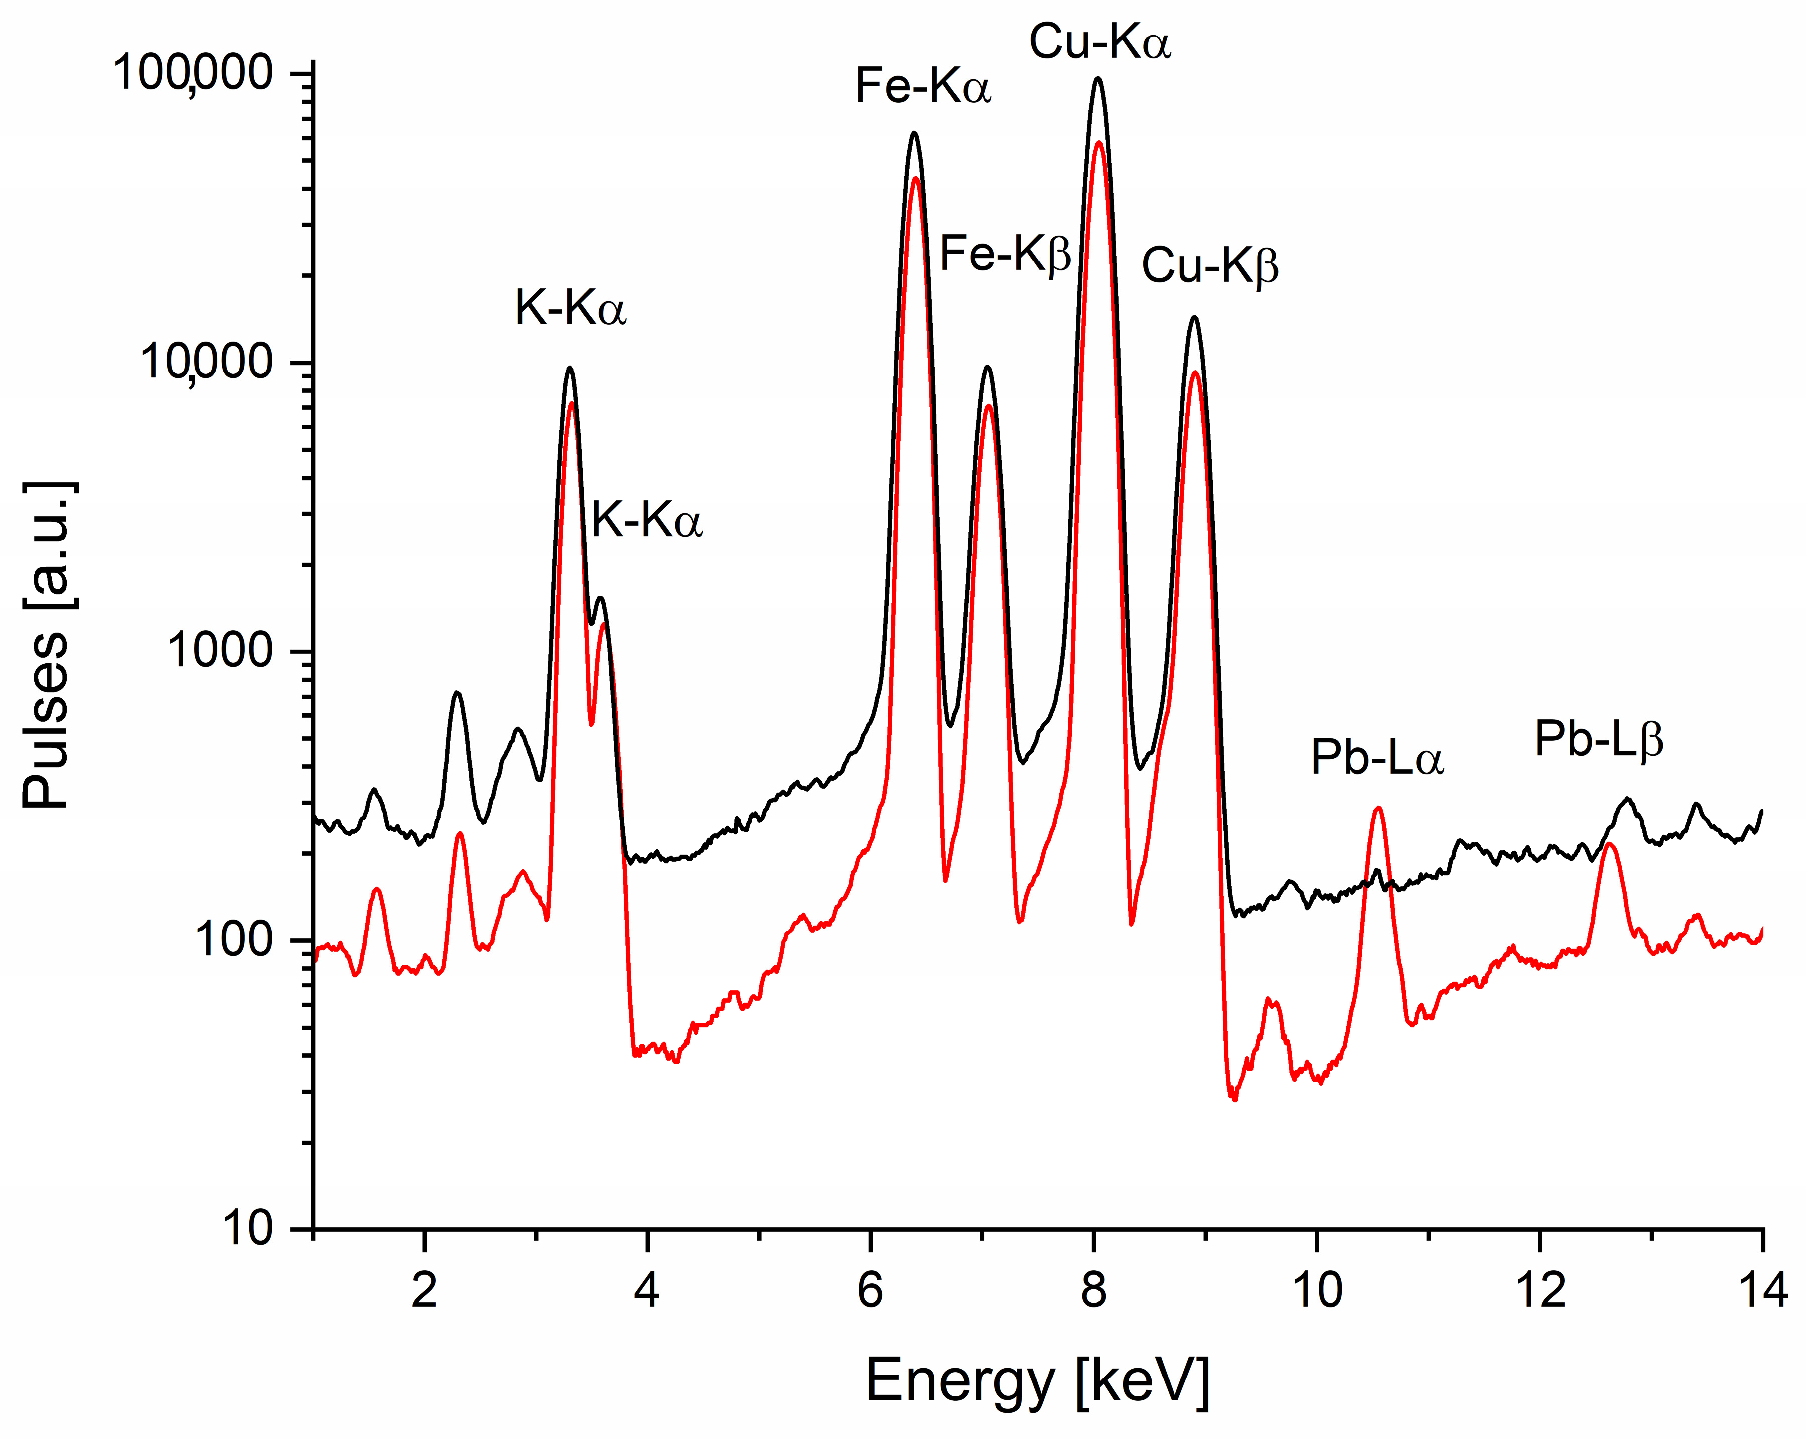
An analysis of a dark brown paint fragment from the edges of the palette, conducted using X-ray fluorescence spectroscopy (XRF), revealed high levels of iron and copper. The obtained spectrum compared with the reference pigment measurement is shown in
Figure 2. The elemental composition of this and other examined objects is summarized in
Table 2. Initially, the analysis results and the paint color suggested the use of iron-based earth pigments, such as umber. However, the high copper and potassium content contradicted this hypothesis.
The presence of both these elements indicates the presence of the chemical compound copper(II) hexacyanoferrate(II) (Cu2[Fe(CN)6]), which forms the pigment known as Vandyke Red. This pigment exhibits a range of shades—from brownish-red through reddish-violet to reddish-brown. To achieve deeper red tones, it was sometimes combined with an organic dye such as madder lake. The chemical process of manufacturing this pigment explains the presence of potassium in the examined sample, while the trace amounts of lead detected in the paint likely originate from lead white, used as an additive. The discovery of Hatchett’s Brown on a 19th-century artist’s palette was surprising for researchers as this pigment was not widely used and its production ceased in the early 20th century.
Due to the necessity of performing only non-invasive analyses on this object, the studies focused solely on determining the elemental composition of the used paints. Despite this limitation, the analysis of pure paint squeezed by Siemiradzki directly from the tube onto the palette and used while painting Portrait of a Woman on the Palette was crucial for identifying the pigment and facilitated the interpretation of results from other works by Henryk Siemiradzki. In subsequent years, further searches for this pigment in the artist’s other works were initiated. These studies, conducted using XRF, SEM-EDX, and Raman spectroscopy, were expanded with additional spectroscopic methods to allow for a broader analysis of Hatchett’s Brown.
The next examined artwork was The Castaway (Beggar)—a study for a painting. The sketch was painted on a piece of canvas, depicting a wealthy woman stepping into a gondola. Most of the composition was painted directly onto the white ground layer; however, in the bottom part of the painting the artist applied a transparent brown layer, upon which he synthetically built the figure of the beggar.
Non-invasive pigment analysis was conducted using XRF. Several reviews in the literature summarize the most important applications of XRF in artwork studies, conservation, and restoration, demonstrating the suitability of this technique for non-destructive analysis [
28,
29,
30,
31]. XRF analyses typically consist of point measurements, but to obtain more comprehensive information about the art object it is often necessary to perform analyses at various points across the surface.
A major issue in interpreting multilayer paint structures using the XRF technique is the inability to distinguish between the elements or pigments visible in the fluorescence spectrum. The relative intensity values of the elements are affected by the shielding of the lower layers (the more numerous they are, the more difficult the interpretation) by the upper layers, as well as by the reabsorption of elements within mixtures of several pigments in a single layer.
Some pigments remain difficult to identify due to low count values or because the detected element is common to several different pigments. Based on the elemental composition at a given point, the results are interpreted to determine the most probable pigments present in the analyzed sample. The identified pigments are suggested by comparing the results with measurements taken from areas of the painting where pure pigments are used (e.g., impastos), along with visual color assessments and considerations of the presence of trace elements.
XRF analysis of the pigments used in this quick sketch, conducted using X-ray fluorescence spectroscopy, revealed the presence of at least eleven pigments including Hatchett’s Brown (lead white, strontium yellow, iron-based pigments (ochre, umber, and iron red), vermilion, organic red, cobalt blue, Scheele’s green (Schweinfurth green), and Hatchett’s Brown, bone black) [
28]. In the dark areas of the painting, a strong signal from potassium, iron, and copper was recorded, along with additional signals from calcium, phosphorus, and lead. The presence of calcium and phosphorus indicates the use of bone black, the signal from potassium, iron, and copper suggests the addition of Hatchett’s Brown, while the lead signal indicates the presence of lead white in the examined area.
Microscopic observation of the cross-section of the sample revealed two layers (
Figure 3A). A black layer (1) with a large brown pigment grain inclusion and an underlying white ground layer (2). The area selected for SEM-EDS analysis is shown in the cross-section image (
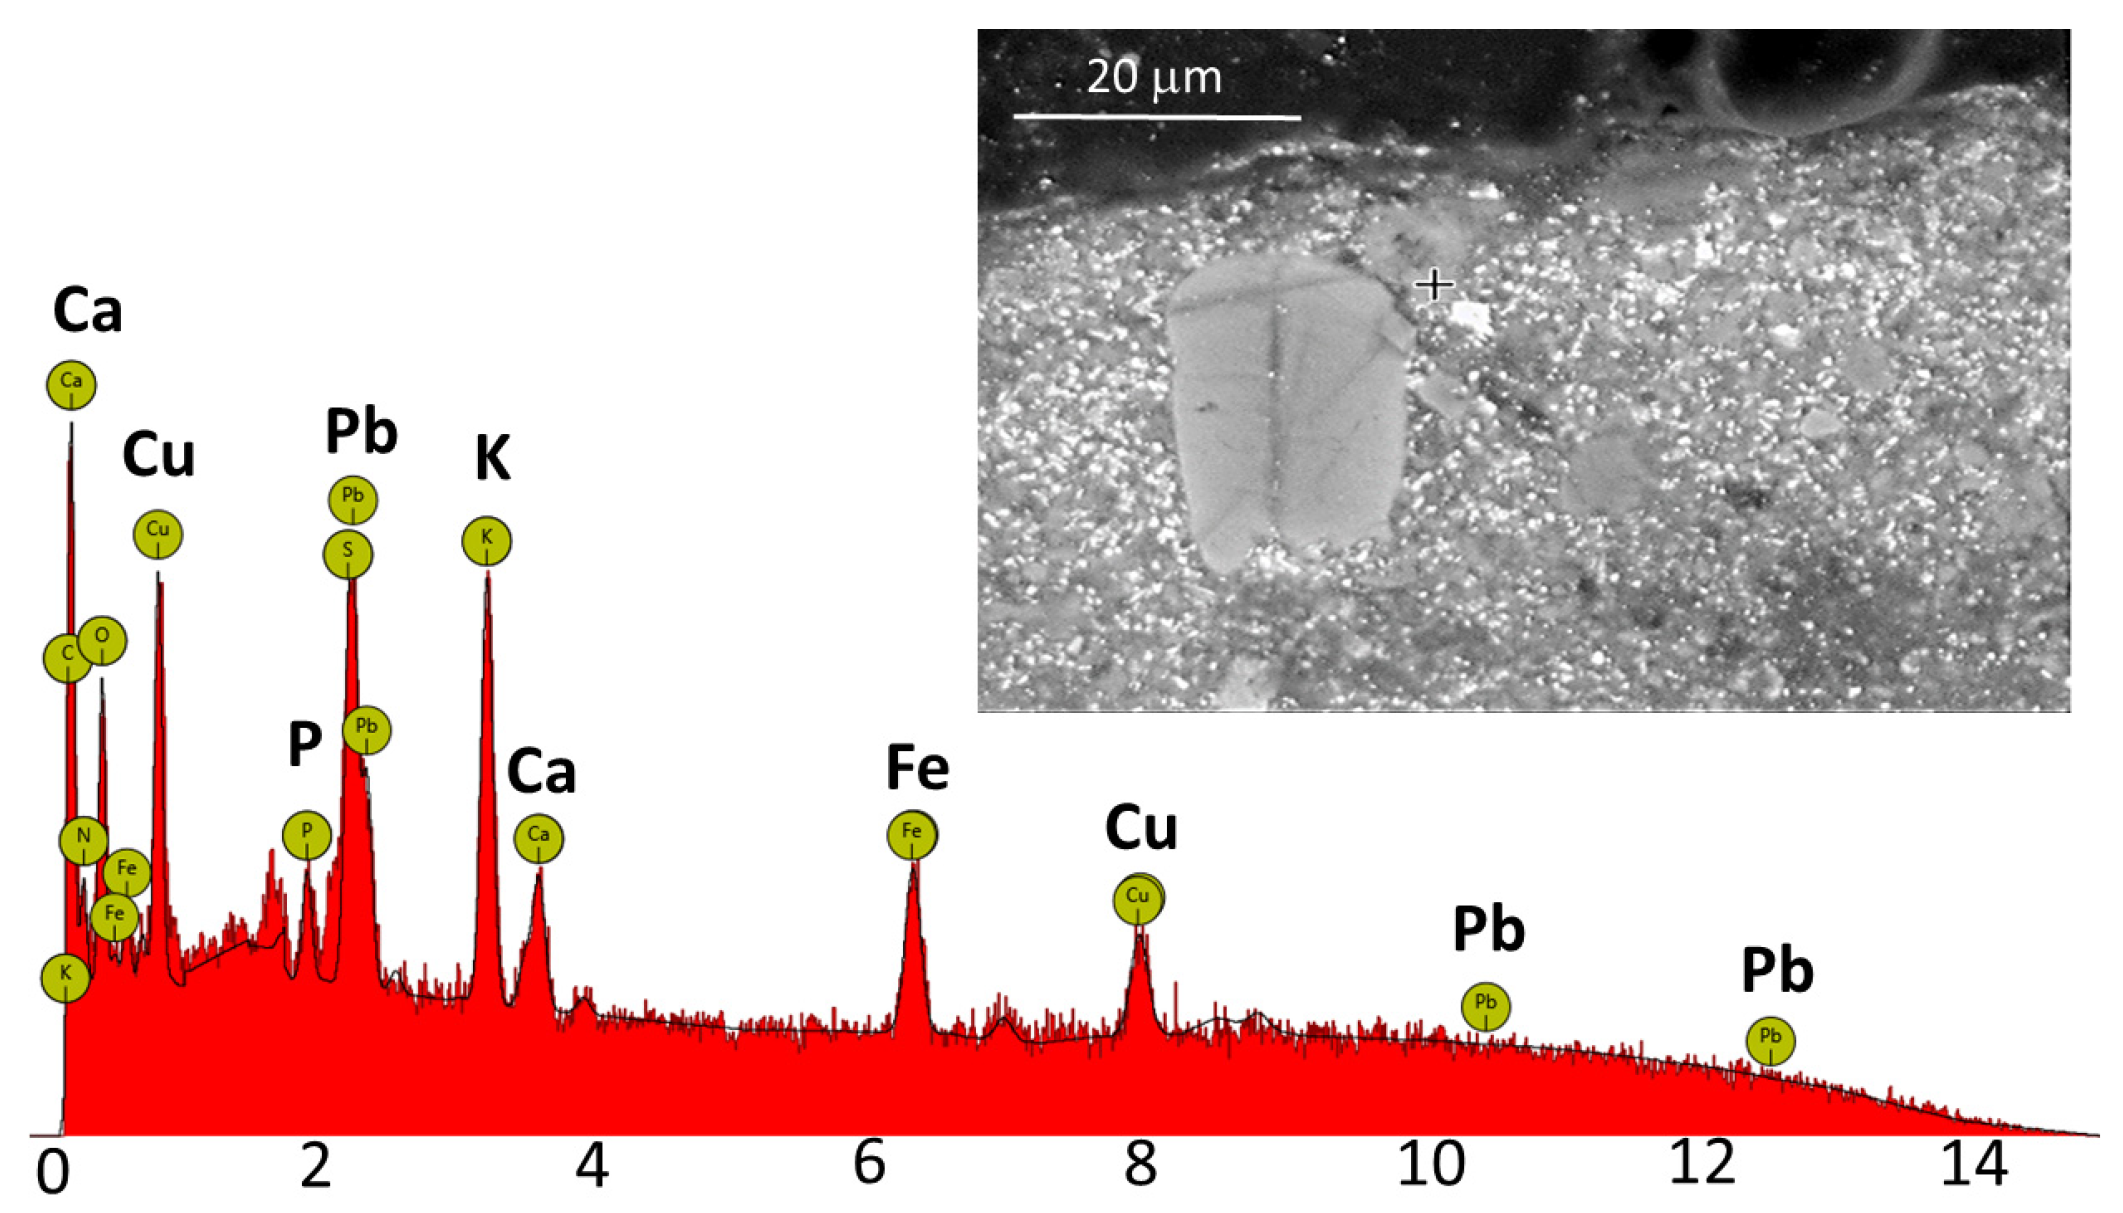
Figure 3A), marked with a yellow dashed line. The results of the SEM-EDS analysis performed on the dark layer are presented in
Figure 4. The analysis revealed the presence of potassium, iron, copper, calcium, and phosphorus. The detection of copper and iron confirms the use of Hatchett’s Brown, while the presence of phosphorus and calcium points to bone black as a pigment. Additionally, a strong iron signal was detected in a large brown grain, indicating the presence of an iron-based pigment—most likely ochre. In the white ground layer SEM-EDS analysis identified lead, barium, and sulfur, suggesting a mixture of lead white and barium white pigments.
The final examined painting by Henryk Siemiradzki was Christ and the Samaritan Woman, one of the artist’s most outstanding works. The illustrated biblical scene provided an opportunity for painterly variations on the richness and beauty of Mediterranean flora, as well as the depiction of a landscape filled with warm air and sunlight. The artist portrayed the vegetation and scenery with remarkable sensitivity.
In this painting as well, XRF analysis of brown areas showed an increased content of iron and copper, which could suggest the use of Hatchett’s Brown, or ochre, umber, and a green copper pigment such as Scheele’s Green, which the artist often used in brown and green areas [
32,
33]. The cross-section of the examined sample is shown in
Figure 3B. Optical microscopy revealed the presence of the following five distinct layers: (1) a dark surface layer, (2) a yellow-green layer with green inclusions, (3) a white layer, (4) a yellow-green layer with black inclusions and a large orange pigment grain, and (5) a white layer. The area selected for SEM-EDS analysis is shown in the cross-section image (
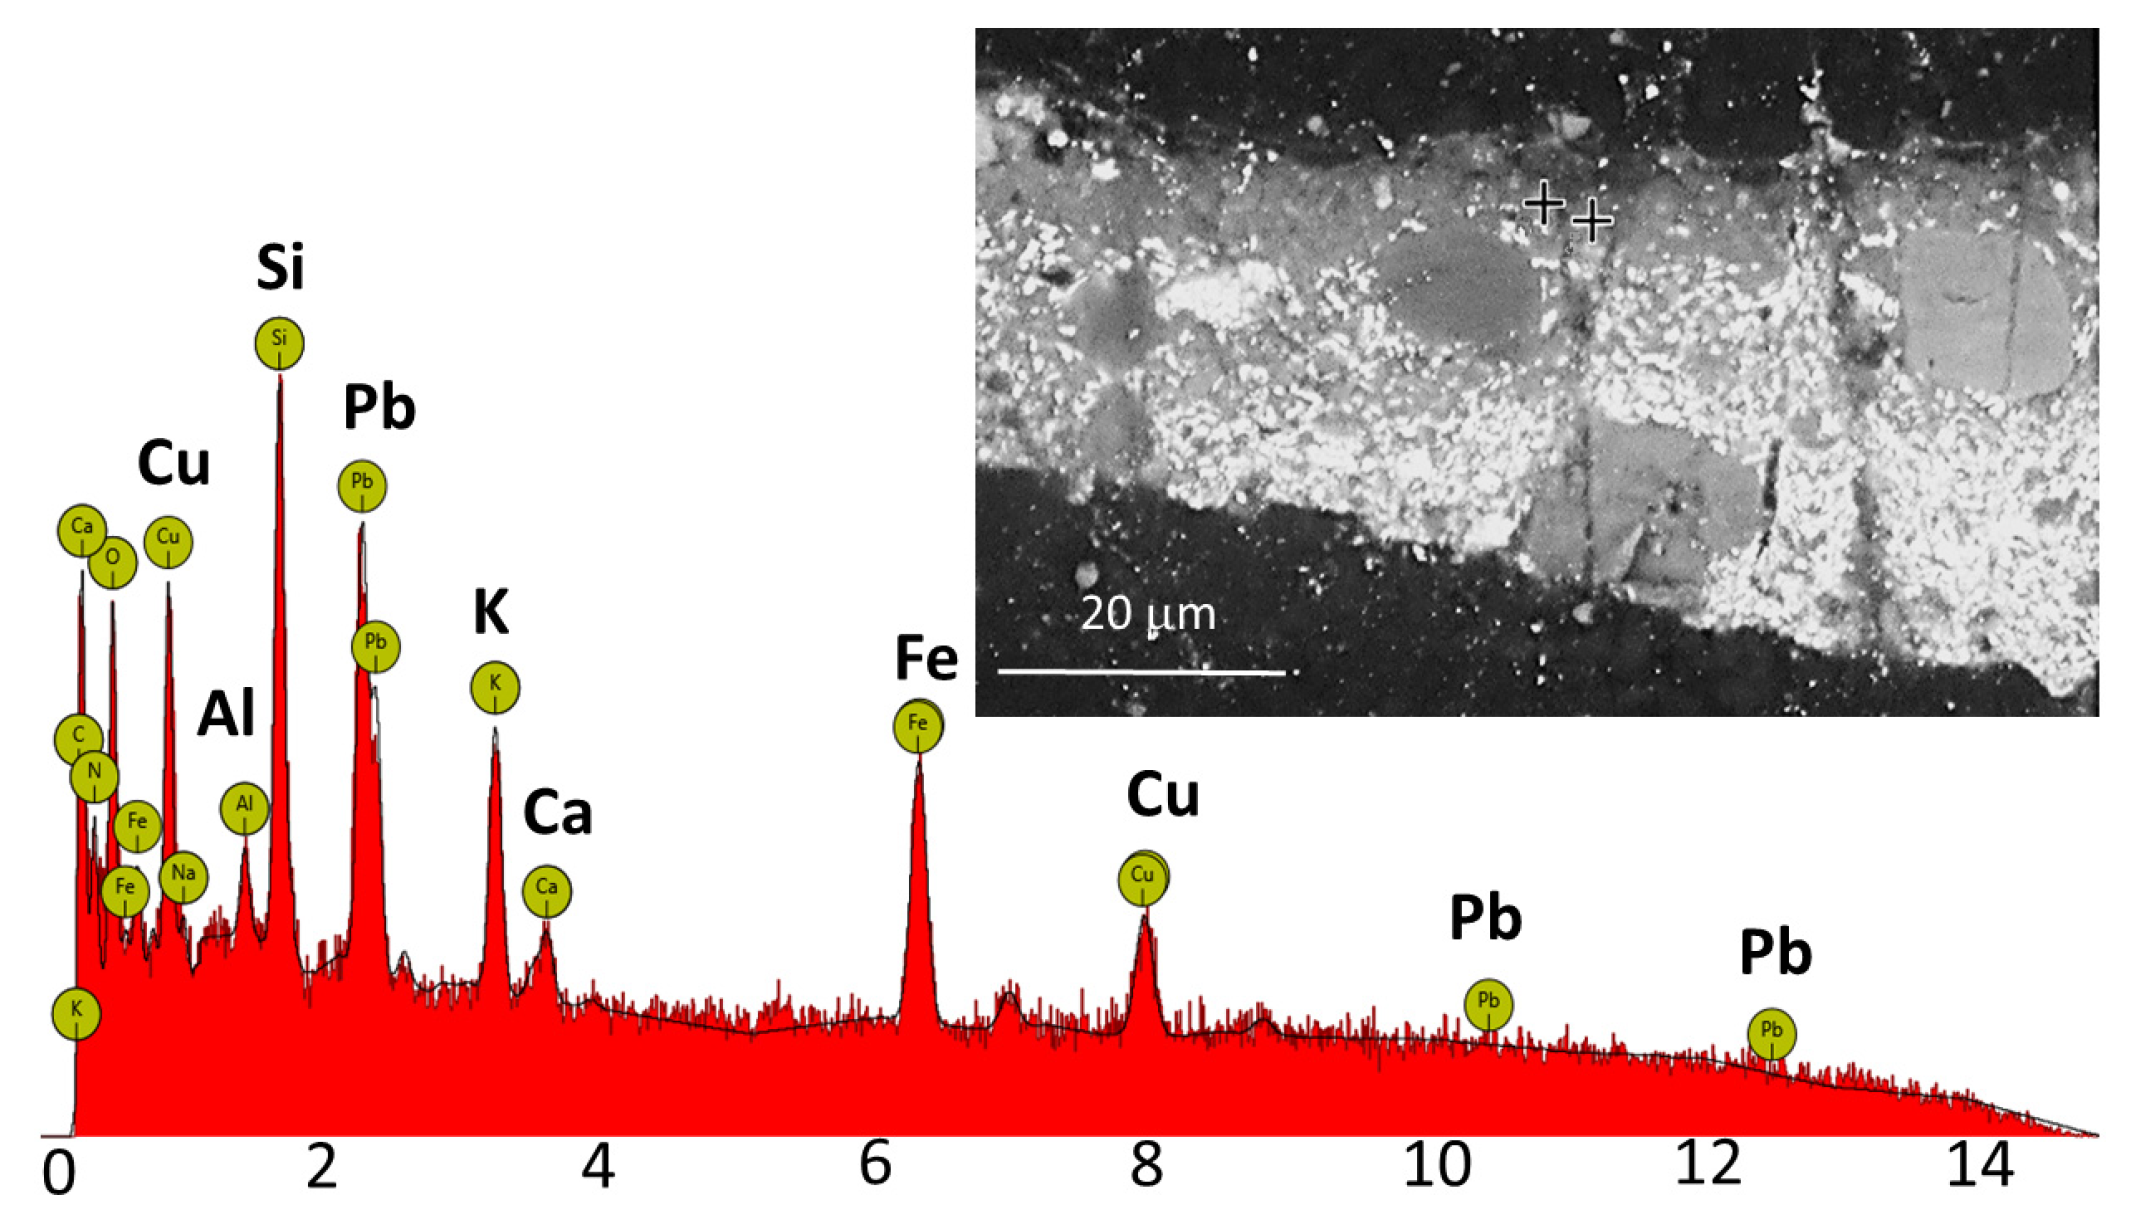
Figure 3B), marked with a yellow dashed line. SEM-EDS analysis of the top paint layer (1) showed a strong signal for potassium, iron, and copper, indicating the presence of Hatchett’s Brown. The results of this analysis are presented in
Figure 5. Measurements were taken at two separate points, both yielding identical results. Additionally, calcium and phosphorus were detected in the dark, round pigment grains, suggesting the presence of bone black, while the red pigment grains contained iron, alumina, and silica, indicating the use of red ochre.
In the underlying yellow-green layer (2), chromium was found in the intensely green, dark pigment grains, which may point to viridian. In the round, green pigment grains copper and arsenic were detected, indicating the use of Scheele’s Green. In the yellow-green grains the presence of silica, iron, potassium, calcium, and lead were found, which may suggest green earth or yellow ochre. The presence of lead indicates the use of lead white.
In the white layer (3) beneath, lead, zinc, calcium, magnesium, and silica were detected, indicating the presence of lead white and zinc white.
In the next yellow-green layer (4) with black inclusions, silica, iron, calcium, phosphorus, and lead were found, suggesting the use of iron-based pigments (yellow ochre or green earth) mixed with lead white. In a large orange grain, iron, silica, and alumina were detected, indicating red ochre. In the black pigment grains, phosphorus and calcium were detected, again pointing to the use of bone black.
In the ground layer (5), the presence of lead was detected, suggesting the use of lead white.
The last examined object suspected of containing Hatchett’s Brown was the
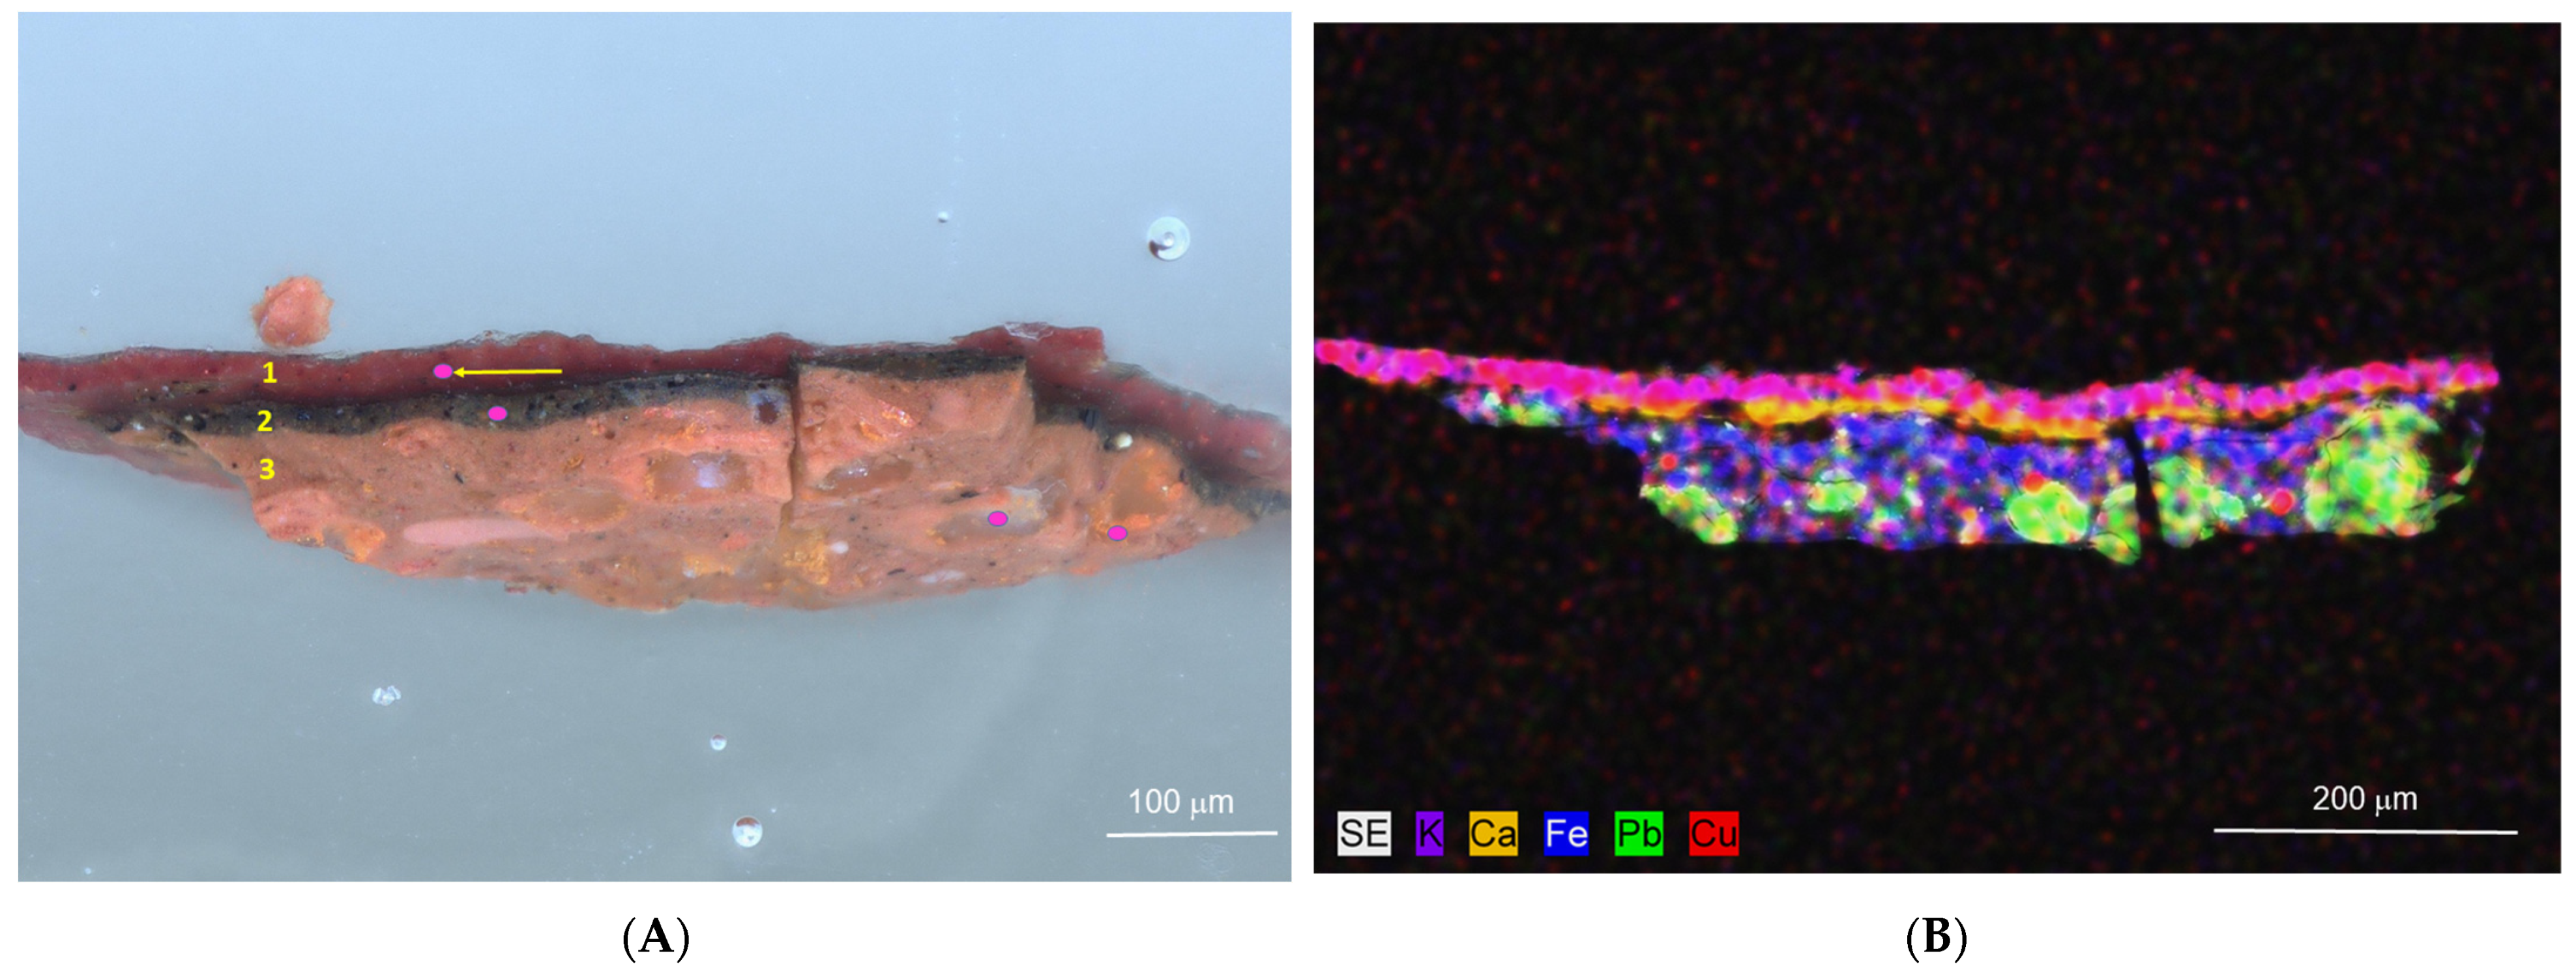
Portrait of the Ukrainian Hetman Danylo Apostol (1654–1734), painted at the turn of the 17th and 18th centuries and subsequently repainted. XRF analysis of the red coat revealed the presence of lead, iron, potassium, calcium, copper, manganese, and mercury which suggests the use of iron oxide pigment, lead pigment such as red lead or white lead, and cinnabar. A sample taken from that area was subjected to optical microscopy and SEM-EDS analysis (
Figure 6). Optical microscopy revealed the presence of the following three distinct layers: (1) a red overpainting layer, (2) a brown original paint layer with black inclusions, and (3) a red ground layer. For this cross-section sample, the SEM-EDS analysis included not only point measurements of individual paint layers but also an elemental distribution map, which is shown in
Figure 6B. In the upper red overpaint layer (1), potassium, iron, copper, and lead were detected, indicating the presence of Hatchett’s Brown and lead white. Raman spectroscopy additionally confirmed the presence of lead white in this layer (
Supplementary Materials S1). In the underlying original brown paint layer (2) a strong signal from iron was recorded, along with trace elements of aluminum, silicon, titanium, manganese, and lead, suggesting the presence of iron-based pigments such natural umber and yellow ochre with a mineral admixture of rutile. The lead detected in the examined layer originates from lead white. Raman analysis confirmed that the detected lead originates from lead white, not red lead. In the black inclusions, calcium and potassium were detected in addition to carbon, suggesting the use of charcoal black. In the red ground layer (3), silicon, aluminum, calcium, potassium, iron, and trace amounts of copper were detected, indicating the use of red iron clay earth with admixtures of copper-containing minerals and chalk. Additionally, lead was detected both in the large orange areas and in the small white inclusions, indicating the use of red lead and white lead, respectively. Additionally, Raman spectroscopy identified red lead (bands at 121, 140, 150, 226, 287, 314, 389, and 548 cm
−1) in the large orange areas and confirmed the presence of white lead (band at 1050 cm
−1) in the small white inclusions. In the examined sample the presence of cinnabar was not confirmed.
To confirm the presence of Hatchett’s Brown with greater certainty, Raman spectroscopy was applied to the upper paint layers of cross-sections taken from
The Castaway (Beggar)—a study for a painting and
Christ and the Samaritan Woman by Henryk Siemiradzki, as well as the
Portrait of the Ukrainian Hetman Danylo Apostol, where SEM-EDS had previously indicated the presence of Hatchett’s Brown.
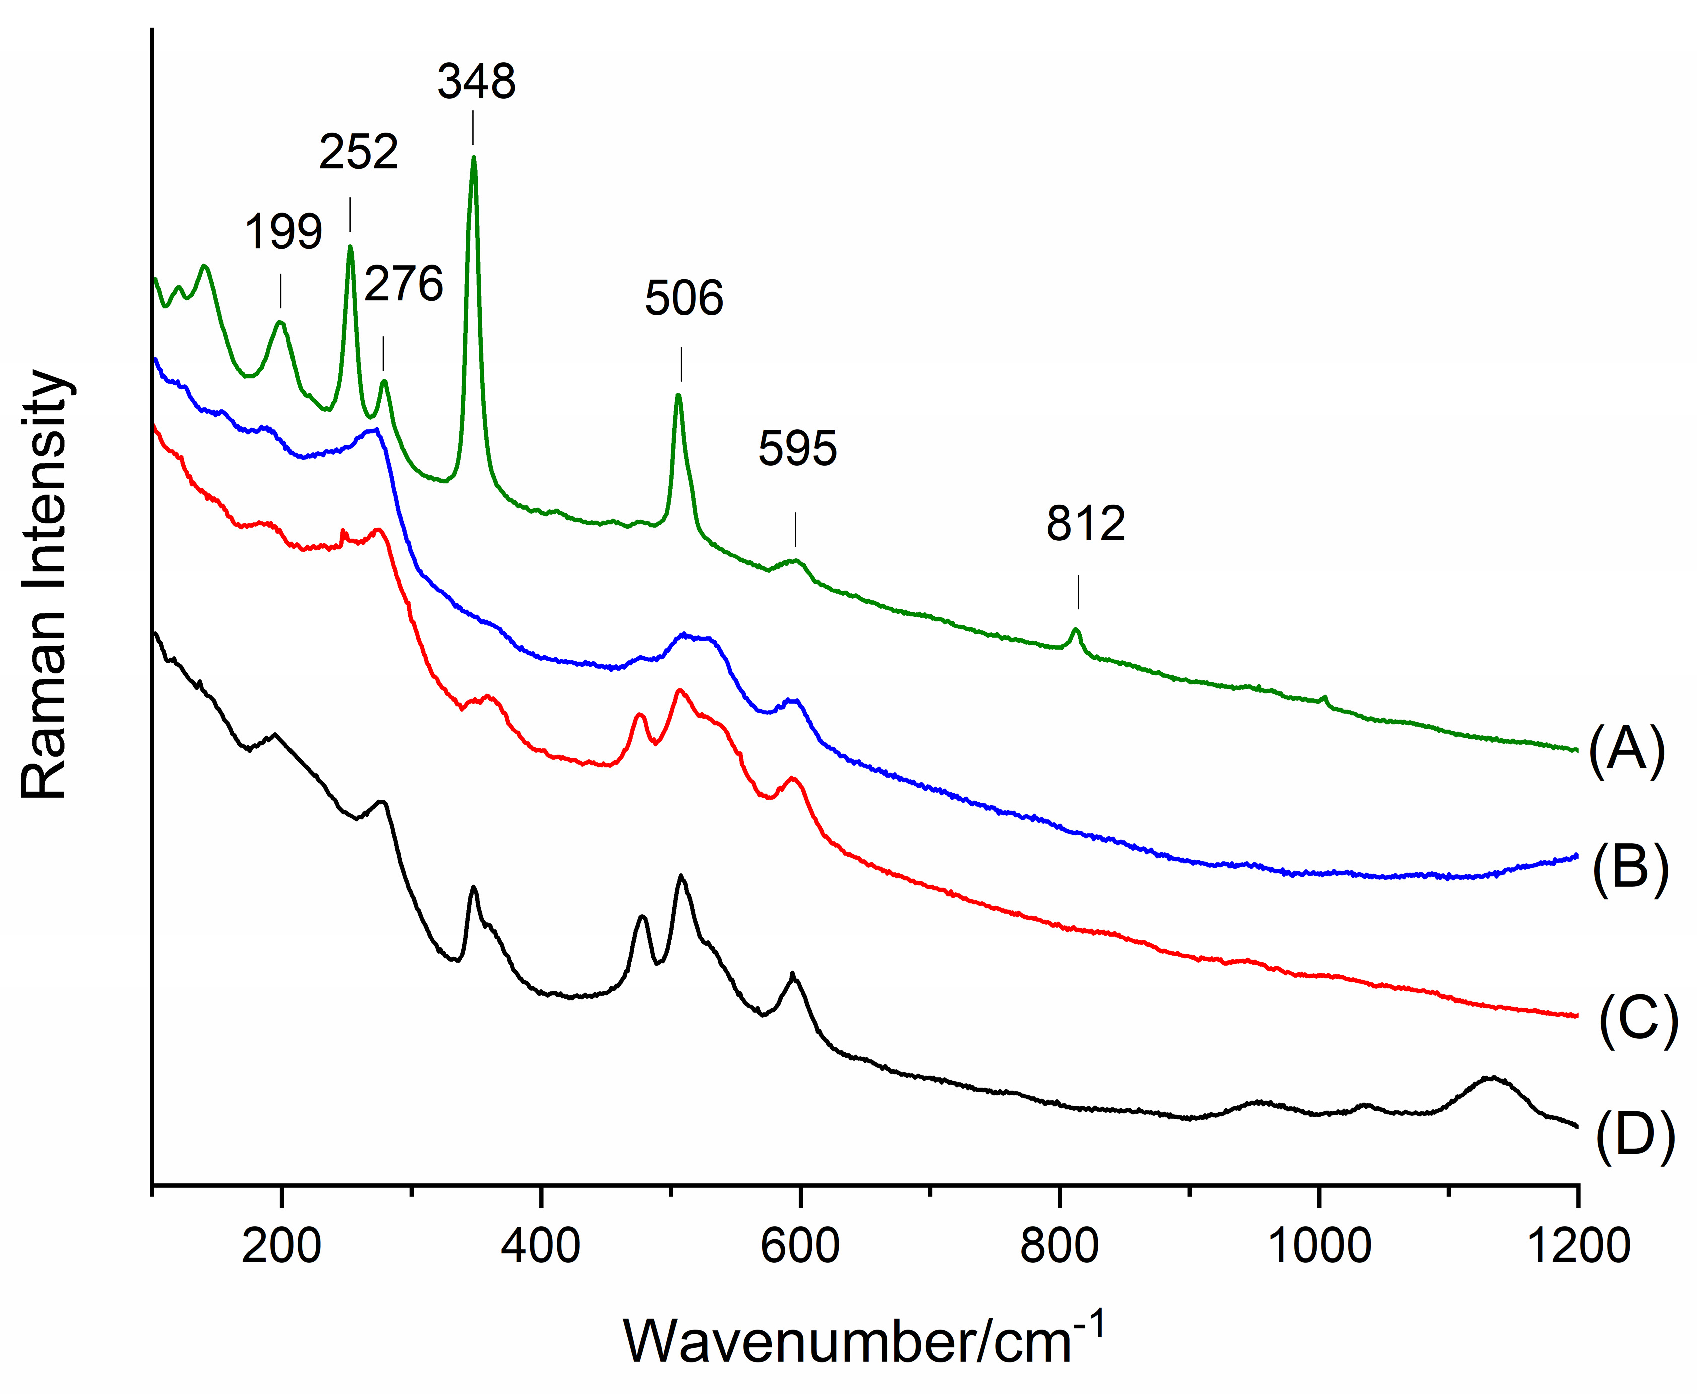
Figure 7 and
Figure 8 present Raman spectra in the ranges of 100–1200 cm
−1 and 1800–2600 cm
−1, respectively, obtained for the reference sample and for the paint layers of the analyzed samples from the paintings by Henryk Siemiradzki and the 17th/18th-century portrait. The Raman measurements were conducted on the same areas that had previously been examined using SEM-EDS (indicated by the dashed lines in
Figure 3). The results of the spectral analysis are reported in
Table 3.
Hexacyanoferrate complexes are characterized by distinct bands corresponding to the stretching vibrations of cyano groups (C≡N), as well as Fe–C and Cu–N vibrations. The following analysis of the brown pigment in Hatchett’s Brown is based on the literature on Raman spectroscopy of hexacyanoferrate compounds, including studies by Mink et al. [
34] and Moretti et al. [
35].
In the spectroscopic analysis of the examined pigments, the following four main frequency ranges can be distinguished corresponding to different types of molecular vibrations: low-frequency bands (<400 cm−1), mid-frequency bands (400–1000 cm−1), high-frequency bands (1000–1600 cm−1), and bands associated with C≡N bond vibrations (>2000 cm−1).
The first set of bands in the range of 194–362 cm−1 corresponds to lattice vibrations and interactions between metal atoms and ligands. The 199 cm−1 band is assigned to FeCN lattice deformations, indicating structural flexibility and possible interactions between neighboring iron and copper centers. In contrast, the 276 cm−1 band corresponds to Cu–N stretching vibrations characteristic of Cu–N–C cyanide bridges, confirming the presence of copper within the complex structure.
The subsequent bands at 348 cm−1 and 362 cm−1 result from the deformation of Fe–C–N and Cu–N–C cyanide bridges. The observation of these bands suggests a certain degree of structural dynamics, which may indicate minor network mobility effects in the presence of crystallization water. Similar effects have been observed in Prussian Blue structures and their analogs.
In the 478–595 cm−1 range bands characteristic of Fe–C and Cu–N stretching vibrations appear, playing a crucial role in the stability of the complex structure. The 478 cm−1 band corresponds to symmetric Fe–C vibrations, which form the structural foundation of hexacyanoferrates. Their shift from standard values suggests an influence of Cu2+ ions on structural stabilization.
The 508 cm−1 band is associated with asymmetric Fe–C and Cu–N stretching, indicating the complexity of the system, where different metal centers may interact with cyanide ligands in an irregular manner. The next band, 532 cm−1, represents Cu–N stretching, which may be weakened by the presence of water molecules within the structure.
The 595 cm−1 band is attributed to FeCN deformations, suggesting a certain degree of flexibility within the cyanide bridges and potential local symmetry changes. Such deformation vibrations are common in Prussian Blue materials and their analogs.
The 956–1133 cm−1 range includes bands resulting from internal deformations of cyano ligands and their interactions with the metallic environment. The 956 cm−1 band can be attributed to a combination of Fe–C and Cu–N vibrations, which vary in intensity depending on the symmetry of the crystal lattice.
The 1035 cm−1 band corresponds to Cu–NC deformations, which may arise from subtle interactions between copper and cyano ligands. Finally, the 1133 cm−1 band is associated with CN and Fe–C vibrations, which are characteristic of classical hexacyanoferrate structures.
The most distinctive part of the spectrum comprises the stretching vibrations of C≡N in the 2050–2207 cm−1 range. These bands provide crucial information about the metallic environment and the oxidation state of metal centers.
The 2050 cm−1 band is associated with C≡N vibrations in Fe(III)–CN–Cu(II) bridges, indicating interactions between these ions within the structure. The 2091 cm−1 band represents C≡N vibrations in the Fe(II)–CN–Cu(II) environment, while the 2099 cm−1 band corresponds to the Fe(III)–CN–Cu(II) form, suggesting different local environments for these bonds.
The 2117 cm−1 band is assigned to symmetric Fe–CN vibrations in Fe(III)–CN–Cu(II), whereas the 2139 cm−1 band is related to the F2g mode, characteristic of Fe(II)–CN in Cu(II)–NC–Fe(III). The highest-frequency band, 2164 cm−1, corresponds to the A1g mode and is associated with Fe(III)–CN vibrations.
The 2191 cm−1 and 2207 cm−1 bands may indicate lattice strain and possible electronic effects. Their presence could be related to interactions between different metallic centers or dynamic effects resulting from crystallization water.
The Raman spectral analysis of Hatchett’s Brown conducted on both the reference sample and the samples taken from the paintings reveals the presence of typical ν(CN) bands as well as Fe–C and Cu–N vibrations, indicating a well-preserved hexacyanoferrate structure. The positions of the bands depend on the network conditions and the presence of coordination water, which can lead to slight shifts in vibration energy. The results of the analysis are consistent with the available literature, particularly the studies by Mink et al. [
34] and Moretti et al. [
35].
The vibrational properties of copper hexacyanoferrate complexes have been extensively studied due to their significance in understanding the bonding characteristics and electronic structure of Prussian Blue analogs (PBAs). In this context, Mink et al. [
34] conducted a detailed Raman spectroscopic investigation of K
4Cu
6[Fe(CN)
6]
4 and Cu
6[Fe(CN)
6]
4, offering crucial insights into their structural dynamics.
The Raman spectrum of K4Cu6[Fe(CN)6]4 revealed several characteristic vibrational bands. The most intense peak appeared at 2162 cm−1, corresponding to stretching vibrations of carbon–nitrogen (C≡N) bonds. Additional bands were detected at 2157 cm−1, 2116 cm−1, and 2097 cm−1, which also originated from stretching vibrations of C≡N bonds but involved different molecular environments within the crystal lattice.
Theoretical calculations performed using density functional theory (DFT) supported these assignments, predicting C≡N stretching vibrations at 2125 cm−1, 2085 cm−1, and 2064 cm−1 with high accuracy. These results confirmed a strong correlation between experimental and computational data, with minor shifts likely due to intermolecular interactions and deviations from ideal lattice structures.
In addition to C≡N stretching, Mink et al. [
34] observed bending vibrations of iron–carbon–nitrogen (Fe-C≡N) groups in the 510–600 cm
−1 range. These modes provided valuable insights into the rigidity of the coordination network. The presence of multiple bands within this range suggested complex lattice dynamics, potentially influenced by water coordination within the crystal structure.
For Cu6[Fe(CN)6]4 the C≡N stretching vibrations appeared at slightly higher frequencies compared to K4Cu6[Fe(CN)6]4. The most intense Raman bands were recorded at 2201 cm−1, 2191 cm−1, 2176 cm−1, and 2157 cm−1. These frequency shifts reflected the influence of the Fe(III) oxidation state, which increased the bond order within the C≡N groups, making them more rigid and thereby shifting their stretching frequencies to higher values.
Additionally, Mink et al. [
34] identified copper–nitrogen (Cu-N) stretching vibrations in the 200–290 cm
−1 range, further suggesting deviations from an idealized octahedral coordination. The Fe-C≡N bending modes were also present in the 510–600 cm
−1 region, with theoretical predictions suggesting 12 active vibrational modes within this range.
A comparison of the two complexes revealed key structural differences in their vibrational behavior. The C≡N stretching vibrations in K4Cu6[Fe(CN)6]4 were distributed over a broader frequency range, suggesting stronger interactions between neighboring units in the lattice. In contrast, Cu6[Fe(CN)6]4 exhibited a more defined spectral pattern, likely due to the more ordered arrangement of its molecular components.
Hatchett’s Brown and the complexes K
4Cu
6[Fe(CN)
6]
4 and Cu
6[Fe(CN)
6]
4 described in the literature [
34] belong to the same PBA family but differ in the number of Cu centers, the presence of K
+ ions, and water content. In the case of the Hatchett’s Brown pigment studied in this work, the Raman bands for C≡N, Fe-C, and Cu-N appear in similar ranges, but shifts may indicate differences in oxidation state and the number of cyanide bridges. Hatchett’s Brown exhibits a simpler Raman spectrum due to its less condensed structure compared to the more complex copper hexacyanoferrates.

