
High-Resolution Seismic Detection Techniques of the Pebble Layer of Baodun Site City Wall, Sichuan, China

Abstract
:1. Introduction
2. Materials and Methods
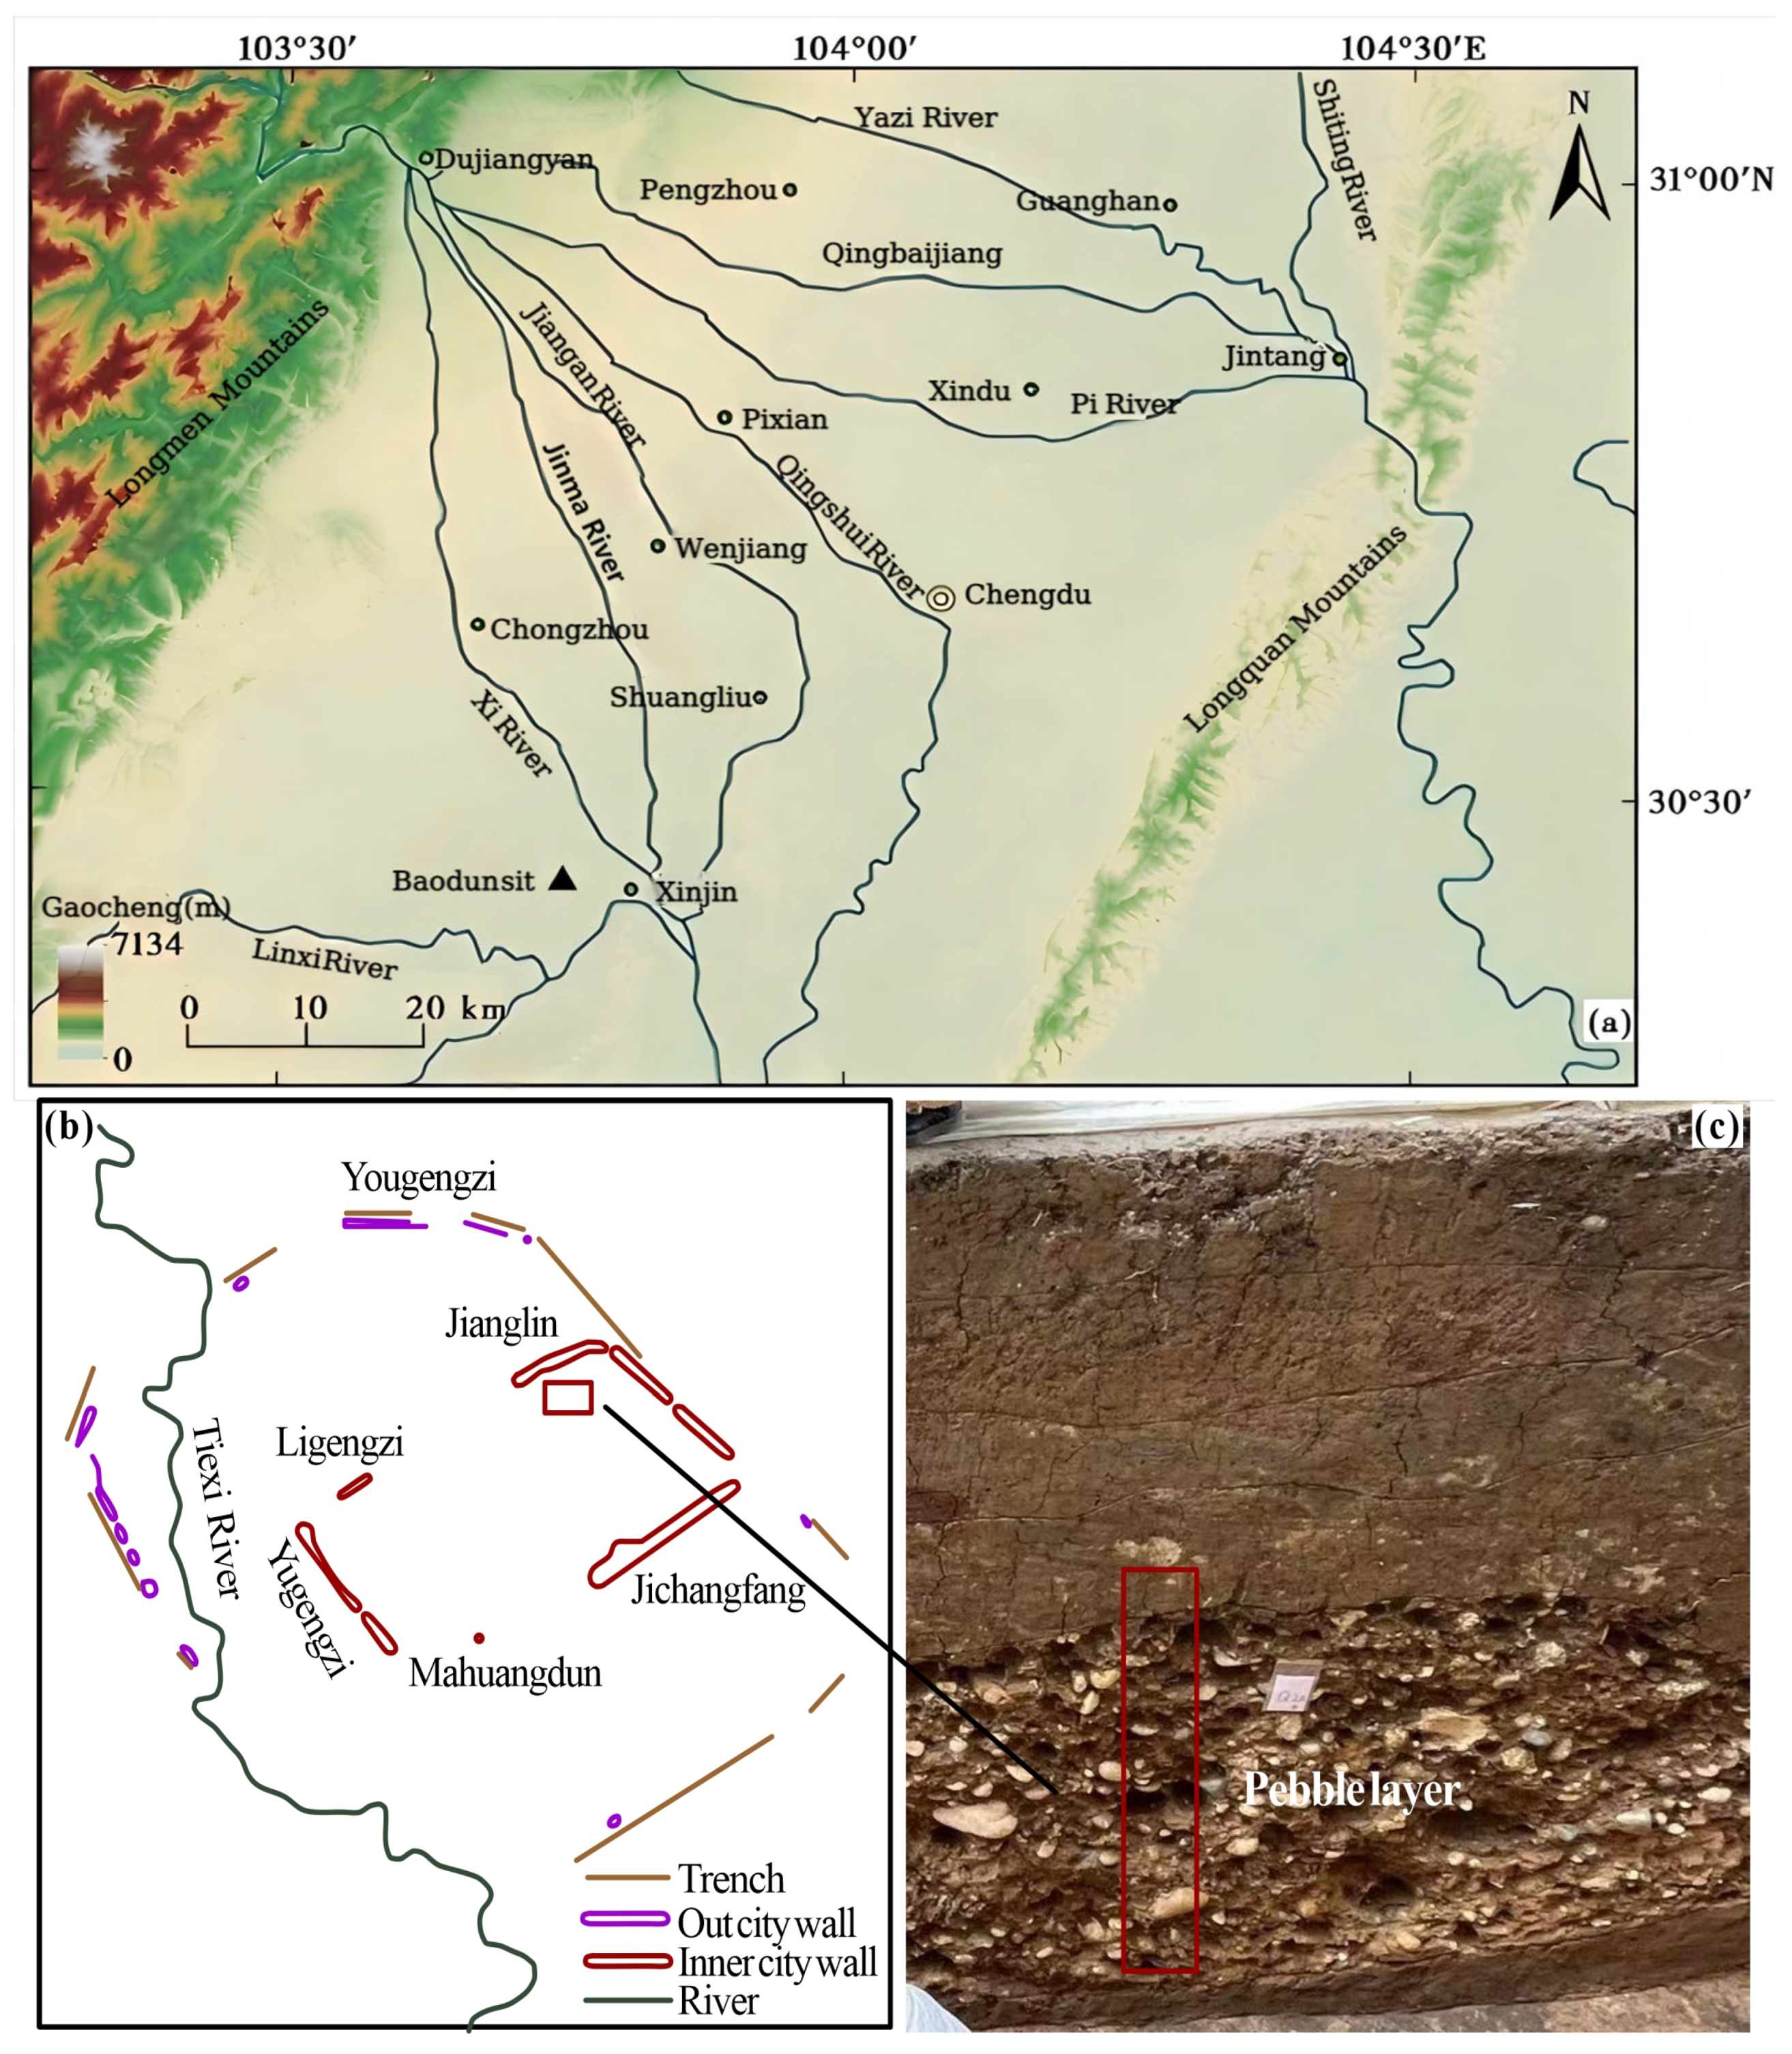
2.1. Regional Overview
2.2. Analysis of Acquired Seismic Data
2.3. Seismic Geological Method
2.4. Technical Difficulties of High-Resolution Seismic Detection
- (1)
- The excitation and reception conditions are relatively poor. The compacted rammed layer exhibits strong seismic wave absorption and attenuation, while the pebble layer produces pronounced scattering effects. Given the distinctive response of the pebble layer to the high-frequency components of seismic waves, how to effectively utilize controllable seismic sources with low energy and high frequency to enhance the signal-to-noise ratio and energy density of high-frequency components, and how to increase the number of single-point stacking iterations to several hundred in order to mitigate the loss of high-frequency energy remain key challenges in seismic data acquisition and processing.
- (2)
- The interpretation of two-dimensional seismic data presents significant challenges. The pebble layer is thin, closely spaced, and exhibits a relatively steep dip angle. Increasing the amount of energy transmitted downward, broadening the frequency bandwidth, and enhancing data resolution remain critical objectives in seismic data processing.
- (3)
- The survey area is characterized by highly active interference waves, which not only exhibit strong energy but also display complex propagation characteristics. Influenced by multiple factors—particularly refracted waves, diffracted waves, and surface waves [66]—the seismic data demonstrate significant heterogeneity and scattering in terms of energy, frequency, and phase. Therefore, under the premise of amplitude preservation and waveform fidelity, a key technical challenge lies in eliminating frequency variations and energy attenuation caused by surface conditions, source energy, and receiver performance [67], while implementing effective frequency decomposition to enhance the detectability of the pebble layer at subsurface reflection interfaces [68].
2.5. Two-Dimensional Seismic Data Processing
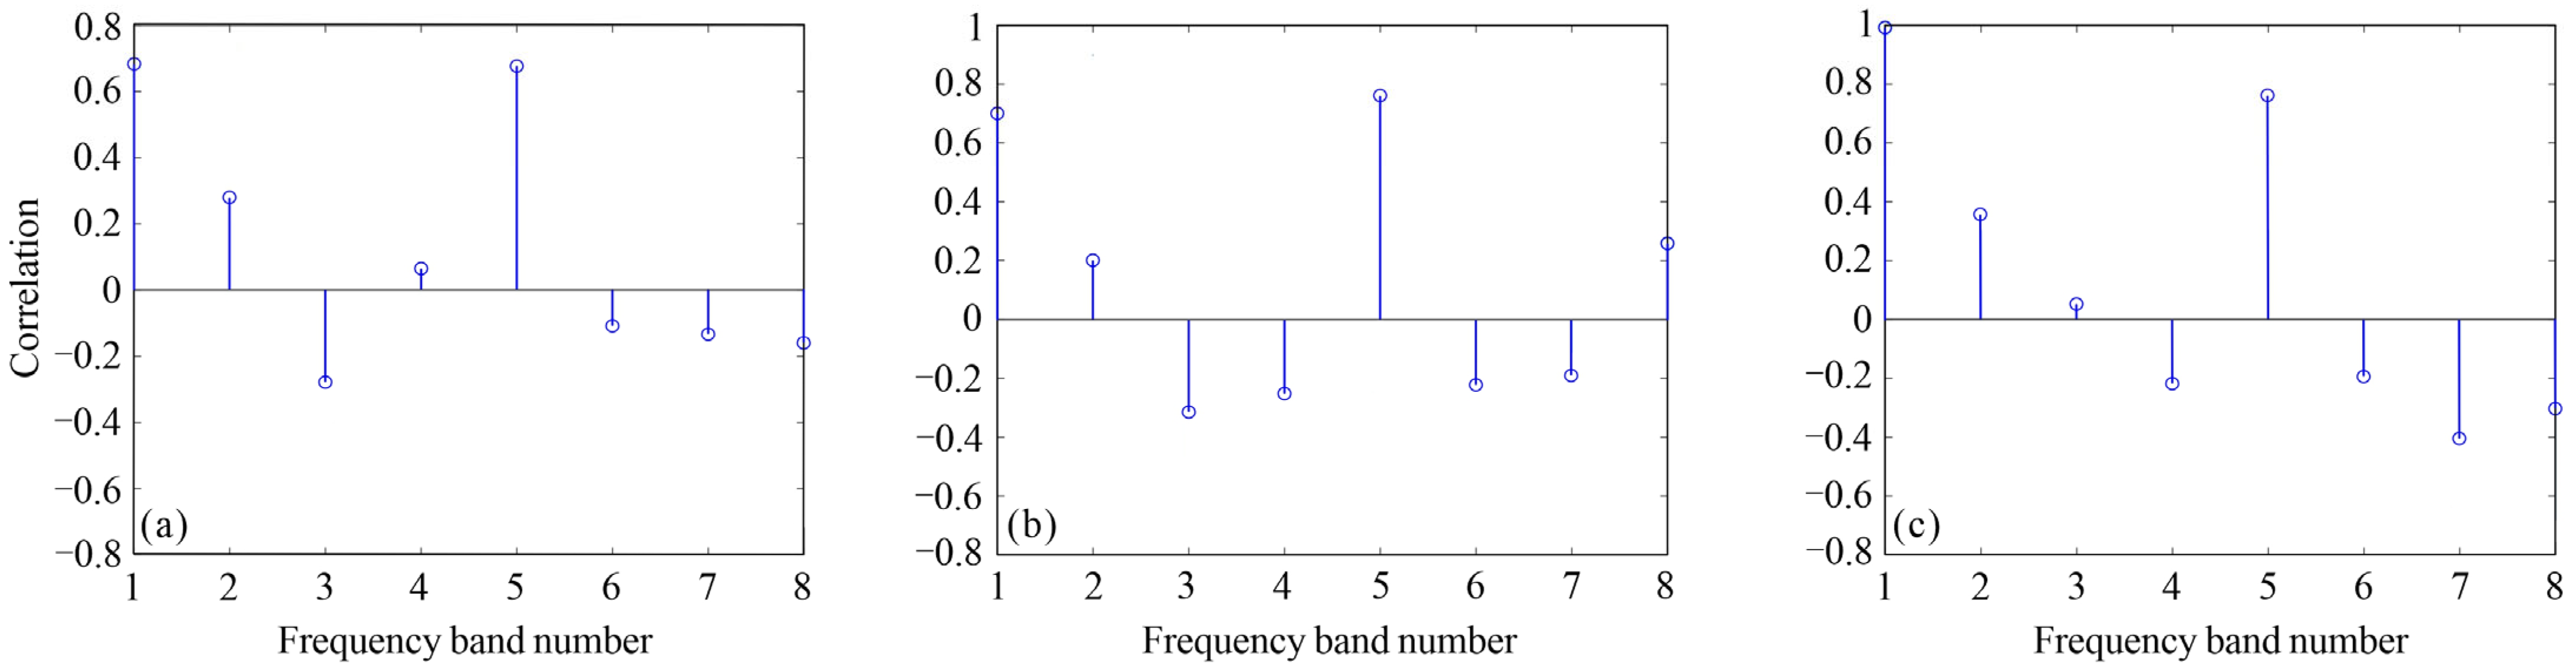
2.5.1. Frequency Division
2.5.2. Energy Curve
3. Results
3.1. Frequency Division Results
3.2. Energy Curve Characteristics
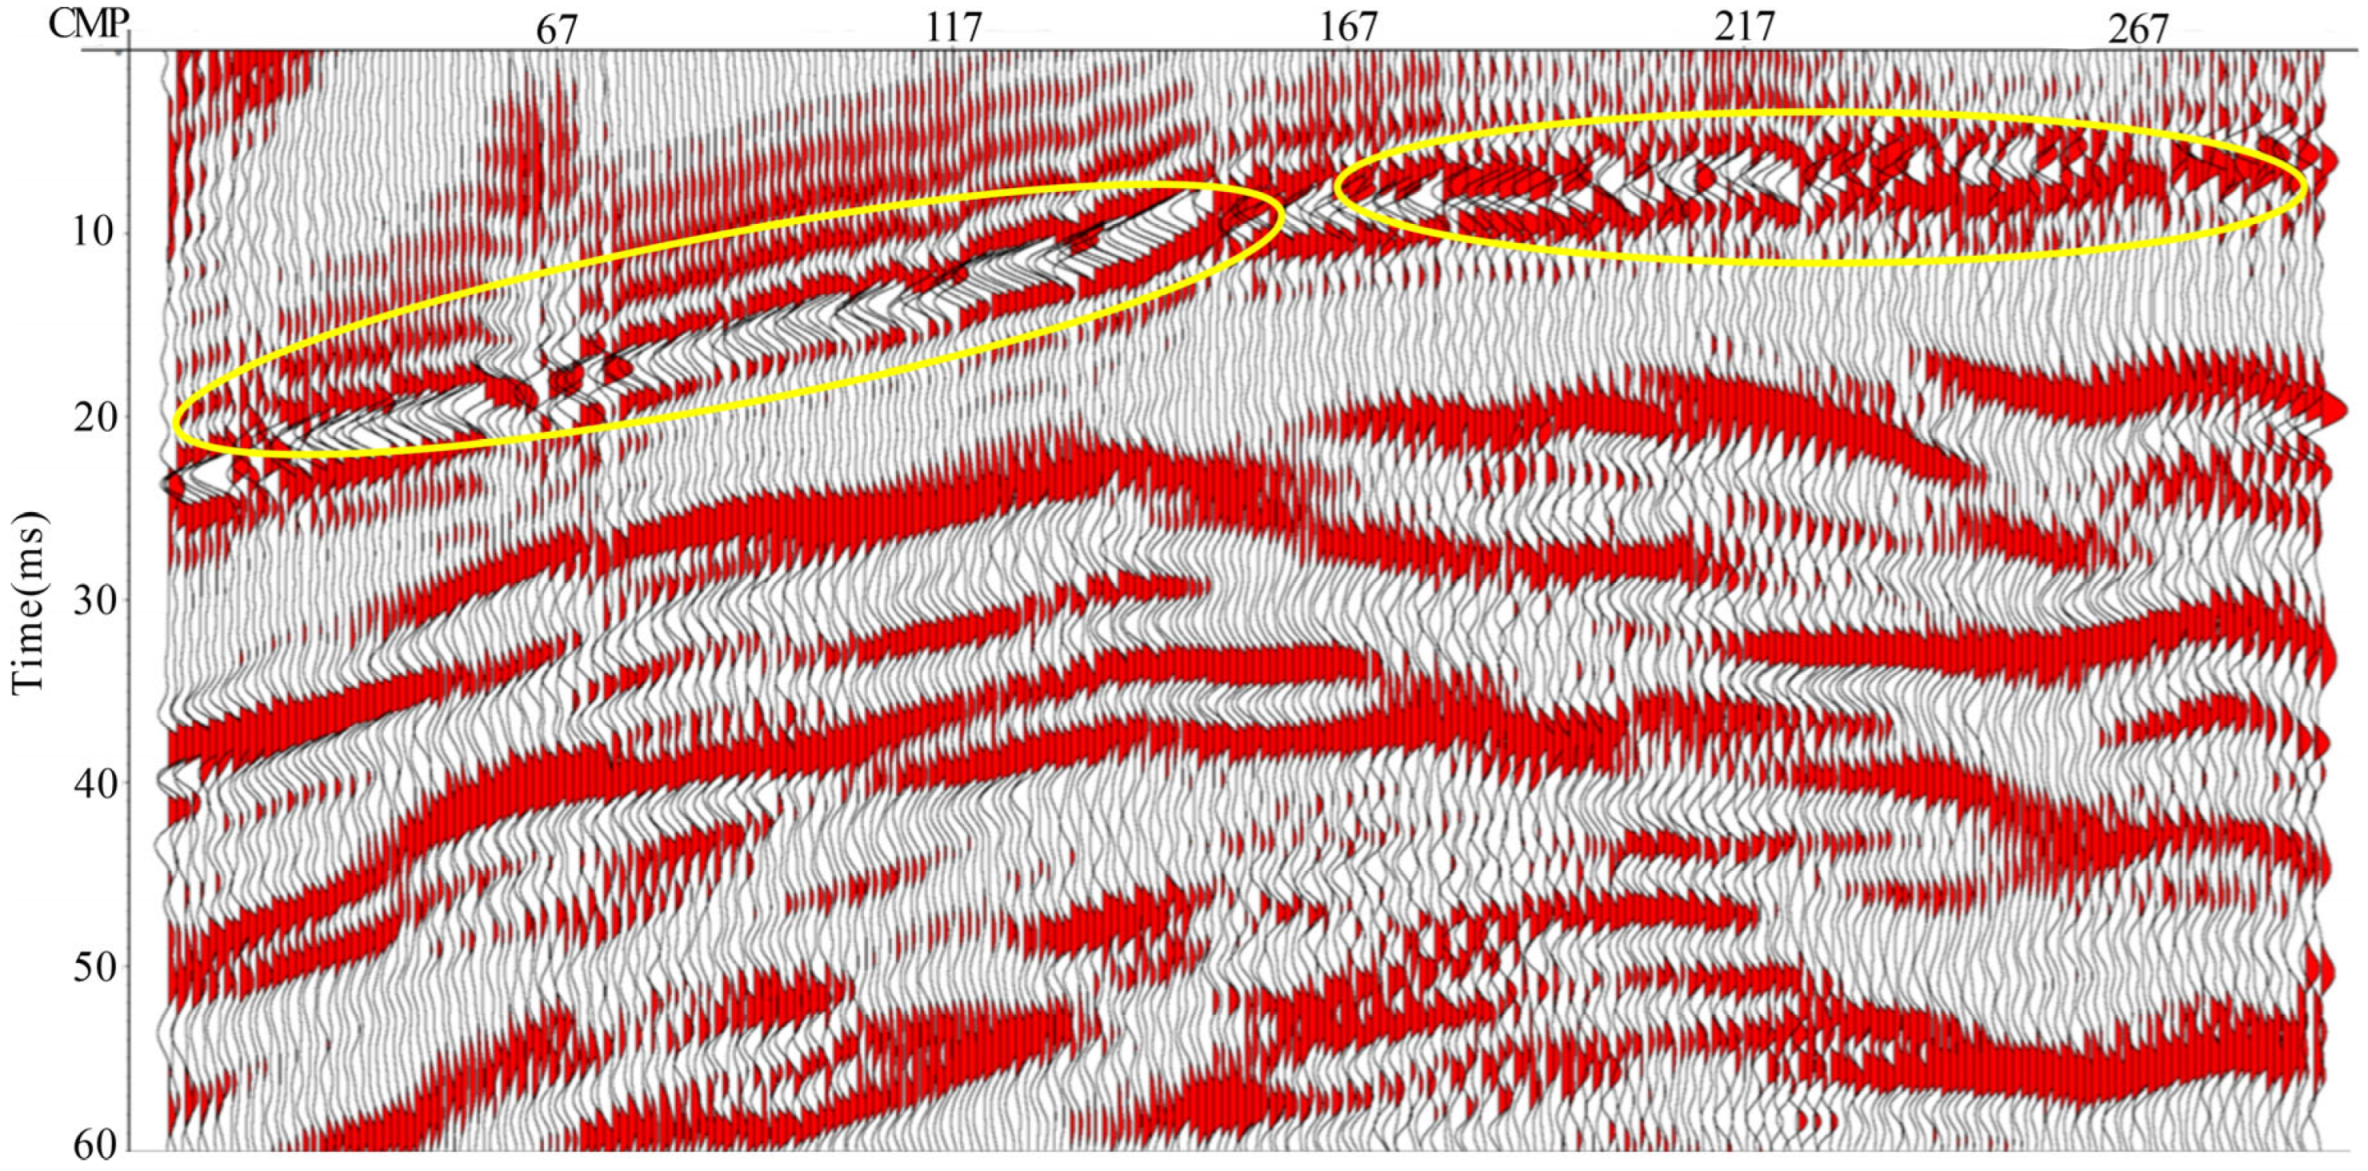
3.3. Results from Actual Data Application
4. Discussion and Conclusions
- (1)
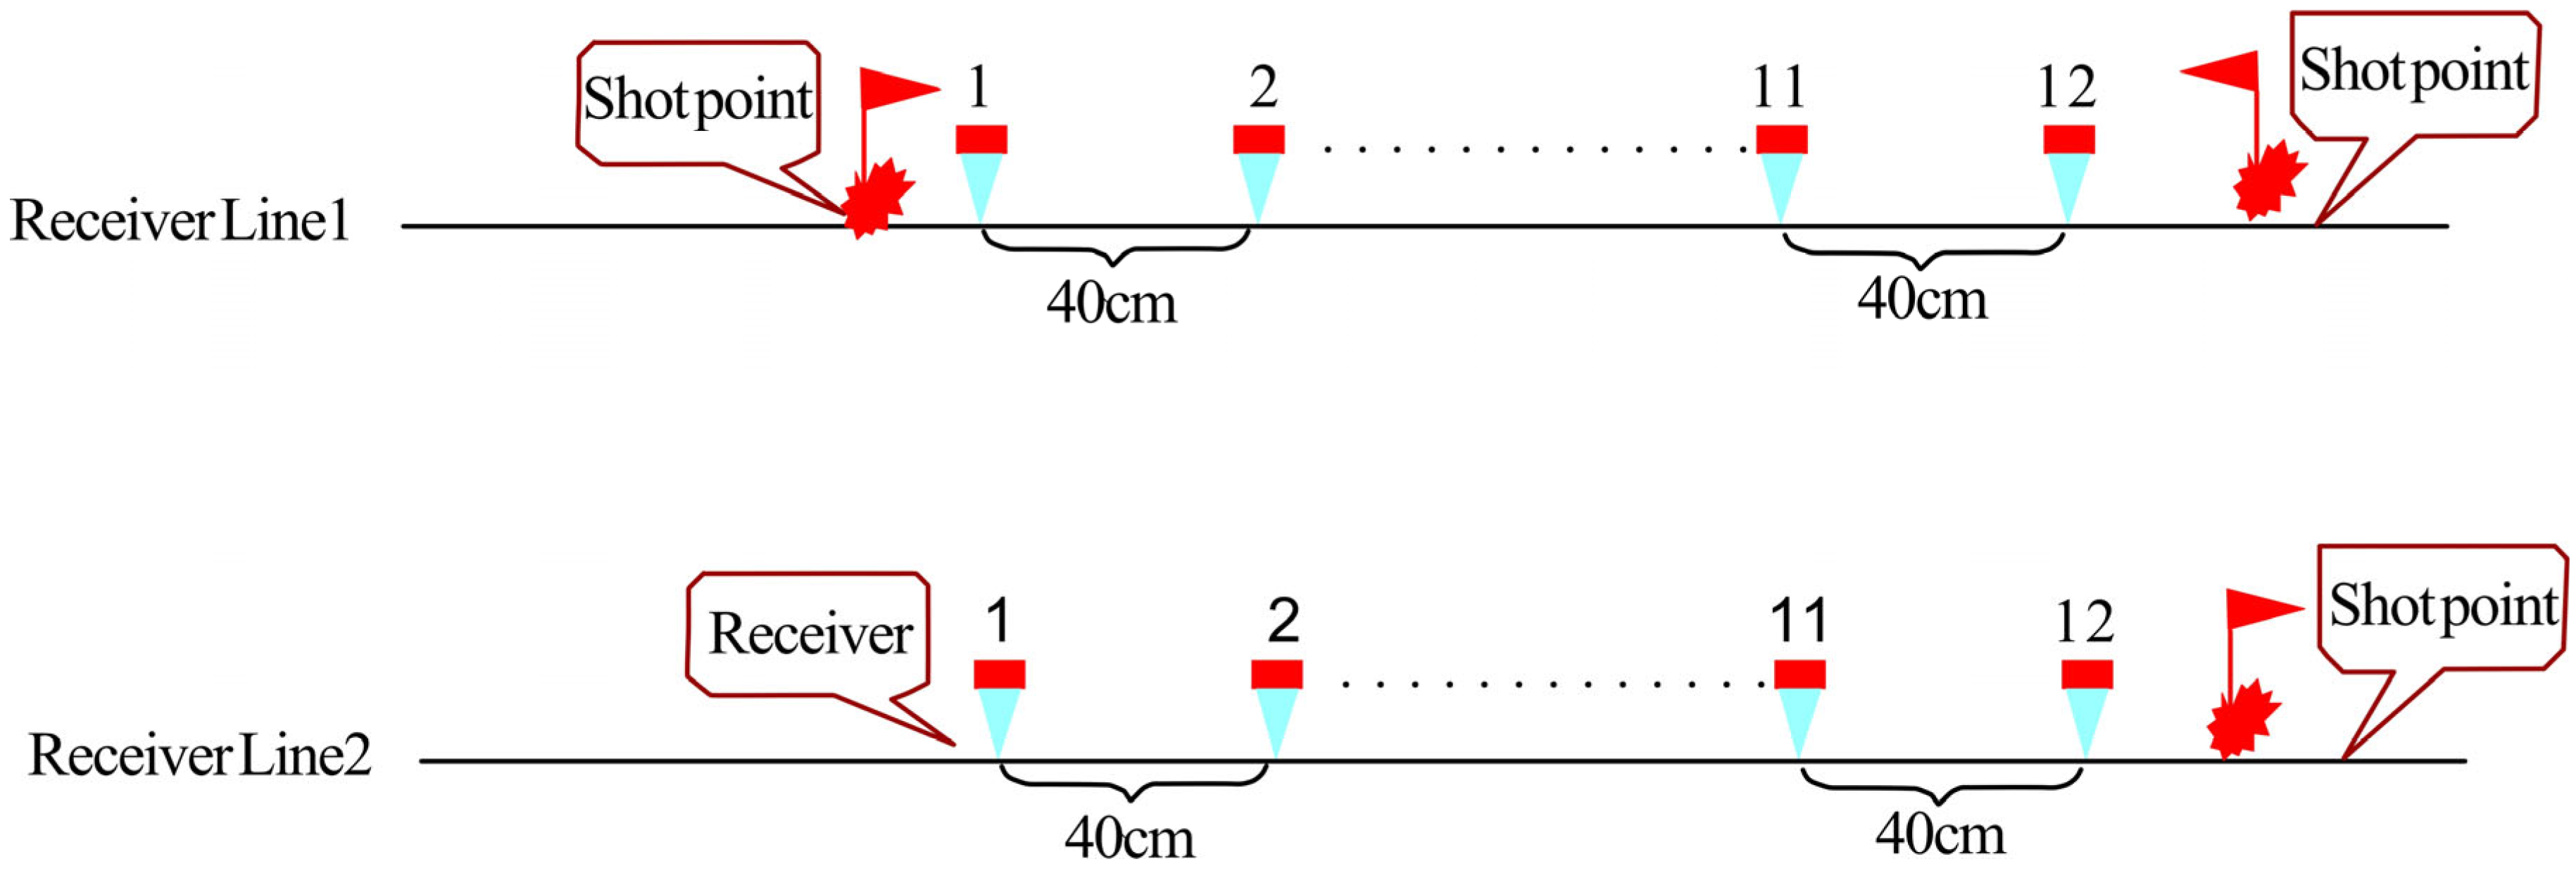
- In response to the complex seismogeological conditions of the western city wall at the Baodun site, this study systematically applied high-resolution seismic detecting techniques in combination with controllable high-frequency source excitation. A data acquisition system featuring high fold coverage and short offset distances was specifically designed to improve both the signal-to-noise ratio and the spatial resolution of the seismic dataset. By optimizing source excitation energy, the length of the receiver spread, and the geophone installation method, with particular emphasis placed on the influence of shallow pebble layer thickness, high-quality raw seismic data were acquired, providing a robust data foundation for subsequent high-resolution analysis.
- (2)
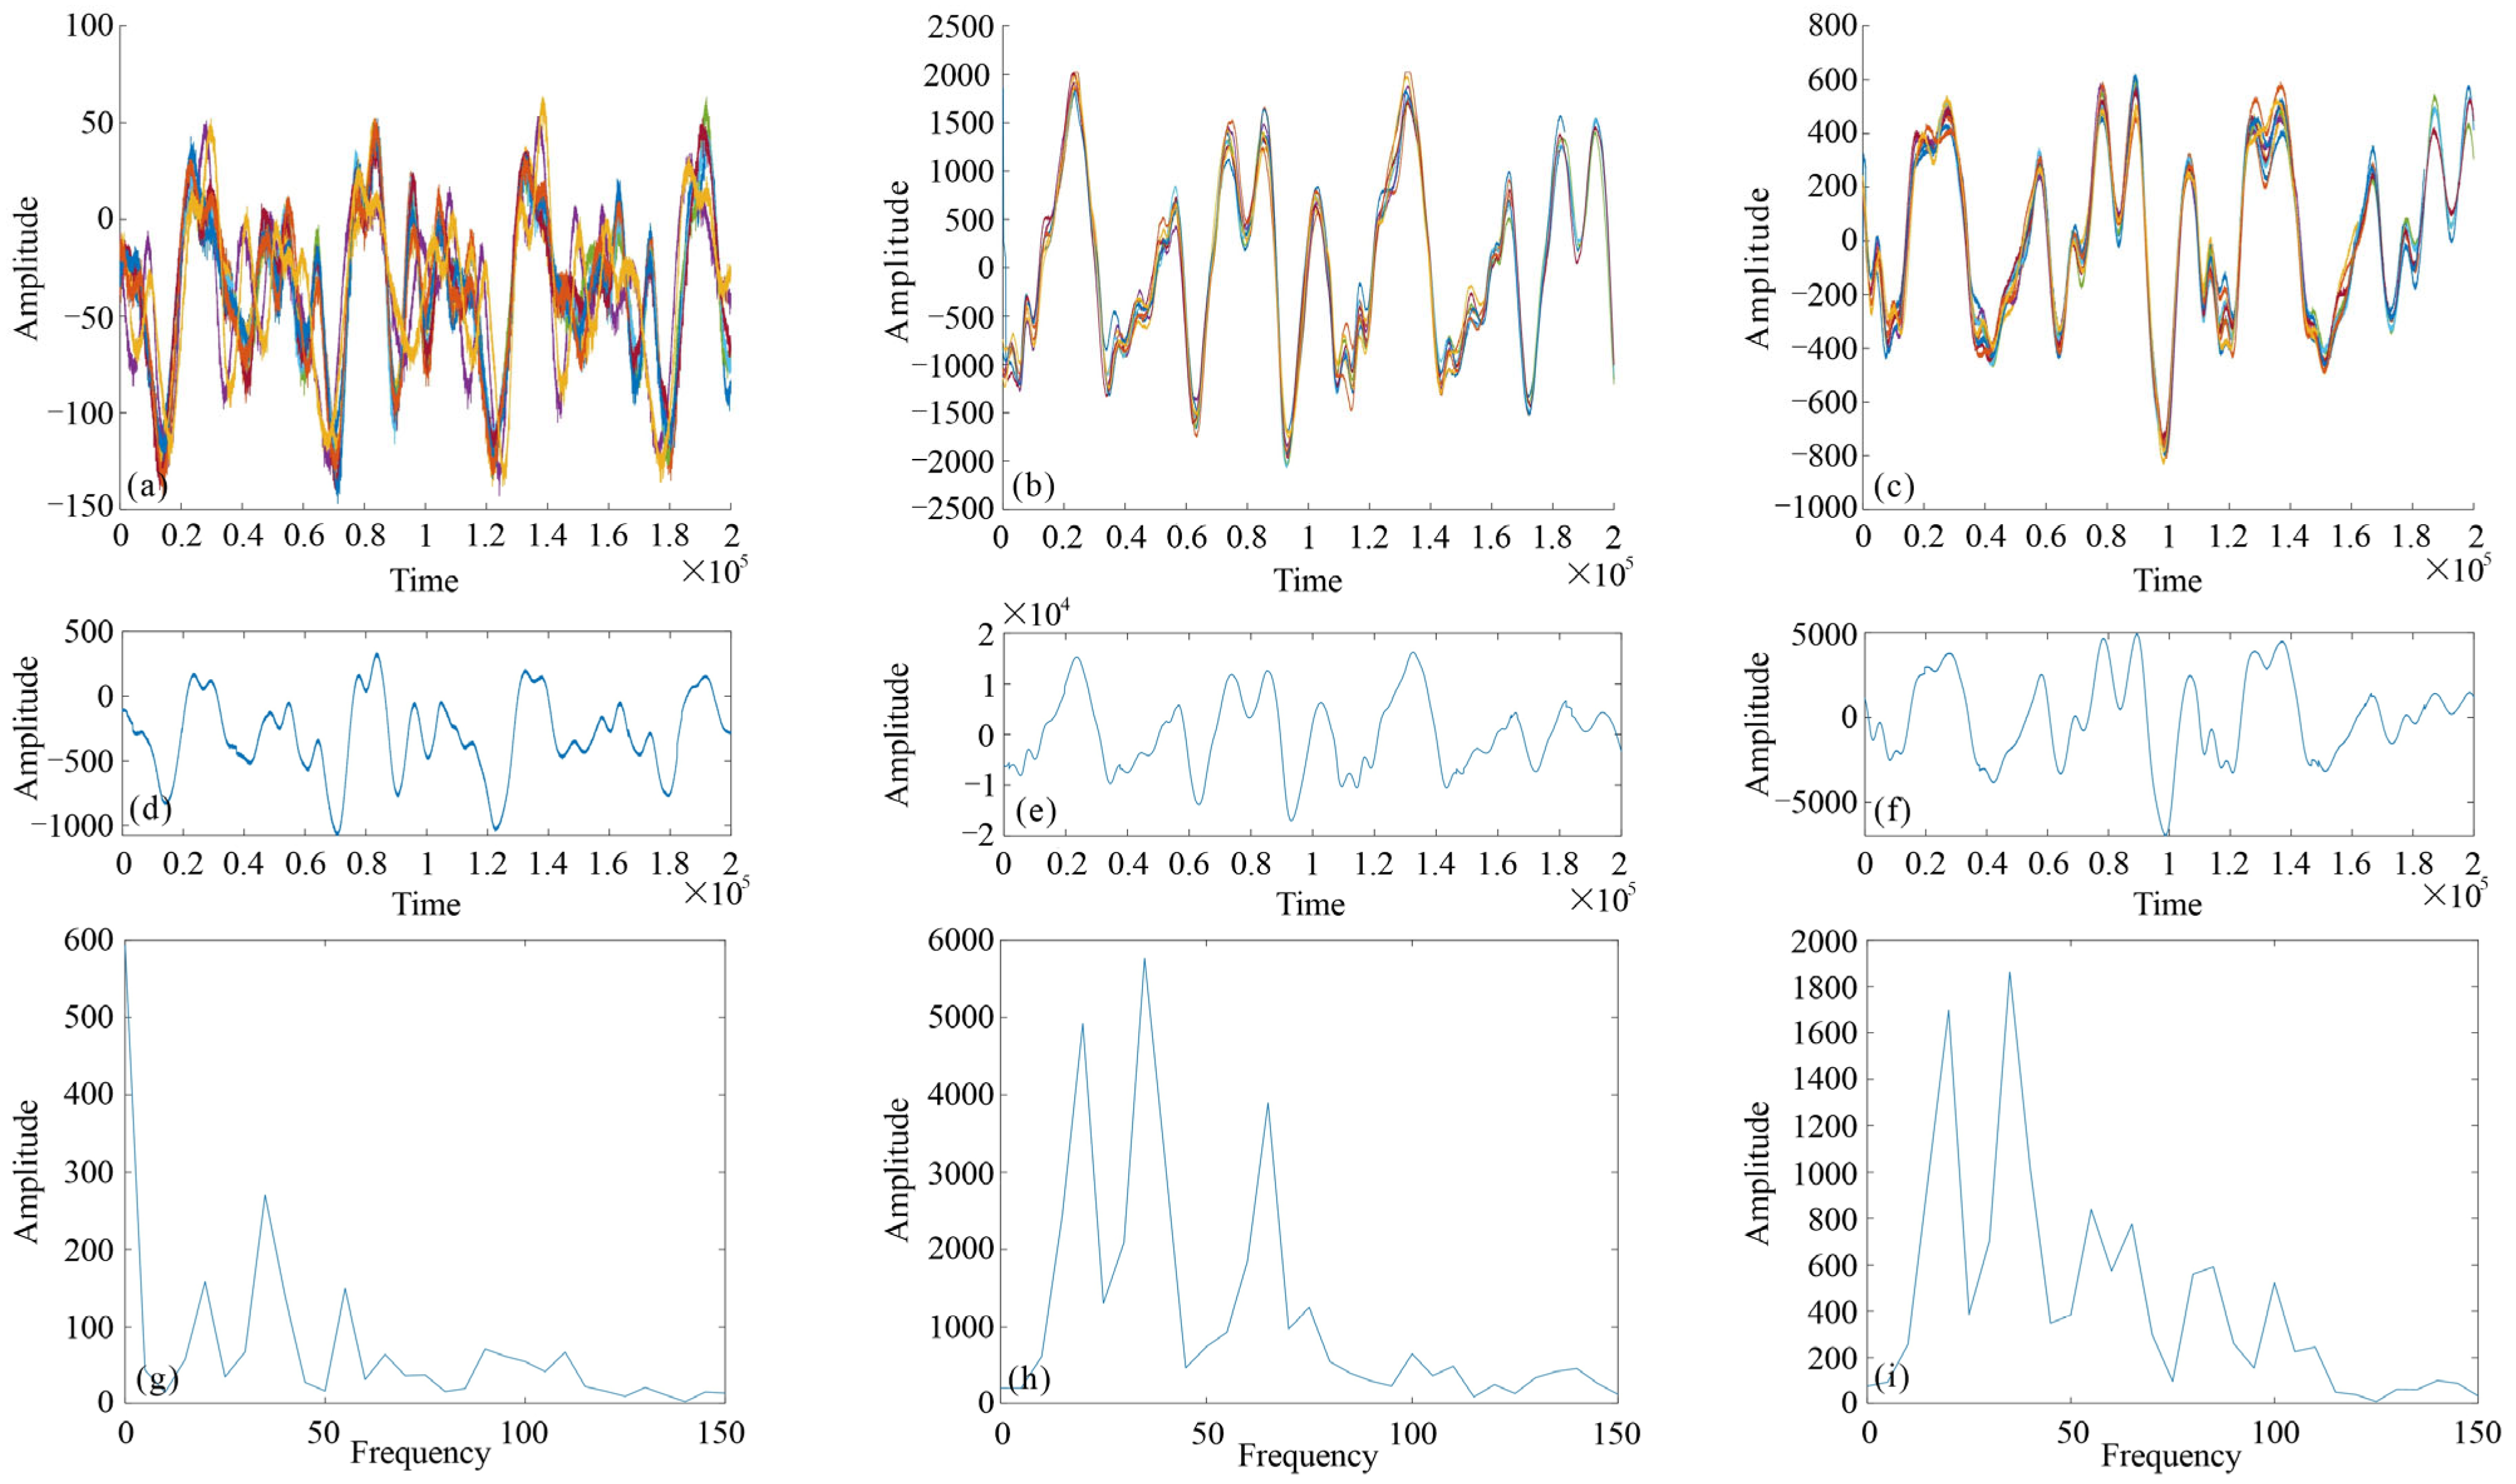
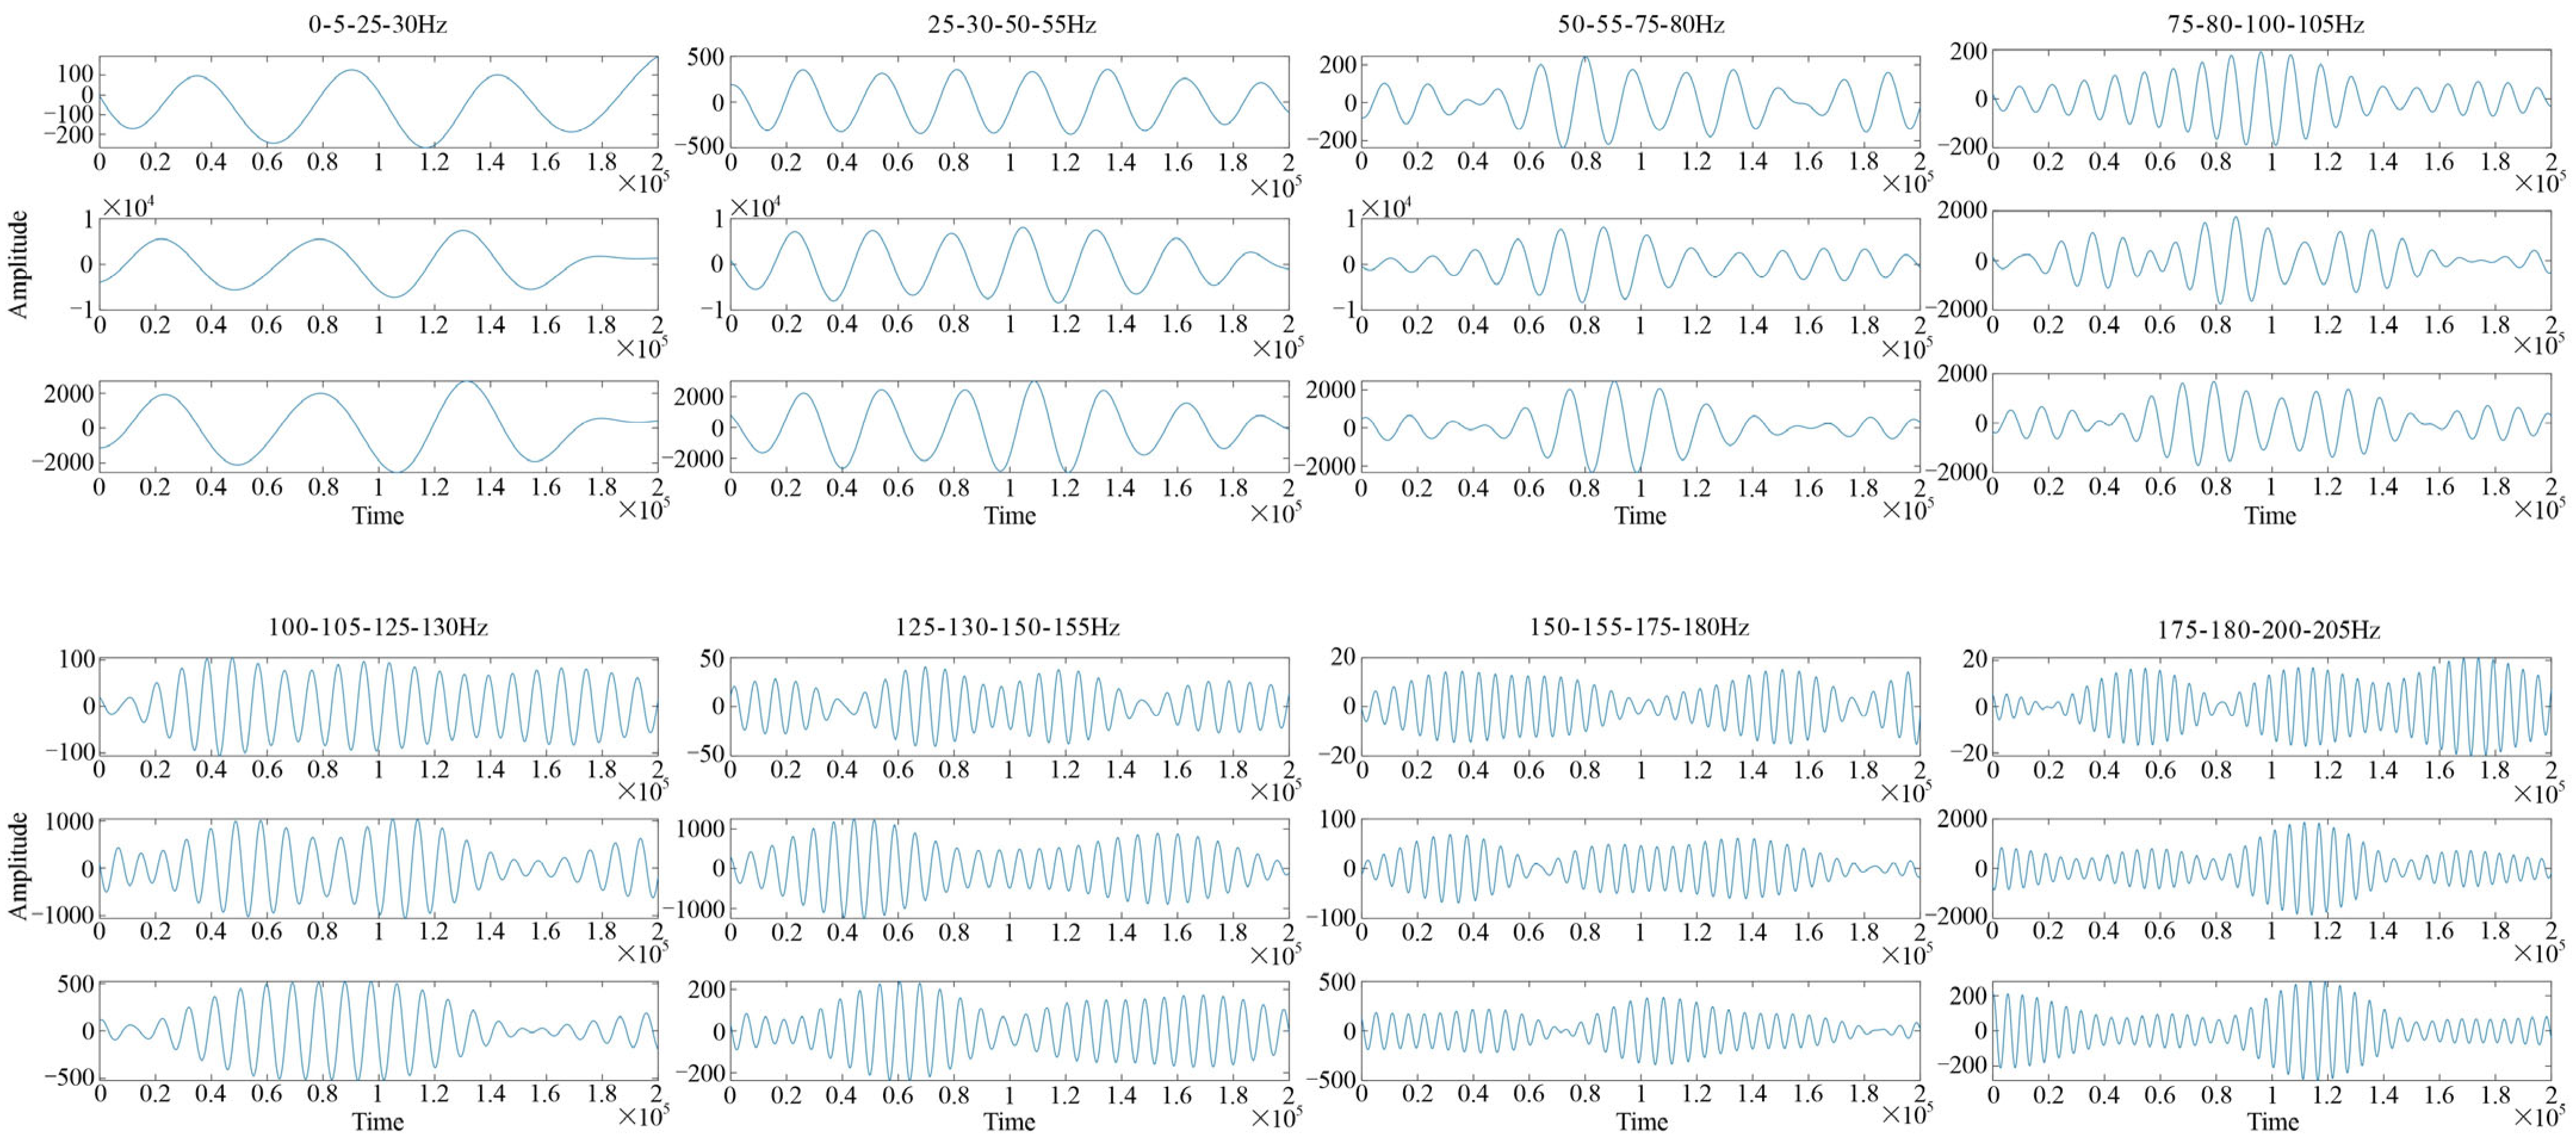
- By purposefully selecting suitable processing methods and testing analysis parameters, this study employed a frequency decomposition approach to effectively distinguish the dominant frequency bands associated with the rammed earth and pebble layers. The results reveal that the dominant frequency band of the rammed earth layer is primarily concentrated in the low-frequency range of 0–25 Hz, whereas that of the pebble layer lies within the high-frequency range of 75–105 Hz. This divergence in frequency distribution reflects a fundamental difference in their physical properties.
- (3)
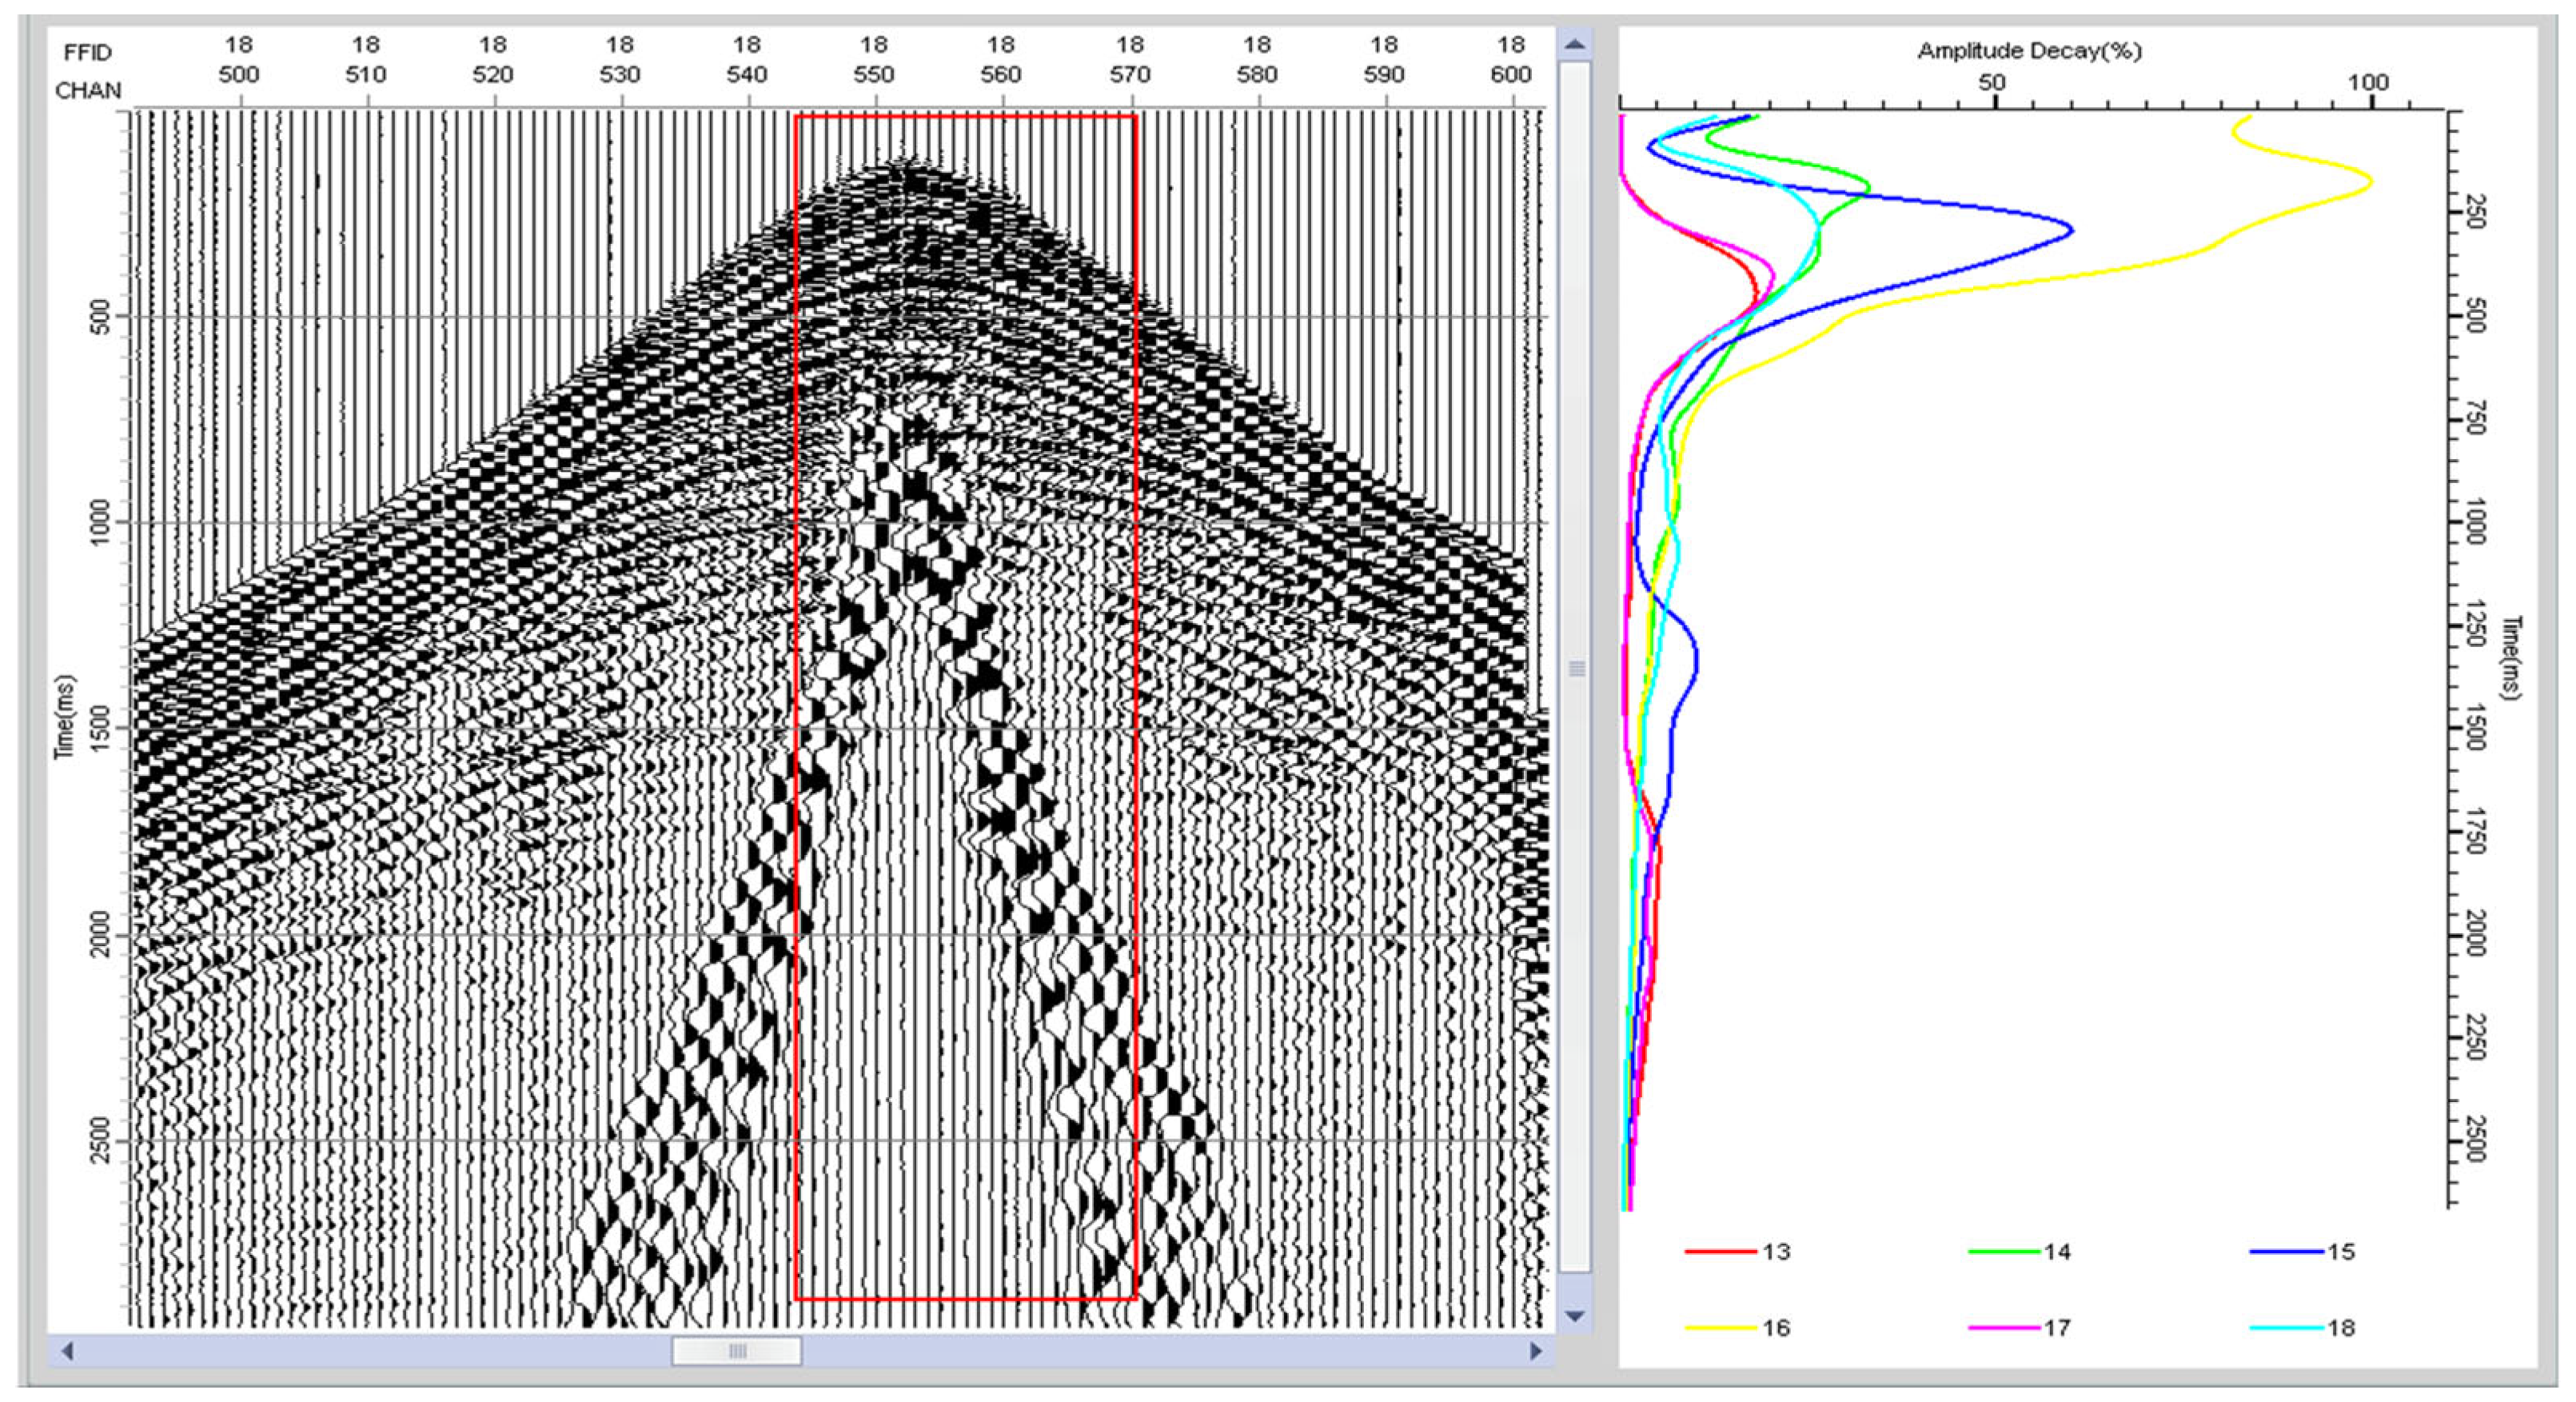
- Through the extraction and comparative analysis of energy curves, this study applied the short-time Fourier transform (STFT) to obtain amplitude spectra at different time-window positions. The spectral peak amplitude was used as an indicator of seismic energy to reveal the temporal evolution of energy characteristics in the seismic data. The energy curve analysis indicates that the energy of the rammed earth layer is primarily concentrated in the low-frequency range, reflecting its relatively homogeneous and compact structure, which facilitates the propagation of low-frequency seismic waves. In contrast, the energy curve of the pebble layer exhibits significant fluctuations in the high-frequency band, suggesting that its heterogeneous structure enhances the scattering and reflection of high-frequency seismic waves, leading to uneven energy distribution and pronounced high-frequency responses.
- (4)
- When seismic waves propagate across stratigraphic interfaces, phenomena such as reflection, refraction, and transmission occur due to impedance contrasts between adjacent layers. In identifying the boundary between the rammed earth layer and the pebble layer, significant contrasts in density and wave velocity lead to pronounced phase changes as seismic waves cross the interface. This study leverages this property to precisely delineate the interface position, thereby providing a reliable basis for identifying discontinuous stratigraphic units.
- (5)
- Through high-frequency seismic data acquisition, combined with specialized processing and interpretive analysis, the identification of the rammed earth layer and the pebble layer was successfully achieved, and the anomalous zones corresponding to the pebble layer response were clearly delineated. This high-frequency seismic approach overcomes the limitations of traditional geophysical methods in detecting pebble layers within shallow and complex subsurface environments, and demonstrates its effectiveness under such challenging conditions. These results not only provide essential technical support for the archaeological excavation and preservation of the Baodun city wall site, but also—by virtue of their non-destructive nature, high efficiency, and high precision—establish a new methodological paradigm for the detection of pebble layers in prehistoric settlement sites, with significant potential for broader application and dissemination.
- (6)
- To further enhance the universality and detection accuracy of the technique, future research may proceed from the perspectives of multi-method integration, intelligent data processing, and interdisciplinary collaboration. By incorporating ground-penetrating radar (GPR) or electrical resistivity tomography (ERT), the limitations of single-method approaches under high-moisture or deep subsurface conditions can be effectively addressed. The adoption of machine learning algorithms, such as deep learning, may facilitate the automated identification of stratigraphic features in seismic data, thereby reducing interpretation errors stemming from human subjectivity. In addition, the integration of micromorphological and spectrochemical analyses has the potential to reconstruct past human–environment interactions from multiple perspectives—for instance, by revealing the provenance characteristics of the pebble layer and its possible association with paleo-river dynamics.
Author Contributions
Funding
Data Availability Statement
Acknowledgments
Conflicts of Interest
References
- Jiang, Z.H.; Zhang, Q.; Wang, Y.; Jiang, C.; Lu, D.; Li, Y.F. A brief report on the 1996 excavation at the Baodun site in Xinjin County, Sichuan. Kaogu (Archeology) 1998, 1, 29–50+100. [Google Scholar]
- Jiang, Z.H.; Jiang, M.; He, K.Y.; Yan, B.; Jiang, S.L.; He, Q.; Li, P.; Li, Y.C.; Yan, B.; Chen, Y.J.; et al. Survey and preliminary excavation report of the Baodun site in Xinjin (2009–2010). Chengdu Kaogu Faxian (Chengdu Archaeol. Discov.) 2009, 1–67. [Google Scholar]
- Jiang, Z.H.; He, K.Y.; Zuo, Z.Q.; Li, P.; Chen, G.Y.; Yang, Y.P.; Wei, L.G.; Li, F.X.; Zeng, L.; Bai, T.Y.; et al. Archaeological excavation report of the Baodun site in Xinjin County (2012–2013). Chengdu Kaogu Faxian (Chengdu Archaeol. Discov.) 2014, 14–39. [Google Scholar]
- Jiang, C.; Yan, J.S. Survey and trial excavation of the Gucheng site in Pi County, Sichuan Province. Wenwu (Cult. Relics) 1999, 1, 32–42. [Google Scholar]
- Yan, J.S.; Chen, Y.H.; Tang, Z.H.; Jiang, S.L.; Dai, Z.M.; Chen, P.; Cheng, Y.F.; Dang, G.S.; Dang, G.P. Archaeological Excavation Results of the Ancient City Site in Pixian County, Sichuan Province, 1998–1999. Chengdu Kaogu Faxian (Chengdu Archaeol. Discov.) 1999, 29–39+320. [Google Scholar]
- Li, M.B.; Chen, Y.H. The 1999 excavation of the Yufu Village site in Wenjiang County. Chengdu Kaogu Faxian (Chengdu Archaeol. Discov.) 1999, 40–53. [Google Scholar]
- Wang, Y.; Kudō, M.; Ma, J.X.; Jiang, C.; Jiang, Z.H.; Lu, D.; Zhang, Q.; Fu, X.B.; Ni, L.Z.; He, Q.; et al. Brief report on the 1998 excavation at the Mangcheng site in Dujiangyan City. Chengdu Kaogu Faxian (Chengdu Archaeol. Discov.) 1999, 54–98. [Google Scholar]
- Wang, Y.; Kudō, M.; Ma, J.X.; Jiang, C.; Jiang, Z.H.; Mao, Q.X.; Yan, J.S.; Zhang, Q.; Xu, L.; Fu, X.B.; et al. A Brief Report on the 1999 Excavation of the Mangcheng Site in Dujiangyan City. Chengdu Kaogu Faxian (Chengdu Archaeol. Discov.) 1999, 99–126. [Google Scholar]
- Yan, J.S.; Jiang, Z.H.; Fan, T.Y. Survey and trial excavation of the Mangcheng site in Dujiangyan City, Sichuan. Kaogu (Archeology) 1999, 7, 14–27. [Google Scholar]
- Jiang, C.; Li, M.B. Brief report on the trial excavation of the Shuanghe prehistoric walled site in Chongzhou, Sichuan. Kaogu (Archeology) 2002, 11, 3–19+97+1. [Google Scholar]
- Zhong, Y.L.; Chen, J.; Liu, X.Y.; Zhou, Z.Q.; Bai, T.Y. Survey and trial excavation report of the Zizhu ancient city in Chongzhou. Chengdu Kaogu Faxian (Chengdu Archaeol. Discov.) 2014, 40–57+514–516. [Google Scholar]
- Liu, Y.M.; Wang, J.; Cheng, Y.F.; Li, Y.C.; Liu, X.Y.; Liao, X.B.; Zhu, Y.; Ji, W.; Yang, Y.; Cao, G.M.; et al. Brief report on the 2013 excavation of the Yandian ancient city site in Dayi County. Chengdu Kaogu Faxian (Chengdu Archaeol. Discov.) 2013, 45–65. [Google Scholar]
- Zhou, Z.Q.; Chen, J.; Li, J.; Lian, J.R.; Cai, Y.M.; Sun, C.; Liao, X.B.; Zhong, Y.L.; Yan, B.; Zuo, Z.Q.; et al. Brief report on the 2012–2013 survey and trial excavation of the Gaoshan ancient city site in Dayi County. Chengdu Kaogu Faxian (Chengdu Archaeol. Discov.) 2013, 1–4+681+5–44. [Google Scholar]
- Li, Z.M. Translation, from Academic Terminology to Exhibition Narrative: A Case Study of Baodun Museum. Chin. Mus. 2024, 5, 42–52. [Google Scholar]
- Huang, M. Prehistoric floods and water control documented at the archaeological sites in the Chengdu Plain. J. Earth Environ. 2024, 15, 193–206. [Google Scholar]
- Yang, L.H. A study of pebble remains at Baodun cultural sites in the Chengdu Plain. Zhonghua Wenhua Luntan (Forum Chin. Cult.) 2018, 3, 38–45. [Google Scholar]
- Yan, J.S.; Jiang, Z.H.; Zhang, Q.; Chen, Y.H. Brief report on the 1997 excavation of the Gucheng site in Pi County, Sichuan Province. Wenwu (Cult. Relics) 2001, 3, 52–68+1. [Google Scholar]
- Li, W.Q.; Huo, M.L.; Tian, X.L.; Fang, S.T. Application of microtremor detection technology based on SPAC method in subway engineering in water-rich sand pebble layer. Constr. Technol. (Chin. Engl. Ed.) 2023, 52, 55–62+75. [Google Scholar]
- Luo, L.; Wang, X.; Guo, H. Transitioning from remote sensing archaeology to space archaeology: Towards a paradigm shift. Remote Sens. Environ. 2024, 308, 114200. [Google Scholar] [CrossRef]
- Yao, Y.; Wang, X.; Luo, L.; Wan, H.; Ren, H. An overview of GIS-RS applications for archaeological and cultural heritage under the DBAR-heritage mission. Remote Sens. 2023, 15, 5766. [Google Scholar] [CrossRef]
- Qian, J.X. Remote sensing archaeology study on the Toqqouz Sarai City site in Xinjiang. J. Natl. Mus. China 2024, 5, 79–90. [Google Scholar]
- Wang, X.Y.; Luo, L. From remote sensing archaeology to space archaeology: A new task in the era of cultural heritage protection. J. Remote Sens. 2020, 24, 837–841. [Google Scholar]
- Tian, J.; Zhu, Y.C.; Li, L.Z.; Zhu, X.; Li, W.R.; An, X.L. Research on the prediction model of Neolithic archaeological sites based on GIS and XGBoost algorithm. J. Beijing Norm. Univ. (Nat. Sci.) 2025, 61, 1–15. [Google Scholar]
- Zhang, Y.X.; Wang, N.Y.; Zhang, X. Identification of archaeological sites based on CORONA stereo image pairs. Nanfang Wenwu (Cult. Relics South. China) 2024, 3, 257–265. [Google Scholar]
- Qian, J.X. The Practice of Drones Photography in the Archaeological Research of Earthen Mound Tombs in Southern Anhui. Southeast Cult. 2021, 5, 123–132. [Google Scholar]
- Tian, S.L.; Qin, G.M.; Qiao, B.T.; Wang, W.; Xian, Y.H.; Yu, C. Spatial archaeological surface survey method in complex occurrence environment supported by airborne LiDAR. J. Northwest Univ. (Nat. Sci. Ed.) 2025, 55, 139–149. [Google Scholar]
- Chen, M.H.; Ji, X.; Chen, Q.H.; Zhang, N.Z.; Zhang, Y.X.; Wang, Y.Y. Brief report on the 2020–2021 excavation of Liangzhu remains at the Beicun South locus of the Beicun site in Yuhang District, Hangzhou City. Kaogu (Archeology) 2024, 6, 3–18+121+2. [Google Scholar]
- Xu, D.Y.; Ran, H.L. Brief report on the 2022–2023 excavation at the Zhenwu Palace locus of the Sanxingdui site in Guanghan City, Sichuan. Sichuan Wenwu (Sichuan Cult. Relics) 2025, 2, 20–42+2+121. [Google Scholar]
- Hu, Y. Research on Partial Structure Extraction and Segmentation of Terracotta Warrior 3D Model Based on Deep Learning Method. Ph.D. Thesis, Northwest University, Xi’an, China, 2022. [Google Scholar]
- Zhou, M.Q.; Chu, T.; Geng, G.H.; Yao, W.M.; Zhang, J.; Cao, X. Three-dimensional cultural relic hole repair method combining structure and texture. Opto-Precis. Eng. 2022, 30, 894–907. [Google Scholar] [CrossRef]
- Yan, S. Research on Terracotta Warriors Face Recognition and Classification Based on Deep Learning. Ph.D. Thesis, Beijing University of Civil Engineering and Architecture, Beijing, China, 2024. [Google Scholar]
- Zhang, H.W.; Bao, Y.Y.; Zhang, R.; Meng, B.L.; Cai, Y.J.; Cheng, H. Characteristics and formation mechanism of stalagmite laminae in E’mei Cave, Jiangxi Province, China. Quat. Res. 2022, 42, 1148–1158. [Google Scholar]
- Chen, J.; Qiu, Y. Archaeological studies of prehistoric walled sites in the Chengdu Plain: Review and prospects. Zhongguo Wenhua Yichan (China Cult. Herit.) 2015, 6, 14–25. [Google Scholar]
- Xia, Y.; Ma, Q.; Zhang, Z.; Liu, Z.; Fang, J.; Shao, A.; Wang, W.; Fu, Q. Development of Chinese barium copper silicate pigments during the Qin Empire based on Raman and polarized light microscopy studies. J. Archaeol. Sci. 2014, 49, 500–509. [Google Scholar] [CrossRef]
- Ji, J.; Tan, P.P.; Yang, J.C. SEM-EDS analysis of manufacturing techniques of gold artifacts from the pre-Qin to Han dynasty. China Cult. Relics Sci. Technol. Res. 2022, 1, 64–71. [Google Scholar]
- Wu, J.T. Application of micro-area line scanning and surface scanning analysis technology in cultural relic conservation and scientific archaeology. Dongfang Shoucang (Orient. Collect.) 2024, 9, 58–61. [Google Scholar]
- Lü, Q.Q.; Wu, Y. LA-ICP-MS analysis of corroded glass beads from Southern China: Tackling highly inhomogeneous archaeological glass. STAR Sci. Technol. Archaeol. Res. 2019, 5, 53–63. [Google Scholar] [CrossRef]
- Guo, X.Q.; Sun, X.F.; Yi, S.W.; Wang, S.J.; Li, Y.H.; Wang, Y.H.; Zhou, Y.D. Age and environment of the Mandelashan lithic site in central Inner Mongolia. Acta Anthropol. Sin. 2025, 1–12. [Google Scholar]
- Lü, Y.; Zhang, J.P.; Tang, M.; Yang, Z.F.; Huang, M.; Jiang, M.; Min, X.; Shao, K.L.; Wen, C.H.; Ye, M.L.; et al. Phytolith analysis reveals the agricultural development and environmental background of the pre-Qin period in Chengdu Plain—A case study of Baodun and Sanxingcun sites. Quat. Res. 2021, 41, 1475–1488. [Google Scholar]
- Li, N.; He, J.N.; Lei, X.S.; Zhong, J.R.; Wu, X.H.; Yang, Y.L.; Pan, Y. Hierarchical structure and spatial variation: Stable isotopic analysis of Western Zhou-dynasty human remains from the Zhouyuan site. Kaogu Yu Wenwu (Archaeol. Cult. Relics) 2023, 6, 117–124. [Google Scholar]
- Ma, X.Z.; Yang, L.W.; Niu, S.R.; Zhong, J. Application of geophysical exploration technology in archaeological survey: A case study of the Qicheng site, Puyang, Henan Province. Zhongyuan Wenwu (Cult. Relics Cent. China) 2017, 2, 92–99. [Google Scholar]
- Liu, H.P.; Wang, S.; Liu, X.D.; Song, F.Z.; Zhang, Z. Application of comprehensive geophysical exploration in the archaeology of hidden pit outside Baling Mausoleum. Shaanxi Geol. 2022, 40, 94–97. [Google Scholar]
- Yang, H.; Zou, J.; Cheng, D.D.; Yu, J.L. Application of ground-penetrating radar in detecting the internal structures of the ancient Great Wall in Linhai City. Geophys. Geochem. Explor. 2024, 48, 1741–1746. [Google Scholar]
- Suo, R.Y. Design and implementation of archaeology excavation information system based on 3D WebGIS. Mod. Surv. Mapp. 2024, 47, 62–69. [Google Scholar]
- Li, Z.; Li, M.S.; Li, Y. Study on the early warning scene of beacon fire on the Ming Great Wall based on auxiliary beacon digital archaeological survey. Aerosp. Recovery Remote Sens. 2023, 44, 1–12. [Google Scholar]
- Bai, Y.F. Application of Photoscan Multi-View 3D Reconstruction Technology in the Protection of Earthen Sites. Ph.D. Thesis, Northwest University, Xi’an, China, 2017. [Google Scholar]
- Abudeif, A.M.; Abdel Aal, G.Z.; Abdelbaky, N.F.; Abdel Gowad, A.M.; Mohammed, M.A. Evaluation of engineering site and subsurface structures using seismic refraction tomography: A case study of Abydos.site, Sohag governorate, Egypt. Appl. Sci. 2023, 13, 2745. [Google Scholar] [CrossRef]
- Selim, E.I.; Basheer, A.A.; Elqady, G.; Hafez, M.A. Shallow seismic refraction, two-dimensional electrical resistivity imaging, and ground penetrating radar for imaging the ancient monuments at the western shore of Old Luxor city, Egypt. Archaeol. Discov. 2014, 2, 31–43. [Google Scholar] [CrossRef]
- Martorana, R.; Capizzi, P.; Pisciotta, A.; Scudero, S.; Bottari, C. An overview of geophysical techniques and their potential suitability for archaeological studies. Heritage 2023, 6, 2886–2927. [Google Scholar] [CrossRef]
- El-khteeb, A.; Mabrouk, W.M.; Soliman, K.S.; EL Aguizy, O.M.; Metwally, A. Archeological exploration via integrated shallow geophysical methods: Case study from Saqqara, Giza, Egypt. npj Herit. Sci. 2025, 13, 38. [Google Scholar] [CrossRef]
- Trebsche, P.; Schlögel, I.; Flores-Orozco, A. Combining geophysical prospection and core drilling: Reconstruction of a Late Bronze Age copper mine at Prigglitz-Gasteil in the Eastern Alps (Austria). Archaeol. Prospect. 2022, 29, 557–577. [Google Scholar] [CrossRef]
- Schwellenbach, I.; Hinzen, K.G.; Petersen, G.M.; Bottari, C. Combined use of refraction seismic, MASW; and ambient noise array measurements to determine the near-surface velocity structure in the Selinunte Archaeological Park, SW Sicily. J. Seismol. 2020, 24, 753–776. [Google Scholar] [CrossRef]
- Allen, M.D.; Stewart, R.R. Seismic and radar tomography of a Maya pyramid ruin. CREWES Res. Rep. 2008, 20, 2008-55. [Google Scholar]
- Shin, Y.H.; Shin, S.Y.; Rastiveis, H.; Cheng, Y.T.; Zhou, T.; Liu, J.; Habib, A. UAV-based remote sensing for detection and visualization of partially-exposed underground structures in complex archaeological sites. Remote Sens. 2023, 15, 1876. [Google Scholar] [CrossRef]
- Sylaiou, S.; Tsifodimou, Z.E.; Evangelidis, K.; Stamou, A.; Tavantzis, I.; Skondras, A.; Stylianidis, E. Redefining Archaeological Research: Digital Tools, Challenges, and Integration in Advancing Methods. Appl. Sci. 2025, 15, 2495. [Google Scholar] [CrossRef]
- Jenkins, E.; Galbraith, J.; Paltseva, A. Portable X-Ray Fluorescence as a Tool for Urban Soil Contamination Analysis: Accuracy, Precision, and Practicality. EGUsphere 2024, 1–26. [Google Scholar]
- Capozzoli, L.; Giampaolo, V.; De Martino, G.; Perciante, F.; Lapenna, V.; Rizzo, E. ERT and GPR prospecting applied to unsaturated and subwater analogue archaeological site in a full scale laboratory. Appl. Sci. 2022, 12, 1126. [Google Scholar] [CrossRef]
- Klanica, R.; Křivánek, R.; Grison, H.; Tábořík, P.; Šteffl, J. Capabilities and limitations of electrical resistivity tomography for map** and surveying hillfort fortifications. Archaeol. Prospect. 2022, 29, 401–416. [Google Scholar] [CrossRef]
- Plekhov, D.; Gosner, L.R.; Smith, A.J.; Nowlin, J. Applications of satellite remote sensing for archaeological survey: A case study from the Sinis Archaeological Project, Sardinia. Adv. Archaeol. Pract. 2020, 8, 192–205. [Google Scholar] [CrossRef]
- Inomata, T. Lidar, Space, and Time in Archaeology: Promises and Challenges. Annu. Rev. Anthropol. 2024, 53, 75–92. [Google Scholar] [CrossRef]
- Huang, M.; Ma, C.M.; He, K.Y.; Tang, M.; Xu, J.J.; Zhu, C. Environmental changes and human activities recorded by the pollen in the middle–late Holocene at Baodun site, Chengdu Plain. Quat. Res. 2022, 42, 1078–1093. [Google Scholar]
- Ye, Q. Prehistoric walled sites in the Chengdu Plain. Wenwu Jianding Yu Jiashang (Cult. Relics Apprais. Apprec.) 2020, 20, 155–157. [Google Scholar]
- Moustafa, S.S.R.; Mohamed, G.E.A.; Elhadidy, M.S.; Abdalzaher, M.S. Machine learning regression implementation for high-frequency seismic wave attenuation estimation in the Aswan Reservoir area, Egypt. Environ. Earth Sci. 2023, 82, 307. [Google Scholar] [CrossRef]
- Xue, Y.; Cao, J.; Wang, X.; Li, Y.; Du, J. Recent developments in local wave decomposition methods for understanding seismic data: Application to seismic interpretation. Surv. Geophys. 2019, 40, 1185–1210. [Google Scholar] [CrossRef]
- Guo, X.; Gao, J.; Yong, X.; Li, S.; Gui, J.; Wang, H. A novel high-resolution imaging method based on sparsity in the time domain and spectral fitting in the frequency domain. Front. Earth Sci. 2024, 12, 1247554. [Google Scholar] [CrossRef]
- Sun, L.; Zheng, X.; Ding, L.; Shou, H.; Li, H. Automatic Identification of Strong Energy Noise in Seismic Data Based on U-Net. IEEE Trans. Geosci. Remote Sens. 2023, 61, 1–11. [Google Scholar] [CrossRef]
- Zhang, H.B. Research and Application of Special High Precision Seismic Acquisition Method in Complex Surface Area. Ph.D. Thesis, Chengdu University of Technology, Chengdu, China, 2020. [Google Scholar]
- Duan, C.X.; Liang, Y.; Fan, X.H.; Zhang, F.C.; Wu, J. Research on high-resolution seismic data processing method based on adaptive VMD. CT Theory Appl. 2022, 31, 135–148. [Google Scholar]
- Dong, L.; Song, D.; Liu, G. Seismic wave propagation characteristics and their effects on the dynamic response of layered rock sites. Appl. Sci. 2022, 12, 758. [Google Scholar] [CrossRef]
- Hu, T.; Xu, B.; Wang, Y.; Zhu, J.; Zhou, J.; Wan, Z. Mine Microseismic Signal Denoising Based on a Deep Convolutional Autoencoder. Shock. Vib. 2023, 2023, 6225923. [Google Scholar] [CrossRef]
- Shenoi, B.A. Introduction to Digital Signal Processing and Filter Design; Wiley: Hoboken, NJ, USA, 2005. [Google Scholar]
- Jenitta, J.; Rajeswari, A. An Optimized Baseline Wander Removal Algorithm Based on Ensemble Empirical Mode De-composition. IAENG Int. J. Comput. Sci. 2015, 42. [Google Scholar]
- Tao, R.; Deng, B.; Zhang, W.Q.; Wang, Y. Sampling and sampling rate conversion of band limited signals in the fractional Fourier transform domain. IEEE Trans. Signal Process. 2007, 56, 158–171. [Google Scholar] [CrossRef]
- Bruni, V.; Tartaglione, M.; Vitulano, D. A pde-based analysis of the spectrogram image for instantaneous frequency estimation. Mathematics 2021, 9, 247. [Google Scholar] [CrossRef]
- Hsu, T.Y.; Liu, K.L. Onsite early prediction of peak amplitudes of ground motion using multi-scale STFT spectrogram. Earth Planets Space 2025, 77, 1–21. [Google Scholar] [CrossRef]


| Site Name | Excavation Date | Cultural Affiliation | Estimated Construction Date | Area (10,000 m2) | Key Cultural Heritage Protection Unit |
|---|---|---|---|---|---|
| Baodun Ancient City Site, Xinjin | 2009–2010 | Baodun Culture | 2500–2000 BC | 336 | National Key Cultural Heritage Protection Unit |
| Mangcheng Ancient City Site, Dujiangyan | 1998–2000 | Baodun Culture, Phase II | circa 4300–3800 BC | 10 | Not designated |
| Gucheng Ancient City Site, Pixian | 1997 | Baodun Culture | 2500–2000 BC | 31 | Chengdu Municipal Cultural Heritage Protection Unit |
| Yufu Village Ancient City Site, Wenjiang | 1999–2000 | Baodun Culture | Phase I–II: 2550–2250 BC; Phase III: 2050–1750 BC | 40 | Not designated |
| Zizhu Ancient City Site, Chongzhou | 2014–2015 | Baodun Culture | 2500–2000 BC | 20 | Not designated |
| Shuanghe Ancient City Site, Chongzhou | 2002 | Baodun Culture | 2500–2000 BC | 15 | Not designated |
| Gaoshan Ancient City Site, Dayi | 2012–2013 | Baodun Culture, Phase I | circa 2500 BC | 24 | Not designated |
| Yandian Ancient City Site, Dayi | 2002–2003 | Baodun Culture | 2500–2000 BC | 17 | Not designated |
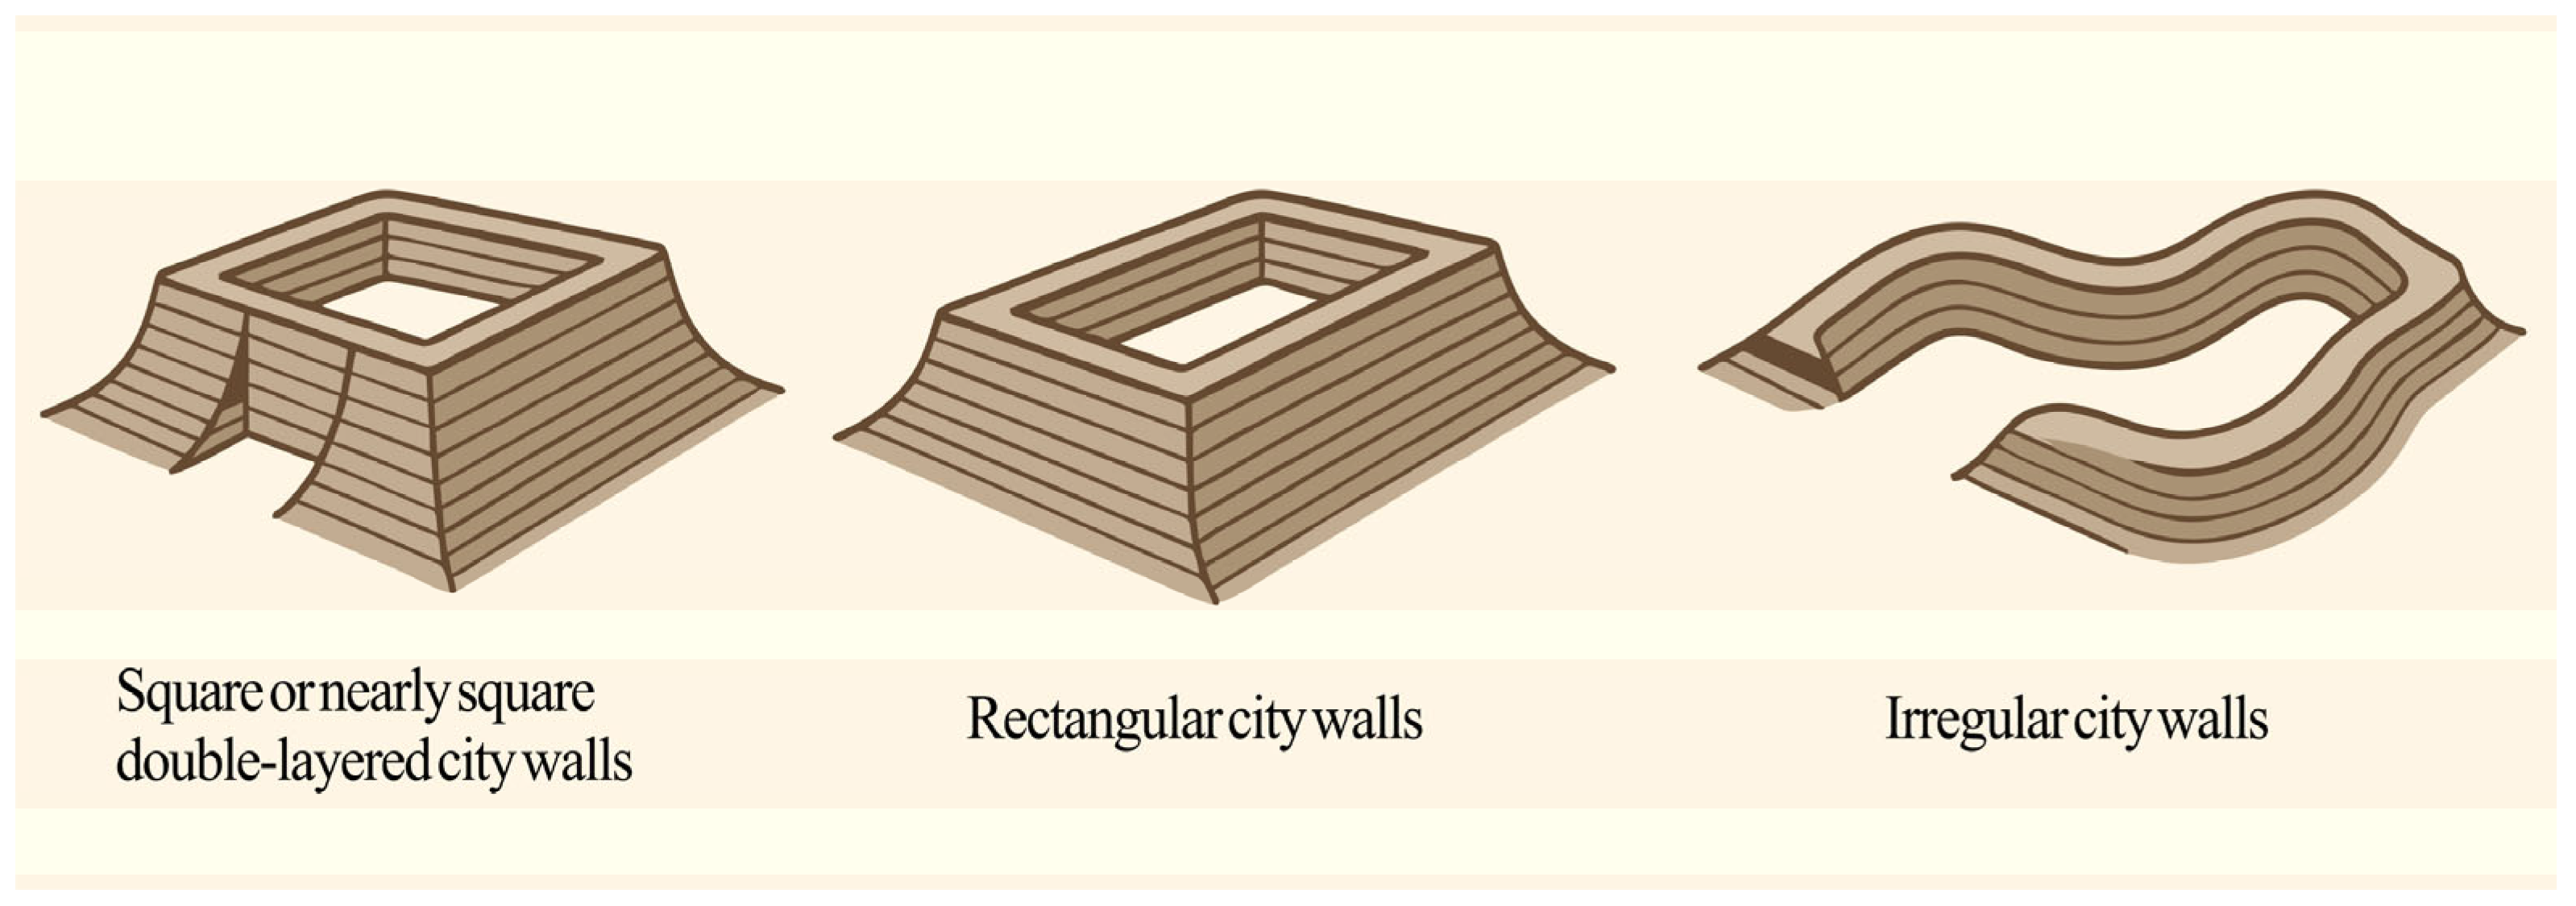
| Site Name | Site Layout Shape | City Wall Structure | Dimensions | Construction Methods |
|---|---|---|---|---|
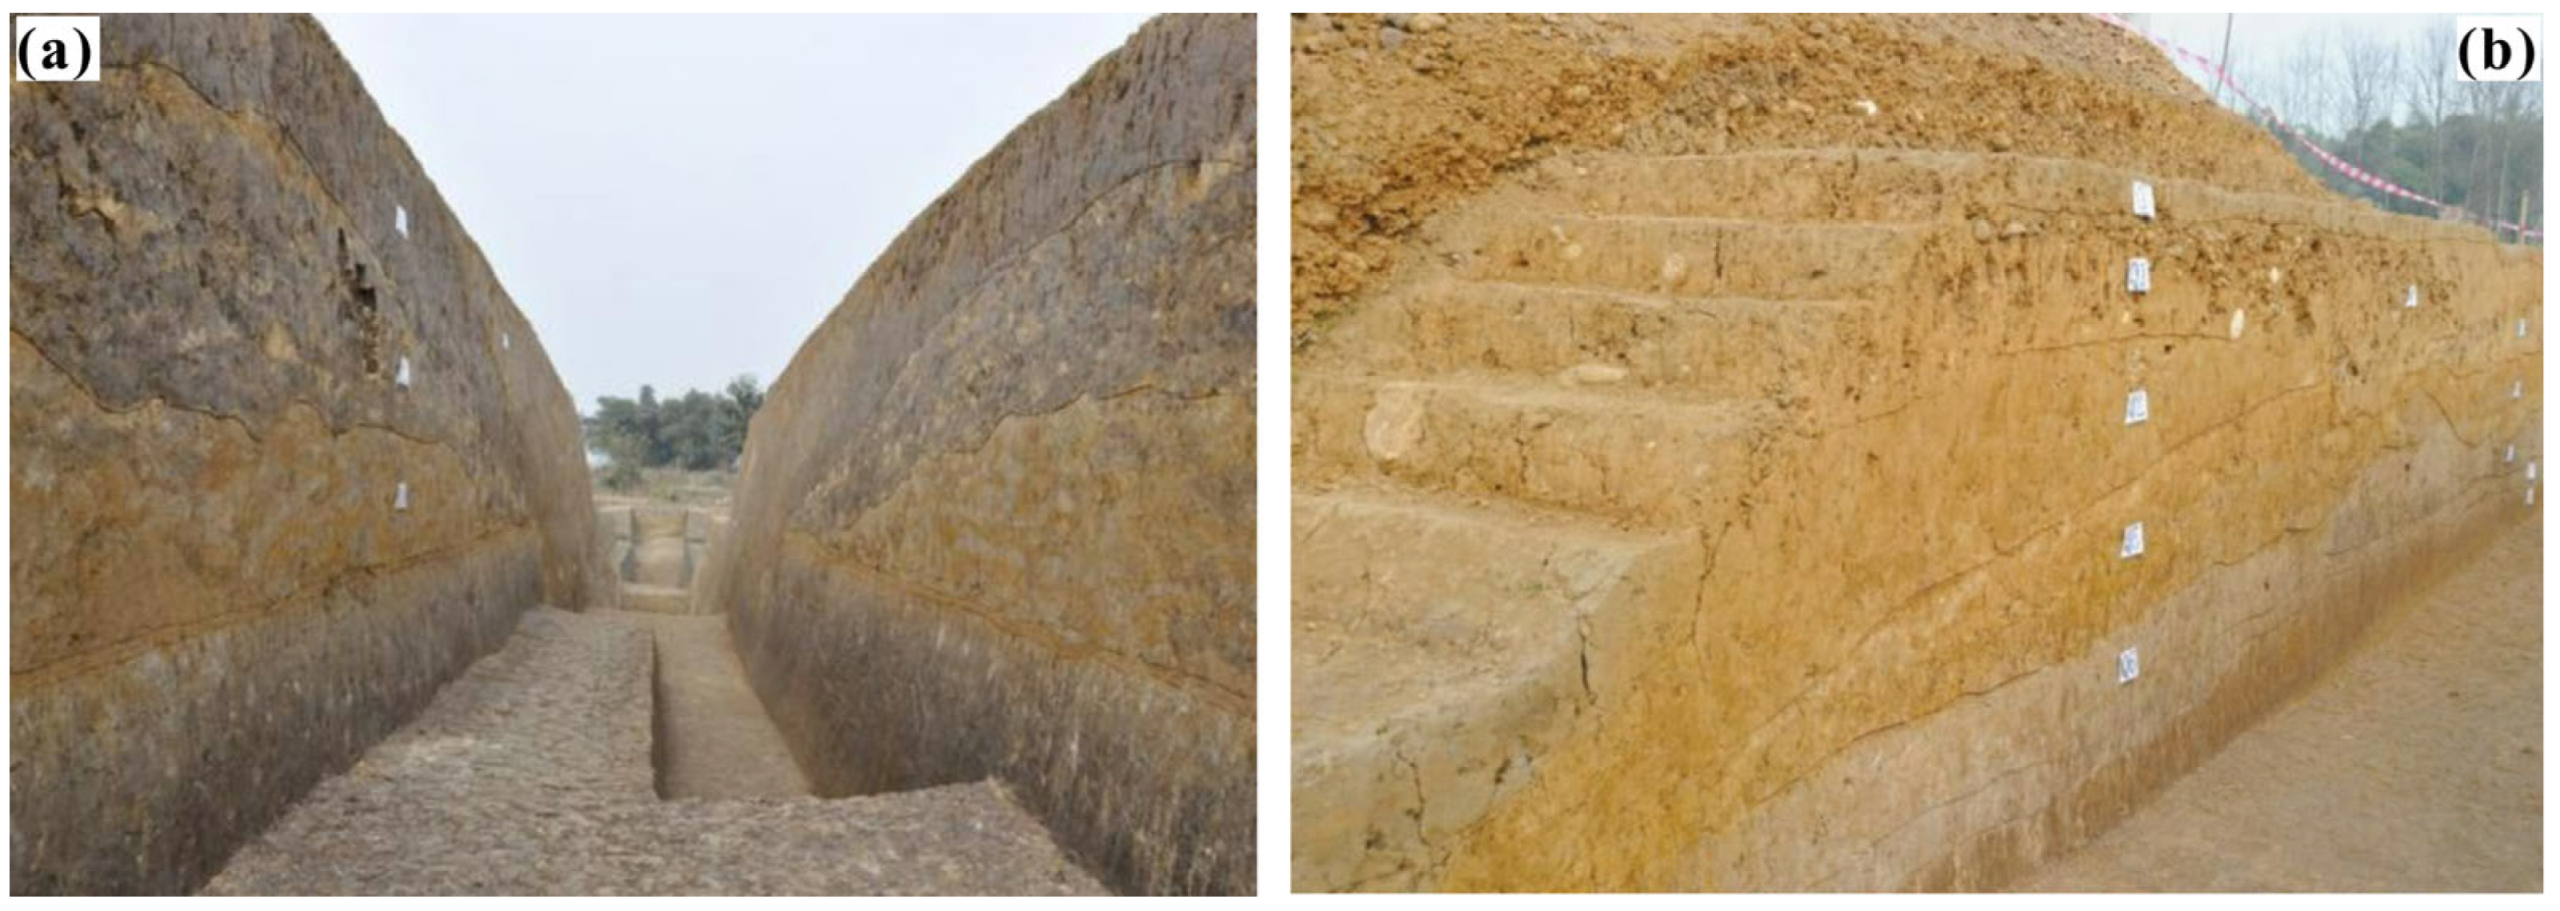
| Baodun Ancient City Site, Xinjin | Rectangular | Double walls (inner and outer) | Top width: 3.15 m; base width: 8.4 m; height: 1.85 m | The rammed earth wall was constructed in layered sections, with its cross-section evolving from triangular to trapezoidal, reflecting multi-phase construction and clear structural definition. |
| Mangcheng Ancient City Site, Dujiangyan | Rectangular | Double walls (inner and outer) | Inner wall: width 5–20 m, height 1–3 m; outer wall: width 5–15 m, height 1–2 m | The construction method remains unclear; although no clear section was found, stratigraphic and artifact evidence suggests the wall may have been built using local earth, with its structure requiring further verification. |
| Shuanghe Ancient City Site, Chongzhou | Rectangular | Double city walls with a moat in between | Top width: 18–30 m; height: 2–3 m | No sectional excavation was conducted, but drilling and wall morphology indicate a typical sloped earth piling method with tamping; the structure is stable and the wall is broad. |
| Zizhu Ancient City Site, Chongzhou | Square | Inner and outer city walls | Inner wall: width 5–25 m, height 1–2 m; outer wall: width 3–10 m, height 1–2 m | The structure is poorly preserved and lacks sectional data; it is presumed to have a double-wall layout, possibly built with a simplified piling method, with no confirmed evidence of rammed earth construction. |
| Gucheng Ancient City Site, Pixian | Rectangular | Single enclosing wall | Width: 8–40 m; height: 1–5 m | The rammed earth platform has a trapezoidal cross-section with clear multi-phase construction; pottery finds indicate prolonged wall-building activity and well-defined cultural stratification. |
| Yufu Village Ancient City Site, Wenjiang | Presumed Hexagonal | Four preserved segments | Not specified | The structure is poorly preserved, with no systematic sectional data; stratigraphic relationships indicate construction during the Baodun culture period, likely using local earth with possible rammed earth work. |
| Yandian Ancient City Site, Dayi | Rectangular | Double walls on three sides; western side reinforced | Wall base width: 20 m; height: 2–3 m | The sloped piling method formed a wide, trapezoidal foundation, with particularly thick outer walls. Clear stratification reflects multiple construction phases and a flood control function. |
| Gaoshan Ancient City Site, Dayi | Rectangular | Single enclosing wall | Width: 7.5–10.5 m; height: over 1 m | The rammed earth wall was built using a sloped piling method; though modest in scale, it has a clear trapezoidal structure. The stratigraphy indicates long-term use. |
| Site Name | Pebble Feature Location | Pebble Characteristics | Functional Interpretation |
|---|---|---|---|
| Baodun Ancient City Site, Xinjin | City wall, ash pit | A row of pebbles with diameters ranging from 10 to 40 cm is embedded in the eastern wall of Mahuai Mound. | Served as structural reinforcement and drainage layer for the city wall; pebbles in ash pits may have had ritual or refuse disposal functions. |
| Mangcheng Ancient City Site, Dujiangyan | City wall | The first layer consists of sandy soil mixed with small pebbles (approximately 3–5 cm in diameter), with loose accumulation. | Pebbles in the city wall were used for reinforcement and waterproofing, despite being loosely accumulated. |
| Yufu Village Ancient City Site, Wenjiang | City wall, house remains, ash pit | Pebbles are used in all layers of the wall structure, with the outer pebble layer of the southern wall reaching a thickness of up to 50 cm. | Pebbles were used for wall reinforcement and waterproofing; as load-bearing foundations in houses; and possibly for ritual or drainage purposes in ash pits. |
| Gucheng Ancient City, Pixian | City wall, house remains, floor surface | A tightly packed pebble layer was identified in Q1A; the column base inside Structure F1 is made of pebbles. | Used for structural reinforcement and drainage in city walls; as column bases for load bearing in house foundations; and as paved surfaces with ritual or everyday functions. |
| Shuanghe Ancient City Site, Chongzhou | House remains, ash pit, floor surface | Pebbles are present in the foundation fill; ash pits contain pebbles measuring 10–30 cm in diameter, and the floor surface is paved with pebbles. | Used for structural stability and load bearing in house foundations; pebble accumulations in ash pits may indicate ritual activities or refuse disposal; paved surfaces served for passage or drainage. |
| Zizhu Ancient City Site, Chongzhou | No explicit record found | No relevant stratigraphic or sectional data are available. | Data unavailable; the city wall has not been sectioned, and the function of the pebbles remains undetermined. |
| Yandian Ancient City Site, Dayi | City wall | The northern wall and similar areas contain a small quantity of pebbles, while the eastern wall contains a large quantity. | The reinforcing and waterproofing functions of the pebbles in the city wall are evident, particularly with the extensive use of pebbles in the eastern wall. |
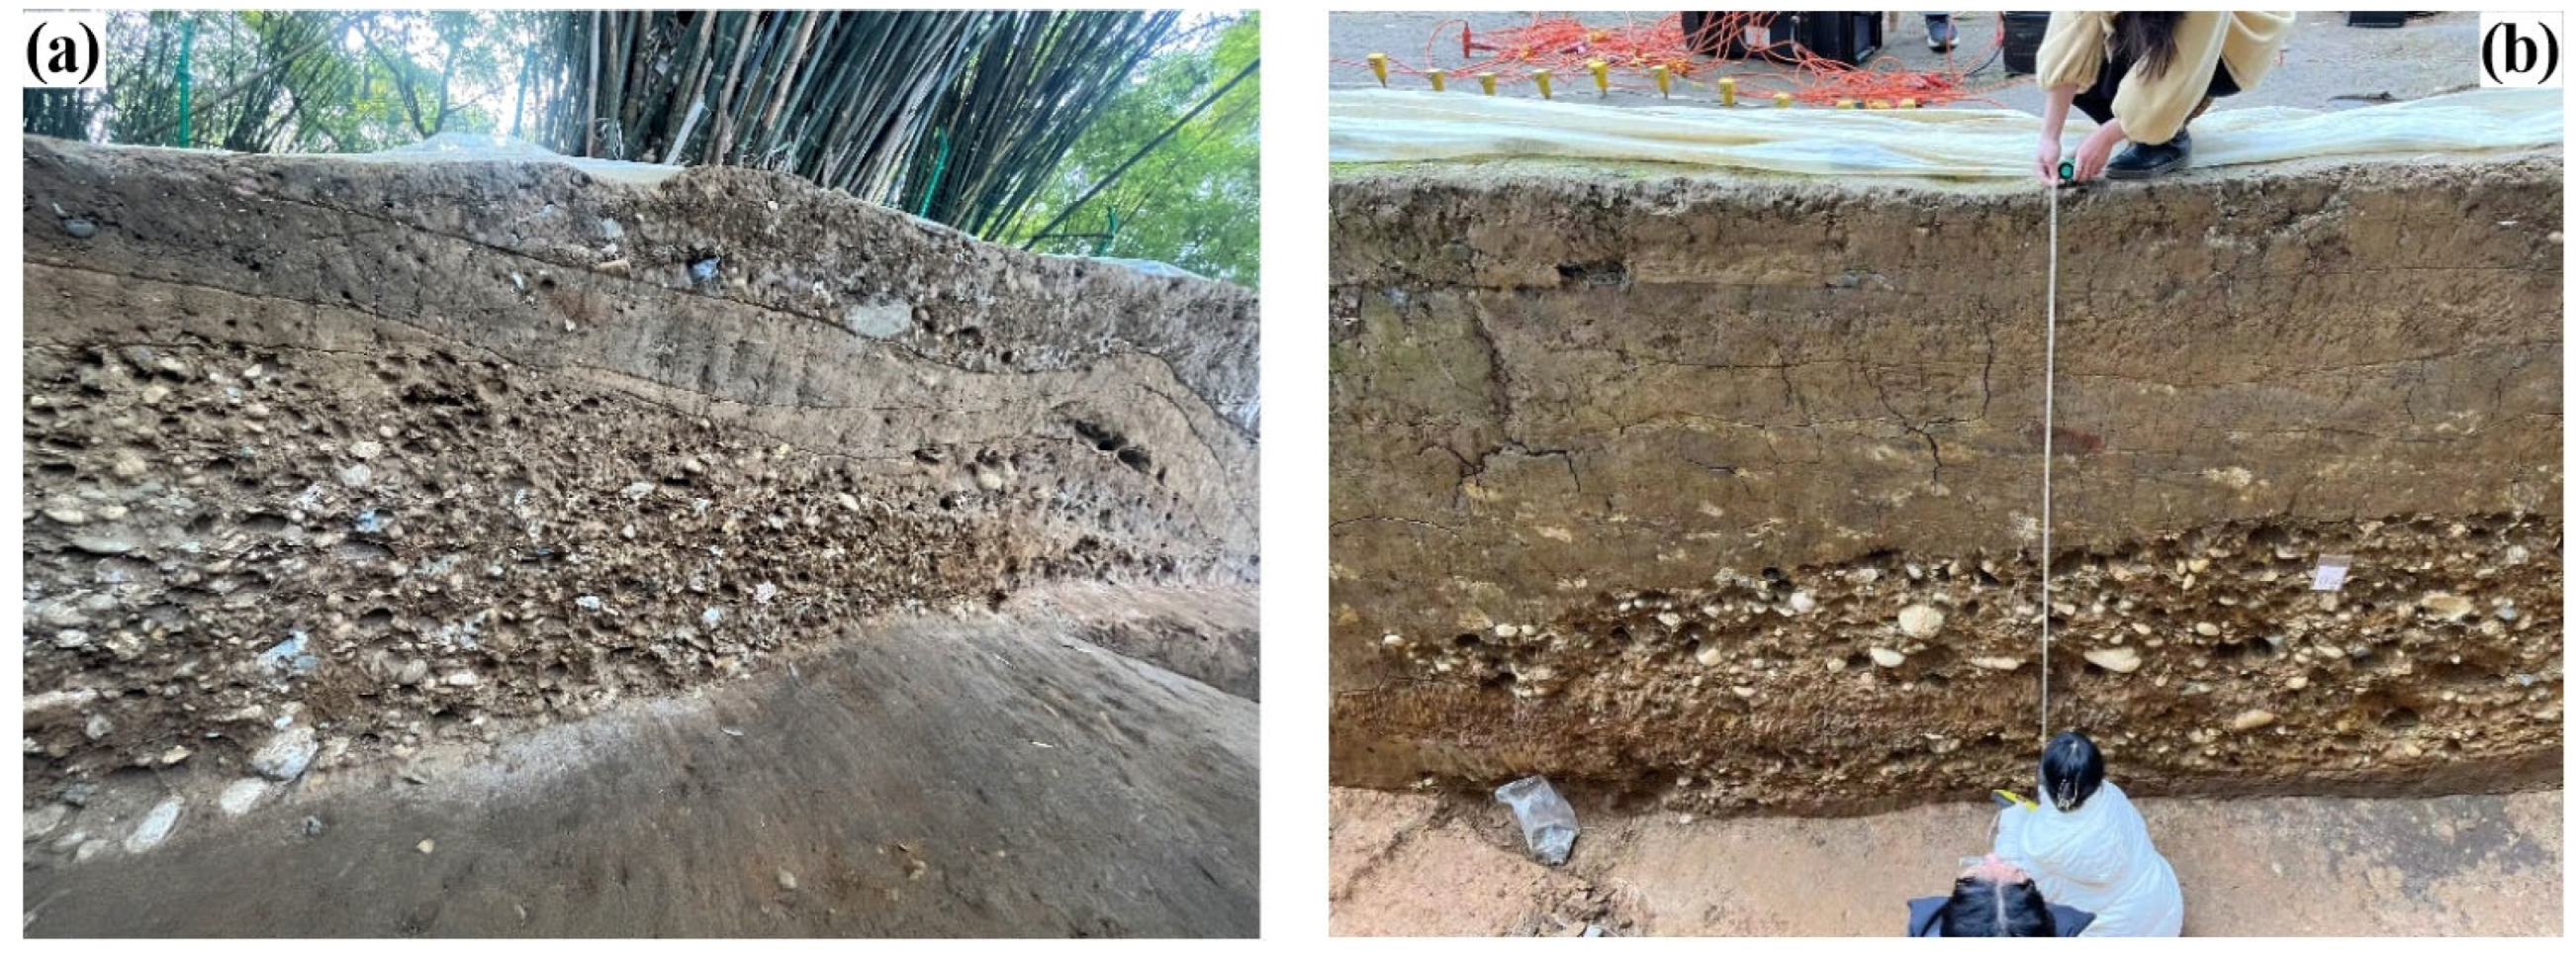
| Stratigraphy | Layer Number | Soil Layer Characteristics | Accumulation Pattern | Thickness (m) |
|---|---|---|---|---|
| Q1 | Q1A | Grayish-brown soil with minor crushed stone inclusions; compact texture | Sloped Accumulation | Approximately 0.6–1.3 m |
| Q1B | Grayish-brown soil with compact texture | Sloped Accumulation | Approximately 0–0.9 m | |
| Q1C | Gray clay with compact texture | Sloped Accumulation | Approximately 0–0.2 m | |
| Q2 | Q2A | Pebble layer mixed with minor sand, dominated by small pebbles; densely packed | Sloped Accumulation | Approximately 0–0.9 m |
| Q2B | Brown soil with minor crushed stone inclusions; compact texture | Sloped Accumulation | Approximately 0–0.95 m | |
| Q3 | Q3A | Brown soil with compact texture | Horizontal Accumulation | Approximately 0–0.7 m |
| Q3B | Yellowish-gray soil with slight sand content and abundant crushed stone inclusions | Horizontal Accumulation | Approximately 0–0.65 m | |
| Q3C | Yellowish-gray sandy soil with compact texture | Horizontal Accumulation | Approximately 0–0.8 m |
| Number of Channels | Sampling Rate | Dynamic Range | Natural Frequency | Sensitivity | Coil Resistance | Open-Circuit Damping | Harmonic Distortion |
|---|---|---|---|---|---|---|---|
| 12 channels | 0.5 ms | ≥110 dB | 4.5 ± 0.5 Hz | 200 ± 10% V/m/s | 2000 ± 5% Ω coil resistance | 0.6 ± 5% | <0.6% |
Disclaimer/Publisher’s Note: The statements, opinions and data contained in all publications are solely those of the individual author(s) and contributor(s) and not of MDPI and/or the editor(s). MDPI and/or the editor(s) disclaim responsibility for any injury to people or property resulting from any ideas, methods, instructions or products referred to in the content. |
© 2025 by the authors. Licensee MDPI, Basel, Switzerland. This article is an open access article distributed under the terms and conditions of the Creative Commons Attribution (CC BY) license (https://creativecommons.org/licenses/by/4.0/).
Share and Cite
Jiang, L.; Wang, Q.; Wang, Y.; Wu, J.; Bai, T.; Tang, M. High-Resolution Seismic Detection Techniques of the Pebble Layer of Baodun Site City Wall, Sichuan, China. Heritage 2025, 8, 215. https://doi.org/10.3390/heritage8060215
Jiang L, Wang Q, Wang Y, Wu J, Bai T, Tang M. High-Resolution Seismic Detection Techniques of the Pebble Layer of Baodun Site City Wall, Sichuan, China. Heritage. 2025; 8(6):215. https://doi.org/10.3390/heritage8060215
Chicago/Turabian StyleJiang, Lian, Quanfeng Wang, Yongfa Wang, Jingxin Wu, Tieyong Bai, and Miao Tang. 2025. "High-Resolution Seismic Detection Techniques of the Pebble Layer of Baodun Site City Wall, Sichuan, China" Heritage 8, no. 6: 215. https://doi.org/10.3390/heritage8060215
APA StyleJiang, L., Wang, Q., Wang, Y., Wu, J., Bai, T., & Tang, M. (2025). High-Resolution Seismic Detection Techniques of the Pebble Layer of Baodun Site City Wall, Sichuan, China. Heritage, 8(6), 215. https://doi.org/10.3390/heritage8060215