Article

Cumae Archeological Site—Processes and Technologies for the Analysis and Monitoring of Anthropogenic Cavities

by
Leopoldo Repola
*,
Giovanni Varriale
,
Silvia Ilacqua
and
Maria Alessandra Letizia
Department of Earth, Environmental and Resources Sciences, University of Naples Federico II, 80138 Napoli, Italy
*
Author to whom correspondence should be addressed.
Heritage 2025, 8(6), 199; https://doi.org/10.3390/heritage8060199
Submission received: 16 March 2025 / Revised: 29 April 2025 / Accepted: 14 May 2025 / Published: 30 May 2025

Abstract

:
This study applies surveying and representation techniques to analyze the cavities of the Cumae site, an archeological park located in the Phlegraean Fields in the Campania region, providing a documentary basis for monitoring, maintenance, and enhancement efforts. The process core is the comparative management of the numerical models produced employing technologies such as laser scanning, photogrammetry, and structured light scanning, supported by a georeferenced topographical network. The 3D models produced are used for the extraction of ortho-planes and bidimensional drawings of the various cavities from which to initiate the procedures for redesigning and analyzing the entire artifact. Specific research carried out on the Antro della Sibilla enabled a detailed 3D description of the tuff-carved surfaces, helping the interpretation of the manufacture in the optic of consolidation and musealization interventions. The interdisciplinary approach employed, in which historical–archeological, geological–structural, and diagnostic sciences contributed correlatedly, ensures a comprehensive program of data representation.

1. Introduction

In recent decades, the documentation, analysis, and preservation of archeological heritage have increasingly relied on the integration of digital technologies capable of addressing the complexity of stratified and environmentally vulnerable sites. This shift marks a profound reconfiguration of archeological practice, driven by the need to ensure both scientific accuracy and resilience in the face of environmental instability, anthropogenic pressure, and climate change. The site of Cumae, located in the geologically active area of the Phlegraean Fields, is emblematic of these challenges.
Founded in the VIII century BCE by Greek settlers from Euboea, Kyme (modern Cuma) was the first Greek colony on the mainland of Italy, strategically positioned on the Campanian coast. Its settlers utilized the natural fortifications of the Acropolis and established dominance over the surrounding region, including the Gulf of Naples. It became a hub of Greek culture and trade, introducing the Chalcidian alphabet to Italic populations and extending its influence over much of the Phlegraean Fields [1,2,3].
Several major eruptive events have marked the geological history of this region, which on one hand, allowed for the setting of the Campanian Ignimbrite or the Neapolitan Yellow Tuff, and on the other hand, significantly altered the landscape, contributing to the formation of the caldera that defines the distinctive topography of the Phlegraean Fields area and the city of Naples [4].

1.1. Geological Setting

The Cumae area is located in the western sector of the Campi Flegrei caldera, a volcanic complex characterized by repeated caldera collapses, alternating episodes of uplift and subsidence, and the development of a dense network of fractures and faults [5,6]. From a lithological perspective, the outcropping units mainly consist of pyroclastic products related to the Campanian Ignimbrite (~39.8 ka) and, subsequently, to post-collapse deposits, such as the Neapolitan Yellow Tuff (~15 ka) [7]. The structural framework of the Cumae sector is dominated by a network of fractures and faults that evolved over time in response to both regional tectonic stress. The main fracture systems exhibit dominant NE–SW and NW–SE orientations, although subordinate N–S and E–W trends are also documented [7]. In particular, N–S trending fractures are well developed in the Cumae area and are interpreted as the result of deformation phases associated with post-collapse relaxation following the Neapolitan Yellow Tuff caldera event [5]. A particularly significant example of the influence of structural geology on human activities is provided by the Antro della Sibilla (Figure 1). Structural analyses suggest that the main gallery and several of its branches were excavated by exploiting the pre-existing natural fracture planes of the tuff bedrock, specifically following discontinuities oriented approximately N–S [7]. The alignment of the hypogeal corridor with these natural planes of weakness highlights how geological structures not only influenced the surface morphology but also decisively conditioned ancient engineering choices. Therefore, the Antro della Sibilla stands as an emblematic example of how geological processes have influenced and in part guided the anthropogenic shaping of the landscape since antiquity.
This unconventional geological context, with its significant volcanic activity, conferred an eerie charm that made geology and myth blend [8]. Indeed, there are many connections between these places and the Underworld, among which we cannot fail to mention Aeneas’ descent to Hell as narrated by Virgil [9]. In this specific episode, the figure of the Cumaean Sibyl—a prophetic priestess whose oracular wisdom has long been woven into the fabric of the site itself—emerges. Her legendary presence reflects the deep interconnection between the natural forces that shaped the landscape and the human narratives raised through centuries of history.

1.2. Digital Tools for Heritage Preservation

This layered cultural significance has thus inspired an ongoing project aimed at preserving, documenting, and disseminating the park’s unique heritage. Moreover, being subject to bradyseism, landslides, and structural deterioration, the archeological site of Cumae demands a multi-scalar, interdisciplinary, and technologically enhanced approach.
The evolution of cultural heritage documentation from static surveys to integrated, dynamic digital systems is evident in the essential role of digital workflows based on terrestrial laser scanning (TLS), terrestrial and UAV-based digital photogrammetry, and 3D modeling. These methods enable the rapid and accurate acquisition of morphological, architectural, and environmental data, which can then be processed into high-resolution digital twins of archeological features [10,11,12,13]. Their application at Cumae has facilitated a comprehensive understanding of spatial organization, degradation patterns, and site dynamics, while also laying the foundation for real-time monitoring strategies.
Ensuring accuracy requires rigorous workflows, and in photogrammetric data processing, it is achieved by addressing tie-point optimization, error propagation, and bundle block adjustment calibration [14,15]. This methodological rigor is reflected in the present research through a carefully calibrated sequence of data acquisition, georeferencing, and model optimization, ensuring geometric reliability and topological consistency. Furthermore, the cost effectiveness and flexibility of photogrammetry, especially Structure from Motion (SfM), for high-resolution 3D modeling have been demonstrated across various contexts, with optimization frameworks using genetic algorithms, improving the quality of meshes derived from low-cost sensors [16] and highlighting the increasing accessibility of digital heritage technologies. The synergy of photogrammetry and TLS provides a scalable and adaptable paradigm for 3D documentation, enabling detailed modeling of intricate and layered environments [10,12,17], overcoming the limitations of individual systems.
Beyond documentation, 3D modeling and Remote Sensing (RS) technologies extend to conservation, risk assessment, and heritage valorization. Integrating 3D data with GIS platforms enables spatio-temporal simulations of degradation, while sensor-based monitoring (e.g., IoT networks) facilitates real-time tracking of structural movement and microclimatic variation, evaluating past interventions and informing restoration strategies [10,18]. These tools support the integration of multidisciplinary datasets encompassing structural, material, environmental, and historical information [19]. Sites like Cumae, where architecture, landscape, and geological instability converge [20], showcase the importance of multi-sensor data fusion for the complete representation of complex heritage sites.
GIS and RS allow for non-invasive site analysis and long-term monitoring, crucial in dynamic environments, like volcanic areas or regions affected by human activity. Indeed, digital technologies nowadays play a central role in the preservation and risk mitigation of cultural heritage, especially in conflict or disaster-prone areas. In such scenarios, tools like digital twins, IoT-based monitoring, and blockchain-based registries offer both real-time diagnostics and secure data archiving solutions [21].
This interdisciplinary convergence of technologies embodies the direction in which cultural heritage preservation is heading. These methodologies not only enhance the precision and efficiency of archeological documentation but also propose a replicable model for other heritage sites facing similar challenges. Applied to Cumae, this approach supports conservation and further enables new forms of public engagement through digital storytelling and immersive experiences. In summary, it exemplifies a holistic vision for the future of archeological practice—one that is as much about preservation as it is about participation.

2. Materials and Methods

The exceptional nature of the sites and the wide range of detected degradation required the definition of a highly interdisciplinary intervention methodology, which included the preliminary geological and archeological study phases in a broader data generation and management procedure. From the outset, a GIS platform was set up for the management and correlation of alphanumeric, raster, and vector data, defined on a model aimed at defining interaction maps of tools for spatial analysis, i.e., for the dynamic correlation of three-dimensional information, such as geological features, instabilities, anthropic signs for the construction of walls, transformation, and the use of spaces. The platform was developed using the advanced GIS digitalisation tools Arcgis Pro 3.3.2 version and ArcgisOnline from the software house Environmental Systems Research Institute, Inc., Redlands, CA, USA. (ESRI) (Figure 2).
The 3D models, specifically point clouds, were imported into the GIS environment through the creation of a dedicated Esri geodatabase, structured to manage and integrate these datasets as LAS Datasets. The use of LAS Datasets allowed efficient handling of large volumes of LiDAR and photogrammetric data, enabling multi-scale visualization and advanced spatial analysis capabilities within the ArcGIS Pro environment. The point clouds were immediately correctly georeferenced, owing to prior alignment procedures carried out during the 3D modeling phase. These procedures included the strategic placement of coded targets (markers) across the surveyed area and their subsequent acquisition through high-precision topographic surveys, using total stations and GNSS receivers. This workflow ensured sub-centimetric spatial accuracy, critical for maintaining the geometric integrity of the 3D models and for enabling their seamless integration into the GIS framework. Moreover, the use of Esri tools, such as the 3D Analyst Extension, and functionalities, like LAS Point Statistics and Classify algorithms, provided further capabilities for quality control and classification of the point cloud data, optimizing them for subsequent analyses and modeling operations in GIS.
For the laser scanning with the Riegl scanner, three types of markers were used: 5 cm flat discs, 5 cm diameter and 5 cm high cylinders, and 10 cm diameter and 10 cm high cylinders.
In addition, 1 m PVC squares and 50 cm aluminum ladder bars were placed within the target area to support the drone survey, along with metal stakes planted in the ground to materialize the topographic points. All the markers were, as mentioned, surveyed using a total station and integrated into a unified reference system, into which all the produced models were imported and aligned.
Furthermore, geophysical investigations, including Ground-Penetrating Radar (GPR) surveys, were conducted by the supporting company Boviar srl to perform subsurface profiling and examine the soil layers just above Sybil’s Cavity. Two GPR antennas were utilized: a Chaser 2000 MHz antenna for the exterior covering and a 900 MHz antenna for the vault intrados (Figure 3).

2.1. Topographical Survey

In December 2019, the topographical survey of the entire archeological area was carried out in order to produce a polygonal map on which to hook up the historical surveys and models being conducted by the various universities operating on the site. Additionally, the collected set of data was incorporated into a GIS platform. Five topographic points were materialized: on the Capitolium at a pre-existing station, on the northeastern corner of the terrace overlooking the lower town, near the meeting point between the belvedere and the ramp leading up from the Antro, on the roof of the small guardhouse of the gateway to the sea, and along the road running alongside the Cumana tracks at the entrance to the station. The points were strategically selected to guarantee the continuity of the polygonal framework and the direct survey of the markers mostly concentrated in the vicinity of the Capitolium (due to the scarce presence of tall trees and, therefore, visible from the drone), Sybil’s Cavity and the western entrance to the Crypta Romana—where detailed survey procedures had been conducted for both the cavities and the surrounding external areas—and the lava dome (to allow the assessment of the cracking states of the slopes towards the sea, which was the object of a specific structural study) [22]. The survey of these points was conducted using a Leica TS16 total station, while their localization in global coordinates was determined using a differential GNSS satellite positioning system, aligning data within the WGS84 geocoordinate system. This methodology enabled the integration of field-collected data into the CAD-GIS environment, preparing them for the following activity of segmentation and extraction of 2–3D vector data.

2.2. Aerial Photogrammetry
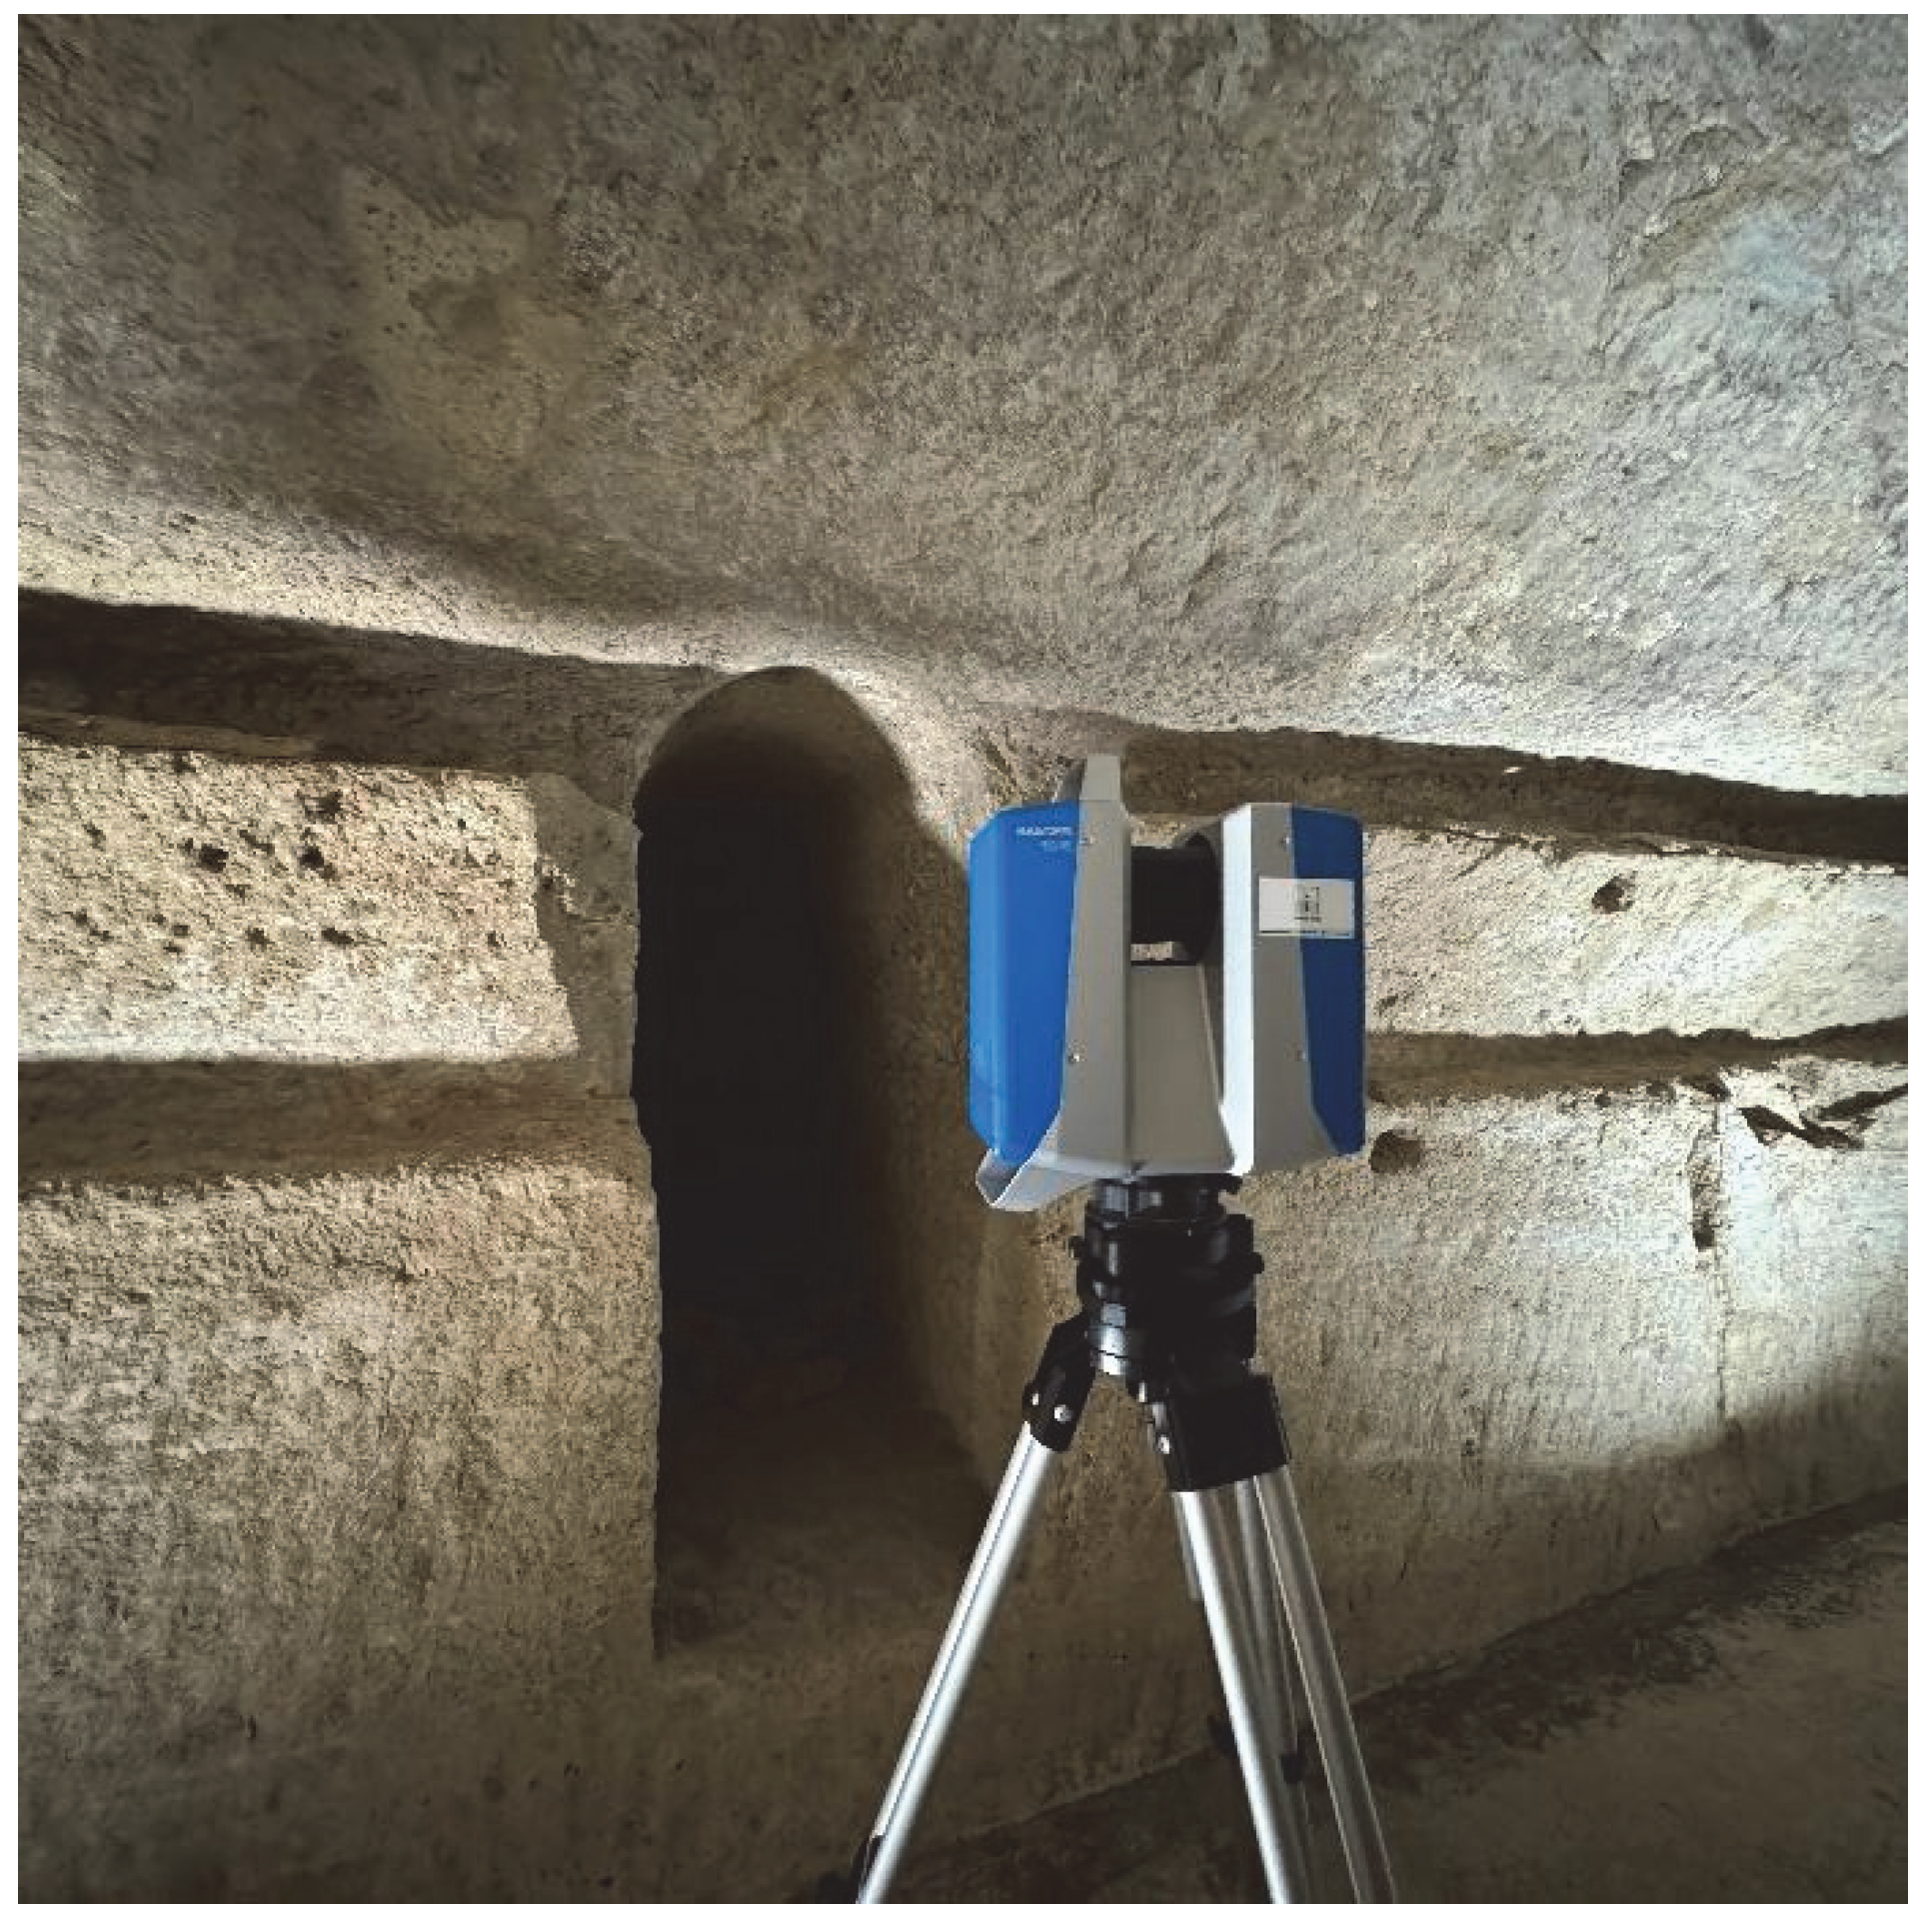
To support the large-scale site survey phases, an additional survey campaign was carried out using a DJI Matrice 300 drone (Figure 4). The flight plan was preset to allow both the acquisition of the entire area by means of LiDAR scanning and sequences of zenithal images taken at a height of approximately 60 m. Additionally, detailed surveys of specific target locations and selected study areas were carried out through photos taken with a camera angle of between 30 and 45°, in particular at the tuffaceous ridges that delimit the upper city, the walls at the western entrance to the Crypta Romana, and the lava dome facing the sea.

2.3. Laser Scanner

2.3.1. Time of Flight (TOF)

The three-dimensional digitization campaign was initially conducted using the Riegl VZ400i TOF scanner (Figure 5). This instrument is a 3D laser scanning system that combines innovative processing architecture and a suite of MEMS sensors with the latest Laser Scanning Engine technology.
The real-time data stream generated is enabled through specific processing platforms: a dedicated data acquisition system and a second processing platform that enables real-time point registration, georeferencing, filtering, and data analysis. In particular, the high performance of the instrument, which, thanks to the full waveform technique, allows for the digitization of the laser signal and the consequent measurement of up to 15 return targets on the same laser beam (a characteristic that guarantees the overcoming of vegetation and obstacles with little space), made it possible to obtain point clouds with a resolution of 3 mm despite the width of the areas acquired. The survey activities were conducted along the entire entrance path to the archeological area, inside and outside Sybil’s Cavity, along the steps and the path leading to the sea up to the northern slope of the lava front, inside all the hypogeic spaces of the Crypta Romana, along the road connecting the tunnel to the Capitolium of the lower city, and then back to the entrance area facing the tuffaceous walls of the upper city, towards the east. A total of 165 scans were taken, textured and aligned within a single digital model, and manually filtered to remove vegetation and disturbing elements accurately. The surveying and location of all scan positions followed an operating program drawn up according to the geometric complexity of the locations and the requirements of rapidity of the field acquisition procedures, the effectiveness of the automatic cloud alignment procedures, the density of the points, and the uniformity of the ambient light for correct texture contrast. In particular, for the shots inside Sybil’s Cavity, 21 scan positions were taken, 7 for the entrance path, 33 for the external parts; in the Crypta Romana, 38 scan positions were taken; along the paths in the archeological area, 39 scan positions were taken; and around the ridges towards the sea, 27 scan positions were taken.
In particular, the possibility of managing automatic procedures for the recognition and very-high-resolution scanning of predefined markers through Riscan Pro v.2.9 software guided towards the choice of using them as collineation points of the various point clouds.

2.3.2. Phase Shift

The extensive three-dimensional digitization campaigns conducted previously were subsequently enhanced in the area of the Antro della Sibilla thanks to the integration of new acquisitions through the Z+F IMAGER 5016A phase-shift 3D laser scanner (Figure 6).
Its use is motivated by the great advantages it offers in the medium to short range. In fact, a smaller range compared to scanning with TOF lasers is balanced by greater precision—in the millimeter range—and greater acquisition speed, as well as a higher point density.
This instrument measures the distance to an object based on the phase shift between the laser beam emitted and that reflected by the object. With a maximum range of 360 m and a measurement rate of more than 1 million points per second, it ensures highly accurate acquisitions, even over long distances. Designed for applications in confined spaces, its wide field of view (360° × 320°) reduces the number of scans required, optimizing workflow. Given its exceptional short- and medium-range accuracy, it is ideal for acquiring detailed scans in confined spaces, such as the interiors of Sybil’s Cavity.
In order to exploit its full potential, IMAGER 5016A was used both in static mode to detail the fracture pattern, particularly of the Antro, and to survey the sensors installed in the area, and in dynamic mode (Figure 7) to obtain a more detailed model of the area just above the Antro—a challenge for other instruments due to the extremely dense vegetation.
A total of 45 static scan positions and 2 SLAM runs were recorded; the survey route and the location of all the scanning positions followed an operating program drawn up based on the geometric complexity of the locations and the requirements for the speed of the field acquisition procedures, the effectiveness of the automatic cloud alignment procedures, and the density of the points. In particular, 37 scan positions were recorded for the shots inside Sybil’s Cavity, 2 for the entrance path, and 6 for the external parts, while the 2 SLAM runs covered the side and upper area of the cave.
Again, during the acquisition phase, it was possible to manage the data flow in real time using the Z+F LaserControl Scout, which allows preliminary recording and georeferencing operations. In fact, the automatic positioning system allows field recording without the need for targets, and it is also able to automatically orient itself, even in the absence of a GPS signal, thanks to the innovative Cloud to Cloud function.

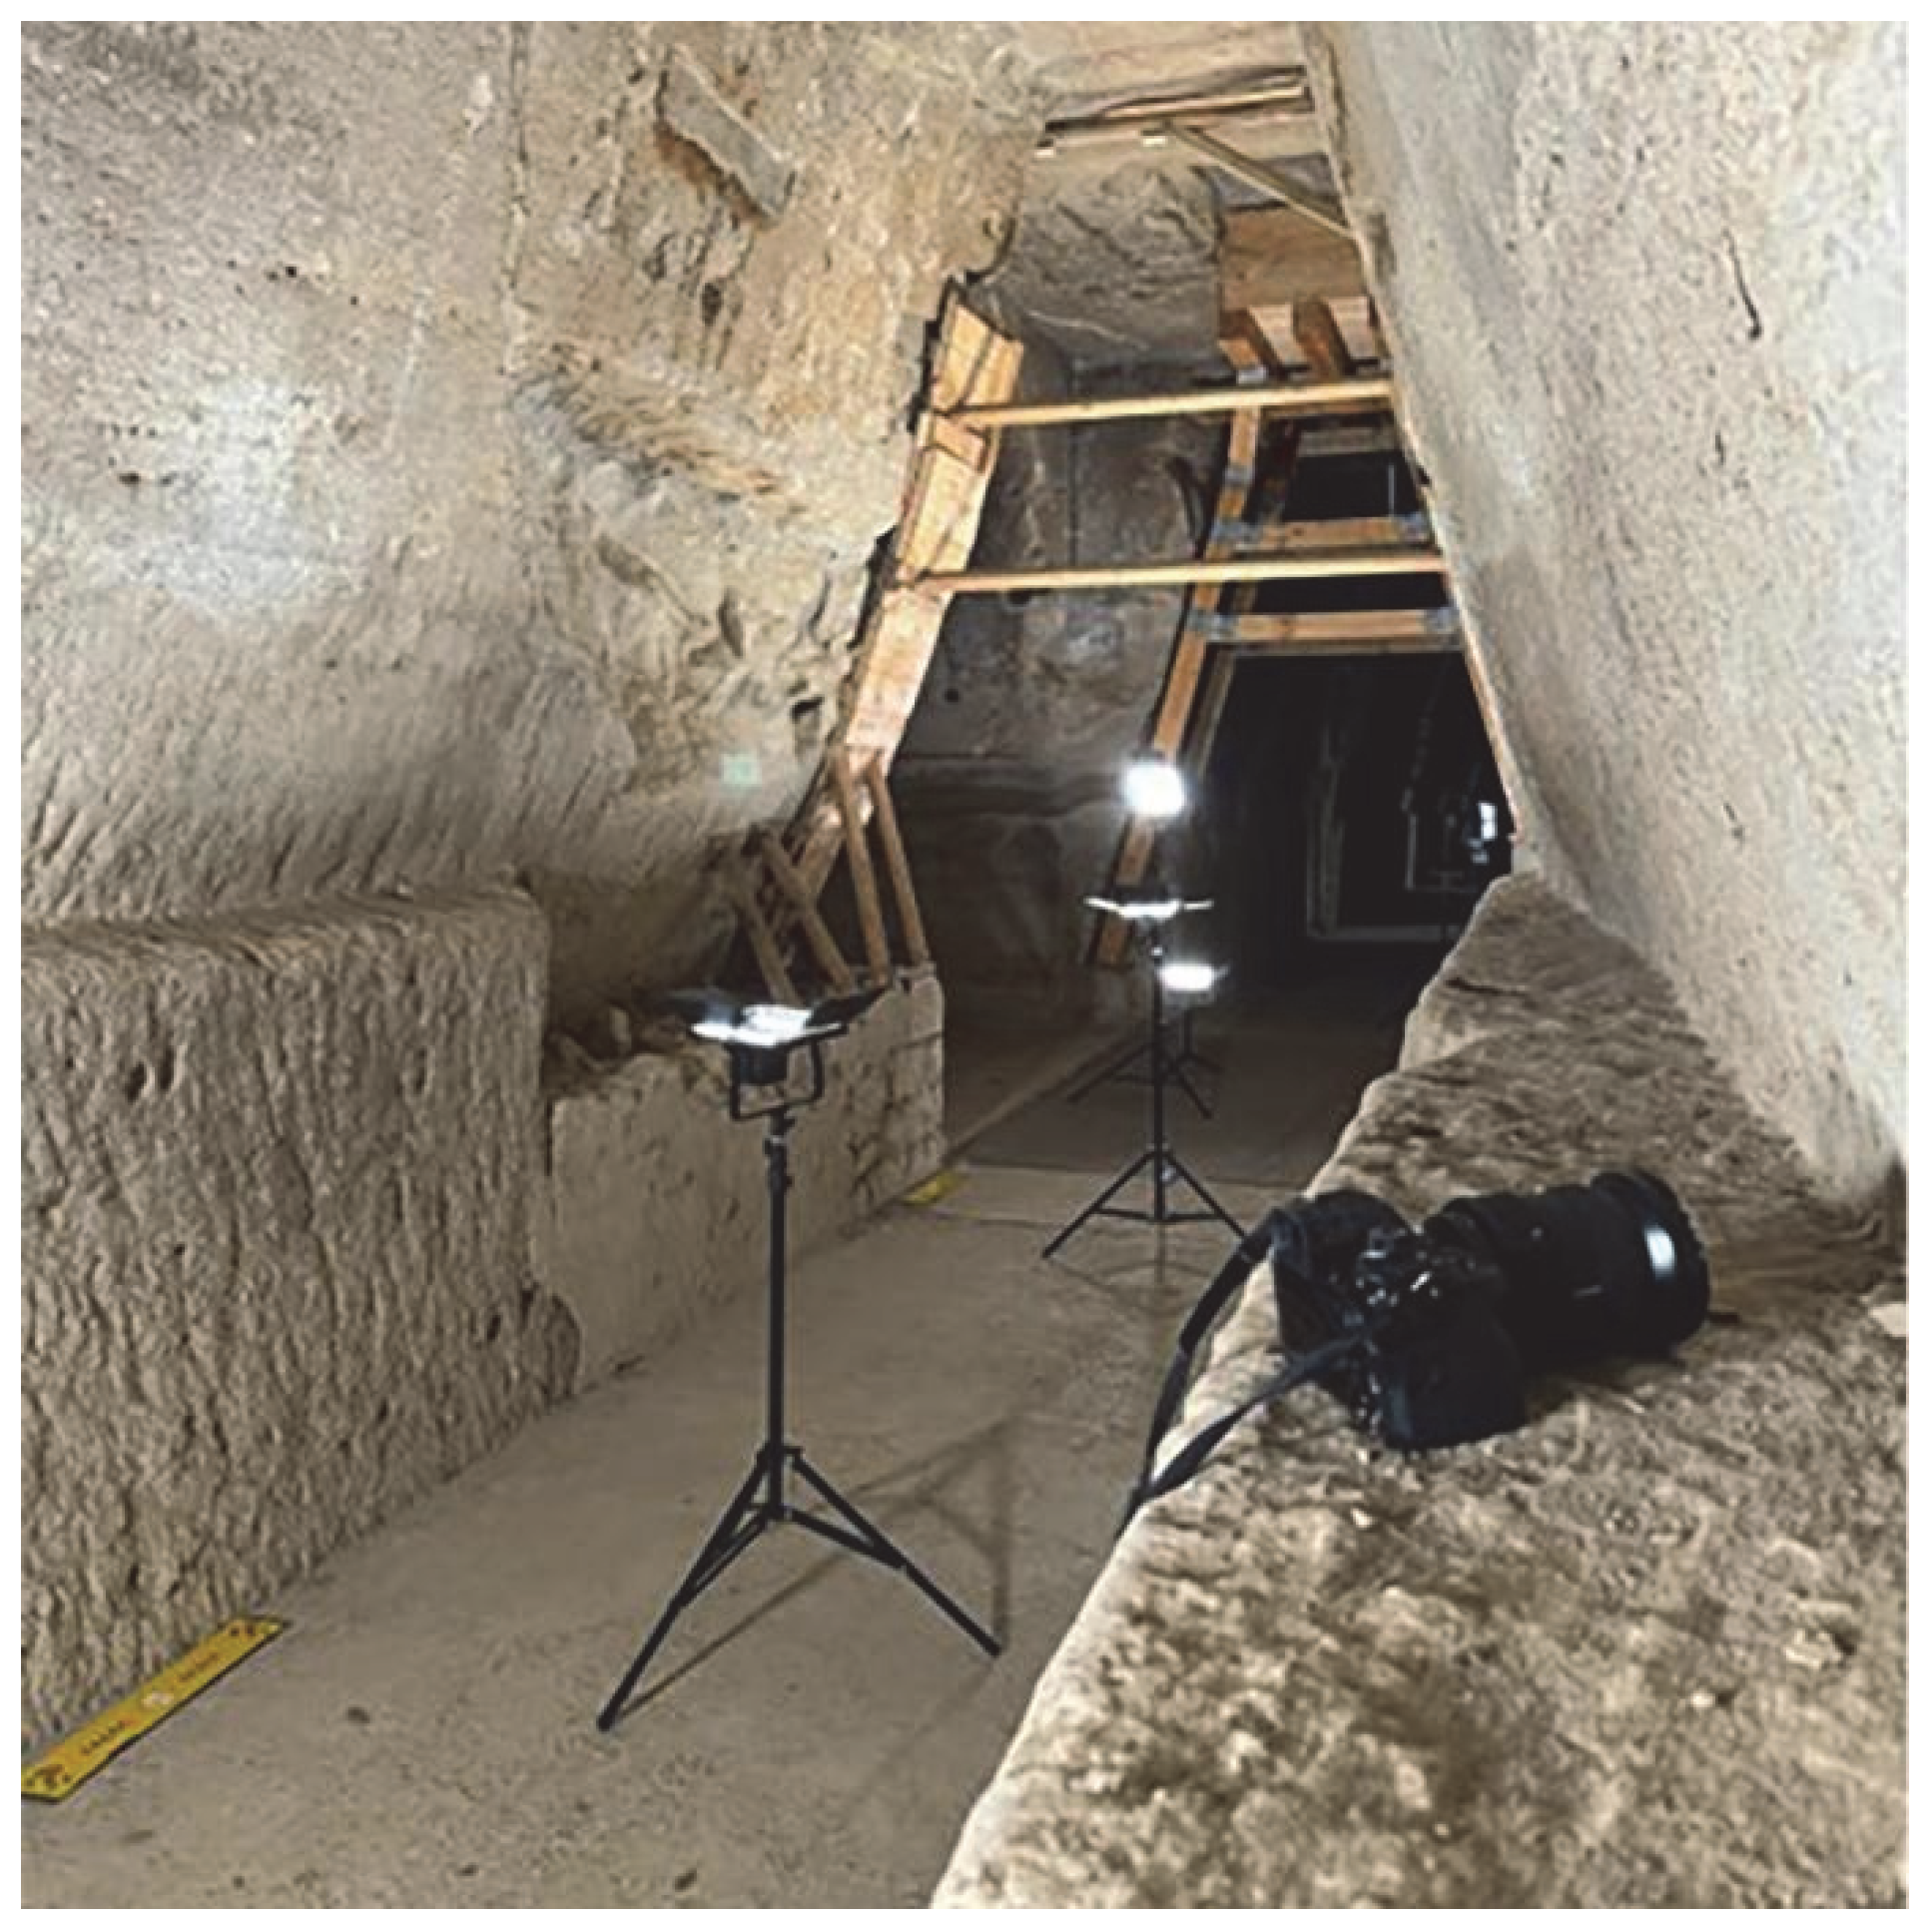
2.4. Terrestrial Photogrammetry

As a complement to laser scanning, a photogrammetric survey of the interior of the Antro della Sibilla was carried out. For an in-depth study to provide information on surface conditions, textures, and colors, aiding conservation planning and addressing problems of degradation or deterioration, several cameras were used, such as the following:
GoPro HERO10, equipped with a 15 mm focal length lens;
Sony ILCE-7M4, equipped with a 16 mm focal length lens (Figure 8);
Nikon D750, equipped with a 28 mm focal length lens.
Using different cameras allows for better spatial coverage. For example, wide-angle lenses, such as the HERO10, can document large areas in fewer shots, reducing the time and effort required to survey large areas, improving the quality, accuracy, and adaptability of the data capture process, while DSLR cameras, such as the Sony ILCE-7M4, provide high-resolution images with excellent detail and low distortion, ideal for documenting architectural details or intricate textures.
The image capture process that led to the acquisition of 3000 frames was meticulously designed to ensure consistency between frames and a high resolution in the output, with a systematic approach during the acquisition. Operators followed predetermined paths—moving in horizontal rows—maintaining a consistent distance of 2 m circa from the wall surface and a longitudinal pace of 1 m to ensure sufficient overlap (around 60–80% both laterally and longitudinally). This method minimizes gaps in coverage and captures all necessary perspectives, facilitating good feature matching and high-quality 3D reconstructions in the later elaboration processes.

2.5. Structured Light Scanner
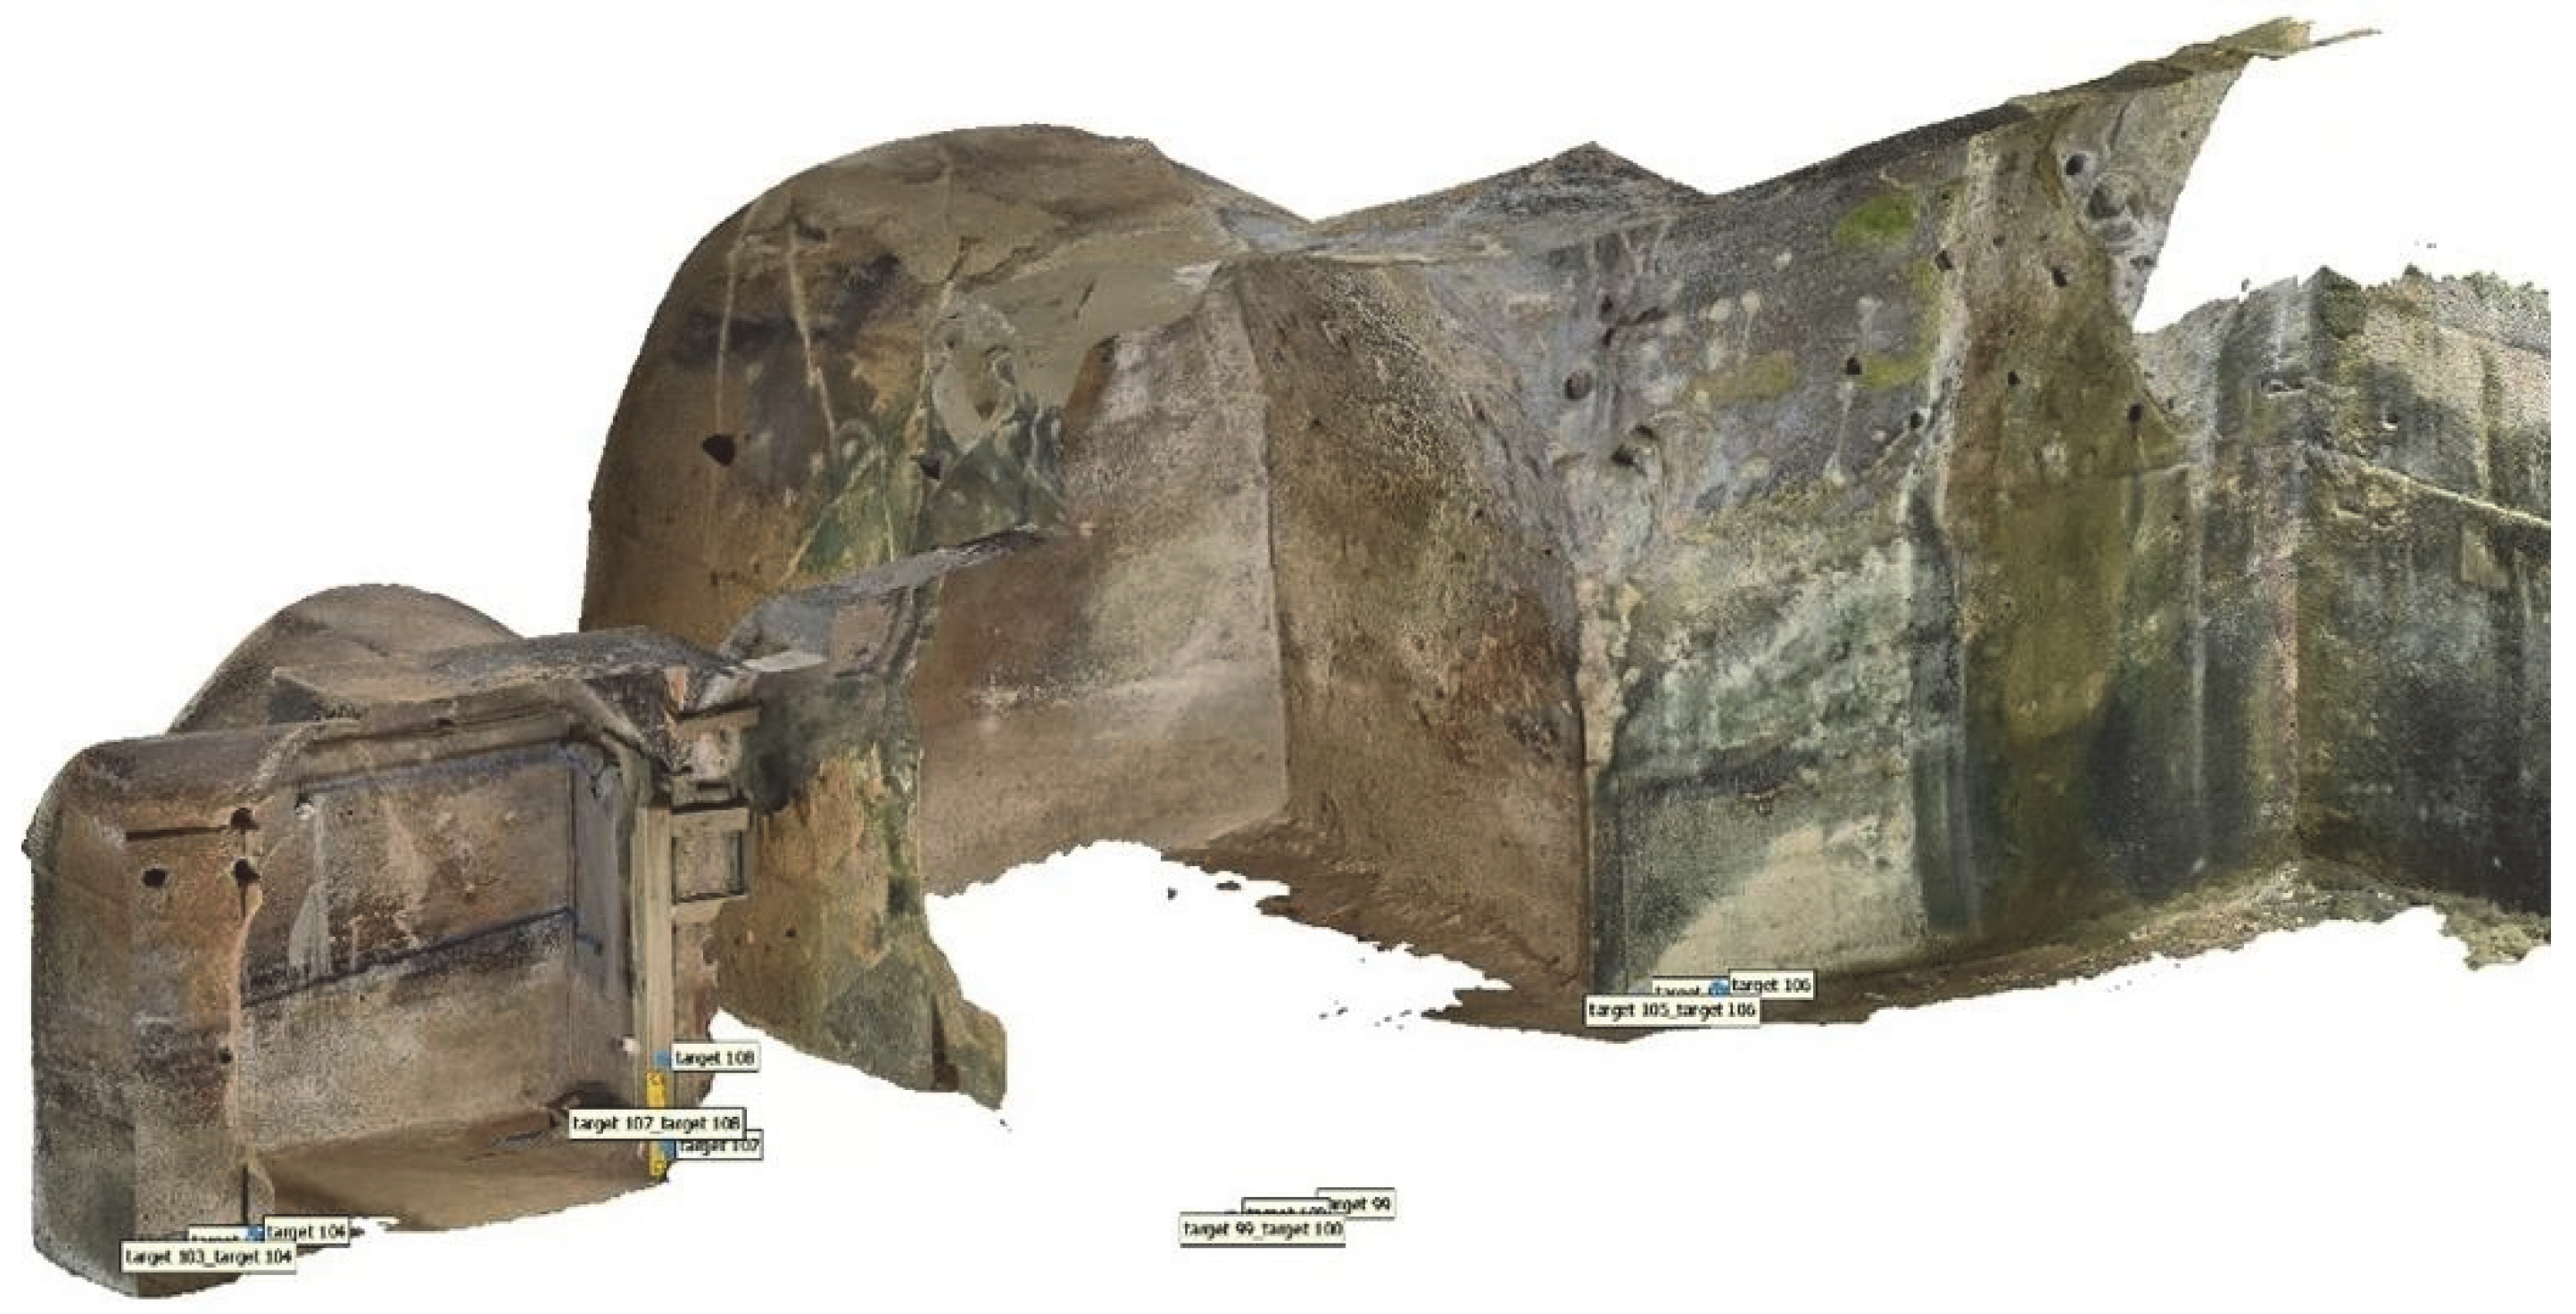
Survey activities using an Artec EVA structured light scanner (Figure 9) were carried out for the high-resolution digitization of the fractures in specific points of Sybil’s Cavity and of the so-called lunar calendars near the entrance to the cavity and inside it. In particular, the surveys of the lunar calendars took into account the widespread phenomena of exfoliation and erosion of the tuffaceous surfaces. Acquisition procedures were conducted both with scanners in a position orthogonal to the plane and inclined at an angle of approximately 45° to better document the areas covered by dust and small detachments still in situ.

2.6. Processing

The point clouds acquired with the different instruments were aligned in a single topographic reference system on the basis of the markers set up in the field during each survey phase and recorded by means of a total station.
The photogrammetric data were processed with Metashape software Version 1.8.4, which aligned the images and generated dense point clouds. Noise and irrelevant elements, such as vegetation, were filtered out to focus on architectural and geological features. During the polygon generation phases, particular importance was given to texture resolution in order to detect surface degradation phenomena associated with the crack state recorded by the models produced by laser scanners. From the textured 3D meshes obtained (Figure 10), contour lines and sections of the entire site were produced at a progressive distance of 50 cm, and high-resolution orthophotos (Figure 11) were generated.
In the post-processing phases, the point clouds generated with the Riegl VZ400i were aligned, providing a complete path of the connections between the lower city, the Antro, the Crypta Romana, and the areas along the coast. The substantial number of scans and areas surveyed required a procedure to divide the model into four areas: Antro, Crypta, the lava dome front, and the low town with pathways. Subsequently, in order to maintain high levels of resolution, the three models were segmented into surfaces according to their degree of uniformity and the architectural characteristics of spaces. Only at this point were meshes generated from the cloud portions (Figure 12), which were then joined into blocks referring to the different areas of the site, with varying degrees of resolution, and prepared for subsequent use by the project.
Regarding the data acquired with the Imager 5016A laser scan, the processing in Z+F LaserControl V10.0.9 Office Premium software allows the point clouds to be registered, filtered, and colored. The data obtained in the field returned a point cloud of the entire interior of the Antro (Figure 13) and the part in front of it with an average displacement of 1.8 mm, guaranteeing model resolution levels far above the normally recognized standards.
The survey in the SLAM modality returned a point cloud perfectly aligned with the previous ones, allowing the thickness of the volumes above the vault of the cavity to be accurately extracted (Figure 14 and Figure 15).
The model of the cavity, comprehensive of the volume sitting on its vault, will soon be aligned with the data from the geophysical surveys to obtain a continuous representation of the visible planes and the subsurface. This will constitute the base for the reverse engineering and NURBS model generation procedures to support future project activities.
The data produced by the structured light scanner were managed within Artec Studio 17 Professional software, where alignment, meshing, and texturing were conducted. The polygonal models of the calendars (Figure 16) and cavities were aligned by homologous points within the open-source software Cloud Compare.
The processing of the models’ phase ended with the alignment of all point clouds within the unified virtual space of Cloud Compare and the creation of meshes. Subsequently, the meshes were further processed in Rhino 8 to produce two-dimensional drawings (Figure 17) reproducing the characteristic parts of the site to form the basis for the following analysis phase.

3. Results and Discussions

3.1. Monitoring

The site is subject to complex structural instability, highlighted by the evident crack pattern. Some have been recorded over time and are already the subject of interventions, while others are of recent formation and have not yet been exposed. The geometric–formal and structural complexity of the cavities, both linked to the fact that they are not buildings constructed using conventional techniques but dug directly into the tuff, made it necessary to carry out an articulated diagnosis project to investigate the causes of the instabilities within the broader geological context.
In this framework, 3D models have proved unmatched, thanks to their high resolution, which allows for the precise detection of degradations, enabling the clear identification of even minor fractures and changes in the rock. Moreover, these models, validated by the overlap of data captured at different resolutions and through diverse methods, provide a multilayered understanding of the site’s fabric. This comprehensive digital reconstruction is crucial for the strategic positioning of monitoring sensors, ensuring that subsequent interventions and ongoing surveillance are accurately targeted to preserve the structural integrity of the Antro della Sibilla.
A monitoring plan for the cavities was defined by installing real-time sensors using Internet of Things technology in the Antro and the Grottone. Two different types of sensors were installed: static crack-type to monitor variations in the opening of the lesions and dynamic type instrumentation, which allowed the evaluation of vibrations, both anthropogenic and natural, through a station equipped with an accelerometer and velocimeter capable of detecting the passage of seismic waves to evaluate the motion and acceleration of the ground at the point of observation of the sensors, as a function of time. Both types of sensors, static and dynamic, were installed to measure the three components of the measurement and manage it in 3D. Finally, the study areas were equipped with thermo-hygrometric measuring stations for the measurement of temperature and relative humidity to monitor the microclimatic variations; each station was then connected to the crack meter sensors.
The architecture of the IoT Sensor System was developed through the installation of wireless nodes to transmit data to a wired central control unit (gateway) and make them available on a special online server built as a database in the cloud using Digi XBee DigiMesh® 2.4. Such technology guarantees greater network stability, even in contexts of poor connectivity, such as the Antro della Sibilla. This technology has made it possible to maintain a high level of efficiency for constant monitoring, especially within the scenario of the current bradyseismic crisis affecting the Phlegraean Fields. The data from the sensors are then sent in .csv format to a server provided by the installer Boviar srl, which, by means of a dashboard, allows an initial visualization through multi-axis histograms of the structural movements in correlation with the microclimatic and seismic data of the area being monitored. One of the main goals of this work was to create the basis for the integration of the real-time sensors into the 3D models through the GIS platform. An automated system was, therefore, created for the acquisition, organization, and sharing of data generated by real-time sensors. Through bi-directional synchronization software and Python v.13.8 code implementation, a batch process was realized for the daily acquisition of data from sensors. This system was specifically designed to update features within the GIS environment, accurately representing the location of sensors both on the 2D plan and within the 3D models acquired in this study (Figure 18). The goal is to ensure a continuous and integrated data flow to support advanced geospatial analyses, as well as the 3D modeling and integration of the sensors, enabling real-time visualization and data flow interpolation. By achieving this, the system will aim to enhance the accuracy of geospatial data management and visualization, thereby supporting the development of new intervention strategies for the conservation and enhancement of the site. Ultimately, it will seek to implement a decision support system to assist the Park Authority in its management activities.
The GIS platform was designed to integrate 3D models derived from advanced surveying techniques not only for integration with sensors but also to enrich spatial analysis with three-dimensional views of sites. Point clouds of the external areas were classified and processed to perform terrain analysis for a better understanding of the geomorphological and geological aspects of the terrain. Furthermore, through tools such as 3D Scenes and the application of geoprocessing tools using the Model Builder system for process automation, it was possible to correlate geological, archeological, and anthropogenic data, generating dynamic visualizations (Figure 19). The platform was then managed to support multi-scale and multi-temporal data, enabling the monitoring of land transformations over time. Finally, the GIS platform was used for interactive data sharing via ArcGIS Online and Web Scene.
The aligned photogrammetric models, instead, will be subjected to a geological–structural analysis to highlight the natural fracture patterns as opposed to those induced by the riveting interventions of the 1980s. This analysis will allow for an interpretation of the entire dataset of dip and dip direction data.
The models’ analyses and the sensors’ data, supported by in situ observations, showed that the main causes of degradation stem from past interventions in which incompatible materials or methods were used, such as riveting. The structural stresses provoked are worsened by natural factors, such as temperature and humidity fluctuations and water infiltration, as they promote freeze–thaw cycles. In addition, the effect of wind, intensified by the specific conformation of the tunnel, accelerates surface erosion and contributes to the detachment of weakened material.

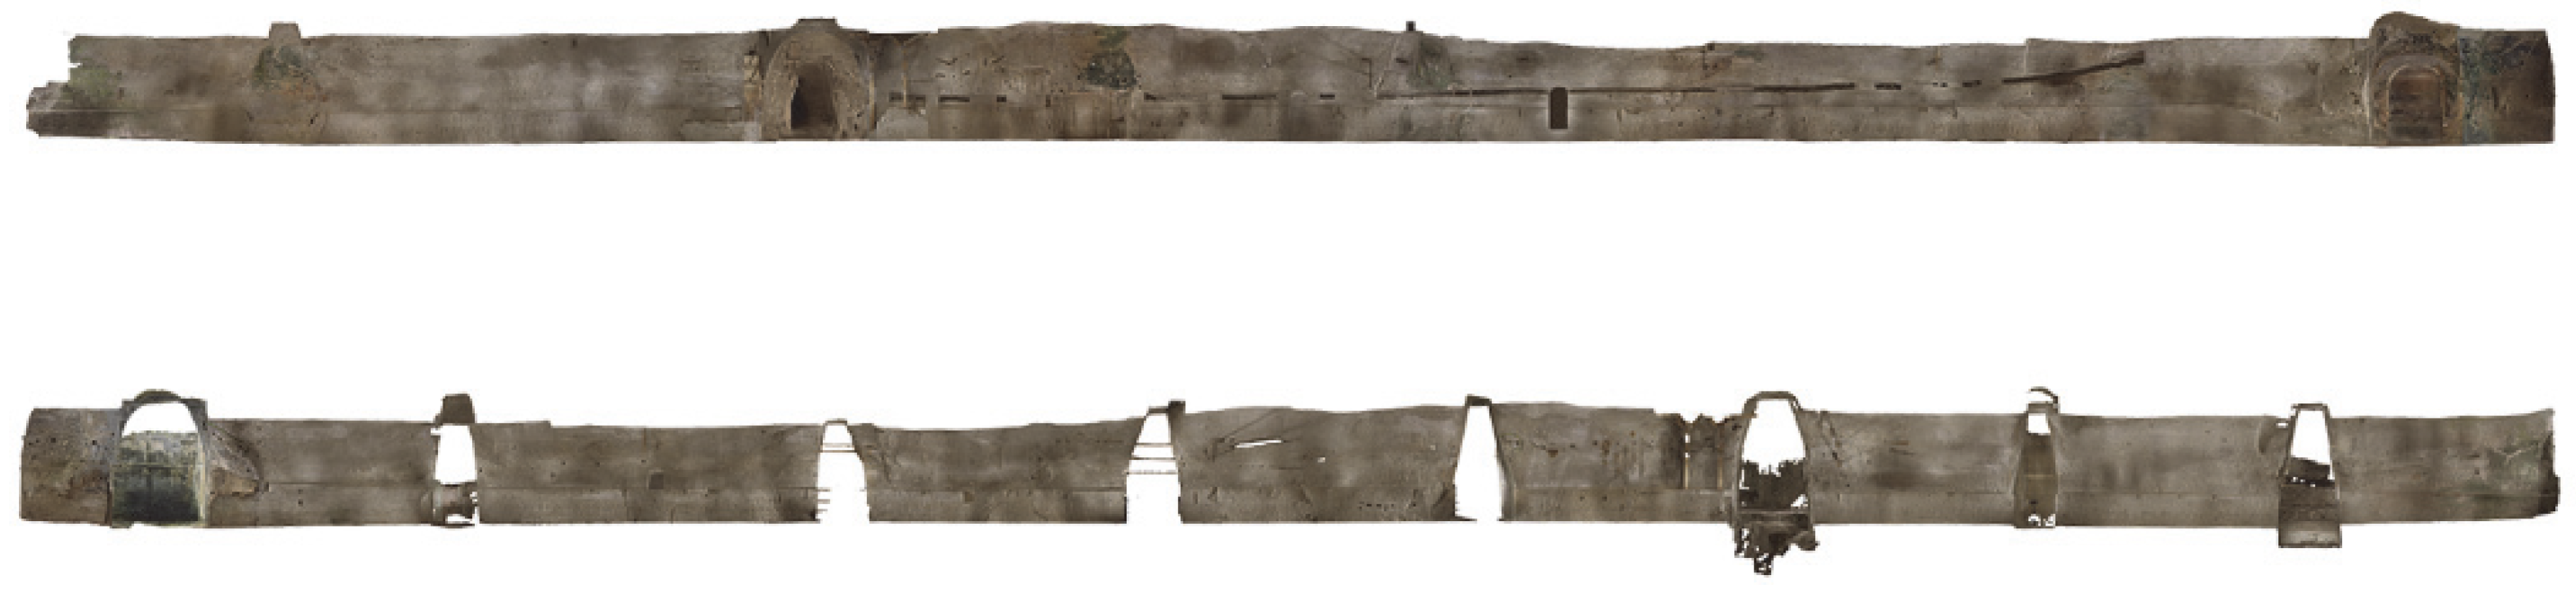
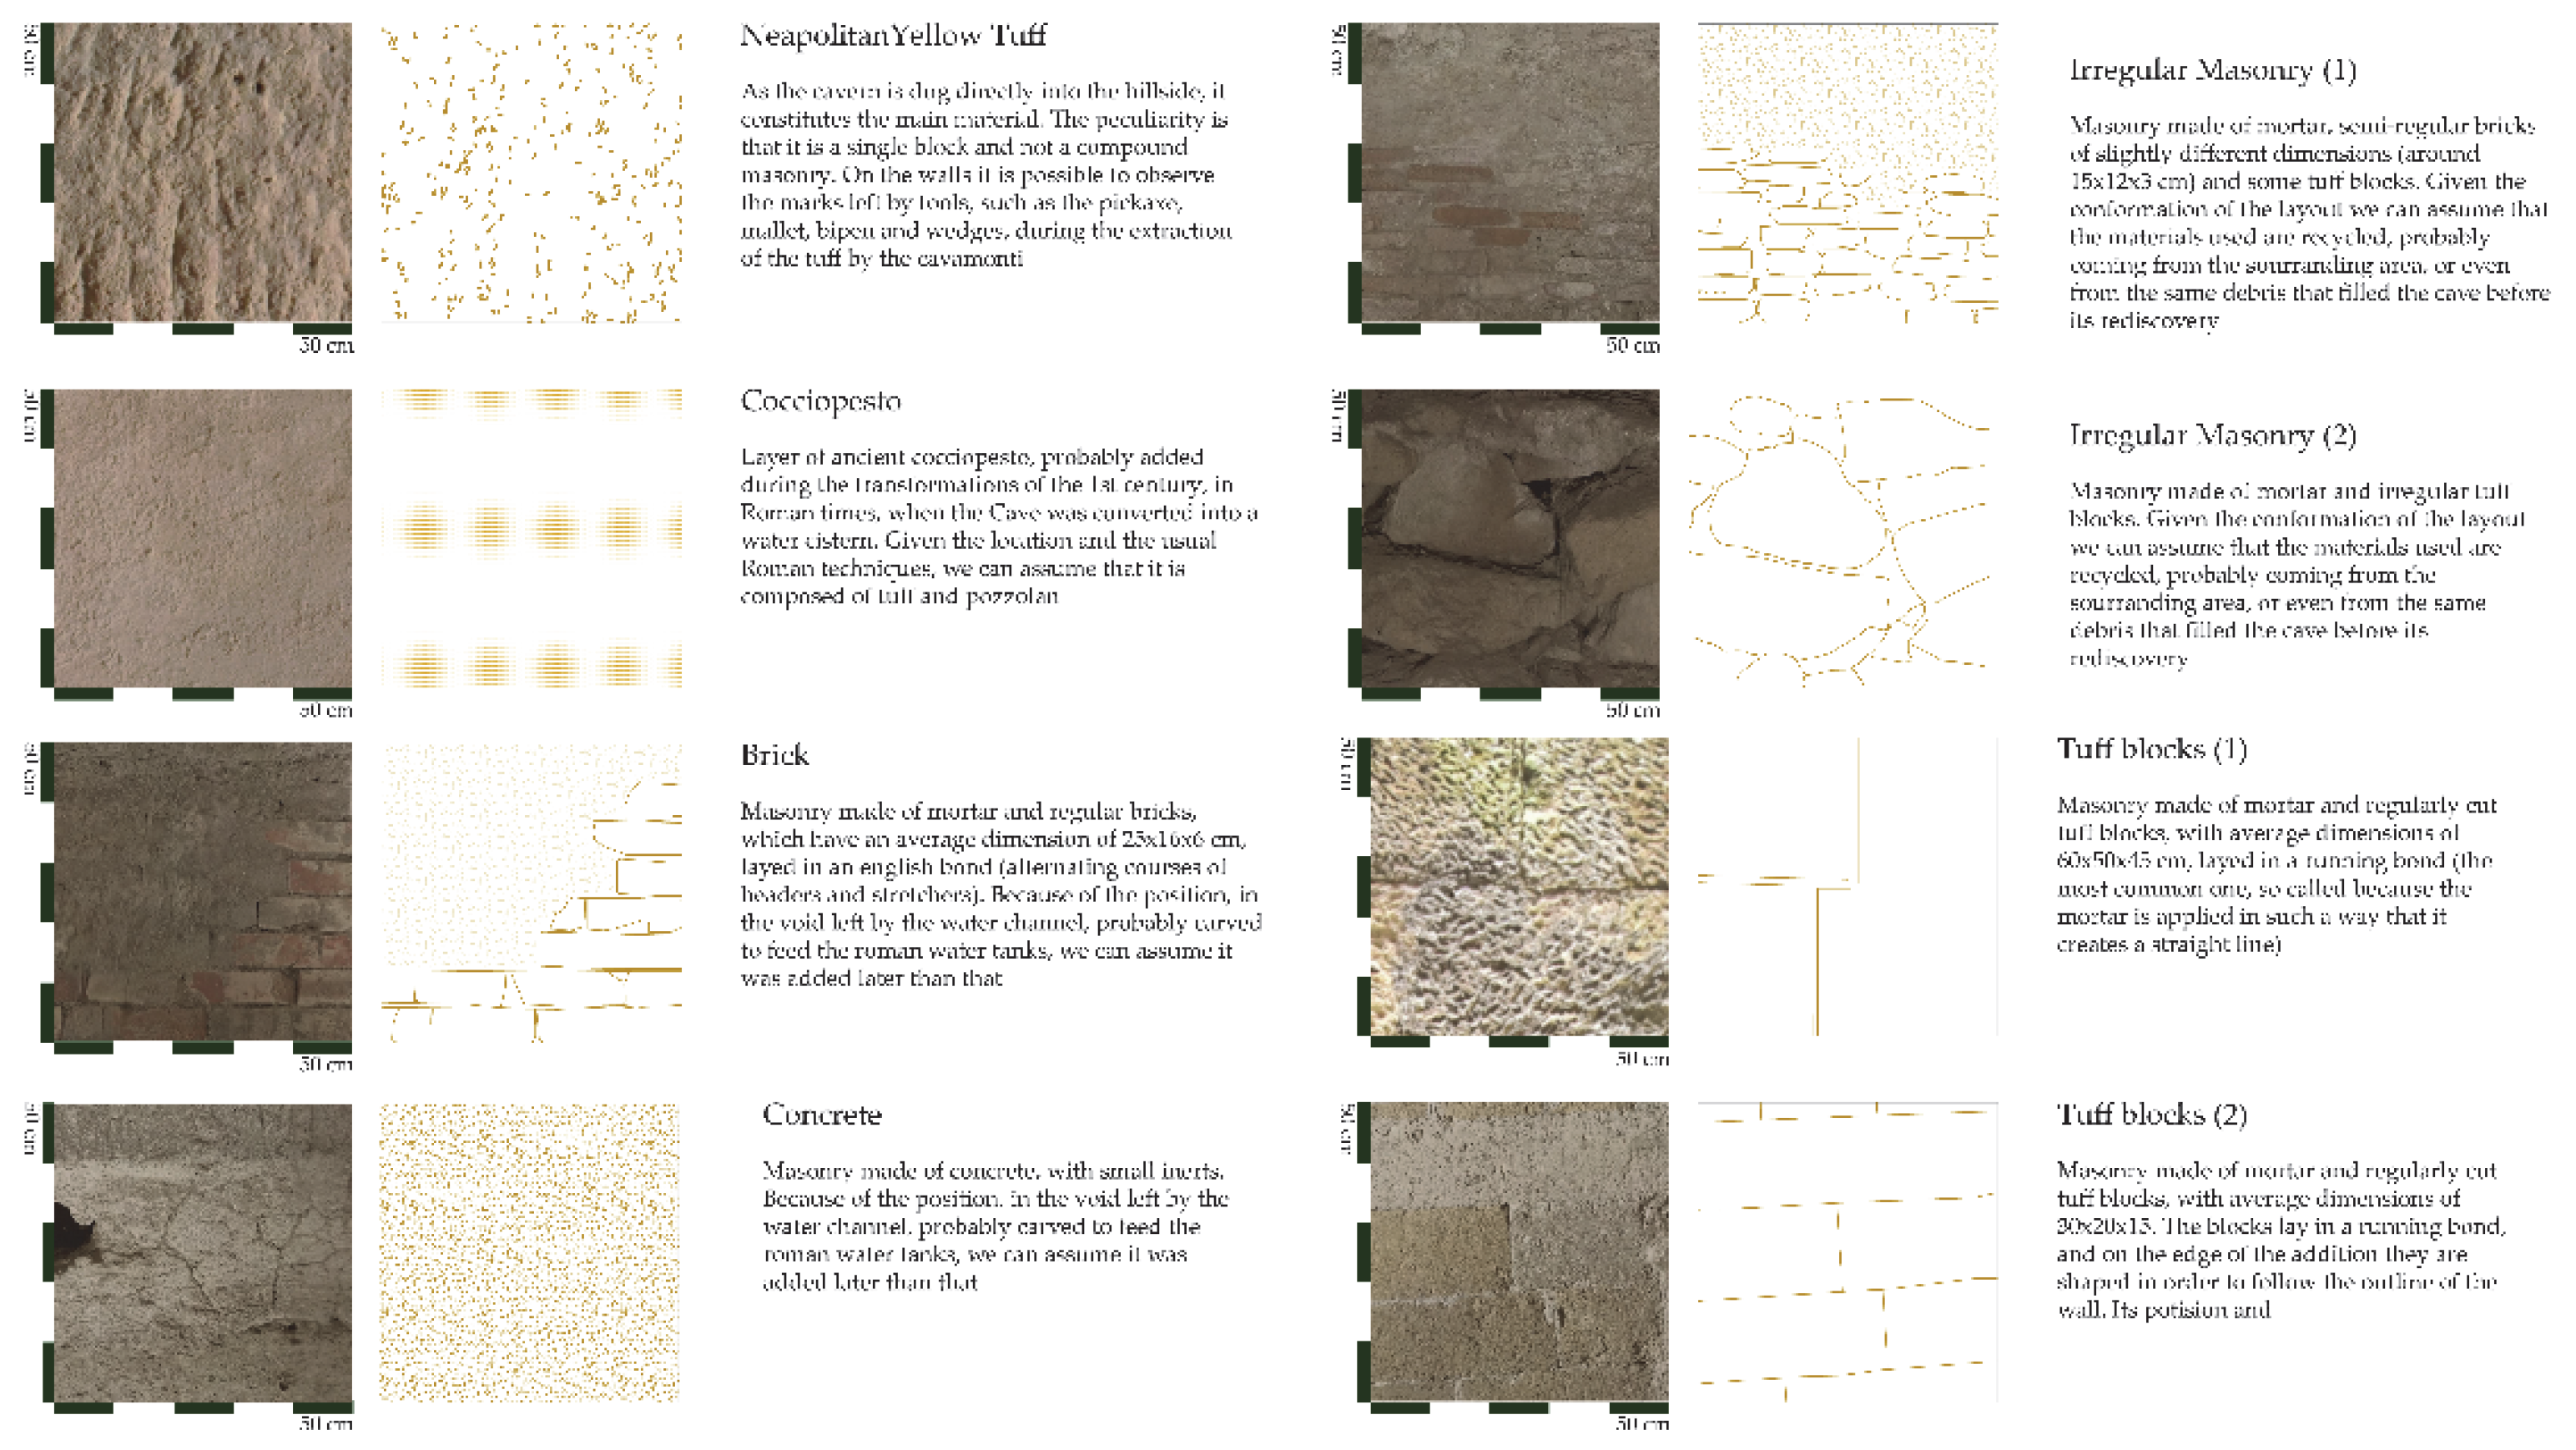
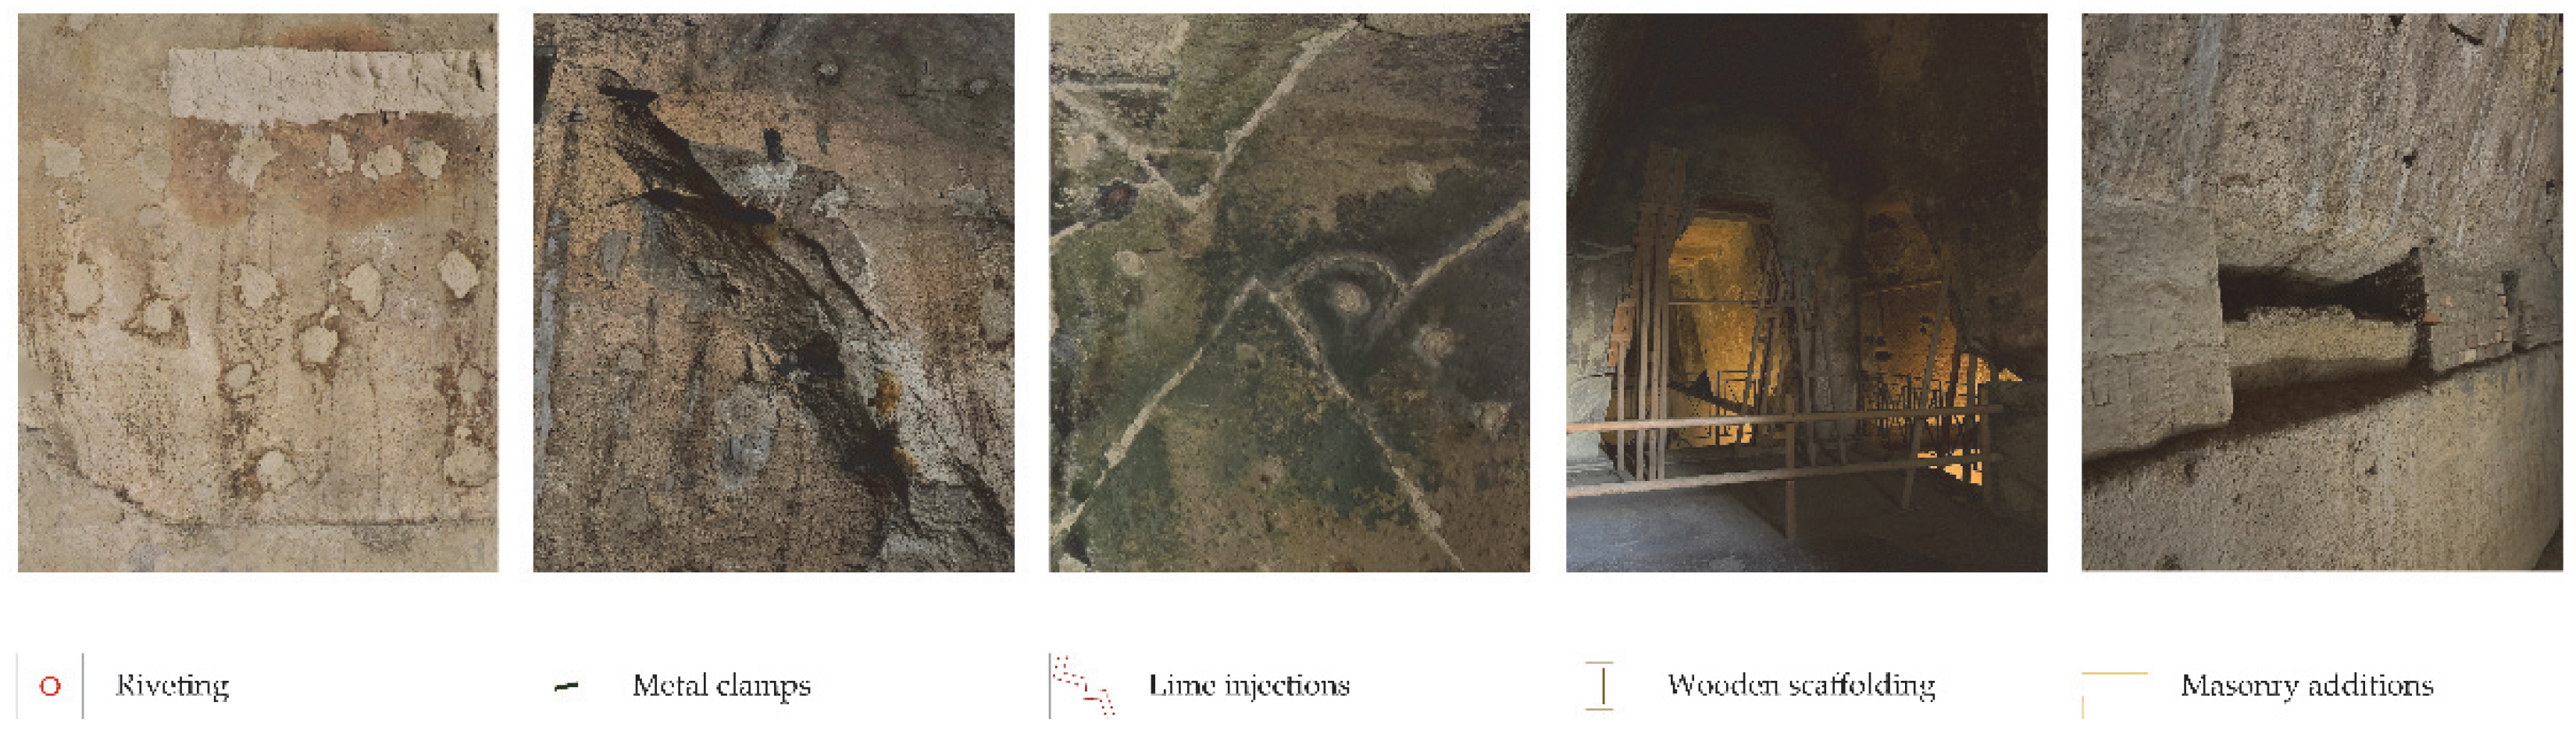
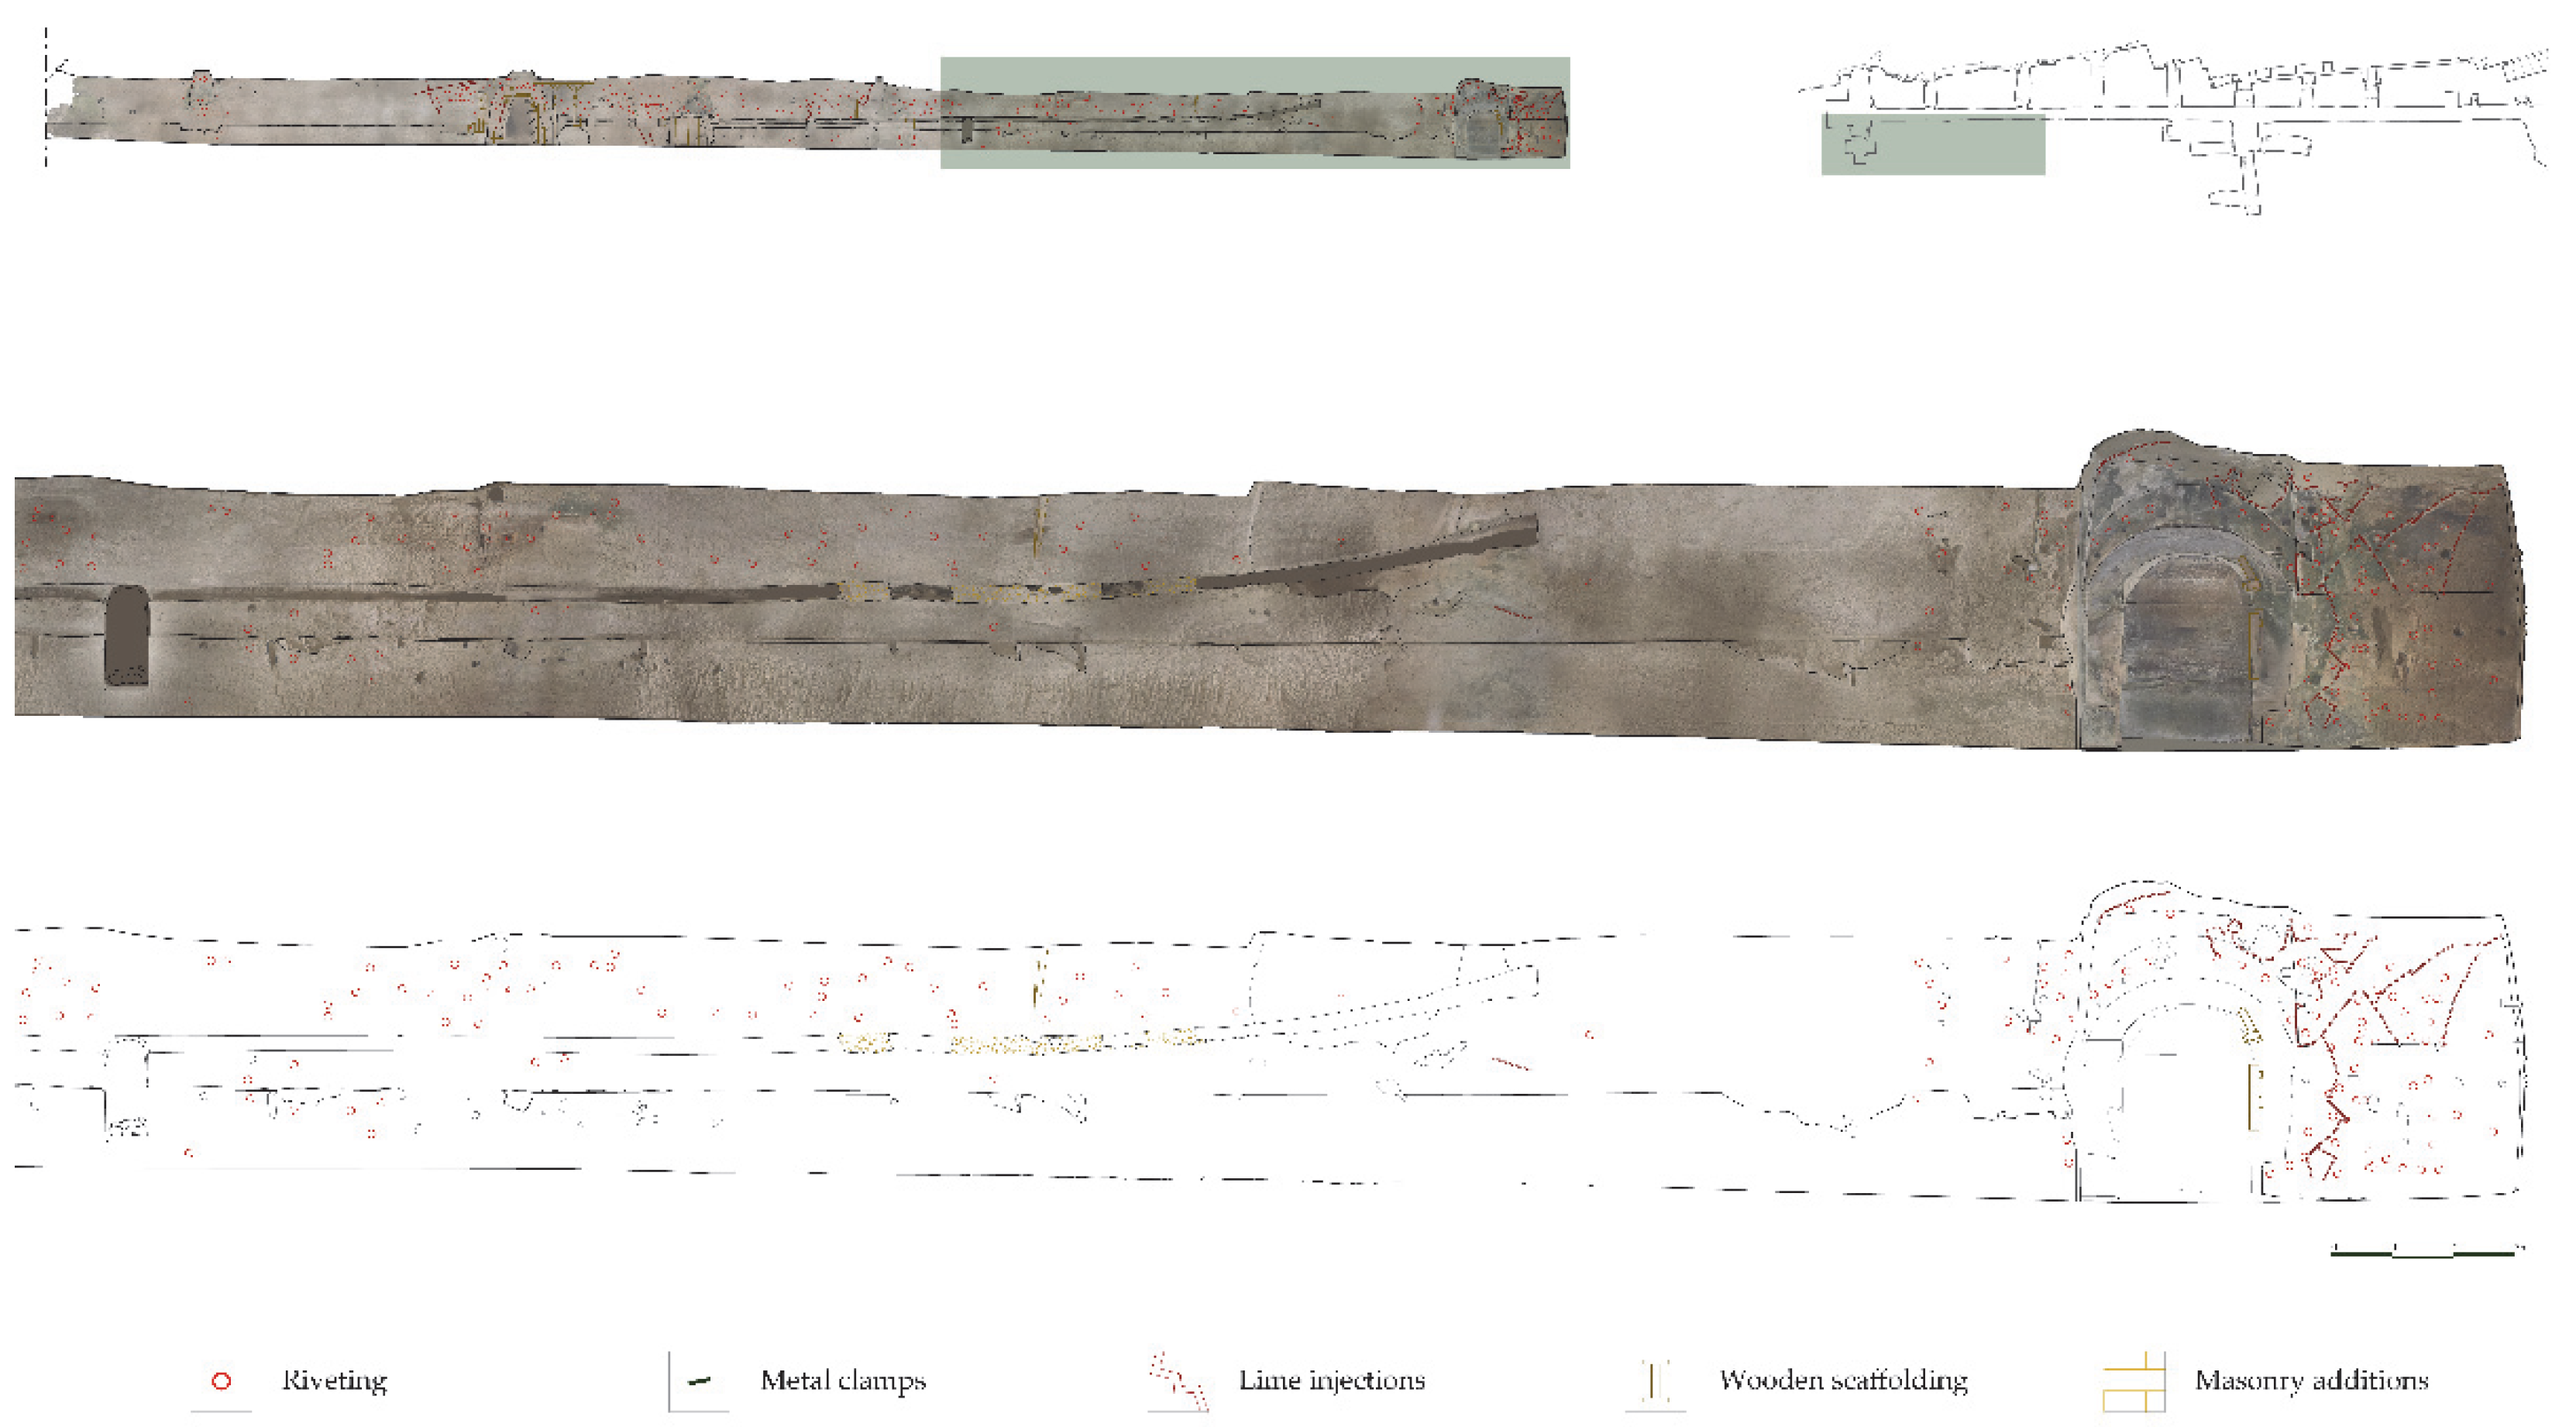
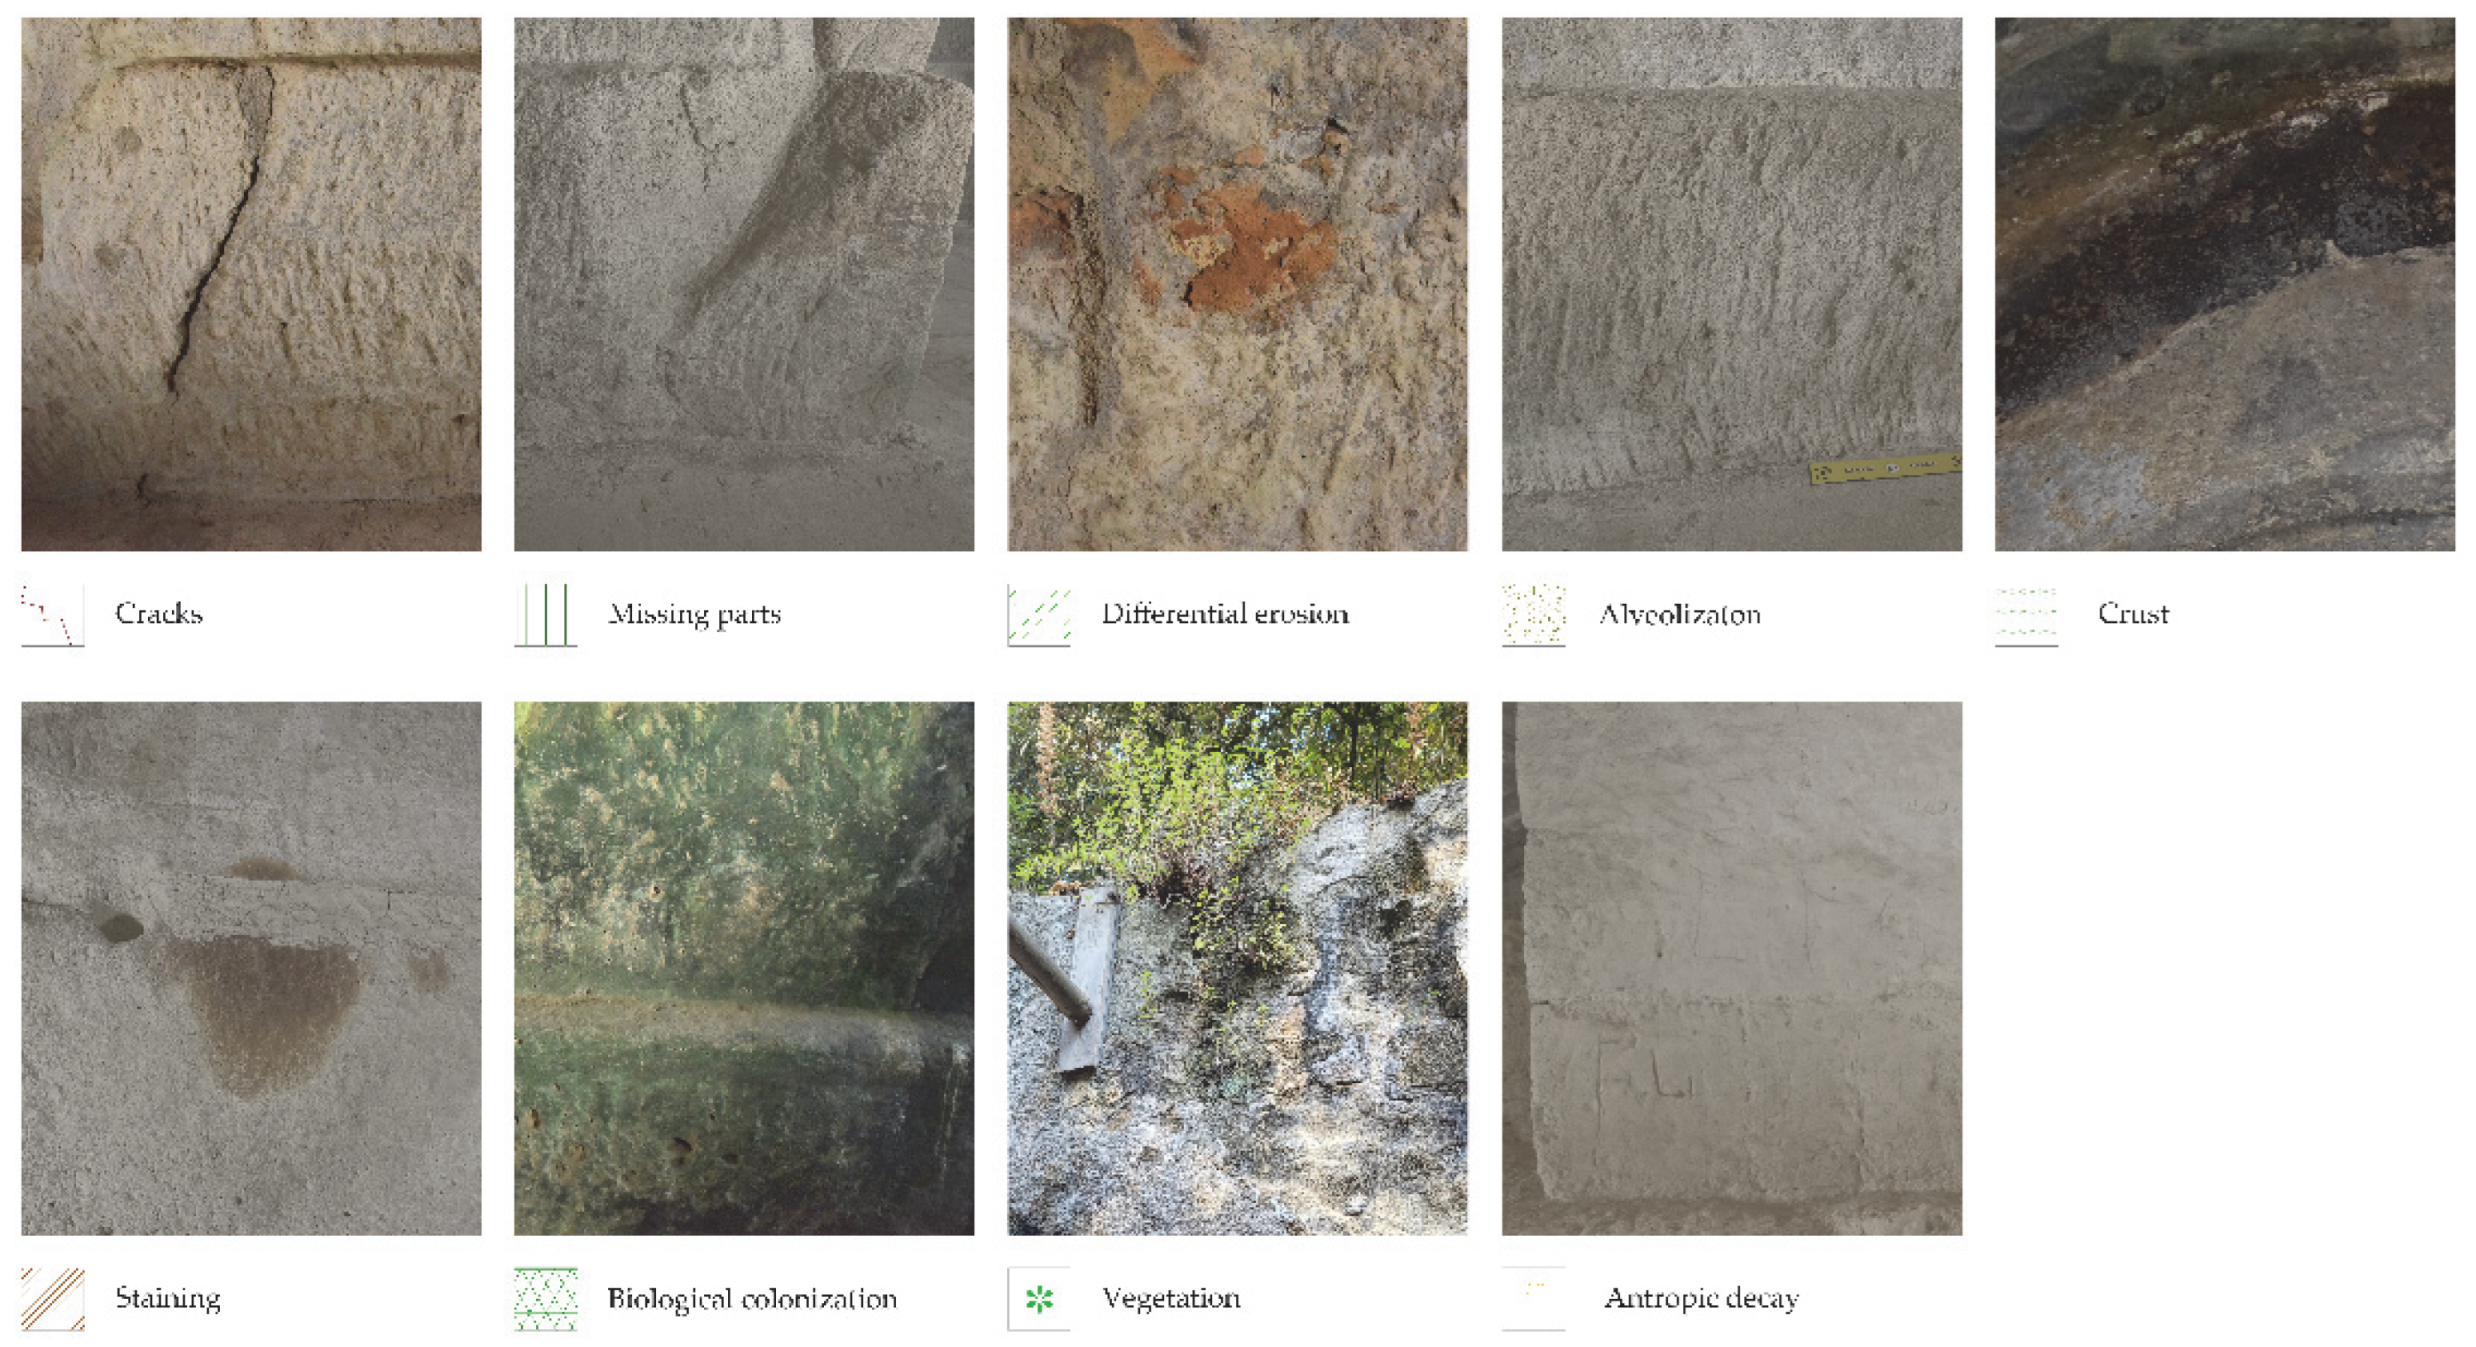
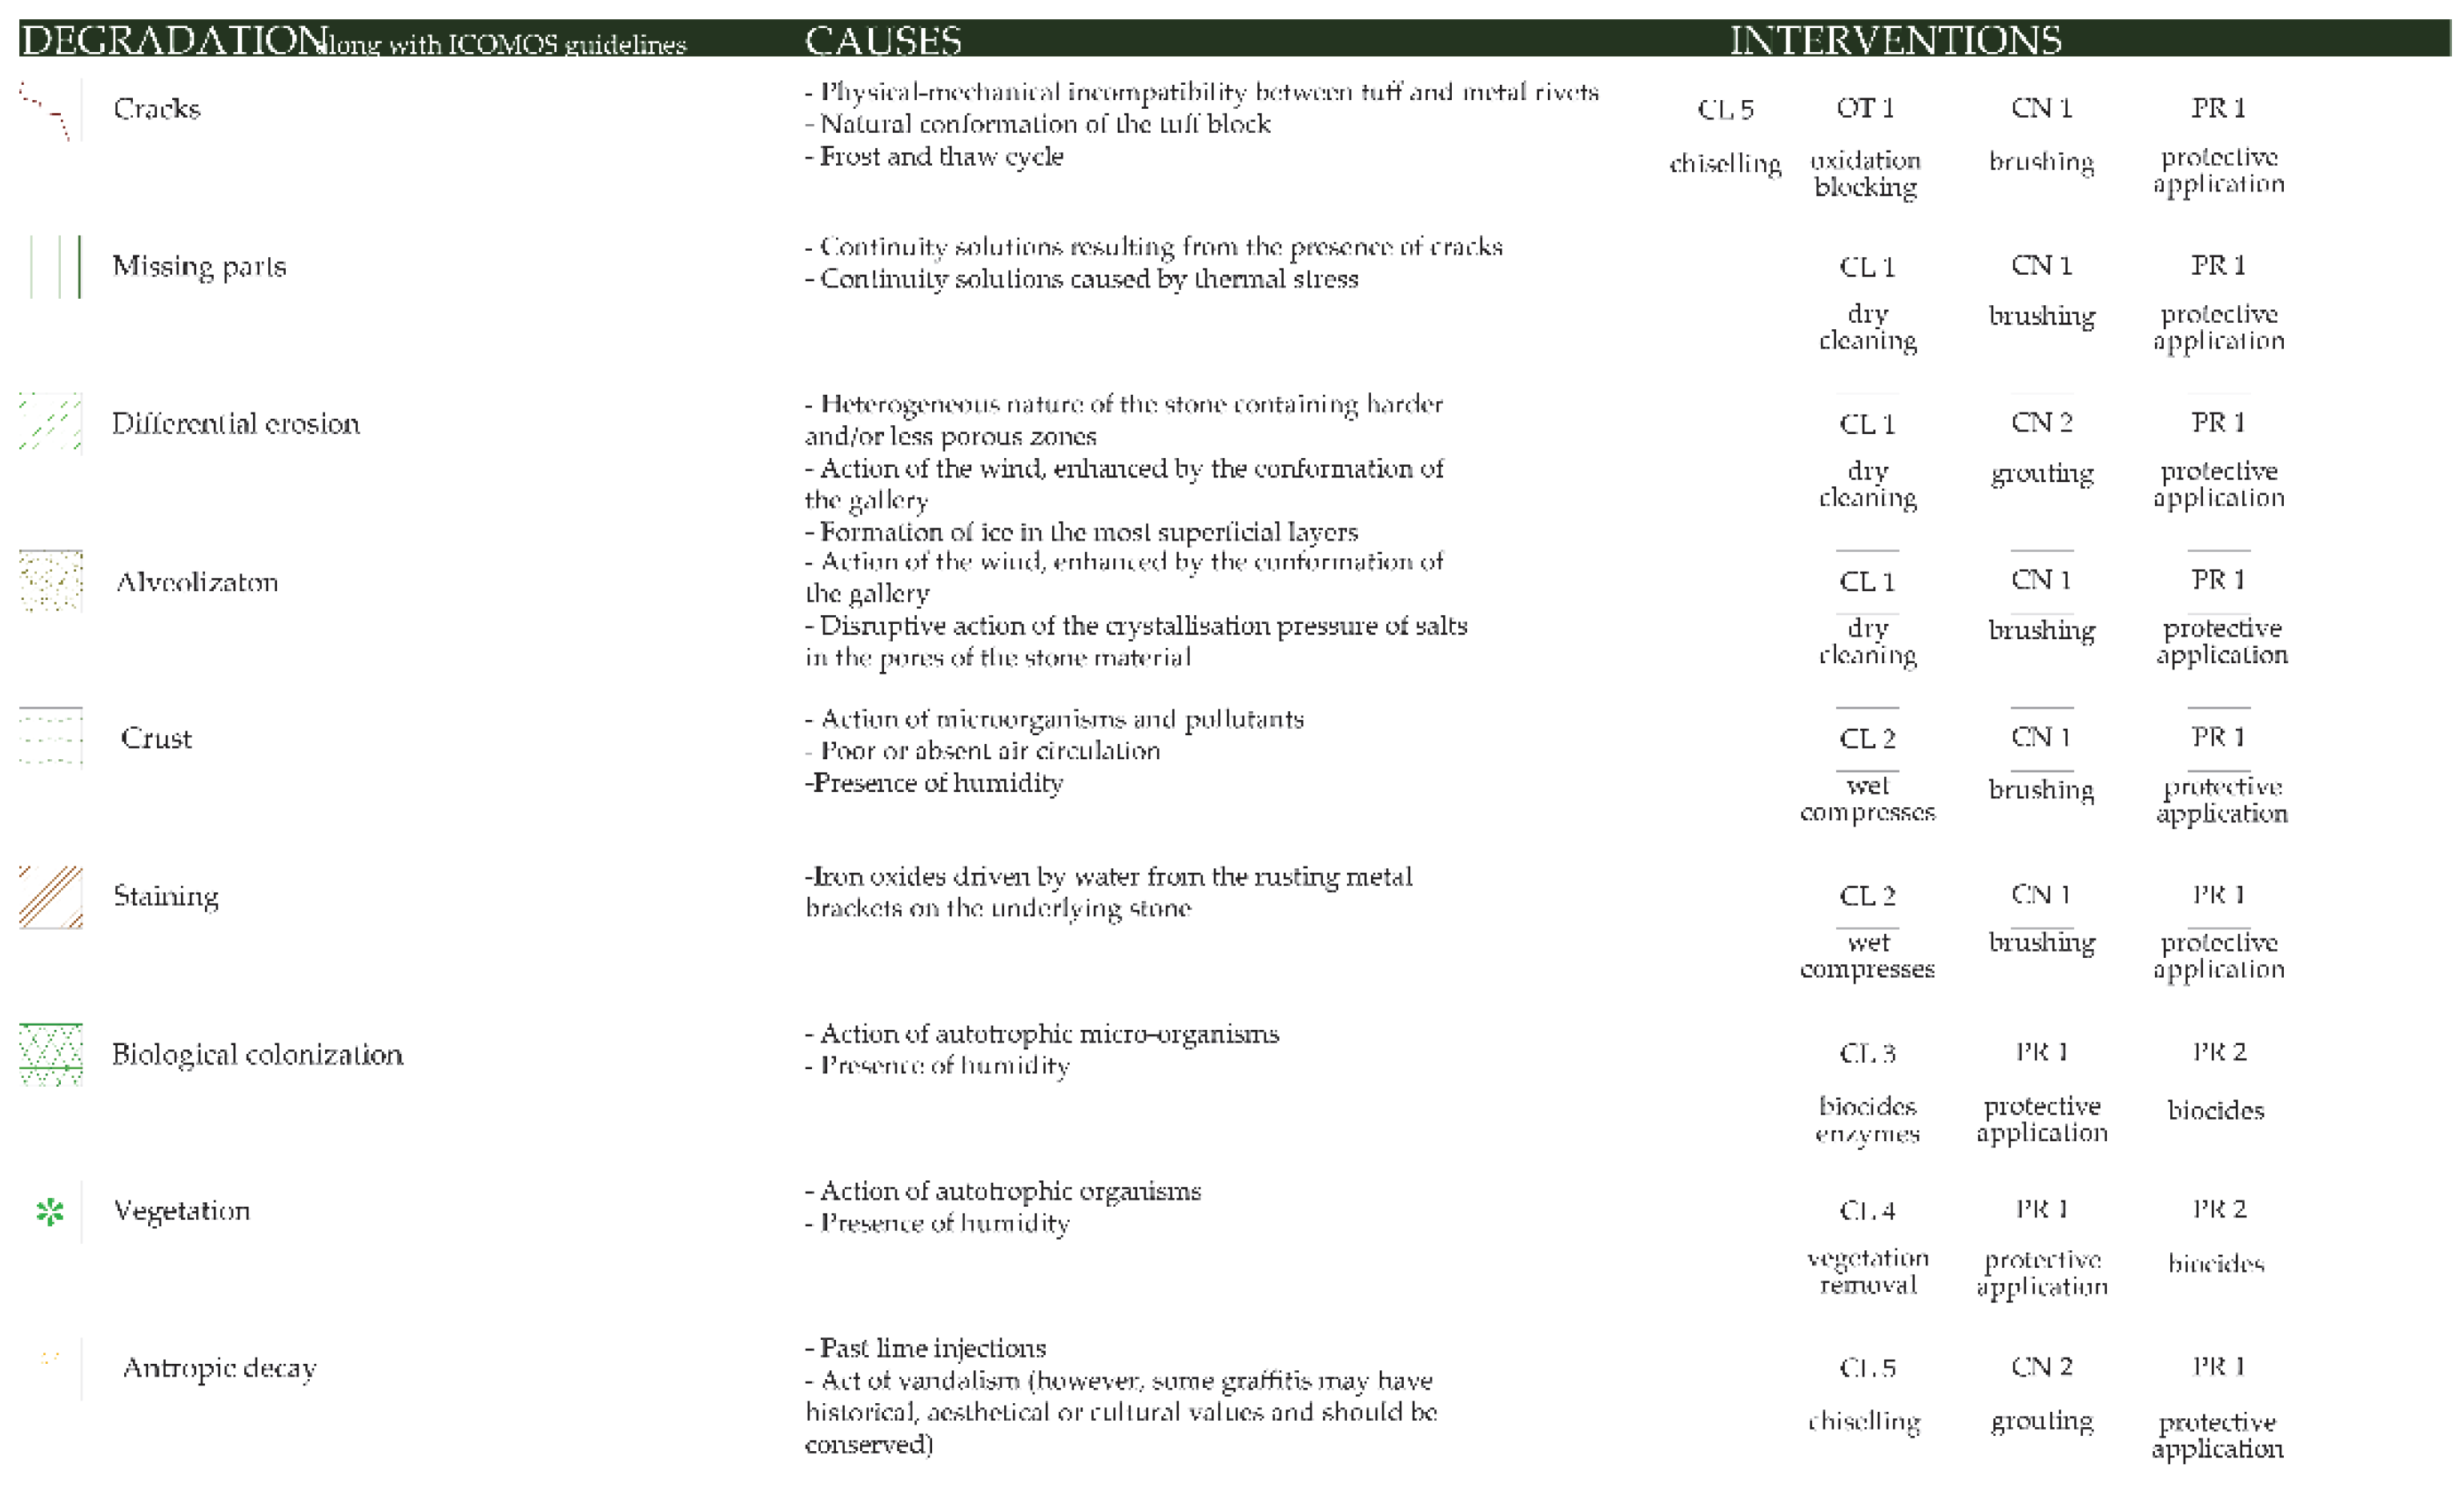
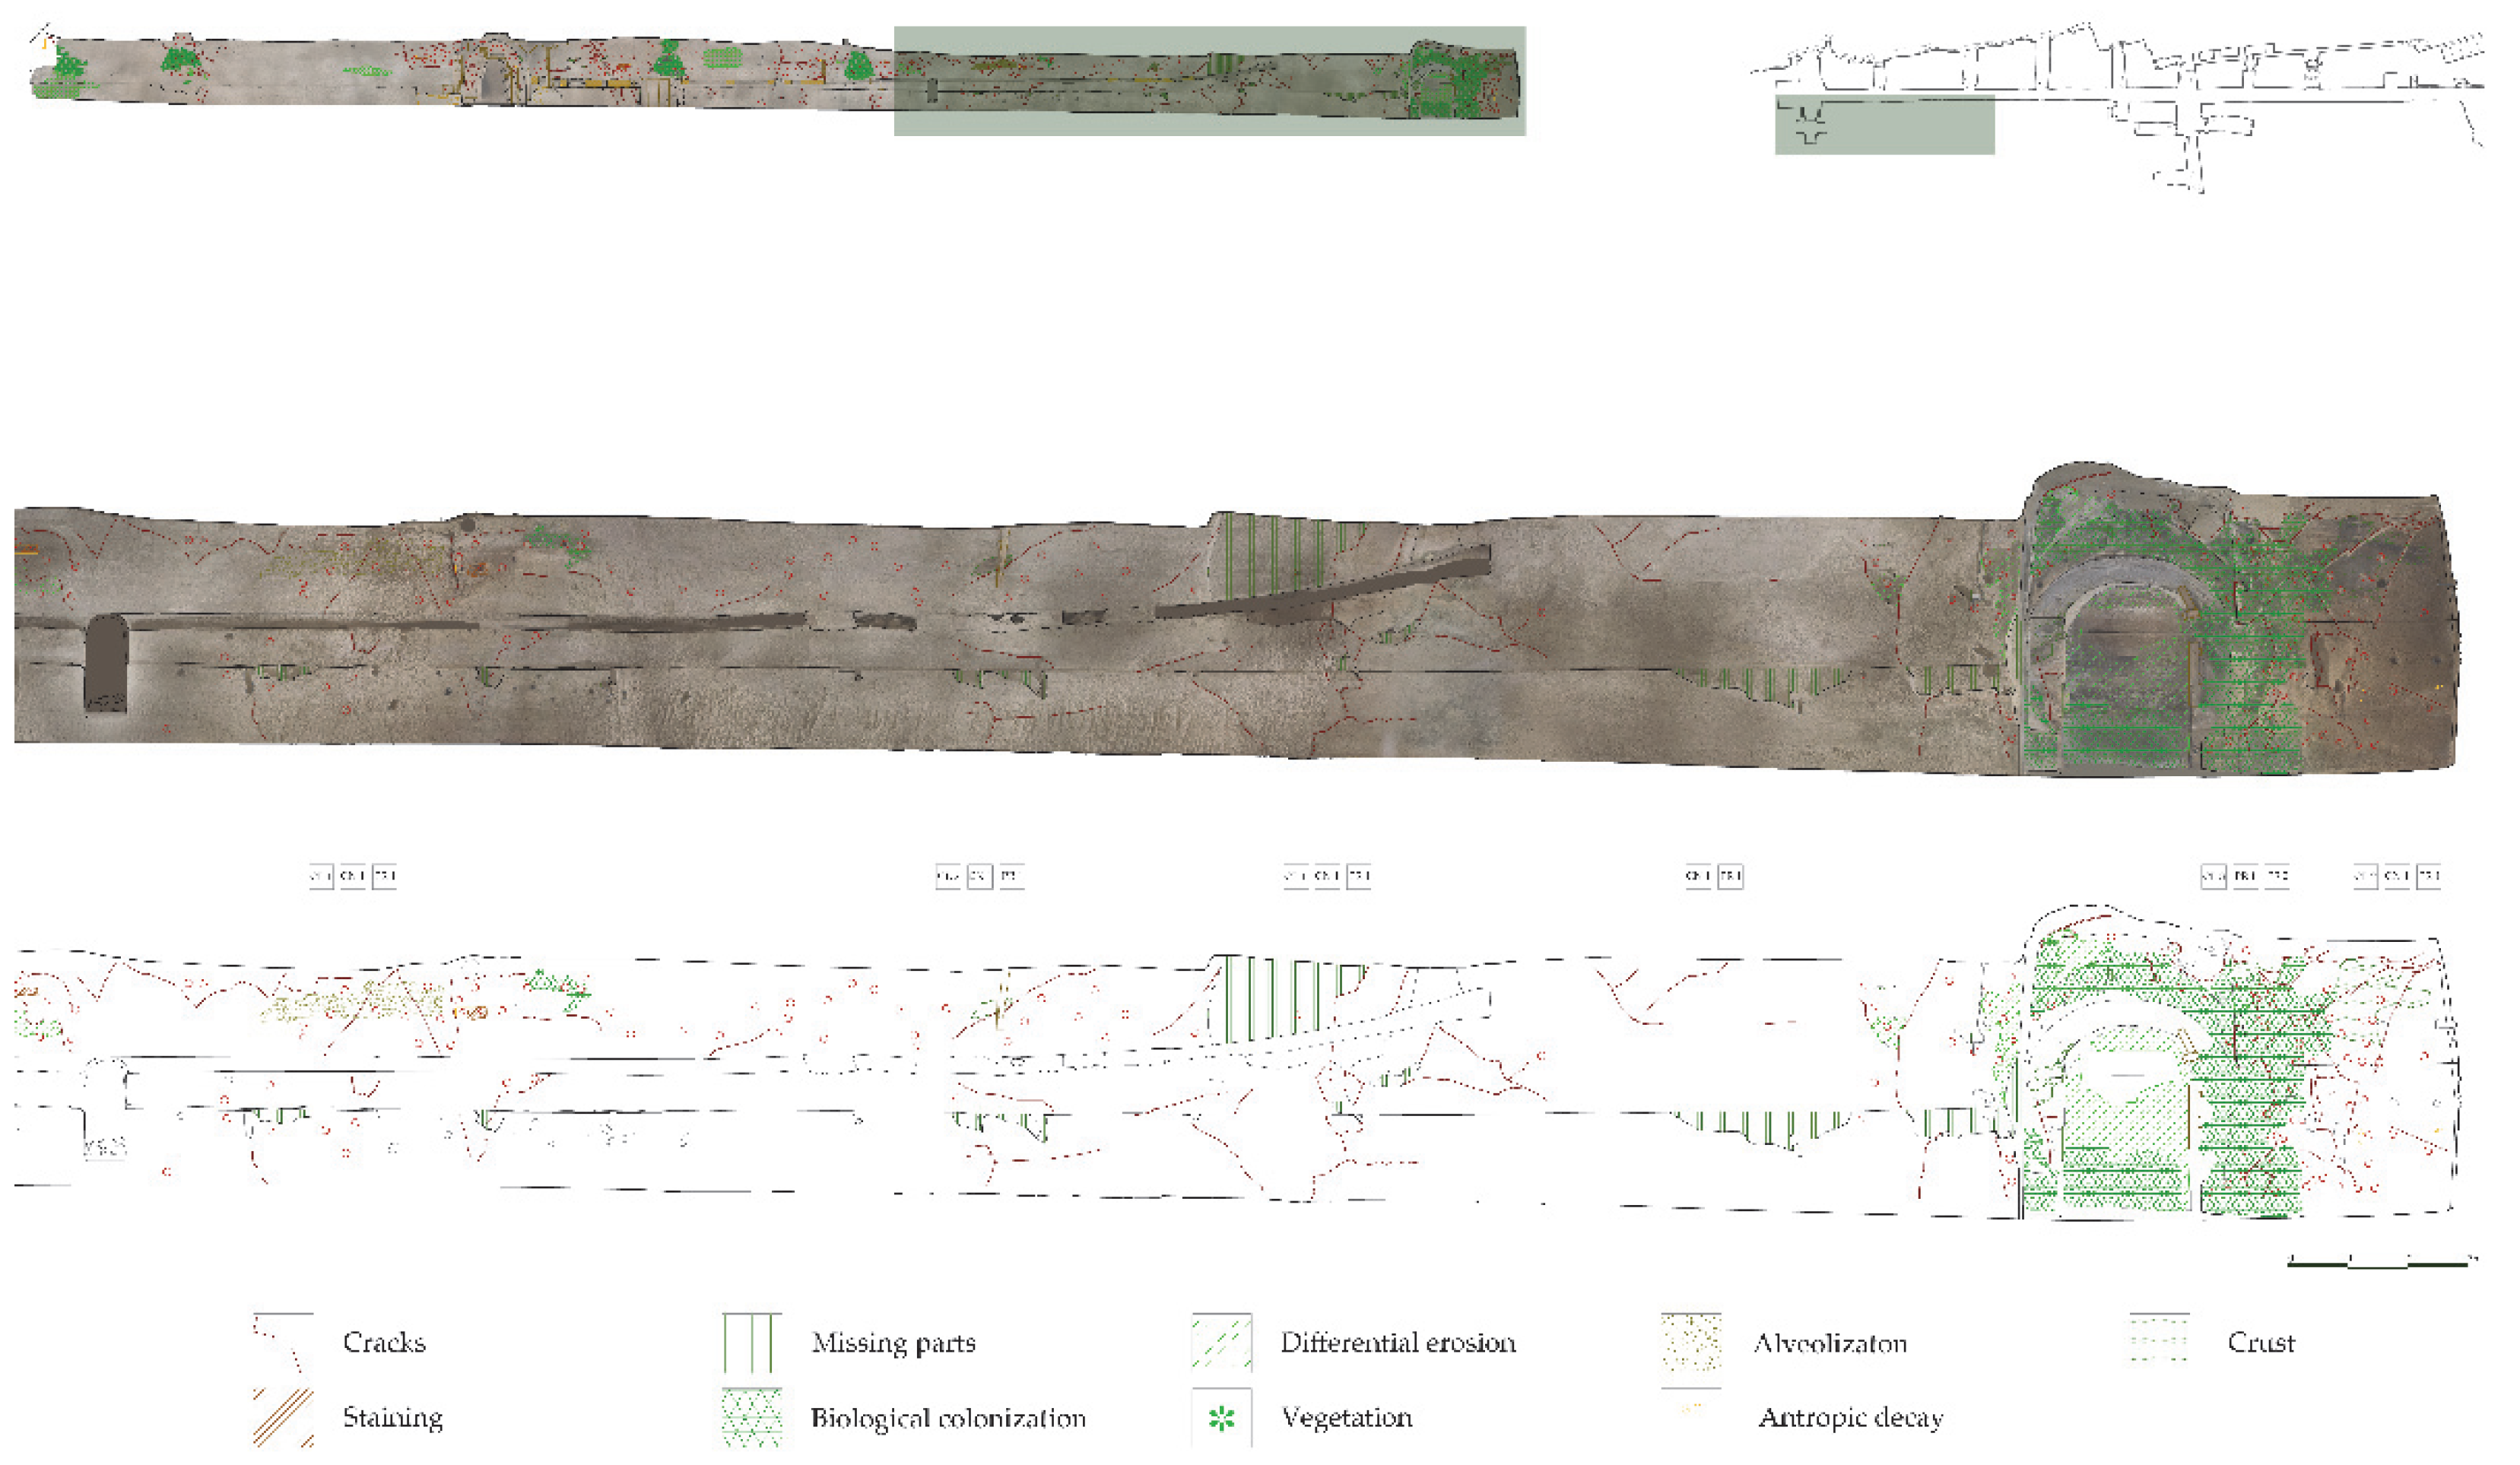
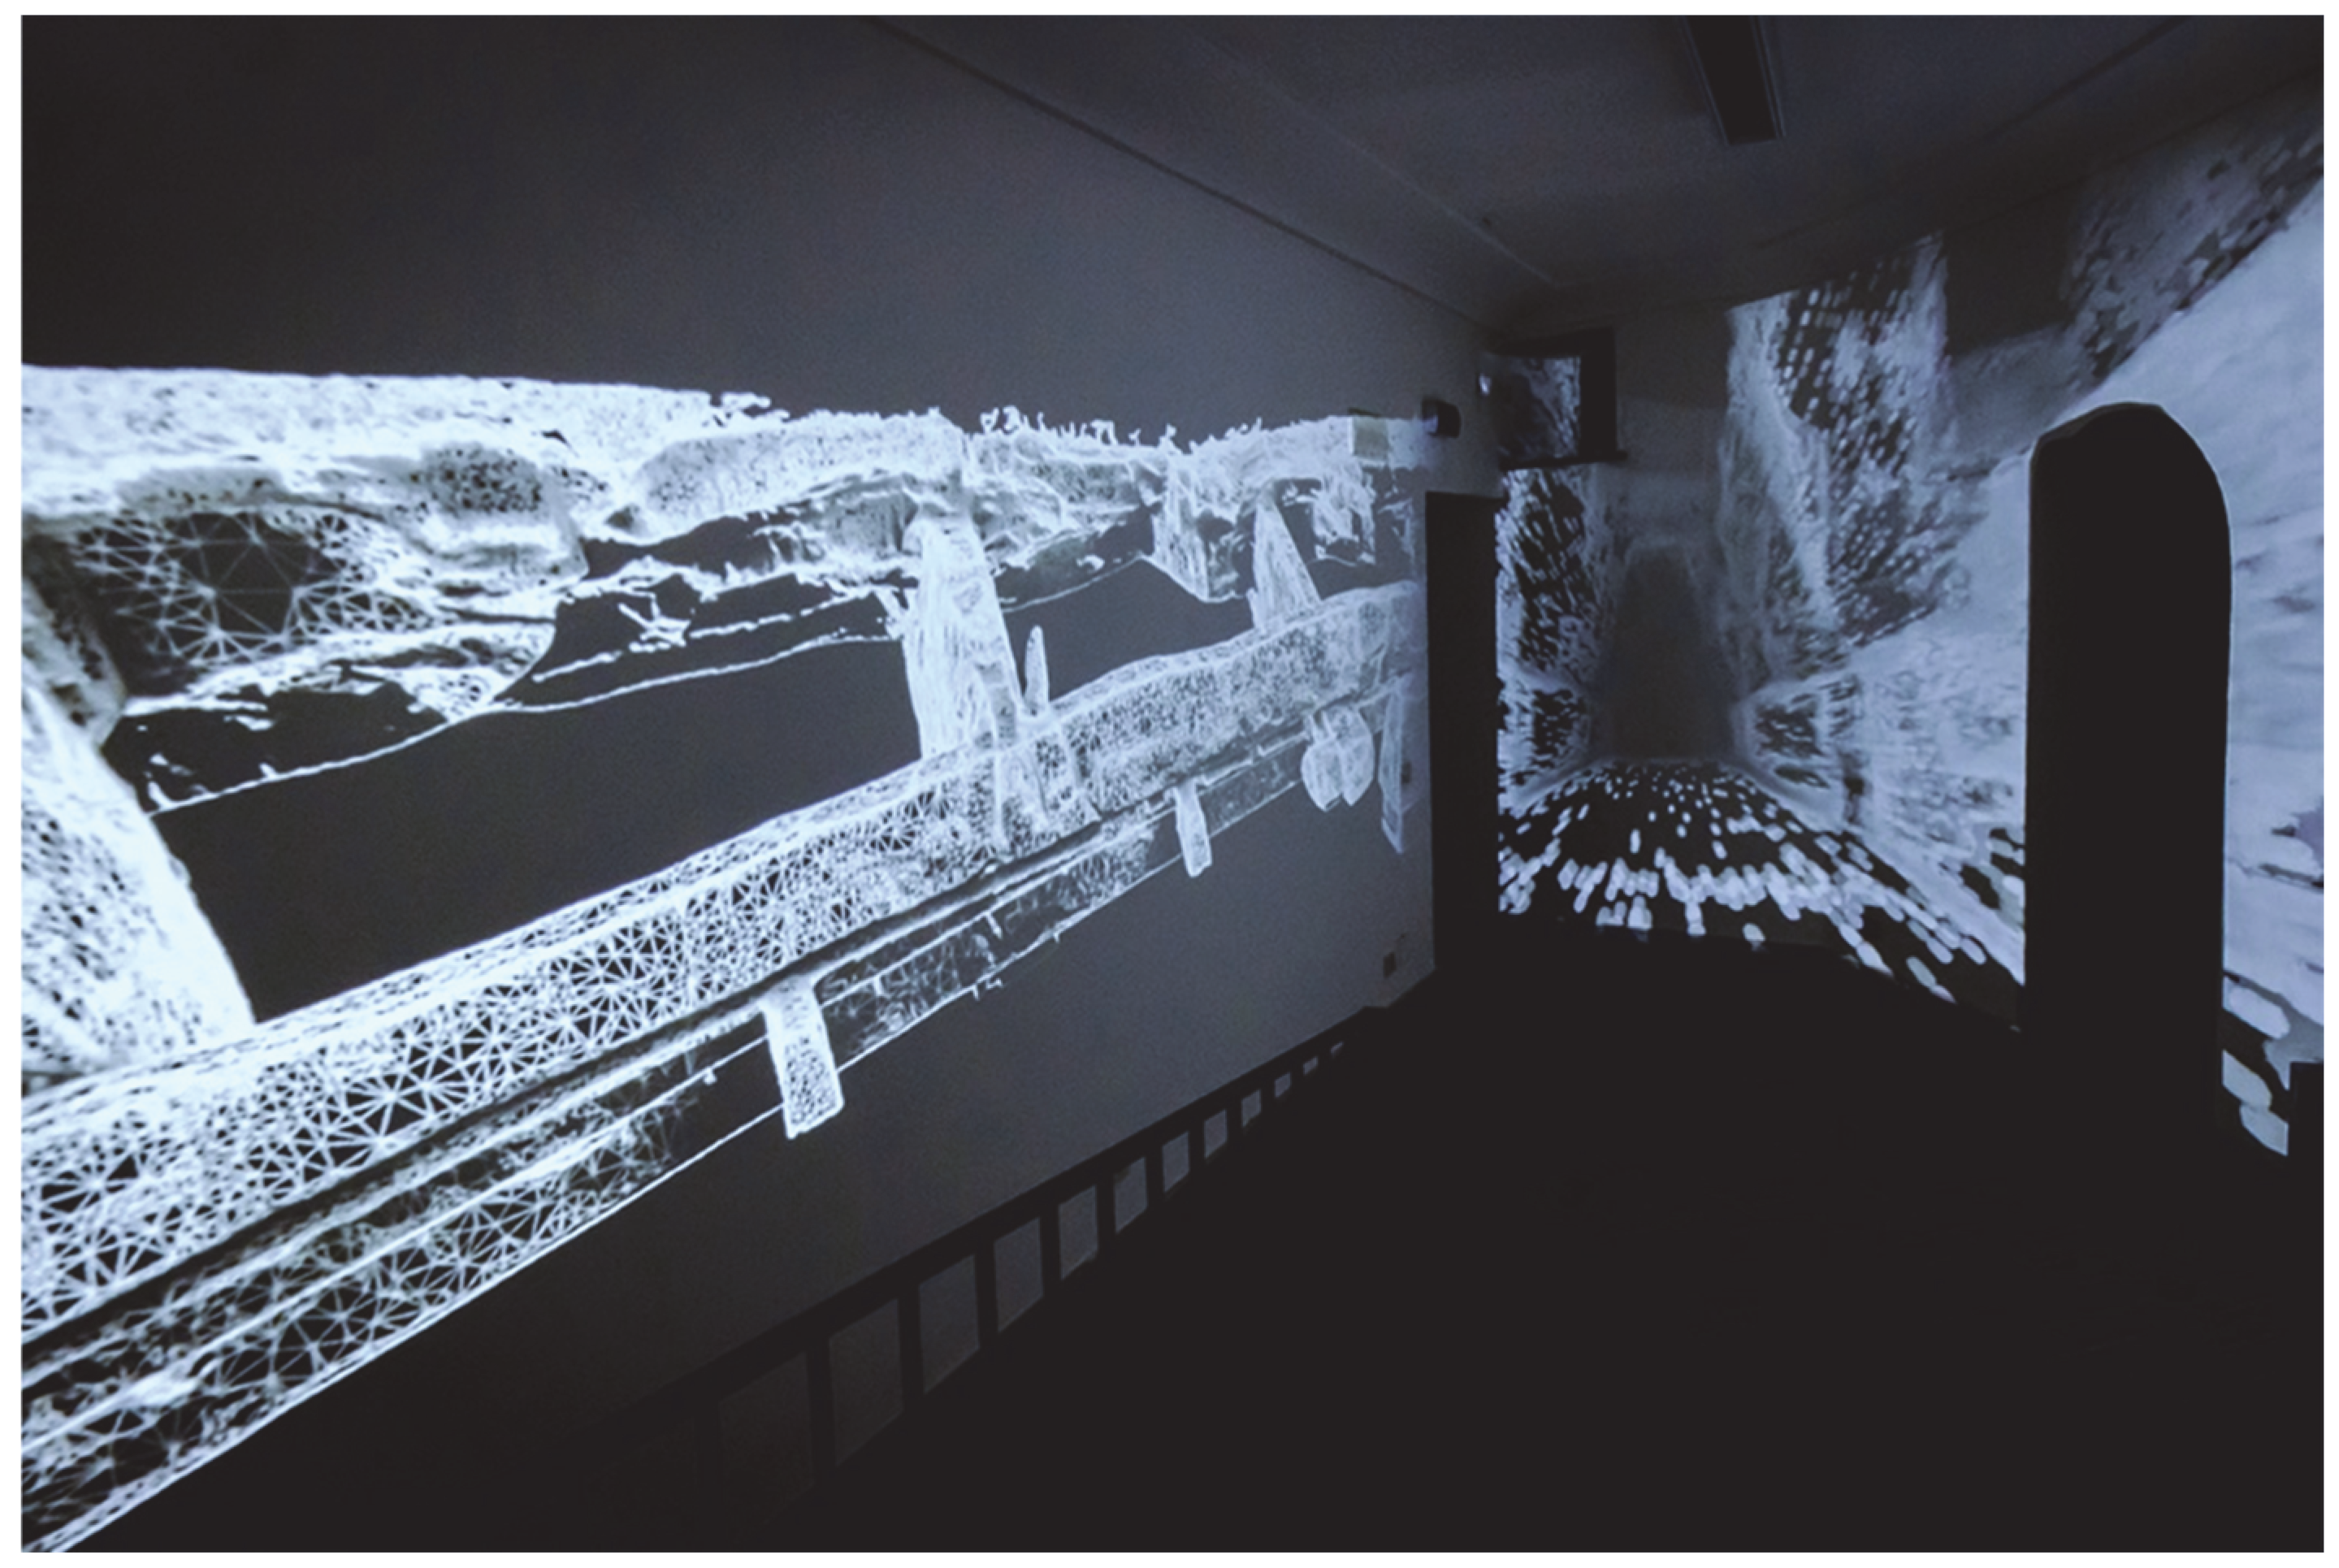
3.2. The Antro Della Sibilla Case

Within the broader scope of the project, particular attention was dedicated to the Antro della Sibilla, not only because of its cultural significance but also due to the evident structural challenges that currently limit its accessibility and compromise its integrity. The detailed 3D reconstructions (Figure 20) provided an in-depth understanding of these vulnerabilities, informing targeted restoration measures. The analysis of the data collected in the field was conducted according to ICOMOS guidelines [23], revealing several critical issues that threaten the conservation of the Antro.
Firstly, numerous fractures were identified, some of which have evolved into detachments of rock material. Added to this is the presence of significant biological colonization. Organisms such as mosses and lichens retain moisture and secrete acidic substances that accelerate the deterioration of the rock. Vegetation, if not properly managed, can also further compromise the structural integrity of the cavity due to the strength of the roots that penetrate into the cracks.
Other degradation phenomena observed inside the Antro are differential erosion, caused by the different composition of the tuff that constitutes it. The harder parts resist the action of atmospheric agents, while the softer ones deteriorate more rapidly, a process accelerated by the action of the wind. Alveolisation, due to the pressure exerted by salt crystals inside the rock pores, further contributes to the deterioration. Surface crusts have also formed, consisting of an accumulation of external materials, such as dirt, pollutants, and salts, which are deposited on the rock due to poor air circulation and high humidity. Finally, there are iron oxide stains, originating from the corrosion of metallic elements embedded in the rock.
In addition to these natural phenomena, there is also degradation of anthropogenic origin, mainly due to previous consolidation of the cracks, which in some cases have caused further structural problems and altered the original appearance of the cavity. Graffiti has also been identified, the historical or cultural significance of which is still being studied (Figure 21, Figure 22 and Figure 23).
The restoration strategy designed to address the aforementioned types of degradation prioritizes the preservation of the cave’s original materials, the use of reversible methods, and the application of techniques that are compatible with the properties of tuff.
Cleaning interventions are tailored to address specific types of degradation. Dry cleaning with soft brushes and rags removes loose surface deposits, while poultice cleaning, using cellulose pulp compresses soaked in distilled water and ammonium carbonate, softens and lifts crusts and oxidation residues. Bio-enzyme solutions effectively remove organic deposits and inhibit biological growth without harming the tuff. Vegetation is carefully extracted using mechanical tools to prevent root damage. Additionally, chiseling is employed to remove incompatible materials and encrustations manually, ensuring precise intervention with minimal impact on the substrate.
To address structural cracks and surface degradation, several methods are proposed. Existing metal rivets will be subjected to magnetic pole reversal where possible to stop oxidation and prevent further cracks due to rust expansion; in other cases, oxidized metal parts will be reduced by means of drilling with a small-diameter probe. Cracks and small voids will be filled with natural hydraulic lime-based grouts enhanced with pozzolanic additives, which offer breathability, compatibility with tuff, and flexibility to accommodate seismic activity. Ethyl silicate applications will reinforce weathered surfaces, particularly in areas with deep cracks and alveolization, without compromising the stone’s breathability.
Protective measures will further safeguard the cavity. Biocides will be applied to remove biological growth, such as fungi and lichens, followed by preventive treatments to inhibit recolonization. Breathable water-repellent coatings will protect the surface from moisture and pollutants while allowing the tuff to release internal moisture. Materials used in consolidation, such as lime-based grouts and mortars, will enable the structure to accommodate minor seismic movements without cracking or failing (Figure 24 and Figure 25).
While not part of the immediate planning, a drainage system may be introduced in the future to divert rainwater and reduce ground moisture infiltration. This system would target water-related degradation by channeling excess moisture through underground pathways, effectively managing rising humidity at its source.

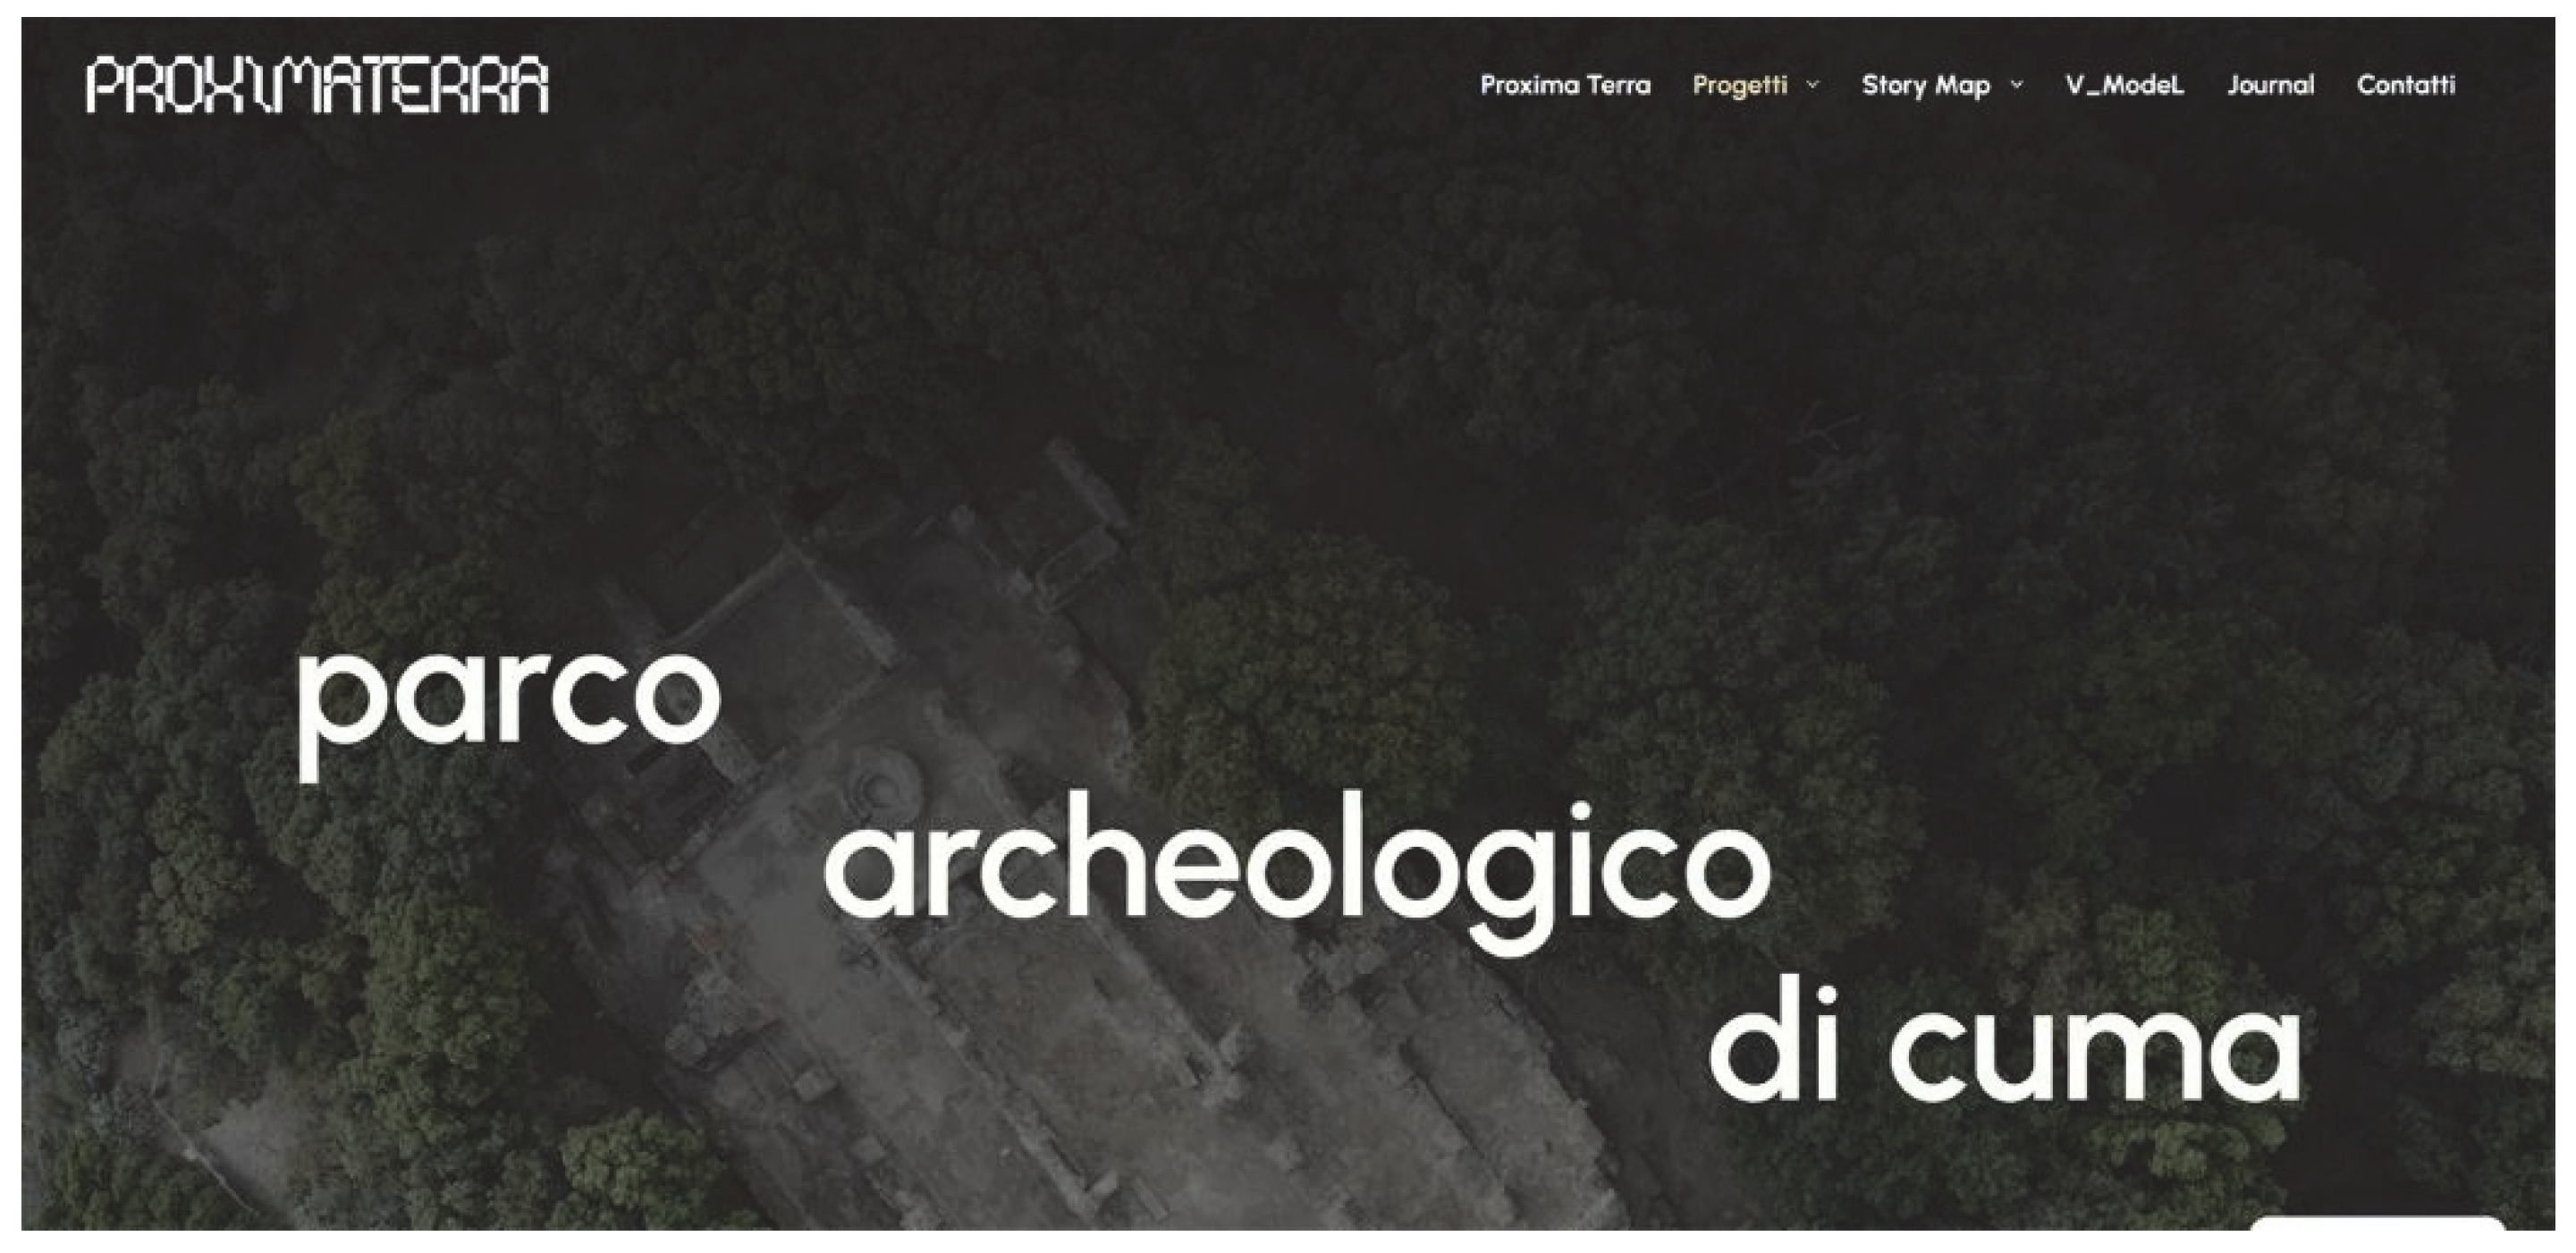
3.3. Dissemination of the Data

Aside from the technical objective of research, such as increasing the knowledge of the site for scholars and researchers, one of the most promising aspects of this study lies in its potential to engage a wider public through innovative data visualization and educational tools [24]. In fact, in cultural heritage projects, the dissemination of scientific data is a crucial phase, particularly when digital methodologies and interdisciplinary research converge, generating such complex results as the rich dataset produced at the archeological site of Cumae.
A relevant innovation in this phase has been the adoption of ArcGIS StoryMaps. This platform enables the creation of dynamic, interactive narratives that combine spatial data with multimedia content. StoryMaps have proven effective in improving public engagement and spatial understanding by bridging the gap between abstract scientific information and geographic storytelling [25,26]. In our case, StoryMaps have been employed to contextualize the research within the broader territorial and historical landscape of Cumae, offering accessible pathways to explore themes such as geology, mythology, history, and conservation. From an educational standpoint, StoryMaps support inclusive and participatory dissemination practices, allowing users—students, scholars, and the general public alike—to explore content at their own pace, navigate rich media layers, and interact with high-resolution data [26].
To make all the 2–3D data managed within the ArcGIS platform at hand of the wider public, the Proxima Terra platform (Figure 26) has been developed and made accessible through the www.proximaterra.it website (Supplementary Materials), combining simplified access to research data through videos, images, and brief descriptions of the activities carried out, with more advanced levels of data visualization.
Another particularly effective strategy for dissemination has been the development of immersive and narrative-based museum experiences. Immersive exhibit design supported by digital technologies allows the public to engage with cultural content in both physical and virtual dimensions. The representation of architectural heritage has been transformed through spatial storytelling and sensory augmentation, enabling visitors to experience historical narratives as multi-sensory environments [27].
The temporary exhibition Terra at Palazzo de Fraja in Rione Terra, Pozzuoli, in 2022 [28,29] has been a clear exemplification of this approach. The exhibit design emphasized the communicative aspects of the 3D models produced, using them as the basis for graphic and digital content in the museum space. Visual language integrates scientific data into a unified display system [29], as happened for the display structures’ geometries, which were derived from numerical models of Cuma’s topography. A further layer of information was presented through video projections mapped onto architectural artifacts (Figure 27) [30]. These videos, based on data collected during the survey and analysis phases, aimed at creating a visually immersive experience, extending the layers of information beyond the mere morphological perception of the sites, overlaying scientific data on real objects and spaces.
The implementation of such methodologies not only enhances the outreach potential of scientific projects but also aligns with current trends in digital heritage dissemination, which emphasize multi-platform, multi-modal communication strategies designed to reach broader audiences while maintaining scientific rigor [31].

4. Conclusions

The research aims to verify the effectiveness of an interdisciplinary approach to the study of a complex site, such as Cumae, both in the phases of data acquisition in the field and management of models through analytical procedures in a CAD-GIS environment. The integration of high-resolution 3D surveys, geophysical investigations, real-time sensors, and GIS platforms allowed not only for the recording of the site’s current state but also the construction of a digital infrastructure for continuous monitoring, informed conservation, and public engagement. The adoption of this digital approach has proven to be far more than a tool for archiving: it has emerged as a proactive means of diagnosis, prevention, and strategic planning. By correlating multi-source data—including topographical, geological, structural, and environmental metrics—it was possible to uncover degradation patterns that might otherwise go unnoticed. This led to a holistic understanding of the site, wherein each instability is interpreted within a broader geomorphological and anthropogenic framework. One of the most innovative results lies in the transformation of the site from a static monument to a dynamic system. The IoT-based sensor infrastructure, embedded into the 3D models, enables real-time monitoring, paving the way for predictive—not just reactive—interventions. This responsiveness will be particularly relevant in the context of the ongoing bradyseismic phenomena in the Phlegraean Fields.
Furthermore, the project goes beyond conservation. By transforming scientific data into accessible formats for broader audiences, it explores new forms of cultural communication. Outreach initiatives—such as the Proxima Terra platform and the Terra temporary exhibition—demonstrate how numerical models can serve as bridges between academic research and public knowledge, transcending traditional barriers between expert and lay audiences. In keeping with the university’s ‘third mission’, the project results will be represented in a temporary exhibition during the Antro 2025 Festival. Through the projection of immersive contents directly in the spaces of the Antro della Sibilla, real places, digital models, and analytical data will compose a single perceptive experience in the extended space of the virtual. In this way, Cumae is no longer just an object of study, but an active participant in a dialogue between memory, innovation, and community.
Ultimately, this research offers a replicable model for other vulnerable archeological contexts, delivering a methodological roadmap that weaves together disciplinary expertise, advanced technology, and cultural valorization. The convergence of scientific rigor, technological innovation, and public engagement proves to be the cornerstone for the sustainable safeguarding of heritage—making it not only preserved but also accessible, meaningful, and shared.

Supplementary Materials

The following supporting information can be downloaded at www.proximaterra.it (accessed on 10 February 2025).

Author Contributions

Conceptualization, L.R.; methodology, L.R.; software, S.I.; validation, L.R.; investigation, L.R., G.V. and M.A.L.; data curation, G.V., S.I. and M.A.L.; writing—original draft preparation, M.A.L.; writing—review and editing, L.R. and G.V.; visualization, M.A.L.; supervision, L.R.; project administration, L.R.; funding acquisition, L.R. All authors have read and agreed to the published version of the manuscript.

Funding

This research was funded by the Ministry of Culture—‘Piano straordinario di monitoraggio e conservazione dei beni culturali immobili’, prot. Mic Pa Fleg n. 15/09/2021 n. 5598. Leopoldo Repola was supported by grant PNRR ‘GeoSciences IR’—Mission 4, Component 2.

Data Availability Statement

More data supporting results can be found at https://www.proximaterra.it/parco-archeologico-di-cuma/ (accessed on 10 February 2025).

Acknowledgments

We would like to thank the Campi Flegrei Archeological Park for its support and availability for all the field research activities and the installation phases of the monitoring sensors and the ‘Direzione Generale Sicurezza del Patrimonio Culturale’ and the ‘Ufficio del Soprintendente speciale per le aree colpite dal sisma il 24 agosto 2016’ of the Ministry of Culture for the funding granted. We thank the Boviar company for the georadar surveys carried out at the Antro della Sibilla. Leopoldo Repola was supported by grant PNRR ‘GeoSciences IR’—Mission 4, Component 2.

Conflicts of Interest

The funders had no role in the design of the study; in the collection, analysis, or interpretation of data; in the writing of the manuscript; or in the decision to publish the results.

Abbreviations

The following abbreviations are used in this manuscript:
BCEBefore Common Era
TLSTerrestrial Laser Scanning
UAVUnmanned Aerial Vehicle
SfMStructure from Motion
RSRemote Sensing
GISGeographic Information System
ESRIEnvironmental Systems Research Institute, Inc.
IoTInternet of Things
GPRGround-Penetrating Radar
CADComputer-Aided Design
DSLRDigital Single Lens Reflex
GISGeographic Information System
GNSSGlobal Navigation Satellite System
GPSGlobal Positioning System
LiDARLight Detection And Range
TOFTime of flight
MEMSMicro-Electro-Mechanical Systems
SLAMSimultaneous Localization And Mapping
NURBSNon-Uniform Rational B-Spline

References

  1. Beloch, K.J. Campania: Storia e Topografia Della Napoli Antica e Dei Suoi Dintorni; Bibliopolis: Napoli, Italy, 1989; pp. 145–189. [Google Scholar]
  2. Amalfitano, P.; Camodeca, G.; Medri, M. I Campi Flegrei: Un Itinerario Archeologico, 1st ed.; Marsilio: Venezia, Italy, 1990; pp. 289–294. [Google Scholar]
  3. Maiuri, A. I Campi Flegrei. Dal Sepolcro Di Virgilio All’antro Di Cuma, 3rd ed.; Istituto Poligrafico dello Stato: Roma, Italy, 1981; pp. 108–143. [Google Scholar]
  4. Caputo, P. Cuma: E Il Suo Parco Archeologico. In Un Territorio e Le Sue Testimonianze, 2nd ed.; Scienze e Lettere: Roma, Italy, 2010; pp. 15–21. [Google Scholar]
  5. Natale, J.; Vitale, S.; Isaia, R. Simultaneous Normal and Reverse Faulting in Reactivating Caldera Faults: A Detailed Field Structural Analysis from Campi Flegrei (Southern Italy). J. Struct. Geol. 2024, 181, 105109. [Google Scholar] [CrossRef]
  6. Isaia, R.; Vitale, S.; Marturano, A.; Aiello, G.; Barra, D.; Ciarcia, S.; Iannuzzi, E.; Tramparulo, F.D. High-Resolution Geological Investigations to Reconstruct the Long-Term Ground Movements in the Last 15 Kyr at Campi Flegrei Caldera (Southern Italy). J. Volcanol. Geotherm. Res. 2019, 385, 143–158. [Google Scholar] [CrossRef]
  7. Vitale, S.; Isaia, R. Fractures and Faults in Volcanic Rocks (Campi Flegrei, Southern Italy): Insight into Volcano-Tectonic Processes. Int. J. Earth Sci. 2014, 103, 801–819. [Google Scholar] [CrossRef]
  8. Pappalardo, U. La Sibilla Cumana. In Sailing to Classical Greece: Papers on Greek Art, Archaeology and Epigraphy Presented to Petros Themelis; Palagia, O., Goette, H.R., Eds.; Oxbow Books: Oxford, England, 2011; pp. 27–36. [Google Scholar]
  9. Virgilio Marone, P. Eneide, 4th ed.; Feltrinelli: Milano, Italy, 2018; Volume VI. [Google Scholar]
  10. Crisan, A.; Pepe, M.; Costantino, D.; Herban, S. From 3D Point Cloud to an Intelligent Model Set for Cultural Heritage Conservation. Heritage 2024, 7, 1419–1437. [Google Scholar] [CrossRef]
  11. Di Luggo, A.; Campi, M.; Repola, L.; Cera, V.; Scandurra, S.; Pulcrano, M.; Falcone, M. Evaluation of historical heritage documentation: Reality based survey and derivative models. Int. Arch. Photogramm. Remote Sens. Spat. Inf. Sci. 2019, XLII-2/W17, 115–122. [Google Scholar] [CrossRef]
  12. Jo, Y.H.; Hong, S. Three-Dimensional Digital Documentation of Cultural Heritage Site Based on the Convergence of Terrestrial Laser Scanning and Unmanned Aerial Vehicle Photogrammetry. ISPRS Int. J. Geo-Inf. 2019, 8, 53. [Google Scholar] [CrossRef]
  13. Remondino, F. Heritage Recording and 3D Modeling with Photogrammetry and 3D Scanning. Remote Sens. 2011, 3, 1104–1138. [Google Scholar] [CrossRef]
  14. James, M.R.; Chandler, J.; Eltner, A.; Fraser, C.; Miller, P.E.; Mills, J.P.; Noble, T.; Robson, T.S.; Lane, S.N. Guidelines on the Use of Structure-from-motion Photogrammetry in Geomorphic Research. Earth Surf. Process. Landf. 2019, 44, 2081–2084. [Google Scholar] [CrossRef]
  15. Mayer, C.; Pereira, L.M.G.; Kersten, T.P. A Comprehensive Workflow to Process UAV Images for the Efficient Production of Accurate Geo-Information; Ordem dos Engenheiros: Lisbon, Portugal, 2018. [Google Scholar]
  16. Bevilacqua, V.; Trotta, G.; Brunetti, A.; Buonamassa, G.; Bruni, M.; Delfine, G.; Riezzo, M.; Amodio, M.; Bellantuono, G.; Magaletti, D.; et al. Photogrammetric Meshes and 3D Points Cloud Reconstruction: A Genetic Algorithm Optimization Procedure; Springer International Publishing: Cham, Switzerland, 2017; p. 76. ISBN 978-3-319-57710-4. [Google Scholar]
  17. Liang, H.; Li, W.; Lai, S.; Zhu, L.; Jiang, W.; Zhang, Q. The Integration of Terrestrial Laser Scanning and Terrestrial and Unmanned Aerial Vehicle Digital Photogrammetry for the Documentation of Chinese Classical Gardens—A Case Study of Huanxiu Shanzhuang, Suzhou, China. J. Cult. Herit. 2018, 33, 222–230. [Google Scholar] [CrossRef]
  18. Adamopoulos, E.; Tsilimantou, E.; Keramidas, V.; Apostolopoulou, M.; Karoglou, M.; Tapinaki, S.; Ioannidis, C.; Georgopoulos, A.; Moropoulou, A. Multi-Sensor Documentation of Metric and Qualitative Information of Historic Stone Structures. ISPRS Ann. Photogramm. Remote Sens. Spat. Inf. Sci. 2017, IV-2/W2, 1–8. [Google Scholar] [CrossRef]
  19. Yao, Y.; Wang, X.; Luo, L.; Wan, H.; Ren, H. An Overview of GIS-RS Applications for Archaeological and Cultural Heritage under the DBAR-Heritage Mission. Remote Sens. 2023, 15, 5766. [Google Scholar] [CrossRef]
  20. Altuntas, C.; Yildiz, F.; Scaioni, M. Laser Scanning and Data Integration for Three-Dimensional Digital Recording of Complex Historical Structures: The Case of Mevlana Museum. ISPRS Int. J. Geo-Inf. 2016, 5, 18. [Google Scholar] [CrossRef]
  21. Neglia, G.; Angrisano, M.; Mecca, I.; Fabbrocino, F. Cultural Heritage at Risk in World Conflicts: Digital Tools’ Contribution to Its Preservation. Heritage 2024, 7, 6343–6365. [Google Scholar] [CrossRef]
  22. De Stefano, R.; Repola, L.; Guerriero, L.; Iovane, D.; Morra, V.; Pagano, F.; Di Martire, D. Rockfall Threatening Cumae Archeological Site Fruition (Phlegraean Fields Park—Naples). Sustainability 2021, 13, 15. [Google Scholar] [CrossRef]
  23. Vergès-Belmin, V. ICOMOS-ISCS: Illustrated Glossary on Stone Deterioration Patterns, English-French version; ICOMOS: Paris, France, 2008. [Google Scholar]
  24. Repola, L. The City Walls on the Hattusa Gorge: From Digital Survey to the Signs of an Architecture. News Land Hittites Sci. J. Anatol. Res. 2020, 3/4, 181–200. [Google Scholar]
  25. Bartalesi, V.; Coro, G.; Lenzi, E.; Pagano, P.; Pratelli, N. From Unstructured Texts to Semantic Story Maps. Int. J. Digit. Earth 2023, 16, 234–250. [Google Scholar] [CrossRef]
  26. Tusam, M.; Somantri, L.; Setiawan, I.; Sugito, N.T. Arcgis Storymaps in Geography Learning: A Systematic Literature Review. Abjadia 2024, 9, 643–655. [Google Scholar] [CrossRef]
  27. Giordano, A.; Repola, L. The Double Dynamics of Knowledge: Reality and Virtual Reality in the Enhancement Project of Torre Maggiore of Villa Rufolo, Ravello. DISEGNARECON 2016, 9, 12-1–12-9. [Google Scholar]
  28. Pagano, F.; Del Villano, M. Terra: La Scultura Di Un Paesaggio, 1st ed.; Gangemi editore S.p.A. International: Roma, Italy, 2022; pp. 25–35. [Google Scholar]
  29. Repola, L. Cuma. Declinazioni del digitale. In DIALOGHI/DIALOGUES • Visioni e Visualità/Visions and Visuality; FrancoAngeli srl: Milano, Italy, 2022; pp. 1835–1852. [Google Scholar]
  30. Scandurra, S.; Repola, L.; Palomba, D.; Campi, M.; Di Luggo, A. Lo spazio figurato di un antro. In Cuma e i Campi Flegrei: Archeologia, Storia, Società, Territorio. Pre-Atti Dell’incontro Internazionale Di Studio (Napoli-Pozzuoli, 11–13 Maggio 2022), 1st ed.; Capaldi, C., Ed.; Flora; Naus Editoria: Napoli, Italy, 2022; pp. 541–550. [Google Scholar]
  31. Georgopoulos, A. Data Acquisition for the Geometric Documentation of Cultural Heritage. In Mixed Reality and Gamification for Cultural Heritage; Ioannides, M., Magnenat-Thalmann, N., Papagiannakis, G., Eds.; Springer International Publishing: Cham, Switzerland, 2017; pp. 29–73. ISBN 978-3-319-49607-8. [Google Scholar]
Figure 1. Location of the study area. (a) Geographical context. (b) Simplified geological map of Campi Flegrei caldera showing the distribution of pyroclastic deposits and caldera and crater rims [5]. (c) Map of the main fracture directions [7]. (d) Elevation map and location of the sites of interest covered by this study within the Archeological Park of Cumae.
Heritage 08 00199 g001
Figure 2. GIS platform.
Heritage 08 00199 g002
Figure 3. (a) Georadar surveys at the extrados of the oracle hall with a 2000 MHz antenna; (b) georadar surveys at the intrados of the oracle hall with a 900 MHz antenna; (c) initial data processing.
Heritage 08 00199 g003
Figure 4. Acquisition phases using the DJI Matrice 300 drone.
Heritage 08 00199 g004
Figure 5. Acquisition phases using the Riegl VZ400i TOF scanner of the Antro della Sibilla.
Heritage 08 00199 g005
Figure 6. Acquisition phases with the Z+F Imager 5016A laser scanner.
Heritage 08 00199 g006
Figure 7. Acquisition phases with the ZF Imager 5016A laser scanner in dynamic mode.
Heritage 08 00199 g007
Figure 8. Photogrammetric acquisition phases with a Sony ILCE-7M4 camera.
Heritage 08 00199 g008
Figure 9. Acquisition phases with an Artec EVA structured light scan.
Heritage 08 00199 g009
Figure 10. Photogrammetry models.
Heritage 08 00199 g010
Figure 11. Orthophotos of longitudinal sections of the Antro della Sibilla.
Heritage 08 00199 g011
Figure 12. Point cloud portion of the oracular chamber.
Heritage 08 00199 g012
Figure 13. Point cloud model from phase difference laser scanning as seen in Z+F LaserControl Office Premium software.
Heritage 08 00199 g013
Figure 14. Point cloud model of a portion of the Antro, with its floor plan above the oracular hall from phase difference laser scanning with a cross-section.
Heritage 08 00199 g014
Figure 15. Dimensioned cross-section of the oracular chamber.
Heritage 08 00199 g015
Figure 16. Mesh model of the moon calendars.
Heritage 08 00199 g016
Figure 17. Plan and sections of the Antro extracted from the numerical model.
Heritage 08 00199 g017
Figure 18. Diagram of the architecture of the entire acquisition system developed for this research.
Heritage 08 00199 g018
Figure 19. Visualization of a 3D model in a GIS environment.
Heritage 08 00199 g019
Figure 20. Atlas of masonries.
Heritage 08 00199 g020
Figure 21. Previous interventions atlas.
Heritage 08 00199 g021
Figure 22. Previous interventions analysis.
Heritage 08 00199 g022
Figure 23. Degradation atlas.
Heritage 08 00199 g023
Figure 24. Interventions.
Heritage 08 00199 g024
Figure 25. Degradation analysis.
Heritage 08 00199 g025
Figure 26. Proxima Terra website interface.
Heritage 08 00199 g026
Figure 27. Videomapping screened during the temporary exhibition Terra at Palazzo de Fraja.
Heritage 08 00199 g027
Disclaimer/Publisher’s Note: The statements, opinions and data contained in all publications are solely those of the individual author(s) and contributor(s) and not of MDPI and/or the editor(s). MDPI and/or the editor(s) disclaim responsibility for any injury to people or property resulting from any ideas, methods, instructions or products referred to in the content.

