Article

Contextual Sensitivity Analysis for Urban Industrial Heritage Quarter Regeneration: Shanghai as a Pilot Case Study

Department of Architecture and Built Environment, University of Nottingham, Nottingham NG7 2RD, UK
*
Author to whom correspondence should be addressed.
Heritage 2025, 8(6), 190; https://doi.org/10.3390/heritage8060190
Submission received: 31 March 2025 / Revised: 22 May 2025 / Accepted: 22 May 2025 / Published: 27 May 2025

Abstract

Looking into the development of modern cities, industrial heritage quarters within the urban context are important spatial resources for urban development. With the increasing trend toward incorporating quantitative research in urban studies in recent years, this study aims to develop mixed method research named Contextual Sensitivity Analysis (CSA) to study how the urban context of industrial heritage quarters impacts the variation in heritage values after regeneration. The application of CSA proceeds as follows: first, value variations following urban regeneration are established as the analysis targets; then, the impact of adaptive reuse strategies on the context is quantified as analysis indicators. A mathematical model is employed to explore how these indicators influence changes in values. This study takes Shanghai as a pilot case study and selected 14 samples that accord with the characteristics of urban industrial heritage quarters (UIHQ) for data collection and analysis. The findings of the analysis will be displayed as regression curves, demonstrating that the degree of correlation and the impact trend between specific context indicators and heritage values vary significantly. By identifying and comparatively analysing indicators with stronger correlations, the study reveals which contextual factors are more effective and efficient in influencing particular heritage values under certain conditions. These results confirm the feasibility and usefulness of CSA as a method for uncovering the relationship between surface-level outcomes and underlying contextual causes in urban industrial heritage quarters. In conclusion, this study is expected to provide a reference when considering how the resource input should sensitively focus on different indicators to achieve optimal performance in adjusting the value of heritage sites. The potential of this study also lies in the fact that, if the CSA method proves effective, the value targets and contextual indicators can be further expanded and applied in broader future research.

1. Introduction

Urban industrial sites differ from other types of industrial heritage due to their close relationship with the city’s social, cultural, and economic history. Preserving and interpreting this heritage is essential for educating future generations, celebrating human achievement, and promoting sustainable development through adaptive reuse [1]. As such, their subsequent regeneration can have a significant impact on the surrounding urban fabric and the communities.
Industrial sites and landscapes within the urban environment are high-potential heritage resources ‘to be reused, regenerating communities, offering real richness and opportunity, reinforcing cultural identity and creating new commercial prospects’ [2] (p. 14). ‘Urban’ usually refers to characteristics and activities that are related to either cities or towns [3]. Generally, a city holds greater economic, cultural, and political influence than towns. Its built environment is also more complex and diverse in scale, function, and fabric [4]. Therefore, the industrial heritage regeneration issues in cities face a complex and multi-dimensional context and hold significant research potential.
In urban studies, a quarter typically refers to an area where particular groups live and work, or where specific activities, such as residential, social, and commercial activities, take place [5]. As a physical urban settlement, a quarter can be characterized by its unique administrative structure, distinct localized community, spatial and functional appearance, industrial and business forms, and boundaries [6,7]. It should integrate functionally within the city, maintaining social, economic, and environmental interactions with surrounding areas. Thus, a quarter emphasizes both tangible aspects of industrial heritage and intangible characteristics associated with past industrial activities.
This study will focus on industrial heritage quarters within the city context. An urban industrial heritage quarter1 in this study can be regarded as a physical area within a city characterized by both tangible and intangible industrial heritage. This area can be marked by its historical or ongoing industrial activities and might be accompanied by industrial communities. Moreover, it should be functionally and physically integrated into a broader city area and have a certain degree of environmental, social, cultural, and economic interaction with the surrounding urban area.
Current studies about urban industrial heritage regeneration mainly focus on qualitative analyses focusing on the overall design of regeneration. However, missing quantitative studies of contextual factors’ impacts may lead certain limitations. First, although qualitative methods effectively capture narratives and urban experiences, they may lack the generalizability and objectivity through quantitative analysis. Second, without quantitative approaches, it is challenging to establish feasible benchmarks for diverse urban variables or conduct comparative studies across different contexts [8,9]. From this point of view, it would be valuable to conduct a more comprehensive and detailed quantitative analysis of urban industrial heritage regeneration, with a particular focus on its contextual connections with the city.
Contextually Sensitive Analysis (CSA) is mixed-method research developed to understand the relationship between the urban context and a specific target. The qualitative aspect of CSA is grounded in the concept of contextual sensitivity in urban studies, and the quantitative analysis process is adapted from the context-sensitive analysis method.
Urban context typically refers to the broader setting of a designated area, including both physical and non-physical elements that comprise the specific entirety [10]. Physical details of ‘contexts can be topography, vegetations, urban condition including building density, street, sidewalks, and the relations of each other, types and arrangement of materials, buildings distances, regional geography condition, urban traffic density, population, and so on’ [11] (p. 1). Except for physical surroundings, the urban context also includes ‘the community vision for the area, and preferred future character, form and function’ [12] (p. 13). When studying the details in an urban context, the scope is based on macro elements that have a relatively long-term and extensive impact on the site and its surrounding environment [13], excluding individual preferences, accidental events, and temporary phenomena. Moreover, the tangible context in different projects should be identified in a way that corresponds to the actual design background and prospect. Looking into the details of an urban project, ‘different contexts of history, geography, social, political, economic, and environmental dimensions can matter, as well as seeing through the underlying philosophies, in order to carefully and critically contribute to the broader contextual concept of sustainable development’ [14] (p. 169). Being sensitive to context illustrates responsiveness to on-site and off-site contexts, and it considers the relationship between humanity and the earth, including community improvement, quality of life, efficiency, fairness, and placemaking [15].
Contextual sensitivity in this study can be understood as the attribute of the process of an urban development or regeneration project that describes the extent to which the project respects existing urban contexts and addresses contextual issues. Contextually sensitive urban regeneration, the process of urban regeneration is sensitive to its context, aims to encourage positive interaction with the existing urban environment and achieves a balance between new development and original characteristics. As being sensitive to context is a planning, design, and management behaviour that serves the project’s target [7], what context the project is sensitive to and how the project addresses the issue of the context change accordingly to different purposes of regeneration. To understand the impact of these contexts on regeneration purposes, context-sensitive analysis is an effective method to quantify this relationship. Context-sensitive analysis works by setting the analysis target layer and the indicator layer, collecting data for the targets and indicators, and then using suitable mathematical tools to analyse the relationship between these two layers through visualized diagrams [16]. Therefore, CSA is a generalizable method of urban study, and its analytical outcome depends on the selection of the two layers.
To apply CSA on UIHQs, this study sets the values of industrial heritage as the analysis target layer, focusing on the value variation in the quarter after urban regeneration. The urban context is a broad and complex system that evolves throughout the regeneration process. To ensure a manageable selection of indicators suited to the length and depth of this paper, this study focuses specifically on contextual changes associated with the adaptive reuse strategy, which are then quantified as the indicator layer. Following the identification of the two layers, this study will conduct a pilot case study to test how this analysis method works and what information it can reveal in practice. Although the framework for values and indicators is developed based on a generalised understanding of urban industrial heritage quarters (UIHQs), the data collection within the pilot study is conducted with reference to the specific urban context of Shanghai and the particular condition of the selected samples.
Shanghai, as the case city, is one of China’s earliest cities to undergo industrialisation, leaving a great number and wide variety of industrial heritage sites. It is also the pioneer in preserving and regenerating industrial heritage during the process of urban development, which has a significant impact on Chinese industrial heritage protection and adaptive reuse. Among all the designated industrial heritage in Shanghai, this study keeps all regenerated heritage sites that accord with the definition and characteristics of UIHQs as sample quarters for data collection. Finally, the analysis outcome is calculated based on data from 14 qualified sample quarters, displayed as impact curves of context indicators on heritage values.
The theoretical framework of this study explained in the following Figure 1.

2. Urban Industrial Heritage Quarter (UIHQ)

This section introduces the definition and value system of industrial heritage, followed by an overview of urban industrial heritage quarters and their adaptive reuse. The literature review informs the identification of the target and indicator layer.

2.1. Definition of Industrial Heritage

In the 18th century, the Industrial Revolution in England marked the rise in industrial civilization which centred on industry, markets, and common knowledge [17]. Industrial civilization has greatly impelled the traditional industrial culture, which was mainly established based on agriculture and handicrafts, to develop into the machine-based industrial culture of the current world [18,19]. Industrial culture is complex and multi-dimensional with both tangible and intangible aspects. Tangible industrial culture includes industrial landscapes, architectures, and structures that constitute the physical industrial remains within an area and are usually regarded as the object of preservation activities. Intangible industrial culture includes other abstract aspects such as expertise, attitudes, values, traditions, and interlinked social factors beyond the physical elements [17,18,19]. Industrial heritage can be regarded as the product of industrial civilization, as well as the physical carrier of industrial culture.
In 2003, TICCIH defined industrial heritage in the Nizhny Tagil Charter as the ‘remains of industrial culture which are of historical, technological, social, architectural or scientific value’ [2] (p. 2). It is the first official definition of industrial heritage and the international instruction for the study, documentation, conservation, and interpretation of industrial heritage. Industrial remains include a wide range of different physical forms, known as ‘buildings and machinery, workshops, mills and factories, mines and sites for processing and refining, warehouses and stores, places where energy is generated, transmitted and used, transport and all its infrastructure, as well as places used for social activities related to industry such as housing, religious worship or education’ [2] (p. 2). In this scope, industrial heritage can be seen as any solid piece of evidence that can illustrate the past or ongoing industrial process of production [20]. Besides tangible relics, industrial heritage also contains intangible evidence, acting as a link to the urban cultural, historical, social, economic, technical, and aesthetic context. Those aspects involve industrial communities, activities, production processes, craftsmanship, place identification, labour, lifestyle, etc. [21].
Industrial archaeology was proposed in 1955 as the early theoretical study of industrial relics’ history and preservation [2]. It has set a time range for industrial heritage study, which focuses on the period after the First Industrial Revolution [22]. This can be understood as the research scope of industrial heritage from when the industrial civilization started. In actual research and practice activities, different research might set its own scope depending on the focus and condition. As this paper will take Shanghai as the case city, the study will be based on the Chinese context. Therefore, the scope of industrial heritage will follow the Chinese delimitation from the First Opium War (1839–1842), which was the starting point of Chinese industrialization, including some traditional industries whose production process was impelled to develop by Industrial Revolution outcomes [23,24].

2.2. Value of Industrial Heritage

In heritage studies, ‘value’ refers to how significant, meaningful, or useful a heritage can be measured in various perspectives, such as historical, cultural, social, aesthetic, economic, and environmental dimensions [25]. According to The Nizhny Tagil Charter for the Industrial Heritage by TICCIH in 2003, the value of industrial heritage is mainly about the historical value, social value, technological and scientific value, and aesthetic value [2].
Early versions of the Chinese industrial heritage value system follow the TICCIH value system, while also taking conservation status and management conditions into consideration [26]. This value system does not emphasize cultural value, however, its impact cannot be ignored because industrial heritage, the remains of industrial culture, is categorized as a special type of cultural heritage [2]. In this study, cultural value will be discussed together with social value as the socio-cultural value.
In recent years, different cities in China have tried to value their industrial remains according to specific and regional perspectives. These evaluation attempts stimulate the development of the earlier value system into broader disciplines. Apart from the original value study by TICCIH, the evaluation system proposed by Beijing, Tianjin, Nanjing, and Chongqing mentioned economic value to highlight the benefits during the transformation and utilization process, or listed the potential and feasibility of heritage utilization as a separate value category [27,28,29,30]. Moreover, the natural environment is also an important aspect to consider for industrial sites. Industrial production processes generally do not have a positive impact on the surrounding natural environment, often leading to pollution and resource depletion [31]. However, long abandoned industrial sites, if not seriously polluted, also have the potential to be re-occupied by eco- and biosystems that can provide greenery for the urban environment [32]. Recent research and practice in the protection and utilization of industrial heritage have recognized the need to address environmental pollution abatement, ecological restoration, green design, and landscape design as significant factors [32,33].
Based on the values proposed by TICCIH and the evaluation systems proposed by Chinese cities, this study summarizes the following key values, which will be used as the CSA target layer (Table 1).

2.3. Characteristics of Urban Industrial Heritage Quarters

The characteristics of an urban industrial heritage quarter are multi-dimensional, including industrial type, spatial layout, location, and current function and social relationship. For a UIHQ, the formation of these characteristics is shaped by its industrial history, while also influencing its potential for physical and functional regeneration [42].
Industrial types in an urban industrial heritage quarter can consist of one or several cooperative categories. Key types of industrial heritage in urban contexts include manufacturing, storage, infrastructure, and transportation industries. Manufacturing sites, such as textile, food processing, and machinery factories, reflect production-driven architectural and spatial designs. Storage heritage includes warehouses, silos, and cranes, typically located near transport routes. Urban infrastructure heritage comprises facilities for power, water, communication, and waste, integrated into larger city systems. Transportation heritage, including railways, docks, and highways, forms expansive industrial landscapes that significantly shape surrounding areas. Studying the industrial type of an urban industrial heritage quarter is important because it provides evidence of how the specific industrial activities operated and shaped the physical environment of the area.
The spatial character illustrates how industrial heritage interacts with the existing urban fabric, significantly influencing site identity and regeneration potential. The defining feature of an industrial heritage quarter is its industrial heritage texture, consisting of various industrial remains such as industrial landscapes, architecture, structures, machinery, production equipment, and infrastructure. Generally, UIHQ can be categorized into three types: a clustered urban industrial heritage quarter, characterized by concentrated industrial heritage forming a distinct spatial identity; a decentralized urban industrial heritage quarter, where industrial heritage is dispersed and interwoven within the broader urban context; and an industrial urban complex, defined by large-scale industrial architecture that independently forms an urban settlement with multifunctional utilization [43,44].
Location character can be described by the relationship between the urban industrial heritage quarter and other urban locations which is largely impacted by transportation convenience, resource accessibility, and required production space [45]. Historically, many industrial sites were located near waterways and railways for transportation and resource access. The Industrial Revolution boosted the development of extensive waterway systems, leaving behind diverse industrial heritage such as docks, quays, and wharves. However, with the rise in railway and automobile transportation, industries gradually became less dependent on proximity to waterways. Consequently, larger, heavily polluting industries relocated to suburban areas, while smaller, lighter industries evolved within urban areas during modern urbanization. The location character of an urban industrial heritage quarter reflects the site’s historical transformation and indicates its preservation and development potential within the broader city plan.
Current function refers to the reuse of historical buildings and mixed functional development. One special kind is the living industrial heritage with the original production activities continuing. These sites preserve historical significance through physical remains, production processes, and industrial culture [46]. Regeneration projects of industrial heritage quarters usually adopt a mixed-use development strategy that calls for the efficient integration of residential, commercial, cultural, and recreational spaces. Functional arrangements depend on architectural adaptability and regeneration goals [47]. Public spaces and green areas may also be considered, providing places for leisure and community activities. Evaluating these functional transformations highlights how industrial heritage gains new life in contemporary contexts, offering practical experience for future development and conservation [48].
From a social perspective, an urban industrial heritage quarter is strongly connected to the local historical context, with close interactions between heritage sites and their communities. During the development of the city, some industrial remains might have been reused and transformed in order to adapt to contemporary urban requirements. However, traditional industrial activities still have an influence on the surrounding social environment. Historical industrial activities contribute to the local economy and labour conditions, affecting the form and development of relevant industrial communities [49].
In the research process, these characteristics can serve as criteria for typological analysis, enabling the examination of commonalities among quarters sharing the same feature, or the differences in how various features influence the quarters. The distribution of characteristics among the 14 samples used in this study will be categorized in Section 4.1. Unfortunately, the current sample size is limited, and the number of representative quarters for each characteristic is insufficient to support additional comparative analysis. Nevertheless, studying the characteristics of these samples still contributes to a more comprehensive understanding of the quarters’ context.

2.4. Adaptive Reuse of Urban Industrial Heritage Quarter

Adaptive reuse is a commonly adopted approach in urban regeneration, referring to the process of refurbishing and revitalizing historic architecture and urban spaces through structural restoration, reinforcement, and functional transformation [50]. For industrial sites, adaptive reuse introduces new and sustainable functions to the urban quarter while highlighting its industrial past and cultural significance.
The principles of adaptive reuse focus on balancing the original use with the adaptiveness of new functions. To preserve the value of heritage quarters, interventions should be minimal to avoid compromising the integrity and authenticity of the heritage context [51]. Moreover, the new design should be compatible with the original context, achieving the architectural and functional harmony within the historic fabric.
From a heritage perspective, adaptive reuse preserves and interprets heritage identification by maintaining a certain proportion of industrial remains. This includes refurbishing the architectural and structural features, as well as industrial landscapes. Old factories and warehouses, once defined by their rigid industrial layouts, can be reconfigured into mixed-use developments, cultural hubs, or residential spaces [46,52,53]. Structures such as silos, tanks, furnaces, etc., are more flexible in functional transformation according to the volume of the space [48,50]. However, reusing the physical elements is relatively challenging, considering the quality of the material and the safety of the structure. Therefore, the extent to which tangible heritage can survive and be adapted into new functions is based on the condition of the heritage. Industrial landscape including slope, yard, pond, etc., is an important part of the site, showing the circulation and workflow of industrial activities [52,54,55]. Besides spatial reuse, adaptive reuse also considers the conservation of machinery, tools, and equipment and interacts with them in design. These tangible elements reinforce the site’s authenticity while introducing new design elements to enhance functionality [56].
At the site level, adaptive reuse strategies influence green infrastructure and open space systems. This adaptive intervention should treat the quarter as a whole, integrating the preservation of heritage into the overall regeneration of the quarter [57]. Therefore, well-designed and properly distributed green and open spaces work as a link between heritage and other functions, increasing the holistic attraction of the project. When industrial heritage sites are located near waterfronts, which is a common location characteristic, adaptive reuse can activate these boundaries with paths, public space, seating areas, or water-based activities, reinviting the waterfront into city life [20].
Adaptive reuse impacts heritage contexts by physically transforming the tangible heritage and overall site configuration. Since the functions of a regenerated quarter may change depending on its occupants, this study focuses only on physical aspects that remain relatively stable after regeneration. These physical context variations, resulting from adaptive reuse, are quantified as context indicators for the CSA.

3. Methodology

This section first explains the process of Contextual Sensitivity Analysis works on urban industrial heritage quarter study, followed by an introduction to the data collection method for values and indicators.

3.1. Contextual Sensitivity Analysis (CSA)

Regeneration strategies make changes to the context factors to address context issues, and the integrated result of context change is the performance of regeneration. In order to study how sensitive the strategies should be to the context, the basic analysis relies on how the change in context leads to the final performance.
Currently, the relationship between context, project targets, and strategies for achieving contextual sensitivity is often derived from practical experience. While practice-based studies offer general guidance, they are limited by the qualitative nature of their approaches. First, the degree to which context influences project outcomes remains unclear, reducing the reliability and effectiveness of context-related strategies. Second, the relative impact of different contextual factors is not well understood, limiting the efficiency and precision of regeneration efforts. Therefore, it is important to engage quantitative methods in studying the effect and impact of contextually sensitive actions on regeneration targets. Mixed-method research is expected to provide a comprehensive understanding and digitalized presentation of the regeneration impacts on the heritage quarter and its surrounding urban environment. The qualitative study provides narrative and perception findings, while the quantitative study aggregated data derived from historical records and current conditions.
Contextual Sensitivity Analysis (CSA) refers to analysing how contextual changes impact the targets of an urban industrial heritage quarter during regeneration. The process begins with qualitative analysis to establish target criteria and context indicators. Quantitative analysis then follows to measure the strength of context–target connections, revealing the specific influence of context indicators on target variations.
Context-sensitive analysis is an approach in research that incorporates contextual factors into quantitative analysis to provide a deeper understanding of the phenomena being studied [58]. This methodology has been applied across various scientific fields, including environmental studies, social sciences, psychology, linguistics, and public health. In urban studies, it acknowledges that quantitative data operate within complex systems, where contextual factors can significantly influence outcomes and interpretations. The key advantages of this approach are its ability to enhance the accuracy of research findings and support decision-making. By considering contextual factors, it generates more relevant results that reflect real-world conditions and offers policymakers and practitioners context-specific suggestions for more effective and targeted interventions [59].
Context-sensitive quantitative methodology involves systematically integrating contextual variables into the data collection, analysis, and interpretation processes [60]. The progress of applying context-sensitive analysis is as follows:
  • Step 1: Define the research question and context indicators. Ensuring the research question leads to the analysis target of the study and emphasizing the requirements of indicator selection.
  • Step 2: Data collection and preparation. Develop an appropriate methodology for both the primary data and contextual variables. Then, structure the data into a suitable dataset for analysis.
  • Step 3: Data analysis. Selecting effective mathematical models such as correlation coefficients and optimization algorithms for analysing the relationship between targets, contextual variables, and their interactions. Interpret the results within the context, explaining how the relationship indicates and what the potential is of utilizing the result.
Contextual Sensitivity Analysis (CSA) is mixed-method research that is designed based on the contextual thinking of urban development and regeneration issues, as well as adopting the quantitative method of context-sensitive analysis to reveal the relationship between contexts and targets.

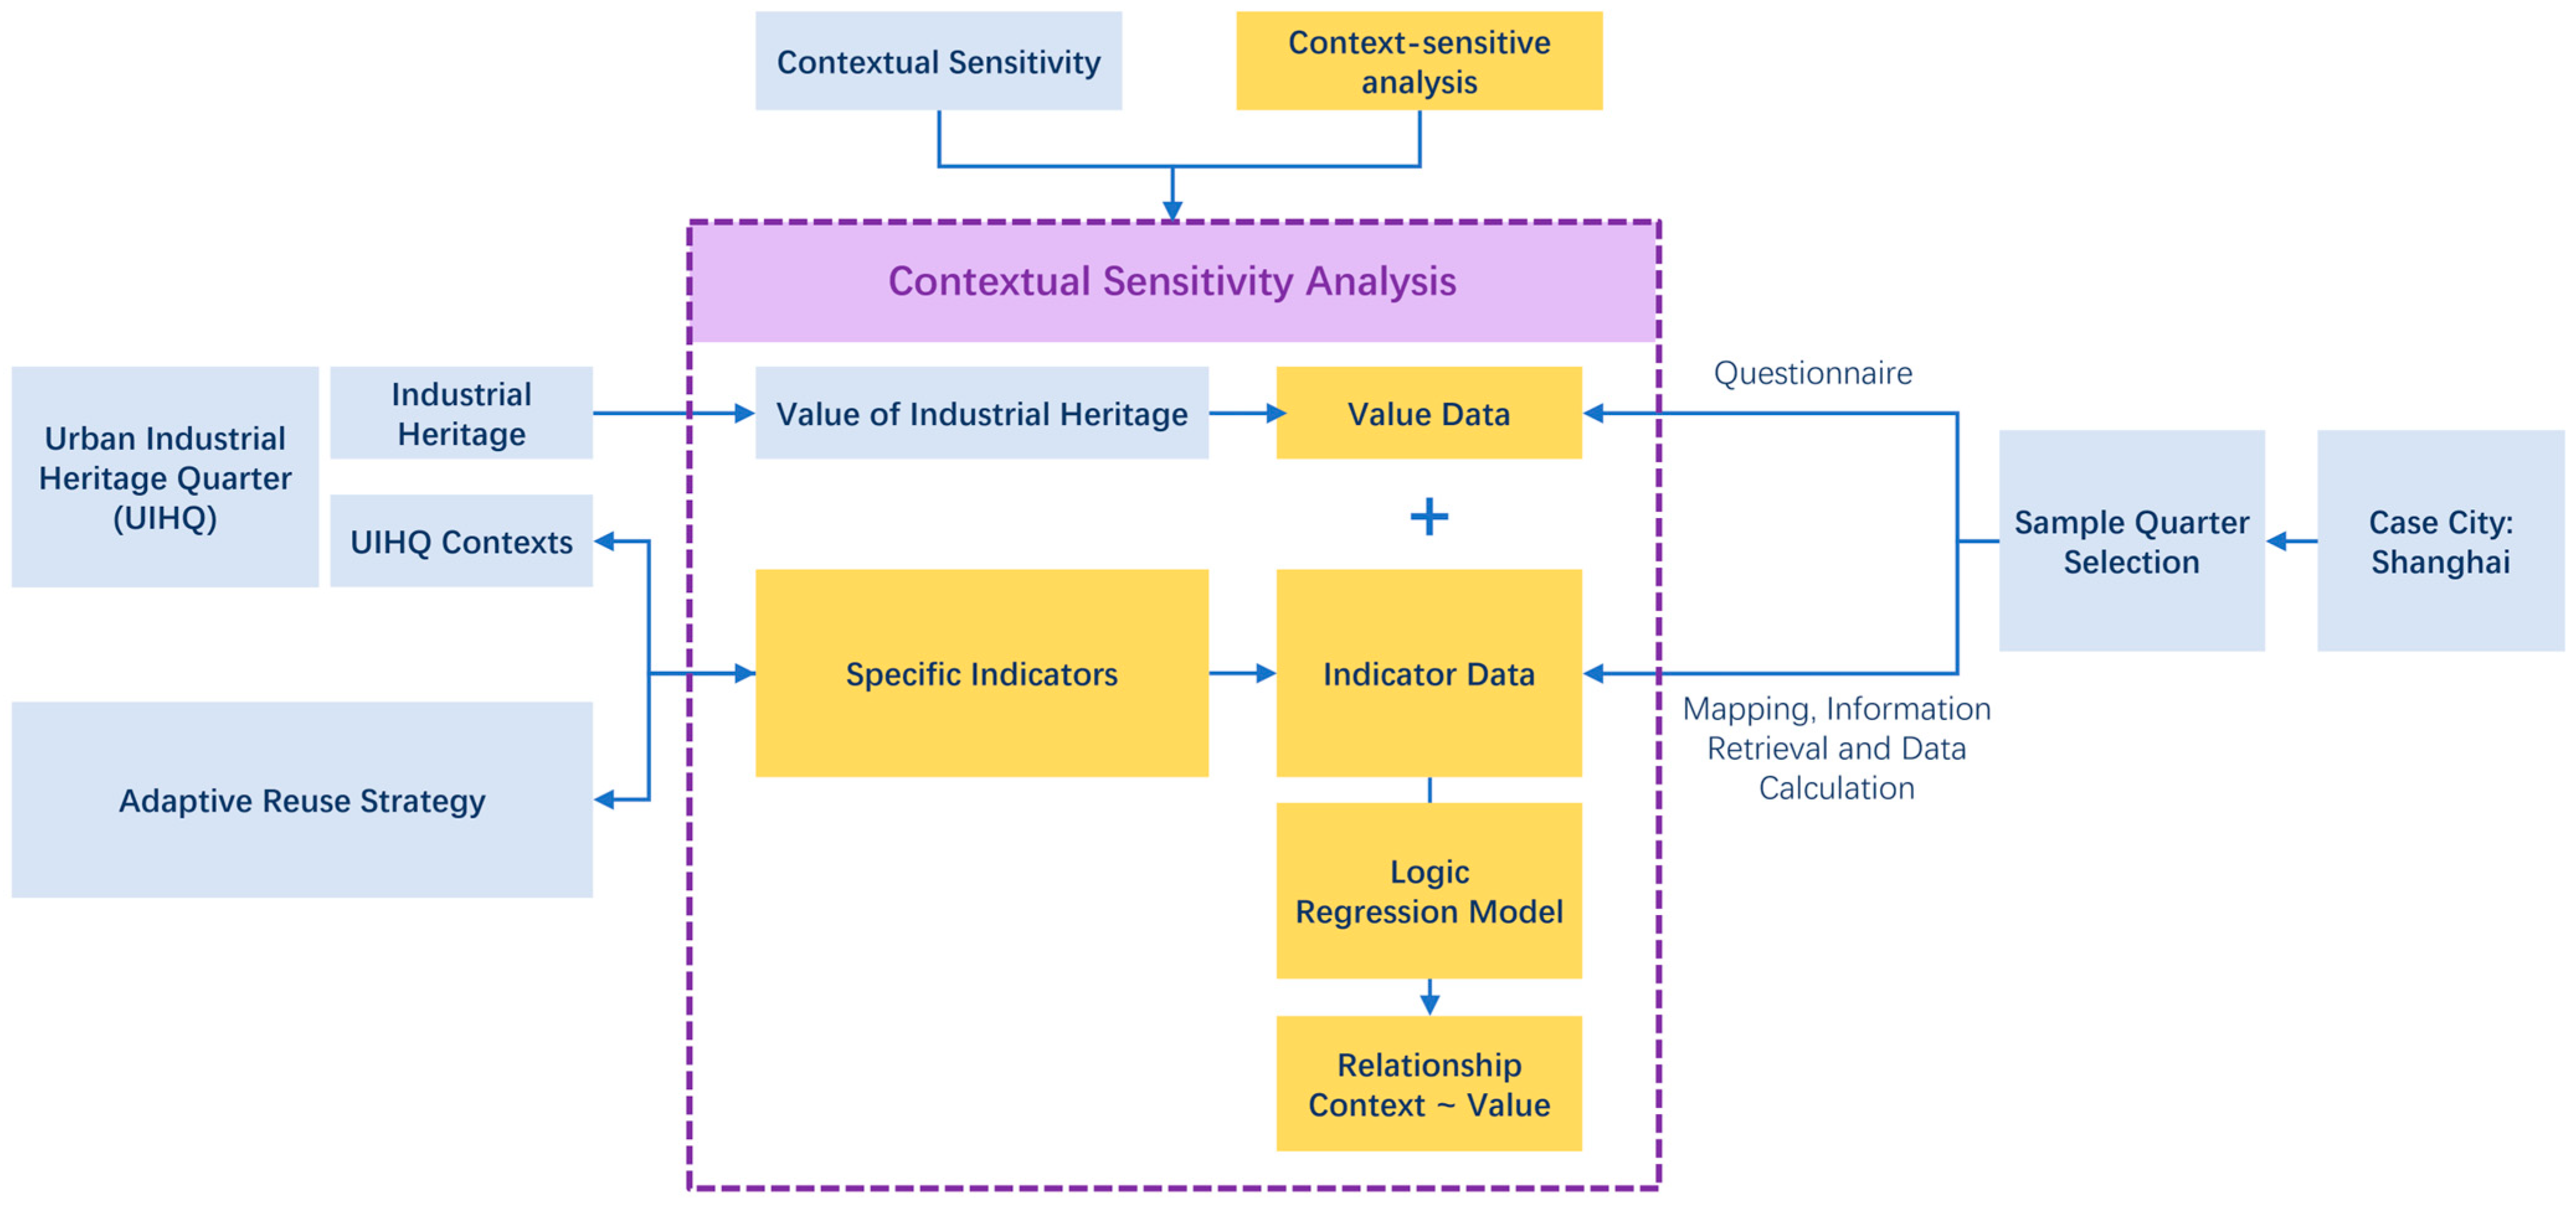
3.2. CSA for Urban Industrial Heritage Quarters

In this study, CSA focuses on the regeneration of urban industrial heritage quarters, aiming to understand how contextual changes during regeneration influence variations in industrial heritage value:
  • Step 1: Establishing the target layer for urban industrial heritage quarters. The target layer defines the aim of the CSA, indicating that the results should support achieving this aim through contextual variations. In this study, the target is the value variation in the UIHQ after regeneration. The value system summarized in Table 1 serves as the scoring framework.
  • Step 2: Designing the Contextual Sensitivity Analysis (CSA) in studying urban industrial heritage quarter regeneration. CSA is an analytical approach adapted from existing research and practice that addresses contextual and sustainable urban issues. The concept of contextual sensitivity discussed in this study serves as a practical principle, highlighting the importance of addressing contextual impacts during the regeneration process. The analytical logic involves establishing relationships between context details and heritage values through variable indicators and generating the impact trend based on actual samples. The results are about specific contexts and project types, offering a reference for planning similar projects.
  • Step 3: Identifying and quantifying context indicators for the urban industrial heritage quarter. As the urban environment is a complex system, context is typically vast and multifaceted. In urban studies, context indicators should be selected according to the research target and subject. For industrial heritage quarters, the indicator system forms the foundation of the assessment process, reflecting the uniqueness and specific considerations of this topic. To ensure feasibility and data accessibility, this analysis is narrowed to a small set of indicators that are physically altered through adaptive reuse strategies.
  • Step 4: Case city and sample selection for data collection. To produce meaningful results and formulate convincing perspectives on contextual impacts, careful selection of cases and samples is essential for ensuring the validity and reliability. Two key principles guide this selection: representativeness and comprehensiveness. Representativeness ensures that the chosen cases or samples accurately reflect broader characteristics or clearly illustrate the target phenomenon [61]. Comprehensiveness minimizes selection bias and enhances the validity of the results. This study uses Shanghai as a pilot case to test the methodology and selects qualified UIHQ samples from officially designated industrial heritage lists for data collection.
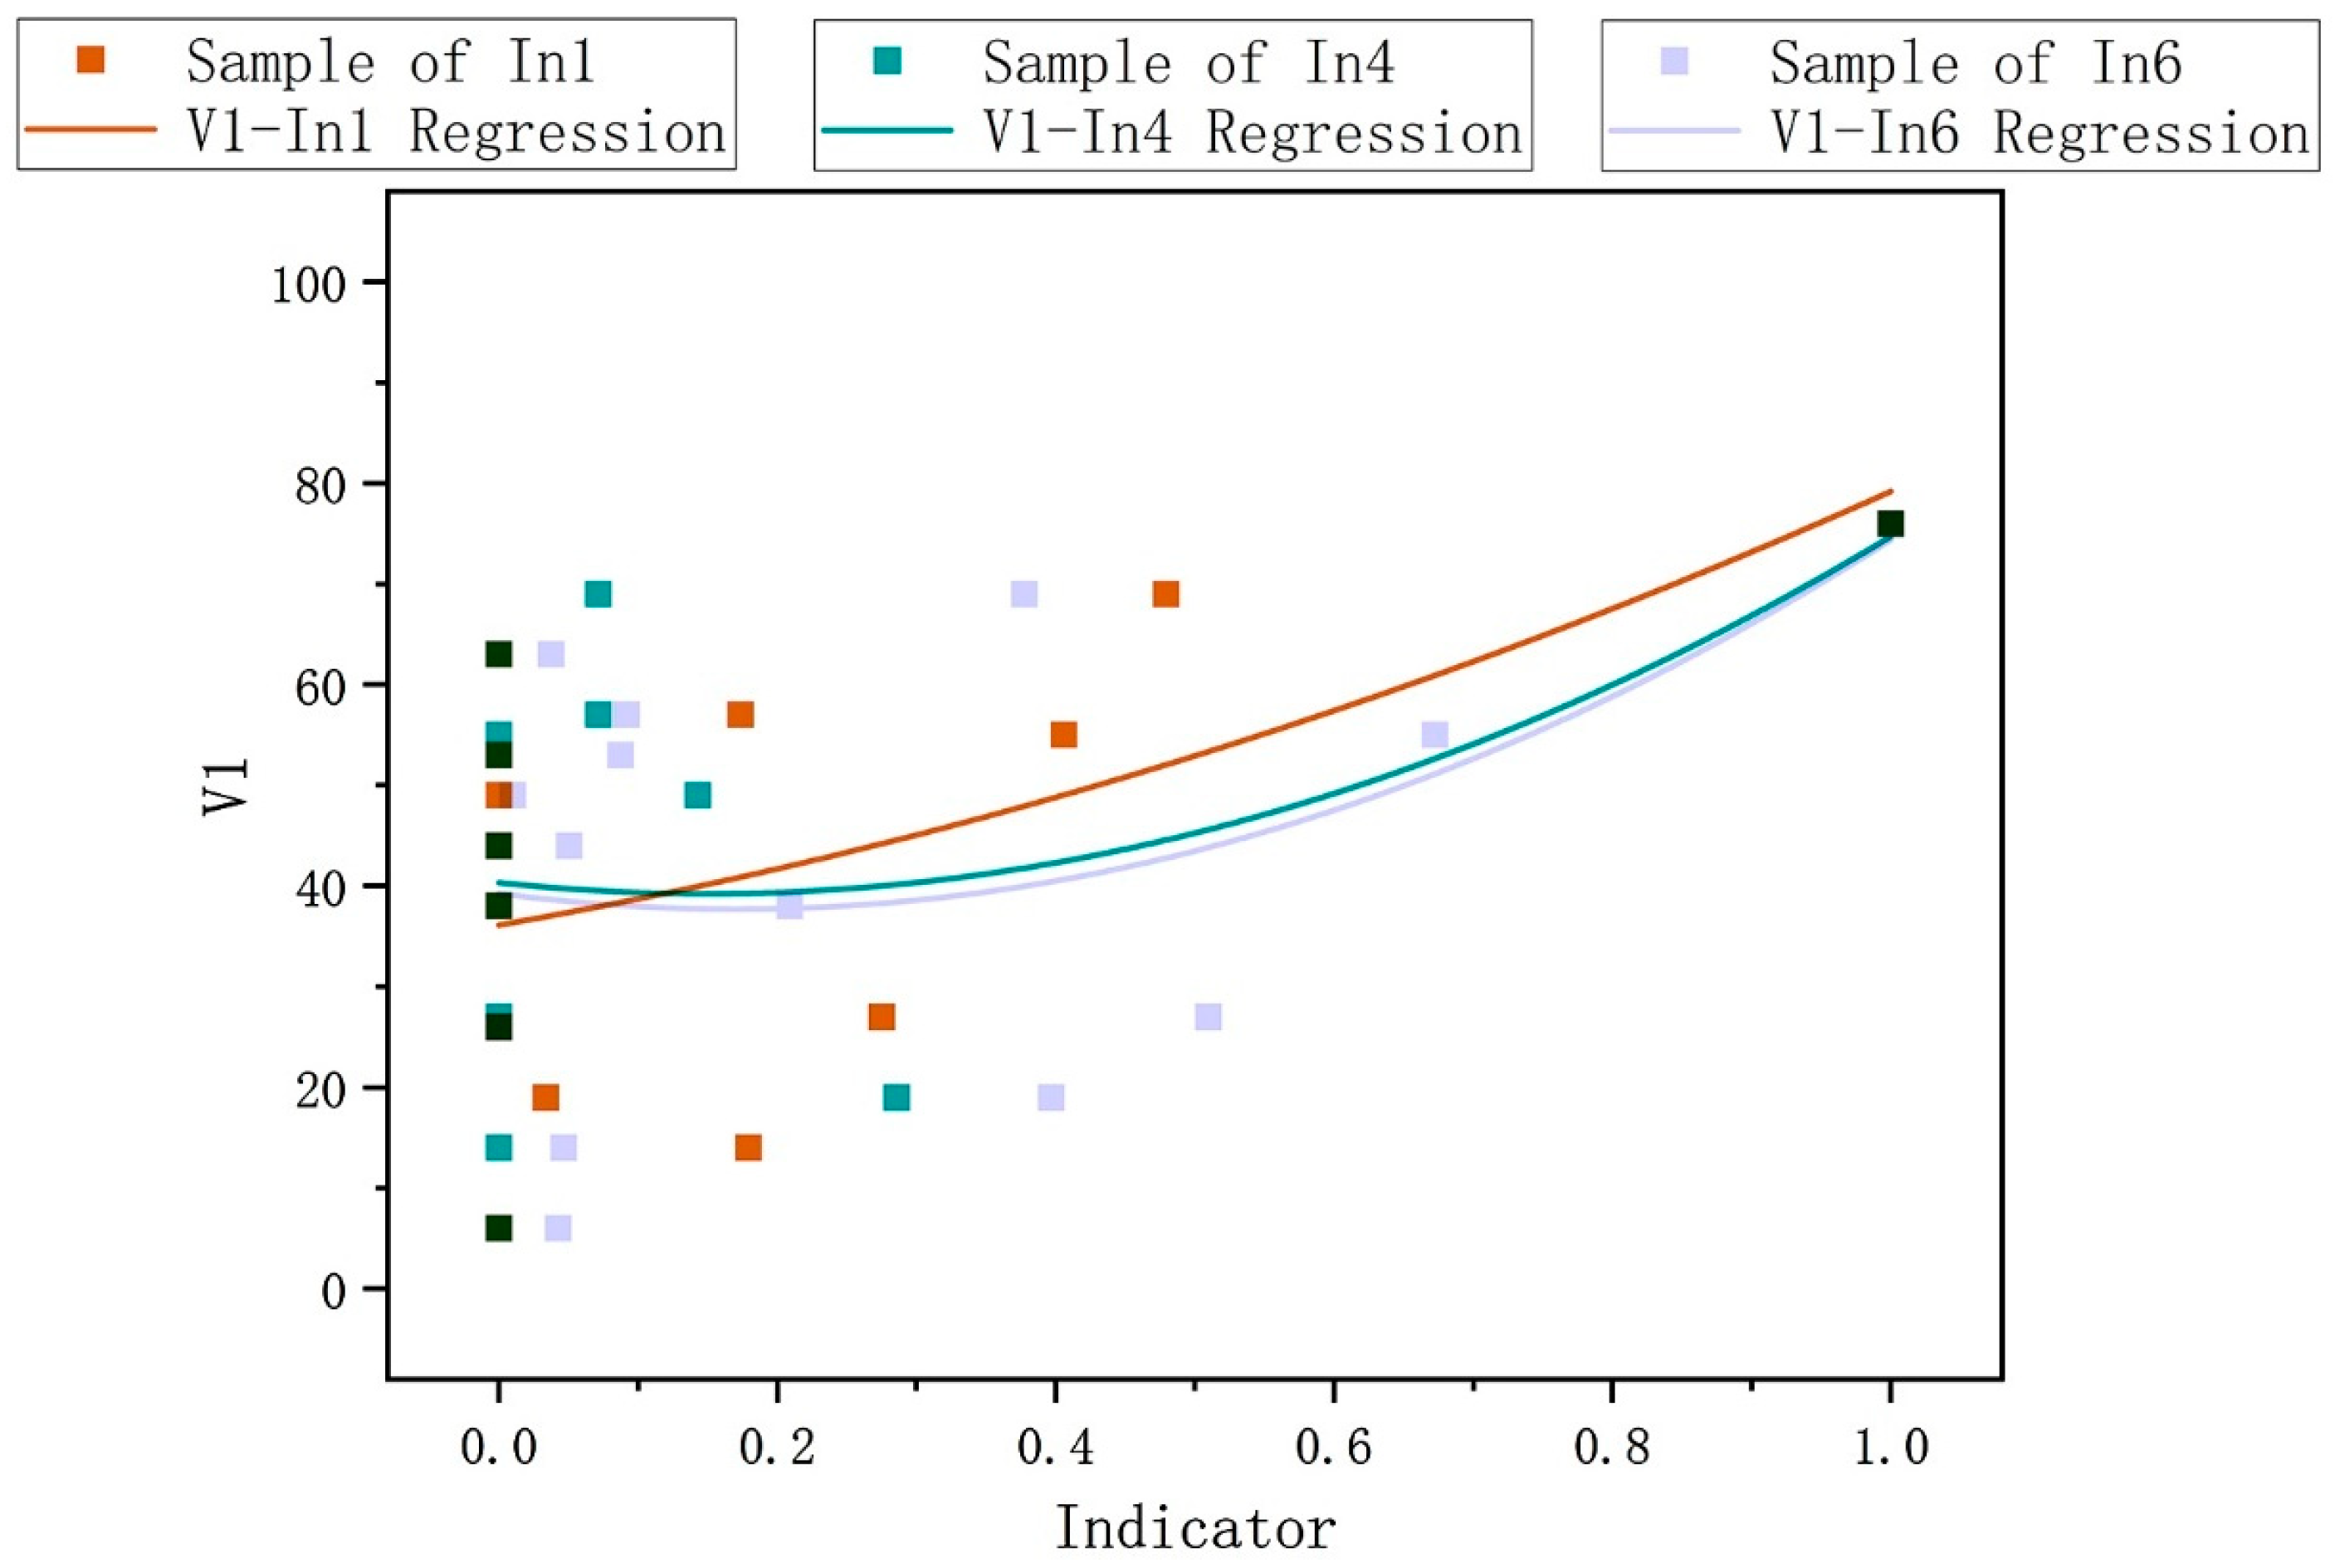
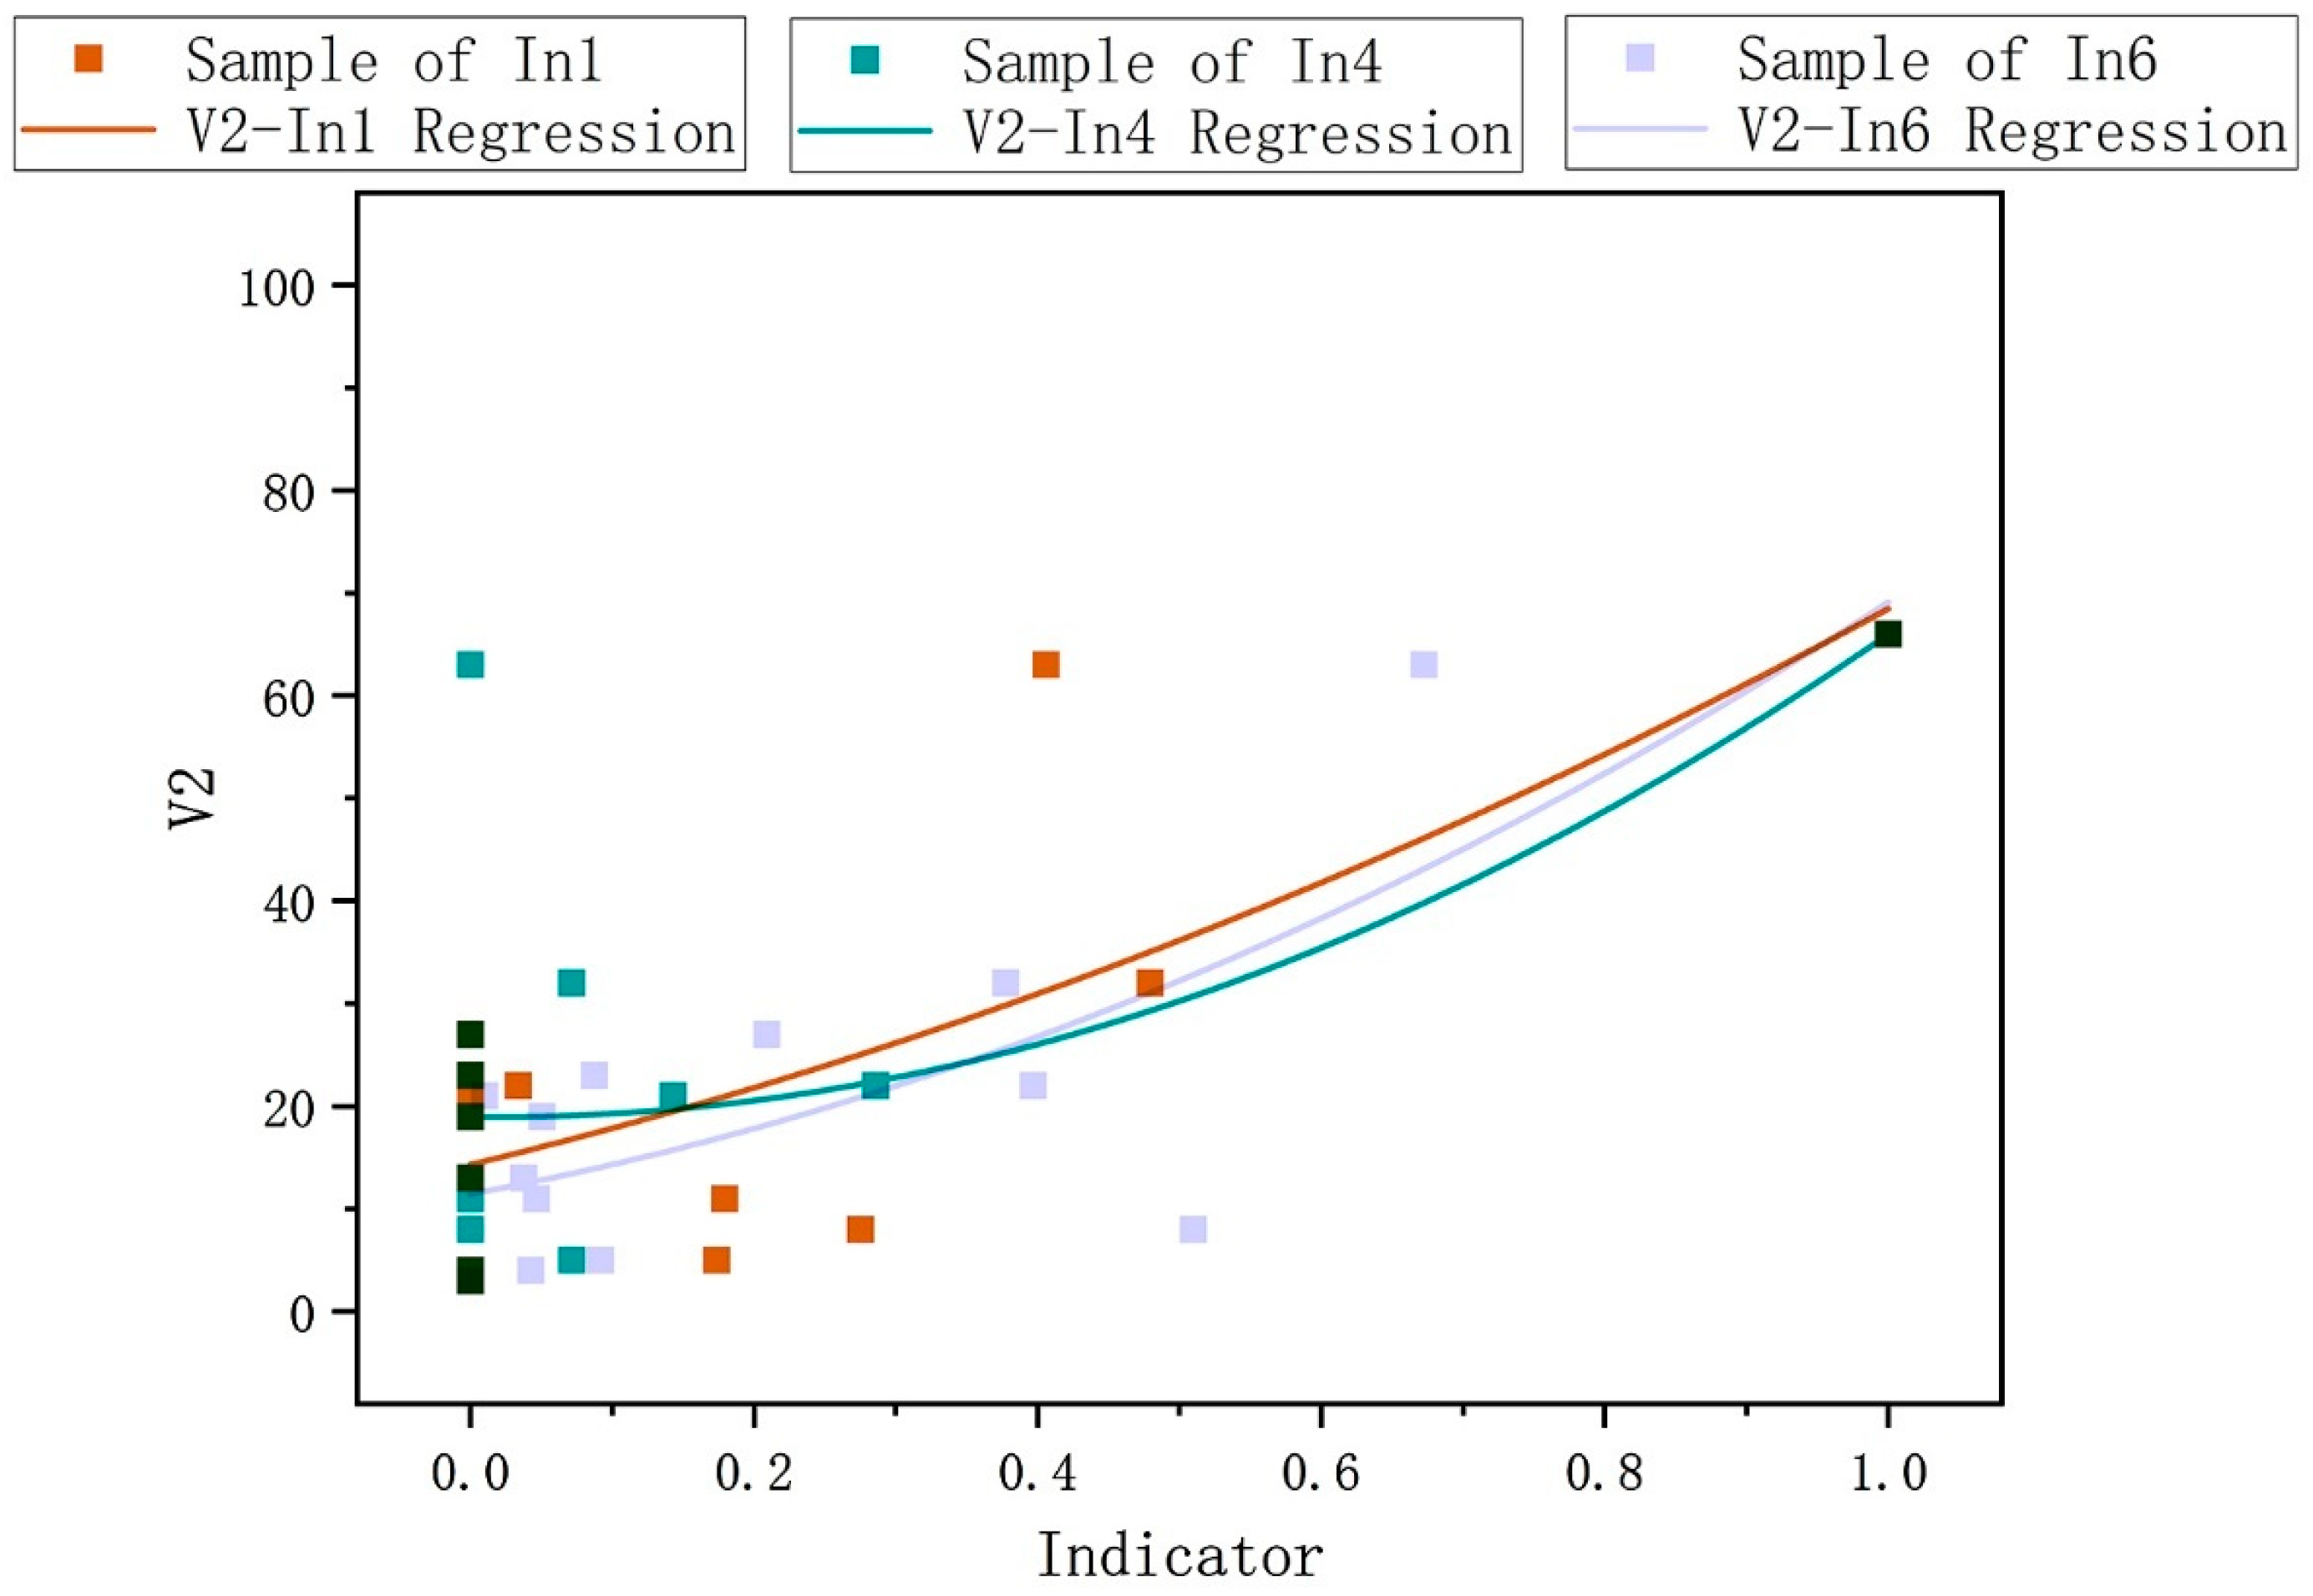
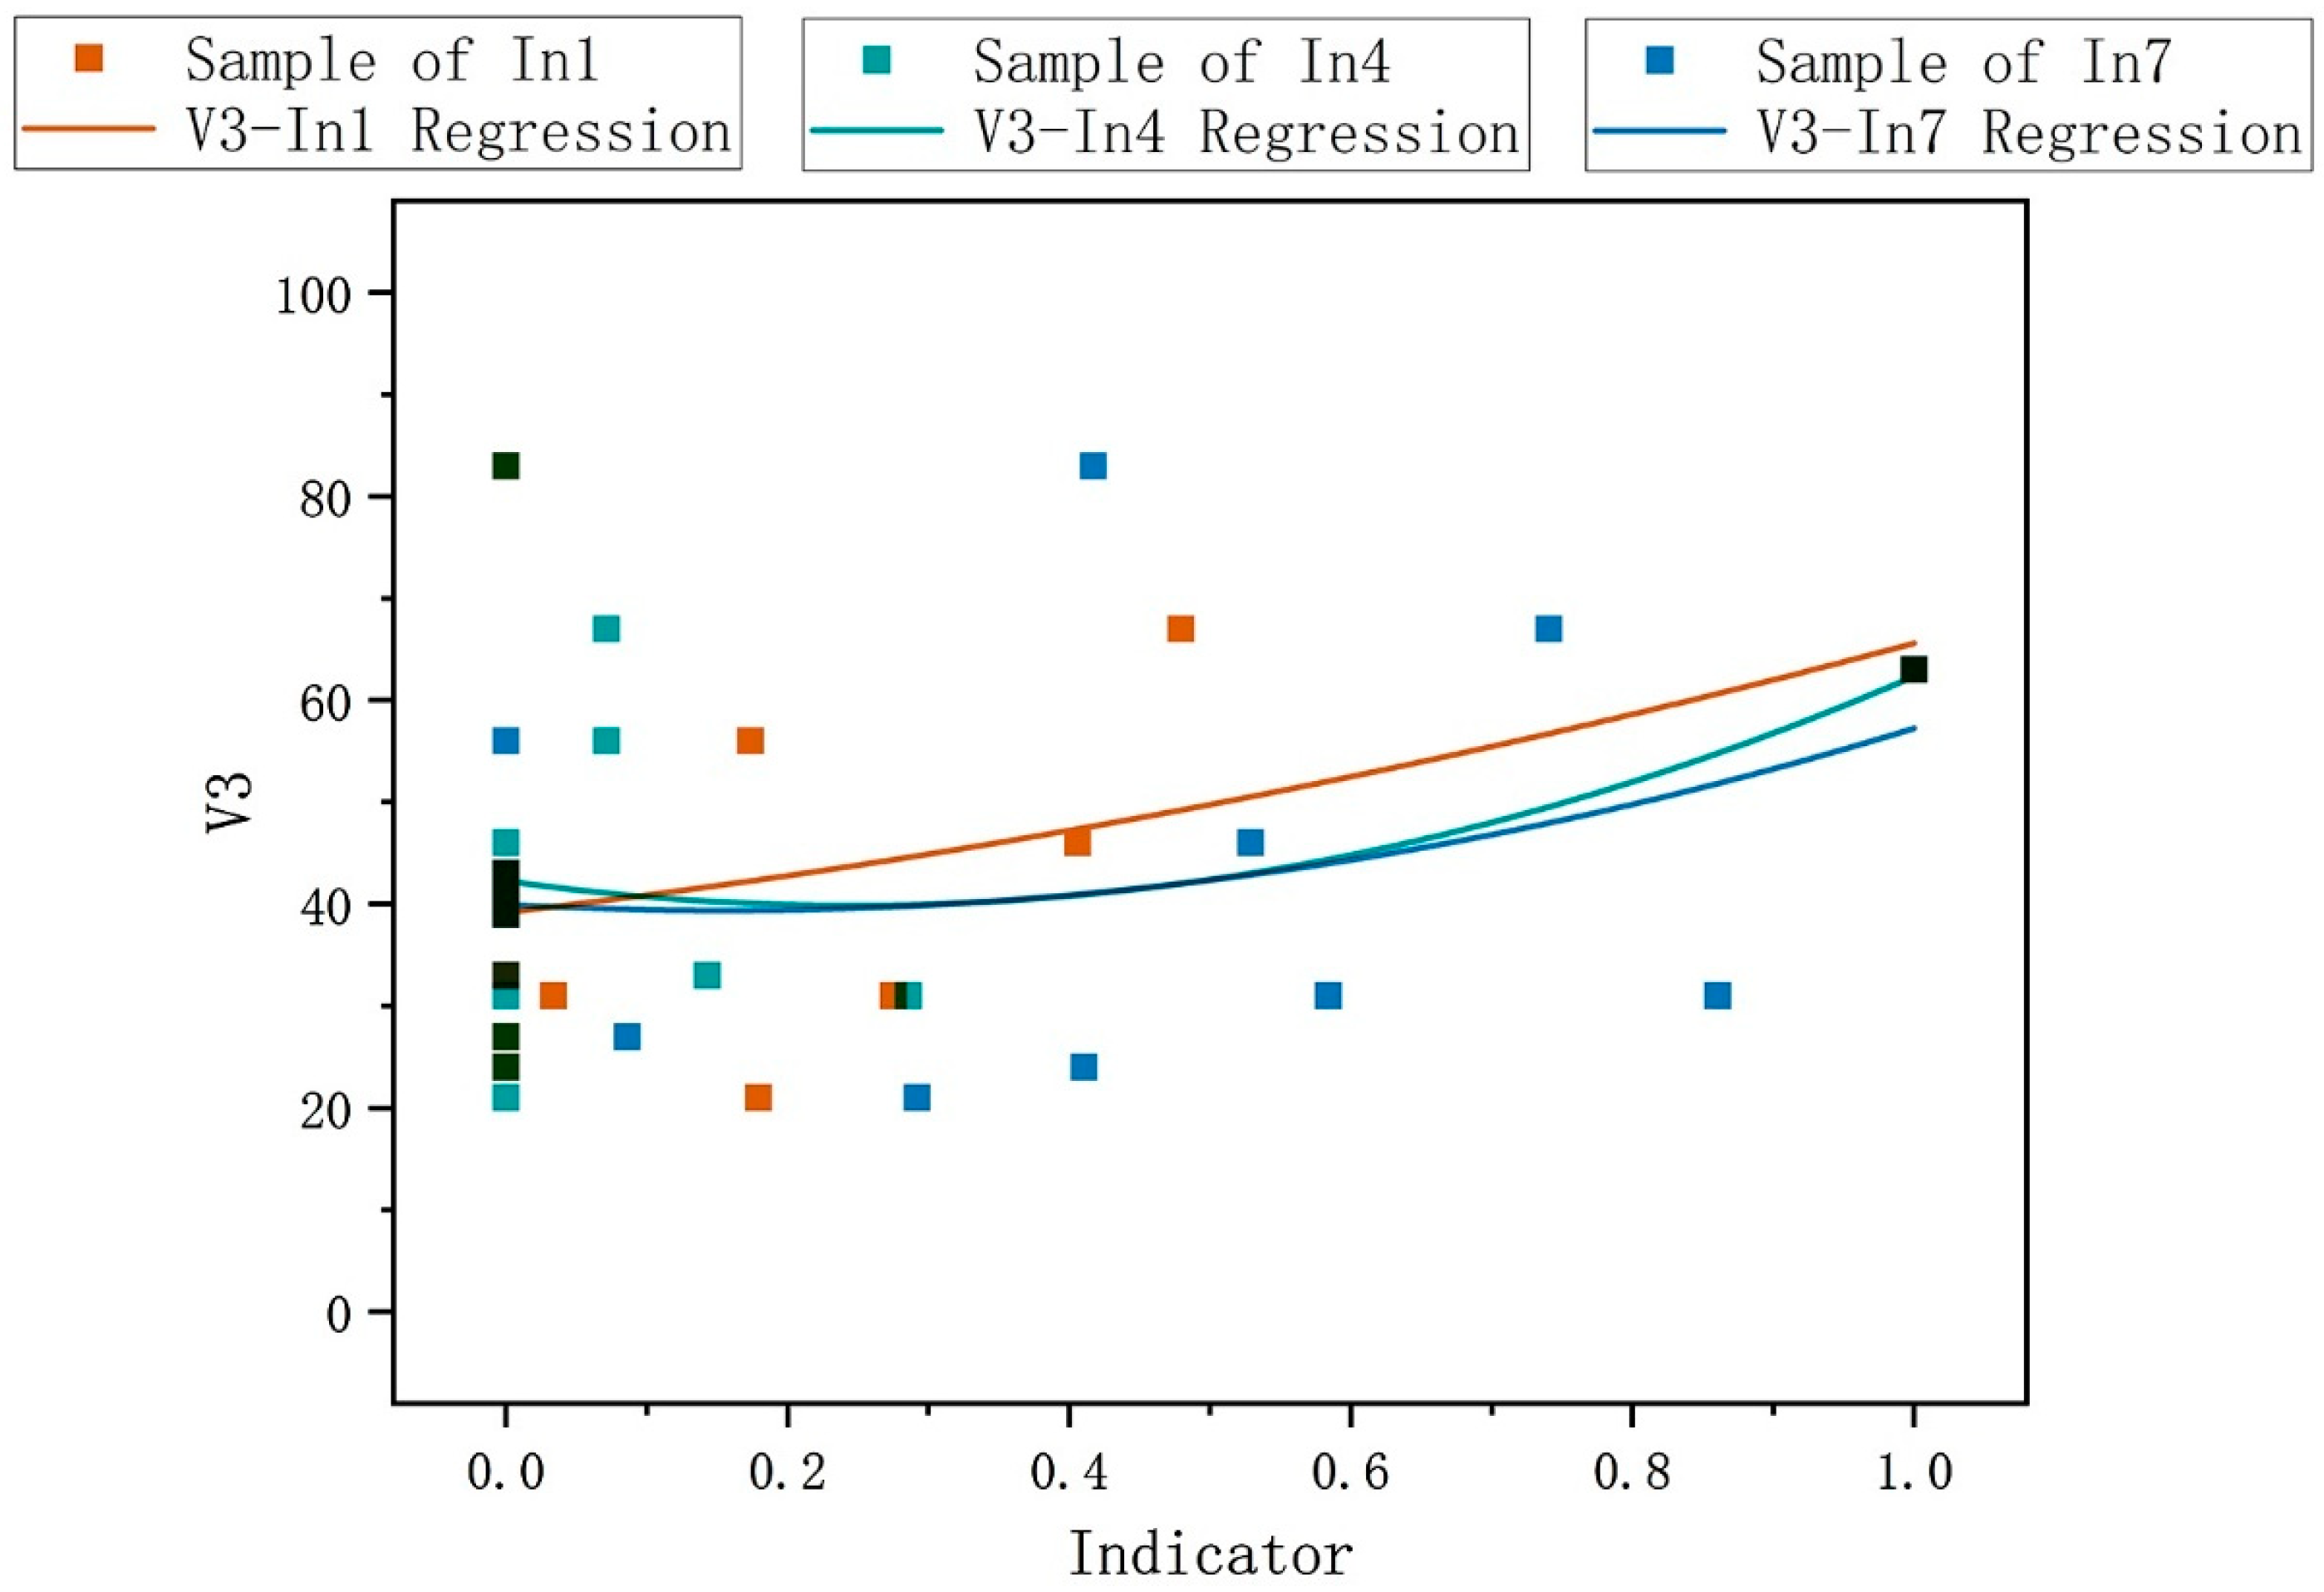
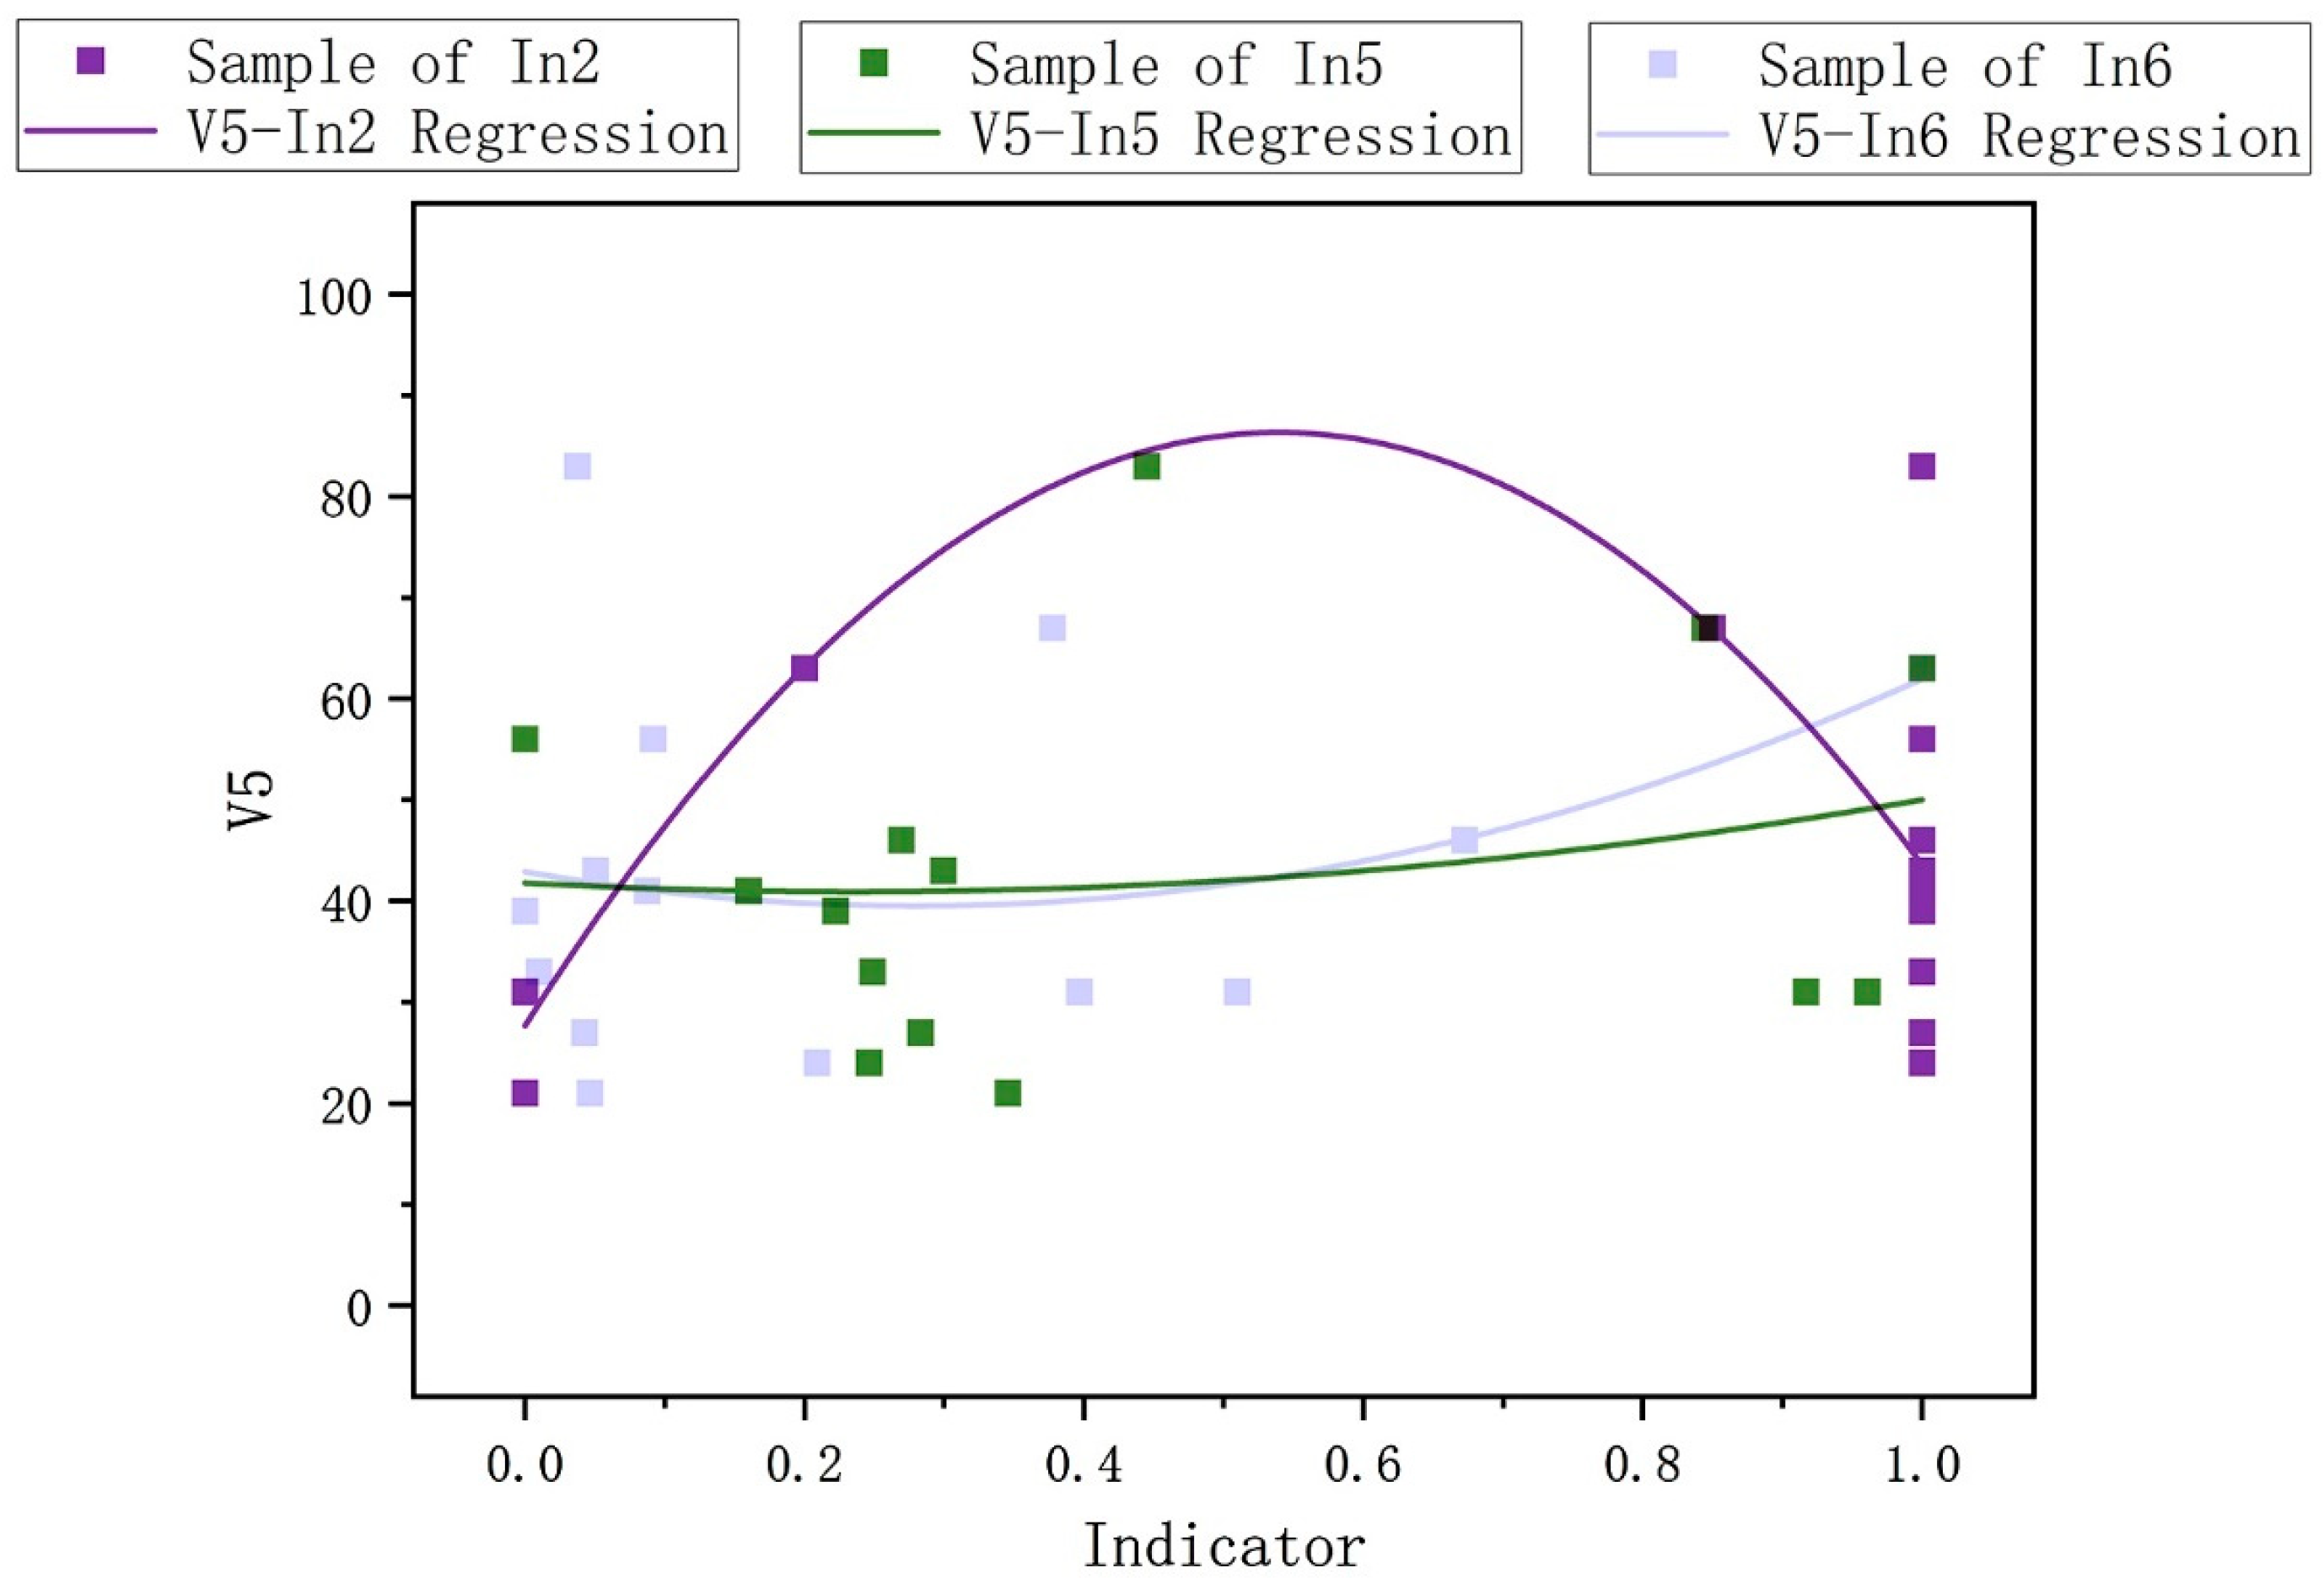
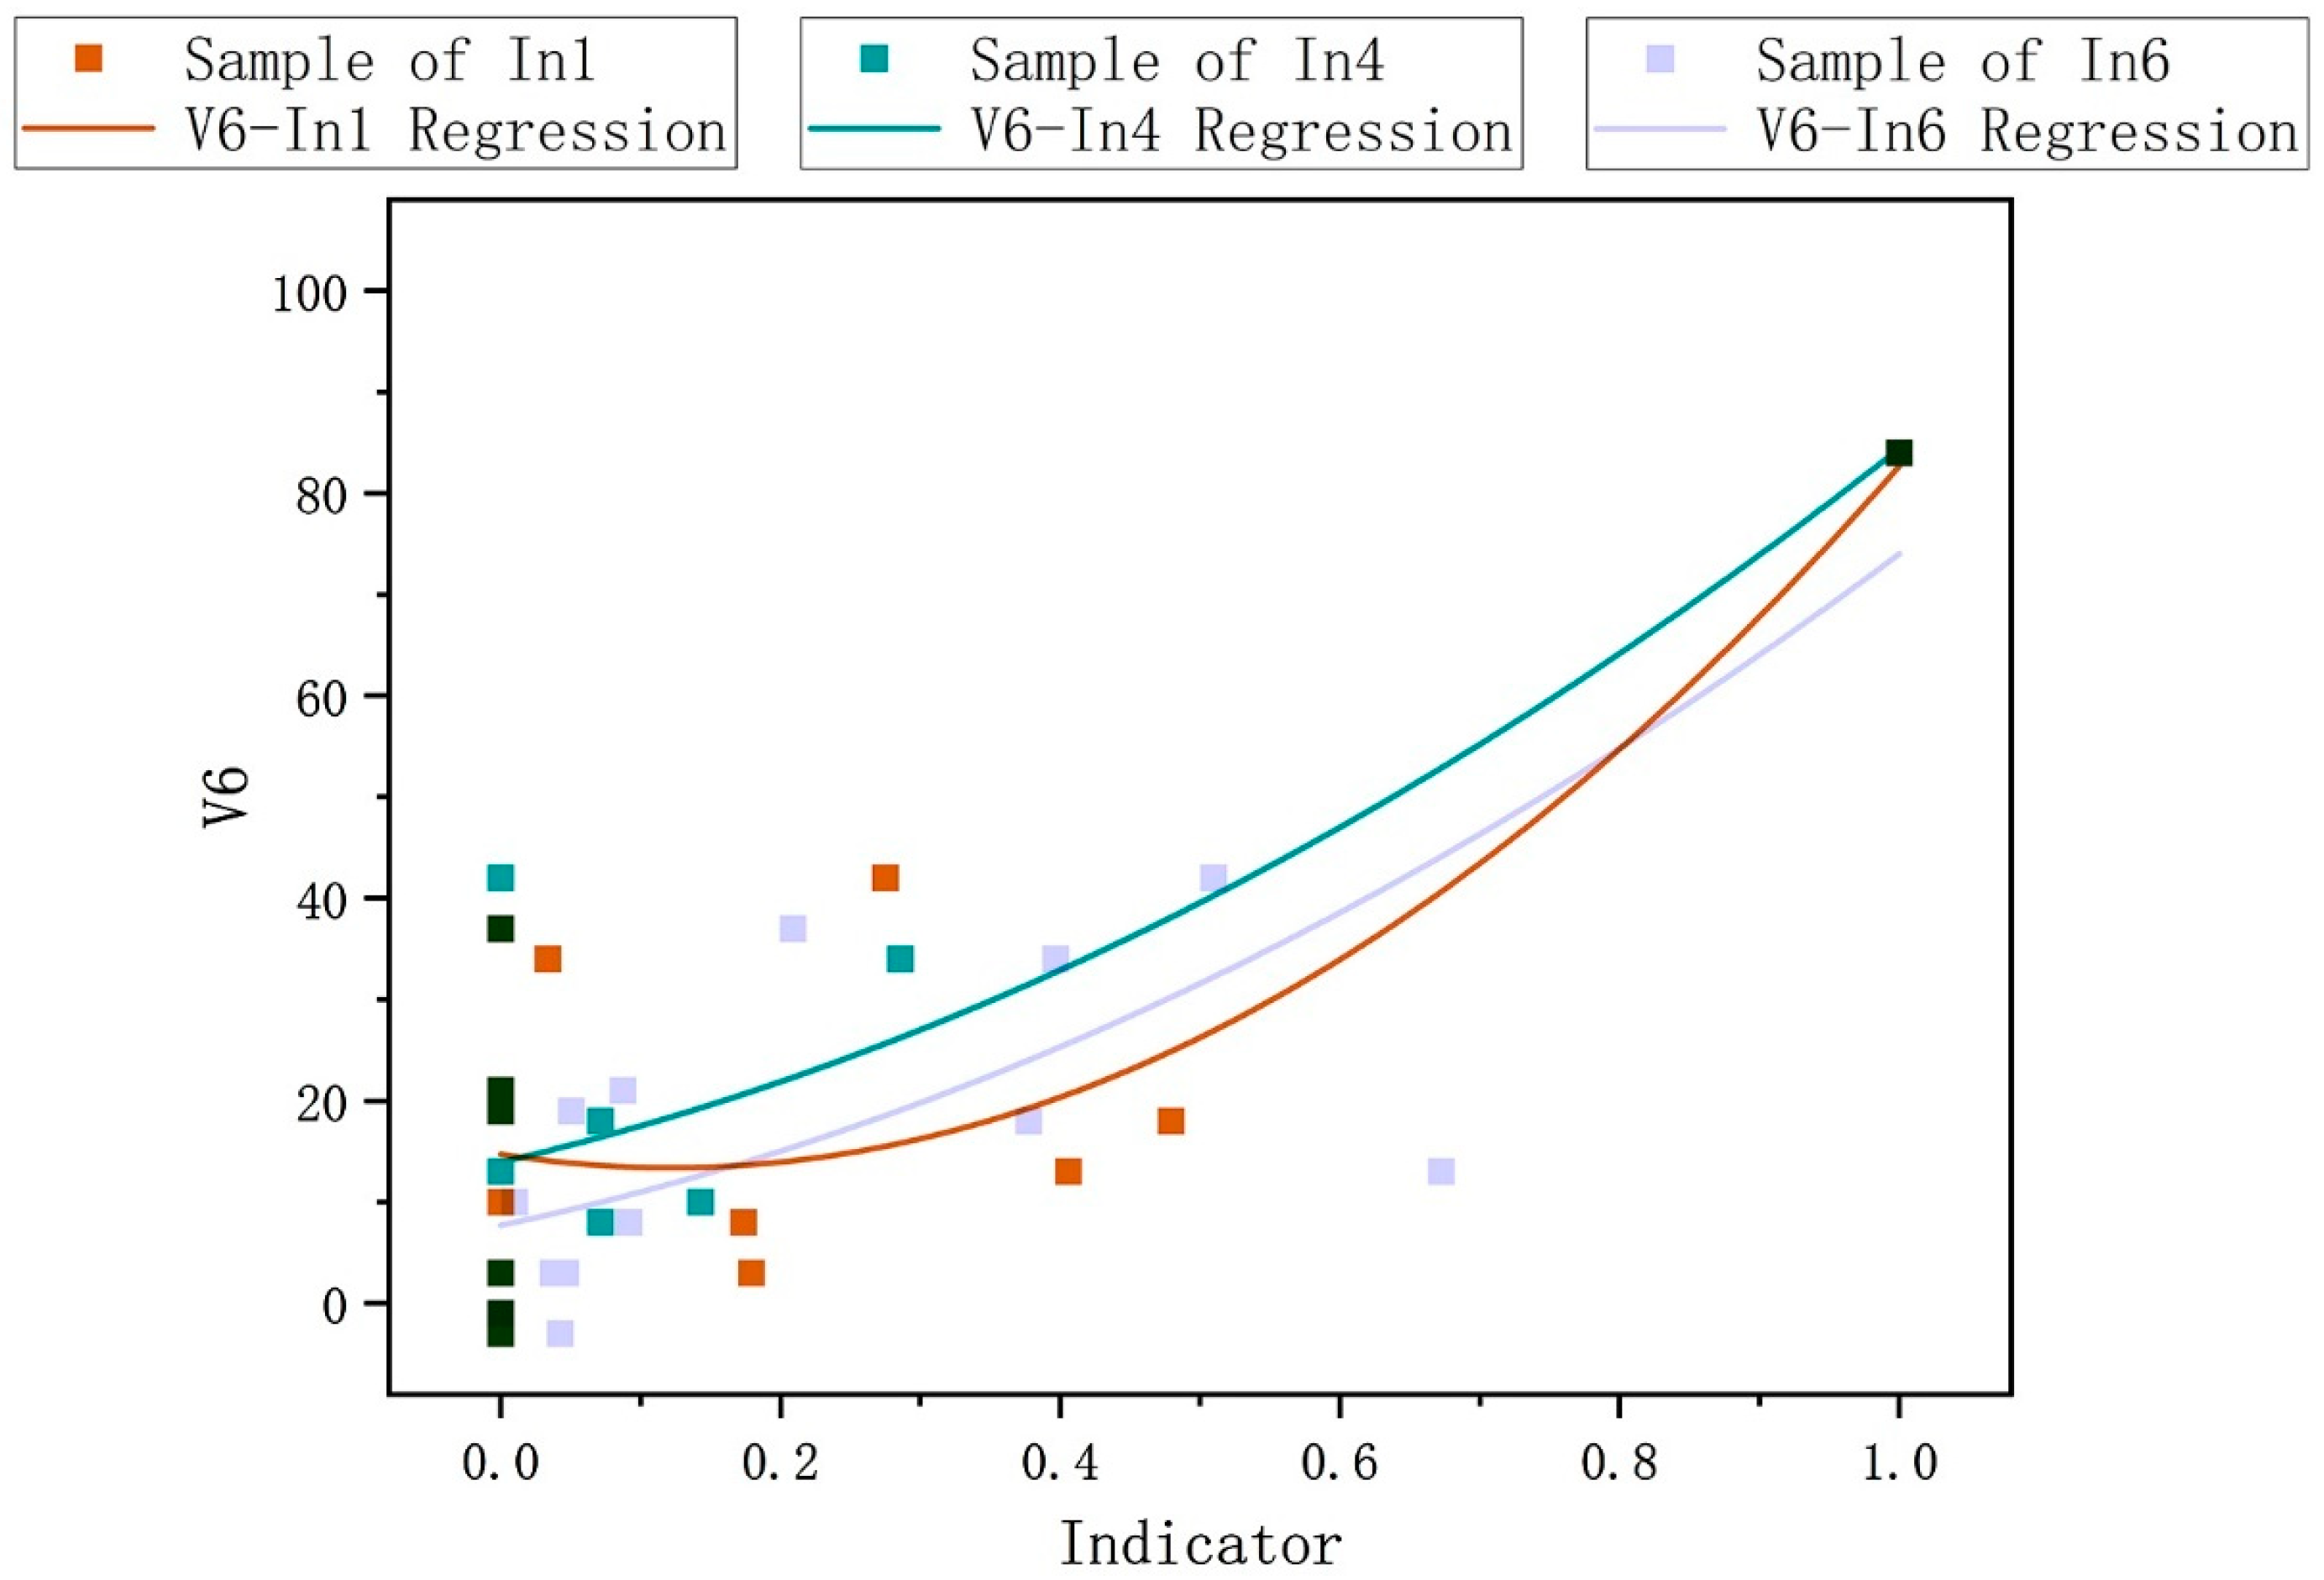
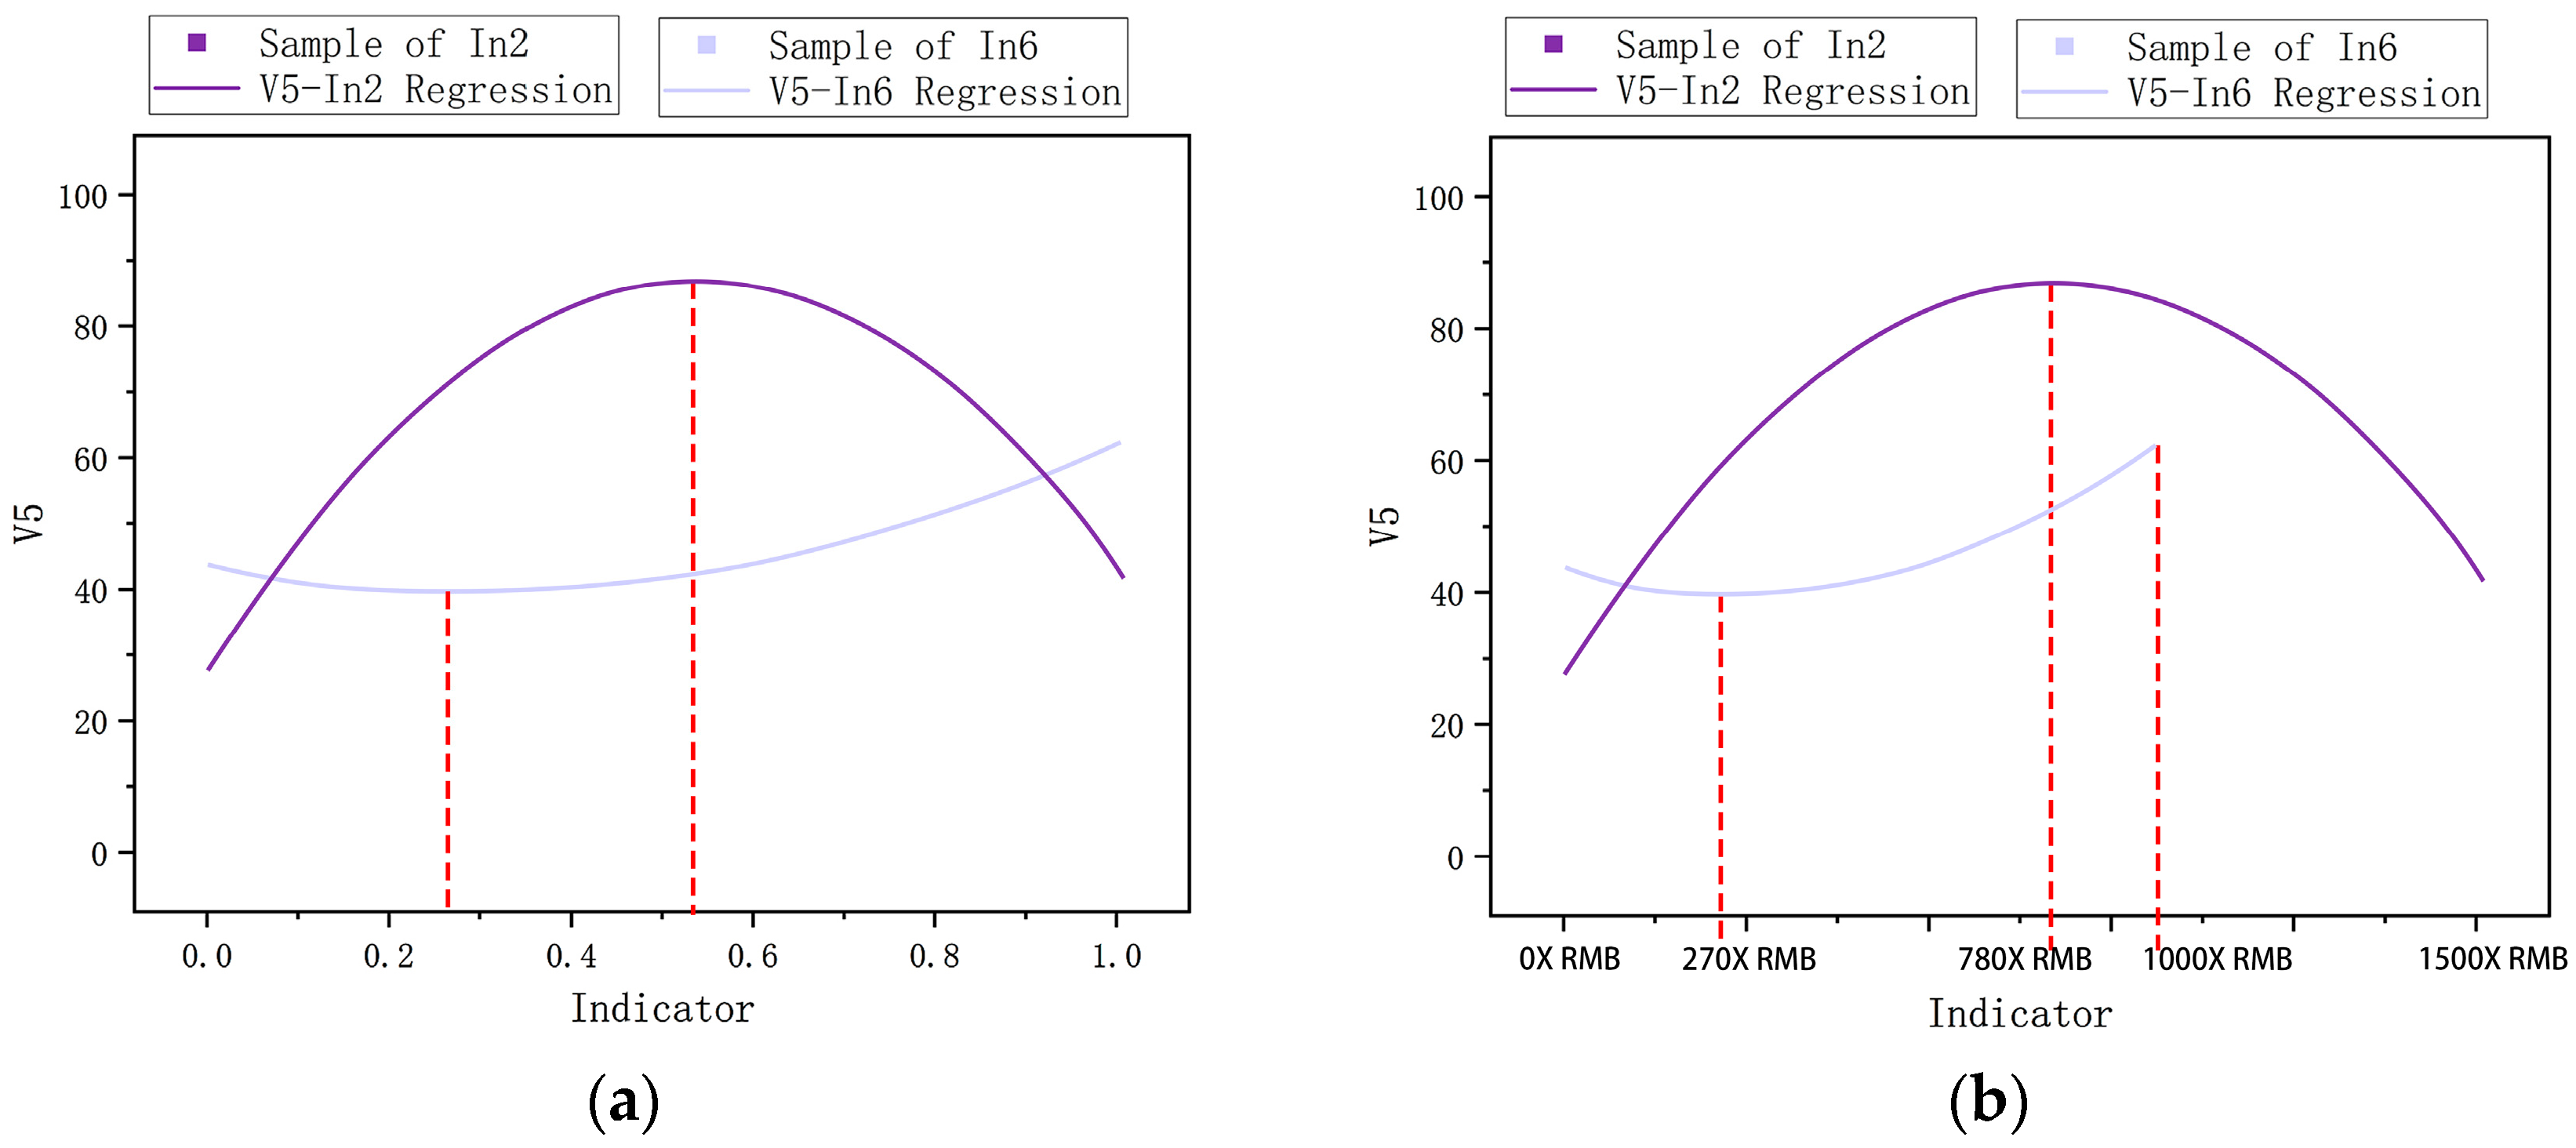
  • Step 5: Quantitative analysis and result interpretation. The quantitative analysis will apply logistic regression model and correlation analysis. The regression model will generate impact trend diagrams illustrating the relationships between indicators and targets. An integrated diagram will compare the effectiveness of various indicators on specific targets. However, if too many indicators are included, the diagram may become difficult to interpret. To improve visualization, the study will focus on a selected set of indicators as examples, chosen based on higher correlation coefficients, which reflect stronger relationships.

3.3. Data Collection Methods

As outlined above, the CSA process relies on two stages of data collection. The first is obtaining value variation scores for urban industrial heritage samples, and the second is quantifying the context indicators of those samples.

3.3.1. Value Variation Data

In this study, the value variation data are collected through questionnaires which are answered by expert participants. The study of heritage evaluation and regeneration needs comparison views and a comprehensive understanding of multi-dimensional urban issues. In this step, the participants are expected to understand the meaning of the industrial heritage value, analyse the sample information, and score the value of regenerated quarters from both historical and present perspectives. This process requires a professional study and working background to assist in the digestion of relevant information [62,63]. Therefore, expert participants who have extensive experience and expertise in urban planning, architecture, policy, and related fields can assist the research with more specialized knowledge and comparatively objective perspectives. Furthermore, experts are more likely to access professional data resources within their respective fields to seek further information on samples or verify definitions and theories, helping to ensure the reliability and objectivity of their assessments.
Identifying appropriate experts for questionnaires in the context of urban industrial heritage involves several considerations. Experts should be selected based on their specific knowledge, experience, and involvement in the field of urban regeneration and heritage conservation [58]. They are expected to have advanced degrees or sufficient working experience in relevant fields such as urban planning, architecture, heritage conservation, real estate development, or management of urban regeneration.
To ensure participant qualifications, the study conducts a pre-survey process in which questionnaires are distributed through contact persons within academic, professional, and industry affiliations. Contact persons share the pre-survey with their colleagues, and participants are screened using the following criteria: a minimum of three years of professional experience, prior involvement in, or visitation to at least one selected sample project, and a demonstrated familiarity with the study topic. Also additional questions to acknowledge the relevance of their professional background and the diversity of their expertise.
In the second stage, qualified participants complete a scoring table to evaluate value variations across the sample projects. Experts are expected to understand the definition of each heritage value and the regeneration background of each case. Based on their experience and professional judgment, they assign a score to each value. The questionnaire is designed to capture the perceived variation in heritage value following regeneration. Each sample is scored across all value dimensions, using a range from −100 to 100: negative scores indicate a decrease, and positive scores an increase in the respective value. The absolute value represents the extent of change, with larger values indicating greater variation (Table 2).
The questionnaire is designed in bilingual (Chinese–English) to accommodate participants’ language preferences and reduce potential translation bias. All key terms will be clearly defined to ensure consistency and clarity. All participants took part voluntarily and anonymously. Contact persons managed all communication and distribution and did not disclose any identifying information to the researcher. This procedure ensured full confidentiality and eliminated the risk of personal data exposure.
Table 3 shows the distribution and return condition of the questionnaire process. After the pre-survey stage, there were 217 qualified participants, and 196 of them returned valid scoring tables.
The following figures present the distribution of qualified experts based on their years of professional experience (Figure 2), areas of expertise (Figure 2), involvement with the sample projects (Figure 3), and familiarity with the research topic (Figure 4).
Most participants have over eight years of work experience, represent a wide range of relevant fields, and often work across multiple disciplines. The majority have either visited or been involved in industrial heritage projects and report a high level of familiarity with both Shanghai’s industrial heritage and urban regeneration. These qualifications ensure that participants are well prepared to understand the study’s objectives and accurately evaluate value variations in the selected case studies.

3.3.2. Context Indicator Data

Data on context indicators are mainly acquired from document analysis. Document analysis involves systematic examination and interpretation of various types of documents, both published and unpublished, to collect valuable information and draw meaningful conclusions about urban phenomena. The process entails the evaluation of diverse sources, such as open-source maps, government reports, policy documents, urban plans, newspapers, historical records, academic publications, etc.
Mapping, as a data collection method, includes a variety of techniques and tools used to capture, analyse, and visualise spatial information. Its strength in urban studies lies in synthesising complex data and converting visual information into statistical formats, enabling researchers to more effectively identify and analyse spatial relationships and trends [64]. In this study, mapping and diagramming of urban industrial heritage quarters support the processing of architectural and spatial data, functional distribution, transportation networks, and related contextual information.
Information Retrieval (IR) is the process of obtaining relevant information from a collection of resources in response to a specific query or need. In data collection, IR is essential for identifying, locating, and extracting useful data to address research questions or support decision-making [65]. In urban studies, IR plays a vital role in gathering data from diverse sources to analyse and understand urban environments, especially in accessing and collecting demographic, economic, and political information from government reports and documents, academic publications, newspapers and media, online databases, and websites.
Based on the information and data retrieved from mapping and documents, some of the indicators might also need to undergo an analysis process using existing datasets, such as census data, transportation records, and crime statistics, to transform the information into the required format or explore in-depth findings.
When focusing on the adaptive reuse strategies introduced in Section 2.4, the seven indicators selected for this study are based on the physical transformation of the heritage and sites.
The following indicators In1 to In4 refer to the protection and revitalization of physical industrial heritage during the regeneration process. The quantitative data can be expressed by the conservation rate of industrial heritage architectures and structures and measured by the proportion of architectures and structures that have been well maintained and preserved. The proportion is calculated by the preservation status of each heritage, depending on how much of the original plan, façade, material, structure, and items are left [66].
These indicators can be accessed from the plan and map analysis, as well as the development and management record of the project. A higher number of these indicators means a greater percentage of heritage preserved. A lower number of these indicators means a smaller percentage of heritage preserved.
  • In1. Heritage landscape
I n 1 = C o n s e r v e d   a r e a   o f   h e r i t a g e   l a n d s c a p e T o t a l   h e r i t a g e   l a n d s c a p e %
  • In2. Heritage architecture
I n 2 = C o n s e r v e d   f l o o r   a r e a   o f   h e r i t a g e   a r c h i t e c t u r e T o t a l   f l o o r   a r e a   o f   t h e   h e r i t a g e   a r c h i t e c t u r e %
  • In3. Heritage structure
I n 3 = C o n s e r v e d   a m o u n t   o f   p h y s i c a l   s t r u c t u r e T o t a l   a m o u n t   o f   p h y s i c a l   s t r u c t u r e %
  • In4. Heritage machinery
I n 4 = N u m b e r   o f   c o n s e r v e d   m a c h i n e s   a n d   i t e m s
Adaptive reuse also considers the positive integration between heritage and site. Regeneration for urban greenery (parks, green belts, landscape greening, etc.) and open spaces (square, plaza, street space, communal open space, etc.) mainly focus on the improvement of the quality and service capacity.
  • In5. Variation in green ratio
This indicator refers to the change in green space during the regeneration process. The study of green ratio is a simplified calculation method focusing on the greenery coverage proportion of the site [67,68]. The increase in green space will contribute to environmental development but might reduce the area of land for more profitable functions. This indicator can be acquired through analysis and comparison of current and historical maps. A higher number of this indicator means a larger degree of greenery area increase. A lower number of this indicator means a smaller degree of greenery area increase. Negative data mean the greenery area has decreased after regeneration.
I n 5 = P o s t   a r e a   o f   g r e e n   r a t i o P r e   a r e a   o f   g r e e n   r a t i o T o t a l   a r e a   o f   t h e   s i t e %
  • In6. Variation in the rate of open spaces area
This indicator refers to the change in open spaces during the regeneration process. Referring to the precedents of urban design, regeneration of heritage space usually aims to stimulate social activities by offering inclusive and adaptive public spaces [57]. Effective open space in the city can promote social activities, highlight the visual impact of heritage characteristics, and enhance the place identification of the site [69]. There are also possible disadvantages in designing open space, such as reducing development potential, overdrawn budget, lacking continuous management and inappropriate utilization [70]. This indicator can be measured by the proportion of open spaces to the total quarter area, which can be acquired through analysis and comparison of current and historical maps. A higher number of this indicator means a larger degree of open space area increase. A lower number of this indicator means a smaller degree of open space area increase. Negative data mean the open space area has decreased after regeneration.
I n 6 = P o s t   a r e a   o f   o p e n   s p a c e P r e   a r e a   o f   o p e n   s p a c e T o t a l   a r e a   o f   t h e   s i t e %
  • In7. Variation in the rate of active water frontage
This indicator refers to the change in the waterbody riparian zone having active interaction with people. Active frontage refers to a boundary or interface in the city that allows active engagement with the street users [71,72]. In some of the research that looks into waterfront architectures, the waterfront boundaries that a building or a public space has active interaction with waterbody is referred to as a part of the active water frontage [73]. The length of active water frontage relates to the urban natural environment, the vitality of social activity, and the price of waterside real estate. This indicator can be measured by the change in the proportion of active water frontage length to the total site perimeter which can be acquired through analysis and comparison of current and historical maps. A higher number of this indicator means a greater degree of newly developed water active frontage. A lower number of this indicator means a smaller degree of newly developed active water frontage. Negative data mean the length of active water frontage has been reduced after regeneration.
I n 7 = P o s t   l e n g t h   o f   a c t i v e   w a t e r   f r o n t a g e P r e   l e n g t h   o f   a c t i v e   w a t e r   f r o n t a g e T o t a l   s i t e   p e r i m e t e r %

3.4. Data Analysis Techniques

Regression analysis is a statistical technique used to determine the quantitative relationship between two or more variables. Polynomial regression analysis is a statistical regression model to show relationships using higher-order terms (such as squares, cubes, etc.) of the variables [74]. The core idea is that any smooth curve can be approximated by a function with higher-order polynomials. The slope of the tangent at each point on the curve represents the impact of changes in one variable on another. The calculation was performed using OriginPro 2022 software. For two sets of variables, selecting [Analysis]—[Fit]—[Polynomial Regression] allows for the computation of the polynomial regression equation and the plotting of the curve.
Considering the number of indicators, presenting all in a single diagram would reduce readability. Therefore, a subset of indicators needs to be selected for comparative analysis. The selection criteria can vary depending on specific research needs; in this study, correlation coefficient is used as the basis for selection. The correlation coefficient describes the intensity of the linear relationship between two variables. Usually, a positive number indicates a positive correlation, a negative number indicates a negative correlation, and the absolute value means the strength of the correlation [75]. The correlation coefficient between each indicator and each value will be calculated independently and compared within a table to identify stronger relationship indicators for a specific value. The calculation of the correlation coefficient is performed in OriginPro 2022. For two sets of variables, select [Statistics]—[Descriptive Statistics]—[Correlation Coefficient].
It is important to note that the correlation coefficient does not indicate the strength of an indicator’s impact. A high correlation coefficient only signifies a strong relationship, meaning that changes in A are likely to lead to changes in B. However, the extent of B’s change is to be measured by the slope of the tangent at each point on the regression curve. Therefore, the coefficient is used solely to select indicators suitable for analysis.

4. CSA for Shanghai—A Pilot Case Study

This section presents Shanghai as a pilot case to demonstrate the application of CSA in analysing the relationship between identified context indicators and heritage values. The study follows CSA procedures, including sample selection and data collection. Results are visualized through integrated impact diagrams, highlighting which adaptive reuse adjustments most effectively contribute to specific heritage values.

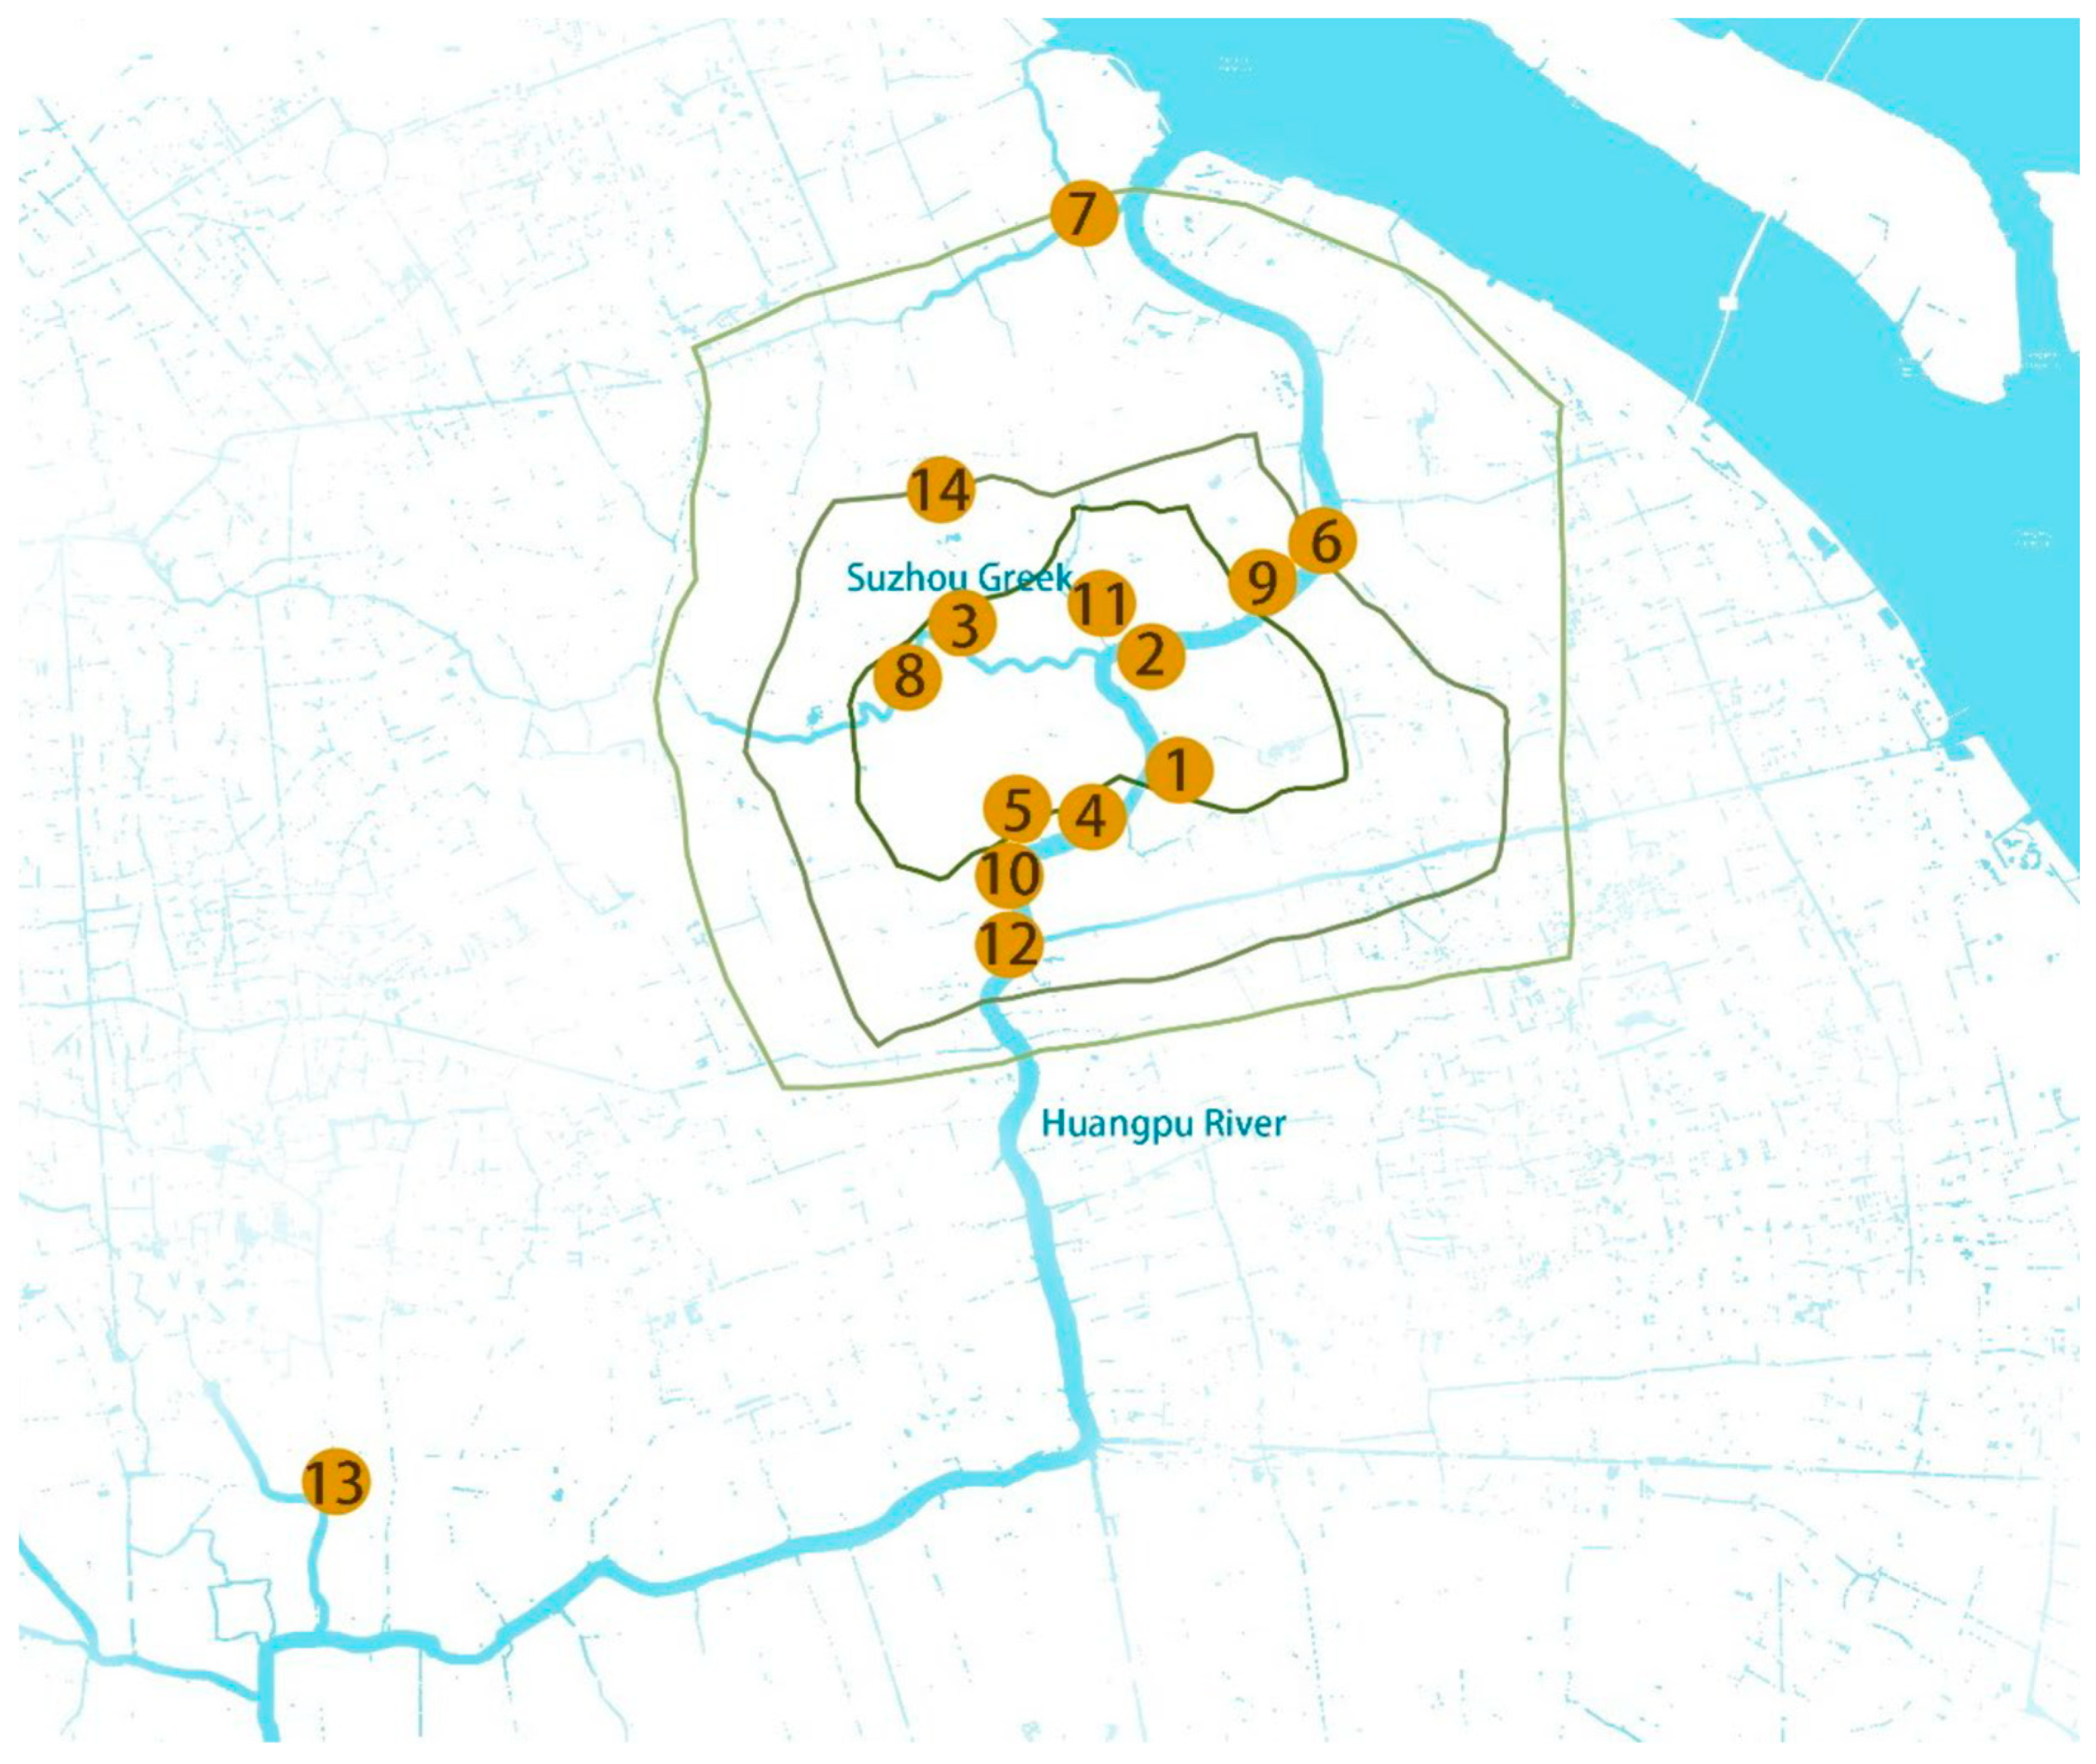
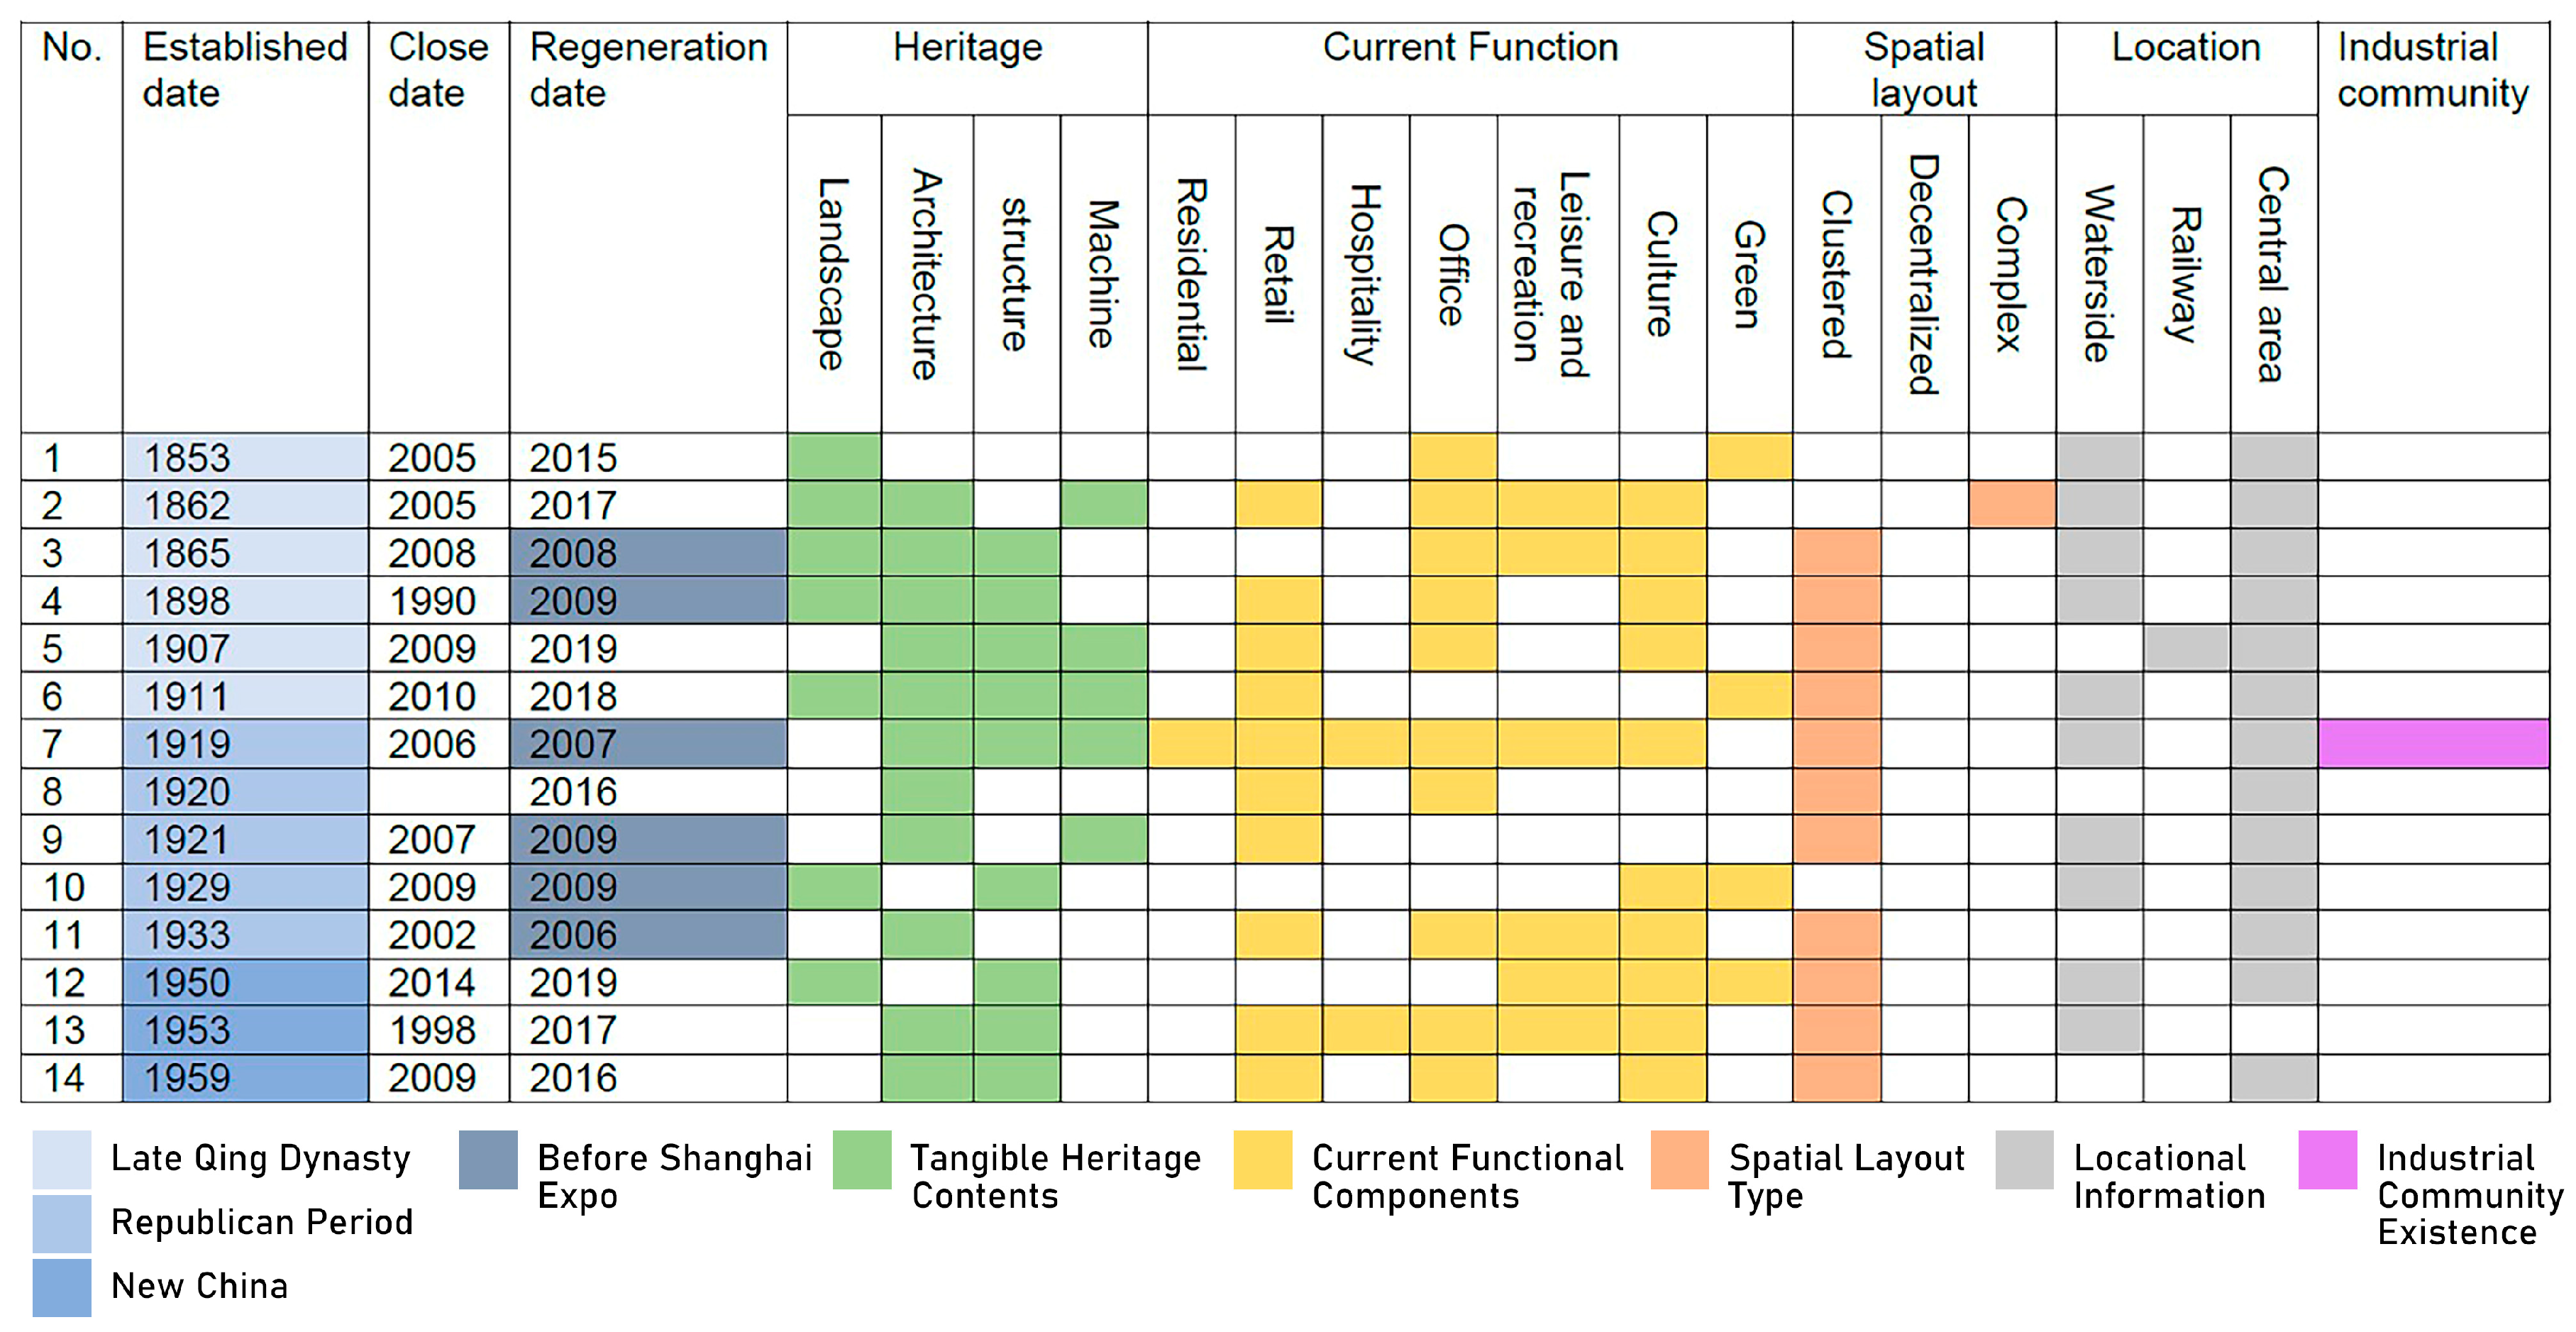
4.1. Urban Industrial Heritage Quarters in Shanghai

Shanghai, the birthplace of modern industry in China, has played a key role in the development of industries such as textiles, shipbuilding, and machinery. It prospered as the nation’s light industry centre in the 1960s and, following economic reforms, became a test city for the nation’s major industrial projects. Today, it is driven by high-tech manufacturing and emerging industries, while preserving a rich industrial legacy.
As the first Chinese city to reuse industrial sites into cultural, commercial, and residential spaces, Shanghai has become a model for industrial heritage regeneration. Its innovative efforts in adaptive reuse and heritage conservation offer valuable precedents for urban development across China. According to National Industrial Heritage Lists2, China Industrial Heritage Protection Lists3, and Shanghai Industrial Heritage Lists4, Shanghai has 58 designated industrial heritages. Among all, there are four machines and products, seven industrial facilities, 13 industrial architectures, 31 industrial quarters, and three industrial zones.
According to the definition of an urban industrial heritage quarter, the samples must meet the following research requirements. Firstly, the samples should already be regenerated into new functions. So, the heritage sites where their original industries are still functioning or sites that are awaiting renovation will not be selected as samples. Secondly, the spatial character of the heritage quarters can be classified into the three spatial types (clustered industrial heritage quarters, decentralized industrial heritage quarters, and industrial heritage complexes) defined earlier. Therefore, independent and small-scale industrial buildings, facilities and structures, and other heritage items will not be considered. Thirdly, from the relationship between the urban context, the industrial heritage quarters should be used as multi-functional quarters integrating with the surrounding context. Some of the industrial quarters have been reused by other companies and are not accessible to the public, so they will not be regarded as urban quarters.
Finally, after screening based on the above-mentioned criteria, 14 sites were left as qualified urban industrial heritage quarters and will be taken as analysis samples (Table 4).
Among the selected samples, 13 sites are located within the outer ring area of Shanghai, while Nanmen Granary Depot (which is now Cloud Grain Silo Cultural and Creative Industrial Park) is located in Songjiang District (Figure 5).
These samples are highly diverse in terms of historical periods, geographical locations, types of industries, scale, spatial layouts, types of buildings, and existing functions. They represent a wide array of industrial heritages and transformation styles from different eras under the current conditions (Figure 6).
The majority of these 14 samples are industrial heritage sites dating from the late Qing Dynasty (1840–1912) and the Republican period (1912–1949). The regeneration of industrial heritage sites occurred primarily in two phases. The first phase was before the 2010 Shanghai World Expo, which served as a catalyst for many urban regeneration projects. The second phase began after 2015, when cities across China gradually started recognizing and protecting industrial heritage, leading to an increase in conservation and reuse projects (Figure 7).
The 14 samples are rich in heritage content. Most cases include more than two types of tangible heritage. However, the Dongjiadu Shipyard, which underwent demolition before regeneration, retained only the dock landscape. Jingyuan Fashion Industry Park and 1933 Old Millfun are urban quarters only composed of industrial buildings (Figure 7).
In terms of current functions, most of these 14 samples have been developed for commercial and cultural uses, with fewer sites converted into residential areas. The residential function of Peninsula 1919 Cultural and Creative Industrial Park continues the former employee housing area of the factory. The spatial distribution mainly consists of clustered industrial heritage quarters (Figure 7).
As Shanghai’s industrial and urban development was based on ports and waterways, most industrial heritage sites have a waterfront characteristic and are located in central city areas. Only Station 1907 was regenerated from a railway heritage site, the old Nanpu Station, to assist in the transportation of the Beipiao Coal Dock. As the industrial structure transformed and urbanization progressed, most industrial communities gradually disappeared after factories ceased operations, with Peninsula 1919 Cultural and Creative Industrial Park being the only site that preserved its industrial community (Figure 7).

4.2. Data Collection

4.2.1. Value Data Collection

In the questionnaire process, each qualified expert participant will score the value variation in all 14 samples. Each score shown in the following table is the average score of 196 scores (the same value of the same sample) (Table 5).
According to the score, the Yangshupu Power Plant Heritage Park is evaluated as the most significantly improved sample after regeneration. The site has preserved most of the tangible heritage and displays the heritage along the waterfront green belt. The M50 Creative Park serves as a cluster of creative businesses. The small businesses on the site have formed an active local community, which is considered a significant improvement in social and cultural perspectives. As there are no production facilities and machines visible in the 1933 Old Millfun, the scientific and technological value is rarely improved. The regeneration performance of Jingyuan Fashion Park is regarded as dissatisfactory, especially in terms of natural value. However, it is considered to have a decent increase in economic conditions after regeneration. The Shanghai International Fashion Centre enjoyed the most significant boost of economic value, and it is now a famous fashion outlet and urban landmark of Yangpu District.

4.2.2. Indicator Data Collection

To illustrate how each kind of data was collected, this part will give examples of the calculation process. For each indicator, this part will select the sample with the largest data and diagrams for illustration. If more than one sample has the same data, the example will select the first sample from the list.
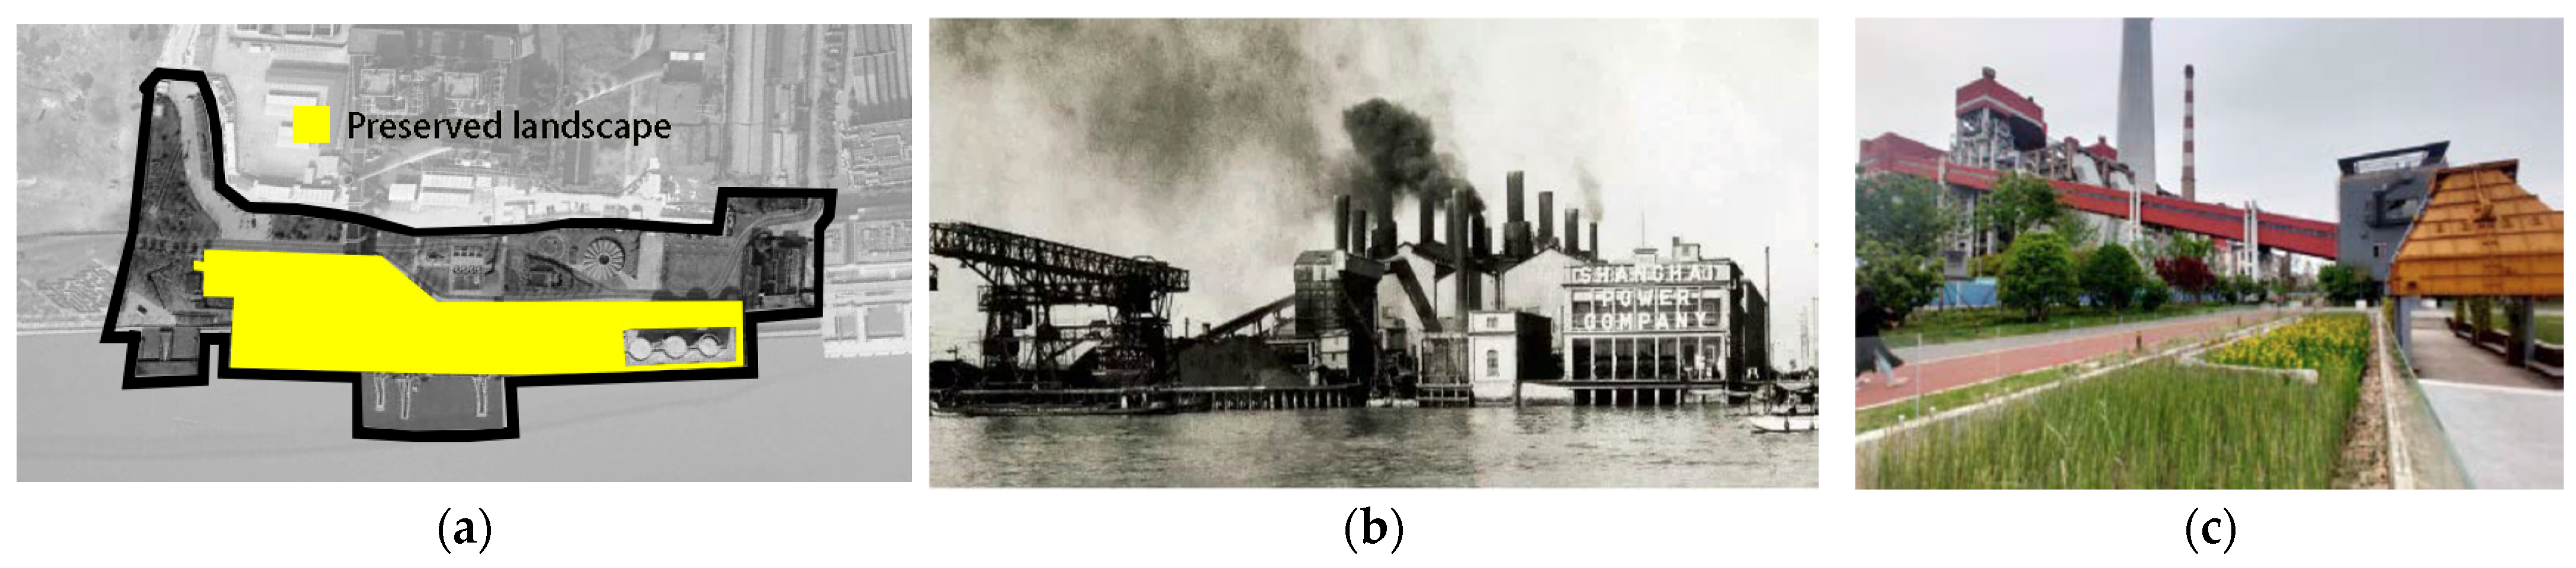
  • In1. Heritage landscape: Shanghai Yangshupu Power Plant Heritage Park has a coal drop yard and dock, which have been kept and reused as playgrounds, pedestrian zones, and waterfronts. According to the map, the total ground floor area of the site is 35,445 m2, the landscape area preserved is 15,698 m2. Therefore, the landscape preservation rate is 44.3% (Figure 8).
I n 1   o f   S a m p l e   6 = 15698   m 2 35445   m 2 = 0.443
  • In2. Heritage architecture: Puxi Riverside Expo Park Area is a heritage quarter that mainly consists of industrial landscape. Although the proportion of heritage architecture is relatively low compared with other sites, all traditional buildings are preserved on site but not reused. Although they remain closed to the public, front squares and introduction boards visually highlight the architecture, reminding people of its history (Figure 9).
I n 2   o f   S a m p l e   3 = 100 % = 1
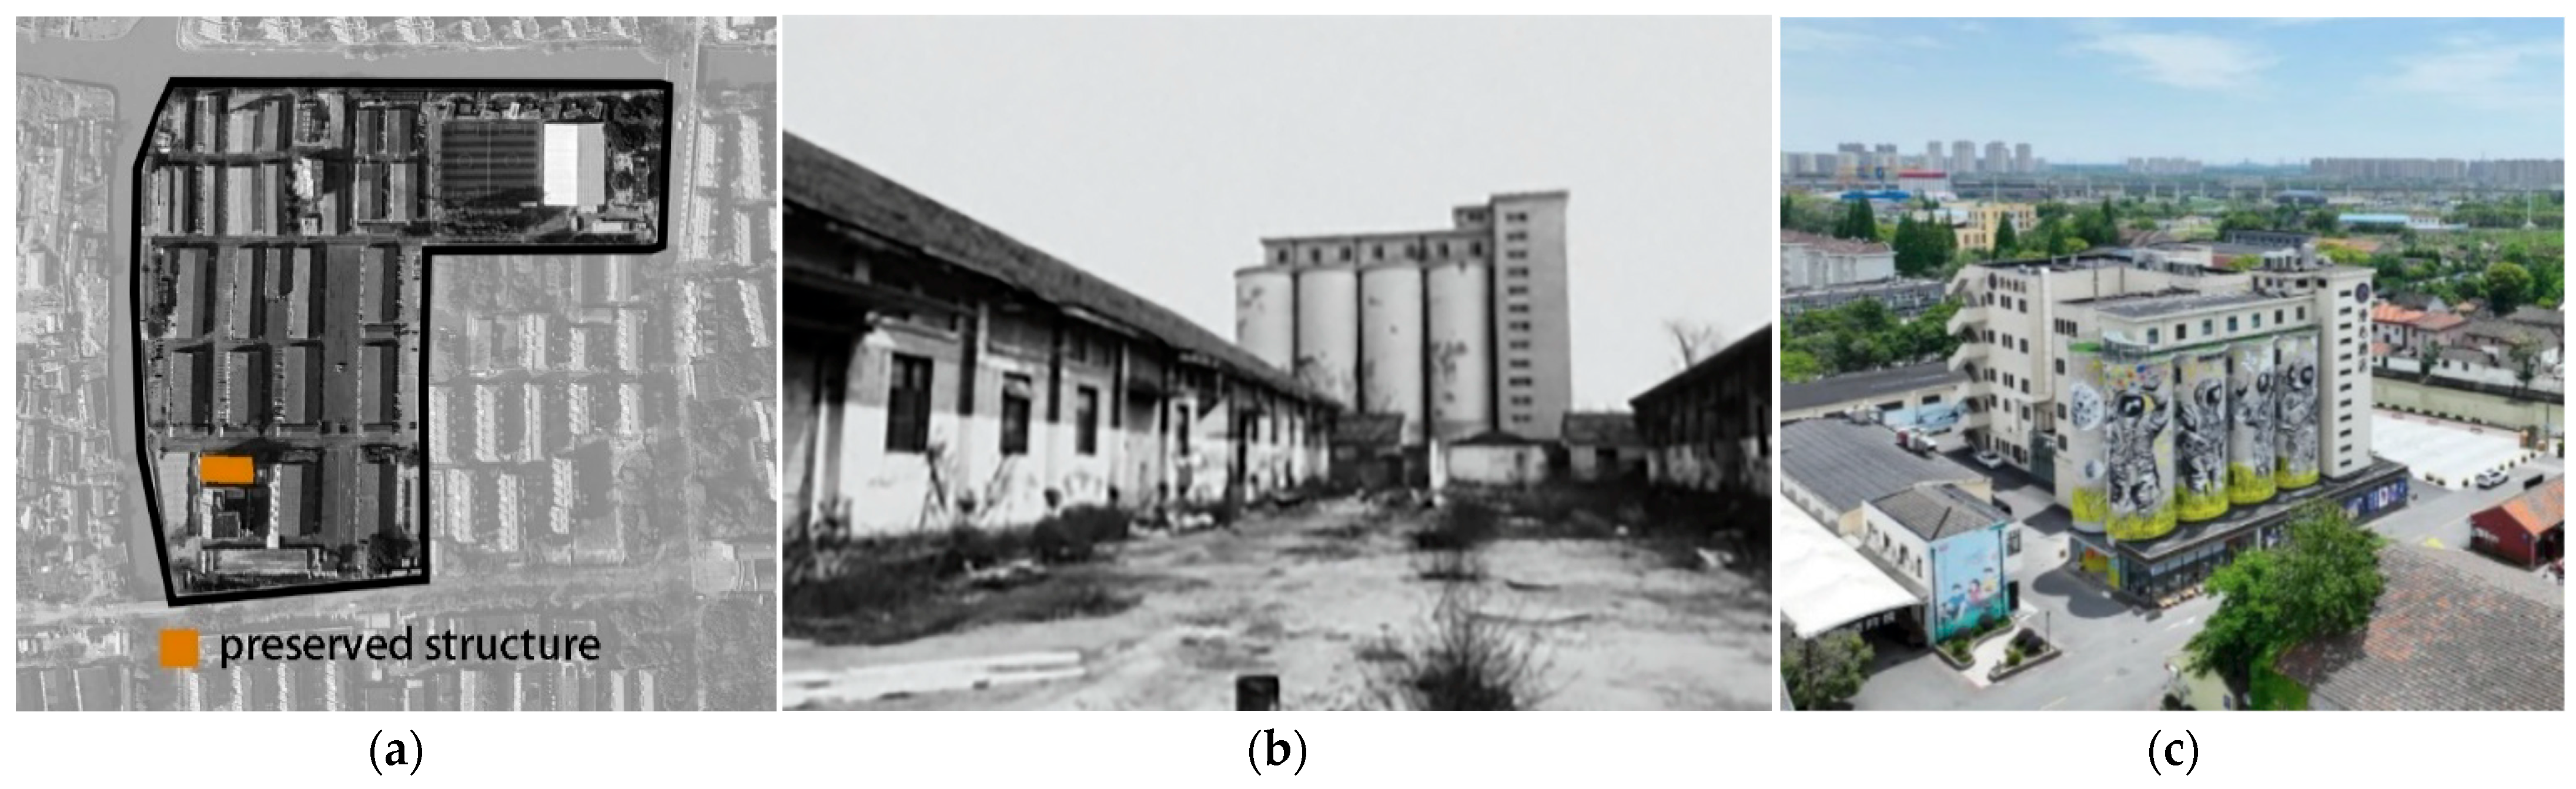
  • In3. Heritage structure: Cloud Grain Silo Cultural and Creative Industrial Park consists of a group silo and a series of warehouses. The original group silo has been fully preserved as the landmark exhibition centre’s outer structure with attractive wall painting (Figure 10).
I n 3   o f   S a m p l e   13 = 100 % = 1
  • In4. Heritage machinery: Shanghai Yangshupu Power Plant Heritage Park has preserved three riverside giant cranes and 11 power equipment on site as part of the regenerated industrial landscape (Figure 11).
I n 4   o f   S a m p l e   6 = 14
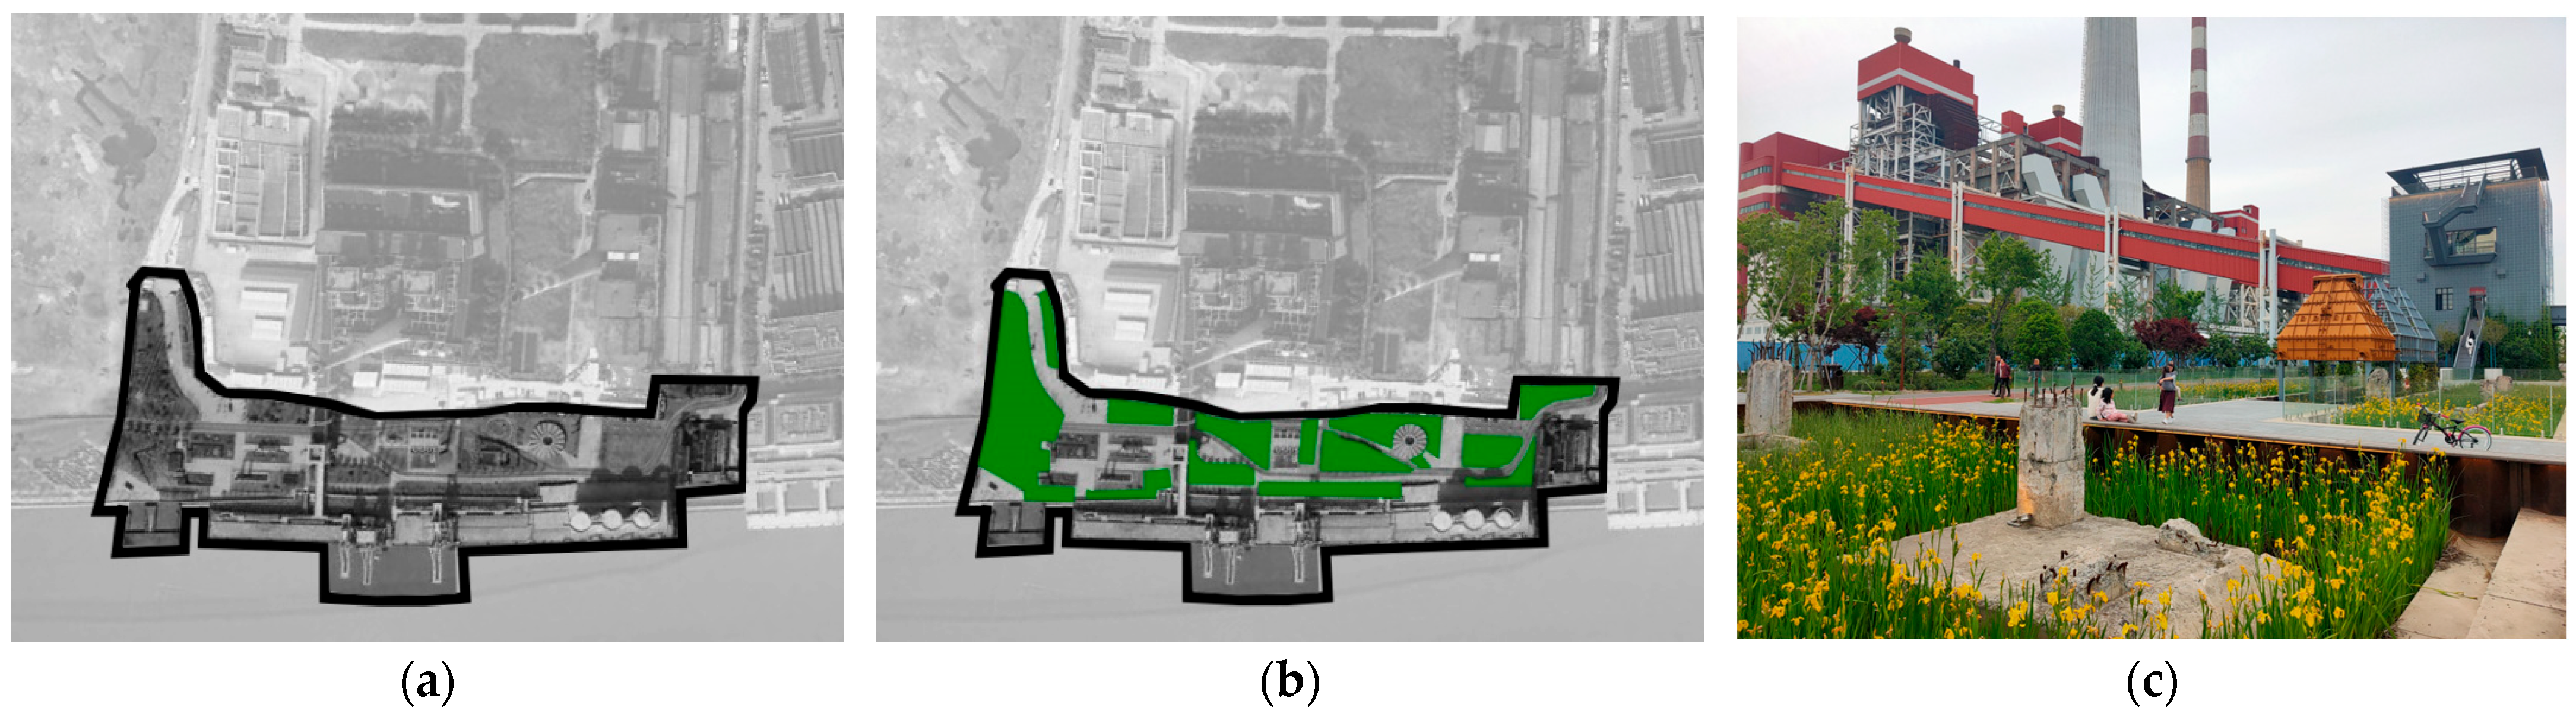
  • In5. Variation in green ratio: According to the historical map, the Shanghai Yangshupu Power Plant Heritage Park had no green area. After regeneration, this quarter added a large area of greenery between buildings and along the riverside. The current green space area is 11,944 m2. The total project area of the current site is 35,445 m2 (Figure 12).
I n 5   o f   S a m p l e   6 = 11944   m 2 0 35445   m 2 = 0.33697
  • In6. Variation in the rate of open space area: The original space of Shanghai Yangshupu Power Plant Heritage Park was purely for industrial and circulation purposes, which in this indicator can be regarded as no public space before regeneration. Now, it is facilitated with sufficient open spaces, with an area of 18,056 m2 (Figure 13).
I n 6   o f   S a m p l e   6 = 18056   m 2 0 35445   m 2 % = 0.509
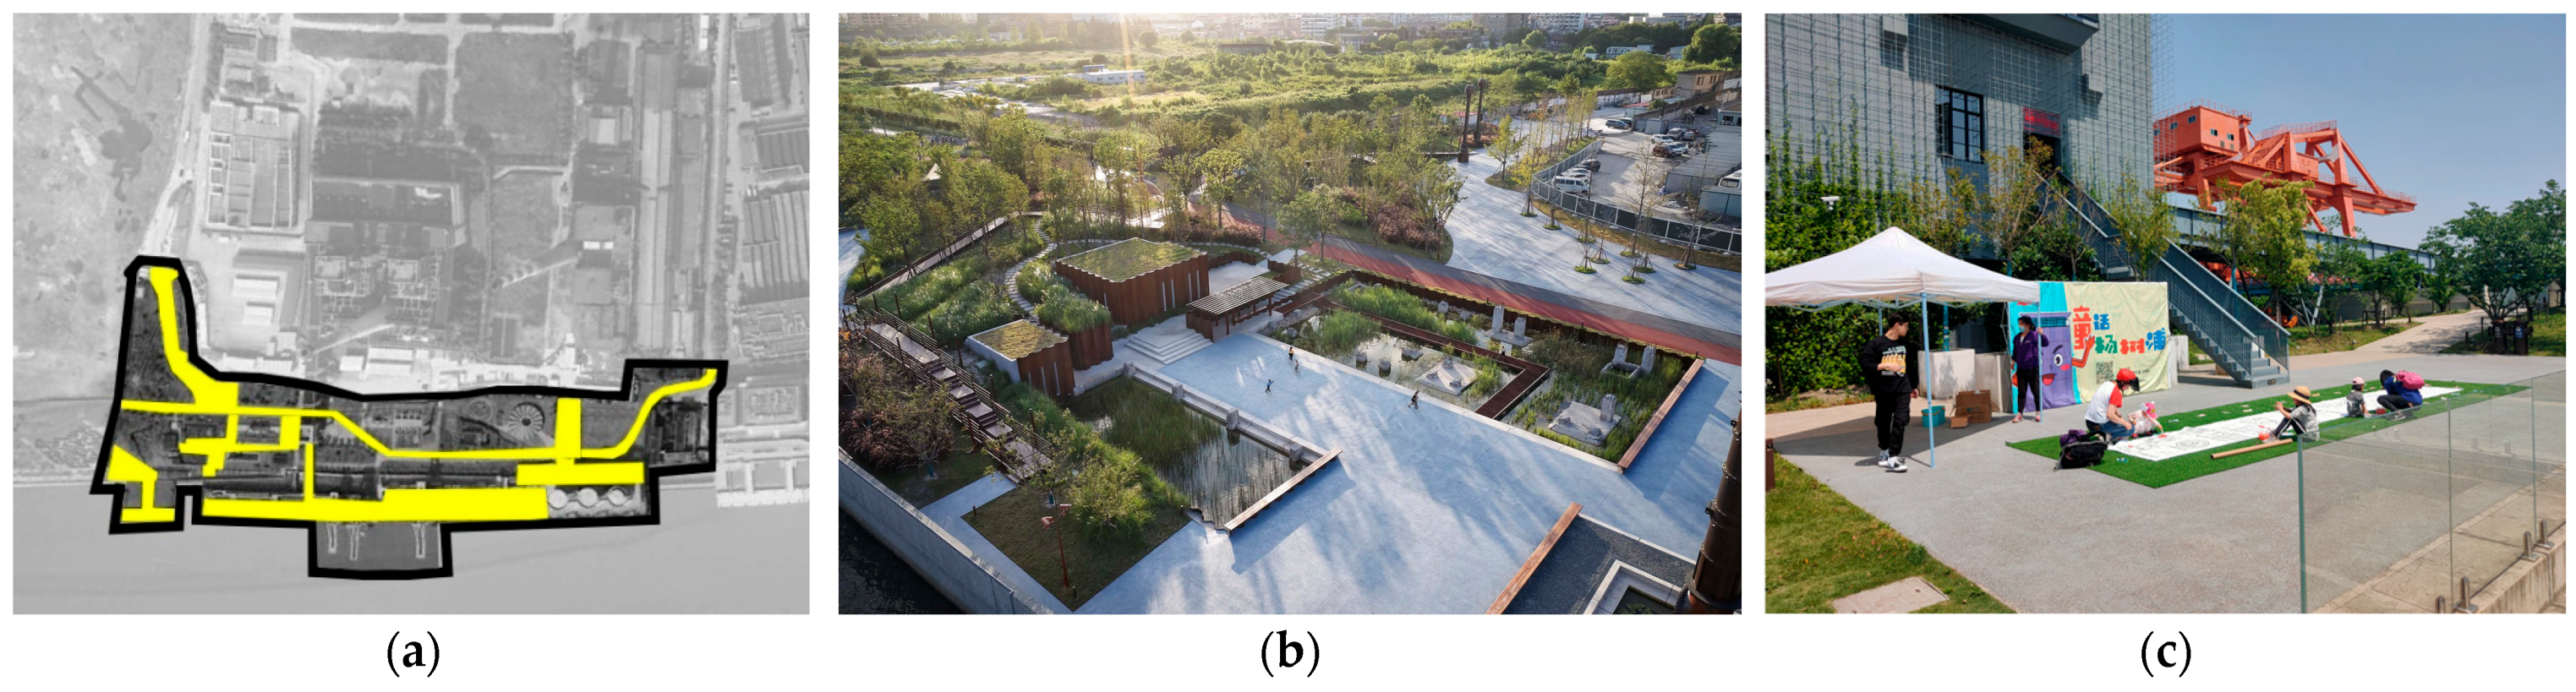
  • In7. Variation in the rate of active water frontage: The waterfront of the Shanghai Yangshupu Power Plant had ship docks that were inaccessible to public users. After regeneration, the site is actively interactive with the riverside through waterfront platforms, where people can walk and sit to enjoy the view of the east bank. The total perimeter of the site boundary is 1180m, with around 52.4% of the riverside being active frontage (Figure 14).
I n 7   o f   S a m p l e   6 = 618   m 0 1180   m = 0.523729
The original indicator data of all the samples are displayed in the following table (Table 6).

4.3. Data Analysis

For each heritage value, all the indicators with more than one piece of available data can generate their own impact trends on the change in a specific score. The outcome of data analysis can be shown as a series of impact trend diagrams representing the influence of indicators on value variation.
For better visualization, this study will select representative indicators based on correlation coefficient as mentioned in Section 3.4. To clearly and effectively illustrate the impact and interrelationships, the three indicators with the highest absolute correlation to each value metric will be selected for detailed analysis (Table 7).
After selecting these indicators for each value, the analysis will focus on each indicator’s impact trend and compare the impact trends of different indicators for a value. The outcome of the regression model will be shown in diagrams, which is a visualised display and is easy to analyse.
For historical value, all the selected indicators have a positive influence. Increasing the preservation percentage of industrial landscape works more effectively to increase the historical value within a certain range (approx. 0.3). However, above this range, increasing the percentage of machinery and open space is more effective as the slope is sharper to indicate a quicker increase rate (Figure 15).
The impact trend of scientific value is similar to historical value. Especially for the preservation of industrial machines, the trend means that sufficient effort is needed to input this indicator before it can show its effectiveness (Figure 16).
Socio-cultural value appears to be influenced quite mildly by these indicators. It is supposed to rely more on some social indicators of the urban environment. However, as adaptive reuse is mainly a physically environment-focused strategy, the results retrieved from this diagram are limited (Figure 17).
The effectiveness of industrial machinery is outstanding in increasing the aesthetic value of the site, as the machines and facilities have unique visual impressions. However, efforts input in this indicator should be limited within the degree of approx. 0.6. After this degree, resources should be considered to contribute more to preserving industrial landscapes or increasing open spaces for the site (Figure 18).
The impact trend of preserved heritage buildings shows an increasing curve as the economic value of the site increases. The peak degree is around 0.5, which means that increasing the percentage of heritage buildings can greatly promote the economic value of the site, but will immediately have opposite effects if over the limit (Figure 19).
The natural value of industrial heritage also relies more on preserving heritage landscapes. The original abandoned heritage landscape is a vital natural and historical resource for urban regeneration. This impact trend shows the high effectiveness of utilizing industrial landscape to its maximum degree (Figure 20).

5. Discussion

The above diagrams are actual influence trends based on the analysis of these 14 samples. The result of this analysis shows the possible impact of the contexts on values based on current cases and limited indicators.
The indicator diagrams invite further interpretation of the underlying dynamics influencing heritage value variation. Tangible industrial heritage within the urban environment reinforces historical legibility and public memory. In terms of historical value, although industrial landscapes often occupy a significant portion of the site, architectural elements and iconic machinery tend to have greater visual and symbolic impact. However, too many machines may result in a chaotic and fragmented impression of the site, potentially diminishing the aesthetic value. Industrial architecture remains a critical heritage asset and is widely recognised as a strategic resource for adaptive reuse. A balanced level of reuse can help reduce construction costs while preserving historical integrity [1]. Nonetheless, extensive preservation may limit the spatial flexibility required for new functional programmes, compromising economic feasibility and future adaptiveness [42]. This issue is particularly significant in mixed-use developments, where long-term financial sustainability should be balanced with conservation goals [47].
The result also reveals the positive impact of creating open spaces across multiple value dimensions. Adaptive reuse strategy for dealing with urban landscapes can promote spatial integration and enhance place identification [57]. In the context of industrial heritage sites, well-designed public spaces provide a setting where visitors can engage with the site’s historical narrative in an immersive and accessible way [20].
The results are expected to a provide reference during future regeneration practice by providing a numeric comparison of the effectiveness of the indicators. Developers need to select appropriate indicators to deal with and dynamically adjust resource allocation based on different goals (which value requires to be changed) and real-time conditions of the heritage site.
In practice, if the resource of the construction can be quantified and uniformed for all the indicators, the x-coordinates of the impact trend will change accordingly with the scale of the resource unit. This part will use ‘money’ as the resource to illustrate the actual utilization of this analysis. Taking V5-In2 (heritage architecture) and V5-In6 (open space) as examples. Suppose the construction area of an urban industrial heritage quarter regeneration project is X m2, and the current aim of the project is to increase the natural value of this quarter only by either increasing greenery or open area.
According to the data resources, the regeneration budget for basic maintenance for historical architecture is around 1500 RMB/m2, and the general regeneration budget for urban public space is around 1000 RMB/m2 [76].
Therefore, to unify the x-coordinate with the construction cost, if the In3 or In5 is increased from 0% to 100%, the regression curves will be adjusted as shown in Figure 21. This diagram provides a reference for deciding which indicator should be more focused on when the budget of this project is confirmed. If the total budget is below RMB 780X, then the more effective indicator is In2. For a budget between RMB 780X and 1000X, the adaptive reuse should select In6 and avoid input in In2. For a budget over RMB 1000X, the data of this study are unable to predict the impact on In6.
Although the sample size in Shanghai is relatively limited, the CSA method still contributes meaningful and interpretable results through the regression analysis. This suggests that even with a modest number of samples in one city, the model is capable of capturing valuable trends in the relationship between context indicators and heritage value variation. Optimistically, the reliability and accuracy of the CSA framework are expected to improve with a larger and more diverse dataset. If applied to broader contexts with an expanded sample base, the method has strong potential to generate more robust conclusions and support more informed, context-sensitive decision-making in heritage regeneration.
There are some limitations to this study that need to be clarified. Firstly, the indicators focus on the physical heritage context from the perspective of adaptive reuse. These indicators may work effectively on values that closely reflect tangible heritage but will show less effectiveness in studying intangible values such as socio-cultural value. Secondly, the number of samples is not sufficient to generate a more accurate impact curve. Limited by the heritage of a single city, future studies can consider taking in qualified samples from other similar cities. Thirdly, the research findings are too academic to be quickly applied in practical regeneration projects. In practice, the influence of a strategy usually leads to integrated contextual variation, which needs a balanced decision-making process. Therefore, integrating the performance of multiple indicators by a weighted indicator system is more supportive of allocating project resources to different indicators.

6. Conclusions

This study mainly focuses on the scope of industrial heritage quarters within the urban context. With a combination of urban environment and heritage characteristics, the future of urban industrial heritage quarters is an interesting and challenging topic.
In order to understand the relationship between context and value of an urban industrial heritage quarter, this research employed mixed-method research named as Contextual Sensitivity Analysis (CSA) to evaluate the relationship between the variation in context indicators and the variation in industrial heritage values, and analyse the industrial heritage quarter samples in Shanghai to reveal the impact trend with the specific context.
From the research outcome, the Contextual Sensitivity Analysis (CSA) is effective in revealing the relationship between two urban variables which inspires further and deeper quantitative urban studies. The series of diagrams shows how each indicator contributes independently to the target of the study, and how different indicators can be considered integrally to achieve a communal expectation. Further application potential has also been discussed when the indicators can be uniformed in a practical way, by money, time, or even labour.
Overall, this study is an attempt to quantify the relationship between complex urban context and subjective heritage value. Although it is limited to a specific strategy and context focus, the results still show a certain degree of feasibility in leading practical actions during adaptive reuse. From a positive perspective, as the topic of urban big data have been receiving more and more popular recently, a mixed-method study is expected to be more solidly supported if participating in interdisciplinary cooperation.

Author Contributions

Conceptualization, S.L. and T.H.; methodology, S.L. and T.H.; software, S.L.; validation, S.L.; formal analysis, S.L. and T.H.; investigation, S.L.; resources, S.L. and T.H.; writing—original draft preparation, S.L. and T.H.; writing—review and editing, T.H.; visualization, S.L.; supervision, T.H. All authors have read and agreed to the published version of the manuscript.

Funding

This research received no external funding.

Data Availability Statement

All original data are embedded in the article.

Acknowledgments

The regression analysis and correlation coefficients analysis are processed in OriginPro 2022.

Conflicts of Interest

The authors declare no conflicts of interest.

Abbreviations

The following abbreviations are used in this manuscript:
UIHQsUrban Industrial Heritage Quarters
CSAContextual Sensitivity Analysis
InIndicator
VValue

Notes

1
An urban industrial heritage quarter will be referred to as a UIHQ for short in this paper.
2
National Industrial Heritage Lists are announced by the Ministry of Industry and Information Technology of the People’s Republic of China, which has published five batches since 2017.
3
China Industrial Heritage Protection Lists are sponsored by the Publicity Department of the China Association for Science and Technology, which has announced three batches since 2018.
4
Shanghai Industrial Heritage Lists have two batches that were announced by the Shanghai Municipal Commission of Economy and Informatization in 2023 and 2024, which are extensions of the national lists, specifically focusing on the local characteristics and history.

References

  1. Berta, M.; Bottero, M.; Ferretti, V. A mixed methods approach for the integration of urban design and economic evaluation: Industrial heritage and urban regeneration in China. Environ. Plan. B Urban Anal. City Sci. 2018, 45, 208–232. [Google Scholar] [CrossRef]
  2. Douet, J. International Committee for the Conservation of the Industrial Heritage. Industrial Heritage Re-Tooled: The TICCIH Guide to Industrial Heritage Conservation; Carnegie Publishing Limited: Lancaster, UK, 2012. [Google Scholar]
  3. Weeks, J. Defining Urban Areas. In Remote Sensing and Digital Image Processing; Rashed, T., Jurgens, C., Eds.; Springer: Dordrecht, The Netherlands, 2010. [Google Scholar]
  4. Couch, C. City of Change and Challenge: Urban Planning and Regeneration in Liverpool; Routledge: Oxford, UK, 2017. [Google Scholar]
  5. Jayne, M.; Bell, D. City of Quarters: Urban Villages in the Contemporary City; Routledge: Oxford, UK, 2017. [Google Scholar]
  6. Hall, P. Cities of Tomorrow: An Intellectual History of Urban Planning and Design Since 1880, 4th ed.; Wiley-Blackwell: Chichester, UK, 2014. [Google Scholar]
  7. Carmona, M.; Tiesdell, S.; Heath, T.; Oc, T. Public Places–Urban Spaces: The Dimensions of Urban Design, 2nd ed.; Architectural: Oxford, UK, 2010. [Google Scholar]
  8. Olsson, K. Citizen input in urban heritage management and planning: A quantitative approach to citizen participation. Town Plan. Rev. 2008, 79, 371–394. [Google Scholar] [CrossRef]
  9. Ewing, R. Basic Quantitative Research Methods for Urban Planners, 1st ed.; Taylor & Francis Group: Oxford, UK, 2020. [Google Scholar]
  10. Frantzeskaki, N.; Bach, M.; Mguni, P. Understanding the Urban Context and Its Challenges. In Co-Creating Sustainable Urban Futures: A Primer on Applying Transition Management in Cities; Frantzeskaki, N., Hölscher, K., Bach, M., Avelino, F., Eds.; Springer International Publishing: Cham, Swizerland, 2018. [Google Scholar]
  11. Liauw, F. Reference for contextual design. IOP Conf. Ser. Mater. Sci. Eng. 2019, 508, 12031. [Google Scholar] [CrossRef]
  12. Victoria State Government. Urban Design Guidelines for Victoria. In Glossary and Resources; Department of Transport and Planning: Melbourne, Australia, 2017. Available online: https://www.urban-design-guidelines.planning.vic.gov.au/home (accessed on 17 November 2024).
  13. Rebecchi, A.; Buffoli, M.; Dettori, M.; Appolloni, L.; Azara, A.; Castiglia, P.; D’Alessandro, D.; Capolongo, S. Walkable Environments and Healthy Urban Moves: Urban Context Features Assessment Framework Experienced in Milan. Sustainability 2019, 11, 2778. [Google Scholar] [CrossRef]
  14. Lee, M.J.; Lee, D.-E. Questioning Beliefs Surrounding Urban Sustainability: The Need for a Contextual Urban Model. J. Asian Archit. Build. Eng. 2014, 13, 163–170. [Google Scholar] [CrossRef]
  15. Li, S.; Heath, T. Achieving Contextual Sensitivity: An organic approach of British urban industrial heritage regeneration. In Proceedings of the City and Complexity: Life, Design and Commerce in the Built Environment, London, UK, 17 June 2020; AMPS Proceedings 19.2. pp. 334–345. Available online: https://www.academia.edu/124160702/The_City_and_Complexity_Life_Design_and_Commerce_in_the_Built_Environment (accessed on 17 November 2024).
  16. Kyttä, M.; Broberg, A.; Haybatollahi, M.; Schmidt-Thomé, K. Urban happiness: Context-sensitive study of the social sustainability of urban settings. Environ. Plan. B Plan. Des. 2015, 43, 34–57. [Google Scholar] [CrossRef]
  17. Bole, D. ‘What is industrial culture anyway?’ Theoretical framing of the concept in economic geography. Geogr. Compass 2021, 15, e12595. [Google Scholar] [CrossRef]
  18. Harfst, J.; Wust, A.; Nadler, R. Conceptualizing industrial culture. GeoScape 2018, 12, 1–9. [Google Scholar] [CrossRef]
  19. Görmar, F.; Harfst, J.; Simic, D.; Wust, A. The Transformative Power of Industrial Culture—From Concepts to Actions; Leibniz-Institut für Länderkunde and Institut für Geographie und Raumforschung: Graz, Austria, 2019. [Google Scholar]
  20. Kaya, E.N. Transforming Industrial Urban Waterfronts: Industrial Heritage and Tourism. Ph.D. Thesis, Western Sydney University, Sydney, Australia, 2017. [Google Scholar]
  21. Icomos–Ticcih, J. The Dublin Principles. Principles for the Conservation of Industrial Heritage Sites, Structures, Areas and Landscapes. In Proceedings of the 17th ICOMOS General Assembly, Paris, France, 27 November–2 December 2011; Available online: https://ticcih.org/about/about-ticcih/dublin-principles/ (accessed on 17 November 2024).
  22. Palmer, M.; Sissons, M. Industrial Archaeology: A Handbook; Council for British Archeology: New York, NY, USA, 2012. [Google Scholar]
  23. Yu, K. Recommendations for the conservation of China’s industrial heritage. Landscape Design. 2006, 2, 70–71. Available online: https://www.turenscape.com/paper/detail/227.html (accessed on 17 November 2024).
  24. Aoki, N.; Xu, S. Research on Value Estimation of Industrial Heritage Sites; China City Press: Beijing, China, 2021. [Google Scholar]
  25. De la Torre, M. Assessing the Values of Cultural Heritage: Research Report; Getty Conservation Institute: Los Angeles, CA, USA, 2002. [Google Scholar]
  26. MIIT. The National Industrial Heritage Management Approach; Ministry of Industry and Information Technology, Ed.; MIIT: Beijing, China, 2023. Available online: https://www.gov.cn/zhengce/zhengceku/2023-03/15/content_5746847.htm (accessed on 17 November 2024).
  27. Deng, C.; Lu, C.; Tong, B.; Zhang, J. Research on the Development of an Industrial Heritage Conservation List—The Case of Nanjing. In Proceedings of the Transformation and Reconstruction—2011 China Urban Planning Conference, Nanjing, China, 2011; Available online: https://chn.oversea.cnki.net/KCMS/detail/detail.aspx?dbcode=CPFD&dbname=CPFD0914&filename=ZHCG201109001889&uniplatform=OVERSEA&v=4YNMMdz0tnEylNkNKCSeUODlNybCpBy8Jy32Ng0TIKqB3VH6A7qS_3dq6fR5APVpGFcfZHQJsqE%3d (accessed on 17 November 2024).
  28. Huang, Q. Conservation and Reuse of Modern Industrial Buildings in Shanghai. Ph.D. Thesis, Tongji University, Shanghai, China, 2008. [Google Scholar]
  29. Liu, C.; Wu, J.; Bai, X.; Zhang, G. Research on the value evaluation system of industrial heritage—An example of industrial heritage protection in Tianjin. In Proceedings of the Diversity and Inclusion—Proceedings of the 2012 China Urban Planning Conference, Yantai, China, 18–20 August 2012. [Google Scholar]
  30. Xu, D. An Exploration of Modern Industrial Heritage Value Evaluation Methods—Chongqing as an Example. China Anc. City J. Yangzhou China 2013, 66–70. Available online: https://chn.oversea.cnki.net/KCMS/detail/detail.aspx?dbcode=CJFD&dbname=CJFD2013&filename=ZGMI201305014&uniplatform=OVERSEA&v=YJwGXstG9QybE9DapocjeVcTEICK2Lbt0FrODz5JdoxudLoqMH59P_LSSD-TnBd4 (accessed on 17 November 2024).
  31. Kirkwood, N. Manufactured Sites: Rethinking the Post-Industrial Landscape; Taylor & Francis: London, UK, 2001. [Google Scholar]
  32. Kowarik, I. Towards a Conceptual Framework. In Wild Urban Woodlands; Kowarik, I., Körner, S., Eds.; Springer: Berlin/Heidelberg, Germany, 2005. [Google Scholar]
  33. Iryna, M.; Irina, B. Ecological transformation of industrial regions: Recreation system by the example of the Emscher Landscape Park. In AIC Conference, 1st ed.; American Institute of Physics: Melville, NY, USA, 2023. [Google Scholar]
  34. BMBEIT. Guidelines for the Conservation and Reuse of Industrial Heritage in Beijing; The Beijing Municipal Bureau of Economy and Information Technology: Beijing, China, 2009.
  35. Ricci, L.; Mariano, C.; Perrone, F. Cultural Heritage Recognition through Protection of Historical Value and Urban Regeneration: CSOA Forte Prenestino. Land 2024, 13, 453. [Google Scholar] [CrossRef]
  36. Ticcih, P. The Nizhny Tagil Charter for the industrial heritage. In Proceedings of the International Committee for the Conservation of the Industrial Heritage (TICCIH), Moscow, Russia, 17 July 2003. [Google Scholar]
  37. Stibral, K.; Faktorová, V. The origins of the aesthetic appreciation and artistic depiction of the industrial landscape. J. Herit. Tour. 2021, 16, 151–163. [Google Scholar] [CrossRef]
  38. Onion, R. Reclaiming the Machine: An Introductory Look at Steampunk in Everyday Practice. Neo-Victorian Stud. 2008, 1, 138–163. [Google Scholar]
  39. Jevremovic, L.; Vasić, M.; Jordanovic, M. Aesthetics of Industrial Architecture in the Context of Industrial Buildings Conversion. In Proceedings of the IV International Symposium for Students of Doctoral Studies in the Fields of Civil Engineering, Architecture and Environmental Protection, Nis, Serbia, 27–28 September 2012; pp. 80–87. [Google Scholar]
  40. Licciardi, G. Economics of Uniqueness: Investing in Historic City Cores and Cultural Heritage Assets for Sustainable Development, 1st ed.; World Bank Publications: Herndon, FL, USA, 2012. [Google Scholar]
  41. Zhu, Q.-Y.; Zhu, Y. Ecological Transforming in Industrial Heritage Site: Quarry Park Proposal for Sustainable Development. Appl. Mech. Mater. 2012, 178–181, 934–942. [Google Scholar] [CrossRef]
  42. Arbab, P.; Alborzi, G. Toward developing a sustainable regeneration framework for urban industrial heritage. J. Cult. Herit. Manag. Sustain. Dev. 2022, 12, 263–274. [Google Scholar] [CrossRef]
  43. HKU. Architecture of the Urban Industrial Complex. Available online: https://www.arch.hku.hk/research_project/architecture-of-the-urban-industrial-complex/ (accessed on 17 November 2024).
  44. Collazo, A.A. Urban Morphology and Industrial Heritage Perspectives. WIT Trans. Ecol. Environ. 2022, 260, 427–436. [Google Scholar]
  45. Swensen, G.; Stenbro, R. Urban planning and industrial heritage—A Norwegian case study. J. Cult. Herit. Manag. Sustain. Dev. 2013, 3, 175–190. [Google Scholar] [CrossRef]
  46. Rifaioğlu, M.N. Interpreting living urban-industrial heritage: The Jewellery Quarter, Birmingham. J. Des. Resil. Archit. Plan. 2022, 3, 308–324. [Google Scholar] [CrossRef]
  47. Bottero, M.; D’Alpaos, C.; Oppio, A. Ranking of Adaptive Reuse Strategies for Abandoned Industrial Heritage in Vulnerable Contexts: A Multiple Criteria Decision Aiding Approach. Sustainability 2019, 11, 785. [Google Scholar] [CrossRef]
  48. Clark, J. Adaptive Reuse of Industrial Heritage: Opportunities & Challenges; Heritage Council of Victoria: Melbourne, Austrilia, 2013. [Google Scholar]
  49. Ifko, S. Comprehensive Management of Industrial Heritage Sites as A Basis for Sustainable Regeneration. Procedia Eng. 2016, 161, 2040–2045. [Google Scholar] [CrossRef]
  50. Plevoets, B.; Van Cleempoel, K. Adaptive Reuse of the Built Heritage: Concepts and Cases of an Emerging Discipline; Taylor & Francis Group: Milton, UK, 2019. [Google Scholar]
  51. Bullen, P.A.; Love, P.E.D. Adaptive reuse of heritage buildings. Struct. Surv. 2011, 29, 411–421. [Google Scholar] [CrossRef]
  52. Andrews, K. Transforming King’s Cross; Merrell: London, UK, 2012. [Google Scholar]
  53. Austin, R.L.; Woodcock, D.G.; Steward, W.C.; Forrester, R.A. Adaptive Reuse: ISSUES and Case Studies in Building Preservation; Van Nostrand Reinhold: New York, NY, USA, 1988. [Google Scholar]
  54. Copic, S.; Đorđević, J.; Lukic, T.; Stojanović, V.; Đukičin, S.; Besermenji, S.; Stamenković, I.; Tumaric, A. Transformation of industrial heritage: An example of tourism industry development in the Ruhr area (Germany). Geogr. Pannonica 2014, 18, 43–50. [Google Scholar] [CrossRef]
  55. Sang, K.; Lin, G. A Landscape Design Strategy for the Regeneration of Brownfield: The Case of Shougang Industrial Park in China. In Resilient and Responsible Smart Cities: The Path to Future Resiliency; Springer: Berlin/Heidelberg, Germany, 2023; pp. 115–125. [Google Scholar]
  56. Andaloro, B.; de Waal, M.; Suurenbroek, F. Adaptive public spaces. Exploring digital transition for social and environmental benefit. Agathón Int. J. Archit. Art Des. 2022, 12, 68–75. [Google Scholar] [CrossRef]
  57. Loures, L. Industrial Heritage: The past in the future of the city. WSEAS Trans. Environ. Dev. 2008, 4, 687. [Google Scholar]
  58. Creswell, J.W. Research Design: Qualitative, Quantitative, and Mixed Methods Approaches, 6th ed.; SAGE Publications, Inc.: Thousand Oaks, CA, USA, 2023. [Google Scholar]
  59. Wolf, K.L. Assessing public response to freeway roadsides: Urban forestry and context-Sensitive solutions. Transp. Res. Rec. 2006, 1984, 102–111. [Google Scholar] [CrossRef]
  60. Beukes, E.A.; Vanderschuren, M.J.W.A.; Zuidgeest, M.H.P. Context sensitive multimodal road planning: A case study in Cape Town, South Africa. J. Transp. Geogr. 2011, 19, 452–460. [Google Scholar] [CrossRef]
  61. Gillham, B. Case Study Research Methods, 1st ed.; Bloomsbury Publishing PLC: London, UK, 2000. [Google Scholar]
  62. Okoli, C.; Pawlowski, S.D. The Delphi method as a research tool: An example, design considerations and applications. Inf. Manag. 2004, 42, 15–29. [Google Scholar] [CrossRef]
  63. Turoff, M. The design of a policy Delphi. Technol. Forecast. Soc. Chang. 1970, 2, 149–171. [Google Scholar] [CrossRef]
  64. Akoka, J.; Comyn-Wattiau, I.; Laoufi, N. Research on Big Data–A systematic mapping study. Comput. Stand. Interfaces 2017, 54, 105–115. [Google Scholar] [CrossRef]
  65. Schütze, H.; Manning, C.D.; Raghavan, P. Introduction to Information Retrieval; Cambridge University Press: Cambridge, UK, 2008; Volume 39. [Google Scholar]
  66. Li, H.; Tian, W.; Zhang, Y.; Chen, X. The Basis for Evaluating the Recycling of Old Industrial Buildings, 1st ed.; China Construction Industry Press: Beijing, China, 2016. [Google Scholar]
  67. Ouyang, W.; Morakinyo, T.E.; Ren, C.; Ng, E. The cooling efficiency of variable greenery coverage ratios in different urban densities: A study in a subtropical climate. Build. Environ. 2020, 174, 106772. [Google Scholar] [CrossRef]
  68. Ong, B.L. Green plot ratio: An ecological measure for architecture and urban planning. Landsc. Urban Plan. 2003, 63, 197–211. [Google Scholar] [CrossRef]
  69. Carmona, M.; De Magalhães, C.; Hammond, L.; Blum, R.; Yang, D. Living Places: Caring for Quality; The Bartlett School of Planning, UCL: London, UK, 2004. [Google Scholar]
  70. Madanipour, A. Whose Public Space? International Case Studies in Urban Design and Development; Routledge: London, UK, 2010. [Google Scholar]
  71. Heffernan, E.; Heffernan, T.; Pan, W. The relationship between the quality of active frontages and public perceptions of public spaces. Urban Des. Int. 2014, 19, 92–102. [Google Scholar] [CrossRef]
  72. Gehl, J. Cities for People; Island Press: London, UK; Washington, DC, USA, 2010. [Google Scholar]
  73. Shangi, Z.A.D.; Hasan, M.T.; Ahmad, M.I. Rethinking Urban Waterfront as a Potential Public Open Space: Interpretative Framework of Surma Waterfront. Archit. Res. 2020, 10, 69–74. [Google Scholar]
  74. Ostertagova, E. Modelling Using Polynomial Regression. Procedia Eng. 2012, 48, 500–506. [Google Scholar] [CrossRef]
  75. Garcia Asuero, A.; Sayago, A.; González, G. The Correlation Coefficient: An Overview. Crit. Rev. Anal. Chem. 2006, 36, 41–59. [Google Scholar] [CrossRef]
  76. Shanghai Municipal Peoples Government. Report of Overall Urban Planning of Shanghai (2017–2035); Shanghai Municipal Peoples Government: Shanghai, China, 2018.
Figure 1. Logic framework of this study (by author).
Heritage 08 00190 g001
Figure 2. Working experience and expertise fields of the participants. (a) Years of working. (b) Expertise fields and participants can select multiple fields (by author).
Heritage 08 00190 g002
Figure 3. Involvement with the sample projects of the participants. (a) Number of listed projects that a participant has visited. (b) Number of projects a participant has been involved in both practically and academically (by author).
Heritage 08 00190 g003
Figure 4. Familiarity with the research topic of the participants. (a) Familiarity with Shanghai industrial heritage topic. (b) Familiarity with Shanghai urban regeneration topic (by author).
Heritage 08 00190 g004
Figure 5. Location of the 14 samples (adapted by author from Google Maps).
Heritage 08 00190 g005
Figure 6. Scales of the 14 samples (adapted by author from Google Earth).
Heritage 08 00190 g006
Figure 7. Key characteristics of the 14 samples with highlighted characteristics (by author).
Heritage 08 00190 g007
Figure 8. (a) Heritage landscape preserved at Yangshupu Power Plant Park (adapted from Google Maps by author). (b) Historical photo of the power plan (https://www.thepaper.cn/newsDetail_forward_4386897, last accessed 17 November 2024). (c) Regenerated coal drop belt along the park (photo by author).
Heritage 08 00190 g008
Figure 9. (a) Heritage architecture preserved at Puxi Riverside Expo Park Area (adapted from Google Maps by author). (b) Historical translation office of the bureau (https://www.archives.sh.cn/datd/shdb/202209/t20220922_65501.html, last accessed 19 February 2025). (c) Historical head office of the bureau (http://www.heritage-architectures.com/index.php/archives/architectures/2c014, last accessed 19 April 2025).
Heritage 08 00190 g009
Figure 10. (a) Heritage structure preserved at Cloud Grain (adapted from Google Maps by author). (b) Historical photo of the group silo (https://m.thepaper.cn/newsDetail_forward_23505366, last accessed 17 November 2024). (c) Current condition of the group silo (https://m.jfdaily.com/sgh/detail?id=1256362, last accessed 17 November 2024).
Heritage 08 00190 g010
Figure 11. (a) Conserved machines at Power Plant Park (adapted from Google Maps by author). (b) Highline path through the cranes (photo by author). (c) Other equipment preserved on site (photo by author).
Heritage 08 00190 g011
Figure 12. (a) Shanghai Yangshupu Power Plant Heritage Park area (adapted from Google Maps by author). (b) Green space of Shanghai Yangshupu Heritage Park (adapted from Google Maps by author). (c) Green area in the park (photo by author).
Heritage 08 00190 g012
Figure 13. (a) Open space in Power Plant Heritage Park (adapted from Google Maps by author). (b) Bird view of the public spaces (https://www.archdaily.cn/cn/947629/shang-hai-yang-shu-pu-dian-han-yi-ji-gong-yuan-tong-ji-yuan-zuo-she-ji-gong-zuo-shi, last accessed 29 April 2025). (c) Activities in the public space (photo by author).
Heritage 08 00190 g013
Figure 14. (a) Active water frontage of Shanghai Yangshupu Power Plant (adapted from Google Maps by author). (b) Waterside pathway and open space (photo by author). (c) Waterside leisure stairs (photo by author).
Heritage 08 00190 g014
Figure 15. Integrated regression analysis between V1 (historical value) and In1 (heritage landscape), In4 (heritage machinery), and In6 (open space) (by author).
Heritage 08 00190 g015
Figure 16. Integrated regression analysis between V2 (scientific value) and In1 (heritage landscape), In4 (heritage machinery), and In6 (open space) (by author).
Heritage 08 00190 g016
Figure 17. Integrated regression analysis between V3 (socio-cultural value) and In1 (heritage landscape), In4 (heritage machinery), and In7 (active waterfront) (by author).
Heritage 08 00190 g017
Figure 18. Integrated regression analysis between V4 (aesthetic value) and In1 (heritage landscape), In4 (heritage machinery), and In6 (open space) (by author).
Heritage 08 00190 g018
Figure 19. Integrated regression analysis between V5 (economic value) and In2 (heritage architecture), In5 (greenery), and In6 (open space) (by author).
Heritage 08 00190 g019
Figure 20. Integrated regression analysis between V6 (natural value) and In1 (heritage landscape), In4 (heritage machinery), and In6 (open space) (by author).
Heritage 08 00190 g020
Figure 21. Comparison between In2 and In6. (a) Original impact trend. (b) Budget impact trend (by author).
Heritage 08 00190 g021
Table 1. Values of industrial heritage and their connotations (summarized by author from [2,24,27,28,29,30,34]).
ValuesDescription
V1—Historical ValueThe importance and usefulness of the record relating to industrial activities that are retained for the purpose of history, including both visible and invisible pieces of evidence [35].
V2—Scientific and Technological ValueThe innovation and advancement of machinery, production processes, and skills in science and technology as well as the continuous influence on the development of the industry [21].
V3—Socio-cultural ValueThe contribution to forming place identification, connecting the lifestyle of present generations with the industrial past, and providing intangible evidence for social development [36].
V4—Aesthetic ValueThe beauty of industrial architecture is appreciated as a perfect combination of function and form [37], while also existing in other derivative art forms and genres such as artworks, literature, movies and films, etc., reflecting both the rational order of industrial progress, the chaotic beauty of urban decay, and the beauty of dilapidation [38,39].
V5—Economic ValueThe benefit generated in the process of heritage-related activities, including research, conservation, regeneration, utilization, etc. [40]. One special economic factor that industrial heritage should consider is the productivity of the original function if its original industry is still functioning.
V6—Natural ValueIndustrial heritage that uses natural resources for transportation and energy may bring ecological system to the city with water features and greenery. The regeneration of industrial sites is also beneficial for reactivating environmental resilience and improving biodiversity [41].
Table 2. Value data scoring form in the questionnaire (by author).
Value CategorySample 1 Score: −100 to 100 (Integer)Sample n Score: −100 to 100 (Integer)
Value 1
Value 2
Value 3
Table 3. Questionnaires delivered affiliations and amounts (by author).
Experts’ Category AffiliationsPre-SurveyReturnScoring TableReturn
ResearchersTongji University:
The College of Architecture and Urban Planning
Department of Project Management
70645249
Shanghai University:
Fine Arts College
Real Estate College
40383127
Architects/urban plannersChina State Construction Engineering Shanghai60524438
Shanghai Academy of Urban Planning and Design40342320
Architects and urban planners from design studio 20171010
DevelopersPoly Real Estate3023119
Vanke Real Estate40312220
Consulting/investorsJLL10633
Shanghai Industrial Urban Development Group Limited10433
Government/
organization officers
Shanghai Planning & Nat Resources Bureau10887
Shanghai Tourism Administration10555
Shanghai Industrial Tourism Promotion Centre10655
Total number 350288217196
Table 4. Qualified industrial heritage quarter samples in Shanghai (by author).
No.Shanghai Industrial Heritage QuartersRegeneration Project
1Dongjiadu ShipyardFerry Waterfront
2Shanghai Shipyard—PudongShipyard 1862
3Jiangnan Machine Manufacturing Bureau (Qiuxin Machine Shipyard)Puxi Riverside Expo Park Area
4Fufeng Flour Mill
Xinhe Spinning Mill
M50 Creative Park
5Shanghai Nanpu Railway StationStation 1907
6Shanghai Municipal Council Electricity Department, Yangshupu Power PlantYangshupu Power Plant Heritage Park
7Great China Spinning Mill and Huafeng Spinning MillPeninsula 1919 Cultural and Creative Industrial Park
8Shanghai Burlap FactoryJingyuan Fashion Industry Park
The X Tower
9Shanghai No. 17 Cotton Textile FactoryInternational Fashion Centre
10Shanghai Beipiao Coal WharfXuhui West Bund Waterfront
11Shanghai Municipal Council Slaughterhouse1933 Old Millfun
12Shanghai Aircraft Manufacturing Plant (5703)West Bund Artistic Centre
Oil Tank Art Centre
13Nanmen Grain DepotCloud Grain Silo Cultural and Creative Industrial Park
14Shanghai Metallurgical Mining Machinery PlantJing’an New Business Park
Table 5. Average value scores of the 14 samples (by author).
Number and Name of the SamplesV1
Historical
V2
Scientific and Historical
V3
Socio-Cultural
V4
Aesthetical
V5
Economic
V6
Natural
1Ferry Waterfront27.38.231.227.815.242.4
2Shipyard 186269.132.367.140.972.917.8
3Puxi Expo54.962.745.849.326.312.9
4M50 Creative Park63.412.682.829.163.13.1
5Station 190757.15.155.767.567.28.4
6Yangshupu Power Plant75.766.463.381.525.784.3
7Peninsula 191949.821.233.136.440.510.2
8Jingyuan & The X6.23.727.215.151.1−2.9
9International Fashion Center37.827.124.425.876.437.1
10Xuhui Waterfront19.222.331.273.218.333.8
111933 Old Millfun26.33.338.746.213.7−1.1
12West Bund & Oil Tank14.310.621.227.424.13.1
13Cloud Grain Silo52.723.441.161.957.221.4
14Jing’an New Business44.119.143.434.339.218.8
Table 6. Original data of the indicators (by author).
No.SampleIn1In2In3In4In5In6In7
1Ferry Waterfront0.12185900.1300.3008530.2596970.305806
2Shipyard 18620.2123590.85010.2694870.1922820.387892
3Puxi Riverside 0.1797510.8500.0204180.3425010.276923
4M50 Creative Park01100.0964920.019180.218459
5Station 19070.07698210.631−0.096310.0467540
6Yangshupu Power0.4428830.20.5140.3369730.5094090.523729
7Peninsula 191901120.0114290.0050430
8Jingyuan Fashion01000.0262950.0216330.045093
9International Fash01000.0103590.1064960.215
10Xuhui West Bund0.0149800.8340.3199680.2021190.450658
111933 Old Millfun0100000
12West Bund Artistic0.07940100.7100.0535070.0237330.152889
13Cloud Grain Silo0110−0.026960.0446040
14Jing’an New010.2500.0334720.0256720
Table 7. Correlation coefficient between indicators and values. For each value, highlighted indicators are the three ones with largest absolute correlation coefficient, which will be selected for further analysis (by author).
ValueIn1In2In3In4In5In6In7
V10.542390.299410.277250.407590.106350.400050.25758
V20.74328−0.080210.208420.611810.345340.816950.60784
V30.39660.261450.205880.276270.184330.227430.2658
V40.48312−0.226270.37390.664430.269850.512510.36045
V5−0.18230.60744−0.07331−0.24795−0.34981−0.31995−0.20005
V60.69941−0.50987−0.074690.804380.673430.808620.69893
Disclaimer/Publisher’s Note: The statements, opinions and data contained in all publications are solely those of the individual author(s) and contributor(s) and not of MDPI and/or the editor(s). MDPI and/or the editor(s) disclaim responsibility for any injury to people or property resulting from any ideas, methods, instructions or products referred to in the content.

