Article

Site Characterization of the Palencia Cathedral (Spain): Origin of Recurrent Phreatic Floods in the Crypt of San Antolín

by
Mariano Yenes
1,*,
Puy Ayarza
1,
Yolanda Sánchez-Sánchez
1,
Javier Elez
1,
Imma Palomeras
2,
Soledad García-Morales
3,
Javier Ayarza
1,
Laura Yenes
4,
Alberto Santamaría-Barragán
5,
Esther Rodríguez-Jiménez
6,
Laura Llera
7 and
Juan Gómez-Barreiro
1
1
Departamento de Geología, Universidad de Salamanca, 37008 Salamanca, Spain
2
GEO3BCN, CSIC, Lluís Solé Sabarís s/n, 08028 Barcelona, Spain
3
Departamento de Construcción y Tecnologías Arquitectónicas, Universidad Politécnica de Madrid, 28040 Madrid, Spain
4
Departamento de Física, Universidad de Burgos, 09001 Burgos, Spain
5
Centro de Estudios y Experimentación de Obras Públicas (CEDEX), Laboratorio de Geotecnia, 28014 Madrid, Spain
6
Confederación Hidrográfica del Duero, 37007 Salamanca, Spain
7
Afesa Medio Ambiente, 48160 San Esteban Derio, Spain
*
Author to whom correspondence should be addressed.
Heritage 2025, 8(5), 169; https://doi.org/10.3390/heritage8050169
Submission received: 17 March 2025 / Revised: 24 April 2025 / Accepted: 6 May 2025 / Published: 12 May 2025
(This article belongs to the Special Issue Geological Hazards and Heritage Safeguard)

Abstract

:
Below the central nave of the Gothic Cathedral of Palencia (14th to 16th centuries) lies the Crypt of San Antolín, which represents the remains of a Visigothic building from the mid-7th century. The crypt itself has suffered recurrent episodes of flooding over the centuries. However, the latest flooding, which began in mid-2021 and ended in mid-2023, is one of the most long-lasting episodes on the historical record. To establish the origin of these flooding episodes, the geological and hydrological properties of the subsoil have been determined by direct prospecting techniques (drilling) and indirect geophysical techniques (Electrical Resistivity Tomography). The prospecting has determined that the aquifer in the area has a basin-like geometry, which favors the accumulation of water below the crypt. This work has shown that the recurrent floods suffered by the crypt prior to 2021 are related to episodes of intense rainfall. However, after 2021, there is a direct relationship between the persistent flooding and the onset of landscaping at the Plaza de San Antolín, one of the squares near the cathedral. In addition, previous archaeological excavations carried out in 1965 in that same square had disrupted the stratigraphic column, easing the percolation of water. We conclude that the increase in landscaped areas in archaeological environments may modify the hydrogeological dynamics of the subsoil and affect the surrounding buildings.

1. Introduction

The conservation and protection of significant historical buildings, including cathedrals, encompasses cultural, social, economic, administrative, and technical aspects. Among the latter, it is essential to highlight the knowledge of the geological substrate on which these buildings are founded. This requires the correct definition of site conditions (i.e., subsurface model), including the investigation and characterization of both the buried anthropic structures (foundation) and the subsurface geology [1,2]. Site characterization is the process of developing an understanding of the geologic, hydrologic, and engineering properties at the site, including the soil, underground rocks along with groundwater flows, and in many cases, man-modified subsurface settings that can affect site conditions [3]. For such a purpose, both direct (drilling) and indirect (geophysics) methods can be applied.
In addition to the geological-geotechnical properties of the substrate on which architectural heritage is founded, it is also necessary to understand the modifications of the geological environment that have occurred from the time of the construction to the present, as these changes can influence the conservation and stability of the buildings. These changes may result from both natural phenomena (floods, earthquakes, landslides, etc.) and anthropogenic activities, since architectural heritage is often located in urban environments where subsurface interventions are constant [4,5].
In many cases, significant historical buildings are constructed on the remains of previous structures. This is particularly true in ancient urban areas with archaeological remains located in zones of persistent urbanization [6,7,8]. These are areas where human settlements have developed in a specific geographical location for centuries, generally due to some favorable circumstances of the environment, such as elevated position, abundance of water, easy access to other natural resources, etc.
One such example (Figure 1) is the Palencia Cathedral (Spain). The construction of this gothic cathedral took place from the 14th to the 16th century, although the oldest vestiges of its origin are found in the Crypt of San Antolín, which are the remains of a Visigothic building from the mid-7th century. In fact, the Visigothic Kingdom counts for a significant presence in the Iberian Peninsula from the 5th to the 8th centuries.
The Crypt of San Antolín is currently located 4.40 m below the level of the central nave of the cathedral (Figure 1C). The crypt preserves, in front of the access staircase, a well with a curbstone that provides access to the aquifer located below the cathedral. This configuration indicates that the setting of this cathedral was originally linked to the access to the water table in the area. Thus, the Crypt of San Antolín has been possibly used since its origin as a water source.
Unfortunately, this proximity of the building to the water table implies some pathologies in its conservation. In fact, humidity mainly produced by capillarity from the substrate is observed in several of its walls. Furthermore, water, as an alteration agent, promotes the appearance of biological colonization and the precipitation of saline efflorescence in wet areas, affecting the overall conservation of the monument. These problems are particularly worrying at the San Antolín Crypt, which has experienced recurrent flooding episodes over the centuries coinciding with periods of heavy rain. The most recent of them began in mid-2021 and ended in mid-2023, being one of the longest episodes on record. However, this episode did not match that of seasonal rains, raising questions about its origin.
In this study, the geological and hydrological properties of the subsoil on which the Cathedral of Palencia is founded will be determined. This will allow for the identification of the causes of the recurrent flooding that has historically affected the San Antolín Crypt, and most importantly the cause of the latest, continuous floods that have even hindered its access since 2021 to 2023. Finally, we will propose some methods of prediction and prevention to avoid or mitigate these events in the future.

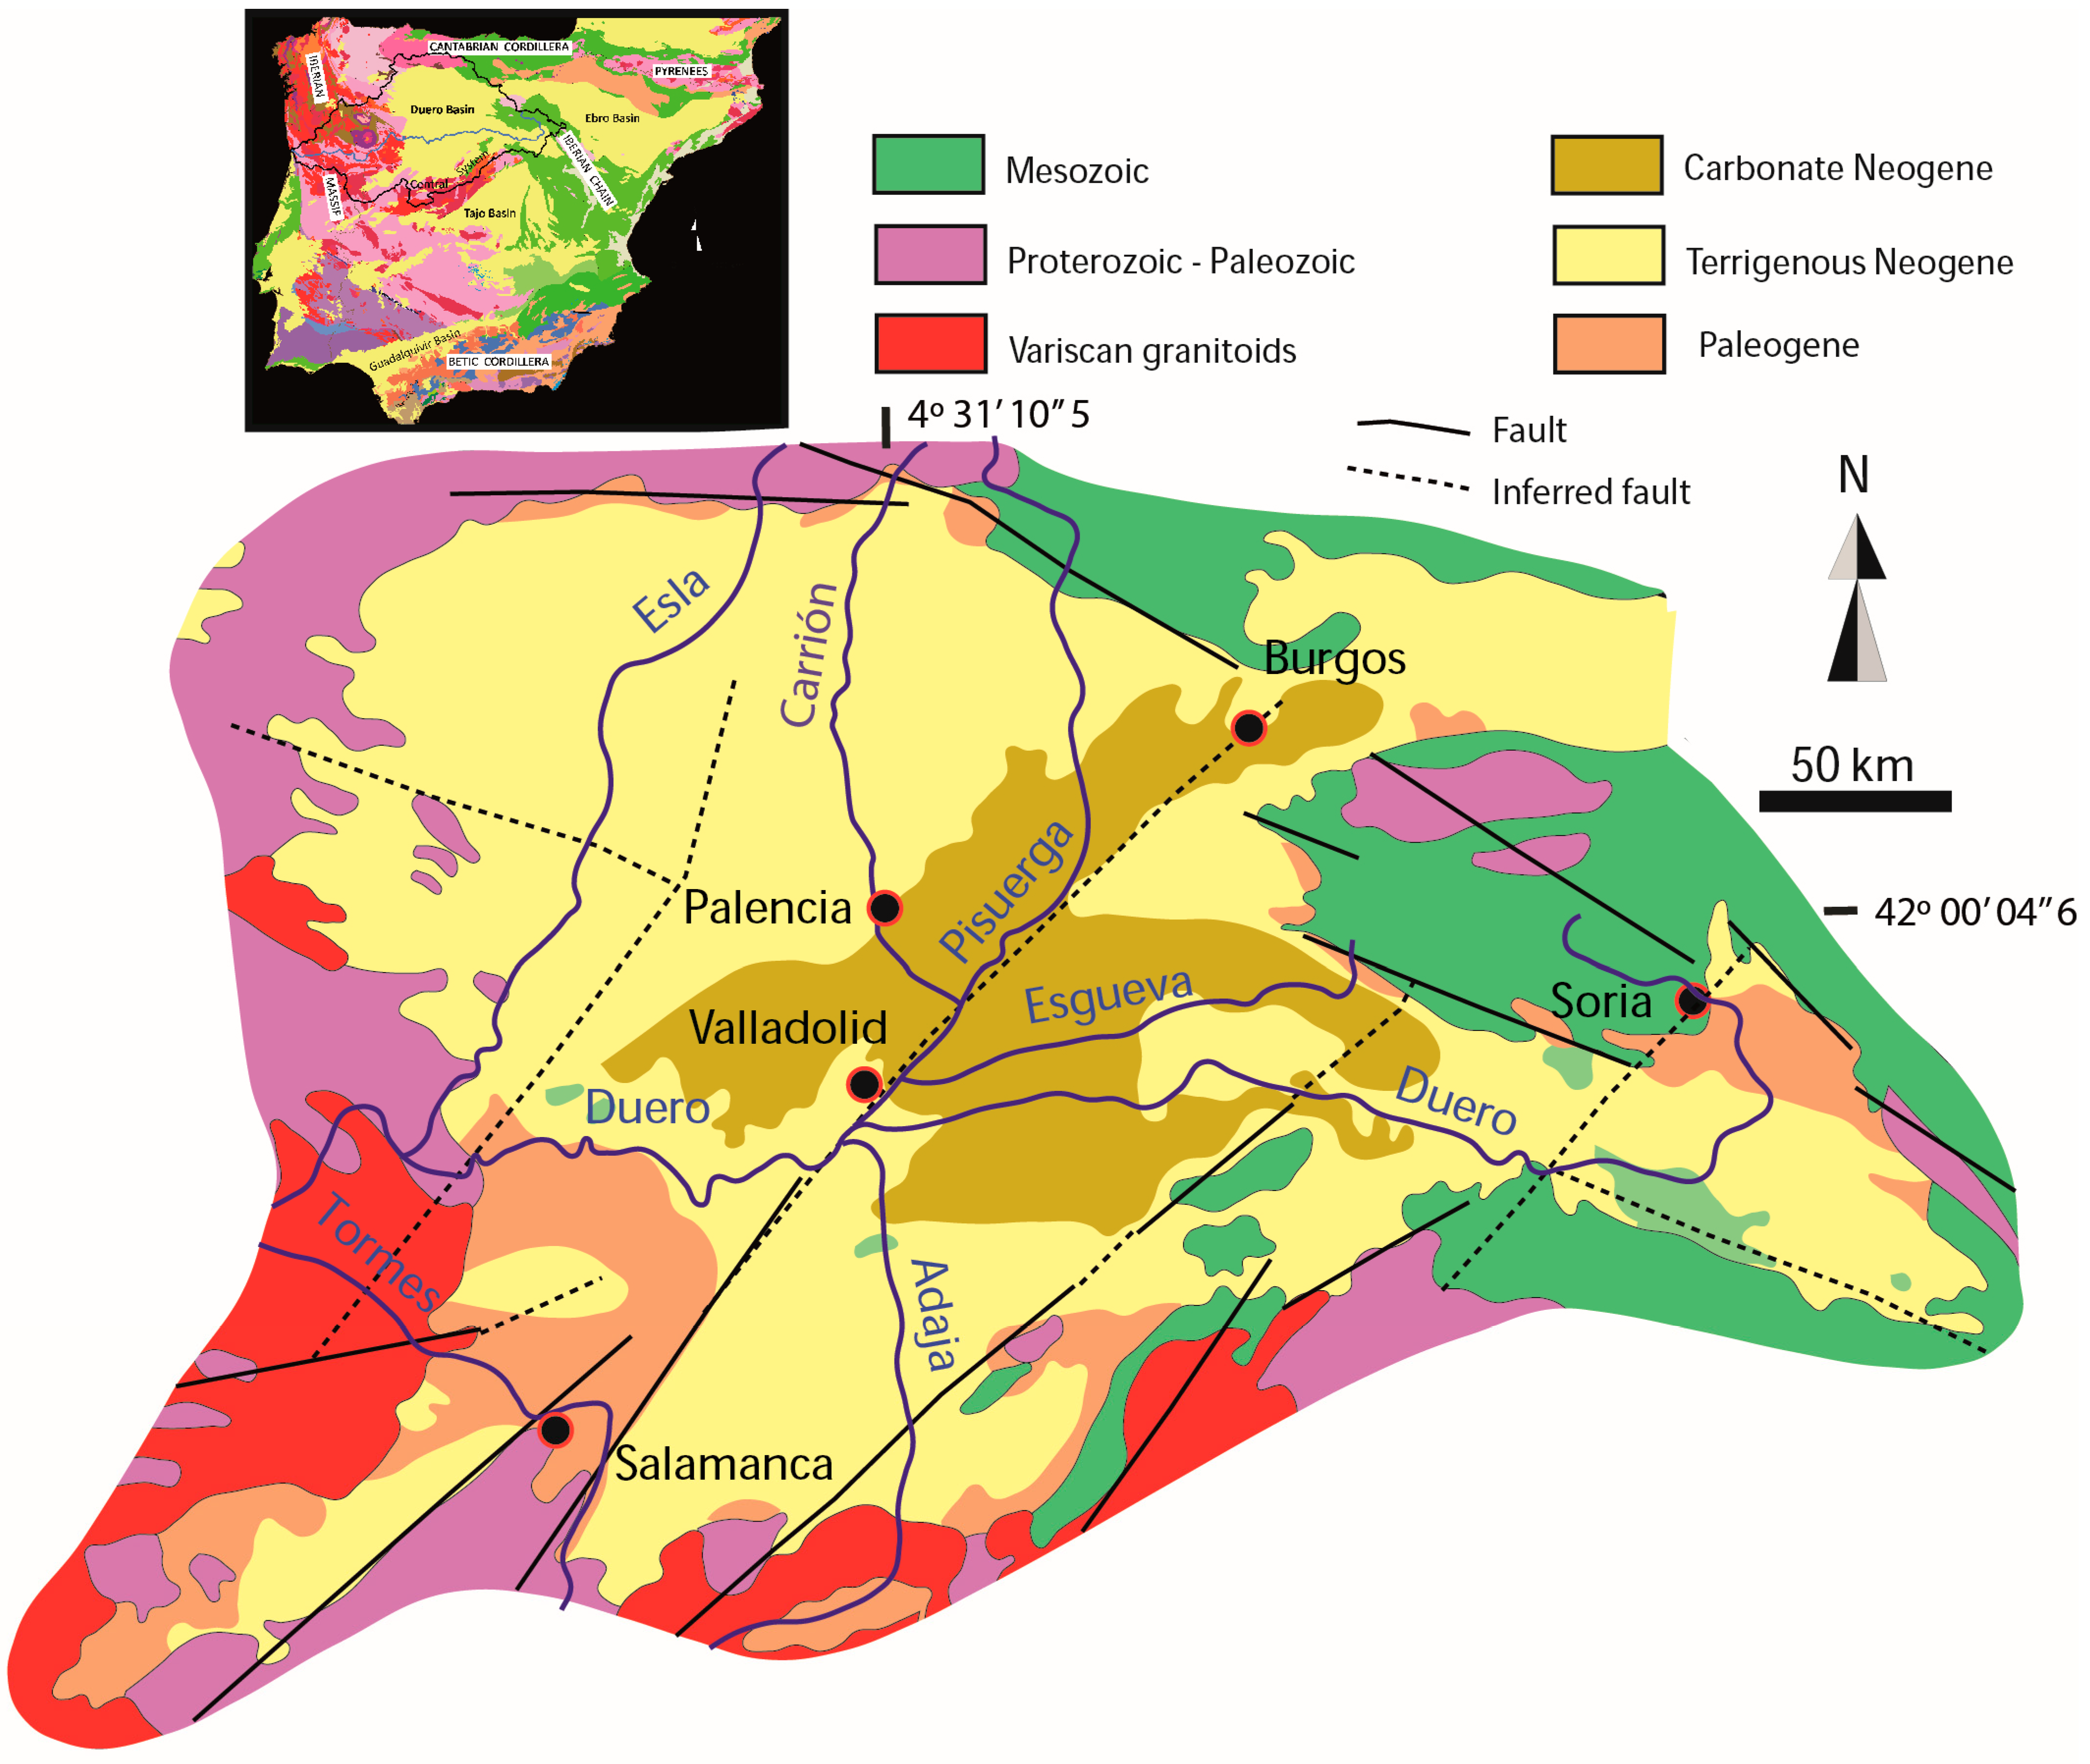
2. Geological Setting

From a geological point of view, Palencia is located in the central part of the Cenozoic Duero Basin (CDB), the largest sedimentary basin on the Iberian Peninsula, featuring ~50,000 km2 in sediment-covered area and 90,400 km2 in total catchment area [9] (Figure 2).
At the center of the CDB, the lithostratigraphic units, from bottom to top, are as follows [9,10]:
(1)
The Dueñas Unit (Lower–Middle Miocene), which outcrops between 700 m a.s.l (riverbed) and 750–760 m a.s.l. It has a visible thickness of 50–60 m since its lowest part does not crop out in the area. Levels of clays, marly clays, marls, and macrocrystalline gypsum are the predominant lithologies. Within the clay levels, smectite and illite are the most abundant minerals, with kaolinite and palygorskite in lower proportions. These materials were formed under lacustrine and palustrine environments.
(2)
The Tierra de Campos Unit (Middle Miocene) comprises silts, sands, and clays, with some sandy and gravelly beds. Their ochre color is easily recognizable between the grey, green, and white colors of the other lithologies. In the central part of the CDB, this unit has a thickness of 30 m, decreasing towards the margins. The clay content is very low, with a predominance of illite and kaolinite, as well as some traces of chlorite. In the sandy levels, quartz and feldspar are dominant. The carbonate content is below 10%, in contrast with the 40–50% found in the other lithologies. This unit is interpreted as an expansion of fluvial sediments over lacustrine deposits.
(3)
The Cuestas Unit (Middle–Upper Miocene) was deposited in a dry/saline mud flat–ephemeral saline lake system, and contains marls, marly clays, gypsum, limestones and dolostones, reaching a thickness of more than 80 m. Organic matter levels are frequent in the transition zone with the Tierra de Campos Unit.
(4)
Quaternary deposits are restricted to large-scale alluvial deposits and fluvial terraces, which may lie between 5 and 180 m above the present thalweg [11].
The present geomorphological configuration of CDB responds to the opening of the previous endorheic basin, which had been dated to occur in the Pleistocene [11]. This triggered the incision of the fluvial network. The transition to the valleys occurs through the Cuestas Unit slopes.
Figure 2. Geological map of the Cenozoic Duero Basin (CDB) (modified from [12]).
Heritage 08 00169 g002
The subsoil geology in the area closest to the Palencia Cathedral is shown in two geological cross-sections in Figure 3. The most recent Miocene materials, belonging to the Cuestas Unit, crop out around the Cerro del Otero, north of the city. To the south, the underlying materials crop out. These consist of a terrigenous unit belonging to the Tierra de Campos Unit. Further south, the historic center of the city is situated on a high terrace from the Middle Pleistocene, mainly composed of gravel with quartzite and sandstone pebbles. This part of the terrace system was deposited by the Carrión River throughout its evolution and entrenchment. The terrace deposits rest on the older Miocene materials of the area, which are marl levels with intercalated clay levels from the Dueñas Unit. This arrangement creates a perched aquifer in the more permeable terrace levels, which is limited at the bottom by the more impermeable materials of the Dueñas Unit.
The Cathedral of Palencia is located some 150 m to the northeast of the Carrión River and sits on one of its 20 terrace levels described in the area, specifically on level QT12 [13], which features an average height above the river between 10 and 15 m. Generally, this terrace is composed of quartzite and some sandstone pebbles, with a silty–sandy matrix; in some levels, limestone pebbles appear in proportions below 10%. The thickness of these terrace levels ranges between 1 and 4 m.

3. Materials and Methods

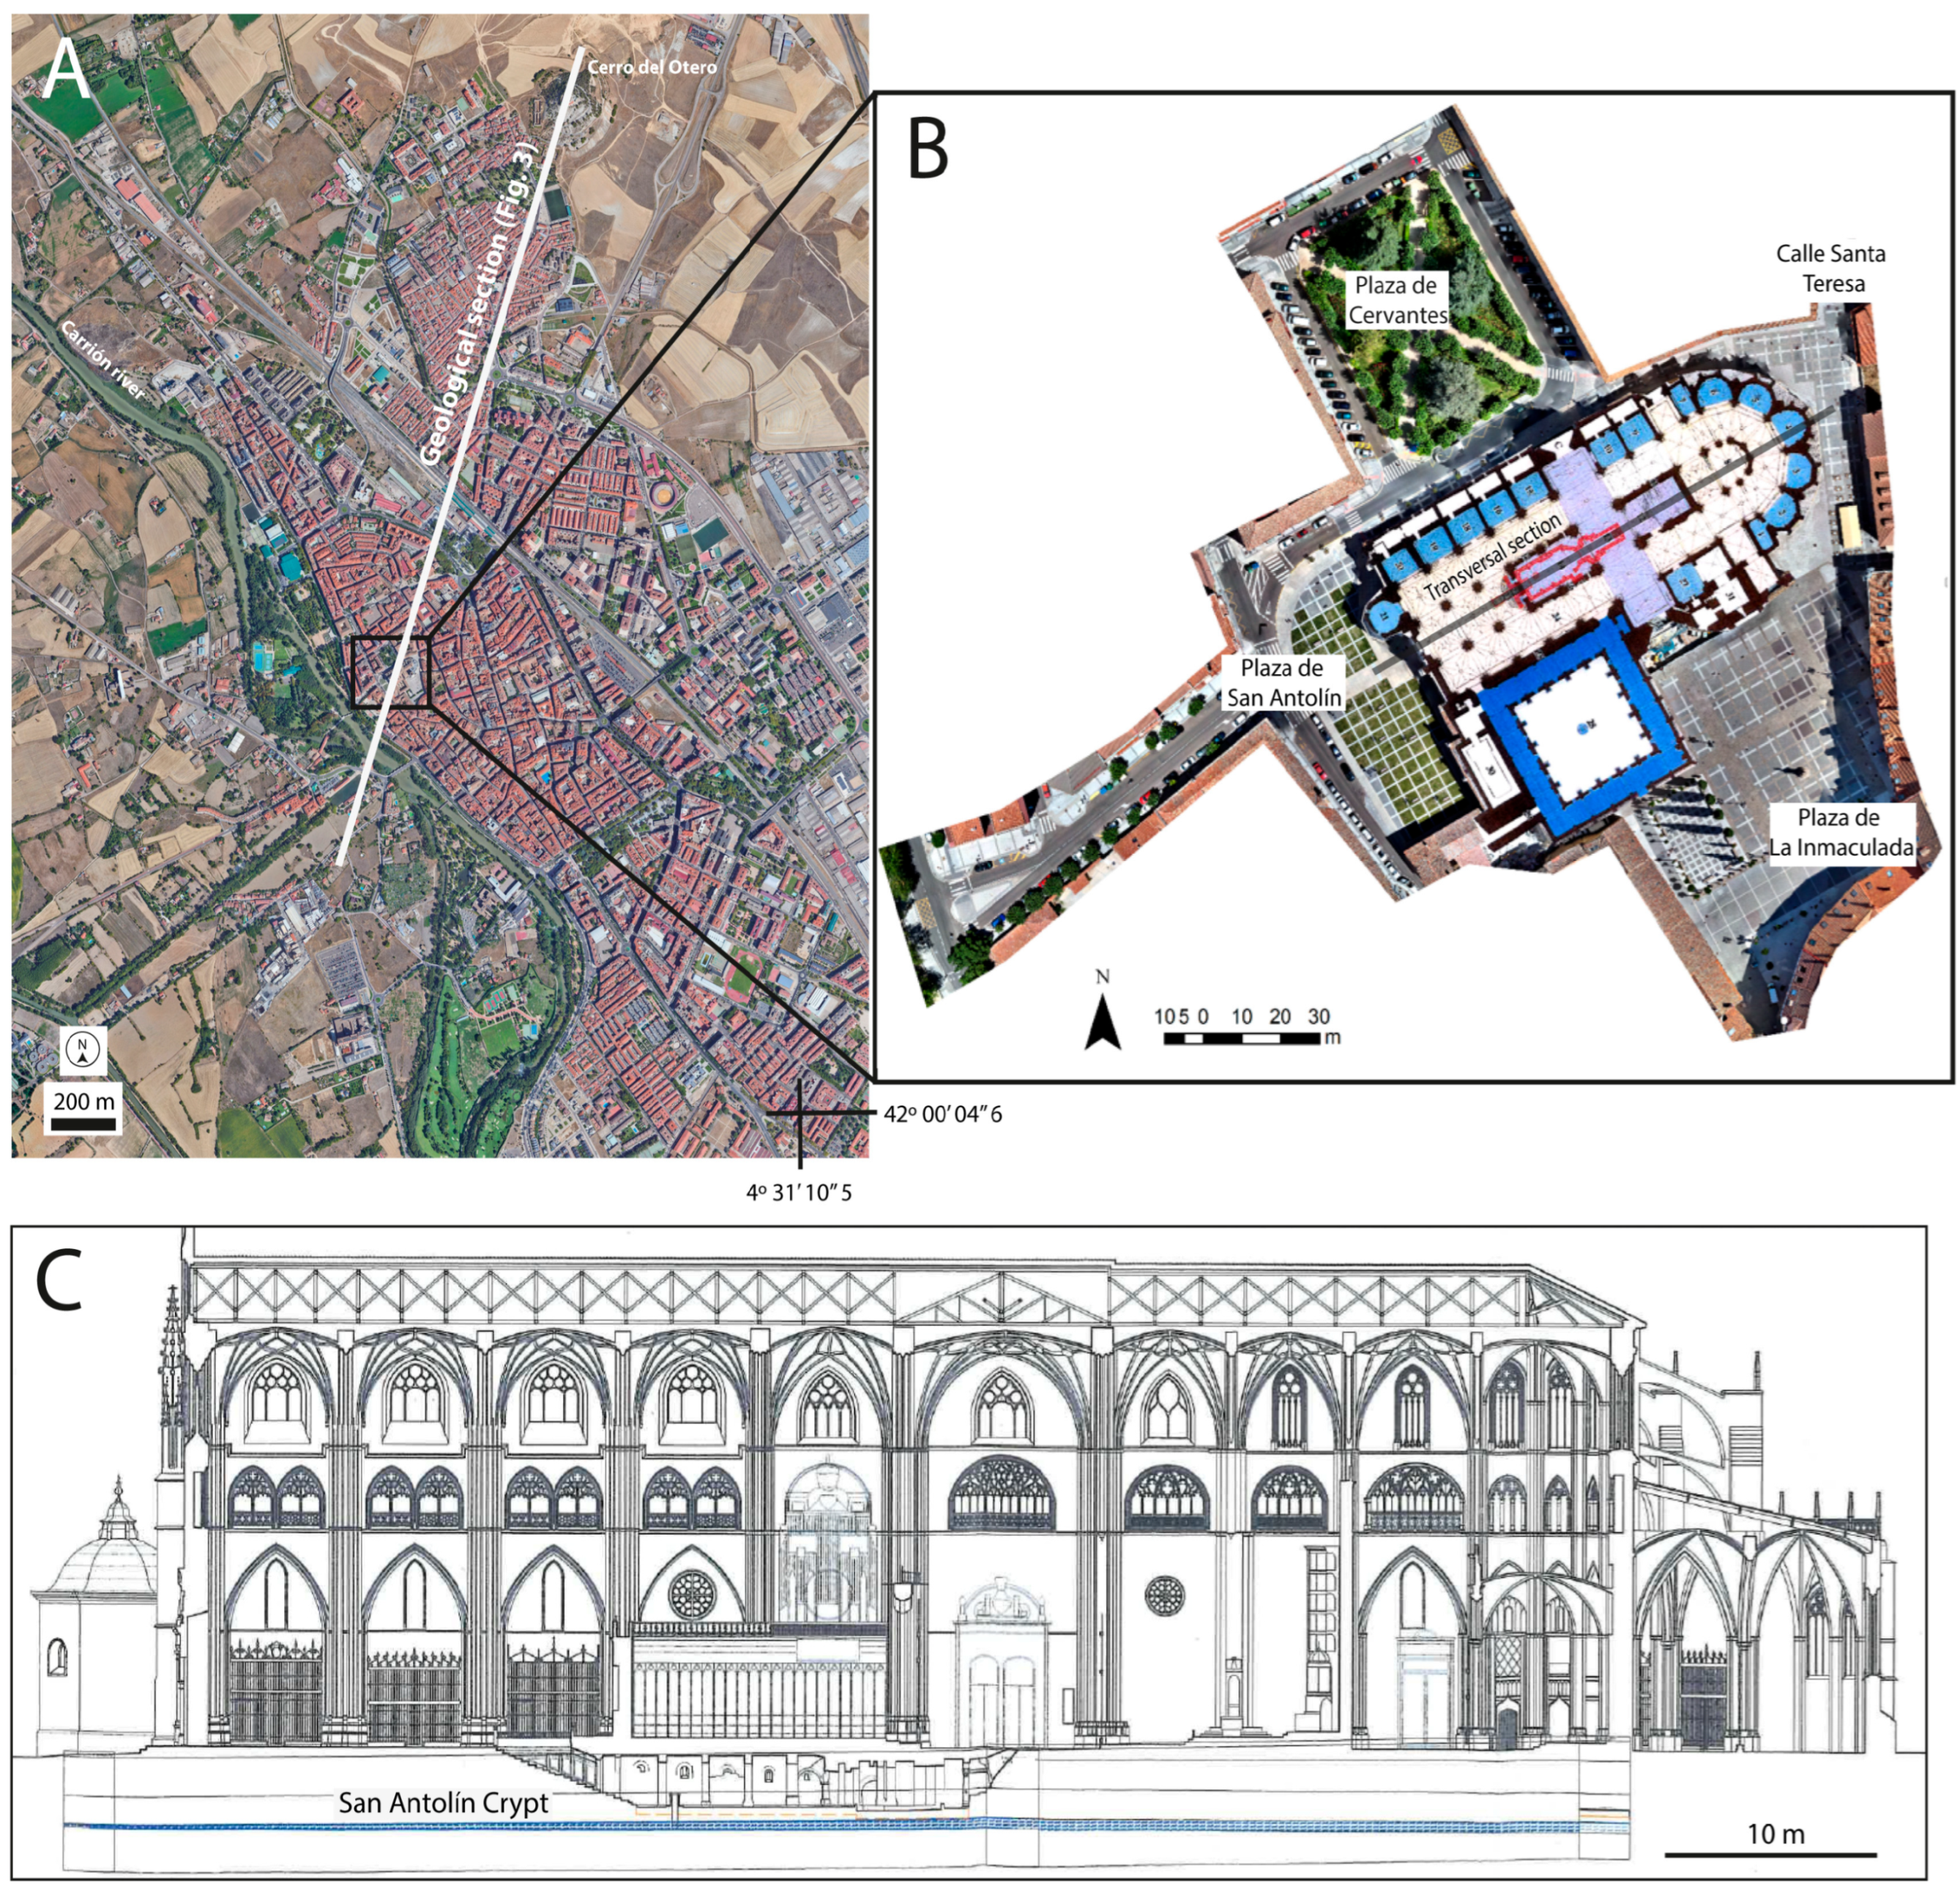
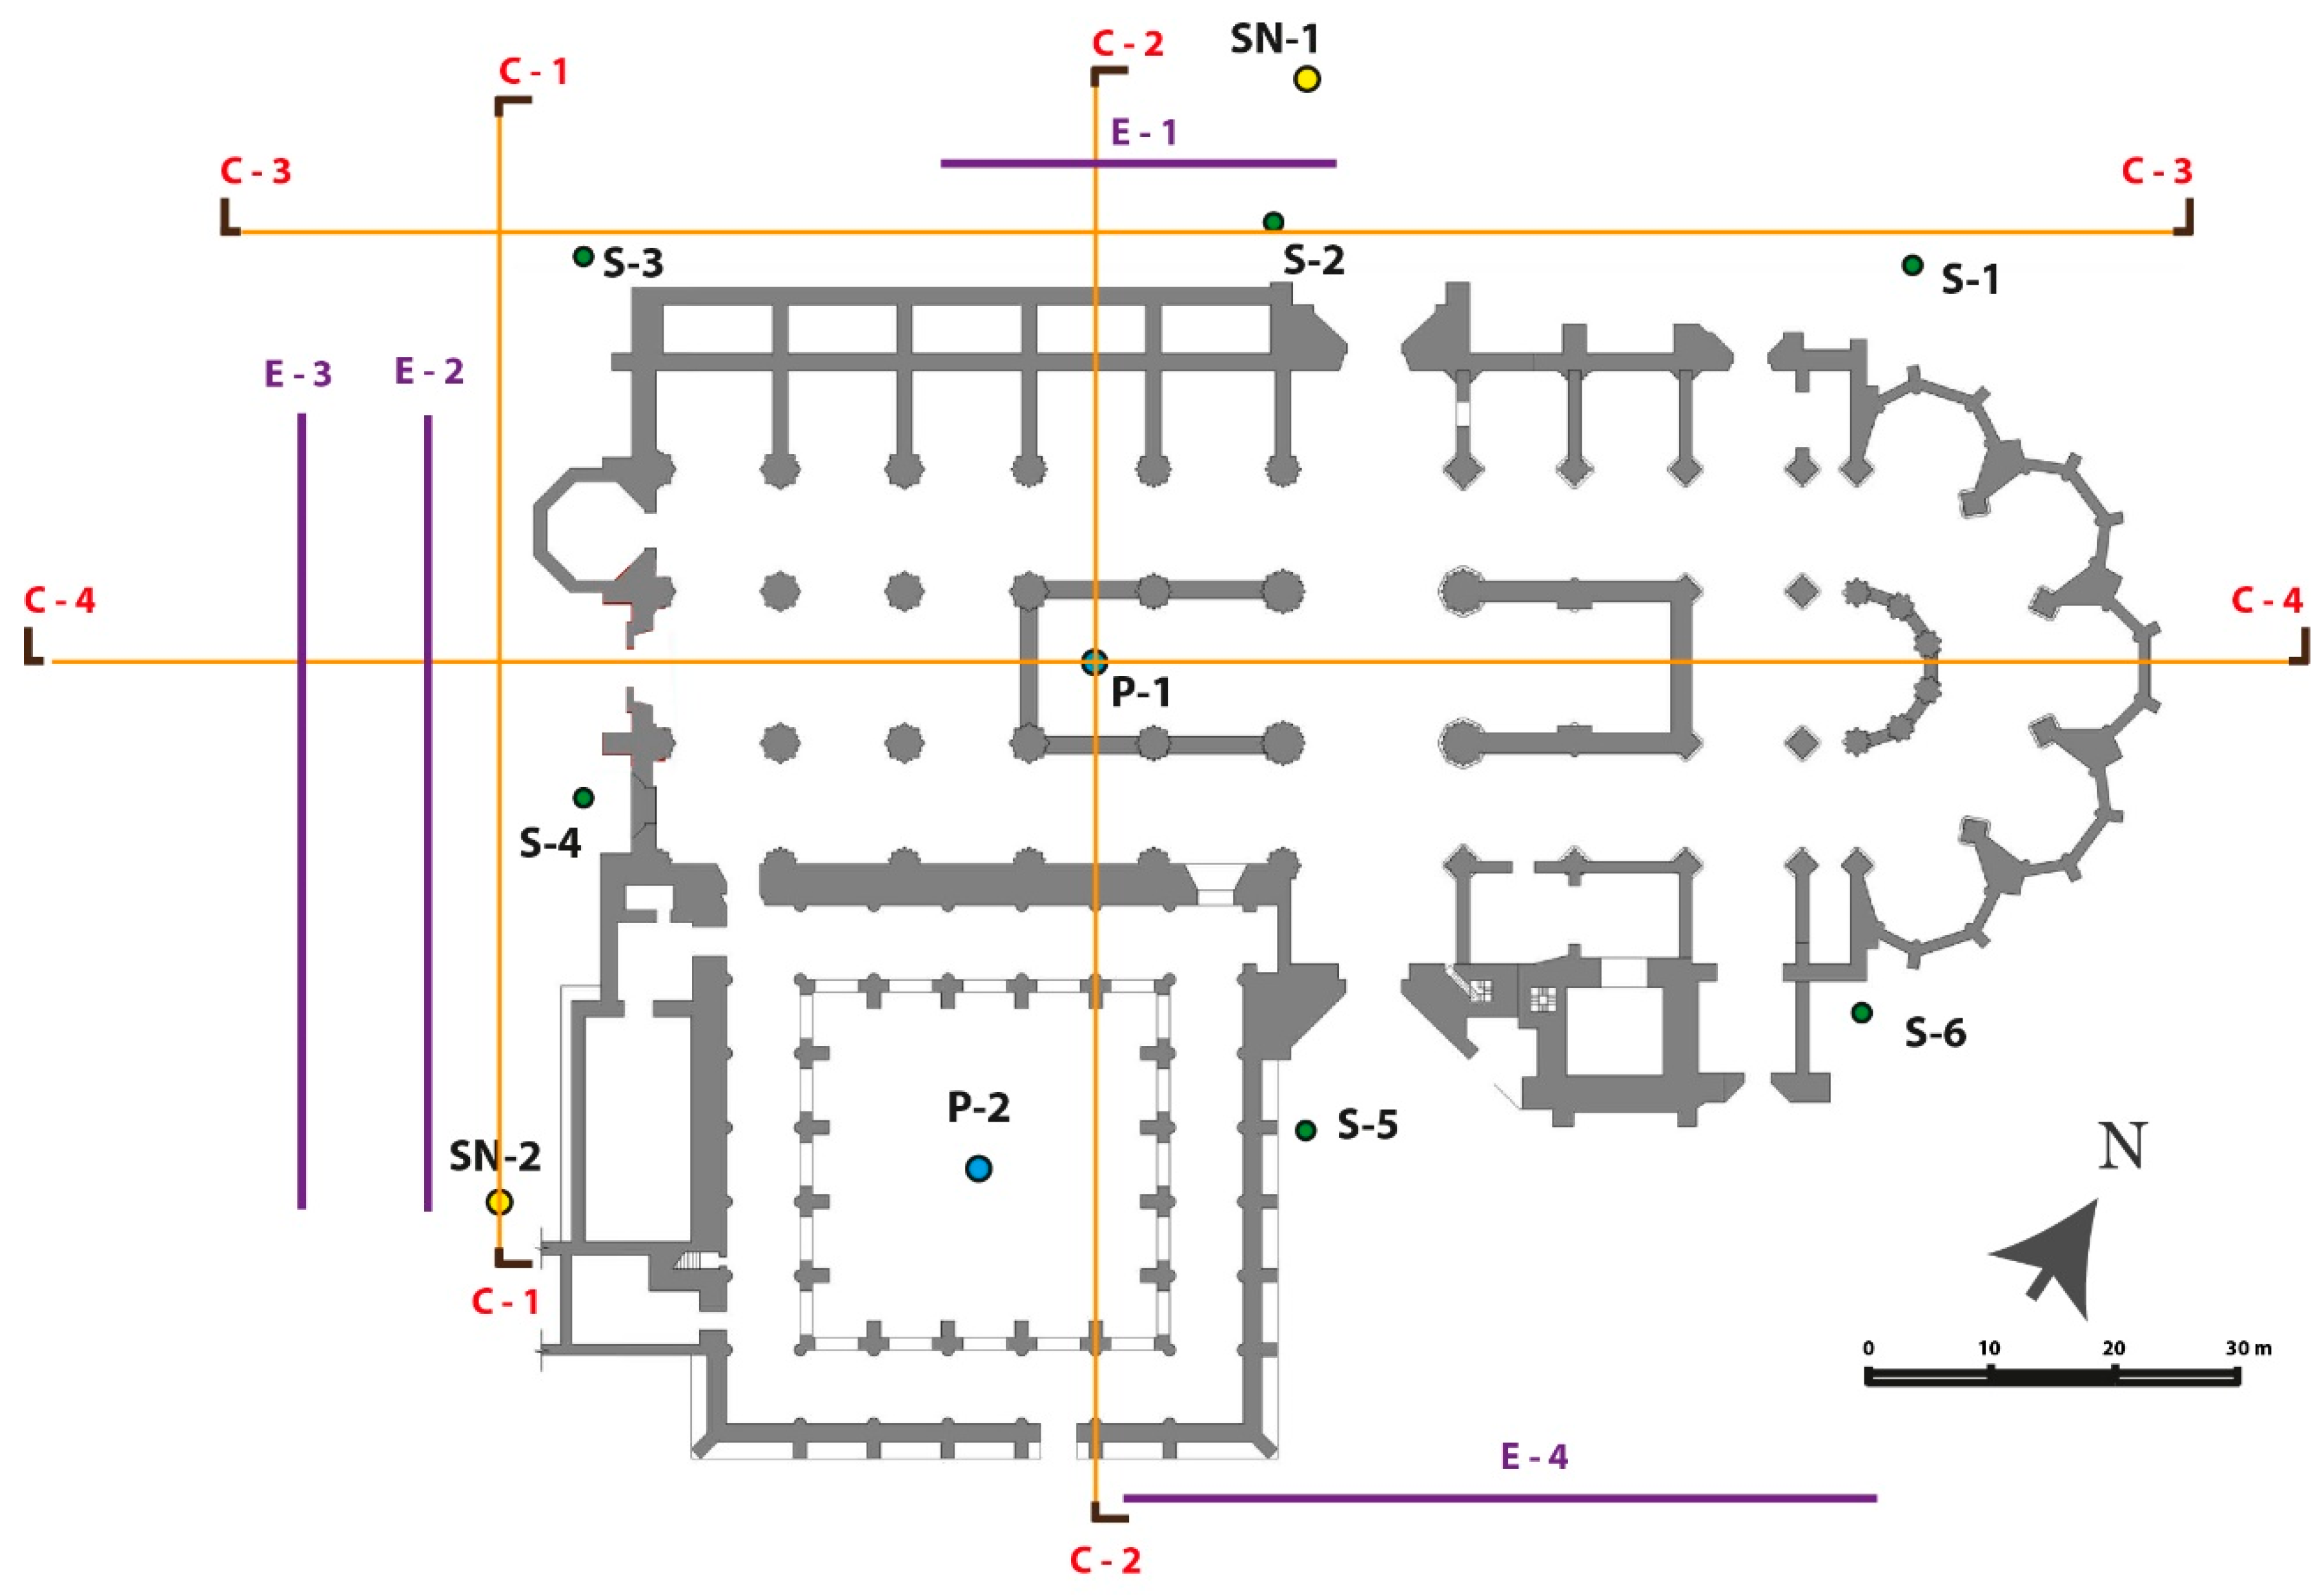
3.1. Topographic Mapping

A high-resolution map of the topography around the cathedral was obtained using images recorded by a remotely piloted aircraft (RPA) DJI Mavic 3T Enterprise, with an airborne RGB (Red, Green, Blue) Hasselblad camera equipped with a 1/2” CMOS sensor, an 84° FOV lens, and an aperture range of 2.8–11. To create the map, 12 flight plans were carried out, and 1543 images were taken. The flight altitude was kept constant at 40 m. To adjust the position of the images, 55 ground control points were taken with a Leica RTK FLX100 GPS. This receiver connects to the National Geodetic Reference Network of Permanent GNSS Stations (ERGNSS) for instant topographic correction, allowing a real-time planimetric accuracy of 2 cm and altimetric accuracy of 3 cm. Coordinate processing was carried out with ArcGIS Desktop (Version 10.8), utilizing the projected coordinate system ETRS89-UTM Zone 30. Image processing involving the alignment, orientation, scaling, and generation of point-cloud models and orthophotographs was performed with AgiSoft PhotoScan Standard (Version 2.1.1).

3.2. Geological-Geotechnical Prospections

To determine the subsoil stratigraphy and monitor the position and evolution of the water table, 8 rotary drilling boreholes with continuous core recovery were created outside the cathedral (Figure 4): S-1 to S-6 were created in a project carried out in 2003, while the boreholes SN-1 and SN-2 were created in 2023. Lefranc permeability tests were performed in boreholes SN-1 and SN-2 to determine the permeability coefficient of the sampled materials. All boreholes reached an approximate depth of 7 m, and once completed they were lined with piezometric tubing to monitor the variation in the water table levels over time. Additionally, the variations in the water table level were also monitored in the well of the San Antolín Crypt (P-1) and in a well located in the cloister of the Cathedral (P-2) (Figure 4).
To determine the stratigraphic disposition of the materials in the subsoil of the cathedral, four geological sections were made: C-1 to C-4 (Figure 4). The topographic base of the sections was obtained from the DTM carried out in this work.

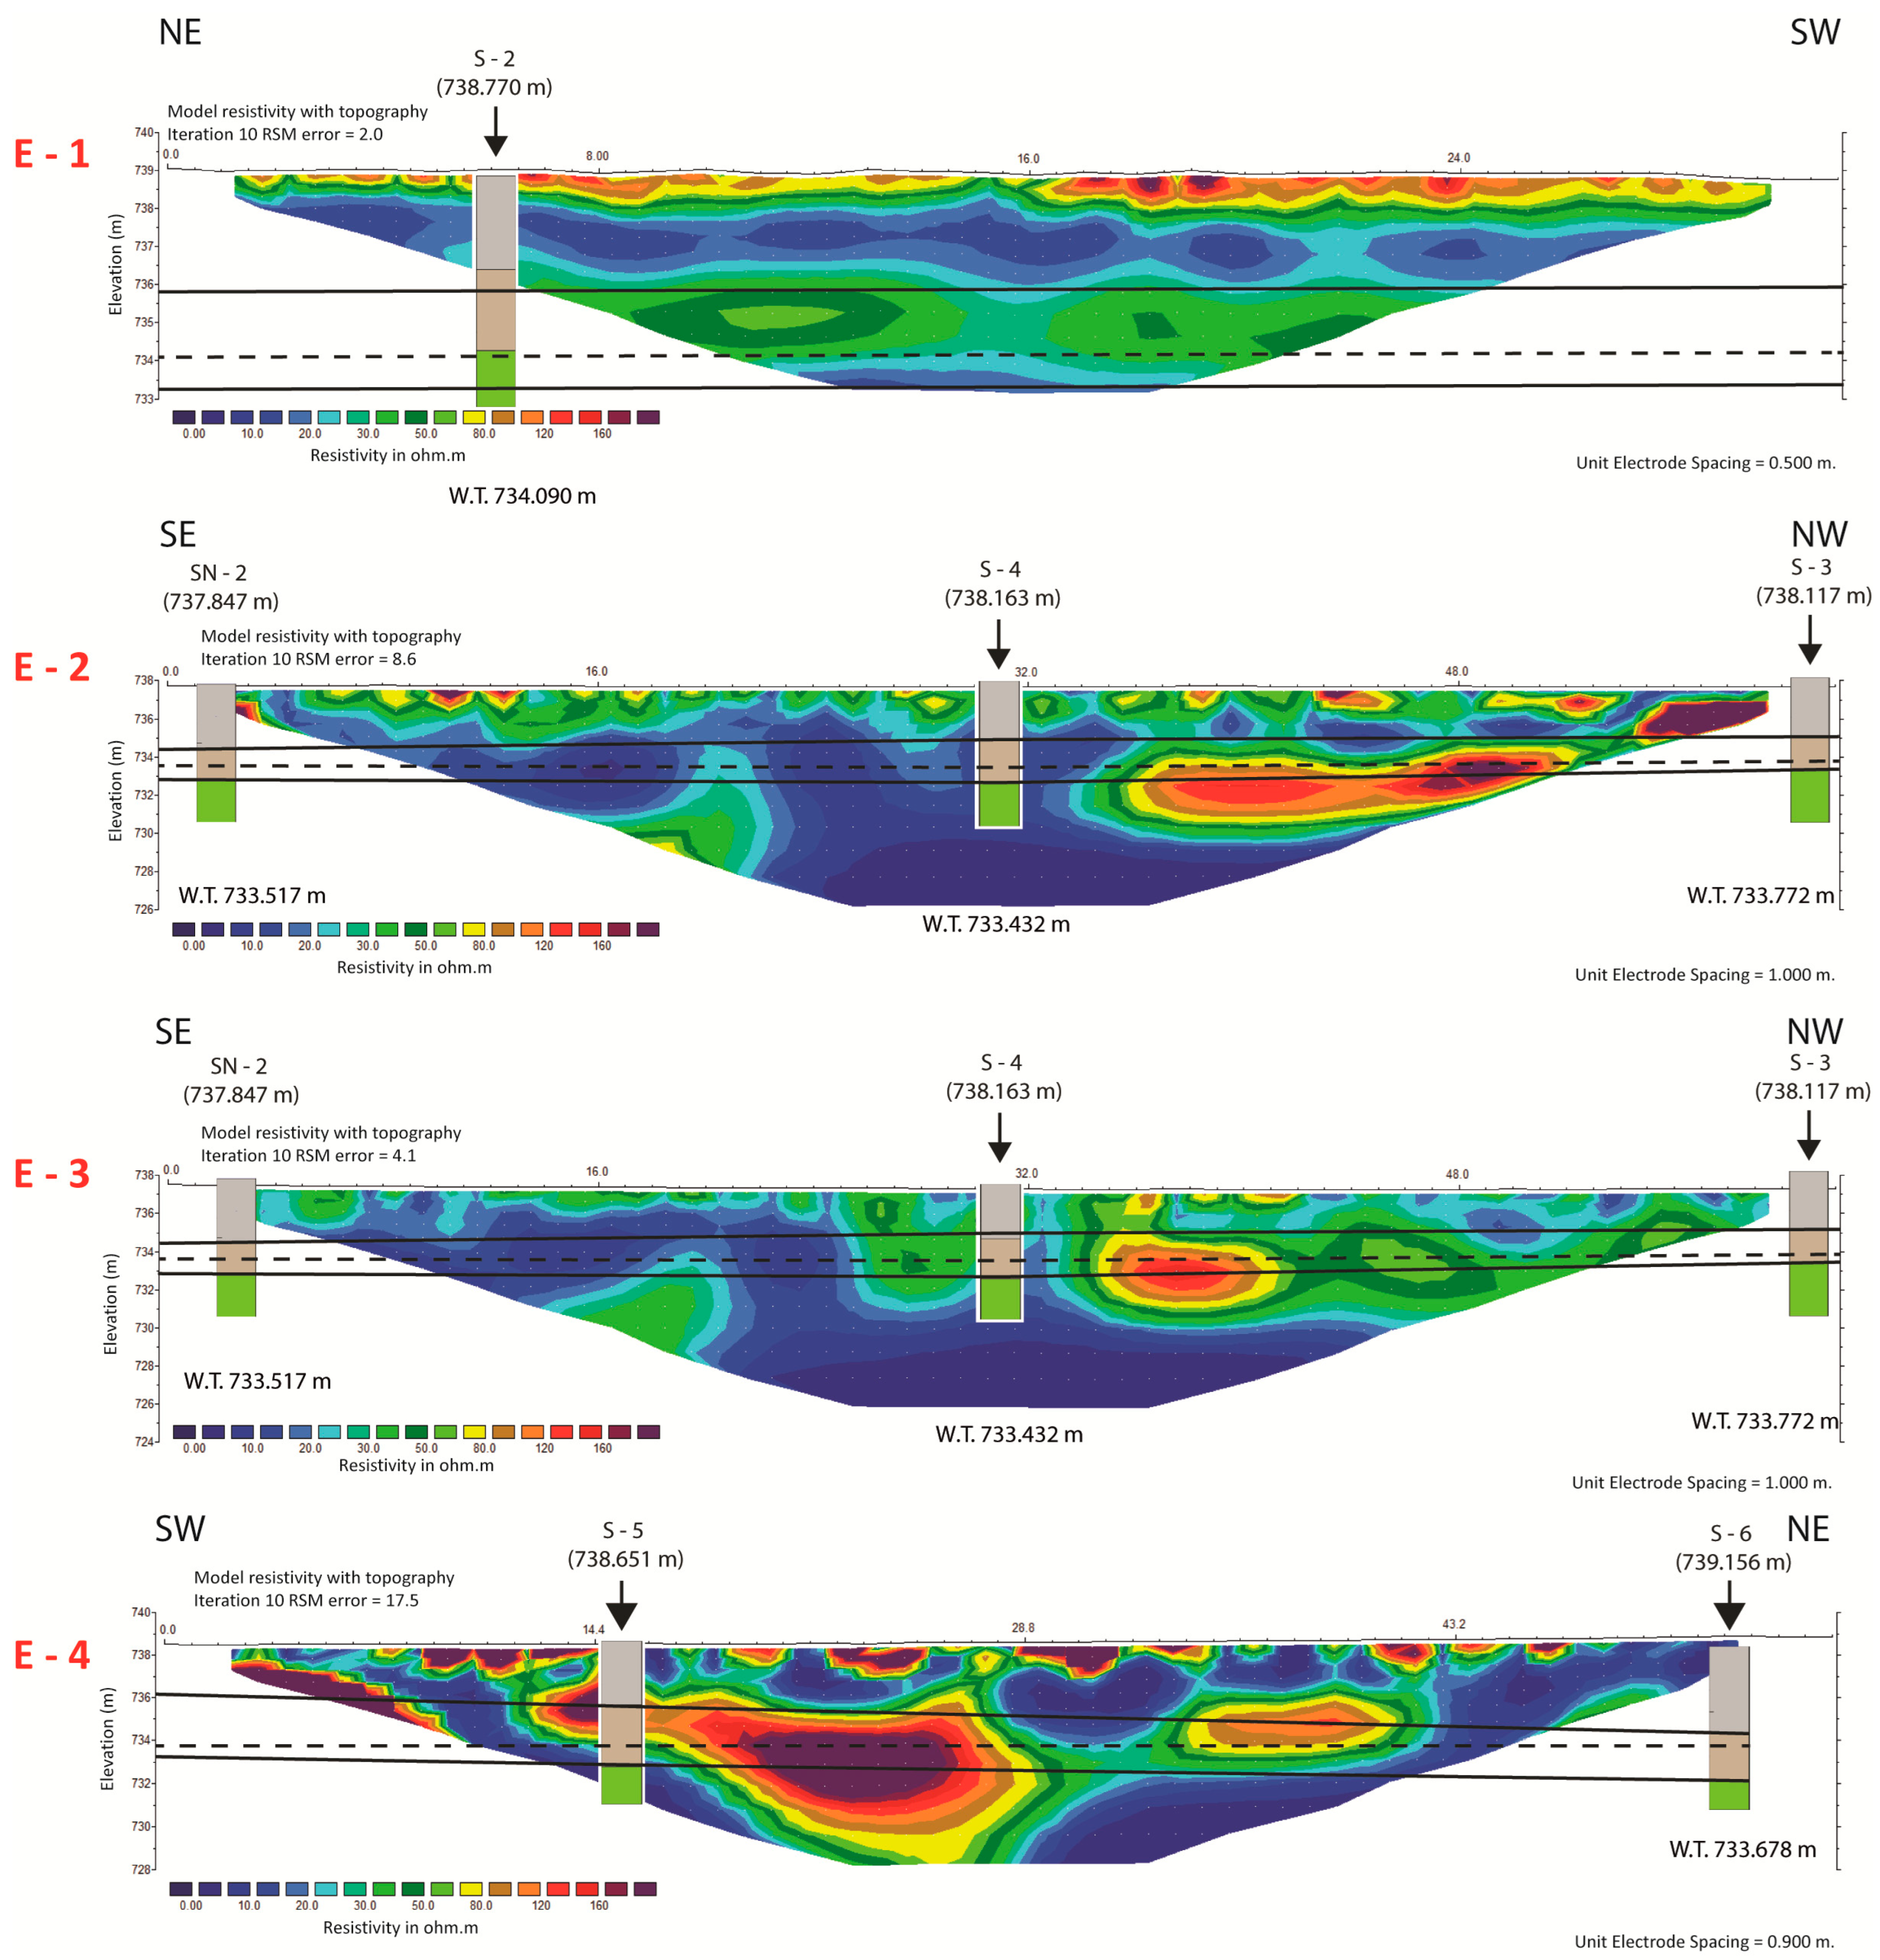
3.3. Electrical Resistivity Tomography (ERT)

Four electrical resistivity profiles were acquired to further study the geometry and depth of underground layers and to determine their degree of saturation (Figure 4). The first was conducted in Plaza de Cervantes, partially coinciding with geological cross-section C-3. In Plaza de San Antolín, two parallel profiles were obtained, partially coinciding with geological cross-section C-1. Finally, a final profile was obtained in Plaza de la Inmaculada. The characteristics of these sections are summarized in Table 1.
The equipment used was a multi-electrode PASI 16SG24 device. All profiles were acquired with two configurations: (I) Wenner, with electrodes spacing between 1 and 2 m (155 measurements for the case of 32 electrodes); and (II) Schlumberger, with current electrodes increasing the distance while potential electrodes remained at a fixed (1–2 m) distance (225 measurements). The results of both configurations were integrated and jointly inverted. This approach provides 2D models that reach deeper levels and have additional information in those areas located in between drillholes, thus improving the final model constraints. Data processing and modelling were performed using the RES2DINV program (Rapid 2D Resistivity and IP Inversion).

4. Characterization of the Problem and Results of the Investigation

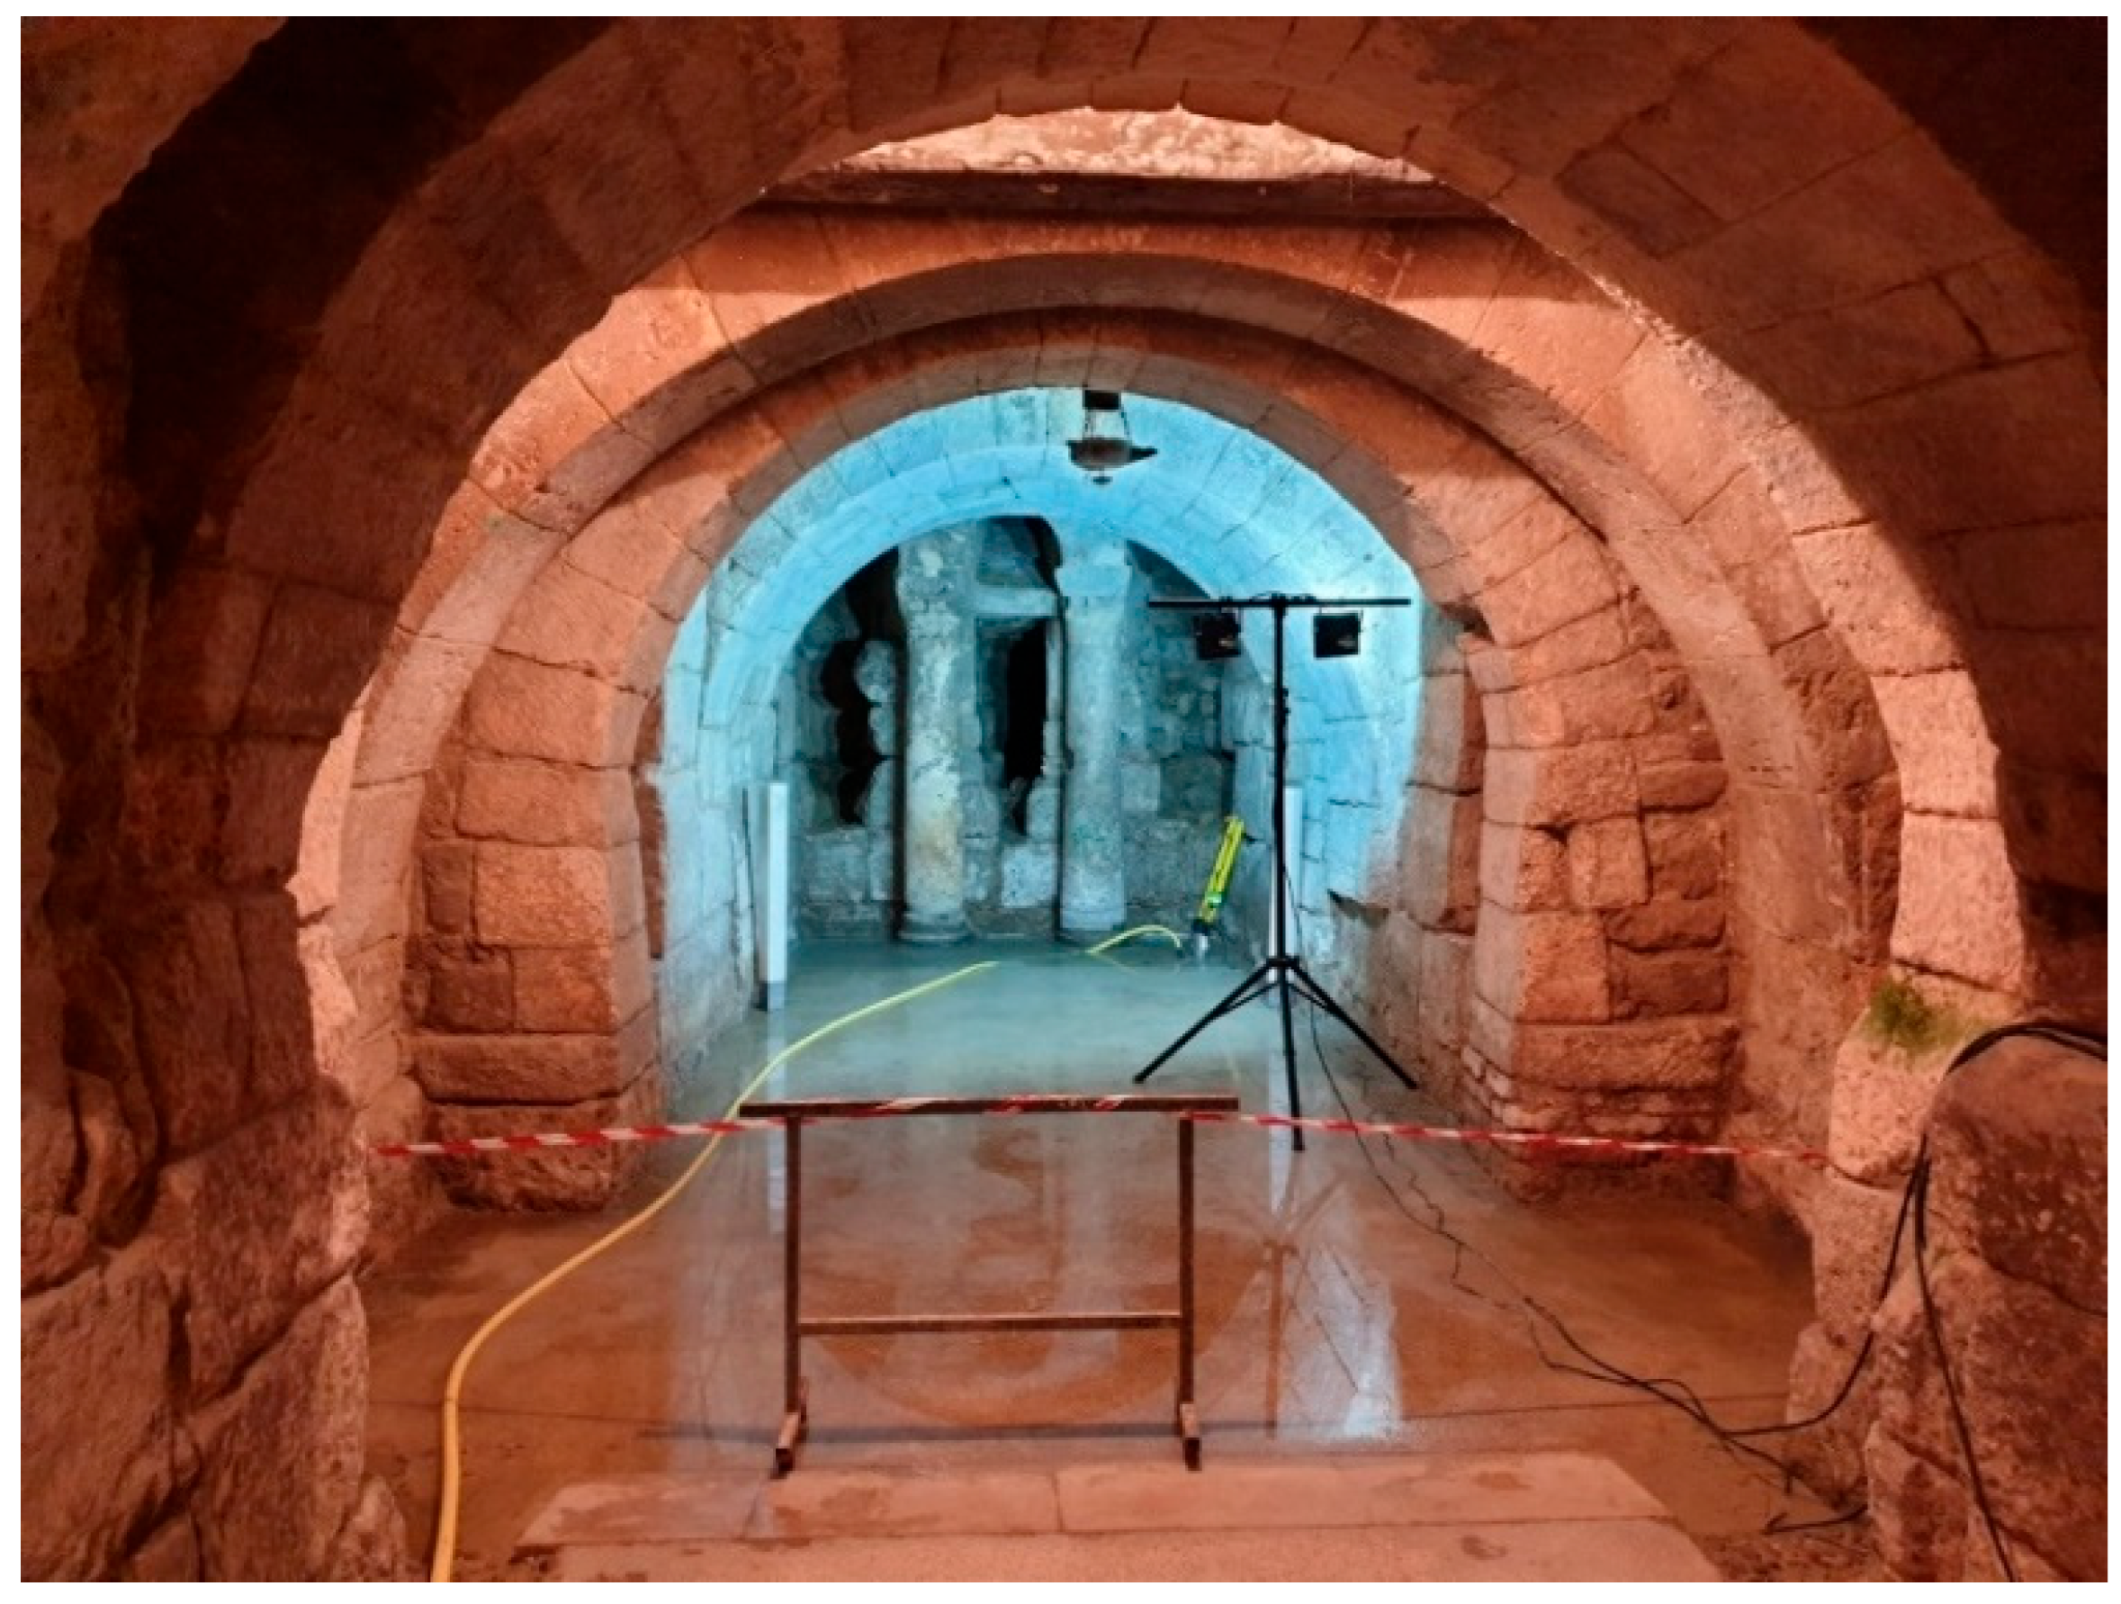
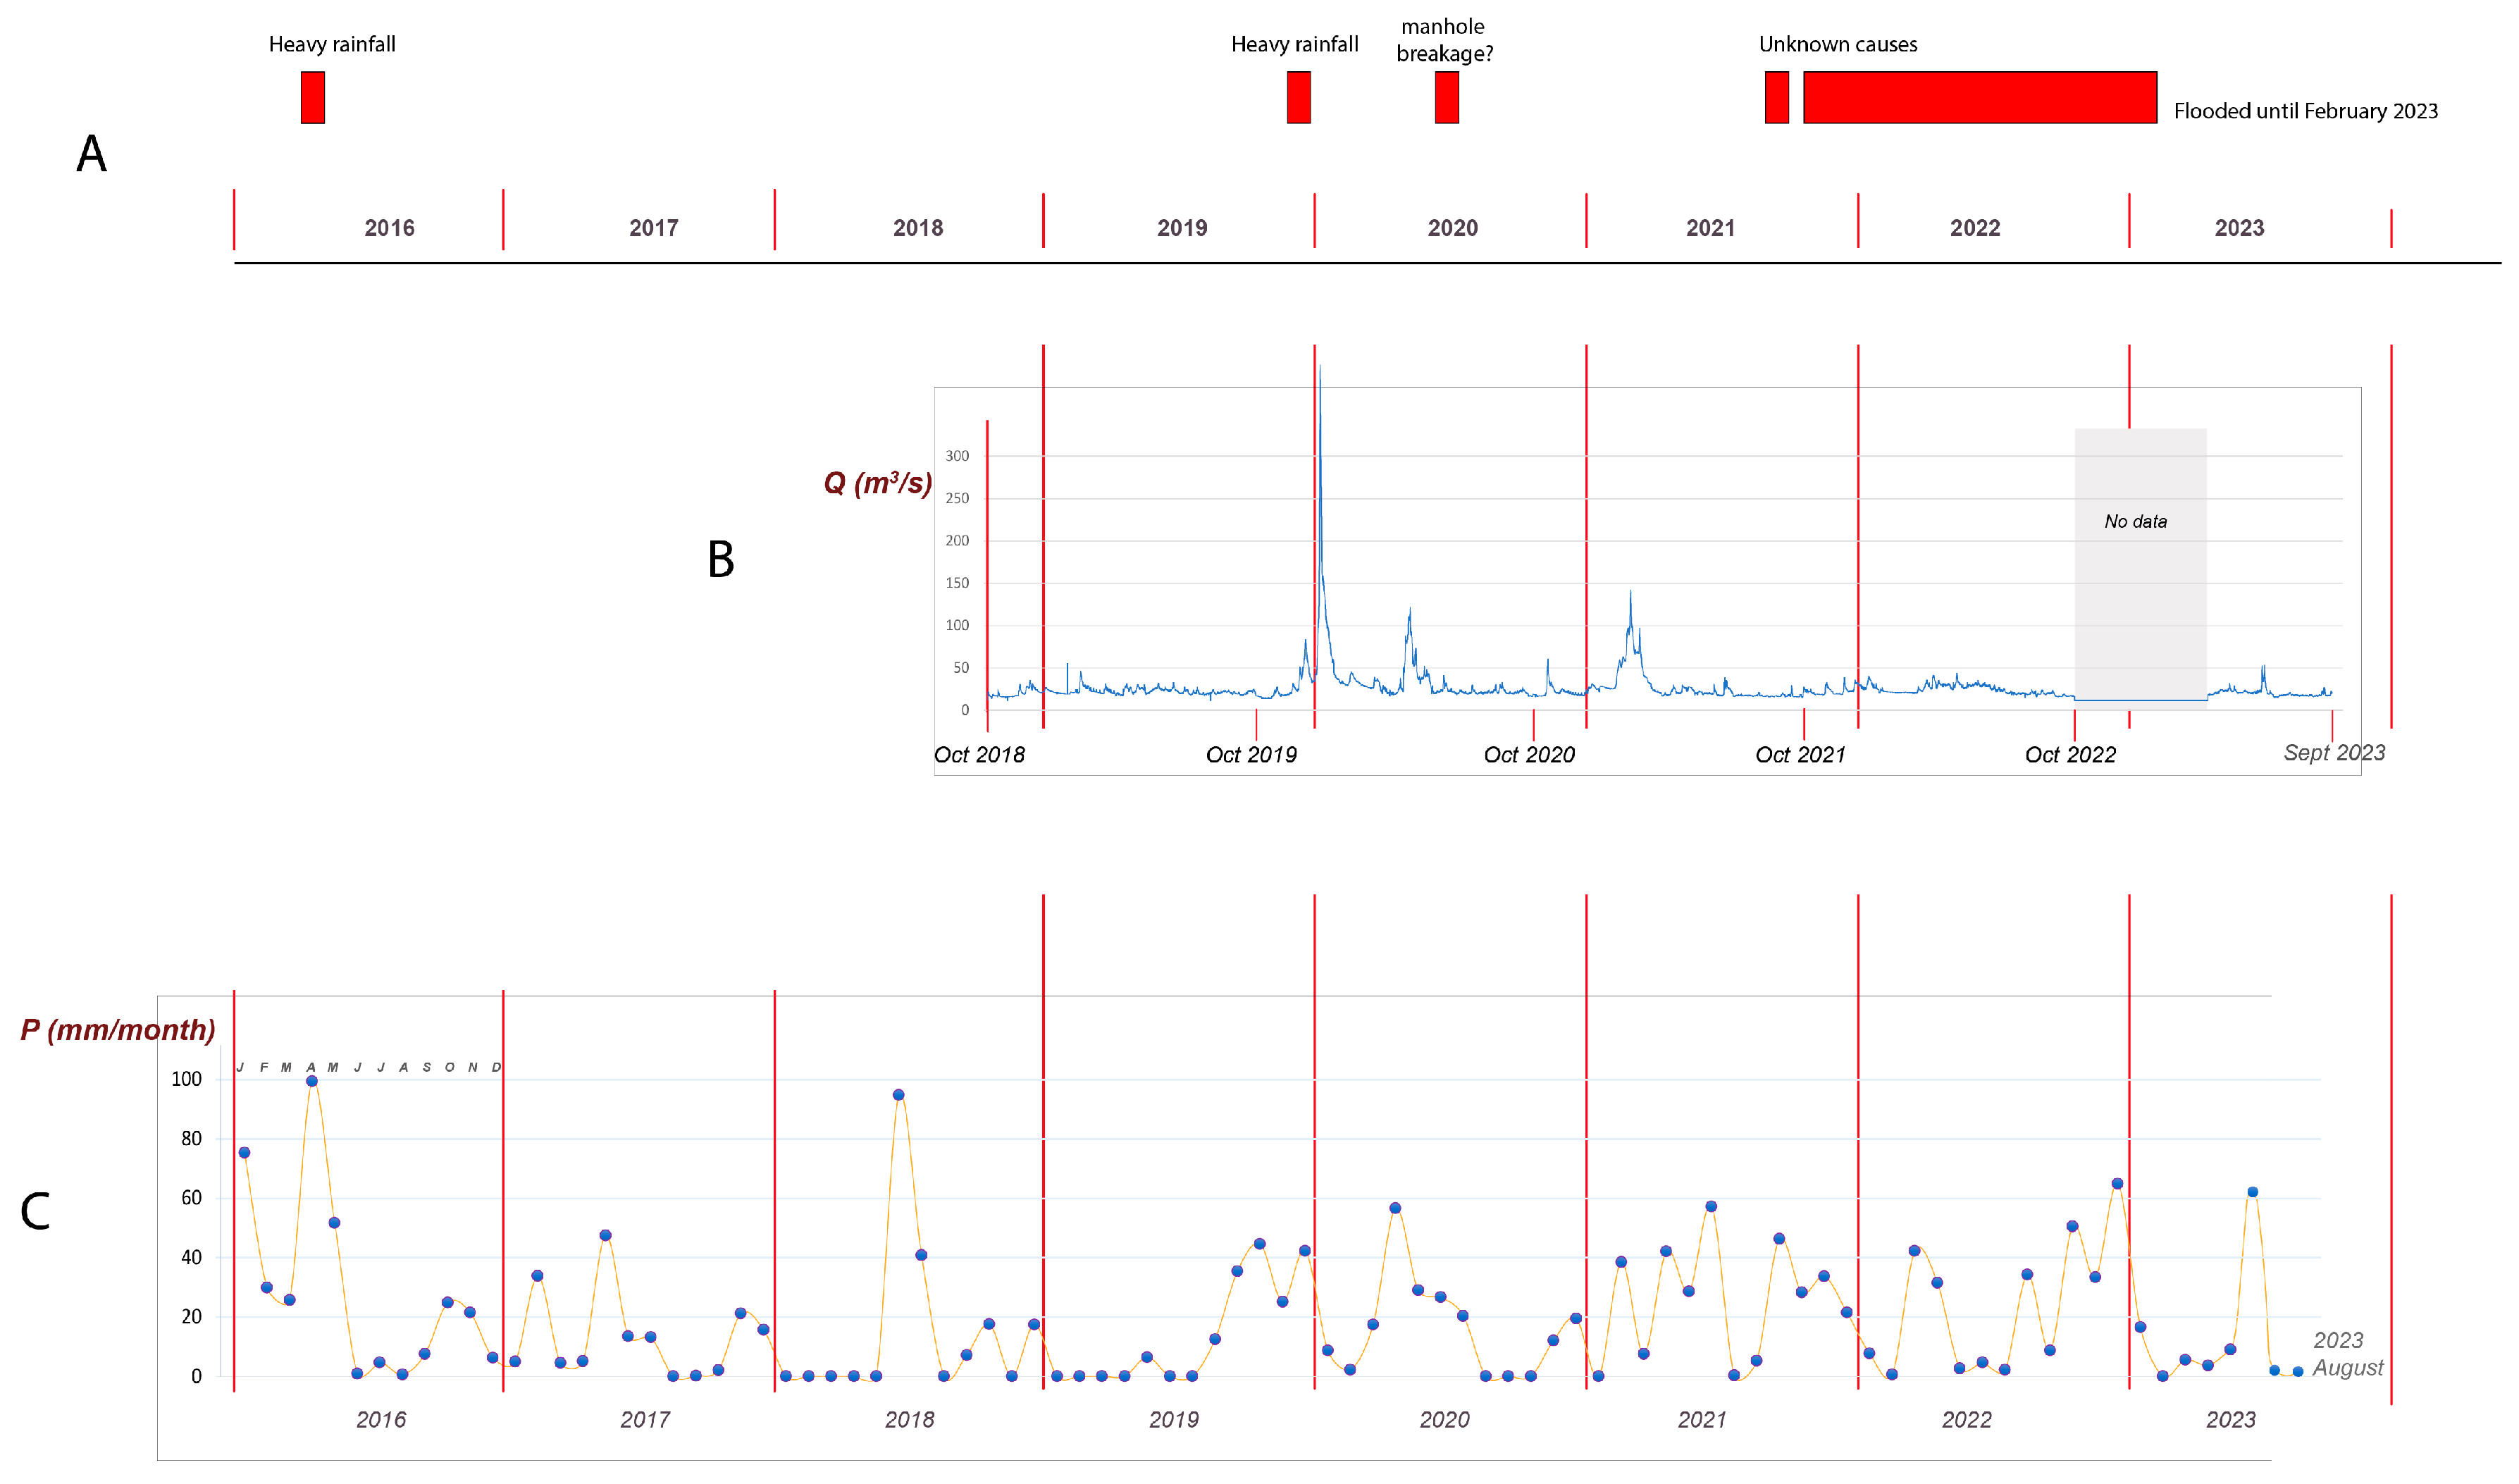
4.1. Flooding of the San Antolín Crypt

The San Antolín Crypt, with a rectangular floor plan (3 × 10 m), is located 4.40 m below the current level of the central nave of the cathedral, being a semi-buried construction allocated in the geological substrate. In the city of Palencia, there is a deeply rooted tradition that every September 2nd, on the day of San Antolín, the crypt is opened to the public to offer water from its well to the faithful [14].
Due to its location and semi-buried construction, the crypt has suffered recurrent phreatic flooding episodes caused by rises in the water table (Figure 5 and Figure 6). Flooding in the crypt is a historical problem that has affected this important architectural and religious site on several occasions throughout its existence. As a result, in 1930, the floor of the crypt was restored, raising its floor level by three steps to avoid floods. However, the flooding of the crypt has continued over the years, albeit periodically.
To determine the origin of these events, flooding periods since 2016 were represented (Figure 6A) and compared with the flow rate of the Carrión River, which crosses the city of Palencia 100–150 m south of the cathedral, at the level of the cathedral (Figure 6B). This flow rate was obtained by summing the data from two upstream gauging stations: one located on the Carrión River (Palencia Station) and another on one of its tributaries (the Nava Station) [15]. Additionally, they were compared with the monthly accumulated precipitation at a weather station located a few kilometers west of Palencia (Autilla del Pino) [16] (Figure 6C).
The flooding occurring in 2016 was the consequence of a period of heavy rain (Figure 6). The rise in the water table caused a 5 cm water layer to flood the crypt. This episode deteriorated the quality of the water in the crypt’s well, leading to the suspension of the tradition of drinking water from the well during the Saint Antolín festivity, as it was declared unfit for human consumption [17].
Subsequently, at the end of 2019 and in mid-2020, the crypt experienced other brief periods of flooding related to episodes of heavy rains and rises in the flow of the Carrión River (Figure 6). However, the 2020 flooding was also related to the rupture of a water supply collector [18].
The data presented above indicate that the water accumulating in the subsoil of the cathedral and causing periodic flooding is mainly rainwater. Nonetheless, contributions from leaks in the water supply network have been proven to play a role. Accordingly, drainage networks, and/or irrigation in the garden areas near the cathedral (e.g., Plazas de Cervantes and San Antolín, Figure 1), cannot be ruled out as a source of excess in underground water. The latter, together with undeveloped lots near the cathedral, are zones where rainwater easily infiltrates into the aquifer.
More recently, in mid-2021, the crypt flooded again. Unlike previous events, this flooding period lasted almost two years, until spring 2023, when water levels began to decline (Figure 6): in this case, there is no record of high flows of the Carrión River and/or significant precipitation accumulations. The main objective of this work is to determine the causes of this latest flood and to provide solutions to avoid it in the future.

4.2. Topographic Mapping Results and Insights

The results provided by RPA mapping can be summarized in an orthophoto with a resolution of 0.15 m/pixel (Figure 1B) and a hypsometric model with a resolution of 0.10 m/pixel (Figure 7). The altitude difference in the study area ranges from 742 m to 732 m. As expected, the topography decreases to the SW, towards the river, leading the surface waters in that direction. The topography does not present features that allow the accumulation of water in the central part of the cathedral.

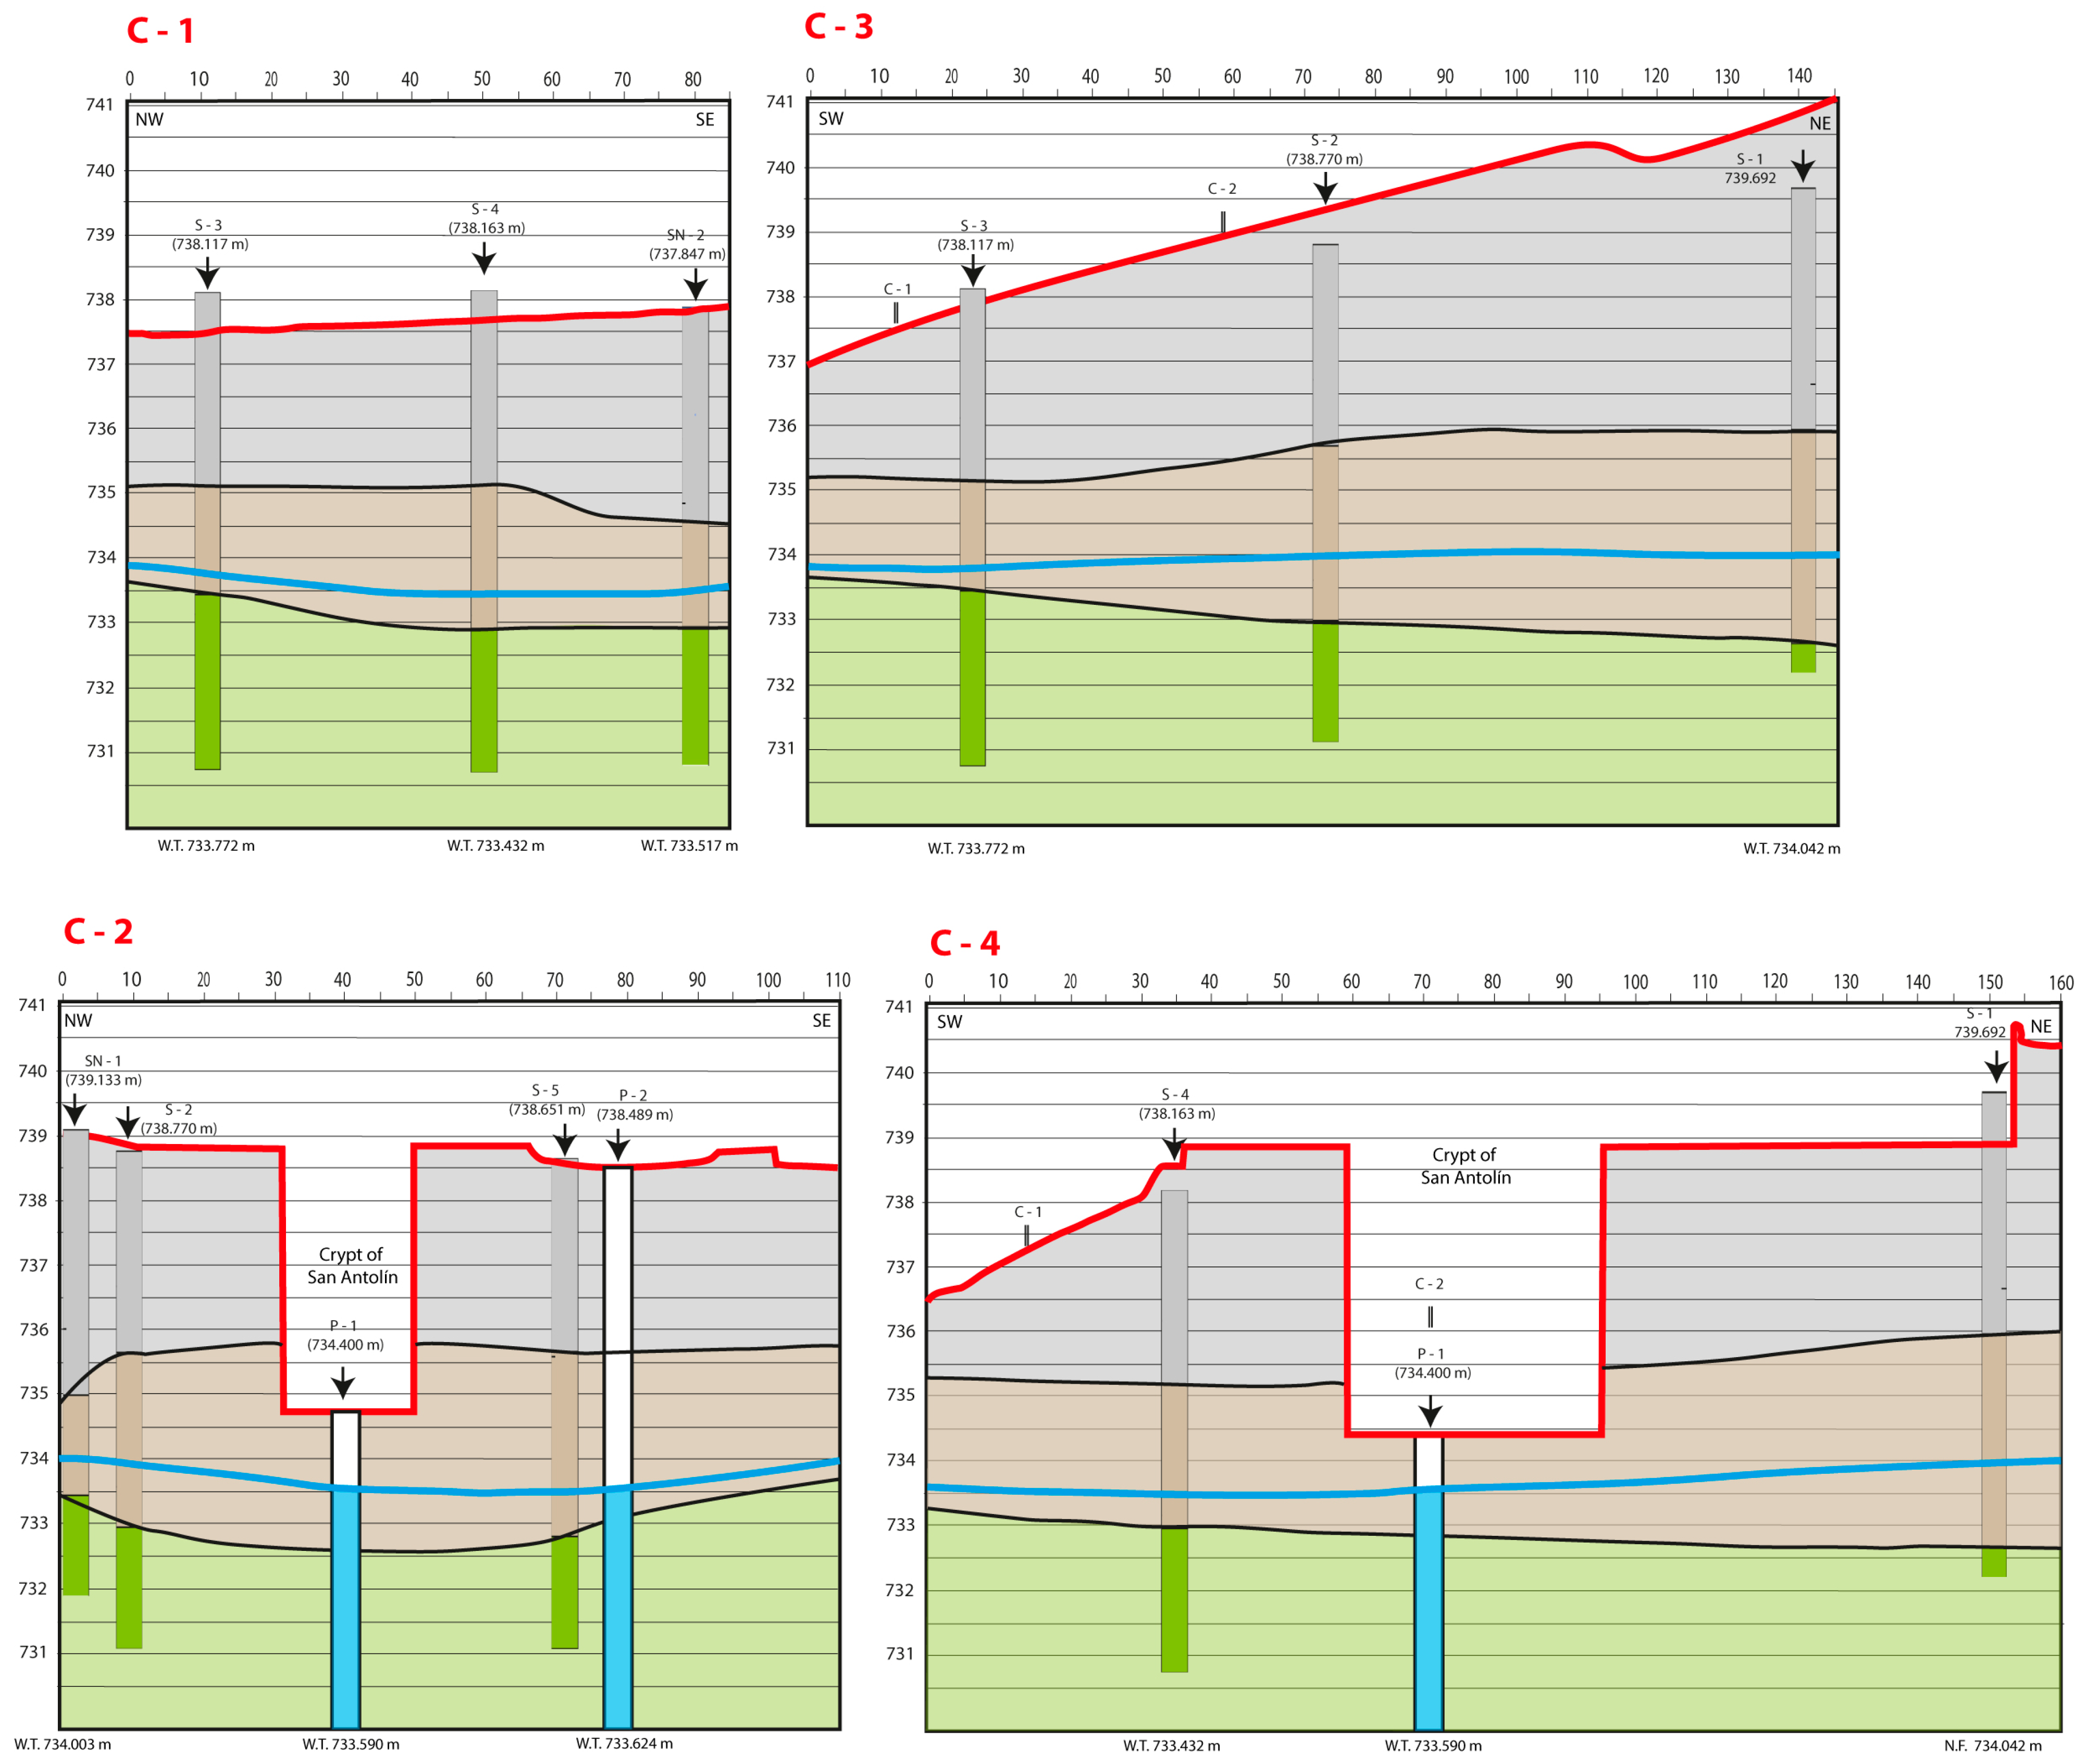
4.3. Geological-Geotechnical Characterization

Based on the results obtained from the analysis of the eight boreholes (Figure 4), the existence of three different levels in the subsoil of the cathedral has been determined. Figure 8 shows a simplified description of the geological layers interpreted from the borehole SN-1. This same stratigraphic distribution, with slight changes in elevation, has been observed in the other boreholes (Table 2).
The shallowest layer (Figure 8) consists of highly heterogeneous, anthropogenic materials, composed of the current pavement and fragments of stones and bricks, along with sands and clays with abundant organic matter. It has a variable thickness, ranging from 2.90 m in the S-5 borehole (Plaza de la Inmaculada) to 4.34 m in the SN-1 borehole at Plaza de Cervantes (Table 2). At the base of this anthropogenic fill, there is a layer rich in organic material and high humidity, referred to as the “black level”. Here, organic matter is mixed with clay, silt, and sand. Additionally, rounded pebbles from the lower Pleistocene terrace are always present. This indicates that it represents the first level of human occupation in the area, lying upon the terrace. This layer would have acted as the base for a very shallow, perched aquifer above the general level of the Pleistocene terrace. This black layer has consistently been found at the base of the anthropogenic fill, though in some cases it is less developed, as observed in the SN-2 borehole conducted in Plaza de San Antolín.
Beneath the anthropogenic fill, all boreholes encountered the Pleistocene terrace, consisting of a mix of gravel and sand. This layer also varies in thickness, from 1.50 m in Plaza de Cervantes to 3.25 m in S-1, located in front of the Cathedral’s apse on Calle Santa Teresa (Figure 1 and Figure 4). All boreholes show that the terrace layer is dry in the upper centimeters, while the lower part of the deposit is water-saturated, indicating the presence of an aquifer within this layer, constrained beneath by the less permeable Miocene marl layers. A Lefranc test conducted at this level in the SN-2 borehole yielded a permeability coefficient of 1.681 × 10⁻⁵ m/s (meters per second). Meanwhile, a pumping test conducted in the San Antolín Crypt well (P-1) yielded a value of 2.6 × 10⁻⁵ m/s. These high values of the permeability coefficient, characteristic of gravels and sands, indicate that these materials may constitute the main aquifer for the area.
The top of the Miocene marl does not show a constant depth; instead, as we will see later, it has a warped shape, forming a trough beneath the cathedral. The deepest part of the marl layer top is consistently found in the central areas of the cathedral.
In the geological sections C-1 to C-4 (Figure 9), the simplified logging of the boreholes located at the profiles or close to them have been projected. The position of the water table in wells P-1 (crypt) and P-2 (cloister) and in the boreholes has also been projected. The projected position of the water table is that corresponding to September 27th.
Cross-section C-1 strikes NW-SE and was conducted in Plaza de San Antolín, starting near borehole S-3 and ending at borehole SN-2 (Figure 4). The section depicts the logging results from boreholes S-3, S-4, and SN-2, along with the position of the water table. This cross-section (Figure 9) shows that the anthropic level exhibits a variable geometry in depth, with greater thicknesses towards the SE. Below the anthropic fill, there are gravels and sands from the Pleistocene terrace, and deeper down lie the Miocene marls. It is noteworthy that the contact between the gravels and the Miocene marls exhibits irregular geometry, showing a slight descent towards the SE, opposite to the topography. The Miocene marls, with very low permeability and transmissivity [9,10], are water-saturated. They serve as the base for the aquifer formed in the Pleistocene terrace, resulting in the water table somewhat reflecting the geometry of the Miocene marl top, leading to a slight inclination towards the SE.
Cross-section C-2 also strikes NW-SE and was conducted from Plaza de Cervantes to Plaza de la Inmaculada. It crosses the cathedral, passing through the well of the San Antolín Crypt, and near the well located in the center of the cloister (Figure 4). This cross-section (Figure 9) shows that the San Antolín Crypt is partially excavated in the Pleistocene terrace, facilitating access to the water table in the area. In this cross-section, the anthropic filling also exhibits irregular morphology, notably increasing its thickness in Plaza de Cervantes. The terrace’s geometry also displays irregularities, as the contact with the Miocene marls presents a basin-like shape, with the deepest part located below the well of the crypt, resulting in greater water accumulation in this area compared to adjacent areas.
Cross-section C-3 was conducted longitudinally to the cathedral (SW-NE) from Plaza de San Antolín to Calle Santa Teresa, passing in front of Plaza de Cervantes (Figure 1 and Figure 4). In this cross-section (Figure 9), the elevation decreases to the SW, i.e., to the Carrión River. This same decrease was observed in both the thickness of the anthropic fill and the layer of gravels and sands, indicating that the terrace deposit becomes thinner as we approach the river. However, the contact between the terrace and the marls has a slight inclination towards the NE, opposite to the topography. This geometry confirms the basin-like shape of the marl top, facilitating water accumulations below the cathedral.
Cross-section C-4 traverses the cathedral through the central nave (SW-NE), from Plaza de San Antolín to Calle Santa Teresa (behind the apse of the temple), passing through the San Antolín Crypt (Figure 4). In this cross-section (Figure 9), the topography shows that Calle Santa Teresa (NE) is approximately 1.5 m above the elevation of the central nave, while Plaza de San Antolín (SW) is slightly lower than the elevation of the central nave and continuously descends towards the SW, i.e., towards the river. Regarding the geometry of the different subsurface layers, they follow the same arrangement as in the previous cross-section (C-3). Both the anthropic fill and the terrace have greater thicknesses towards the NE. Similarly, like in section C-3, the contact between the marl top and the terrace wall exhibits a slight inclination towards the NE, i.e., towards the subsurface of the cathedral.
Figure 9. Cross-sections depicted in Figure 4. Vertical scale is meters above sea level (m a.s.l.). The horizontal scale is meters. Grey: anthropic fill; brown: Pleistocene terrace; green: Miocene marls. The blue line represents the position of the top of the water table on 27 September 2023. Observe the concave upwards geometry of the Miocene marls underneath the crypt in section C2.
Heritage 08 00169 g009

4.4. Geophysical (Resistivity) Characterization: Results from the ERT Profiles

The final resistivity models (Figure 10) are presented with a customized color scale, where resistivity values below 10 ohm-meters (Ω·m) represent saturated Miocene marls, and values between 10 and 30 Ω·m represent areas with water. Despite terraces and anthropic fills being resistive materials, these layers accumulate water retained by the water table, indicated by black lines in the case of anthropic fills, or constituting the water table of the area located within the terrace level.
Profile E-1 (Figure 10) shows the uppermost layer to be highly resistive. This interval corresponds to the current street pavement. Below, and approximately down to 3 m depth, a low-resistivity (high-conductivity) zone corresponding to the anthropic fill can be identified. At the base of this conductive layer lies the so-called “black level” (a layer rich in organic material and with high humidity), which in this area has been found to be well developed. Due to its nature, the latter acts as a low-resistivity water retention layer. Underneath, and approximately down to 6 m depth, the terrace deposit appears partly dry in the upper part (green colors,) becoming less resistive, i.e., saturated with water, at depth (blue colors). These findings confirm the presence of a perched aquifer, supported by stratigraphic evidence and resistivity data, in Plaza de Cervantes, which is partly retained by the “black level” but with a deeper water table within the alluvial materials. As shown above, these resistivity configurations match results from the drillholes, allowing us to extend the 1D information from the latter into a 2D section.
Profiles E-2 and E-3 (Figure 10) were conducted in Plaza de San Antolín. These are two parallel profiles, with E-2 closer to the cathedral and E-3 closer to the river. A simplified sketch of the logging results for boreholes SN-2, S-4, and S-3, along with the position of the water table determined on 27 September 2023 (dashed line), was projected onto these profiles. In this case, two very distinct parts are observed. While the stratigraphic and resistivity sequence observed in E-1 prevails from the center of profiles E-2 and E-3 to the NW (Plaza de Cervantes, righthand side of the figure), it is lost from the middle of the profiles towards the SE (lefthand side of the figure). Here, a plume-like, highly conductive zone breaks the layered configuration, indicating water saturation at higher levels. The lack of a well-developed “black level” in this area similar to that in Plaza de Cervantes prevents the retention of subsurface water and facilitates its free flow between the surface and the deeper aquifer.
Finally, profile E-4 (Figure 10) was conducted in Plaza de la Inmaculada. This profile includes the simplified results of logging for boreholes S-5 and S-6, as well as the position of the water table as of 27 September 2023 (S-6). Once again, the stratigraphic and resistivity sequence determined in E-1 and the SW of E-2 and E-3 is observed. However, it is noteworthy that the subsurface of Plaza de la Inmaculada is much more resistive than that of Plaza de Cervantes and Plaza de San Antolín. This is due to the fact that this square is paved while the other are not, thus preventing water from accessing the underground.

5. Discussion

5.1. Aquifer Arrangements and Factors Altering Them

The subsurface of the Cathedral of Palencia hosts two levels of water accumulation. (1) The base of the anthropic fill, the so-called “black level”. The latter represents the record of the early settlements in the area, and as such, it is rich in organic material. Currently, this level acts as an aquitard, i.e., a geological layer that restricts the flow of groundwater due to its low permeability, partially retaining water that infiltrates from the ground and is not drained by the stormwater network. This “black level” is well developed in Plaza de Cervantes, while it has not been clearly detected in the boreholes and geophysical surveys conducted in Plaza de San Antolín. (2) A lower aquifer develops in the granular deposits of the Pleistocene terrace. Water does not penetrate the lower level of Miocene marls as they are commonly saturated and have very low permeability, accordingly, acting as a non-permeable formation.
The stratigraphic and resistivity pattern described above has been detected in all surveys, except to the SE of Plaza de San Antolín, from Puerta de San Antolín to the SE, towards borehole SN-2. In this area, ERT results have revealed a high-conductivity plume in the ground, extending from near the surface to the Miocene marls, indicating high water saturation at every level (Figure 10). Additionally, borehole SN-2 lacks a clear “black level” opposite to that observed in Plaza de Cervantes. It is also noteworthy that in 1965, three archaeological test pits were created in this same area (Figure 11), reaching depths of between 4 and 5 m, down to the Pleistocene terrace. These interventions and their subsequent sealing may have contributed to altering the initial stratigraphic configuration, eliminating a possibly under-developed “black level”, thus providing a pathway for the water to reach the lower aquifer.
The top of the Miocene marls, and therefore the base of the main aquifer, is not perfectly horizontal (Figure 9: C-2). Borehole logging and ERT surveys have shown that this contact is slightly undulating, with a thicker terrace beneath the cathedral. This geometry forces much of the water infiltrating into the ground to accumulate in the basin formed below the cathedral, especially beneath the San Antolín Crypt, instead of being evacuated by gravity to the Carrión River.
Consequently, the high moisture levels in the Plaza de San Antolín, the under-developed or absent water retention levels in some areas (“black level”), the archaeological test pits created in the 1960s, and the inclination of the base of the main aquifer towards the central part of the cathedral, suggest that some most of the water accumulating in the crypt comes from Plaza de San Antolín, which despite its proximity and dip to the Carrión River, flows the underground water to the center of the cathedral.
This water dynamics was possibly enhanced by the replacement of the pavement in Plaza de San Antolín in mid-2021 (Figure 12), right when the continuous floods started (Figure 6). This intervention involved replacing the former pavement, consisting of concrete slabs with rounded edges, with a lattice pavement made out of concrete pieces, with grass between the gaps. In addition, 50 trees were planted in their corresponding tree pits [19].

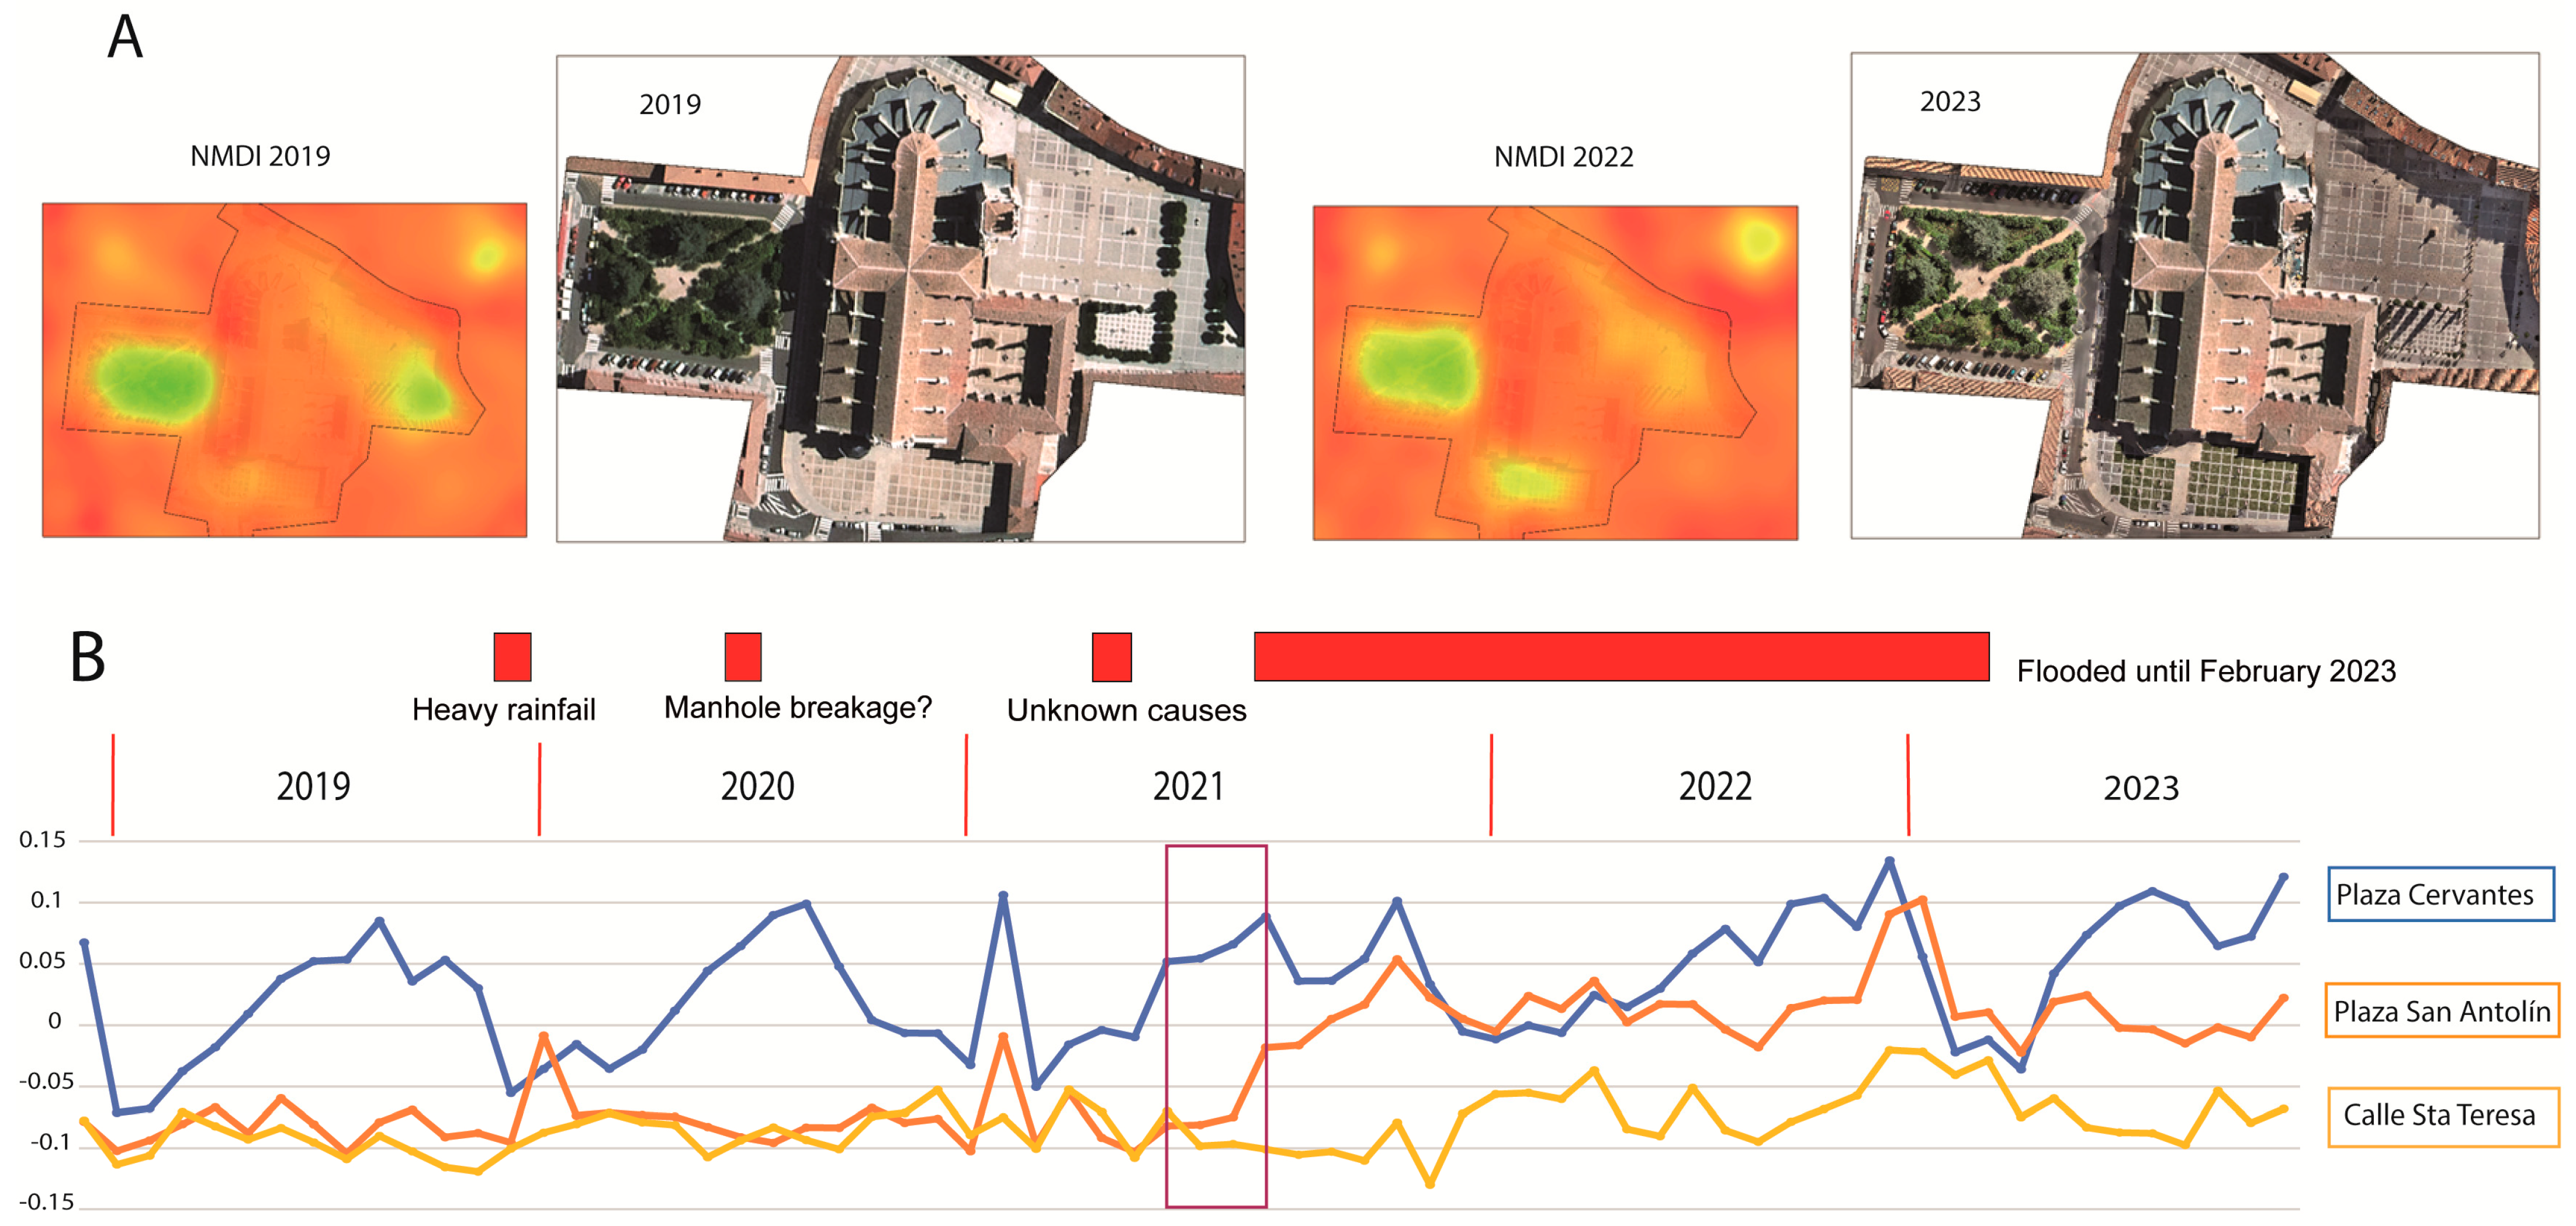
5.2. Input from Satellite Images on the Humidity Levels Around the Cathedral

In order to detect how the 2021 intervention on Plaza de San Antolín affected the humidity levels around the cathedral, the Normalized Difference Moisture Index (NDMI) was obtained. This index detects vegetation moisture levels using a combination of near-infrared (NIR) and short-wave infrared (SWIR) spectral bands. Sentinel-2 satellite images were used for this analysis. These have a spatial resolution of 10 m/pixel and a temporal resolution of approximately 5 days. The images were obtained from the digital repository of the European Space Agency-Sentinel Hub EO Browser [20]. Data from 3 November 2018 to 19 September 2023 were utilized.
Sentinel 2 images consist of 13 bands with a wavelength range from 443 nm to 2185 nm. In this case, bands 8A (864 nm—NWIR) and 11 (1610 nm—SWIR) were used. The NDMI was computed by combining bands B8A and B11 with the equation NDMI = (B08 − B11)/(B08 + B11). Negative values of the index indicate the presence of water stress; the closer the values are to −1, the more arid the conditions. Positive values indicate high humidity, with values closer to 1 representing greater water saturation.
The NDMI maps of areas adjacent to the cathedral allowed for the calculation of mean NDMI for three areas of interest (Figure 13): (1) Plaza de Cervantes, a zone that was gardened throughout the study period (3 November 2018 to 19 September 2023) and even from earlier times; (2) Plaza de San Antolín, a square that was paved until mid-2021 when the pavement was replaced and a new landscaped area was created; and (3) Calle de Santa Teresa, located behind the apse of the cathedral, which was paved throughout the study period.
When comparing the monthly values obtained for Plaza de San Antolín with those obtained for Calle Santa Teresa and Plaza de Cervantes (Figure 13), it can be observed that before May 2021, the NDMI of Plaza de Saint Antolín coincides, both in values and trend, with the NDMI obtained for Calle Santa Teresa (arid zone, negative values). However, after May 2021, this index coincides both in trend and values with that obtained for Plaza de Cervantes (continuous irrigation, positive values).
Figure 13. (A) NDMI in Plaza de Cervantes, Plaza de San Antolín, and Calle Santa Teresa. (B) Yearly plot of flooding intervals in the San Antolín Crypt versus NDMI in Plaza de Cervantes, Plaza de San Antolín, and Calle Santa Teresa.
Heritage 08 00169 g013

5.3. Solutions for and Evolution of the San Antolín Crypt’s Phreatic Floods

As previously stated, while sporadic crypt flooding before 2021 occurred as a direct consequence of periods of heavy rainfall and increase in the flow of the Carrión River, the persistent flooding starting in 2021 showed no direct relation with precipitation. Contrarily, Figure 13 shows a correlation between the timing of gardening of Plaza de San Antolín and the persistent flooding of the San Antolín Crypt. It can also be observed that in 2023, coinciding with a prolonged drought period and the reduction in irrigation in Plaza de Cervantes and Plaza de San Antolín as suggested by the authors of this research, the resulting NDMIs decreased (Figure 13B). Accordingly, the latest period of crypt flooding came to an end.
As a result of this study, the Palencia City Council cut down the water irrigation to Plaza de San Antolín in the 2023 fall. Since then, the level of water in the boreholes has decreased and the crypt flooding has disappeared (Table 3). This trend has been observed in the SN-2 borehole, created in 2023, where the water level depth has been deepening (42 cm since it was drilled). It is worth noting that, in the monitoring points located at Plaza de Cervantes, (S-3, SN-1) the levels remain relatively constant, with some fluctuations in relation to the initial measurements conducted in 2003. However, in this case, the variation in the water levels does not pose an important problem for floods in the crypt as the “black level” in this area is well developed.
Despite the observed general trend, in the southeastern part of Plaza de San Antolín, the evolution of the water table has shown a variable behavior (Table 3). For instance, borehole S-4 showed a deepening of the groundwater level since its drilling in 2003 to June 2023, varying from 5.0 m to 4.72 m. However, in the latest measurements, a contrary trend is observed, i.e., in May 2024, the depth of the water level returns to the 2003 levels (5.0 m); but no floods have been observed in the crypt.
Finally, we have also found that in the crypt and the cloister wells, the water levels have also been deepening since we started this study (Table 3).

6. Conclusions

The subsurface of the Cathedral of Palencia and its surroundings feature three stratigraphic levels that play an important role in the behavior of the aquifer:
(1)
The first level consists of anthropogenic fillings ranging in thickness from 3 to 4 m. At its base there is a “black level” rich in organic content and with low permeability, constituting a water retention level. This level is not continuous, as it was not detected in some areas of Plaza de San Antolín during the conducted surveys.
(2)
The natural stratigraphic sequence begins with a deposit of gravels and sands constituting one of the high Pleistocene terraces of the Carrión River. Its thickness is also variable, generally decreasing as it approaches the river. These are highly permeable materials where the main aquifer in the area is located.
(3)
Clays and marls from the Miocene, belonging to the Dueñas Unit. This level is water-saturated and has very low permeability. The depth at which the top of this level is located varies, usually between 5 and 7 m. It is worth noting that its top is not horizontal but presents an undulating shape, defining a basin-like geometry in the subsurface of the San Antonín Crypt.
This study has confirmed that the recurrent historical floods experienced by the San Antolin Crypt before 2021 are related to episodes of heavy rainfall. Despite the partial prevention of water infiltration into the subsoil by the stormwater drainage network, the gardened areas, undeveloped lots in the nearby areas, and other possible pathways fed the underground aquifer, leading to a rise in the water table and the consequent flooding of the crypt.
However, the persistent flooding that began in mid-2021 and ended in 2023 is not related to periods of heavy rainfall. Instead, a direct relationship has been found between the gardening of Plaza de San Antolín and this flooding episode. This, together with the lack of the “black level” in this square and the existence of archaeological test pits down to ~5 m depth, has increased the permeability of that area. Thus, rainwater and irrigation water have greatly contributed to the flooding of the crypt. Additionally, any ruptures in the supply or drainage networks should not be ruled out, which would also explain the high levels of humidity detected in this area.
As a result of this study, several recommendations were made to the Palencia City Council to prevent or mitigate the detected problems in the crypt. (1) Short-term measures: avoid, as much as possible, watering in Plaza de Cervantes, and especially in Plaza de San Antolín; (2) review the municipal supply and stormwater drainage networks to prevent possible losses, especially recommended in Plaza de San Antolín, where there is a significant water supply that does not seem solely related to natural processes; and (3) although artificial water inputs to the area are avoided, infiltration during heavy rains will be inevitable, so flooding of the crypt will still occur during periods of heavy rain. It is therefore recommended that automatic drainage submersible pumps be installed in the crypt well.
Finally, it is important to emphasize the importance of conducting geological-geotechnical studies in the vicinity of historical buildings, as any modification of the environment can cause damage to the structure and compromise its maintenance and stability. This study underscores how seemingly benign urban modifications can critically alter subsurface hydrological regimes, posing significant risks to the structural integrity and conservation of heritage sites.

Author Contributions

M.Y.: Writing—review and editing, writing—original draft, visualization, validation, methodology, investigation, formal analysis, data curation, conceptualization, project administration. P.A.: Writing—review and editing, writing—original draft, visualization, validation, methodology, investigation, formal analysis, data curation, conceptualization, project administration. Y.S.-S.: Writing—review and editing, visualization, validation, methodology, investigation, formal analysis, data curation, conceptualization. J.E.: Writing—review and editing, visualization, validation, methodology, investigation, formal analysis, data curation, conceptualization. I.P.: Writing—review and editing, visualization, validation, methodology, investigation, formal analysis, data curation, conceptualization. S.G.-M.: Writing—review and editing, investigation, methodology. J.A.: Writing—review and editing, investigation, visualization, validation. L.Y.: Writing—review and editing, investigation, visualization, validation. A.S.-B.: Writing—review and editing, investigation, visualization, validation. E.R.-J.: Writing—review and editing, formal analysis, investigation. L.L.: Writing—review and editing, formal analysis, investigation, methodology. J.G.-B.: Writing—review and editing, visualization, validation, methodology, investigation, formal analysis, data curation, conceptualization. All authors have read and agreed to the published version of the manuscript.

Funding

The results are part of the contract B2023/008285 with JCYL. The authors acknowledge the support of the MCIN/AEI/10.13039/501100011033 under the grant PID2020-117332GB-C21, the MCIN/AEI/10.13039/501100011033 and European Union NextGenerationEU/PRTR under the grant TED2021-130440B-I00, and the Junta de Castilla y León grant SA066P24.

Data Availability Statement

Data are contained within the article.

Conflicts of Interest

The authors declare no conflicts of interest.

References

  1. Pérez-Gracia, V.; Caselles, J.O.; Clapes, J.; Osorio, R.; Martínez, G.; Canas, J.A. Integrated near-surface geophysical survey of the Cathedral of Mallorca. J. Archaeol. Sci. 2009, 36, 1289–1299. [Google Scholar] [CrossRef]
  2. Giocoli, A.; Hailemikael, S.; Bellanova, J.; Calamita, G.; Perrone, A.; Piscitelli, P. Site and building characterization of the Orvieto Cathedral (Umbria, Central Italy) by electrical resistivity tomography and single-station ambient vibration measurements. Eng. Geol. 2019, 260, 105195. [Google Scholar] [CrossRef]
  3. Benson, R.C.; Yuhr, L.B. What Is Site Characterization. In Site Characterization in Karst and Pseudokarst Terraines; Springer: Dordrecht, The Netherlands, 2016. [Google Scholar] [CrossRef]
  4. Carpinteri, A.; Lacidogna, G.; Manuello, A.; Invernizzi Binda, L. Stability of the vertical bearing structures of the Syracuse Cathedral: Experimental and numerical evaluation. Mater. Struct. 2009, 42, 877–888. [Google Scholar] [CrossRef]
  5. Roje-Bonacci, T.; Miscevic, P.; Salvezani, D. Non-destructive monitoring methods as indicators of damage cause on Cathedral of St. Lawrence in Trogir, Croatia. J. Cult. Herit. 2014, 15, 424–431. [Google Scholar] [CrossRef]
  6. Zmudzinski, Z. Changes of engineering geological conditions and their influence on buildings in the Historical Centre of Cracow. In The Engineering Geology of Ancient Works, Monuments and Historical Sites: Preservation and Protection, Proceedings of the International Symposium Organized by the Greek National Group of IAEG, Athens, Greece, 19–23 September 1988; Marinos, K., Ed.; Balkema: Rotterdam, The Netherlands, 1988; Volume 1, pp. 495–502. [Google Scholar]
  7. Makedon, T.; Chatzigogos, N.P.; Spandos, S. Engineering geological parameters affecting the response of Thessaloniki’s urban fill to a major seismic event. Eng. Geol. 2009, 104, 167–180. [Google Scholar] [CrossRef]
  8. Moscatelli, M.; Pagliaroli, A.; Mancini, M.; Stigliano, F.; Cavuoto, G.; Simionato, M.; Peronace, E.; Quadrio, B.; Tommasi, P.; Cavinato, G.P.; et al. Integrated subsoil model for seismic microzonation in the Central Archaeological Area of Rome (Italy). Disaster Adv. 2012, 5, 109–124. [Google Scholar]
  9. Alonso-Gavilán, G.; Armenteros, I.; Carballeira, J.; Corrochano, A.; Huerta, P.; Rodríguez, J.M. Cuenca del Duero. In Geología de España; Vera, J.A., Ed.; Sociedad Geológica de España: Salamanca, Spain; IGME: Madrid, Spain, 2004; pp. 550–556. ISBN 978-84-7840-546-6. [Google Scholar]
  10. Yenes, M.; Monterrubio, S.; Nespereira, J.; Santos, G.; Fernández-Macarro, B. Large landslides induced by fluvial incision in the Cenozoic Duero Basin (Spain). Geomorphology 2015, 246, 263–276. [Google Scholar] [CrossRef]
  11. Antón, L.; Rodés, A.; De Vicente, G.; Pallás, R.; García-Castellanos, D.; Stuart, F.; Braucher, R.; Bourlès, D. Quantification of fluvial incision in the Duero Basin (NW Iberia) from longitudinal profile analysis and terrestrial cosmogenic nuclide concentrations. Geomorphology 2012, 165–166, 50–61. [Google Scholar] [CrossRef]
  12. Vera, J.A. (Ed.) Geología de España; SGE-IGME: Madrid, Spain, 2004; 890p, ISBN 978-84-7840-546-6. [Google Scholar]
  13. Portero, J.M.; Gutiérrez-Elorza, M.; Molina, E. Geological Map of Spain, 1:50000, n° 273 (Palencia); Instituto Geológico y Minero de España (IGME): Madrid, Spain, 1982. [Google Scholar]
  14. Mora, M. Los Palentinos Cumplen con la Tradición de Beber Agua en la Cripta. 2024. Available online: https://www.elnortedecastilla.es/palencia/fiestas/palentinos-cumplen-tradicion-beber-agua-cripta-20240902180633-ga.html (accessed on 2 September 2024).
  15. CHD (Confederación Hidrográfica del Duero). Datos de Aforo: Estaciones de Palencia y La Nava. 2023. Available online: https://datos.chduero.es/dataset/datos-de-aforos (accessed on 25 September 2023).
  16. AEMET (Agencia Estatal de Meteorología). Estación Meteorológica de Autilla del Pino. 2023. Available online: https://www.aemet.es/es/datos_abiertos (accessed on 25 September 2023).
  17. Mínguez, A. La Cripta de la Catedral de Palencia, Víctima de las Lluvias. 2016. Available online: https://www.abc.es/espana/castilla-leon/abci-cripta-catedral-palencia-victima-lluvias201604221925_noticia.html (accessed on 22 April 2016).
  18. Benito Iglesias, J. Ni Cripta ni Agua Milagrosa el día del Patrono. 2021. Available online: https://www.diariopalentino.es/Noticia/z5c4bfd05-f8e8-9ad3-ac483a5b93e50449/202109/Ni-cripta-ni-agua-milagrosa-el-dia-del-patrono (accessed on 2 September 2021).
  19. Díaz, J.M. Las Obras de los Entornos de la Catedral de Palencia Culminan con la Plantación de Cincuenta Árboles. La Plaza de San Antolín se Transforma en una Zona Ajardinada para el Descanso. 2021. Available online: https://www.elnortedecastilla.es/palencia/obras-entornos-catedral-20210724141142-nt.html (accessed on 24 July 2021).
  20. Sentinel Hub EO Browser. 2024. Available online: https://apps.sentinel-hub.com/eo-browser/ (accessed on 19 September 2023).
Figure 1. (A): Aerial image of Palencia city (see location of the city in Figure 2) (Google Maps). (B): Orthophotomap of the cathedral setting. (C): Transversal section of the cathedral along its central nave, from its apse to the Plaza de San Antolín, crossing the San Antolín Crypt.
Heritage 08 00169 g001
Figure 3. Geological cross-section across the city of Palencia (see Figure 1 for locations).
Heritage 08 00169 g003
Figure 4. Location of the drillholes, and that of the wells (San Antolín Crypt and cloister). Yellow lines (C-1 at C-4) show the location of cross-sections presented in Figure 9. Purple lines (E-1 at E-4) show the location of Electric Resistivity Tomography (ERT) profiles displayed in Figure 10.
Heritage 08 00169 g004
Figure 5. Flood in the San Antolín Crypt (20 January 2022). View of the crypt from the access stairs.
Heritage 08 00169 g005
Figure 6. (A): Floods in the San Antolín Crypt from 2016 to date. (B): Hietogram of the Carrión River as it crosses Palencia city (sum of stations from Palencia and La Nava [15]). (C): Hietogram of monthly cumulative rain (weather station from Autilla del Pino, 10 km west of Palencia [16]).
Heritage 08 00169 g006
Figure 7. Hypsometric model (in meters) of the cathedral and neighboring areas. Note the terrain slope to the southwest, i.e., towards the Carrion River.
Heritage 08 00169 g007
Figure 8. SN-1 borehole’s samples and its simplified logging (Plaza de Cervantes).
Heritage 08 00169 g008
Figure 10. ERT results in Plaza de Cervantes (E-1), Plaza de San Antolín (E-2 y E-3), and Plaza de la Inmaculada (E-4). Locations are shown in Figure 1 and Figure 4. Simplified logging results are plotted in the models in the projected position of boreholes. The top of the water table is shown with a dashed line. Black lines indicate the top and bottom of the Pleistocene level.
Heritage 08 00169 g010
Figure 11. Location, resulting sections, and image of the archaeological test pits created in Plaza de San Antolín in 1965.
Heritage 08 00169 g011
Figure 12. Left: Plaza de San Antolín before the replacement of the impermeable pavement (early 2020). Right: after the intervention (2023).
Heritage 08 00169 g012
Table 1. Characteristics of the resistivity profiles acquired at the cathedral surroundings. See their locations in Figure 4.
ProfileLocationLength (m)Electrode Spacing (m)Number of ElectrodesError (%)
E-1Plaza de Cervantes31 1 322
E-2Plaza de San Antolín622 328.6
E-3Plaza de San Antolín622324.1
E-4Plaza de la Inmaculada55.81.83217.5
Table 2. Drillholes and wells together with their location, altitude, piezometric level, and depth to the top of the identified layers. Coordinates ETRS89-UTM Zone 30. Piezometric level on 27 September 2023.
Survey PointUTM XUTM YAltitude
(m a.s.l.)
Piezometric Level
(m a.s.l.)
Anthropogenic Fill—Fluvial Terrace Contact
(m a.s.l.)
Anthropogenic Fill Thickness (m)Fluvial Terrace—Dueñas Unit Contact
(m a.s.l.)
Fluvial Terrace Thickness
(m)
S-1372,705.2314,652,221.59739.692734.042735.9923.70732.7423.25
S-2372,692.6184,652,206.55738.770-735.7703.00732.9702.80
S-3372,646.7874,652,177.99738.117733.772735.1173.00733.3971.72
S-4372,664.7534,652,143.23738.163733.432735.1633.00732.9632.20
S-5372,722.9034,652,150.47738.651-735.7512.90732.9512.80
S-6372,756.4664,652,177.19739.156733.678735.1564.00733.0562.10
SN-1372,691.4764,652,221.43739.133734.003734.7904.34733.2901.50
SN-2372,670.4004,652,112.73737.847733.517734.9612.89733.3611.60
P-1372,692.5294,652,170.85734.400733.590----
P-2372,705.2314,652,132.76738.489733.624----
Table 3. Evolution of the water table depth as observed in the monitoring points from 2003 (only S wells) to 2024 (S and SN wells). Depth in meters.
CryptCloisterS-1S-2S-3S-4S-5S-6SN-1SN-2
31/07/2003-- 5.80- - - 5.405.80- -
01/08/2003- - - - - -- - - -
04/08/2003- - 5.804.704.255.005.205.70- -
17/09/2003- - 5.804.684.185.055.215.76- -
08/05/2019- - 4.59- - - - 5.34- -
03/12/2019- - 4.69- - - - 5.27- -
21/06/20230.145.015.75- 4.254.72- - - -
11/07/20230.284.915.70- 4.414.81- 4.48- -
27/09/20230.234.875.65- 4.364.78- 5.435.134.33
16/12/2023- 4.945.71- 4.18- - 5.465.174.45
15/04/20240.205.005.45- 4.37- - - 5.124.59
27/05/20240.385.16--4.355.005.175.605.104.75
Disclaimer/Publisher’s Note: The statements, opinions and data contained in all publications are solely those of the individual author(s) and contributor(s) and not of MDPI and/or the editor(s). MDPI and/or the editor(s) disclaim responsibility for any injury to people or property resulting from any ideas, methods, instructions or products referred to in the content.

