Article

Stored Collections and Accessibility: An Overview in New Zealand Museums

Department of Humanities, International University of Catalonia, 08017 Barcelona, Spain
*
Authors to whom correspondence should be addressed.
Heritage 2025, 8(5), 162; https://doi.org/10.3390/heritage8050162
Submission received: 2 April 2025 / Revised: 1 May 2025 / Accepted: 2 May 2025 / Published: 5 May 2025

Abstract

:
Most museum collections are not displayed since they are held in storage, out of visitors’ reach. However, little is known about the size of stored collections, how they are used, and to what extent museums enhance their accessibility in New Zealand museums. This study aims to provide an overview of the size of stored collections, the strategies adopted by museums, and how these solutions impact the accessibility of stored collections in museums in New Zealand. Data were gathered through a survey sent to the New Zealand office of ICOM and direct invitations to museums between December 2020 and January 2021. Respondents represented different museums’ legal statuses, sizes, and collections. The results show that 84% of collections are held in storage. Strategies such as the rotation of items enabled museums to use 28% of stored collections. In comparison, 18% of stored items were used through loans and 17% through exchanges, making them accessible to everyone. Specifically, it was found that the most effective strategies in terms of accessibility are visible storage, with 55% usability of stored collections, and the digitisation of collections, with 41%. These findings indicate that factors such as different legal statuses of museums, sizes, and types of collections, might impact the use of stored collections.

1. Introduction

Museums were set up within the framework of an intellectual movement which emphasised the importance of disseminating knowledge as a key factor in advancing society. The function of collecting objects, along with educating the public, was one of the primary triggers for the birth of museums [1,2,3,4,5]. The collections were at the centre of the museum’s identity, and their conservation, study, and exhibition were pivotal for its core functions. Museums have been collecting for a long time, thereby triggering overcrowded storage that might lead to critical scenarios in terms of sustainability, if not supported by a rigorous acquisition policy.
The accumulation of items has led to a “profusion predicament”, meaning a condition in which the sheer abundance of objects exceeds the institution’s capacity to preserve, interpret, and display them adequately [6,7]. In this framework, collection policies oriented towards sustainability are fundamental to achieving more selective acquisition, contextual relevance, and long-lasting care. Rationalising collections implies assessing items’ preservation needs and potential value in different settings. In order to ensure collections are better used and understood, deaccessioning—“the removal of an object from a museum permanent collection” [8] (pp. 119,137)—might be a possible action. Once deemed a controversial practice, deaccession might mitigate storage burdens when conducted according to ethical guidelines and transparent processes to retain trust and accountability [9,10,11,12,13]. Therefore, managing collections responsibly is of the utmost importance [14,15]. In addition, museums need to steward their collections with future generations in mind and take into account their environmental footprints [16]. This change in collections management is reflected in the New Zealand Standard Scheme [17] adopted in 2002 and in The Revised Standards adopted in 2023. These documents aim to be a guide for the governance of New Zealand museums, with an emphasis on accessibility and sustainability [18]. For instance, the collection policy of the National Museum of New Zealand Te Papa Tongarewa in Wellington, approved in August 2024, advocates for onsite and online accessibility as much as possible [19]. Additionally, the policy provides details about the acquisition process and sets out that collecting items can concern only objects with relevance for the nation. The policy of the Auckland War Memorial Museum, approved in 2018, in the “Collections Development” chapter, identifies regular assessments of collection as a compulsory task to verify the quality and the significance of items before deaccessioning them [20]. In order to achieve sustainability, the collection policy 2020–2025 of the Otago Museum sets ethical standards for acquisitions. Specifically, it points out that acquisitions can be made so that their qualities and quantities are neither detrimental for the survival of local or regional biota or communities, nor be prone to negative impacts on other societies or cultures [21]. In order to encourage the collection growth in line with the acquisitions and disposals policy, the Canterbury Museum in Christchurch in its long-term activity plan 2021–2031 indicates the collections development as a performance measure level of service [22]. Documentation from these museums in New Zealand—representing the “big four” [23]—highlights the importance of collections management for museums and the key elements that a good collections policy should include. In this sense, a collection policy incorporates specific actions dedicated to the correct implementation of online collections and considers acquisition and deaccessioning policies as fundamental for the care of collections and for their sustainable growth.
Beyond the preservation of collections, however, accessibility remains a pressing concern for museums today. Museums have been placing fewer items on display due to different circumstances, such as conservation needs and the lack of space in the main galleries, as a result of aesthetic criteria intended to avoid overwhelming visitors with too many objects, which could negatively impact the visitor experience [24,25,26,27]. Accordingly, collections have accumulated in storage, thereby making them “hidden” from the public eye and usable only by a small elite, such as scholars [28,29,30,31,32]. ICCROM [33]—which stands for the International Centre for the Study of the Preservation and Restoration of Cultural Property—showed that 90 per cent of the worldwide museum collections are kept in storage, thereby confirming the percentage of previous research conducted in the United Kingdom [34,35]. Furthermore, De Erfogoedmonitor [36] showed that approximately 20 per cent of museum collections are on display in the Netherlands. Recent research highlighted that 74 per cent of collections are housed in storage [37].
As has been seen, the stored collections have become the focus of the debate concerning the democratisation of culture, mainly because museums have been supported by public money [38,39,40,41]. Not only have they created the impression that museums keep the best pieces out of the reach of the bigger audience, but they also have triggered discontent as a social inequality [42]. The topic of stored collections and their usability is thus of paramount importance inasmuch as museums hold them in people’s trust to preserve them for today’s and tomorrow’s generations [43]. Nevertheless, they are supposed to be accessible to society.
In order to strike a balance between preservation and accessibility, museums can adopt several strategies. Amidst them, visible storage has been studied as a model of accessing collections exhibited in a high-density arrangement and developed over time from its first ambitious experiments, which took place at the University of British Columbia’s Museum of Anthropology in Vancouver in 1976 and the Glenbow Museum of Art in Calgary in 1978, both in Canada [29,30,31,42,44,45,46,47]. Additionally, collections can be used by other cultural institutions through loans and exchanges [48,49,50,51,52,53]. Ultimately, technological improvements, such as the digitisation of collections, can also allow anyone to access museum collections [54,55,56]. However, in order to implement these solutions, the extent of the stored collections needs quantifying.
Nevertheless, research highlighting the size of stored collections is not abundant. There are also a few studies concerning the size of stored items made available through different museum strategies. Although some studies have contributed to the former matter, the data are outdated and do not indicate the figures for each country [33], or in other cases, they refer to only a small number of countries, such as the United Kingdom [34,57,58] and the Netherlands [36]. Fundamentally, the primary literature has examined specific case studies focusing on one solution at a time rather than providing an overview of the main strategies adopted by museums in a particular country. To the best of our knowledge, there has been no research concerning the usage of stored collections in museums in New Zealand. Considering this, this study aims to provide a picture of the extent of the stored collections, the museum strategies adopted to enhance the need for accessibility, and how much each solution fulfils this purpose in museums in New Zealand.

2. Literature Review

Before research on the stored collections in New Zealand is developed, it is first necessary to acknowledge that some strategies have increasingly been implemented by museums in Western countries so as to ensure the accessibility of their collections. For example, museums enlarge access to stored collections in distinctive ways in different physical spaces, namely inside or outside their facility walls. From an internal perspective, not only are collections typically exhibited (through rotations from the storage reserve) within the museum’s main rooms in and of itself, but they can also be enjoyed in the (visible) storage, so far as people are allowed to come in. However, due to, for example, the lack of space within the museum facility, items are moved through loans and exchanges from the museum towards other cultural institutions, and digitised, thereby enlarging the audience [59,60].
In order to overcome the lack of space, some museums have turned to offsite storage rather than struggling with space limitation inside the museum premises. Offsite storage is an external facility that is detached from the museum it belongs to. It is less expensive and offers improved environmental control systems, especially when situated outside the city centre and far from natural disaster-prone areas [29,30,61,62]. Some examples of offsite storage are represented by the Louvre Conservation Centre in Liévin, the offsite storage in La Plaine Saint-Denis of the National Museum of Technology in Paris, the Smithsonian Institution’s Museum Support Centre in the United States, the offsite storage in East London of the Victoria and Albert Museum, and the National Collection Centre in Wroughton in the United Kingdom of the Science Museum Group [29,30,61,63,64,65,66,67]. In northern Europe, particularly in Denmark, a distinctive model of shared offsite storage has developed since the late 1980s [68]. This model involves more museums (at least two) that decide to manage a shared storage facility so as to reduce costs while maintaining high preservation standards. Some examples are represented by the cases of Aarhus, the Conservation Centre Vejle with 20 institutions involved, the storage facility in Rudkøbing for the Langelands Museums, and the Ribe with five institutions [68,69,70]. Other facilities of offsite shared storage were set up in other countries, e.g., in the United Kingdom with the Glasgow Museums Resource Centre and in the Netherlands with the depot in Leeuwarden. These examples demonstrate how shared storage can combine sustainability, low energy consumption, improved conservation conditions, and sustainable costs. These collaborative initiatives not only reduce individual institutional burdens but also set new standards for sustainable storage.
Regarding solutions to usage within the museum, some authors emphasise how the rotation of items represents a means to ensure protection owing to a decrease in long-term exposure to hazards, such as environmental conditions, dust, and security [46,71], especially for those museums that cannot ensure equal conditions in all premises of the museum [72,73]. Nevertheless, this practice results in a more well-organised retrieval process within the storage [72] and increases the accessibility of stored collections through fresh exhibitions with new themes, thus encouraging visitors to return regularly to museums [74,75].
In addition to museum exhibitions with rotated items, people can enjoy collections within museums by accessing visible storage. The primary literature has recently paid attention to some case studies of visible storage, mainly in Europe and the United States [26,58]. For example, Kisters [76] argues that, despite the increased access, visible storage is a money and time-consuming model that hardly represents a realistic practice for any museum. Nevertheless, storage is crucial since it serves educational purposes when made visible to the general public, meaning people who are not scholars, researchers, or students [35,40,57,72]. The visible storage can be accessed during regular museum opening hours, set times, or appointments [41]. Some visible storage can be accessed only on special events, tours, or exhibition halls [77]. Furthermore, people can visit it through store tours and appreciate being behind the scenes and seeing the staff working with objects, such as restoring, is as an exciting experience [41,74].
With regard to the usage of stored collections outside the museum facility, museums can lend, exchange, and digitise them so as to enlarge their use. Loans have been studied mainly as a significant aspect of collections management that develops through several stages before approval. The procedure comprises receiving the loan request, assessing the purpose of the loan, the borrower’s eligibility, the borrower’s facility, the conditions of collections, and negotiating the conditions of the agreement [48,50,52,59]. Once approved, loans represent an opportunity to give stored items a second life through exhibitions [78]. In order to complete the exhibition of permanent collections in the main museum galleries, museums sometimes mutually lend items of similar value, thus making an exchange [52]. Both loans and exchanges enable the audience to see real original objects [74,79]. Potentially, an unlimited audience can access the whole collection through the digital content as a “virtual” museum devoid of walls [80,81,82,83], which can disseminate knowledge regardless of the visitor’s location, gender, age, education, social status, and time of access [54,55,83].
This endless accessibility was stressed by Corona [84], who emphasised that the digitisation of collections ensures accessibility even in periods when physical access is not possible, as occurred during the lockdown for the COVID-19 virus outbreak, thereby overcoming the criticism related to the aura for the authenticity of collections [54,85]. The notion of the “loss of aura” originated in the 1930s and pertained to replicating artworks using mechanical means. It was contended that original things were considered unique not only because of their qualities, but also because they were irreplaceable and valuable goods containing information inaccessible in digital resources [86]. Nevertheless, due to digitisation, a new category of cultural consumers has emerged, for whom museums can transcend the constraints of their physical boundaries and venture into uncharted territories within the digital realm, also feeding digital heritage tourism [87]. Additionally, advancements in digitisation enable museums to support citizen curation and improve museum digital tools [88].
In enumerating strategies such as rotation, lending, exchange, digitisation, visible storage, and storage tours designed to enhance the accessibility of collections, it is crucial to highlight qualitative distinctions among these solutions. The accessibility afforded by visible storage, wherein a visitor can glimpse thousands of shelved museum artefacts through a transparent barrier, is fundamentally dissimilar from the accessibility achieved through rotation, lending, or even digitisation. As Brusius and Singh [58] elucidate, certain visible storage implementations prioritise spectacle over accessibility, wherein the visitor is captivated by the overwhelming abundance of the institution’s holdings.
Several studies have reported the extent of stored collections in other countries outside New Zealand. For instance, a study carried out by ICOM-Working Group on Collections on Storage- in 2024 showed that almost seven out of ten respondents to a survey reported they displayed less than 15% of their collections [89]. Another study highlighted that 74% of the entire collections are housed in storage [37]. Additionally, the ICCROM [33] reported that only 10 per cent of museum collections were displayed in the main galleries worldwide. Museums in England and Wales reported the same usage share [57]. That study showed increased stored collections compared to the estimation of 80% provided by Wilkinson [35], which confirmed previous results [34]. The latter research estimated the lowest share of stored collections in art museums (from 70 to 80 per cent), 90 per cent in science museums, 95 per cent in ethnographic, 96 per cent in archaeologic museums, and a peak of 99 per cent in biology and geology museums. Furthermore, the Erfgoedermonitor’s report [36] found that only 20 per cent of museum collections in the Netherlands are available to the public.
However, there is a notable lack of research on the extent of stored collections, how museums face the increasing accessibility of stored collections, and how many stored items can be accessed for each type of solution museums adopt in New Zealand. A previous study concerning stored collections in New Zealand was published in 2011 [90]. The research provided a glance at some initiatives adopted to access collections, such as the creation of online collections made available through the Matapihi and the NZMuseums search portals, the on-demand store tours at the Museum of New Zealand Te Papa Tongarewa and the Rotorua Museum, and the short-lasting exhibitions at Auckland Museum and the Waikato Museum. Furthermore, this research was focused on people’s opinions on stored collections and accessibility issues after they visited the Rotorua Museum, as well as the museum staff’s point of view. Although some research has described specific strategies through case studies and has investigated the impact of these strategies in other countries [48,58,91,92,93], an updated overview of adopted solutions to overcome the underuse of collections, especially in New Zealand, is currently lacking. Taking this into account, this study aims to provide information on stored collections, strategies adopted by museums to make collections accessible, and provide a measure of the impact of these strategies on stored items in terms of accessibility in museums in New Zealand.

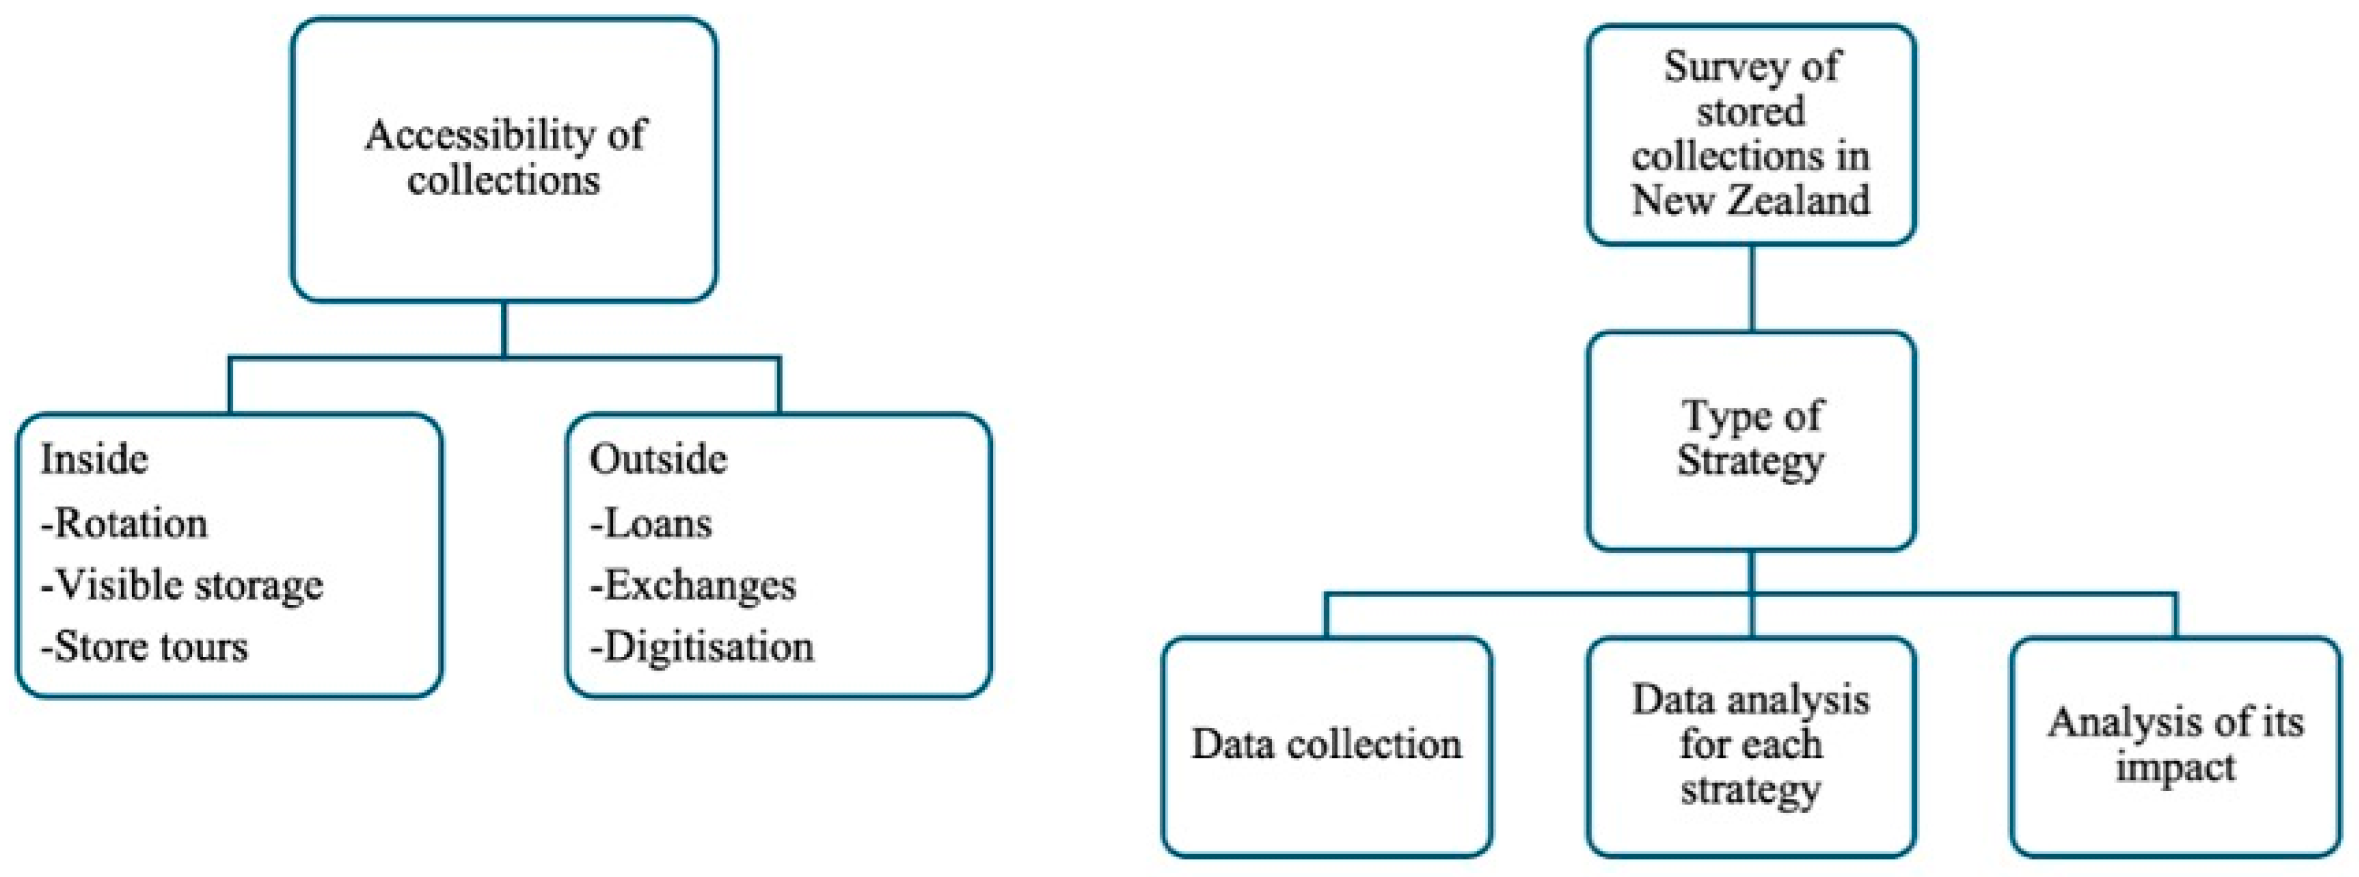
3. Conceptual Framework

This research develops according to a conceptual framework comprising the concept of rotation, visible storage and store tour, loan and exchange, and digitisation of items (see Figure 1). These concepts represent the strategies museums employ to enhance the accessibility of their collections, including those that are kept in storage [40,41,46,48,55,57,58,71,73,75,76,78,79,80,84,89,94]. All of them are related to the broad theme of accessibility.
First, accessibility is defined as “the degree to which museum services or environments are available and welcoming to as many people as possible” [95] (p. 98). The definition of a museum itself highlights the importance of accessibility and its openness to the public [96]. In order to reach real accessibility, all barriers need to be overcome. Thus, not only could physical, economic, cultural, and intellectual barriers affect the accessibility of collections [97] but also social, organisation [48], emotional, sensory constraints, access to information and decision-making [98], as well as digital access [99].
The accessibility of collections can be achieved through strategies that museums carry out inside (rotation, visible storage, store tours) or outside the museum (loans, exchanges, digital content). First, rotation refers to replacing some items from the museum galleries with items from storage, thereby exhibiting new themes for new interpretations [73]. Additionally, people can see collections inside the storage, where collections are stored and preserved and, if feasible, enjoyed by the public [100]. The latter possibility is fulfilled through visible storage, meaning the museum depot, where people can enter to see collections arranged in a high-density display format typically set for storing items [46,101]. It can be accessed in different ways [41], namely during regular museum opening hours, set times, arranging an appointment, or guided tours, and is an approach providing collections with interpretation and appreciation for the behind-the-scenes work [74].
Furthermore, collections are seen outside, in other museums, because of a loan, which Piacente summarised as “the contract between the borrower and the organiser, stipulating the responsibilities of both parties” [53] (p. 137). Likewise, collections can be displayed in another museum because of an exchange wherein institutions simultaneously are both lenders and borrowers of goods of equal value [102]. Beyond any physical constraints, collections can be accessed through digital content as the outcome of digitisation, which NEMO-which stands for Network for European Museum Organization- indicates as the process through which unique, fragile, and irreplaceable items are converted into analogue originals [103].
Hence, as shown in Figure 1, the conceptual framework comprises the rotation, lending, exchange, digitisation of items, visible storage, and store tour. These elements were examined through a survey disseminated amongst museums in New Zealand between December 2020 and January 2021. More specifically, this study is part of broader research within a PhD programme defended in 2023. The study investigates which solutions make stored collections more accessible.

4. Materials and Methods

4.1. Sample and Sampling Techniques

This study is based on quantitative data concerning several aspects of the stored collections in museums in New Zealand. The data were provided by a sample of museums in New Zealand selected using the national directories of museums in New Zealand [104,105]. In total, 101 museums representing a wide range of museums in terms of the type of collections, governance, and size of collections—according to the number of items in museum collections, meaning small (up to 100,000 items), medium (from 100,001 to 1 million), and large collections (from 1,000,001 items)—were selected to participate in the research. Nevertheless, only 15 respondents (15%) provided feedback. Many museums communicated that, despite their will to take part in this study, they could not participate due to the closure of museums in their country as a measure against the spread of the coronavirus. For this reason, it cannot be excluded that this study would have had more participants if it had not encountered the COVID-19 pandemic. As shown in Table 1, most participants have a public legal status, such as a trust (public enterprise) or a public foundation. In addition, as shown in Table 2, the average participant has a historical collection of a small size (Table 3). By and large, the sample is appropriate because participants mirror the distribution of museums across the country according to the size of museums featured by a predominance of small museums (89%) in comparison to large (4%) and medium museums (7%) [106].

4.2. Research Tools and Procedures

The sample provided data through an anonymous online survey, first delivered via email to the selected museums (complete questionnaire shown in the Supplementary Materials). One survey per museum was mainly filled out by collection managers, registrars, and directors. This study maintained the participants’ anonymity per ethical guidelines to encourage museums to complete the survey. Indeed, museums could be reluctant to deliberately show how much and how they use their collections, discouraging them from participating in the research. Therefore, an anonymous survey was considered appropriate for this study. Secondly, in an attempt to mitigate the risk of a lack of participants, the same survey was sent to the ICOM New Zealand office for its dissemination amongst the museum community of the country.

4.3. Data Analysis Techniques

Upon completing the survey, data were collected. First, parameters were defined, such as the museum’s governance (fundamentally public or private), the type (art, history…), and the size of collections (hence, according to the number of pieces: small museums, up to 100,000 items; medium size museum: from 100,001 to 1,000,000 pieces; large museum: from 1,000,001 pieces). Afterwards, the data were used for quantitative analysis through pivot tables in Excel, highlighting essential aspects of stored collections. For instance, the average of stored collections was calculated. Then, an analysis of its correlation with the size of collections was conducted to evaluate whether and how these variables impact the degree of accessibility of collections. Then, the stored collection average was studied according to the type of collections and, ultimately, the type of legal status of the museum. The same method was utilised to estimate how these parameters (size and type of collections, governance), in combination with different strategies of using collections (digital, visible storage…), affect their accessibility.

5. Results

5.1. Stored Collections

The first aim of this study was to estimate the extent of stored collections. As seen in Table 4, an average of 84% of the collections are stored. According to the size of the collections, the analysis showed large museums have almost all collections in storage (nearly 100%), meaning less than 1% of collections are available to people. Additionally, findings demonstrate how large museums are more prone to store collections than medium (80%) and small museums (82%).
Besides the size of collections, museums reported different stored collections according to the types of collections, as shown in Table 4. For instance, 95% of collections in art museums were, on average, kept in storage, in contrast to 60% in museums with science and technology collections.
The analysis of the extent of stored collections according to the legal status of museums is summarised in Table 5. Museums, whose legal status can be related to the public sphere, including museums that are part/a department of other institutions, such as universities and banks, kept more items in storage than private institutions.
This research’s second and third aims were to provide a picture of strategies to enhance the accessibility of stored collections and highlight how much they impact the collection’s accessibility. Amongst these strategies, museums indicated opening collections through visible storage.

5.2. Visible Storage

The results concerning visible storage are presented in Table 6. Given an average usage of 55% of the stored collections inside the depot, a considerable difference in use was found between small (38%) and medium and large museums (90% each). Going deeper into the analysis, visible storage with historical collections differs in usage when managed by medium (90%) or small museums (38%), as shown in Table 6. Historical collections (55%) are more used than science and technology collections (30%).
Table 7 illustrates the analysis according to the legal status. The results revealed that the stored collections differed considerably from public trust (15%) and national and regional museums (90%). These findings could be interpreted by how stored collections are made more available in museums with broader territorial governance.
In order to assess the accessibility of the storage facility, museums were asked to indicate and estimate the type of users of their visible storage, as displayed in Table 8. All respondents indicated visitors coming from the museum’s main galleries were the foremost visitors to the storage. Additionally, almost the same portion of museums have visitors like researchers (67%) and people who visited the museum storage (60%) but did not access the museum’s main galleries. Only one out of three (33%) reported visits from schools.
There were various types of visible storage, as shown in Table 9. For example, no respondents made the storage visible through the exhibition halls through glass windows, whereas all ensured access through appointments. If, on the one hand, few museums opened the storage during regular times (20%), on the other, a large portion of them provided store tours (83%) and openings for special events (67%).
As can be observed in Table 10, 67% of museums did not charge an extra fee for visiting the storage. Nevertheless, the remaining participants indicated a ticket payment as a standard modality of access (17%) and free entry only for researchers (16%).
Data related to the number of visitors to visible storage compared with the total of visits to the museum are illustrated in Table 11. There were differences between science and technology collections (30%), other (68%), and history collections (55%). Additionally, the analysis demonstrated differences between the same type of collections when part of museums of different sizes. For instance, there was a difference between small historical museums (38%) and medium ones (90%). The survey reported an average number of visits to the storage of 900 visits per year.
According to survey findings, all museums have onsite and offsite storage. As indicated in Table 12, all museums had onsite storage, but approximately one in eight (83%) museums had offsite depots. The analysis also revealed that offsite storage was sometimes shared with other institutions, precisely up to four, with an average of two organisations for shared offsite storage.
In order to assess the accessibility of the facility, it was essential to consider the distance from the museum to the depot. Not only was a large part of offsite storage 20 km away from the museums on average (75%), but they also did not include any public transportation to reach them.

5.3. Rotation

Another strategy to enhance the accessibility of collections is rotation, as shown in Table 13. With the average usage of 28% of stored items, use was shown to be higher in medium museums (45%), followed by small (25%) and large museums (15%). Additionally, the findings of the usage for the type of collections demonstrated differences across collections. The higher use was found in art museums (38%), followed by history (28%) and other collections (15%).
As displayed in Table 14, data on the legal status show differences between museums that are part of other institutions (15%), regional and national museums (15%), and museums in partnership with local governments and private, non-profit bodies (45%).

5.4. Loans

Another strategy museums reported was lending stored items, allowing them to use 18% of the stored items. Table 15 shows a slight difference in usage according to the museum size, with higher use for medium museums (23%) and lower for larger ones (15%). Thus, the trend was the same for rotation, albeit with different percentages. Additionally, according to the type of the collection, art and “other” items (15%) are lent less frequently than historical (18%).
Adding the information on the legal status of museums, given an average usage of 15%, differences were reported between non-profit organisations (30%) and public museums (15%), as shown in Table 16.

5.5. Exchange

Another important result concerns the exchange of items, enabling museums to use 17% of stored items, as shown in Table 17. With the same trend for rotation and loan, the stored items were higher for medium museums (23%) and lower for smaller ones (15%). The difference between rotation and loan was that the percentage of usage for museums with medium collections occupied an intermediate position, whereas it had a lower percentage for exchange (15%). Additionally, the percentage of usage for exchange and loans differs only from the percentage of use in small museums.
With regard to the type of collections, Table 18 presents the usage percentages in different museums according to the type of collections. Some differences between the categories of collections were found. As for loans, the highest usage was reported by science and technology collections (30%), and history collections (19%) are more used than art and “other” collections (15%). Data show no considerable differences between legal statuses (15%), except for local museums (23%).

5.6. Digitisation

Ultimately, museums indicated the digitisation of items to use stored items, as shown in Table 19. The size of the collections was found to be a crucial determinant of the usage of stored collections. The average digitisation of stored items is 41%.
According to the size of collections, stored collections were used more in medium museums (60%), followed by small (39%) and large museums (15%).
According to the type of collection, the findings confirmed, even if with different percentages, the trend of usage reported for the loan, exchange, and rotation, with higher usage for history collection (47%) and lower use for art and “other” collections (30%), as shown in Table 19.
Regarding governance, Table 20 presents the usage according to the type of governance. There were some differences between use and legal status, with higher levels for private organisations (90%), national museums (75%), and partnerships with the state (60%), in comparison with regional (45%) and the other types (15%).
Table 21 illustrates the average visits according to the size of the museum collections. Both onsite and online visits to the websites were indicated and compared, as well as the number of visits to the online collections on the number of visits to the website. Surprisingly, the number of visits to the website was greater than the museum visits only for medium museums (120%) and only 26% for small institutions. Moreover, only a few visitors demonstrated interest in digitised collections in small (8%) and medium museums (12%).
In order to assess the accessibility of the digital content, museums were asked to indicate if and where they were represented on the Internet, as shown in Table 22. All respondents had a website (100%). Smaller museums are represented more through a wide range of channels, from Google Art Project (90% of museums), regional sites and aggregators (75%), Wikipedia and Wikimedia (82%) to social media (71%). Unlike small museums, large institutions have reported a lack of presence on Wikipedia, Wikimedia, and Google Art Project. The presence in the regional sites, as well as in other aggregators, ranged from 8% to 82%, according to the size of the collections.
Going deeper with the analysis, it was found that historical museums represented their collections on social media (50%), portals (42%), Google Art Project (40%), and Wikipedia (36%), as shown in Table 23. In contrast, the lowest representation was observed among museums with science and technology collections.
The analysis of the data for legal status highlighted a higher presence on the Internet for public trust museums (25%) and lower for partnerships between local government and a trust, private institutions, and organisations that are part of central government (8%), and a total absence for museums that were part of other institutions, as displayed in Table 24.

6. Discussion

Results from this study show that museums in New Zealand store an average of 84% of their collections, as indicated in Table 4. This study corroborates the findings of stored collections in the Netherlands, where the average stored collection is approximately 80% [36]. The slightly higher percentage of stored collections in New Zealand could be explained by the different sample sizes (616 museums) used in the Netherlands and by the fact that data were gathered over five years.
Nevertheless, the type of governance and the type and size of collections impact these data, as shown in Table 4 and Table 5. According to the size of collections, large museums are prone to store almost the whole collection. This study is consistent with the previous literature that reported approximately the exact extent of stored collections (95–99%) in large museums [31]. The trend across museums with different sizes of collections suggests that the more items museums have, the more they hold them in storage.
According to the type of collections, science collections tend to be more accessible (60% in storage) than art items (95% in storage). These results differ from those from the United Kingdom [34], which showed how museums with science collections stored more items (90%) than art museums (70–80%). One possible reason for this discrepancy could be that science museums have experienced a decline in acquisitions over time, thus resulting in fewer items being stored in storage. On the contrary, art museums might have increased acquisitions of the number of artworks comprising large-scale works, which typically require more storage space. Additionally, strategic changes in collection care and display practices may have contributed to this shift. Moreover, these studies were conducted over three decades apart and in different national contexts. Precisely, data from the study in the United Kingdom were collected in 1989, while the present study was conducted in New Zealand and gathered data in 2021. Consequently, important changes in museological practices could have played a crucial role over time in determining these differences, such as the rise in digital access, shifts towards more inclusive collecting policies, and an increased interest in visible storage or rotational displays.
According to the governance, public institutions, or those related to the public sphere, store fewer items. This study further supports the assumption that museums that benefit from central or local financial aid differ from private organisations whose survival depends on tickets, gifts, shops, restaurants, and governmental funds [107]. Moreover, these data align with previous research that reported how public museums received funds from the authority they were part of. In contrast, charitable trusts and private institutions had different funding sources, including sponsorship [80]. A private, non-profit organisation could probably be motivated to increase the mobility of its collections because it can rely only on its items to obtain economic relief, i.e., by lending stored items. Consequently, private museums are likely to use more of their collections and decrease the size of stored collections.
With regard to the strategies museums adopted to increase the accessibility of their stored collections, data reveal that visible storage is the most effective solution across museums, with differences in the percentages of items made accessible according to the size of collections (small collections 38% versus 90% each for medium and large collections). This study confirms that small museums have lower financial resources in New Zealand [108]. Indeed, it is likely that small museums cannot afford a building as extensive as required to display more items. Likewise, some differences are reported according to the type of collection (history 55%, science and technology 30%). Similarly to a study conducted in the United States, scientific collections are more likely to be damaged or lost due to physical and chemical deterioration, pests, or handling [82]. This might mean that science and technology collections are used less to mitigate the associated risks. Additionally, some differences are reported in the dimension of stored collections in public trust (15%) and national and regional museums (90%). These findings could be interpreted in how stored collections are made more available in museums with broader territorial governance.
With regard to the type of users of their visible storage, 33% of respondents reported visits from schools, as shown in Table 8. These data align with the results obtained by a study in New Zealand that reported that museums offered educational programmes for 39% of students [106]. The ongoing low engagement of schools might be overcome with more effective cooperation between museums and schools to increase the offer of educational programmes.
As can be observed in Table 9, many museums offer store tours (83%) and openings for special events (67%) in their visible storage. These findings are in agreement with previous studies that consider a store tour an experience more meaningful than a simple visit to the storage. Museums are likely to offer store tours so visitors can better interpret and appreciate the collections [109] and fulfil the urge for intellectual access [48,98,110]. Contrary to earlier findings obtained by Keene, Stevenson, and Monti [57], the analysis demonstrated more availability through appointments (100%), presumably for researchers and groups, rather than a generalised opening for the general public (20%). A potential cause of these discrepancies might be that having purposed storage, whereby collections are permanently shown, and people are allowed to see them, is expensive [76]. As a result, museums prefer offering access by appointment to mitigate the costs. It is key to point out that financial considerations consist in the type of depot, such as specific facilities or exhibitions through glass windows inside the museum itself, e.g., the storage exhibition held by the National Museum of Australia [32].
As shown in Table 10, although 67% of museums did not charge an extra fee for visiting the storage, 17% charged the visit to visible storage. Similarly to previous research highlighting how the lack of affordability is an obstacle, cultural access appears to be ensured by not charging the entrance to the depot [48].
As illustrated in Table 11, the average number of visits to the storage (900 per year) is higher than most other studies, which indicated more than 400 visits and up to 1000 visits for only 10% of museums [57]. Additionally, this study shows more visits to large museums than to smaller ones, which is the opposite of what was indicated by Keene et al. [57]. Nevertheless, the average number of museum visits of 89,353 is in line with the report issued for museums in New Zealand of approximately 100,000 visitors per year [111]. These findings might indicate that visitors are interested in stored collections and appreciate augmenting the museum visit with the experience of the visible storage.
According to the findings in Table 12, 83% of respondents have offsite depots that are sometimes shared with other institutions. Data about offsite storage suggest that museums have collected so many items throughout the years that space on premises inside their museums is not enough. Also, it implies that museums are reluctant to embrace the deaccessioning practice, probably because of criticism raised in the past [6,14,15,94,112,113]. Additionally, on average, most of them (75%) are 20 km away from the museums, and there is no public transportation to reach them. As a result, offsite storage devoid of transportation service is far from being accessible, to the detriment of all, including the staff, researchers, and potential visitors, who could give up their visit because they do not have a car and cannot rely on the service of a bus or train. Not only might offsite storage threaten physical accessibility but also economic accessibility since having cars is more expensive than paying for a bus or train ticket. It confirms how access is more difficult for offsite storage [57].
As illustrated in Table 13, another strategy to enhance the accessibility of collections is rotation, which small museums widely use. One reason for this could be that smaller museums use rotation to create new themes for novel exhibitions, considering that they acquire less [106]. As displayed in Table 14, rotation is highly used in museums in partnership with local governments and private, non-profit bodies (45%). These findings might indicate how non-profit museums overcome the difficulties of creating new exhibitions through acquisitions due to the lack of governmental funds [106] by rotating items.
Another strategy museums reported was lending stored items, especially for science and technology items (30%), as indicated in Table 15. Other research [114] demonstrates that science and technological collections are used more intensely (30%).
According to the legal status of museums, given an average usage of 15%, differences were reported between percentages of items lent by non-profit organisations (30%) and public museums (15%), as shown in Table 16. One reason for this could be that public museums receive more funds. Therefore, museums with lower funds are likely to lend their items to obtain the resources to borrow or acquire items from other institutions to create new exhibitions.
Another strategy adopted by museums is represented by exchanges of items among institutions. The percentage of usage of stored items for exchange and loans differs only from the percentage of use in small museums. Many items do not have many opportunities to be exchanged because they have no market [115], which could justify the consistent difference in the average usage for exchange and visible storage (55%).
With regard to the type of collections, data in Table 18 show no considerable differences between legal statuses (15%), except for local museums (23%). This difference suggests more extensive accountability for local museums, which could pay more attention to how they manage their collections. On the other hand, local museums are institutions closer to the community than national museums.
Lastly, museums indicated the digitisation of items as a solution to use stored items, according to the data shown in Table 19. The average digitisation of 41% of stored items is below 67% of stored collections in the United Kingdom [57]. Nevertheless, the data confirm recent results reporting 41% as the average percentage of digitisation of stored collections [37]. In contrast, the average digitisation of the whole collection is 45% against the average of 33% in Europe, of which only one-third is on the Internet [116].
According to the size of collections, medium museums use the digitisation of items (60%) more than small (39%) and large museums (15%). These results are in alignment with recent findings obtained by Corona [37], who highlighted that large museums digitise fewer items (21%) than medium (30%) and small museums (46%). It seems that museums in New Zealand digitise more items, even if fewer are from the depot. One possible explanation for this discrepancy is related to the size of collections, whereby small museums use their resources in digitisation to attract more visitors in the virtual realm, considering that they cannot compete in the physical world with expensive acquisitions against superstar museums [117].
Contrary to a previous study [114], art museums (30%) do not digitise more than other museums, as indicated in Table 19. Recent research provided the same trend of digitisation rate amongst the types of collections, with 47% in history museums, 56% in art museums, and 41% for museums with “other” collections [37]. One reason might be that museums with historical collections have understood this tool’s potential to reach a wider audience.
Regarding governance, Table 20 reveals that, contrary to previous research on London museums that showed low use of digitisation practice [114], local museums in New Zealand (40%) digitise collections. These differences might be explained by the fact that digitisation has developed since that study was conducted. Nevertheless, more research is needed to confirm this.
With regard to the number of visits to the website, only medium museums reported high visits (120%) versus only 26% from small institutions, as indicated in Table 21. Moreover, only a few visitors demonstrated interest in digitised collections in small (8%) and medium museums (12%). These results confirm previous studies that concluded that frequent museum visitors prefer the comfort of physical visits [118,119]. Contrary to an earlier study that considered the digital experience as a producer of more extensive utility [120], a potential cause of the limited number of online visits to collections (15%) is that the digital content might be better appreciated with a higher level of knowledge and skills. For this reason, it is crucial that digital content be presented so that anyone can understand it.
Findings highlight a significant presence of museums on the Internet (Table 22). These results differ significantly from another research conducted by Keene et al. [57], which demonstrated that only 25% of museums had their collections represented at some level. The improved digitisation procedure might explain this discrepancy since Keene’s study was conducted earlier. Additionally, these findings differ from previous research in New Zealand that showed that 407 of 476 museums (85%) and their collections were represented on the NZMuseums website [108]. On the other hand, this study includes more than one aggregator. Hence, it refers not only to the NZMuseums website.
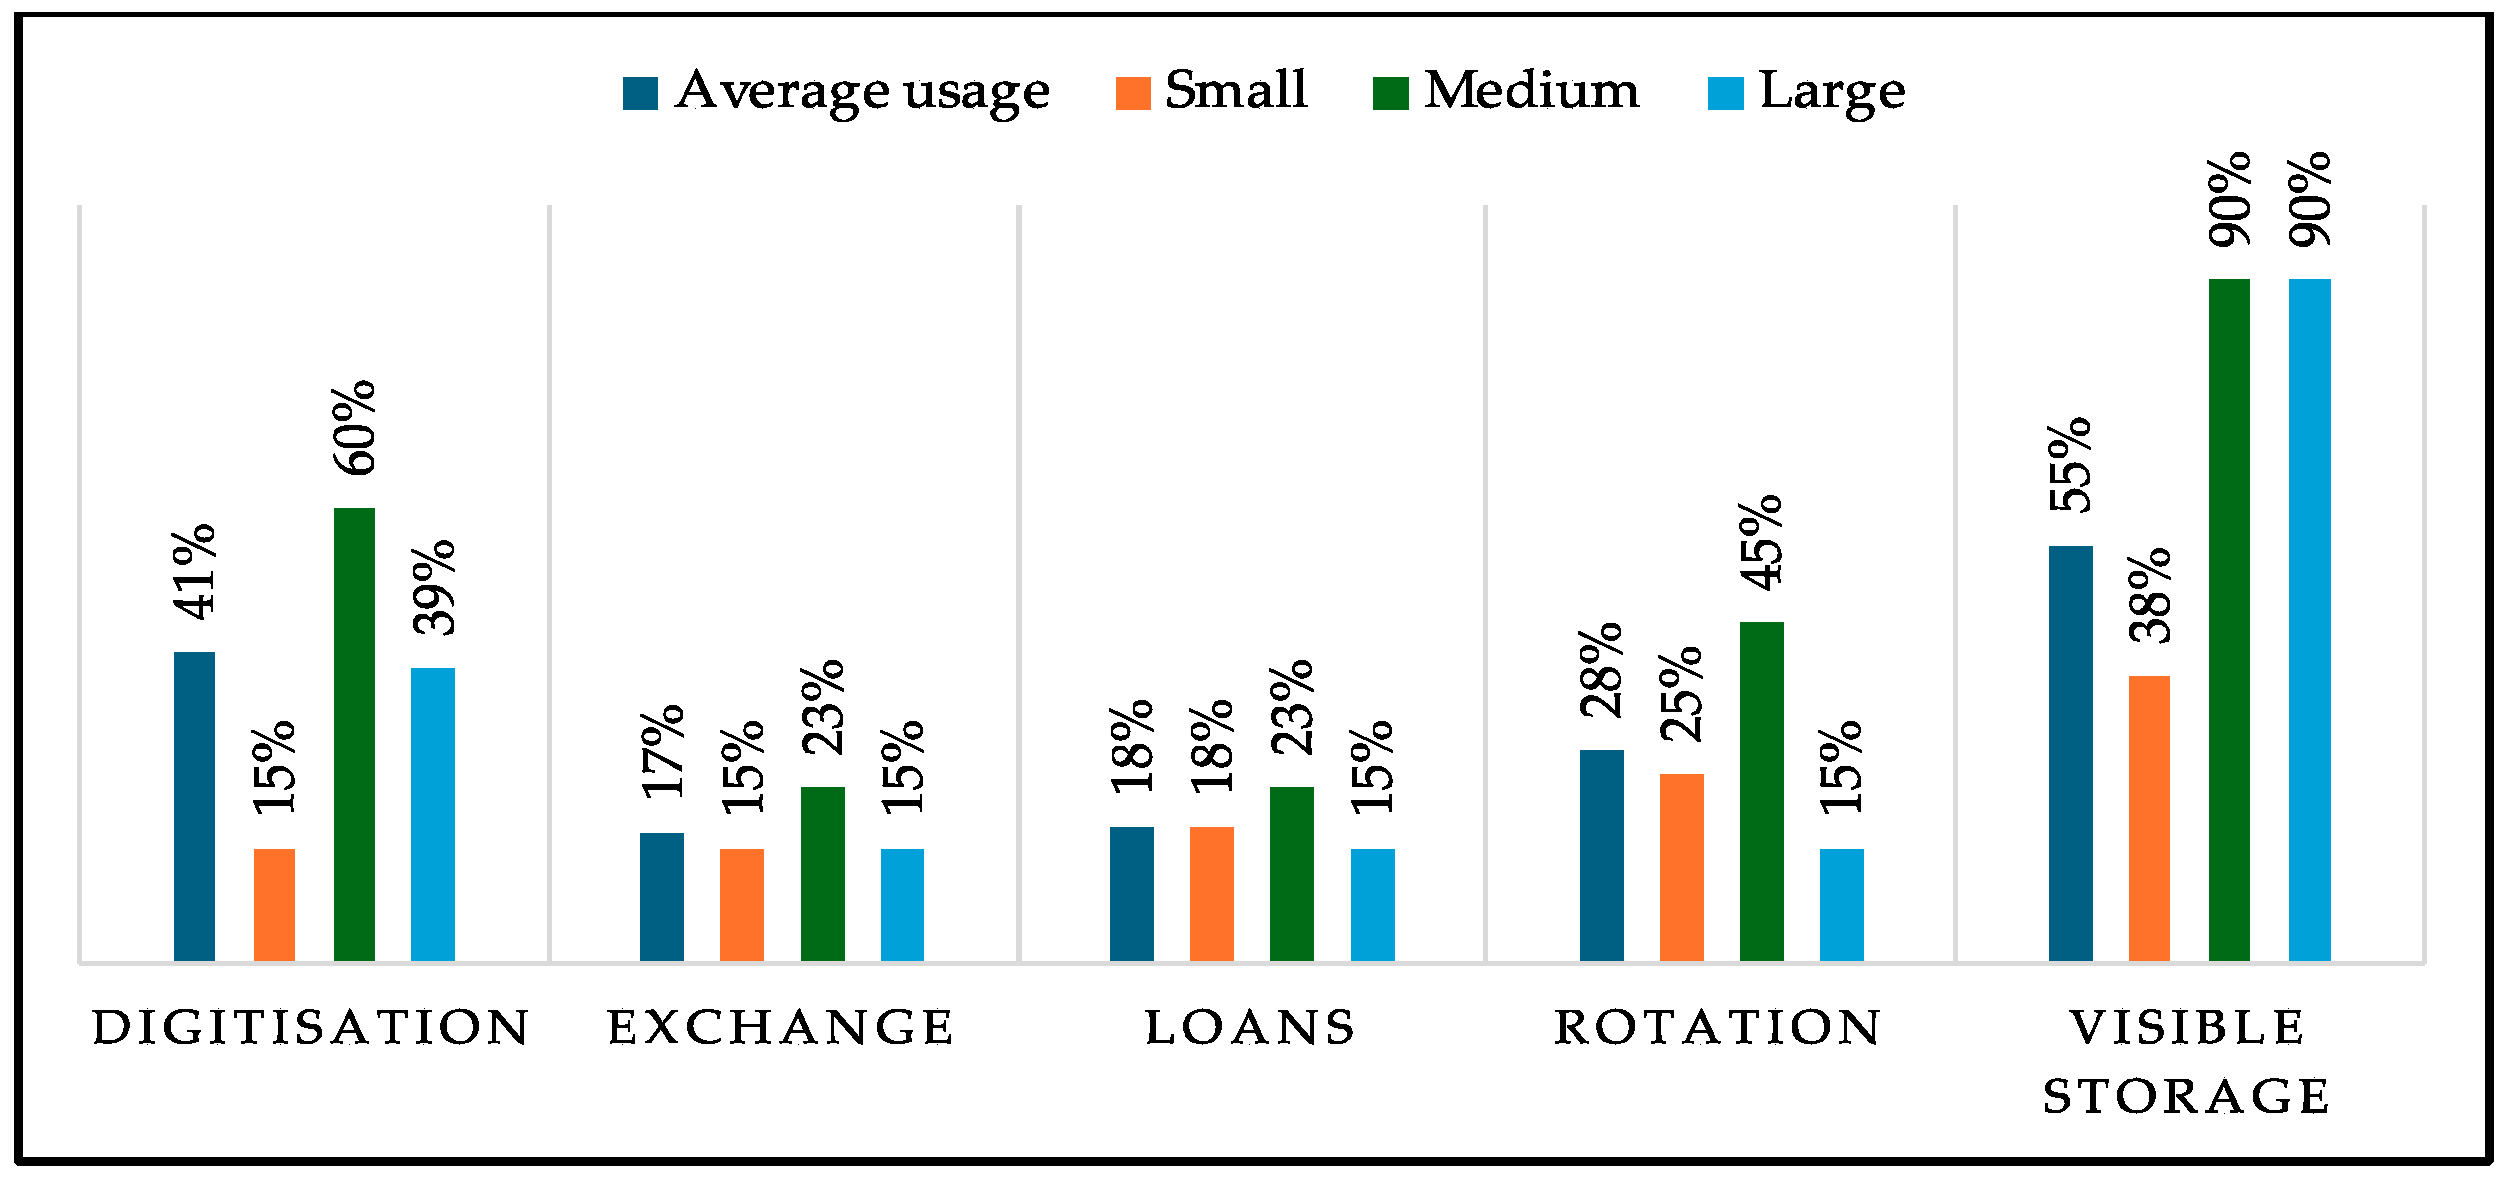
A crucial result that emerged from this research is that museums use stored collections in different ways: digitisation, exchanges, loans, rotations, and through visible storage. Considering the results shown in the previous sections, it is possible to compare the solutions adopted by museums to enhance the accessibility of stored collections, as shown in Figure 2. The data demonstrate that visible storage (55%) and digitisation (41%) are the strategies that enable museums to display more. Specifically, the analysis shows that small museums display more items through visible storage (38%) than medium and large museums (90% each). Nevertheless, small museums use digitisation for fewer items (15%) than medium (60%) and large museums (39%). Moreover, museums exchange the same percentage of stored items (15%) if they hold small and large collections, whereas the percentage of usage increases for medium museums (23%). Likewise, small museums lend more items (18%) than large museums (15%) but fewer than medium museums (23%). Similarly, museums with small collections rotate items from the storage (25%) more than those with large collections (15%), but fewer than museums with medium collections (45%). According to the data, museums struggle more to make large collections accessible, with the only exception of visible storage. These findings suggest that the size of collections is a pivotal factor in the extent of the accessibility of stored collections.
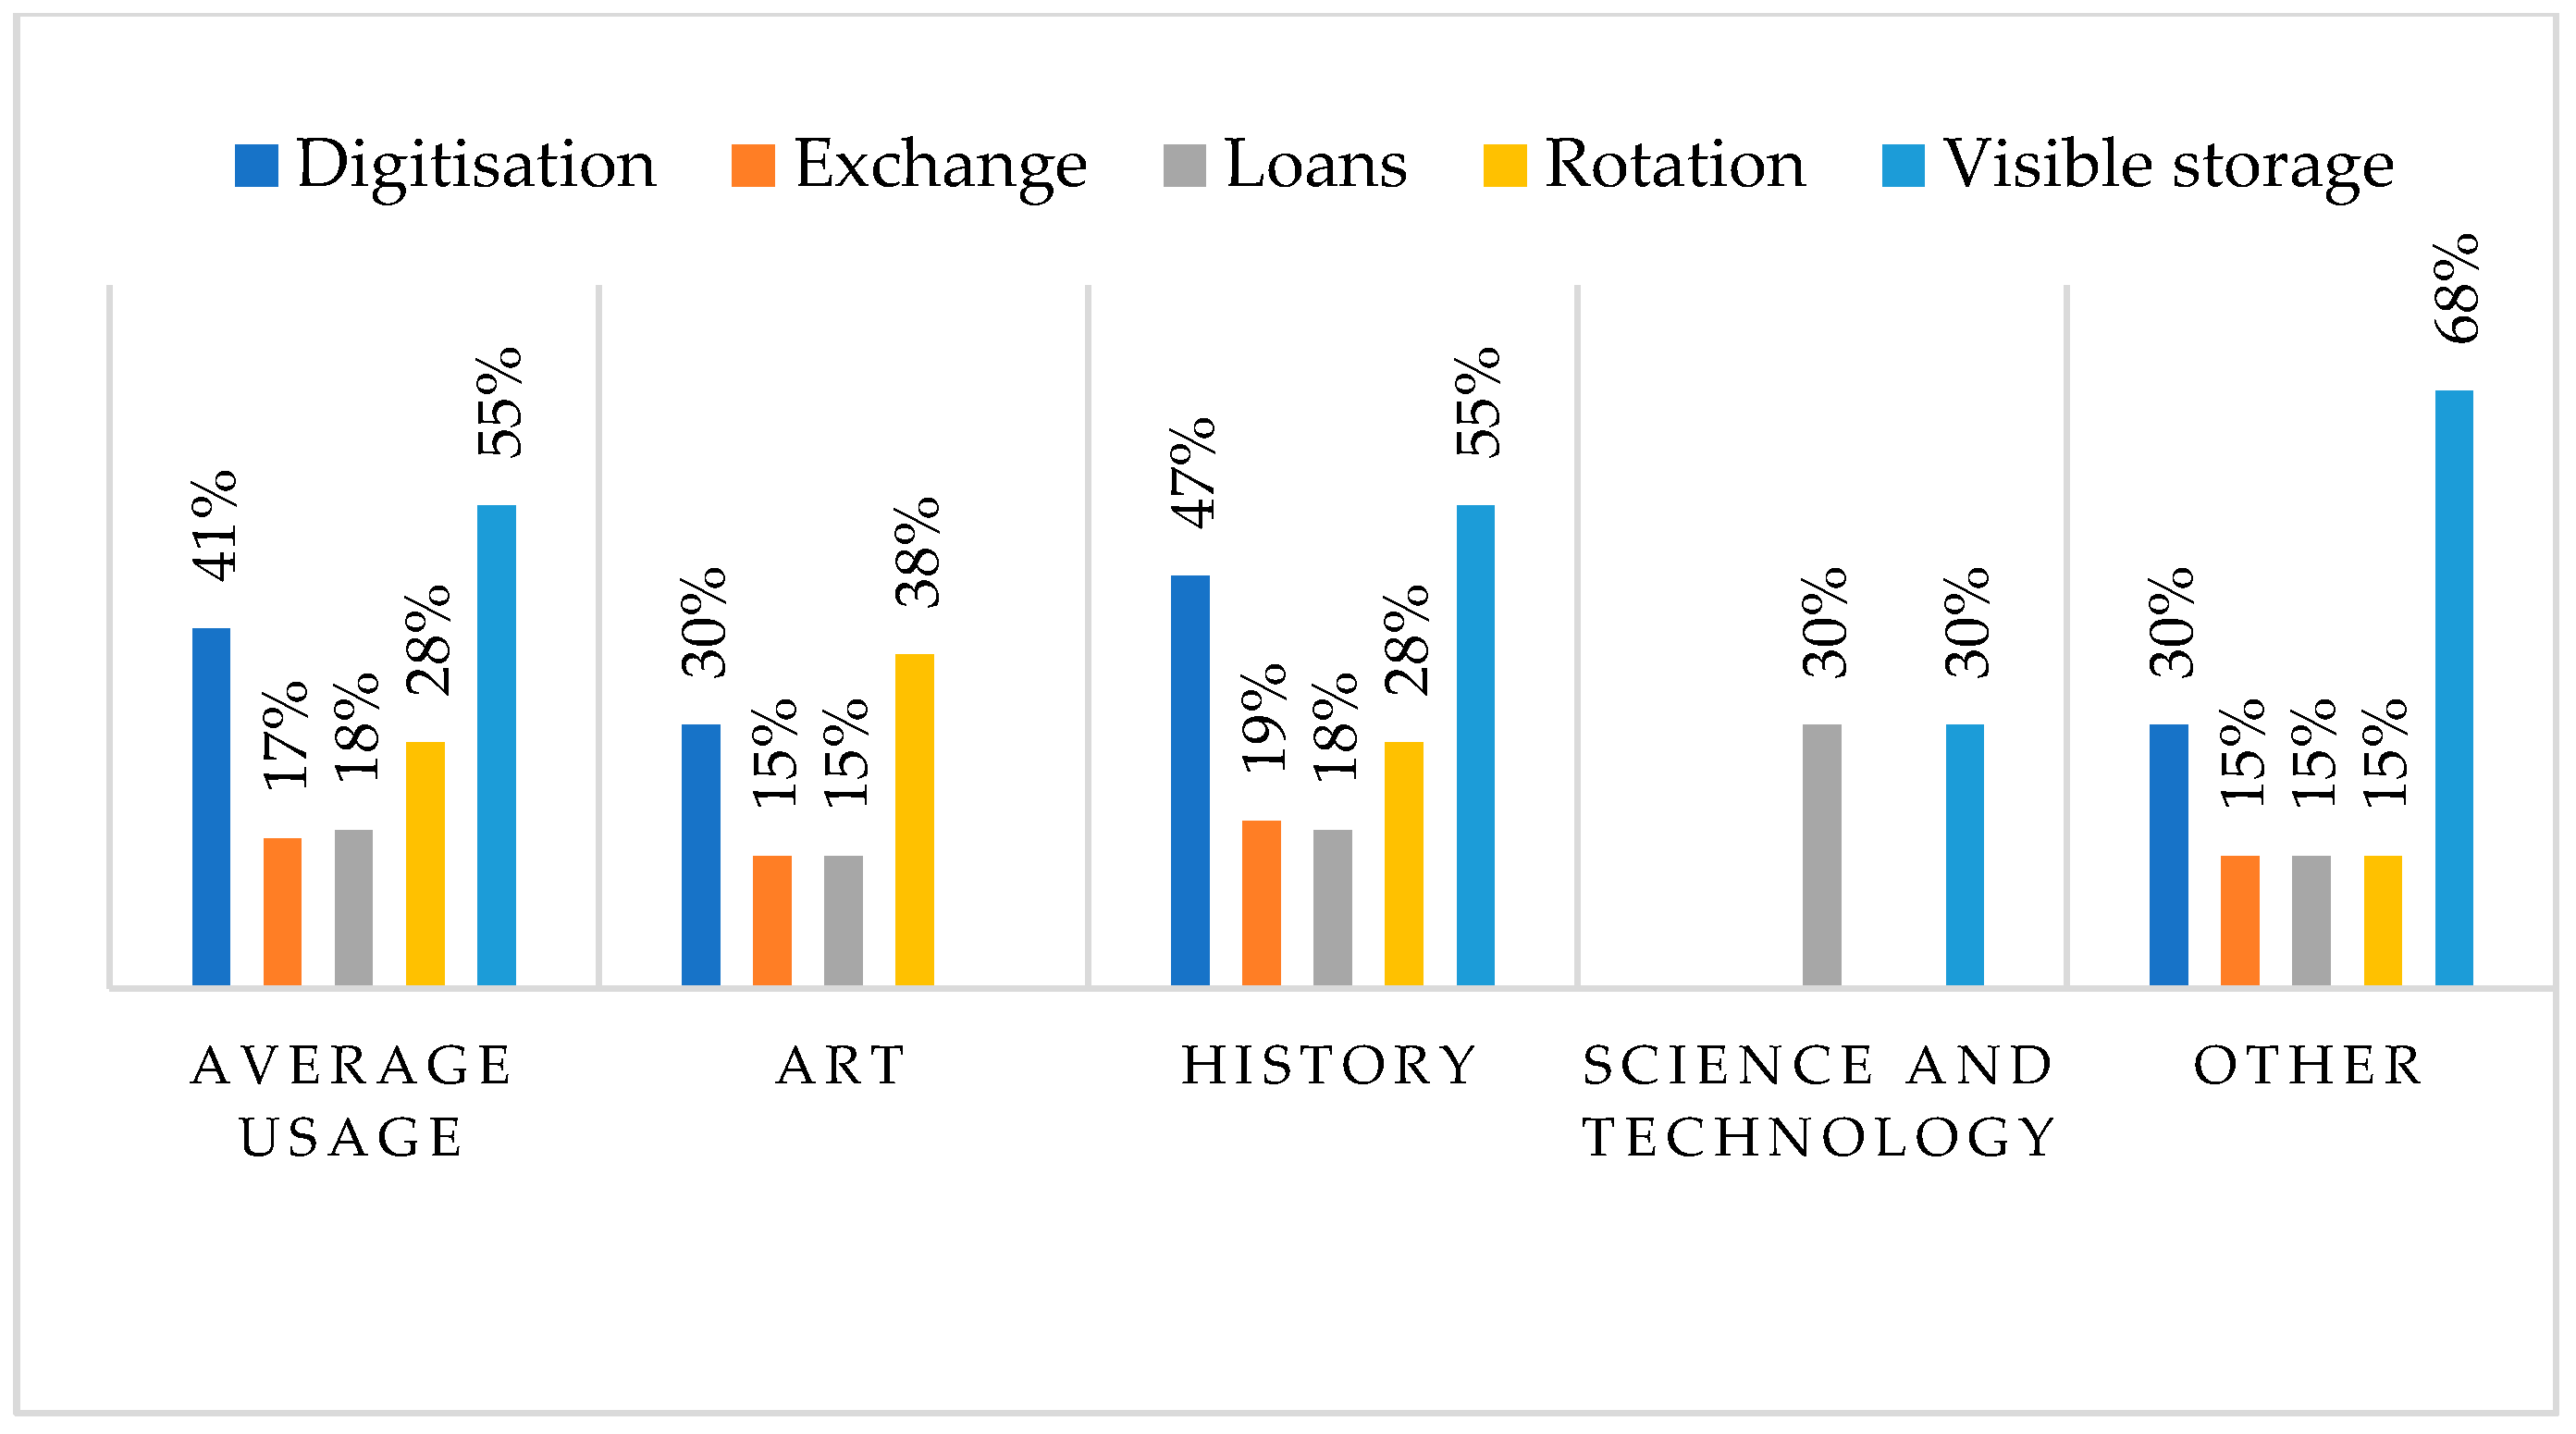
According to the types of collections, museums with history collections show the highest accessibility across all strategies, especially digitisation (55%), as shown in Figure 3. Art collections are more rotated and digitised (38% and 30%, respectively), but less used in loans and exchanges (15% each). Science and technology collections had the lowest usage across most strategies (30% for loans and visible storage). These results suggest that not only the size of the collection but also the type of collection is crucial in determining the size of usage of stored collections [37]. Overall, despite the higher percentage of usage provided by visible storage (55%), it is important to acknowledge that digitisation (41%) demonstrated its value during times when physical access to museums (and visible storage) was restricted due to the COVID-19 pandemic [56,121]. Indeed, digital content maintained public engagement and achieved educational purposes, thereby overcoming criticism related to the concept of “the loss of aura” associated with the mechanical reproduction of artworks, whose qualities are not replaceable [54,85]. Due to digitisation, a growing number of digital users are currently part of cultural consumers engaged with digital collections, including new forms of engagement, such as digital heritage tourism [87,122]. This development has not only made collections more accessible, but it also has empowered practices such as citizen curation and the enhancement of museum digital interfaces [123,124]. Together, the present results confirm that museums can benefit from varying strategies to compensate for the advantages and disadvantages of each one of them [31,125].

7. Conclusions

In this study, a starting point for further research using qualitative methodology that can enrich the final results, we provided a picture of the extent of stored collections in museums in New Zealand. At this stage of the paper, it is important to point out that the study encountered some limitations. One major limitation is the sample size and, as a consequence, the potential response bias of the results. Secondly, the conditions collections were not considered in the analysis. Finally, the research lacks information on assessing the conditions of collections and visitors’ points of view. Bearing this in mind, it is recommended that future studies investigate qualitative topics, such as how conditions of collections affect their accessibility, what the general audience opines about accessing stored items, and consider a more extensive sample of museums.
Despite these limitations, the present analysis provides important new information about the size of stored collections, the strategies adopted by museums to increase their accessibility, and a measure of how these strategies have impacted the accessibility of stored items in New Zealand. This is the first study to indicate the size of stored collections in this country. The share of stored collections (84%), according to the survey disseminated in 2020–2021, was lower than in a previous global report conducted in 2011 [33]. Nevertheless, our finding is consistent with a more recent study in the Netherlands [36]. This result could be interpreted as a mindset change towards broader accessibility of collections achieved through different ways of using stored items throughout the years.
Furthermore, the analysis sheds light on how museums use stored items and reveals how much they are accessible to everyone. The strategies that led to the utmost accessibility were setting up visible storage (55%) and digitising stored items (41%). Although strategies are far from cheap [76,126], these findings suggest they enable museums to improve the accessibility of collections.
The study showed the types of accessing visible storage and digital content, and their impact on the accessibility of collections and visitors. Specifically, it demonstrated that approximately the same number of people visited the visible storage (55%, as shown in Table 11) and the website (57%, as shown in Table 21) compared to the museum visits, of which 15% visited the online collections. This challenges the assumption that there are usually more online users than onsite visitors [127]. These results suggest that the general public is likely interested in having a direct experience with the stored collections. They appreciate their interpretation provided with store tours to understand them at best.
The results of this study have some important implications for practice, particularly in terms of the actions museums could adopt to improve the accessibility of collections. For instance, in order to fulfil physical accessibility, museums could contemplate how to mitigate the distance between the museum and the offsite storage: not only could they make arrangements with local authorities to set up public transportation, but they could also offer a shuttle service for free and ensure parking areas. Museums could improve accessibility through more flexible access, such as regular times.
Although this research mainly focuses on strategies to enhance the accessibility of stored collections according to a quantitative analysis, it is essential to acknowledge that real accessibility implies many factors, including access to information [98]. On the one hand, rotations, loans, store tours, and visible storage boost the accessibility of stored collections. Conversely, they might hinder opportunities to provide crucial information, comprising provenance and historical context. On the contrary, digitisation can provide the audience with comprehensive metadata and narratives for each item.
Although contextualisation is not the main aim of this study, it is crucial to acknowledge that, to fulfil educational purposes, the availability of collections needs to be accompanied by the interpretation to educate visitors about the meaning of those items. In order to enhance understanding of collections, museums can use simple, inclusive language, offer diverse educational programmes, and ensure the sustainability and availability of information for all visitors [128].
The findings of this research might provide museums with helpful directions on which strategies are more suitable. For instance, small museums could increase accessibility through visible storage and digitisation since the results of this study suggest that these strategies are likely to make more stored items accessible for museums of that size of collection. Nevertheless, museums could combine the strategies to compensate for the advantages and disadvantages of each strategy. Finally, this study may contribute to building awareness of the size of stored collections in the civil community, thereby advocating for the democratisation of collections.

Supplementary Materials

The following supporting information can be downloaded at: https://www.mdpi.com/article/10.3390/heritage8050162/s1.

Author Contributions

Conceptualisation, all authors; methodology, all authors; software, L.C.; validation, all authors; formal analysis, all authors; investigation, L.C.; resources, L.C.; data curation, L.C.; writing—original draft preparation, L.C.; writing—review and editing, M.C.; visualisation, L.C.; supervision, M.C.; project administration, M.C. All authors have read and agreed to the published version of the manuscript.

Funding

This research received no external funding.

Data Availability Statement

The data presented in this study are available on request from the corresponding authors due to the need to preserve the anonymity of the museum participants.

Conflicts of Interest

The authors declare no conflicts of interest.

References

  1. Crook, J.M. The British Museum; Allen, Lane, Penguin Press: London, UK, 1972; ISBN 071390254X/9780713902549. [Google Scholar]
  2. Van Mensch, L.M.; Van Mensch, P. From Disciplinary Control to Co-Creation—Collecting and the Development of Museums as Praxis in the Nineteenth and Twentieth Century. In Encouraging Collections Mobility—A Way Forward for Museums in Europe; Finnish National Gallery, Institut für Museumsforschung, Staatliche Museen zu Berlin, Erfgoed Nederland: Helsinki, Finland, 2010; pp. 33–53. ISBN 978-951-53-3287-5. [Google Scholar]
  3. McClellan, A. Inventing the Louvre: Art, Politics, and the Origins of the Modern Museum in Eighteenth-Century Paris; University of California Press, Ltd.: London, UK, 1999; ISBN 978-0-520-22176-5. [Google Scholar]
  4. Azcue Brea, L. El Origen de La Colecciones de Escultura Del Museo Prado: El Real Museo de Pintura y Escultura. In Taller Europeo: Intercambios, Influjos y Préstamos en la Escultura Moderna Europea; Museo Nacional de Escultura: Valladolid, Spain, 2012; pp. 73–108. ISBN 978-84-615-8629-5. [Google Scholar]
  5. Bazin, G. The Museum Age; Universe Book Inc.: New York, NY, USA, 1967. [Google Scholar]
  6. Fredheim, H.; Macdonald, S.; Morgan, J.; Harrison, R.; DeSilvey, C.; Holtorf, C.; Bartolini, N.; Breithoff, E.; Lyons, A.; May, S.; et al. Curating Museum Profusion. In Heritage Futures; Comparative Approaches to Natural and Cultural Heritage Practices; UCL Press: London, UK, 2020; pp. 169–189. ISBN 9781787356016. [Google Scholar]
  7. Morgan, J.; Macdonald, S. De-Growing Museum Collections for New Heritage Futures. Int. J. Herit. Stud. 2020, 26, 56–70. [Google Scholar] [CrossRef]
  8. Stephens, H.H. All in a Day’s Work: How Museums May Approach Deaccessioning as a Necessary Collections Management Tool. DePaul J. Art Technol. Intellect. Prop. Law 2011, 22, 119–181. [Google Scholar]
  9. Malaro, M.C.; DeAngelis, P.I. The Disposal of Objects: Deaccessioning. In A Legal Primer on Managing Museum Collections; Smithsonian Institution: Washington, DC, USA, 2019; pp. 248–272. [Google Scholar]
  10. Ulph, J. Dealing with UK Museum Collections: Law, Ethics and the Public/Private Divide. Int. J. Cult. Prop. 2015, 22, 177–204. [Google Scholar] [CrossRef]
  11. Hoving, T. Making the Mummies Dance: Inside the Metropolitan Museum of Art; Simon & Schuster: New York, NY, USA; London, UK; Toronto, ON, Canada; Sydney, Australia; Tokyo, Japan; Singapore, 1993; ISBN 0671738542. [Google Scholar]
  12. Piazzai, M.; Vecco, M.; Piazzai, M.; Vecco, M. Deaccessioning. In Anthropology; Oxford University Press: Oxford, UK, 2020. [Google Scholar]
  13. Wijsmuller, D. Deaccessioning and Disposal in Europe, 2008–2017: A Research on Possibilities and Attitudes across the European Member States; Mondriaan Fund: Amsterdam, The Netherlands, 2017. [Google Scholar]
  14. Cannadine, D. Why Collect? Art Fund, The Wolfson Foundation: London, UK, 2018; ISBN 9781874184096. [Google Scholar]
  15. Kidd, J. Debating Contemporary Museum Ethics: Reporting Sekhemka. Int. J. Herit. Stud. 2017, 23, 493–505. [Google Scholar] [CrossRef]
  16. Carvalho, A.; Camacho, C.F. Addressing Sustainability in Portuguese Museums and Heritage: The Role of Cultural Policies. Heritage 2023, 6, 7742–7754. [Google Scholar] [CrossRef]
  17. National Services of the Museum of New Zealand Te Papa Tongarewa. New Zealand Museums Standards Scheme; National Services: Wellington, New Zealand, 2002. [Google Scholar]
  18. National Services of the Museum of New Zealand Te Papa Tongarewa. Museum Unit Standards Review; National Services: Wellington, New Zealand, 2023. [Google Scholar]
  19. National Services of the Museum of New Zealand Te Papa Tongarewa. NGĀ Kaupapa Papa MŌ Te Kohikohinga-Collections Policy; National Services: Wellington, New Zealand, 2024. Available online: https://www.tepapa.govt.nz/assets/76067/1730769101-collections-policy.pdf (accessed on 1 May 2025).
  20. Auckland War Memorial Museum. Auckland War Memorial Museum Governance Policies; Auckland War Memorial Museum: Auckland, New Zealand, 2018; Available online: https://www.aucklandmuseum.com/getmedia/37f48cdb-29d7-4b3b-9199-b18f758cba30/2018-Review-Governance-Policy.pdf (accessed on 1 May 2025).
  21. Otago Museum. Otago Museum Collection Policy 2020–2025; Tūhura Otago Museum: Dunedin, New Zealand, 2025; pp. 1–16. Available online: https://otagomuseum.nz/assets/documents/Collection-Policy-2020-2025.pdf (accessed on 1 May 2025).
  22. Wallace, L. Activity Plan Canterbury and Akaroa Museums 2021–2031; Christchurch City Council: Christchurch, New Zealand, 2021. Available online: https://ccc.govt.nz/assets/Documents/The-Council/Plans-Strategies-Policies-Bylaws/Plans/Long-Term-Plan/LTP-2021-final/LTP-2021-Activity-Plan-Canterbury-and-Akaroa-Museums.PDF (accessed on 1 May 2025).
  23. McCarthy, C. Museums and Maori: Heritage Professionals, Indigenous Collections, Current Practice; Routledge: Wellington, New Zealand, 2016; ISBN 1315423898. [Google Scholar]
  24. Murray, D. Museums, Their History and Their Use; James Maclahose and Sons: Glasgow, UK, 1904. [Google Scholar]
  25. Reinach, S. Musées, Bibliothèques et Hypogées [Museums, Libraries and Hypogeums]. Rev. Archéologique 1909, 2, 267–270. [Google Scholar]
  26. Stermscheg, G.M. Zur Entwicklungsgeschichte Des Museumsdepots—Ein Überblick [The History of the Development of the Museum Depot—An Overview]. Museum.ch 2014, 9, 10–17. [Google Scholar]
  27. Avery-Quash, S.; Crookham, A. Upstairs, Downstairs: The National Gallery’s Dual Collections. In Museum Storage and Meaning: Tales from the Crypt; Brusius, M., Singh, K., Eds.; Routledge: New York, NY, USA; London, UK, 2018; pp. 167–182. [Google Scholar]
  28. Gilson, G. Le Musée d’Histoire Naturelle Moderne: Sa Mission, Son Organisation, Ses Droits Mémoires Du Musée Royal d’Histoire Naturelle de Belgique [The Modern Natural History Museum: Its Mission, Its Organization, Its Memory Rights of the Royal Museum of Natural Hi; Hayez: Brussels, Belgium, 1914. [Google Scholar]
  29. Ferriot, D. Museum-Reserve Collections: An International Symposium. Mus. Int. 1995, XLVII, 35–39. [Google Scholar] [CrossRef]
  30. Jaoul, M. Why Reserve Collections? Mus. Int. 1995, 47, 4–7. [Google Scholar] [CrossRef]
  31. Ames, M.M. De-Schooling the Museum: A Proposal to Increase Public Access to Museums and Their Resources. Mus. Int. 2015, 66, 98–106. [Google Scholar] [CrossRef]
  32. Crenn, G. Storage Exhibitions in Permanent Museum Collections. Mus. Int. 2021, 73, 88–99. [Google Scholar] [CrossRef]
  33. Iccrom, G.A. ICCROM Programme Biennium 2018–2019. Available online: https://www.iccrom.org/sites/default/files/GA3010 ICCROM Programme of Work and Budget %28PWB%29 for the biennium 2018-2019 - Approved.pdf (accessed on 7 September 2022).
  34. Lord, B.; Lord, G.D.; Nicks, J. The Cost of Collecting: Collection Management in UK Museums; A Report Commissioned by the Office of Arts and Libraries; H.M. Stationery Office: London, UK, 1989. [Google Scholar]
  35. Wilkinson, H. Collections for the Future: Report of a Museums Association Enquiry; Museums Association: London, UK, 2005; Available online: https://archive-media.museumsassociation.org/policy_collections.pdf (accessed on 1 May 2025).
  36. De Erfgoedmonitor Museum Collections—Location of the Objects. Available online: https://erfgoedmonitor.cultureelerfgoed.nl/mosaic/dashboard/museumcollecties-en-objecten (accessed on 5 September 2022).
  37. Corona, L. Digitization for the Visibility of Collections. Collect. Curation 2023, 42, 73–80. [Google Scholar] [CrossRef]
  38. Fleming, D. The Politics of Social Inclusion. In Including Museums: Perspectives on Museums, Galleries and Social Inclusion; Dodd, J., Sandell, R., Eds.; Research Centre for Museums and Galleries, Department of Museum Studies, University of Leicester: Leicester, UK, 2001; pp. 16–19. [Google Scholar]
  39. Keene, S. Collections: Treasure or Trash? In Politics and Positioning. Museums Australia Conference; Museums Australia: Sydney, Australia, 2005. [Google Scholar]
  40. Caesar, L.G. Store Tours: Accessing Museums’ Stored Collections. Pap. Inst. Archaeol. 2007, 18, 101–115. [Google Scholar] [CrossRef]
  41. Bond, S. Serendipity, Transparency, and Wonder: The Value of Visible Storage. In Museum Storage and Meaning: Tales from the Crypt; Brusius, M., Singh, K., Eds.; Routledge: New York, NY, USA, 2018; pp. 64–73. [Google Scholar]
  42. Thiemeyer, T. THE STOREROOM AS PROMISE: The Discovery of the Ethnological Museum Depot as an Exhibition Method in the 1970s. Mus. Anthropol. 2017, 40, 143–157. [Google Scholar] [CrossRef]
  43. Simmons, J. Managing Things: Crafting a Collections Policy. Mus. News Am. Assoc. Mus. 2004, 83, 29–48. [Google Scholar]
  44. Slater, D. Visible Storage: The Glenbow Experiment. Mus. Int. 1995, 47, 13–17. [Google Scholar] [CrossRef]
  45. Pes, J. The Move toward Open Storage; Museum Practice-Museums Association: London, UK, 2002; pp. 50–52. [Google Scholar]
  46. Thistle, P.C. Visible Storage for the Small Museum. In Care of Collections; Knell, S., Ed.; Routledge: London, UK; New York, NY, USA, 2005; pp. 207–217. [Google Scholar]
  47. Somers, T. The Collection Belongs to Everyone. Depot J. 2018, 2, 9. [Google Scholar]
  48. Ambrose, T.; Paine, C. Museum Basics. The International Handbook; Routledge: London, UK; New York, NY, USA, 2018. [Google Scholar]
  49. Miller, S. The Anatomy of a Museum: An Insider’s Text; Wiley-Blackwell: Oxford, UK, 2018. [Google Scholar]
  50. Malaro, M.C.; DeAngelis, I.P. Loans: Incoming and Outgoing Loans. In A Legal Primer on Managing Museum Collections; Smithsonian Books: Washington, DC, USA, 2019; pp. 273–318. [Google Scholar]
  51. Bakke, J. Organizing Loan and Traveling Exhibitions. In Museum Registration Methods; Simmons, J.E., Kiser, M.T., Eds.; Rowman & Littlefield: Lanham, MD, USA; Boulder, CO, USA; New York, NY, USA; London, UK, 2020; pp. 298–311. [Google Scholar]
  52. Wood, R.; Gardner, A. Loans. In Museum Registration Methods; Simmons, J.E., Kiser, T.M., Eds.; Rowman & Littlefield: Lanham, MD, USA; Boulder, CO, USA; New York, NY, USA; London, UK, 2020; pp. 224–245. [Google Scholar]
  53. Piacente, M. Travelling Exhibitions. In Manual of Museum Exhibitions; Piacente, M., Ed.; Rowman & Littlefield: London, UK, 2022; pp. 133–152. [Google Scholar]
  54. Cameron, F. Digital Futures I: Museum Collections, Digital Technologies, and The Cultural Construction of Knowledge. Curator Mus. J. 2003, 46, 325–340. [Google Scholar] [CrossRef]
  55. Bertacchini, E.; Morando, F. The Future of Museums in the Digital Age: New Models for Access to and Use of Digital Collections. Int. J. Arts Manag. 2013, 15, 60–72. [Google Scholar]
  56. Corona, L. Museums and Communication: The Case of the Louvre Museum at the Covid-19 Age. Humanit. Soc. Sci. Res. 2021, 4, 15–26. [Google Scholar] [CrossRef]
  57. Keene, S.; Stevenson, A.; Monti, F. Collections for People: Museums’ Stored Collections as a Public Resource; University College London-Institute of Archaeology: London, UK, 2008; ISBN 978-0-905853-44-4. [Google Scholar]
  58. Brusius, M.; Singh, K. Introduction. In Museum Storage and Meaning: Tales from the Crypt; Brusius, M., Singh, K., Eds.; Routledge: New York, NY, USA; London, UK, 2018; pp. 12–45. [Google Scholar]
  59. Matassa, F. Loans. In Museum Collections Management; Facet Publishing: London, UK, 2011; pp. 169–200. [Google Scholar]
  60. Weilenmann, A.; Hillman, T.; Jungselius, B. Instagram at the Museum: Communicating the Museum Experience through Social Photo Sharing. In Proceedings of the CHI’13: Proceedings of the SIGCHI Conference on Human Factors in Computing Systems, Paris, France, 27 April–2 May 2013; pp. 1843–1852. [Google Scholar]
  61. Wilcox, U.V. Detached Storage: The Smithsonian Institution’s Museum Support Center. Mus. Int. 1995, 47, 18–22. [Google Scholar] [CrossRef]
  62. Edwards, H.E. Expert Review of Local Museum Provision in Wales 2015; Welsh Government: Aberystwyth, UK, 2015. Available online: https://www.gov.wales/sites/default/files/publications/2019-07/expert-review-of-local-museum-provision-in-wales-2015.pdf (accessed on 1 May 2025).
  63. Moore, K. Museums and Popular Culture; Leicester University Press: Leicester, UK, 2000. [Google Scholar]
  64. Moore, M. A New Collections Hub Making Efficiencies with Warehouse Tech (Museum Practice-Museums Association). Available online: https://www.museumsassociation.org/museums-journal/in-practice/2018/10/26102018-case-study-smg-national-collections-centre/ (accessed on 28 September 2020).
  65. Stevens, A. Opportunities in Store. Mus. J. Mus. Assoc. 2019. Available online: https://www.museumsassociation.org/museums-journal/in-practice/2018/10/15102018-storage-opportunities-in-store/ (accessed on 1 May 2025).
  66. Louvre Conservation Centre. Available online: https://www.louvre.fr/en/louvre-conservation-center (accessed on 28 September 2020).
  67. Sharp, R. V&A Hopes Here East Will Be the Watershed for Museum Storage. Available online: https://www.museumsassociation.org/museums-journal/analysis/2018/12/01122018-v-and-a-east-storage/ (accessed on 29 September 2020).
  68. Woer, K. Establishing New Museum Storage for Eight Cultural Institutions in Aarhus, Denmark. Stud. Conserv. 2018, 63, 441–444. [Google Scholar] [CrossRef]
  69. Knudsen, R.L.; Lundbye, S.R. Performance of Danish Low-Energy Museum Storage Buildings. In Proceedings of the ICOM-CC 18th Triennial Conference 2017 Copenhagen, Copenhagen, Denmark, 4–8 September 2017; Pulido & Nunes. ICOM Committee for Conservation: Paris, France, 2017; pp. 1–9. [Google Scholar]
  70. Knudsen, R.L. Building a New Shared Storage Facility for Sixteen Museums and Archives. In Proceedings of the ICOM-CC Fourteenth Triennial Meeting, The Hague, The Netherlands, 12–16 September 2005; James & James/Earthscan: London, UK, 2005; pp. 648–654. [Google Scholar]
  71. Matassa, F. Museum Collections Management; Facet Publishing: London, UK, 2011. [Google Scholar]
  72. Johnson, E.V.; Horgan, J.C. Museum Collection Storage; Unesco, Ed.; Museums Association: London, UK, 1979; ISBN 92-3-101632-6. [Google Scholar]
  73. Sanders, J.M. Hidden Histories: Museum Taxidermy Rediscovered. In Museum Storage and Meaning: Tales from the Crypt; Brusius, M., Kavita, S., Eds.; Routledge: London, UK; New York, NY, USA, 2018; pp. 236–254. [Google Scholar]
  74. Matassa, F. Active Collections: Re-Visiting Our Collection for More and Better Use. In Encouraging Collections Mobility—A Way Forward for Museums in Europe; Pettersson, S., Hagedorn-Saupe, M., Jyrkkio, T., Weij, A., Eds.; Finnish National Gallery, Institut für Museumsforschung, Staatliche Museen zu Berlin, Erfgoed Nederland: Helsinki, Finland, 2010; pp. 107–135. ISBN 978-951-53-3287-5. [Google Scholar]
  75. Ryan, M. Displays from Within—Considerations for Collections-Based Exhibitions. In Museum Registration Methods; Simmons, J.E., Kiser, T.M., Eds.; Rowman & Littlefield: Lanham, MD, USA; Boulder, CO, USA; New York, NY, USA; London, UK, 2020; pp. 257–265. [Google Scholar]
  76. Kisters, S. A New Museum Typology? Mus. Int. 2021, 73, 74–85. [Google Scholar] [CrossRef]
  77. Corona, L. Stored Collections of Museums: An Overview of How Visible Storage Makes Them Accessible. Collect. Curation 2025, 44, 1–8. [Google Scholar] [CrossRef]
  78. Pye, E. Collections Mobility Perspectives on Conservation: Emphasis on the Original Object. In Encouraging Collections Mobility—A Way Forward for Museums in Europe; Pettersson, S., Hagedorn-Saupe, M., Jyrkkio, T., Weij, A., Eds.; Finnish National Gallery, Institut für Museumsforschung, Staatliche Museen zu Berlin, Erfgoed Nederland: Helsinki, Finland, 2000; pp. 136–149. [Google Scholar]
  79. Corona, L. Enhancing the Usability of Stored Museum Items: Loans and Exchanges. Mus. Worlds 2024, 12, 148–161. [Google Scholar] [CrossRef]
  80. Jones, G.; Christal, M. The Future of Virtual Museums: On-Line, Immersive, 3D Environments; Created Realities Group: Austin, TX, USA, 2002. [Google Scholar]
  81. Schweibenz, W. The Development of Virtual Museums. Icom News 2004, 3, 3. [Google Scholar]
  82. Pinna, G. Reale o Virtuale? Nuova Museol. 2005, 12. [Google Scholar]
  83. Corona, L. Museology and Communication within the Virtual Museum. Ulakbilge Derg. 2020, 8, 26–31. [Google Scholar] [CrossRef]
  84. Corona, L. The Digital Content: An Opportunity to Enjoy Collections. Mimesis 2024, 13, 215–227. [Google Scholar] [CrossRef]
  85. Benjamin, W. The Work of Art in the Age of Its Technological Reproducibility; Penguin: London, UK, 1936. [Google Scholar]
  86. Pantalony, D. What Remains: The Enduring Value of Museum Collections in the Digital Age. HoST-J. Hist. Sci. Technol. 2020, 14, 160–182. [Google Scholar] [CrossRef]
  87. Navarrete, T. Digital Heritage Tourism: Innovations in Museums T. World Leis. J. 2019, 61, 200–214. [Google Scholar] [CrossRef]
  88. Marras, A.M.M.; Díaz-Kommonen, L.; Stoneman, A.; Svinhufvud, L. Digital Technologies for Citizen Curation in Museums: Two Case Studies from the SPICE Project. Available online: https://icom.museum/en/news/spice-project-digital-technologies/ (accessed on 30 March 2025).
  89. Mairesse, F. Museum Storage around the World. In Proceedings of the ICOM, Working Group on Collections in Storage, Paris, France, 29–31 October 2024. [Google Scholar]
  90. West, G.E.-J. Why Keep It If You Can’t See It!: An Investigation into Public and Professional Attitudes Towards Collection Care, Access and Utilisation in New Zealand Museums. Master’s Thesis, Victoria University of Wellington, Wellington, New Zealand, 1 January 2011. [Google Scholar]
  91. Nunberg, S.; Eckelman, M.; Hatchfield, P. Life Cycle Assessments of Loans and Exhibitions: Three Case Studies at the Museum Fine Arts, Boston. J. Am. Inst. Conserv. 2016, 55, 2–11. [Google Scholar] [CrossRef]
  92. Eid, H.; Forstrom, M. Museum Innovation: Building More Equitable, Relevant and Impactful Museums; Routledge: Abingdon, Oxford, UK, 2021. [Google Scholar]
  93. Mason, M. The Contribution of Design Thinking to Museum Digital Transformation in Post-Pandemic Times. Multimodal Technol. Interact. 2022, 6, 79. [Google Scholar] [CrossRef]
  94. Mairesse, F. Collection Strategies Now! In Encouraging Collecitons Mobility—A Way Forward for Museums in Europe; Pettersson, S., Hagedorn-Saupe, M., Jyrkkiö, T., Weij, A., Eds.; Finnish National Gallery, Institut für Museumsforschung, Staatliche Museen zu Berlin, Erfgoed Nederland: Helsinki, Finland, 2010; pp. 54–73. [Google Scholar]
  95. Burkhart, K. Accessibility Is for Everyone. In Small Museum Toolkit. Reaching and Responding to the Audience; Catlin-Legutko, C., Klinger, S., Eds.; Altamira Press: Plymouth, UK, 2012; pp. 98–120. [Google Scholar]
  96. ICOM Museum Definition. Available online: https://icom.museum/en/resources/standards-guidelines/museum-definition/ (accessed on 5 September 2024).
  97. Da Milano, C. L’accesso Alla Cultura in Una Prospettiva Europea. In I Pubblici Della Cultura. Audience Development, Audience Engagement; De Biase, F., Ed.; Franco Angeli: Milan, Italy, 2014; pp. 151–162. [Google Scholar]
  98. Dodd, J.; Sandell, R. Building Bridges: Guidance for Museums and Galleries on Developing New Audiences; Coles, A., Ed.; Museums and Galleries Commission: London, UK, 1998; ISBN 0948630655. [Google Scholar]
  99. Solima, L.; Tani, M.; Sasso, P. Social Innovation and Accessibility in Museum: Some Evidence from the SoStare al MANN Project. In Il Capitale Culturale. Studies on the Value of Cultural Heritage; EUM University of Macerata: Macerata, Italy, 2021; pp. 23–56. [Google Scholar]
  100. De Guichen, G. Collection Storage: A Window into the Richness of Cultural Heritage. Mus. Int. 2021, 73, 226–235. [Google Scholar]
  101. Keene, S. Museum Collection Storage. APT Bull. 1987, 19, 2. [Google Scholar] [CrossRef]
  102. Simmons, J.E.; Kiser, T.M. Acquisitions and Accessioning. In Museum Registration Methods; Simmons, J.E., Kiser, T.M., Eds.; Rowman & Littlefield: Lanham, MD, USA; Boulder, CO, USA; New York, NY, USA; London, UK, 2020; p. 102. [Google Scholar]
  103. Winfried, B.; Klimpel, P.; Benedek, A.; Malinen, I.; Maass, M.; Matas, A.; Ramskjaer, L.; Willkomm., S. Practical Guide: Digital Basic Cataloguing:10 Principles. In Network of European Museum Organisations and German Museums Association; Network of European Museum Organisations and German Museums Association: Berlin, Germany, 2022; p. 69. [Google Scholar]
  104. New Zealand Museum Directory. Available online: https://www.nzmuseums.co.nz/find-museum (accessed on 12 March 2025).
  105. New Zealand Museums Association Museums Aotearoa Members. Available online: https://www.museumsaotearoa.org.nz/about/membership/member-organisations (accessed on 10 March 2025).
  106. Carr, A. The Value Museums, Art Galleries and Heritage Properties Contribute in Aotearoa New Zealand; Museums Aotearoa: Aotearoa, New Zealand, 2018. [Google Scholar]
  107. Feldstein, M. The Economics of Art Museums; National Bureau of Economics: Chicago, IL, USA, 1991. [Google Scholar]
  108. Patten, T. Collecting Community: Digital Initiatives for New Zealand Museums. In Proceedings of the Museums and the Web in Asia, Melbourne, Australia, 5–8 October 2015; MWA: Melbourne, Australia, 2015. [Google Scholar]
  109. Handa, K.; Dairoku, H.; Toriyama, Y. Investigation of Priority Needs in Terms of Museum Service Accessibility for Visually Impaired Visitors. Br. J. Vis. Impair. 2010, 28, 221–234. [Google Scholar] [CrossRef]
  110. Solima, L. Museums across Boundaries. In Exploring Cultural Value; Lehman, K., Fillis, I., Wickham, M., Eds.; Emerald Publishing Limited: Leeds, UK, 2021; pp. 199–213. ISBN 978-1-78973-515-4/978-1-78973-516-1. [Google Scholar]
  111. Whiteford, A.; Van Serventen, D.; Patterson, B. A Profile of the Museums Sector in New Zealand; Infometrics for ServiceIQ: Wellington, New Zealand, 2014. [Google Scholar]
  112. Fredheim, H.; Macdonald, S.; Morgan, J. Profusion in Museums: A Report on Contemporary Collecting and Disposal; Arts & Humanities Research Council, University of York: York, UK, 2018. [Google Scholar]
  113. Gammon, M. Deaccessioning and Its Discontents: A Critical History; The MIT Press: Cambridge, MA, USA; London, UK, 2019; ISBN 9780262037587. [Google Scholar]
  114. Gardner, L. The Uses of Stored Collections in Some London Museums. Pap. Inst. Archaeol. 2010, 18, 36–78. [Google Scholar] [CrossRef]
  115. Plaza, B. Valuing Museums as Economic Engines: Willingness to Pay or Discounting of Cash-Flows? J. Cult. Herit. 2010, 11, 155–162. [Google Scholar] [CrossRef]
  116. Nauta, G.J.; Van den Heuvel, W.; Teunisse, S. Europeana DSI 2—Access to Digital Resources of European Heritage. D4.4. Report on ENUMERATE Core Survey 4; Europeana: The Hague, The Netherlands, 2017. [Google Scholar]
  117. Schülze, G.G. Superstars. In The Handbook of Cultural Economics; Towse, R., Navarrete, T., Eds.; Edward Elgar Publishing: Cheltenham, UK, 2020; pp. 431–436. [Google Scholar]
  118. Evans, G. Participation and Provision in Arts and Culture. Cult. Trends 2016, 25, 2–20. [Google Scholar] [CrossRef]
  119. Wilkinson, M.D.; Dumontier, M.; Aalbersberg, I.J.; Appleton, G.; Axton, M.; Baak, A.; Blomberg, N.; Boiten, J.-W.; da Silva Santos, L.B.; Bourne, P.E.; et al. The FAIR Guiding Principles for Scientific Data Management and Stewardship. Sci. Data 2016, 3, 160018. [Google Scholar] [CrossRef]
  120. Frey, B.; Meier, S. The Economics of Museums. In Handbook of the Economics of Art and Culture; Ginsburgh, V.A., Throsby, D., Eds.; Elsevier: Amsterdam, The Netherlands, 2006; pp. 1017–1047. [Google Scholar]
  121. Kim, R.C.; Scullion, H.; Avvari, M.V.; Jooss, S.; Uddin, H. Inclusive Leadership in Times of Global Crisis: How CEOs of Multinational Enterprises Responded to COVID-19. Crit. Perspect. Int. Bus. 2025, 21, 257–287. [Google Scholar] [CrossRef]
  122. Navarrete, T.; Villaespesa, E. Digital Heritage Consumption: The Case of the Metropolitan Museum of Art. Magazén 2020, 1, 223–248. [Google Scholar] [CrossRef]
  123. Palmucci, D.N.; Giovando, G.; Vincurova, Z. The Post-Covid Era: Digital Leadership, Organizational Performance and Employee Motivation. In Management Decision; Iris: Torino, Italy, 2025. [Google Scholar]
  124. Tranta, A.; Alexandri, E.; Kyprianos, K. Young People and Museums in the Time of COVID-19. Mus. Manag. Curatorship 2021, 36, 1–17. [Google Scholar] [CrossRef]
  125. Corona, L. Digitization: An Overview of the Advantages and Disadvantages. In Aspects of Digital Libraries—Digitization, Standards, Open Access, Repositories and User’s Skills; Gabbay, L.K., Ed.; IntechOpen: London, UK, 2023. [Google Scholar]
  126. Camarero, C.; Garrido, M.J.; Vicente, E. How Cultural Organizations Size and Funding Influence Innovation and Performance: The Case of Museums. J. Cult. Econ. 2011, 35, 247–266. [Google Scholar] [CrossRef]
  127. Henrieke, W.; Huysmans, F. Klik Naar Het Verleden: Een Onderzoek Naar Gebruikers Van Digitaal Erfoged: Hun Profilien En Zoekstrategieen; SCP: The Hague, The Netherlands, 2006. [Google Scholar]
  128. Kjeldsen, A.K.; Jensen, M.N. When Words of Wisdom Are Not Wise. A Study of Accessibility in Museum Exhibition Texts. Nord. Museol. 2015, 1, 91–111. [Google Scholar] [CrossRef]
Figure 1. The conceptual framework for studying the accessibility of stored collections in museums in New Zealand.
Heritage 08 00162 g001
Figure 2. Strategies of using stored collections according to the sizes of collections.
Heritage 08 00162 g002
Figure 3. Strategies of using stored collections according to the types of collections.
Heritage 08 00162 g003
Table 1. Participants’ governances.
Governance%
A non-profit private body13%
A trust (public enterprise), public foundation27%
Part of municipal or province government20%
Part of the regional government13%
Part of the state, central, or federal government7%
Part/department of another institution7%
Partnership with local govt and a trust7%
Private, non-profit body7%
Grand Total100%
Table 2. Participants’ types of collections.
Type of Collection%
Art13%
History53%
Other 127%
Science and technology7%
Grand Total100%
1 Museums referred to as “other”: war history, social history, and industrial heritage collections.
Table 3. Participants’ sizes of collections.
Size%
Large13%
Medium13%
Small73%
Grand Total100%
Table 4. Stored collections (%) according to the sizes and types of collections.
Size of CollectionAverage Kept in Storage
Large100%
Other100%
Medium80%
History80%
Small82%
Art95%
History88%
Other60%
Science and Technology60%
Grand Total84%
Table 5. Stored collections (%) according to the legal status.
GovernanceAverage Stored
A non-profit private body80%
Small80%
  Other100%
  Science and technology60%
A trust (public enterprise), public foundation98%
Large100%
  Other100%
Small97%
  History97%
Part of municipal or province government70%
Medium90%
  History90%
Small60%
  Art100%
  Other20%
Part of the regional government95%
Large100%
  Other100%
Small90%
  Art90%
Part of the state, central, or federal government90%
Small90%
  History90%
Part/department of another institution100%
Small100%
  History100%
Partnership with local govt and a trust70%
Medium70%
  History70%
Private, non-profit body50%
Small50%
  History50%
Grand Total84%
Table 6. Usage of stored collections in visible storage according to types and sizes of collections.
Size of Collection% Average Use in StorageType and Size% Use in Storage
Large90%History55%
Medium90%  Medium90%
Small38%  Small38%
Other68%
  Large90%
  Small45%
Science and technology30%
  Small30%
Grand Total55%Grand Total55%
Table 7. Usage of stored collections in visible storage according to the types and sizes of collections and governance.
Governance% In Storage
A non-profit private body30%
Science and technology30%
Small30%
A trust (public enterprise), public foundation15%
History15%
Small15%
Part of municipal or province government45%
Other45%
Small45%
Part of the regional government90%
Other90%
Large90%
Partnership with local govt and a trust90%
History90%
Medium90%
Private, non-profit body60%
History60%
Small60%
Grand Total55%
Table 8. Types of visitors in visible storage.
Visitors Type% Museums
Museum visitors100%
Researchers67%
School33%
General public60%
Table 9. Types of accesses in visible storage.
Type of Access% Museums
Glass window0%
Regular times20%
Appointment100%
Store tour83%
Special events67%
Table 10. Ticketing in visible storage.
Ticket% Museums
 Free entry for researchers17%
 Most of the time17%
 Never67%
Grand Total100%
Table 11. Share of visitors to visible storage on visits to the museum.
Type % Visitors
History55%
  Medium90%
  Small38%
Other68%
  Large90%
  Small45%
Science and technology30%
  Small30%
Grand Total55%
Average Visits900
Table 12. Museums with onsite and offsite storage.
Type of StorageMuseums
onsite100%
offsite83%
  no transportation (20 km)75%
  with transportation (15 km)25%
shared offsite 2
Table 13. Usage of stored collections through rotation according to sizes and types of collections.
SizeAverage UsageType, SizeAverage Usage
Large15%Art38%
Medium45% Small38%
Small25%History28%
 Medium45%
 Small23%
Other15%
 Large15%
 Small15%
Science and Technology-
 Small-
Grand Total28%Grand Total28%
Table 14. Usage of stored collections through rotation according to the governance.
GovernanceAverage Usage
A non-profit private body-
Small-
  Other-
  Science and technology-
A trust (public enterprise), public foundation19%
Large15%
  Other15%
Small20%
  History20%
Part of municipal or province government40%
Medium45%
  History45%
Small38%
  Art60%
  Other15%
Part of the regional government15%
Large-
  Other-
Small15%
  Art15%
Part of the state, central, or federal government15%
Small15%
  History15%
Part/department of another institution15%
Small15%
  History15%
Partnership with local govt and a trust45%
Medium45%
  History45%
Private, non-profit body45%
Small45%
  History45%
Grand Total28%
Table 15. Usage of stored collections through loans according to types and sizes of collections.
SizeAverage UsageType, SizeAverage Usage
Large15%Art15%
Medium23% Small15%
Small18%History18%
 Medium23%
 Small15%
Other15%
 Large15%
 Small-
Science and Technology30%
 Small30%
Grand Total18%Grand Total18%
Table 16. Usage of stored collections through loans according to the governance.
Governance, Type, SizeAverage Usage
A non-profit private body30%
Other-
  Small-
Science and technology30%
  Small30%
A trust (public enterprise), public foundation15%
History15%
  Small15%
Other15%
  Large15%
Part of municipal or province government23%
Art15%
  Small15%
History30%
  Medium30%
Other-
  Small-
Part of the regional government15%
Art15%
  Small15%
Other-
  Large -
Part of the state, central, or federal government15%
History15%
  Small15%
Part/department of another institution15%
History15%
  Small15%
Partnership with local govt and a trust15%
History15%
  Medium15%
Private, non-profit body-
History-
  Small-
Grand Total18%
Table 17. Usage of stored collections through exchanges according to types and sizes of collections.
Size Average UsageType, Size of CollectionAverage Usage
Large15%Art15%
Medium23% Small15%
Small15%History19%
 Medium23%
 Small15%
Other15%
 Large15%
 Small -
Science and Technology-
 Small -
Grand Total17%Grand Total17%
Table 18. Usage of stored collections through exchanges according to the governances.
Type, Size, GovernanceAverage Usage
A non-profit private body
 Other
  Small
 Science and technology
  Small
A trust (public enterprise), public foundation15%
 History
  Small
 Other15%
  Large15%
Part of municipal or province government23%
 Art15%
  Small15%
 History30%
  Medium30%
 Other
  Small
Part of the regional government15%
 Art15%
  Small15%
 Other
  Large
Part of the state, central, or federal government15%
 History15%
  Small15%
Part/department of another institution15%
 History15%
  Small15%
Partnership with local govt and a trust15%
 History15%
  Medium15%
Private, non-profit body
 History
  Small
Grand Total17%
Table 19. Usage of stored collections through digitisation according to types and sizes of collections.
SizeAverage UsageType, SizeAverage Usage
Large15%Art30%
Medium60% Small30%
Small39%History47%
 Medium60%
 Small42%
Other30%
 Large15%
 Small45%
Science and Technology
 Small
Grand Total41%Grand Total41%
Table 20. Usage of stored collections through digitisation according to the governances.
GovernanceAverage Usage
A non-profit private body-
Small-
  Other -
  Science and technology -
A trust (public enterprise), public foundation15%
Large15%
  Other15%
Small15%
  History15%
Part of municipal or province government40%
Medium60%
  History60%
Small30%
  Art15%
  Other45%
Part of the regional government45%
Large-
  Other-
Small45%
  Art45%
Part of the state, central, or federal government75%
Small75%
  History75%
Part/department of another institution15%
Small15%
  History15%
Partnership with local govt and a trust60%
Medium60%
  History60%
Private, non-profit body90%
Small90%
  History90%
Table 21. Onsite and online visits.
SizeAverage n. of VisitsAverage n. of Visits via Web% N. of Visits via Web/n. of Onsite VisitsAverage n. of Online Collections% N. of Online Visits to Collections/n. of Online Collections
Small700.000185.00026%15.0008%
Medium2.5003.000120%35012%
Small36.97329.76380% 0%
Grand Total89.35351.17557%7.67515%
Table 22. Museums with digitised collections on the Internet.
SizeRegional Sites, Portals, AggregatorGoogle Art ProjectSocial MediaWikipedia, Wikimedia
Large17%10%14%18%
Medium8%0%14%0%
Small75%90%71%82%
Grand Total100%100%100%100%
Table 23. Museums and digitised collections on the Internet according to the types of collections.
TypePortalsGoogle Art ProjectSocial MediaWikipedia, Wikimedia
Art17%20%14%18%
 Small17%20%14%18%
History42%40%50%36%
 Medium8%0%14%0%
 Small33%40%36%36%
Other33%30%29%36%
 Large17%10%14%18%
 Small17%20%14%18%
Science and Technology8%10%7%9%
 Small8%10%7%9%
Grand Total100%100%100%100%
Table 24. Museums and digitised collections on the Internet according to the governances.
GovernancePortalsGoogle Art ProjectSocial MediaWikipedia, Wikimedia
A non-profit private body17%20%14%18%
Small17%20%14%18%
  Other8%10%7%9%
  Science and technology8%10%7%9%
A trust (public enterprise), public foundation25%20%21%27%
Large8%0%7%9%
  Other8%0%7%9%
Small17%20%14%18%
  History17%20%14%18%
Part of municipal or province government17%20%21%18%
Medium0%0%7%0%
  History0%0%7%0%
Small17%20%14%18%
  Art8%10%7%9%
  Other8%10%7%9%
Part of the regional government17%20%14%18%
Large8%10%7%9%
  Other8%10%7%9%
Small8%10%7%9%
  Art8%10%7%9%
Part of the state, central, or federal government8%10%7%9%
Small8%10%7%9%
  History8%10%7%9%
Part/department of another institution0%0%7%0%
Small0%0%7%0%
  History0%0%7%0%
Partnership with local govt and a trust8%0%7%0%
Medium8%0%7%0%
  History8%0%7%0%
Private, non-profit body8%10%7%9%
Small8%10%7%9%
  History8%10%7%9%
Grand Total100%100%100%100%
Disclaimer/Publisher’s Note: The statements, opinions and data contained in all publications are solely those of the individual author(s) and contributor(s) and not of MDPI and/or the editor(s). MDPI and/or the editor(s) disclaim responsibility for any injury to people or property resulting from any ideas, methods, instructions or products referred to in the content.

