Article

Microclimate of the Natural History Museum, Vienna

1
School of Environmental Sciences, University of East Anglia, Norwich NR4 7TJ, UK
2
Department of Marine Environment and Engineering, National Sun Yat-Sen University, Kaohsiung 80424, Taiwan
3
Zoology, Natural History Museum Vienna, Burgring 7, 1010 Vienna, Austria
4
Building Department, Natural History Museum Vienna, Burgring 7, 1010 Vienna, Austria
5
Department of Integrative Biology and Biodiversity Research, Institute of Zoology, University of Natural Resources and Life Sciences, Gregor-Mendel-Straße 33, 1180 Vienna, Austria
*
Author to whom correspondence should be addressed.
Heritage 2025, 8(4), 124; https://doi.org/10.3390/heritage8040124
Submission received: 28 January 2025 / Revised: 14 March 2025 / Accepted: 29 March 2025 / Published: 31 March 2025
(This article belongs to the Special Issue Microclimate in Heritage)

Abstract

Climate change increases the importance of maintaining environmental conditions suitable for preventive conservation within museums. The microclimates at the Natural History Museum of Vienna, a large national collection housed within a classical building, were studied using >200 data loggers placed from mid 2021 to provide thermo-hygrometric measurements at 15 min intervals. Daily mean temperatures showed exhibition halls typically had the warmest rooms. This was due to the heating in winter and open windows on summer days. The halls can become even hotter than the outside temperature. In winter, most areas of the museum were very dry, as heating lowered the relative humidity, typically to 25–35% for the coldest season. Opening hours imposed daily and weekly cycles on the internal climate. There was little difference between sunny and shaded parts of the building or adjacent offices, corridors and depots. Similarly, the microclimate at the floor resembled that of the room air some ~2 m above. Mechanically controlled microclimates in cold storage areas maintained 10 °C and relative humidity ~50%, but this had become increasingly difficult in hot summers. While there was little apparent damage to the collection, at times, the museum had an extreme indoor climate: very hot in the summer and dry in the winter.

1. Introduction

The 20th century saw the development of the concept of preventive conservation [1] and an increasing interest in the climate of museums. This led to the publication of key works on museum climates, such as Garry Thomson’s The Museum Environment of 1976 [2] and later Dario Camuffo’s Microclimate for Cultural Heritage of 1998 [3]. Over recent decades, there has been a growing body of work concerned with the indoor conditions relevant to the preservation of objects and materials in museums [4]. This has led to a wider understanding of how indoor climates vary across the day, and through the year, and effects on their storage. Relative humidity is typically given a guideline value of 50% with a daily variation of 5–10% for optimum long-term preservation, while the recommended temperature is between 15 and 25 °C, with a daily variation between 2 and 5 °C [4]. The microclimate of museums is increasingly well monitored [5,6,7], and museums are able to take advantage of the recent availability of inexpensive sensors and cloud-based systems [8]. In the last century, damage from pollutants within acid rain was of great concern, so it is little wonder that interest in pollutants within museum air was also increasing [9] and was very much a focus of many studies [5]. These were ultimately joined by concerns about the impacts of a changing climate [10] and the need to consider weather in terms of heritage climatology that represents climate in a way that is relevant to the protection of collections [11]. This has positioned the microclimate of the heritage environment as a major feature of research and a practical challenge for heritage management [12]. Climate change has meant increasing interest in the way the outdoor climate propagates indoors [10,13]. There is a large amount of literature on the museum microclimate, as it is crucial to the prevention of damage from climate fluctuations and to reducing the risk of damage [14,15,16,17,18,19]. If objects are not exhibited in well-constructed display cases with a specifically regulated microclimate, objects will have a similar temperature and relative humidity (RH) as the air in the rooms and will fluctuate with the number of visitors and outside weather with daily and yearly changes. There is also interest in the relevance of storage at lower temperatures [20,21,22,23].
Future changes in indoor temperature and relative humidity, although perhaps just a few degrees or percent, seem likely to affect indoor pests such as insects and fungi [24,25,26]. However, even contemporary environmental conditions in the heritage environment are not always well understood. While temperature and relative humidity have long been monitored indoors, the availability of inexpensive microsensors has allowed more detailed pictures of the indoor climate, which can be seen in measurements from a number of locations [4,5,6,7]. While such campaigns have established variation across museums, it has often been difficult to relate observed outcomes to microclimate given the changing nature of collections, visitors and exhibited materials. This study looks at the climate of a major historic museum building with the largest natural history collection in Austria to explore the climate of different areas of a museum and how it changes over time and space and compares this with that of the outdoors. While the monitoring was undertaken to understand the presence of insects and fungi, it has a wider relevance to the general preservation of sensitive materials.
Increases in temperature, humidity, air speed, solar radiation and pollution in a changing world [27] heighten the risk of degradation and damage to cultural and natural heritage. In this context, accurate and efficient access to microclimate information and monitoring of microclimatic change are of considerable importance for the sustainable conservation of heritage.
The current study of the Natural History Museum, Vienna (Figure 1), forms part of a more extensive program examining threats of a changing climate to museums [28]. The work presented here examines this large national collection in a classical, though modified, building of >8000 m2, that receives more than a million visitors each year among exhibition rooms where there is a ready exchange of air. It explores the differences between floors that show a range of uses beyond just acting as exhibition spaces. It is thus relevant to the conservation requirements of the microclimate of storage spaces, offices, archives, libraries, etc. The imperial collections of the Natural History Museum consist of a variety of object types and materials. The museum began in 1750 with a large collection of minerals and fossils (30,000 objects); later, taxidermy objects (mainly hunted mammals and other vertebra) along with plants (herbaria) were added. The collection also included an ethnographic collection with a mix of materials (wood, textiles, fur, paper, photographs etc.), but this now belongs to the Weltmuseum Wien (a museum of the Kunsthistorisches Museum KHM Museumsverband). A few paintings, large libraries and an archive are also part of the collection. Sensitive materials include taxidermy objects, the herbaria and the former ethnographic collections, which are at risk from indoor temperature and RH fluctuations.
Major research gaps remain in terms of the indoor climate of large historic buildings. This study tries to understand the influence of outside temperature, weather and visitor numbers, so the building can better adapt to the future challenges of climate change. This work aims to be a baseline for further research within the Natural History Museum that can be combined with studies related to insect pests, fungal activity and energy efficiency, for example.

2. Materials and Methods

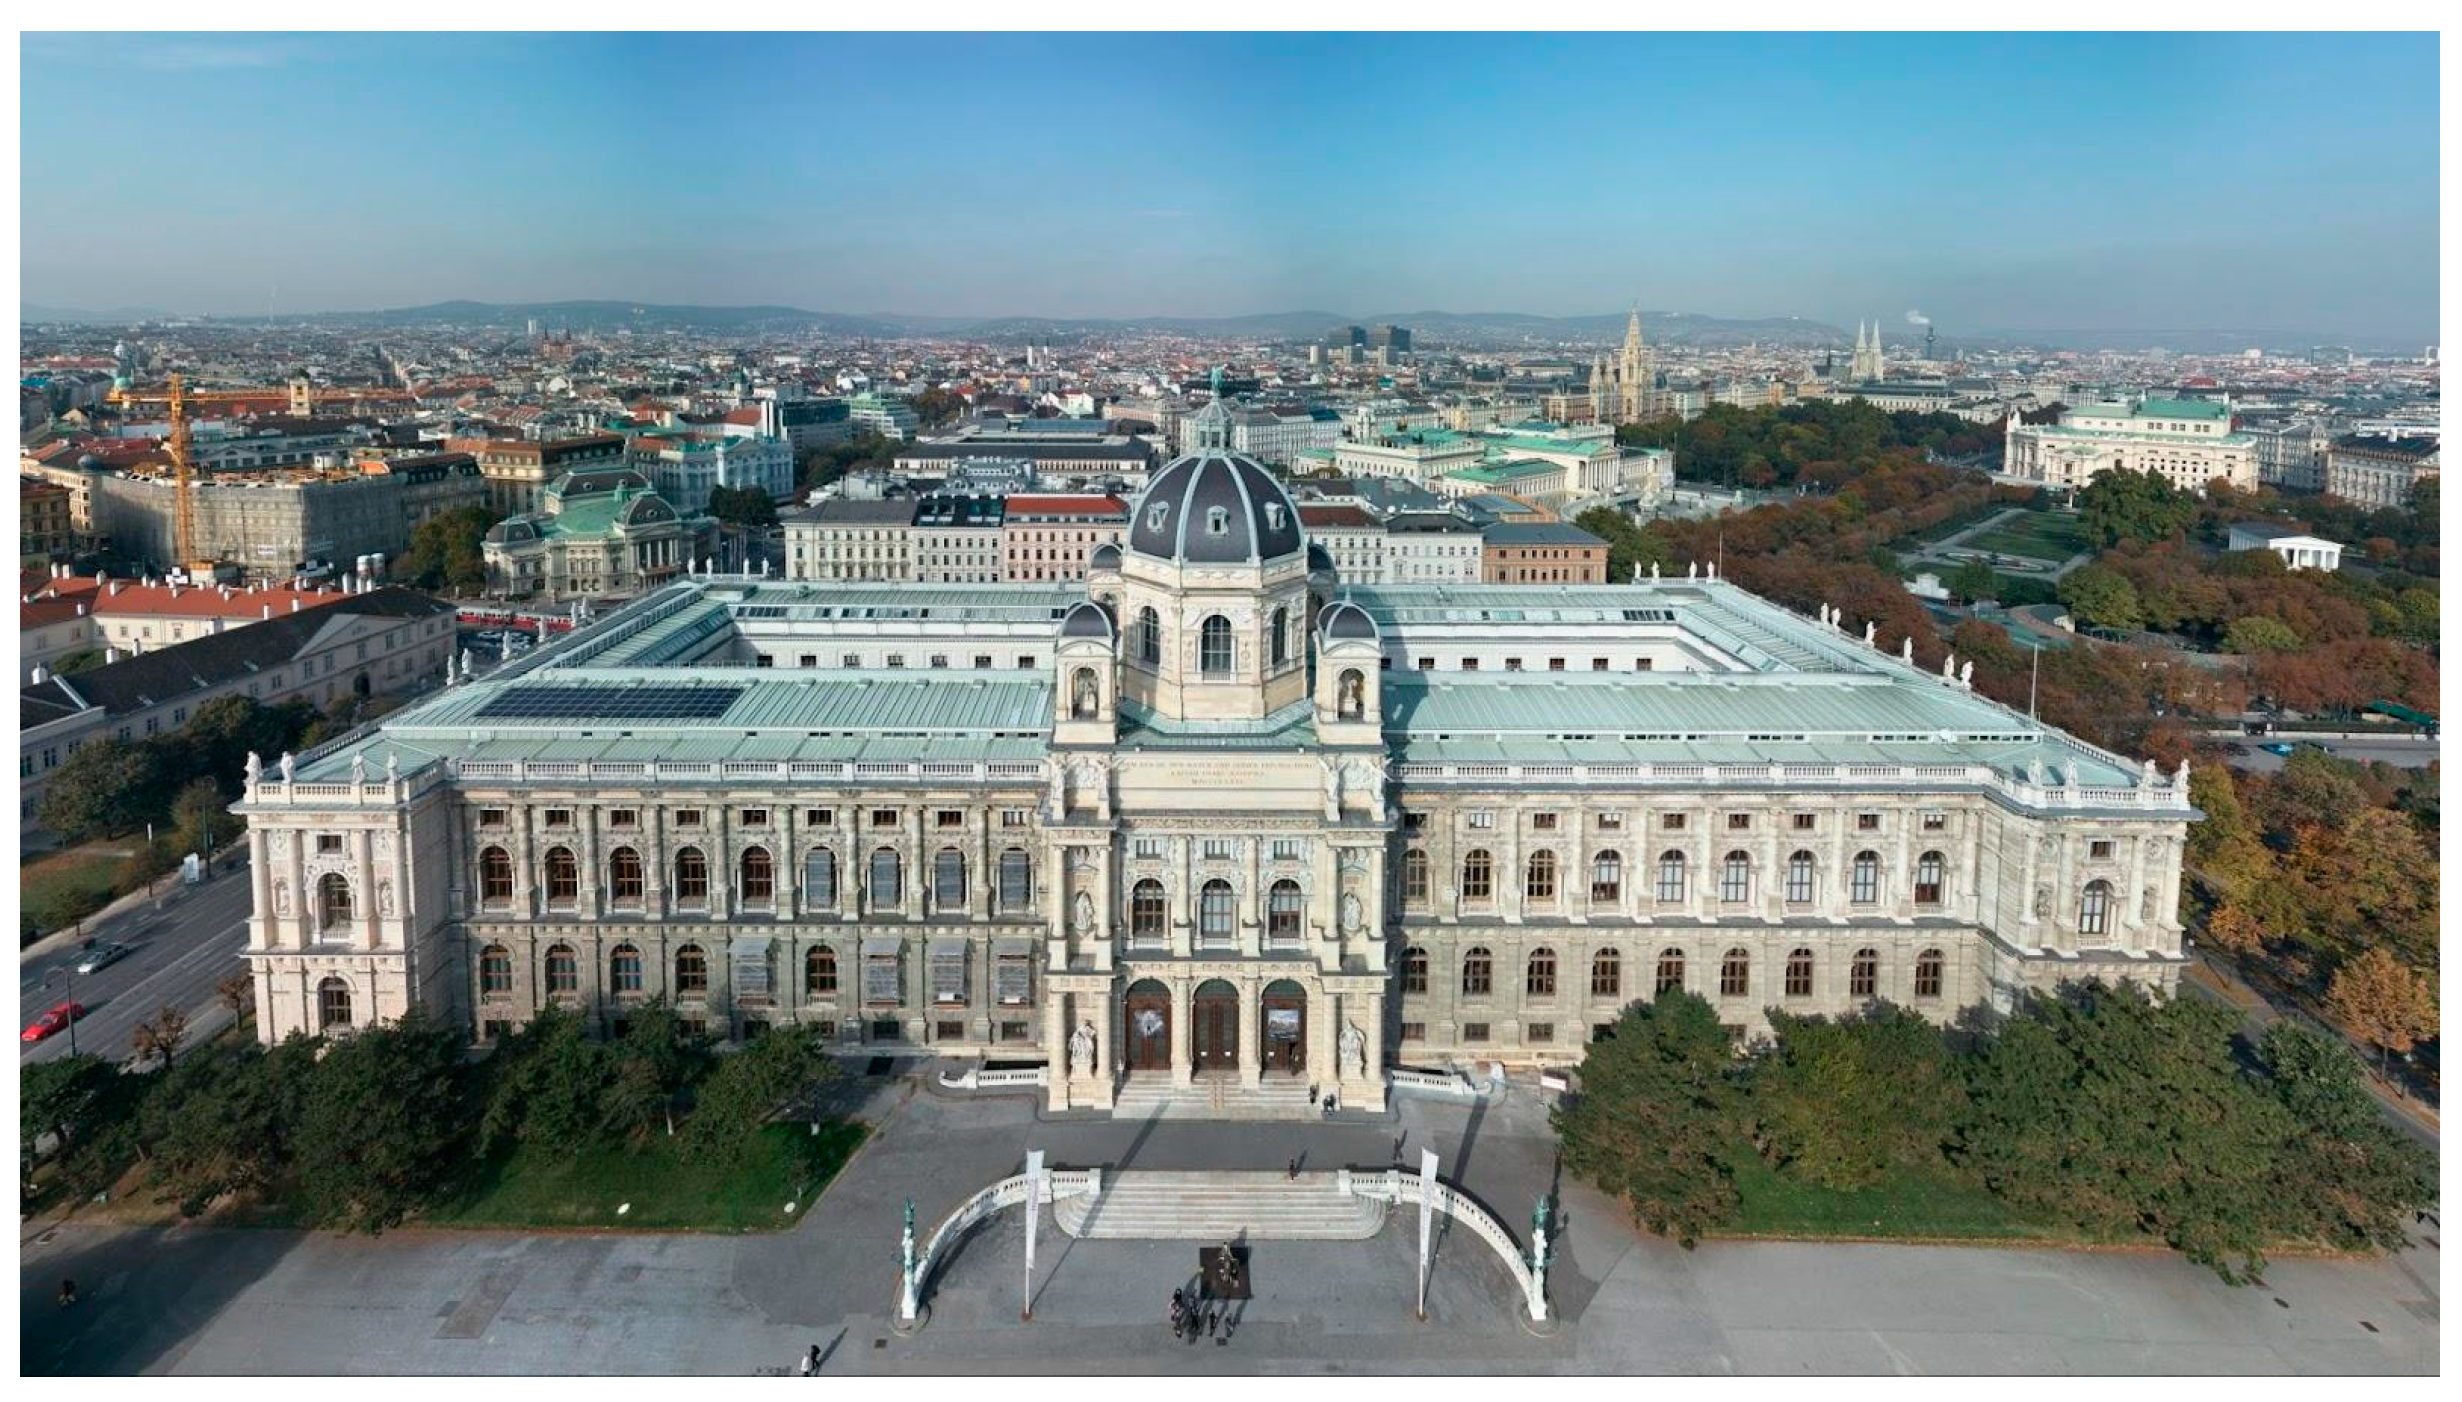
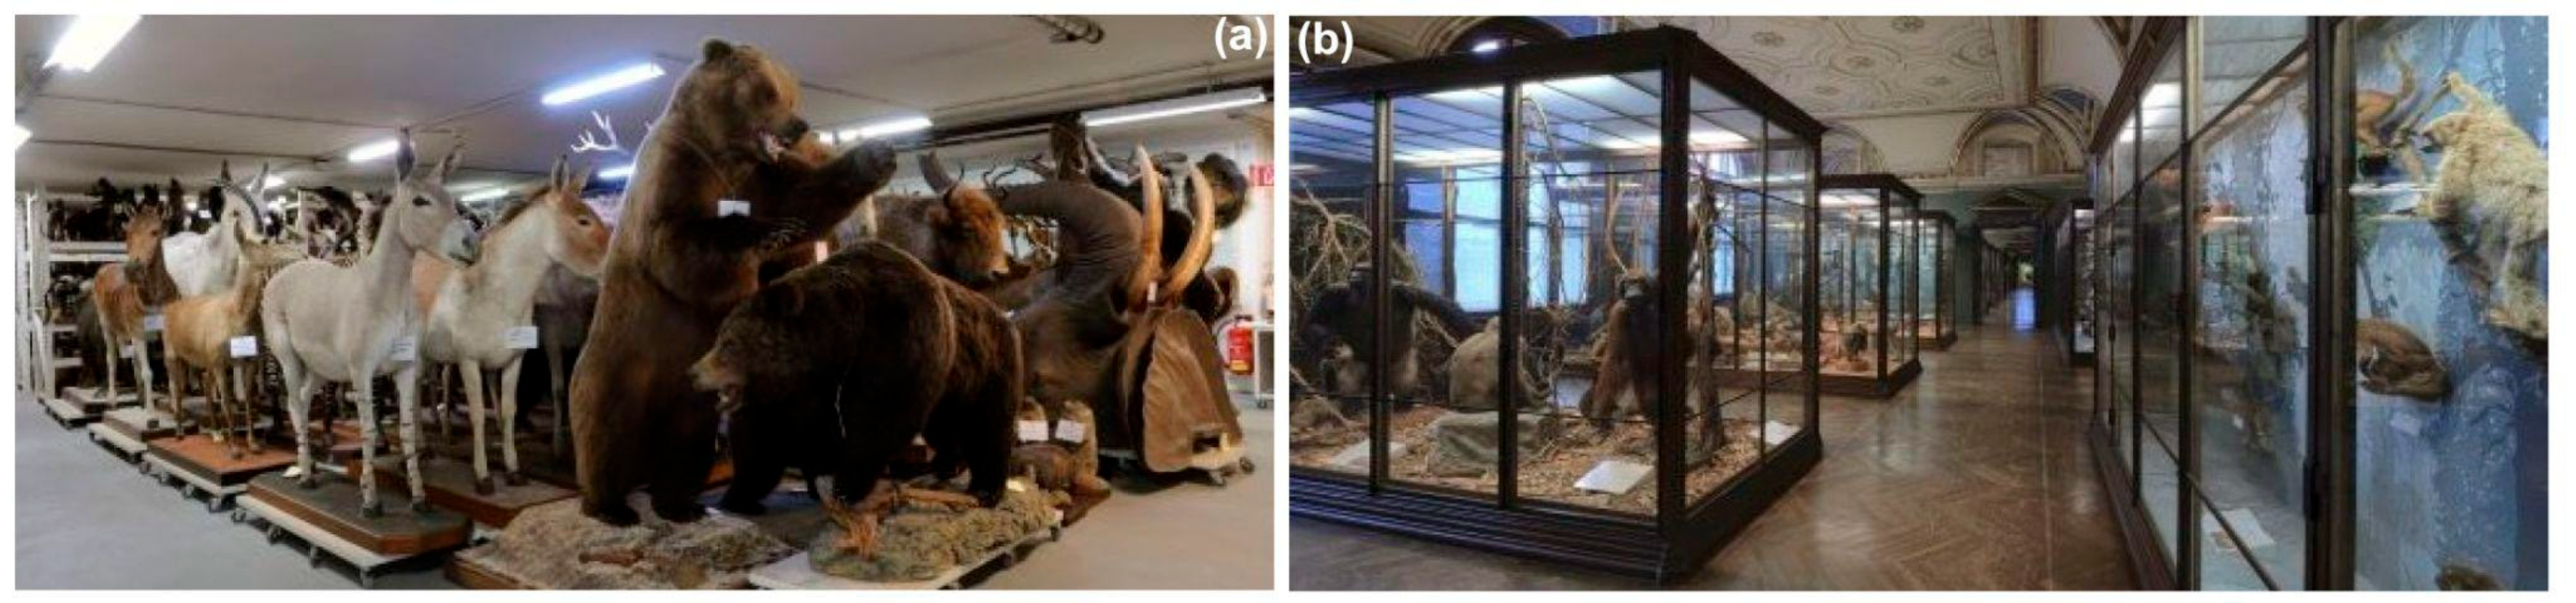
2.1. The Natural History Museum in Vienna

The Natural History Museum of Vienna is a research museum dating back to the imperial collections of the 18th century, with its collections restructured by the geologist Ferdinand von Hochstetter [29]. It is located on Museumsplatz in the city center. The current building was inaugurated on 10 August 1889 and presently has 39 large exhibition rooms, which display more than 100,000 objects. On the Mezzanine floor (F1), minerals, rare fossils, huge dinosaurs and unique prehistoric findings, such as the famous Venus of Willendorf, are on display. On the first floor (F2), mammals, birds, insects and other arthropods are presented, with most of the objects in historic wood and glass showcases. The building has a basement, a ground floor and four further floors, including the modernized attic [30]. The total area of the museum is 8460 m2, which additionally includes offices, laboratories, libraries and storerooms (Table 1). The building is some 170 m long and 70 m wide, comprising two courtyards that are each surrounded by working, storage and exhibition rooms. In total, the museum has 900 rooms (sometimes referred to by their numbers in the text). It is home to 30 million objects available to more than 60 scientists and numerous guest researchers who conduct research on a wide range of topics related to human, earth and life sciences. As a result, the Natural History Museum of Vienna is one of the largest non-university research institutions in Austria, one of the 10th largest natural history collections in the world and an important center of excellence for all matters relating to the natural sciences.
Individual exhibition rooms differ in their content but typically contain objects within display cases and are located on all four sides of the building, with the longest axis running southwest to northeast. Some of the workshops and lecture rooms face southwest on the Mezzanine Level, and most of exhibition rooms overlook large courtyards. The building has mostly passive natural ventilation with open windows. The few rooms with climate control systems (automatic) are specifically discussed within the text. The museum is open Thursday–Monday: 09:00–18:00, Wednesday: 09:00–20:00, on Tuesday, it is closed. The office spaces are open from Monday to Friday during working hours.
Additional space was required by the late 20th century due to a growing number of acquisitions to the collection. This problem was partly solved by the construction of an underground storage area, immediately adjacent to the museum, with four underground levels. It was built at the time of the construction of the U3 subway line and completed in 1990. This new storage area allowed sensitive elements of the collection to be kept in a climate-controlled environment. An example is the valuable prehistory, bird, mammal, reptile and entomological collections, which are cooled to 10 °C or 16 °C with an HVAC system to prevent damage from insect pests. In summer, additional dehumidifiers are necessary to regulate humidity. Occupied rooms in the building use district heating to maintain warm conditions in winter of 24–25 °C, although it is not centrally controlled and varies slightly from room to room. Further, a roof conversion was carried out between 1991 and 1995 that also created new storage, libraries, archives and working areas in the attic of the building by effectively adding another floor. A few rooms in the attic have an HVAC system to regulate the climate (cooling, humidification and dehumidification).

2.2. Instrumentation and Data

A total of 250 MostraLog data loggers were set out in summer 2021 (Long Life for Art, Germany). They were used to record indoor climate at 15 min intervals, storing thermo-hygrometric measurements from different locations (Table 1) in the building as part of the Heritage_2020-043_Modeling-Museum project [29]. Most recordings began in July 2021, with many records running to October 2022. The loggers have a temperature accuracy of ±0.5 °C (5 °C–45 °C) with a resolution of 0.1 °C and can determine relative humidity with an accuracy of ±2% RH (10–90%) at 0.1% resolution. The sensors were placed on the walls at a height of approximately 2 m, although some of the loggers used additional external sensors at the floor level in close contact with the flooring material. The data loggers were distributed within the building to obtain a representative sample of all rooms and collections. Most objects are displayed or stored between 2 m and the ground. Therefore, we selected 2 m as the height for the data loggers. Further, they could easily be reached, checked and monitored. The floor measurements were used to measure the microclimate related to the insects living on the floor. Comparing these two measurements in one room gives an idea of how much the microclimate varies.
The supplementary material (see links under the Data Availability Statement) presents the position of all data loggers on the floor maps. We tried to place a representative number of data loggers on each floor and selected rooms that were relevant from the following standpoints: exhibition rooms, storage rooms housing valuable organic (and inorganic) collections, storage rooms with objects that are sensitive to climate fluctuations, rooms that have strong sun exposure (the attic for example), work spaces and the basement, where higher humidity was likely.
Absolute humidity was determined from temperature and relative humidity using the Wexler polynomial [31]. Historic data (from January 2004 to September 2013) from the mammal collection came from records generated by Rotronic monitors in the storage areas and equipment from Technetics Freiburg. External climate data from the nearby climate station at Innere Stadt in Vienna were downloaded from Zentralanstalt für Meteorologie und Geodynamik [32].

2.3. Data Analysis and Statistics

Data from the loggers were initially downloaded in proprietary form from the climate sensors but converted to CSV files. Seasons were defined as: summer, June–August; autumn, September–November; winter, December–February; and spring, March–May. The datasets were cleaned and processed using short scripts (written in the AWK programming language) and adopted simple linear regression analysis and other tests from online tools. Vassarstats [33] was used for the Student’s t-test, allowing us to compare the means of two sets of data. An ANOVA model was used where more than two climate datasets were to be compared. The Tukey Honest Significant Difference test (HSD) was used to interpret the statistical significance of these measures of difference between means in sets of data. Fourier transforms were adopted to detect frequencies present in the data and establish the presence of daily and weekly seasonal cycles. We adopted the fast Fourier transform (FFT) function in the SCILAB computational package for these analyses. Although regression analysis was sometimes used in the current study, trends in time series used Theil–Sen slopes as an outlier-resistant alternative to the linear regression slope [34]; this is particularly useful as outliers do not need to be removed. Where necessary, seasonal trends in time series were removed by locally estimated scatterplot smoothing (LOESS), so the long-term trends were clearer [35].

3. Results and Discussion

3.1. Building Microclimate

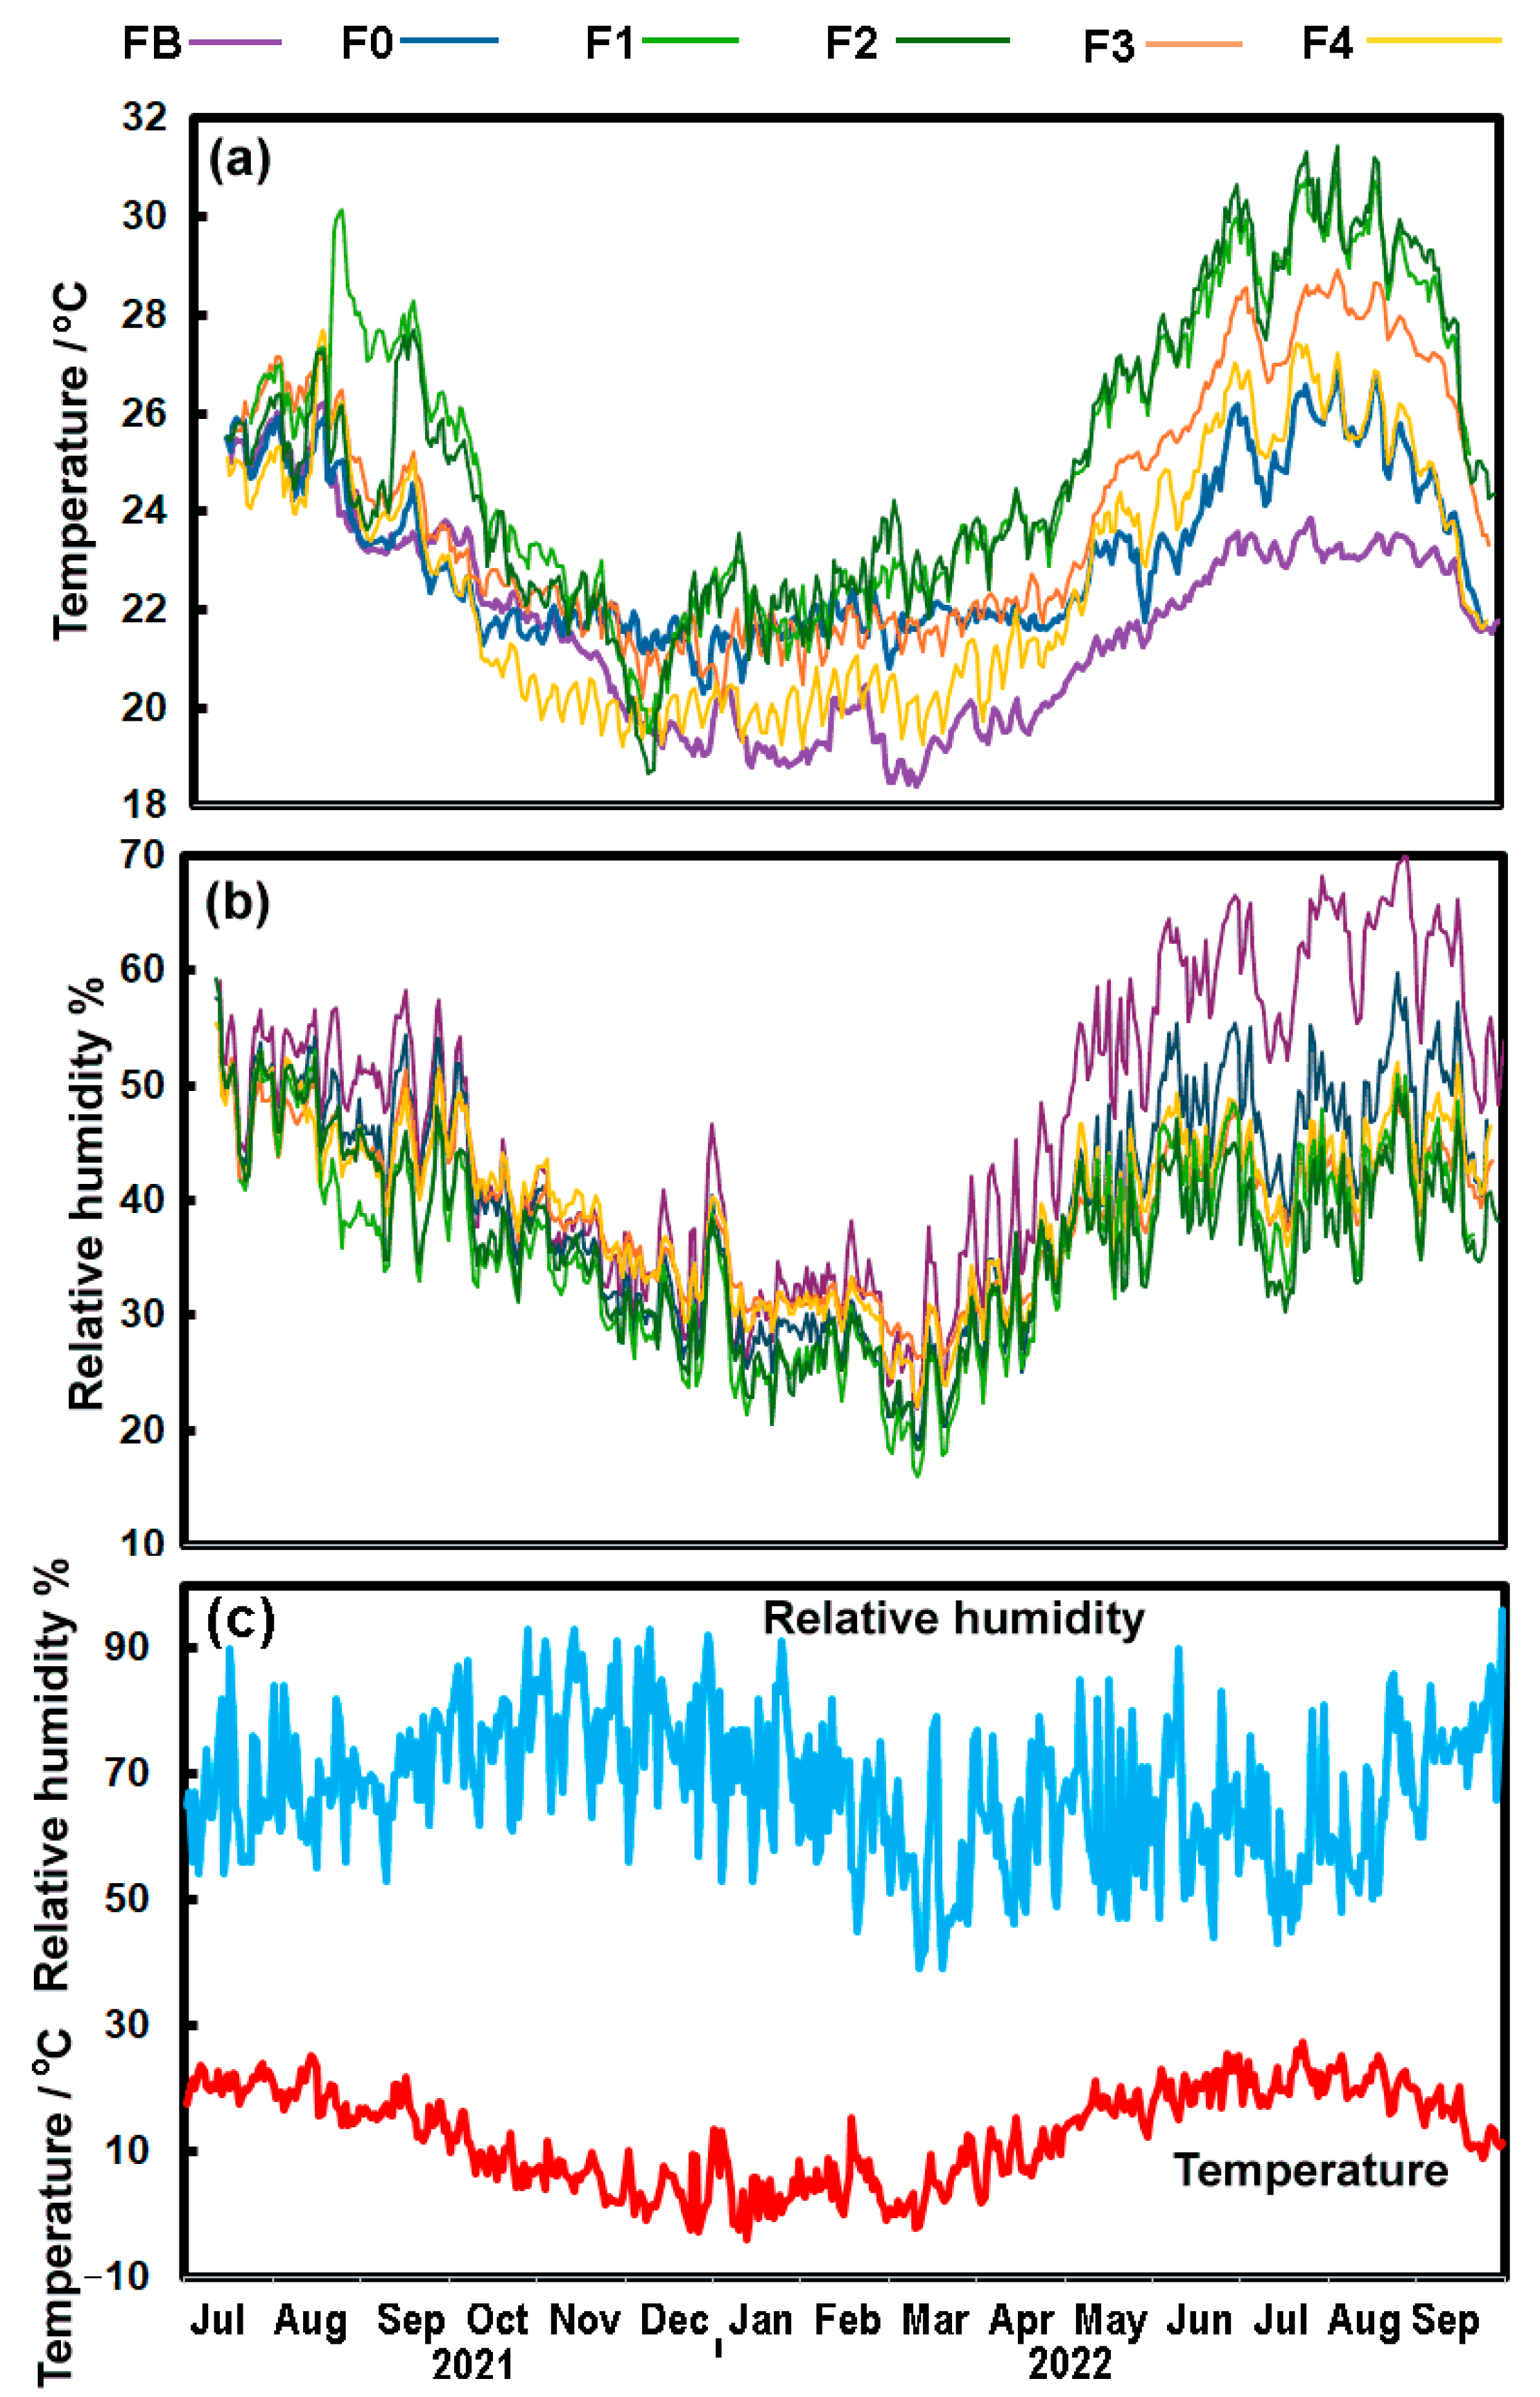
3.1.1. Floors of the Building

The average microclimate, as measured from sensors on the various floors and the local outdoor climate at nearby Innere Stadt, is shown in Figure 2 as daily means covering the period from July 2021 to September 2022. Not all records collected were of equal length (some extending into 2023), so care needed to be taken when comparing records; fortunately, missing values were extremely rare. A few records were lost during the study when batteries in the loggers failed.
In general, cooler floors of the building appeared slightly more humid. The basement (FB) was typically one of the cooler areas in terms of average measurements from sensors in hallways, storage locations and building management sites. At times, the air-conditioned attic (F4), which includes archives, offices and workspaces, was one of the coolest areas. The exhibition halls in floors F1 and F2 were typically the warmest, well heated in winter with radiators using district heating [36], and ventilated with open windows on summer days and occasionally district cooling [37]. Exhibition halls could become even hotter than the outside temperature. The differences between the floors were greatest in summer. Unsurprisingly, the basement was not only cool, but also the most humid level. In winter, most areas of the museum were very dry, as heating lowered the relative humidity, which was typically between 25 and 35% in the coldest parts of the year. It was very low in the exhibition halls from January to March (F1: 24.87 ± 4.16%; F2: 25.87 ± 3.68%). Seasonal changes in temperature were smaller inside than outside but showed a similar pattern, while the seasonality of RH was different.
The average microclimate for the year, i.e., 365 days from 6 August 2021 to 5 August 2022, is given in Table 2 as the average temperature for each floor, but much dispersion appears in these numbers as standard deviation arose from the annual cycle. A correlated or paired ANOVA, using the daily dataset to calculate averages, showed that the daily temperature used to assemble the values in Table 2 was not the same on all floors. A Tukey difference test (HSD) suggested the temperatures of the floors were significantly different from each other (p < 0.01). A similar analysis for relative humidity again suggests the daily values were not all the same, but in this case, the Tukey HSD test suggests that some of the pairs of relative humidity measurements, notably the exhibition rooms (F1 and F3), did not differ significantly (p > 0.05) from the ground floor (F0).

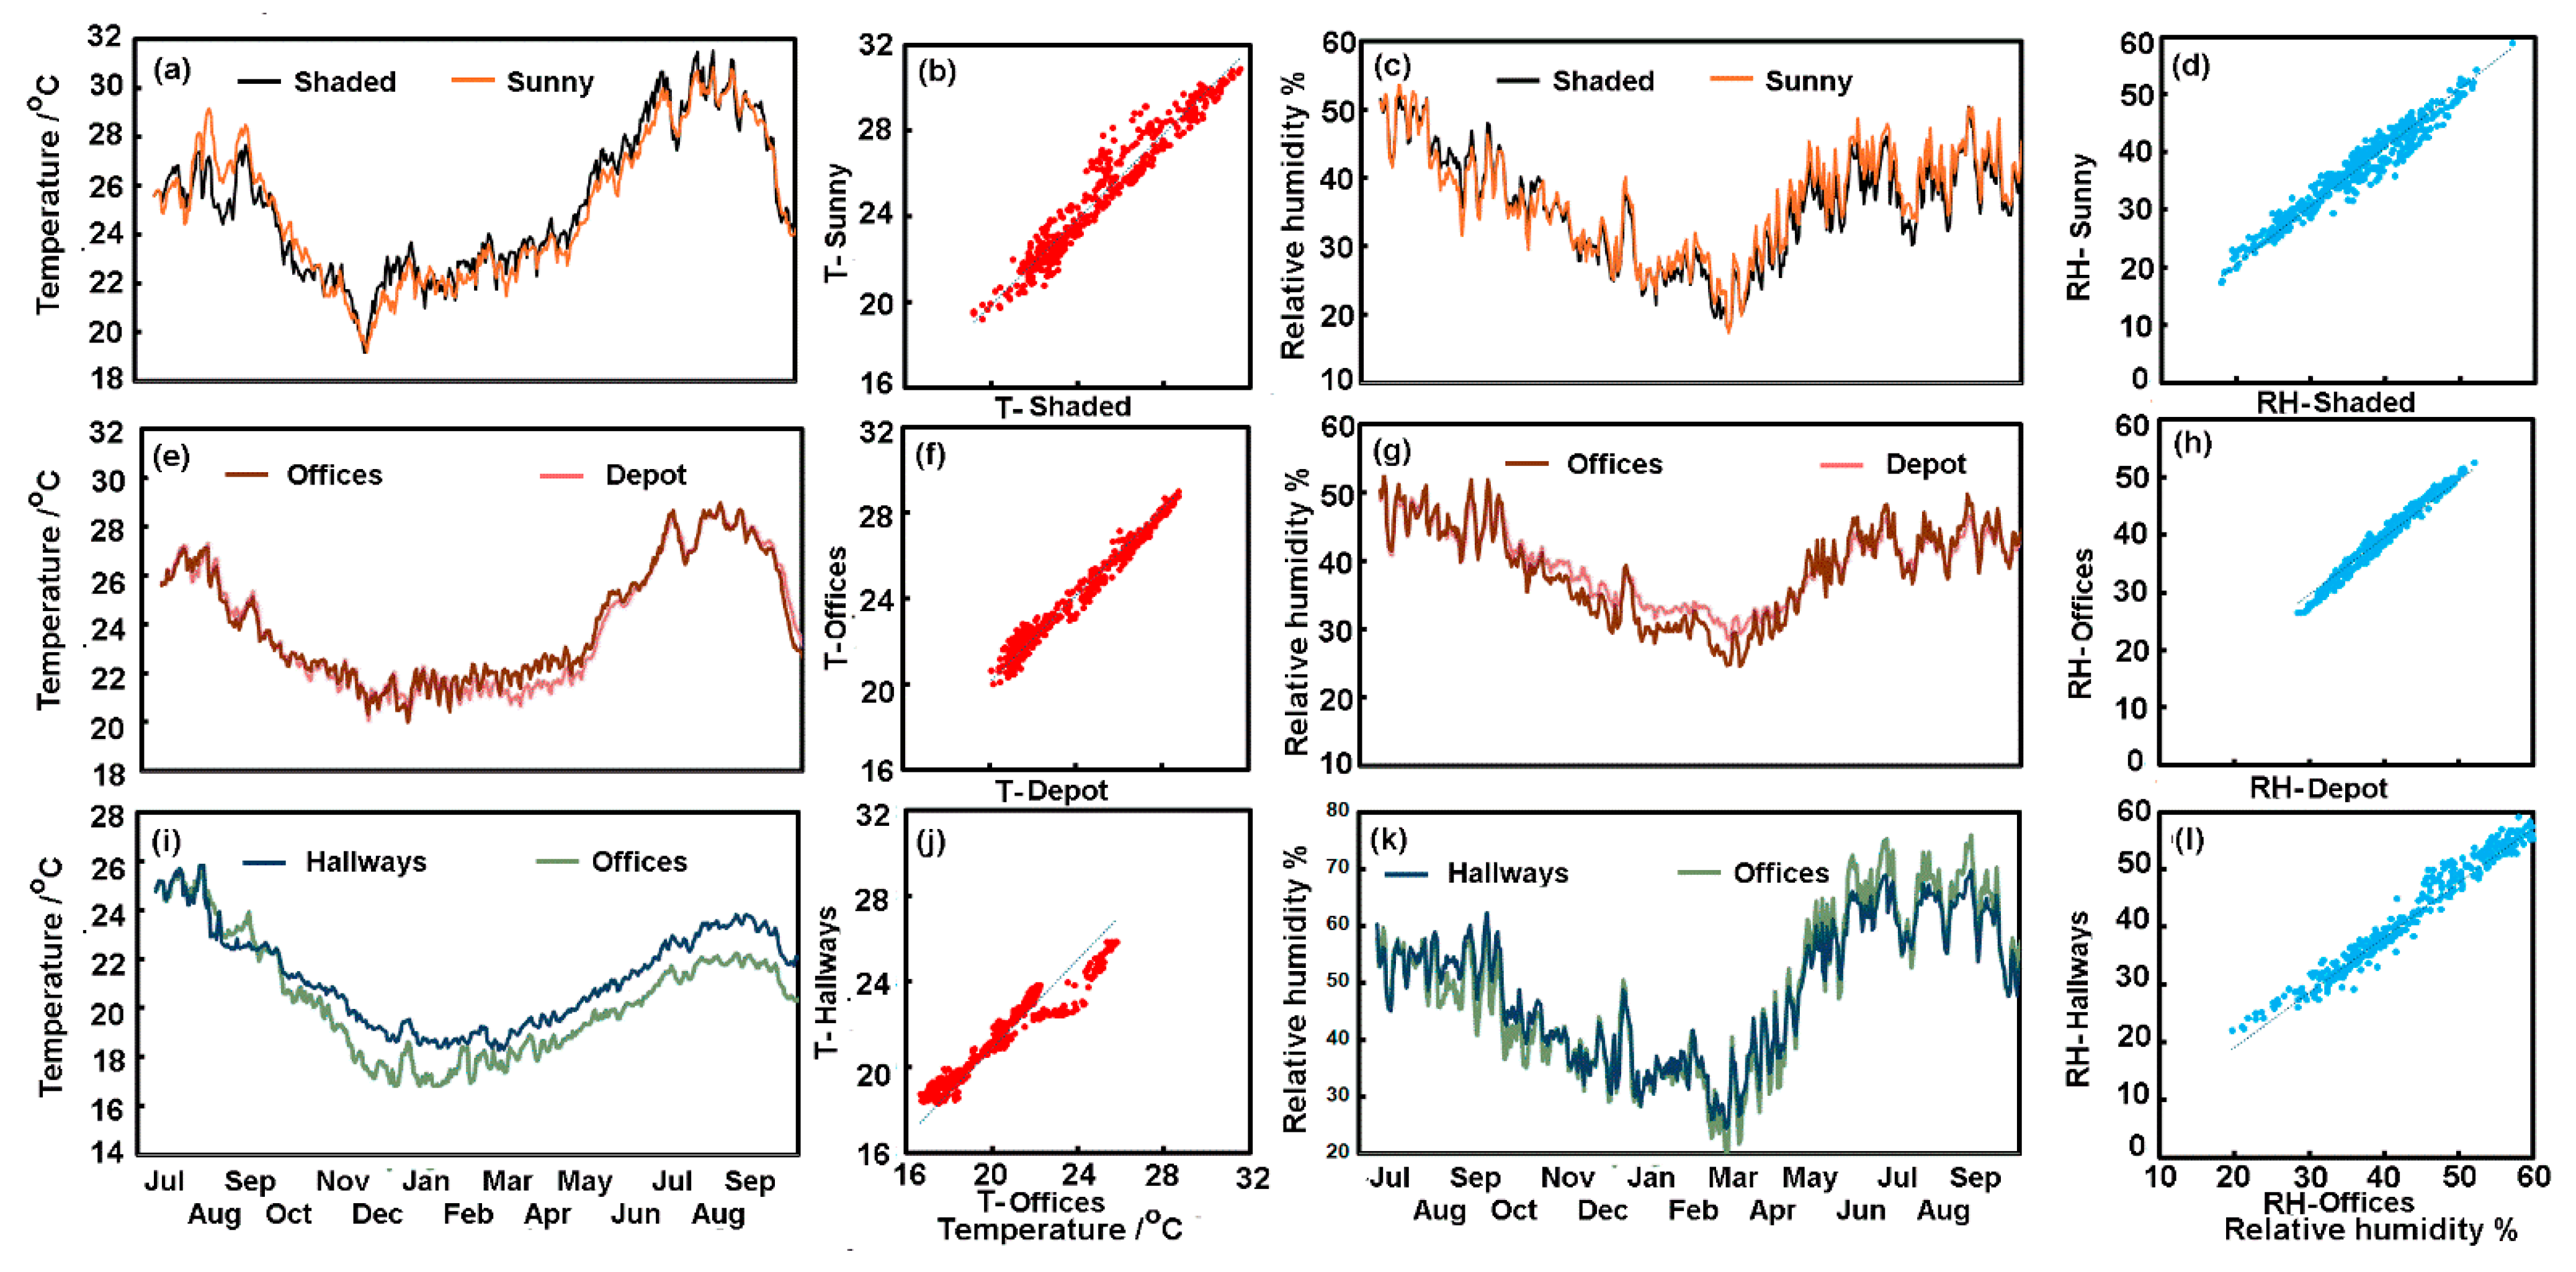
3.1.2. Areas of the Building

The microclimate in various parts of the building reflecting different aspects of use is shown in Figure 3, revealing that the microclimate of a given floor is not especially different. Figure 3a shows the average temperature from July 2021 to September 2022 in the rooms of the exhibition halls with a shaded northerly aspect as compared to those with the sunny southerly aspect. Over the time period, there was little difference between the temperatures of these areas, as shown in Figure 3b, where the regression coefficient (R2) was 0.9992, and the slope was close to unity (0.995), suggesting equivalence between the daily temperature values on the sunny side (y-axis) and the shaded side (x-axis). Similar plots in Figure 3c,d, suggest a close relationship between the relative humidity of rooms with shaded and sunny aspects as the R2 was 0.9976, and again, the slope was close to unity (1.0221). As with the aspect of the rooms, their use as offices and storage depots on F3 again suggests little difference in the temperature and relative humidity of these two sets of rooms (Figure 3e–h). In the basement, where temperatures were generally lower than the upper floors, the hallways were slightly cooler than the storage areas (Figure 2a and Figure 3i). These were well correlated (R2 = 0.9987), although the slope (Figure 3j) departed from unity (1.0434). The basement was more humid than the other floors (Figure 2b), although the hallways and the offices were very similar (Figure 3k) and well correlated (R2 = 0.9981), even though the offices appeared slightly cooler. However, the slope departed from unity (0.9536) as the hallways were more humid when conditions were damper.

3.2. Indoor Climate Cycles

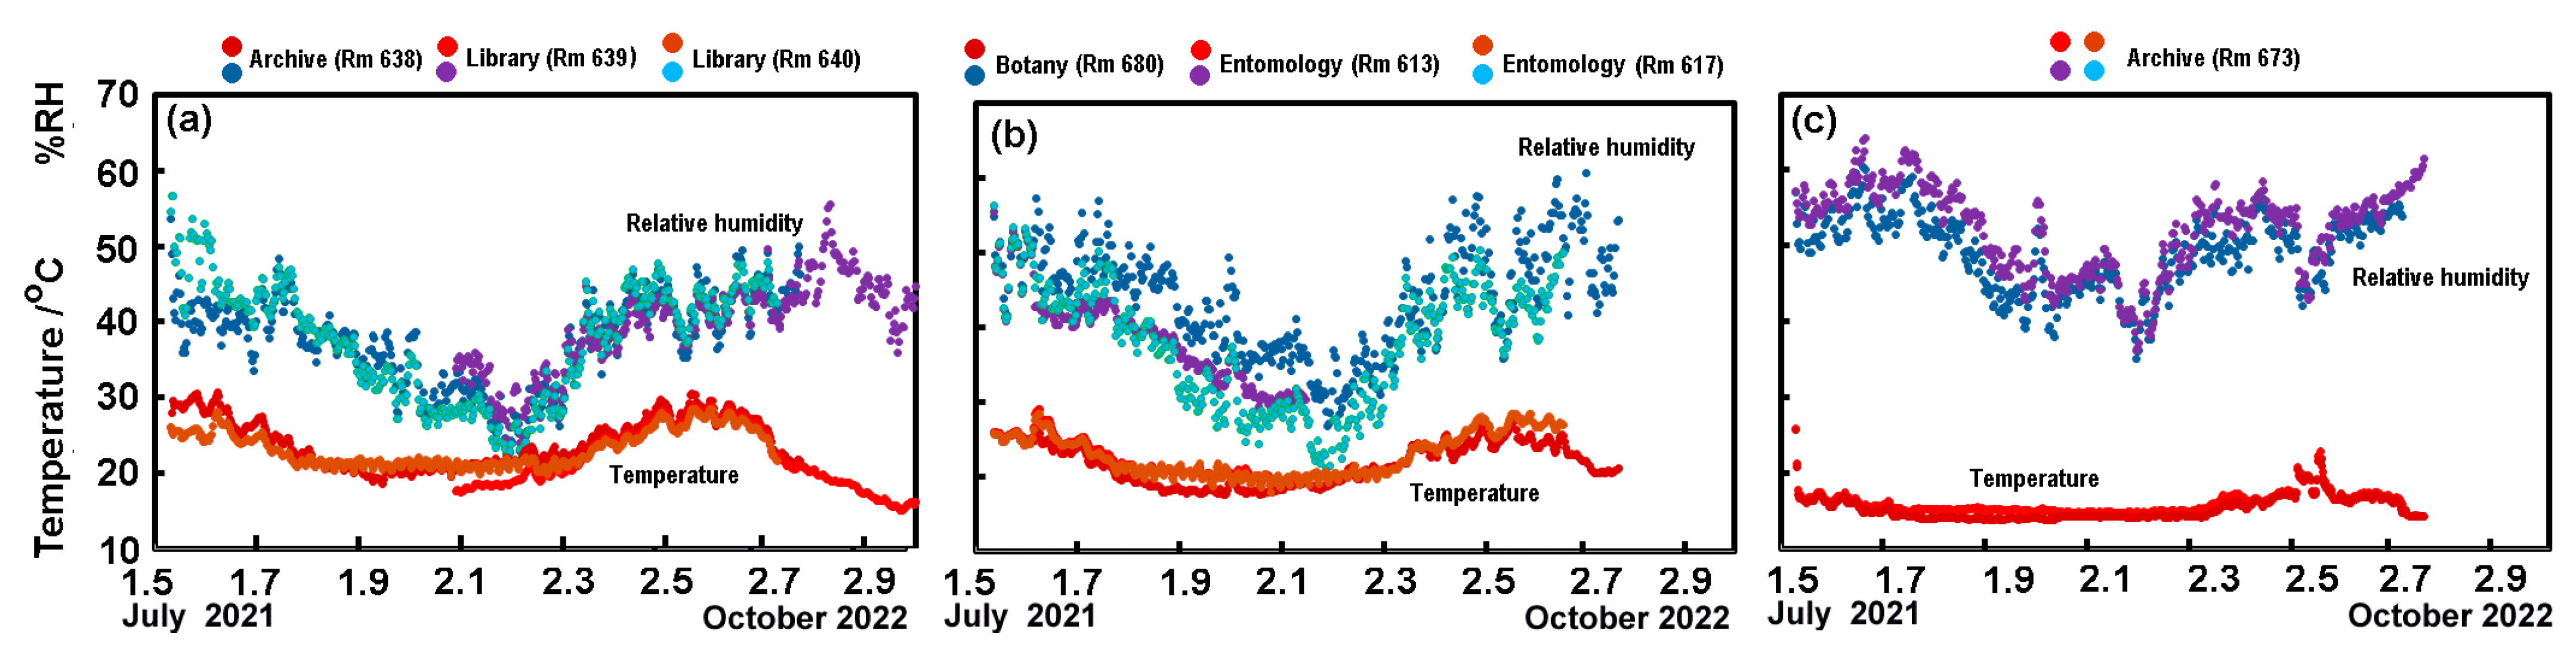
3.2.1. Zoological Library

The climate cycles in the Zoological Library (as a typical interior space) are shown in Figure 4. The daily temperature as a function of relative humidity for the period from 20 July 2021 to 10 October 2022 (Figure 4a) suggests the summer is understandably warm (~28 °C), but comparatively dry (RH 35–40%). The autumn temperatures were variable, but cooler (23–26 °C). However, both winter and spring were even colder (22–24 °C) and had very dry conditions (RH 25–32%), especially in spring, when external relative humidity was low (Figure 2c). Figure 4b shows the daily temperature and relative humidity plotted for the period from 20 July 2021 to 10 October 2022. The Fourier transform of the raw temperature data collected at 15 min intervals, in the inset, illustrate that distinct cycles occurred at both daily and weekly frequencies, driven by activities in the museum, i.e., daily and weekly work and visitor routines. The summer temperatures in the library were at their lowest during the small drop just after midnight (Figure 4c). The average daily temperatures in winter were lowest at the end of the week as the library was largely unused on Saturdays and Sundays, so heating was minimal (Figure 4d). There were some hints of a daily relative humidity cycle (Figure 4c), although there was no evident weekly cycle (Figure 4d).

3.2.2. Diurnal Patterns in the Exhibition Halls

Figure 5a shows the diurnal pattern (i.e., occurring each day) of hourly averages (from all the exhibition rooms of F1) for the warm and cold seasons. Unsurprisingly, the temperatures were cooler in the winter, although during the day, they revealed a 4 °C increase, consistent with the galleries being warmed for visitor comfort (typically warmed to 24–25 °C). The daily range of average temperatures on the floor were close to 2 °C, and the room temperatures is probably rather high for human comfort in summer, so the windows are typically open encouraging natural ventilation in the room. In contrast, the humidity was lower during the day when the museum was open (Figure 5b). This seems to arise through the rooms being heated perhaps by solar irradiation in the warm season in addition to an inward flow of warm air, but by the heating system in the winter. Relative humidity levels are remarkably low in the winter and represent an environment that is likely to be too dry for some of the objects (e.g., organic materials such as paper, leather etc.), although many of the smaller items within the collection are presented in cases. Most of the objects in the museum have been on display for over 100 years, without obvious damage, even among collections that include more sensitive items, such as taxidermy objects. Minerals and fossils are both on open display and in cases showing no sign of damage. Nevertheless, a few sensitive objects are displayed in cases with some internal climate control.
The museum is closed to the public on Tuesdays, so we were able to examine the effect of accommodating visitor needs by comparing the differences between Tuesday and the rest of days in the week for both temperature and relative humidity through the year. Figure 5c shows that during the night, there was little difference between Tuesdays (when the museum is closed) and other days. However, during the day when the exhibition areas were open to the public (i.e., days other than Tuesdays), they were warmer than on Tuesdays, likely a product of the heating (in winter) and perhaps solar irradiation and open windows in summer. Relative humidity showed a rather similar pattern, although during the day F1 was a little drier on Tuesday, when it was closed to the public, probably because moisture arose from the many thousands of visitors each day.

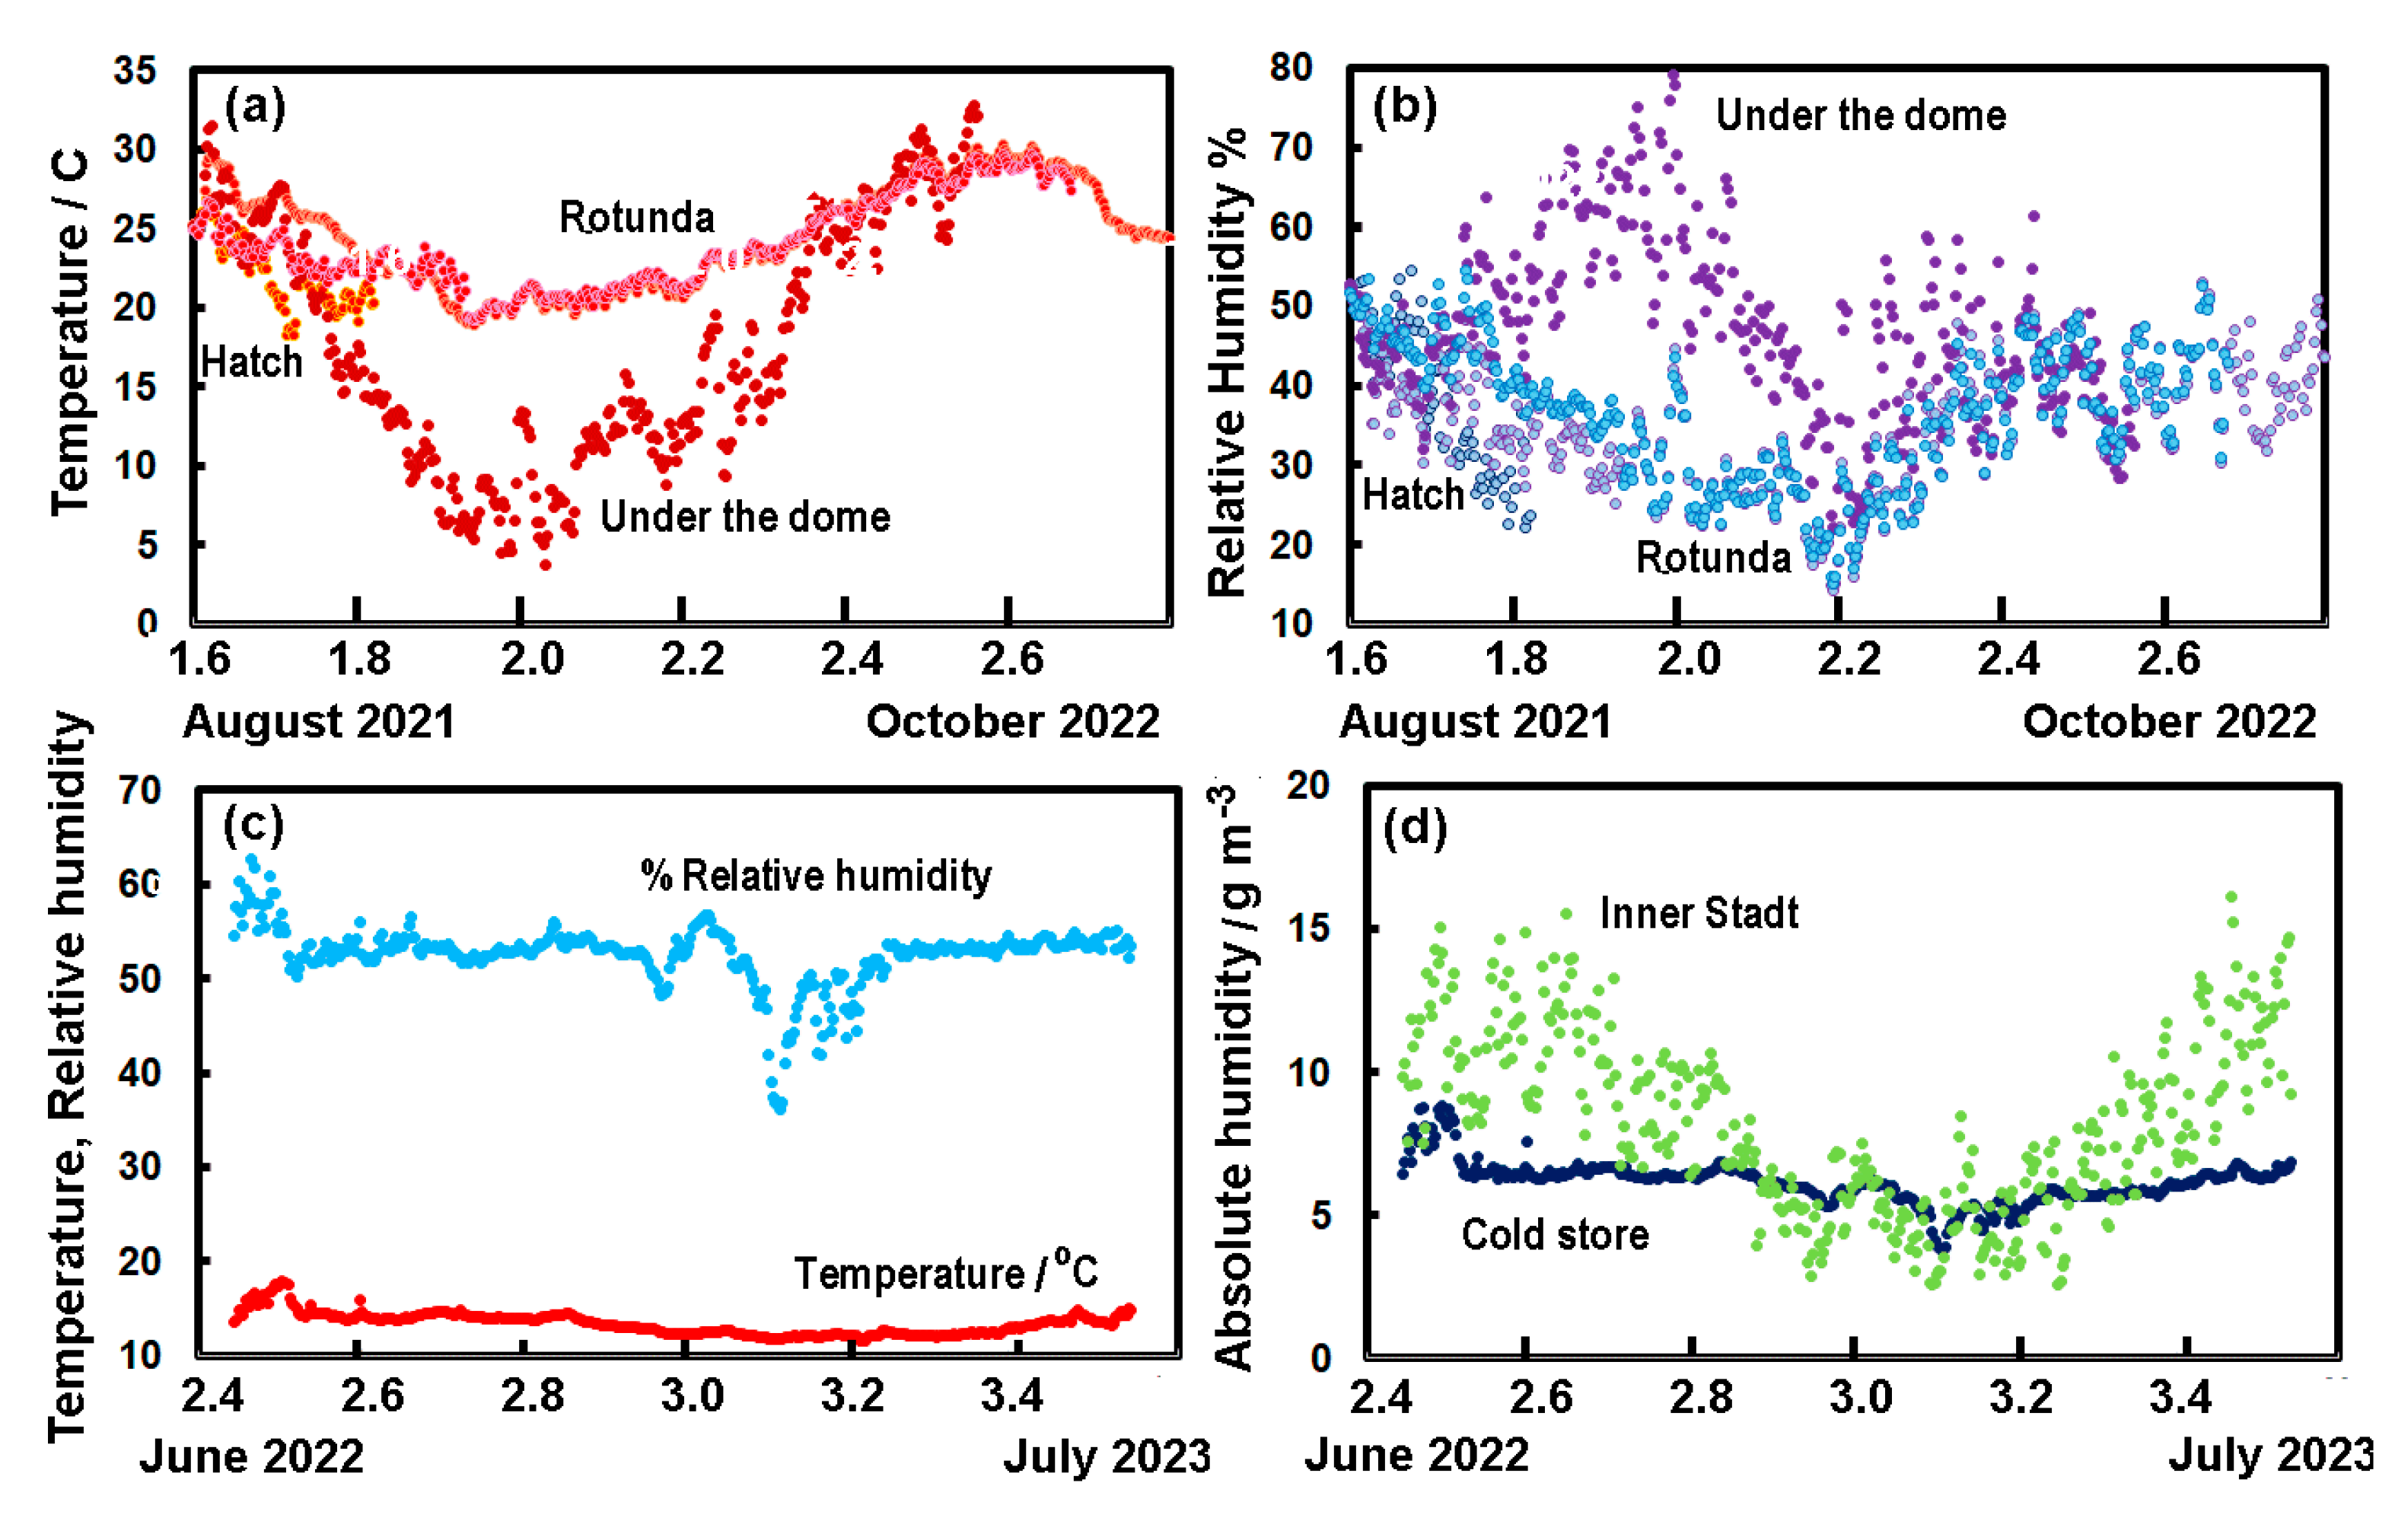
3.3. Microclimates in Specific Parts of the Building

The building shows some consistency between areas on a given floor (Figure 3). Nevertheless, there are rooms that were distinctive based on different approaches to climate control. Figure 6 shows the microclimate in various parts of the attic, housing the archive, parts of the botanical collection, the botanical library and the entomology collection. The daily average temperature and relative humidity (Figure 6a) for the two library rooms and the archive workshop suggest that in summer, the archive workshop could occasionally exceed 30 °C. Here, the average temperature for July and August 2022 was 28.1 ± 1.1 °C, and in the library, just a little cooler at 27.0 ± 0.8 °C (a significant difference, t-test p2 < 0.0001). Temperatures are high because there is no mechanical cooling in these rooms. Winter temperatures were maintained close to 20 °C, with an average for December and January of 20.1 ± 0.6 °C, and in the library, just a little warmer at 21.2 ± 0.5 °C. The relative humidity was 40–50% in the summer months and lower in winter at 25–40% (because of heating).
The storerooms for botanical and entomological collections have somewhat more moderate July–August temperatures at 26.1 ± 1.4 °C and cooler temperatures for the period December–January 19.5 ± 1.1 °C (Figure 6b) compared with the library as there is less heating via windows. Conditions were slightly more humid in the summer, with relative humidity in the low 60% range, although this is not elevated enough to be particularly damaging to most materials. The situation in the climate-controlled archive areas, where there were two sensors, showed more stable temperatures. At one position in the archive from September through the end of April, the temperature was 15.1 ± 0.2 °C, accounting for the almost flat lines in Figure 6c. Relative humidity was more variable, although it remained mostly above 40%, and stayed within the bounds 41.0–58.5% RH for 90% of the time across the entire record from both sensors.
Figure 7a shows the daily average temperature at various locations in the dome. The three sites with almost identical conditions are within the rotunda, the part of the building beneath the dome. The winter temperatures in the large room, just under the dome roof (see Figure 1), were low and distinct from the two in the rotunda in the occupied (heated) part of the building, which includes the rotunda and the entrance to the roof hatch. Summer temperatures were also high for a few days in the room just under the dome—a few degrees higher than elsewhere in the rotunda. Very low temperatures in winter caused the relative humidity to be very high. However, these extremes in both temperature and relative humidity in the dome room do not affect the collection, as items are neither displayed nor stored in this space. The dome is used in the summer months for natural ventilation with a few small windows open so there is constant airflow going up and out of the building. The dome is not well sealed and insulated, so its microclimate is strongly influenced by the outside weather. In winter, the dome windows are closed to prevent heat from escaping the building.
Conditions in the underground cold storage area are shown for both temperature and relative humidity in Figure 7c, although over a slightly different time period (mid 2022–mid 2023). The temperature remained close to the 10 °C set point at 13.25 ± 1.06 °C much of the time. Relative humidity was also stable over a week or several weeks, with excursions of around 10%. One of the problems with the cold store is that maintaining a low relative humidity requires large amounts of water to be removed from incoming air. Additional dehumidifiers run all summer, and about 100 L of water is manually removed every week from the area containing the mammal collection (461.37 m2; room height: 2.71 m). The absolute humidity (as g[H2O] m−3) in the cold store is shown in Figure 7d along with the absolute humidity, measured nearby at Innere Stadt, illustrating the large amount of water that needs to be removed from external air to keep the cold stores dry.

3.4. Floor-Level Microclimate

It seemed possible that the microclimate at the floor level might be different than that of the room at 2 m height. This could potentially be important where the floor acts as a habitat for a range of insect pests. Figure 8 shows that there was a close relationship between the temperature at the floor and that at ~2 m elevation on Floor F3. It suggests that the floor, as a potential microclimate for insects, does not appear to be very different from that of the air in the room in general. The best fit slope of temperature, when constrained to pass through an origin of zero, was close to unity (Figure 8a: slope = 0.9949, R2 = 0.9998). Relative humidity appeared a little more scattered, though the slope was close to unity (Figure 8b: slope = 0.9866, R2 = 0.9989). The apparent scatter was significantly reduced when plotted as absolute humidity (Figure 8c: 0.98, R2 = 0.9993), which may have been driven, in part, by the pattern of seasonal change, as shown in Figure 7d. Similar measurements at the floor level were also available from F2 and F4 and showed parallel results.

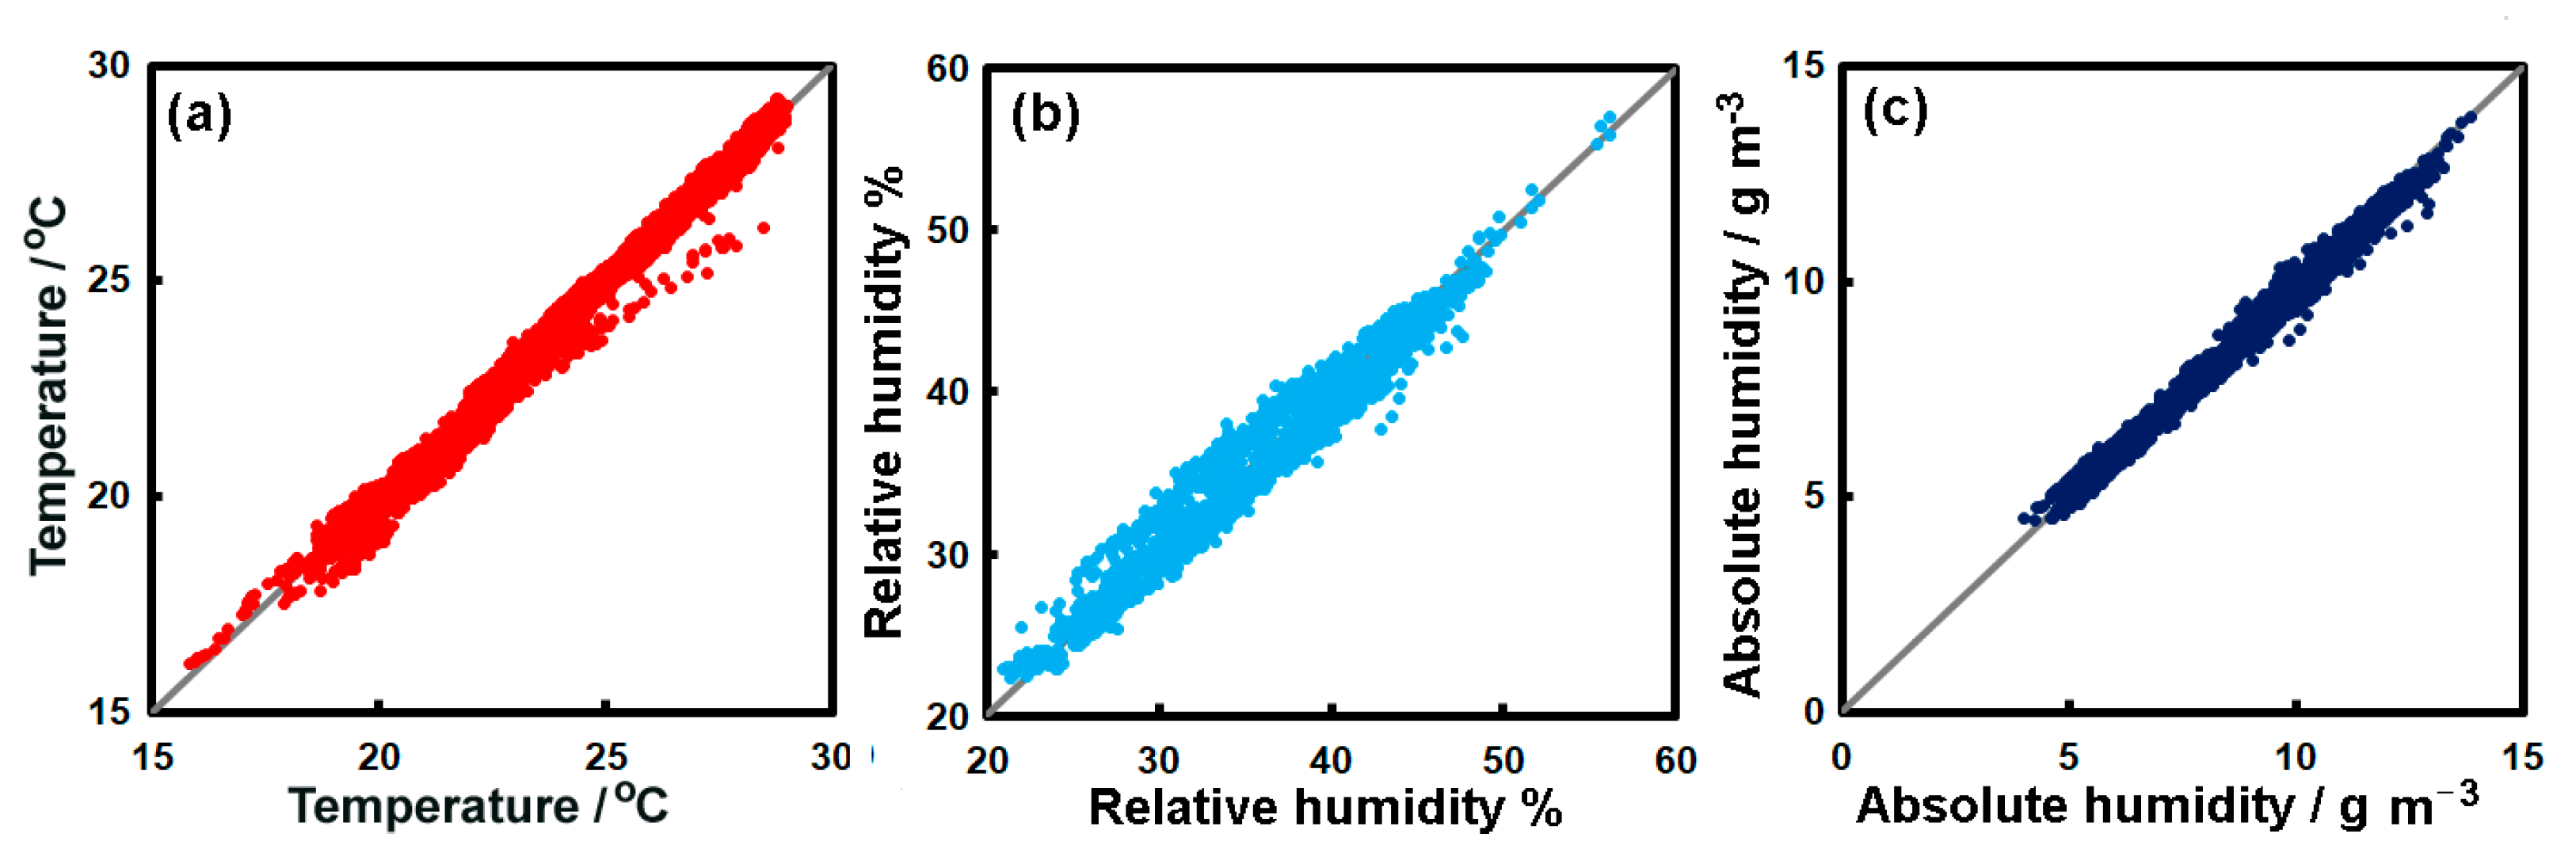
3.5. Long Term Change

We had access to a decade-long record from a program that began 20 years ago, which examined microclimate in the underground storage area for the mammal collection (Figure 9a) and the Hall of Primates, exhibiting prosimians, monkeys and apes (Figure 9b). These data enabled some assessment of the impact of long-term change on the building climate.

3.5.1. Long Term Change in the Cold Store

The temperature record (Figure 10a) shows that in the decade from ~2004 to 2014, the temperature, although remaining close to 10 °C, rose slowly at about two-tenths of a degree for each year (Theil-Sen slope 0.19 °C a−1; p< 0.0001), appearing as a thick red line from multiple daily values. The early part of the decade had an average temperature 11.2 ± 0.88 °C and can be compared with an average temperature measured in this project (2022–2023), which is slightly higher at 13.4 ± 1.20 °C (appears in Figure 10a as a thick red line to the right of the figure). The mammal collection is meant to be maintained at 10 °C [20,21,22,23], but in a warming world, the current climate control system appears to be struggling; in the early part of the decade, the maximum daily value reached 16.1 °C, while in the recent study period, it was 17.9 °C.
The monthly temperature at the Innere Stadt meteorological station is shown as the pink line in Figure 10a. It is just a kilometer from the Natural History Museum, so it is likely to be a good representation of external conditions there. Understandably, the mechanically controlled climate of the mammal store was far less variable than that outdoors, but indoors, we observed a summer peak, even though the winter low was absent in the interior of the storeroom. The trend in external temperature over time is shown as a thick pink dashed line, which has the seasonal cycle removed by LOESS decomposition. Sensor positions remained the same over time. It is possible that the trend may simply be the result of long-term ageing of the cooling equipment, although this might be limited as the equipment undergoes routine annual maintenance. The Theil–Sen slope for this change suggests an average rate of increase in outdoor temperature of 0.13 °C a−1, whereas the measured change in the storeroom was almost double this amount. Again, this may hint at the increasing difficulty the system has in maintaining 10 °C in warmer summers. In summer, technical failures of the HVAC system now occur regularly, which always results in a temporary increase and fluctuation in temperature.
Relative humidity in the storeroom appeared to be fairly stable over time, and the Theil–Sen slope was actually negative but statistically non-significant (−0.33% a−1; p~0.2). Although contemporary measurements of relative humidity 52.5 ± 3.4 were higher than in the past (i.e., 50.8 ± 1.2), the large variation makes any comparison difficult. However, the variation may also point to the difficulties in maintaining a stable relative humidity through the year with the current system under a contemporary climate.

3.5.2. Long Term Change in the Hall of Primates

Figure 10b shows the microclimate in the Hall of Primates, which is understandably warmer and more variable than that of the storage area. In the earlier records, the winter temperatures were largely comfortable at 20 °C, although on some individual days, the room became quite cold. The average temperature over the decade was 22.9 ± 3.5 °C, which can be compared with that in more recent years (2021–2022) of 25.0 ± 2. 8 °C, showing an increase of almost 2 °C, part of which is likely to be associated with a warming climate. The relative humidity was variable compared with the storage area, which had occasional very low values (<20%) that were especially persistent in the winter of 2021–2022.

3.6. Managing the Museum Climate

The work presented here shows that useful illustrations of the differences in climate within buildings can emerge from the analysis of the large amounts of data so often collected in museums. However, such large datasets may be inconvenient to examine within simple spreadsheet editors such as Microsoft Excel, so the use of a simple scripting language can make the data more readily processed. A range of online statistical tools have been used for models not available in Excel. Our past work [38] suggested in large, well-mixed rooms, there is only a small variation among the sensors, which can also be seen elsewhere [39]. Although data were collected at 15 min intervals, observations at this time resolution were rarely used. It might be reasonable to reduce the sampling rate to once an hour if smaller datasets are required by future work.
The study shows that the Natural History Museum sometimes has an extreme indoor climate: very hot in the summer and dry in the winter. This is a result of (i) a lack of cooling or humidity control in most of the larger rooms, (ii) past unregulated heating in winter (sometimes rooms become overheated, so windows are opened), (iii) large windows on all sides of the building that can admit sunlight, (iv) ventilation all year with windows open in most of the exhibition rooms and (v) many visitors throughout the year. The years 2022 and 2023 each had over 800,000 visitors, although in 2021, there were only 400,000 visitors because of a closure due to COVID-19 restrictions. As we have shown in the observations above, heat is trapped in the museum, with very large windows facing west and south, so even with ventilation through open windows the inside temperature is equal to or even higher than the outside temperature. This can make some of the exhibition spaces uncomfortably hot in summer. Overheating has become a concern for heritage buildings under a warming climate [40]. Nevertheless, the overall climate of the museum is not dissimilar to other major museums in Europe [41] and the nearby Kunsthistorisches Museum, which also shows small gradients [42] between the sunlit and shaded sides.
The attic had been expanded during renovation to contain offices, libraries and storerooms, but the roof is not well insulated (only 15 cm thick), so it can become very hot in the summer months. However, this cannot be changed with better insulation, and adding more rooms to the HVAC system is not possible for architectural reasons. A few rooms, such as the archive, are air-conditioned and have a cooler and stable climate, which is important for the sensitive objects housed there (paper, paintings). The original building had a passive cooling system, but it is not in use anymore. Due to building adaptations, modernization and fire prevention, the large openings to the outside of the building connecting to the basement and the vertical shafts (Luftbrunnen) that transported cooled air from the basement to all floors were permanently sealed after World War II. They can no longer be reverted to their original use, although some other historic buildings in Vienna (Hofburg Imperial Palace; see [43] for a detailed description), built at the same time, still use their passive cooling systems. The dome of the building allows some climate control options in the summer by removing hot air. In winter, temperatures in the space above the dome can drop to 5 °C.
A range of new ways to manage the heating and cooling of the building has been explored given a world with a changing climate [44]. Many materials adapt to a stable microclimate (climatic memory) of exhibited and remain well preserved, but rapid environmental changes can lead to deterioration, so it is important to avoid large variations in the interior spaces. However, there is little evidence of damage from environmental factors in the museum. In addition, energy efficiency has become increasingly important given environmental concerns along with increasing energy costs. In recent years, this has meant more stringent regulation of microclimates than in previous winters (heating in winter 2021–2022 was limited to 19 °C). Such control can involve the removal of large amounts of water from the incoming air in the storage areas in the summer. The museum is currently able to take advantage of Vienna district heating that supplies warm water to the building radiators. District cooling was also installed in 2024, and the museum is now making use of this to partially cool some areas. Some of the large windows are now shielded by outdoor shades, which is also projected to lower the room temperature by 2 °C. This has already been successfully installed in the main building of the Kunsthistorische Museum (a very similar building opposite the Natural History Museum) and in the rooms of the Sammlung Alter Musikinstrumente, Weltmuseum and Hofjagd und Rüstkammer, all also belonging to the Kunsthistorische Museum.

4. Conclusions

Heated exhibition rooms in the winter, where there is no humidity control, mean that the museum has low relative humidity. The absence of air conditioning means high internal temperatures in some parts of the building in the summer. The historic cooling and passive ventilation ducts of the past are not in use anymore, so the museum now needs to be adapted to the hotter weather likely to come as a result of climate change. This means the district cooling systems, the use of shades and care with open windows may become increasingly important. Milder winters could lessen the amount of heating required, so low humidity in future should not be so much in evidence. Our future work will undertake comparisons across Lower Austria where there are a range of different external climates, yet similar large historic buildings that house important collections. It will also be useful to explore the effectiveness of newer methods that aim to improve indoor climate.

Author Contributions

Conceptualization, P.B. and P.Q.; methodology, P.Q.; formal analysis, P.B.; investigation, P.Q., A.B. and H.P.; resources, P.Q. and C.F.; data curation, P.B.; writing—original draft preparation, P.B.; writing—review and editing, P.Q. and P.B.; visualization, P.B.; project administration, P.Q.; funding acquisition, P.Q. All authors have read and agreed to the published version of the manuscript.

Funding

This research was funded by the Austria Academy of Science; grant number: Heritage_2020-043_Modeling-Museum.

Data Availability Statement

Data are available as supplements created and last accessed on 28 November 2024 (https://zenodo.org/records/14233429 Natural History Museum Vienna Floors B, 0, 1; https://zenodo.org/records/14233508 Natural History Museum Vienna Floors 2, 3; https://zenodo.org/records/14233546 Natural History Museum Vienna Floor 4). Floor plans as: https://zenodo.org/records/14503914 Natural History Museum, Vienna with the sensor positions marked in green with code numbers listed in the data files.

Conflicts of Interest

The authors declare no conflicts of interest.

References

  1. Lucchi, E. Review of preventive conservation in museum buildings. J. Cult. Herit. 2018, 29, 180–193. [Google Scholar]
  2. Thomson, G. Museum Environment; Routledge: Abingdon, UK, 2018. [Google Scholar]
  3. Camuffo, D. Microclimate for Cultural Heritage: Measurement, Risk Assessment, Conservation, Restoration, and Maintenance of Indoor and Outdoor Monuments; Elsevier: Amsterdam, The Netherlands, 1998. [Google Scholar]
  4. Sharif-Askari, H.; Abu-Hijleh, B. Review of museums’ indoor environment conditions studies and guidelines and their impact on the museums’ artifacts and energy consumption. Build. Environ. 2018, 143, 186–195. [Google Scholar] [CrossRef]
  5. Elkadi, H.; Al-Maiyah, S.; Fielder, K.; Kenawy, I.; Martinson, D.B. The regulations and reality of indoor environmental standards for objects and visitors in museums. Renew. Sust. Energ. Rev. 2021, 152, 111653. [Google Scholar] [CrossRef]
  6. Ferdyn-Grygierek, J. Monitoring of indoor air parameters in large museum exhibition halls with and without air-conditioning systems. Build. Environ. 2016, 107, 113–126. [Google Scholar]
  7. Sciurpi, F.; Carletti, C.; Cellai, G.; Pierangioli, L. Environmental monitoring and microclimatic control strategies in “La Specola” museum of Florence. Energy Build. 2015, 95, 190–201. [Google Scholar]
  8. Corbellini, S.; Di Francia, E.; Grassini, S.; Iannucci, L.; Lombardo, L.; Parvis, M. Cloud based sensor network for environmental monitoring. Measurement 2018, 118, 354–361. [Google Scholar] [CrossRef]
  9. Brimblecombe, P. The composition of museum air. Atmos. Environ. 1990, 24B, 1–8. [Google Scholar]
  10. Leissner, J.; Kilian, R.; Kotova, L.; Jacob, D.; Mikolajewicz, U.; Broström, T.; Ashley-Smith, J.; Schellen, H.L.; Martens, M.; van Sabbioni, C.; et al. Global Climate Change Impact on Built Heritage and Cultural Landscapes. In Proceedings of the International Conference on Heritage, Weathering and Conservation, HWC, Madrid, Spain, 21–24 June 2006; pp. 395–401. [Google Scholar]
  11. Brimblecombe, P.; Richards, J. Applied climatology for heritage. Theor. Appl. Climatol. 2024, 155, 7325–7333. [Google Scholar]
  12. Ankersmit, B.; Stappers, M.H. Managing Indoor Climate Risks in Museums; Springer International Publishing: Cham, Switzerland, 2017. [Google Scholar]
  13. Lankester, P.; Brimblecombe, P. Future thermohygrometric climate within historic houses. J. Cult. Herit. 2012, 13, 1–6. [Google Scholar]
  14. Salah Bakry, M.; Hamdy, M.; Mohamed, A.; Elsayed, K. Energy saving potential in open museum spaces: A comparative hygrothermal microclimates analysis. Build. Environ. 2022, 225, 10963. [Google Scholar]
  15. ElAdl, M.; Fathy, F.; Morsi, N.K.; Nessim, A.; Refat, M.; Sabry, H. Managing microclimate challenges for museum buildings in Egypt. Ain Shams Eng. J. 2022, 13, 101529. [Google Scholar]
  16. Litti, G.; Audenaert, A. An integrated approach for indoor microclimate diagnosis of heritage and museum buildings: The main exhibition hall of Vleeshuis museum in Antwerp. Energy Build. 2018, 162, 91–108. [Google Scholar]
  17. Litti, G.; Audenaert, A.; Fabbri, K. Indoor Microclimate Quality (IMQ) certification in heritage and museum buildings: The case study of Vleeshuis museum in Antwerp. Build. Environ. 2017, 124, 478–491. [Google Scholar]
  18. Schito, E.; Testi, D. Integrated maps of risk assessment and minimization of multiple risks for artworks in museum environments based on microclimate control. Build. Environ. 2017, 123, 585–600. [Google Scholar]
  19. Ferdyn-Grygierek, J.; Grygierek, K. HVAC control methods for drastically improved hygrothermal museum microclimates in warm season. Build. Environ. 2019, 149, 90–99. [Google Scholar]
  20. Waller, R. Conservation risk assessment: A strategy for managing resources for preventive conservation. Stud. Conserv. 1994, 39 (Suppl. 2), 12–16. [Google Scholar]
  21. Waller, R. Risk management applied to preventive conservation. In Storage of Natural History Collections: A Preventive Conservation Approach; Society for the Preservation of Natural History Collections: Washington, DC, USA, 1995; pp. 21–28. [Google Scholar]
  22. Waller, R. Fundamental requirements for historic house preservation risk management. In Preventive Conservation in Historic Houses and Palace Museums: Assessment Methodologies and Applications; Silvana Editoriale S.p.A.: Cinisello Balsamo (Milan), Italy, 2019. [Google Scholar]
  23. Muething, G.; Waller, R.; Graham, F. Risk Assessment of Collections in Exhibitions at the Canadian Museum of Nature. J. Amer. Ins. Cons. 2005, 44, 233–243. [Google Scholar]
  24. Brimblecombe, P.; Lankester, P. Long-term changes in climate and insect damage in historic houses. Stud. Conserv. 2013, 58, 13–22. [Google Scholar]
  25. Hansen, L.S.; Åkerlund, M.; Grøntoft, T.; Ryhl-Svendsen, M.; Schmidt, A.L.; Bergh, J.-E.; Jensen, K.-M.V. Future pest status of an insect pest in museums, Attagenus smirnovi: Distribution and food consumption in relation to climate change. J. Cult. Herit. 2012, 13, 22–27. [Google Scholar]
  26. Querner, P.; Sterflinger, K.; Derksen, K.; Leissner, J.; Landsberger, B.; Hammer, A.; Brimblecombe, P. Climate change and its effects on indoor pests (insect and Fungi) in museums. Climate 2022, 10, 103. [Google Scholar] [CrossRef]
  27. Brimblecombe, P.; Grossi, C.M.; Harris, I. Climate change critical to cultural heritage. In Survival and Sustainability: Environmental Concerns in the 21st Century; Springer: Berlin/Heidelberg, Germany, 2011; pp. 195–205. [Google Scholar]
  28. Querner, P. Modelling Museum Pests–Insects and Fungi–and Climate Change. Available online: https://nhm-wien.ac.at/en/research/interdepartmental_projects/modelling_museum_pests_ (accessed on 8 March 2025).
  29. Koeberl, C.; Brandstätter, F.; Harzhauser, M.; Riedl-Dorn, C. History and importance of the geoscience collections at the Natural History Museum Vienna. In Museums at the Forefront of the History and Philosophy of Geology: History Made, History in the Making; Rosenberg, G.D., Clary, R.M., Eds.; The Geological Society of America: Boulder, CO, USA, 2018. [Google Scholar] [CrossRef]
  30. Jovanovic-Kruspel, S.; Schumacher, A. Das Naturhistorische Museum—Baugeschichte, Konzeption & Architektur; Naturhistorisches Museum: Vienna, Austria, 2014. [Google Scholar]
  31. Clemenzi, R. Water Vapor—Other Formulas. Available online: http://mc-computing.com/Science_Facts/Water_Vapor/Other_Formulas.html (accessed on 18 February 2025).
  32. Zentralanstalt für Meteorologie und Geodynamik. Available online: https://www.zamg.ac.at/cms/de/aktuell (accessed on 8 March 2025).
  33. Vassarstats. Available online: https://www.vassarstats.net/ (accessed on 8 March 2025).
  34. Theil-Sen Slopes Applied as an Outlier-Resistant Alternative to the Linear Regression Slope from Single Case Research. Available online: https://singlecaseresearch.org/calculators/theil-sen (accessed on 8 March 2025).
  35. Wessa, P. Decomposition by Loess (v1.0.3) in Free Statistics Software (v1.2.1), Office for Research Development and Education. 2021. Available online: http://www.wessa.net/rwasp_decomposeloess.wasp/ (accessed on 8 March 2025).
  36. Fallahnejad, M.; Hartner, M.; Kranzl, L.; Fritz, S. Impact of distribution and transmission investment costs of district heating systems on district heating potential. Energy Procedia 2018, 149, 141–150. [Google Scholar]
  37. Büchele, R.; Kranzl, L.; Müller, A.; Hummel, M.; Hartner, M.; Deng, Y.; Bons, M. Comprehensive assessment of the potential for efficient district heating and cooling and for high-efficient cogeneration in Austria. Int. J. Sustain. Energy Plann. Manag. 2016, 10, 3–20. [Google Scholar]
  38. Brimblecombe, P.; Sterflinger, K.; Derksen, K.; Haltrich, M.; Querner, P. Thermohygrometric climate, insects and fungi in the Klosterneuburg Monastic Library. Heritage 2022, 5, 4228–4244. [Google Scholar] [CrossRef]
  39. Bernardi, A. Microclimate in the British museum, London. Mus. Manag. Curatorship 1990, 9, 169–182. [Google Scholar]
  40. Kumar, P.; Wright, B.; Petsou, A. Overheating in Historic Buildings in the UK: An Exploratory Study of Overheating Risks, Building Performance, and Thermal Comfort. Heritage 2024, 7, 4829–4854. [Google Scholar] [CrossRef]
  41. Sturaro, G.; Camuffo, D.; Brimblecombe, P.; Van Grieken, R.; Busse, H.J.; Bernardi, A.; Valentino, A.; Blades, N.; Gysels, K.; Deutsch, F.; et al. Multidisciplinary environmental monitoring at the Kunsthistorisches Museum, Vienna. J. Trace Microprobe Tech. 2003, 21, 273–294. [Google Scholar] [CrossRef]
  42. Camuffo, D.; Van Grieken, R.; Busse, H.J.; Sturaro, G.; Valentino, A.; Bernardi, A.; Blades, N.; Shooter, D.; Gysels, K.; Deutsch, F.; et al. Environmental monitoring in four European museums. Atmos. Environ. 2001, 35, 127–140. [Google Scholar] [CrossRef]
  43. Huber, A. Ökosystem Museum. Grundlagen zu Einem Konservatorischen Betriebskonzept für die Neue Burg in Wien. Ph.D. Thesis, Academy of Fine Arts, Vienna, Austria, 2011. (In German). [Google Scholar]
  44. Frasca, F.; Siani, A.M.; Bertolin, C. Energy demand for indoor climate control in museums: Challenges and perspectives in time of a changing climate. Procedia Struct. Integr. 2024, 55, 32–38. [Google Scholar]
Figure 1. Aerial view of the Natural History Museum in Vienna, Austria. NHM Wien © GeoPic.
Heritage 08 00124 g001
Figure 2. (a) Daily average temperature of the floors of the museum and (b) relative humidity of the floors over the period July 2021–September 2022. (c) Daily average temperature and relative humidity at Innere Stadt. Note: FB: basement; F0: ground floor; F1–F3 upper floors; F4: attic.
Heritage 08 00124 g002
Figure 3. (a) Daily temperature from July 2021 to September 2022 on the sunny and shaded aspects of the building using data from the exhibition rooms of F1. (b) Correlation between the daily temperature on the sunny aspect and that of the shaded aspect. (c) Daily relative humidity from July 2021 to September 2022 on the sunny and shaded aspects of the building. (d) Correlation between the daily relative humidity on the sunny aspect and that of the shaded aspect. (e) Temperature in offices and storage depots on F3. (f) Correlation between the daily temperature in offices and depots (g) Daily relative humidity in offices and depots. (h) Correlation between the daily relative humidity in offices and depots. (i) Temperature in hallways and offices in the basement. (j) Correlation between the daily temperature in hallways and offices. (k) Daily relative humidity in hallways and offices. (l) Correlation between the daily relative humidity in hallways and offices. Note: see text for slopes and correlation coefficients for (b,d,f,h,j,l).
Heritage 08 00124 g003
Figure 4. Microclimate of the Zoological Library. (a) Daily temperature as a function of relative humidity, with the coloured dots representing the four seasons. (b) Daily temperature and relative humidity from 20 July 2021 to 10 October 2022. Note. Red temperature and blue relative humidity values. Inset shows a Fourier analysis of 15 min temperature values (red) revealing peaks in spectral power at a given number of cycles in the 463-day record, indicating clear weekly and daily frequencies. Time expressed as a decimal fraction of the year from 2020. (c) Two weeks of 15 min temperature and relative humidity from 1 August 2022 to 14 August 2022; grey lines denote midnight. Note. Red temperature and blue relative humidity values. (d) Six weeks of daily temperature and relative humidity from Monday 27 December 2021 to Sunday 6 February 2022; grey lines denote the beginning of Monday of each week. Note. Red temperature and blue relative humidity values. Note: time expressed as a decimal fraction of the year from 2020.
Heritage 08 00124 g004
Figure 5. Hourly average microclimate in the exhibition halls of F1. (a) Daily temperature cycle in the warm season and cold season. (b) Daily relative humidity cycle in the warm season and cold season. (c) Daily temperature cycle on Tuesdays and other days of the week throughout the year. (d) Daily relative humidity cycle on Tuesdays (museum is closed) and other days of the week.
Heritage 08 00124 g005
Figure 6. Daily temperature and relative humidity in (a) the library and archive, (b) collection storerooms and (c) the climate-controlled archive. Note. Year as a decimal from 2020. Note: the temperatures are often so similar that points overlap.
Heritage 08 00124 g006
Figure 7. (a) Daily temperatures in the dome. (b) Daily relative humidity in the dome. (c) Daily temperature and relative humidity in the cold store (d) Daily absolute humidity in the cold store compared with the external absolute humidity at Innere Stadt. Note: year as a decimal from 2020.
Heritage 08 00124 g007
Figure 8. (a) Daily temperature at floor level as a function of that at 2 m on Floor 3. (b) Daily relative humidity at floor level as a function of that at 2 m. (c) Daily absolute humidity at floor level as a function of that at 2 m. Note the grey diagonal lines mark the line of equivalence. Note: see text for slopes and correlation coefficients.
Heritage 08 00124 g008
Figure 9. Mammal collection in the (a) underground storage area and (b) in the Hall of Primates (Photographs: Naturhistorisches Museum Wien © 2024).
Heritage 08 00124 g009
Figure 10. (a) Microclimate 2004–2024 in the underground mammal storage. (a) Temperature, thick line made of red dots), relative humidity (blue dots—note the break in the scale at 20), monthly temperatures at Innere Stadt (pink line) and LOESS temperature trend line (thick pink dashed line). (b) Microclimate 2004–2024 in the Hall of Primates, with temperature as a thick line made of red dots), relative humidity (blue dots) and monthly temperatures at Innere Stadt (pink line).
Heritage 08 00124 g010
Table 1. Description of the six levels, including a cooled storage area, sampled across the Natural History Museum in Vienna, Austria. Note: collections investigated are denoted by italic script.
Floor
No
DescriptionFloor
Code
Collection Type
and Room Use
Climate ControlData LoggersData Loggers in Contact with FloorPublic AccessOpen Windows
Natural Ventilation
F4Attic,
modern
OG3archive, library, botany,
entomology, offices
HVAC374nono
F3historicOG2mammal, library, entomology,
anthropology, botany
only heating425nopartly
F2historicOG1exhibition, bird, libraryonly heating445yesyes
F1Mezzanine
historic
HPexhibition, officesonly heating365yesyes
F0Ground floor,
historic
TP+EGlibrary, taxidermy
studio, offices
only heating400nono
FBBasement, historicKtechnical rooms, storageno control320nono
FCCooled storage,
modern
storageHVAC50nono
Table 2. Average temperature and relative humidity, along with their standard deviation, from the various floors for a year from 6 August 2021 to 5 August 2022. FB: basement; F0: ground floor; F1–F3 upper floors; F4: attic.
FloorTemperature
°C
Relative Humidity %
F422.2 ± 2.438.1 ± 6.8
F324.5 ± 2.337.9 ± 6.1
F223.4 ± 2.834.5 ± 7.4
F124.8 ± 2.934.1 ± 7.9
F022.7 ± 1.538.0 ± 9.4
FB21.3 ± 1.843.9 ± 11.8
Disclaimer/Publisher’s Note: The statements, opinions and data contained in all publications are solely those of the individual author(s) and contributor(s) and not of MDPI and/or the editor(s). MDPI and/or the editor(s) disclaim responsibility for any injury to people or property resulting from any ideas, methods, instructions or products referred to in the content.

