1. Introduction
Historical objects and structures are a part of every country’s cultural heritage that needs to be preserved. Threats to their safety include natural disasters, pollution, wars, etc. Earthquakes have always been a major threat, and several monumental structures and objects have suffered from past seismic activity. Studying the dynamic behavior of our cultural heritage can provide a strong foundation for improving its seismic safety.
This paper focuses on the dynamic behavior of small monumental objects. Most of these objects are considered rigid since their natural frequencies are much higher than the frequency content of an earthquake. Unlike regularly designed structures, which remain elastic under small loads and undergo large deformations beyond the elastic limit at higher loads without failing, cultural heritage structures behave differently.
Past research has primarily focused on developing theories regarding the dynamic behavior of rigid blocks with simple geometry, limiting motion to a single plane parallel to the direction of excitation [
1,
2,
3,
4,
5,
6,
7,
8,
9,
10]. A few studies have included more complex geometry examining the behavior of statues and museum artifacts, mostly numerically or analytically [
11,
12,
13,
14,
15]. Several studies have examined the seismic vulnerability of artifacts and monumental objects in museums, proposing ways to improve their seismic safety [
16,
17,
18,
19,
20,
21,
22,
23,
24,
25]. While these studies have provided valuable insights, our ability to predict the actual dynamic performance of artifacts remains limited, as they can slide, rock, and rotate around their axis, moving in directions beyond the direction of excitation. It is difficult for a numerical model to accurately predict an out-of-plane object’s behavior. Experimental investigation can provide more accurate results about their seismic performance if their base of support is rigid and directly excited by ground motion. However, objects can be free-standing or mounted on showcases or shelves supported on a wall of a museum. Their support system is not necessarily located on the ground floor of the museum, which incorporates the museum’s dynamic response to the seismic behavior of the objects. In addition, there is a wide variety of artifacts with different geometries, which, most of the time, cannot be simplified to a rectangular shape without losing significant accuracy.
It is obvious that there are many issues to address in order to thoroughly understand the dynamic behavior of objects, as a first step toward finding ways to protect them. Some studies have addressed some of the above issues, with a few utilizing simplified models [
26]. However, more information is needed to accurately assess the safety margin for monumental objects in museums during earthquakes. In addition, the experimental research about this subject is limited [
27]. This article provides a deeper understanding of the dynamic response of these objects by conducting experiments with two figurine models of different sizes, replicas of ancient ones, supported on a rigid base. Initially, the figurines were subjected to harmonic signals, varying the frequency and the level of excitation to determine the threshold at which overturning occurs. Next, the figurines were subjected to earthquake signals to further analyze their dynamic behavior. The effect of the coefficient of friction between them and their base of support on their dynamic behavior was also examined.
2. Basic Theory of the Dynamic Response of Rigid Objects
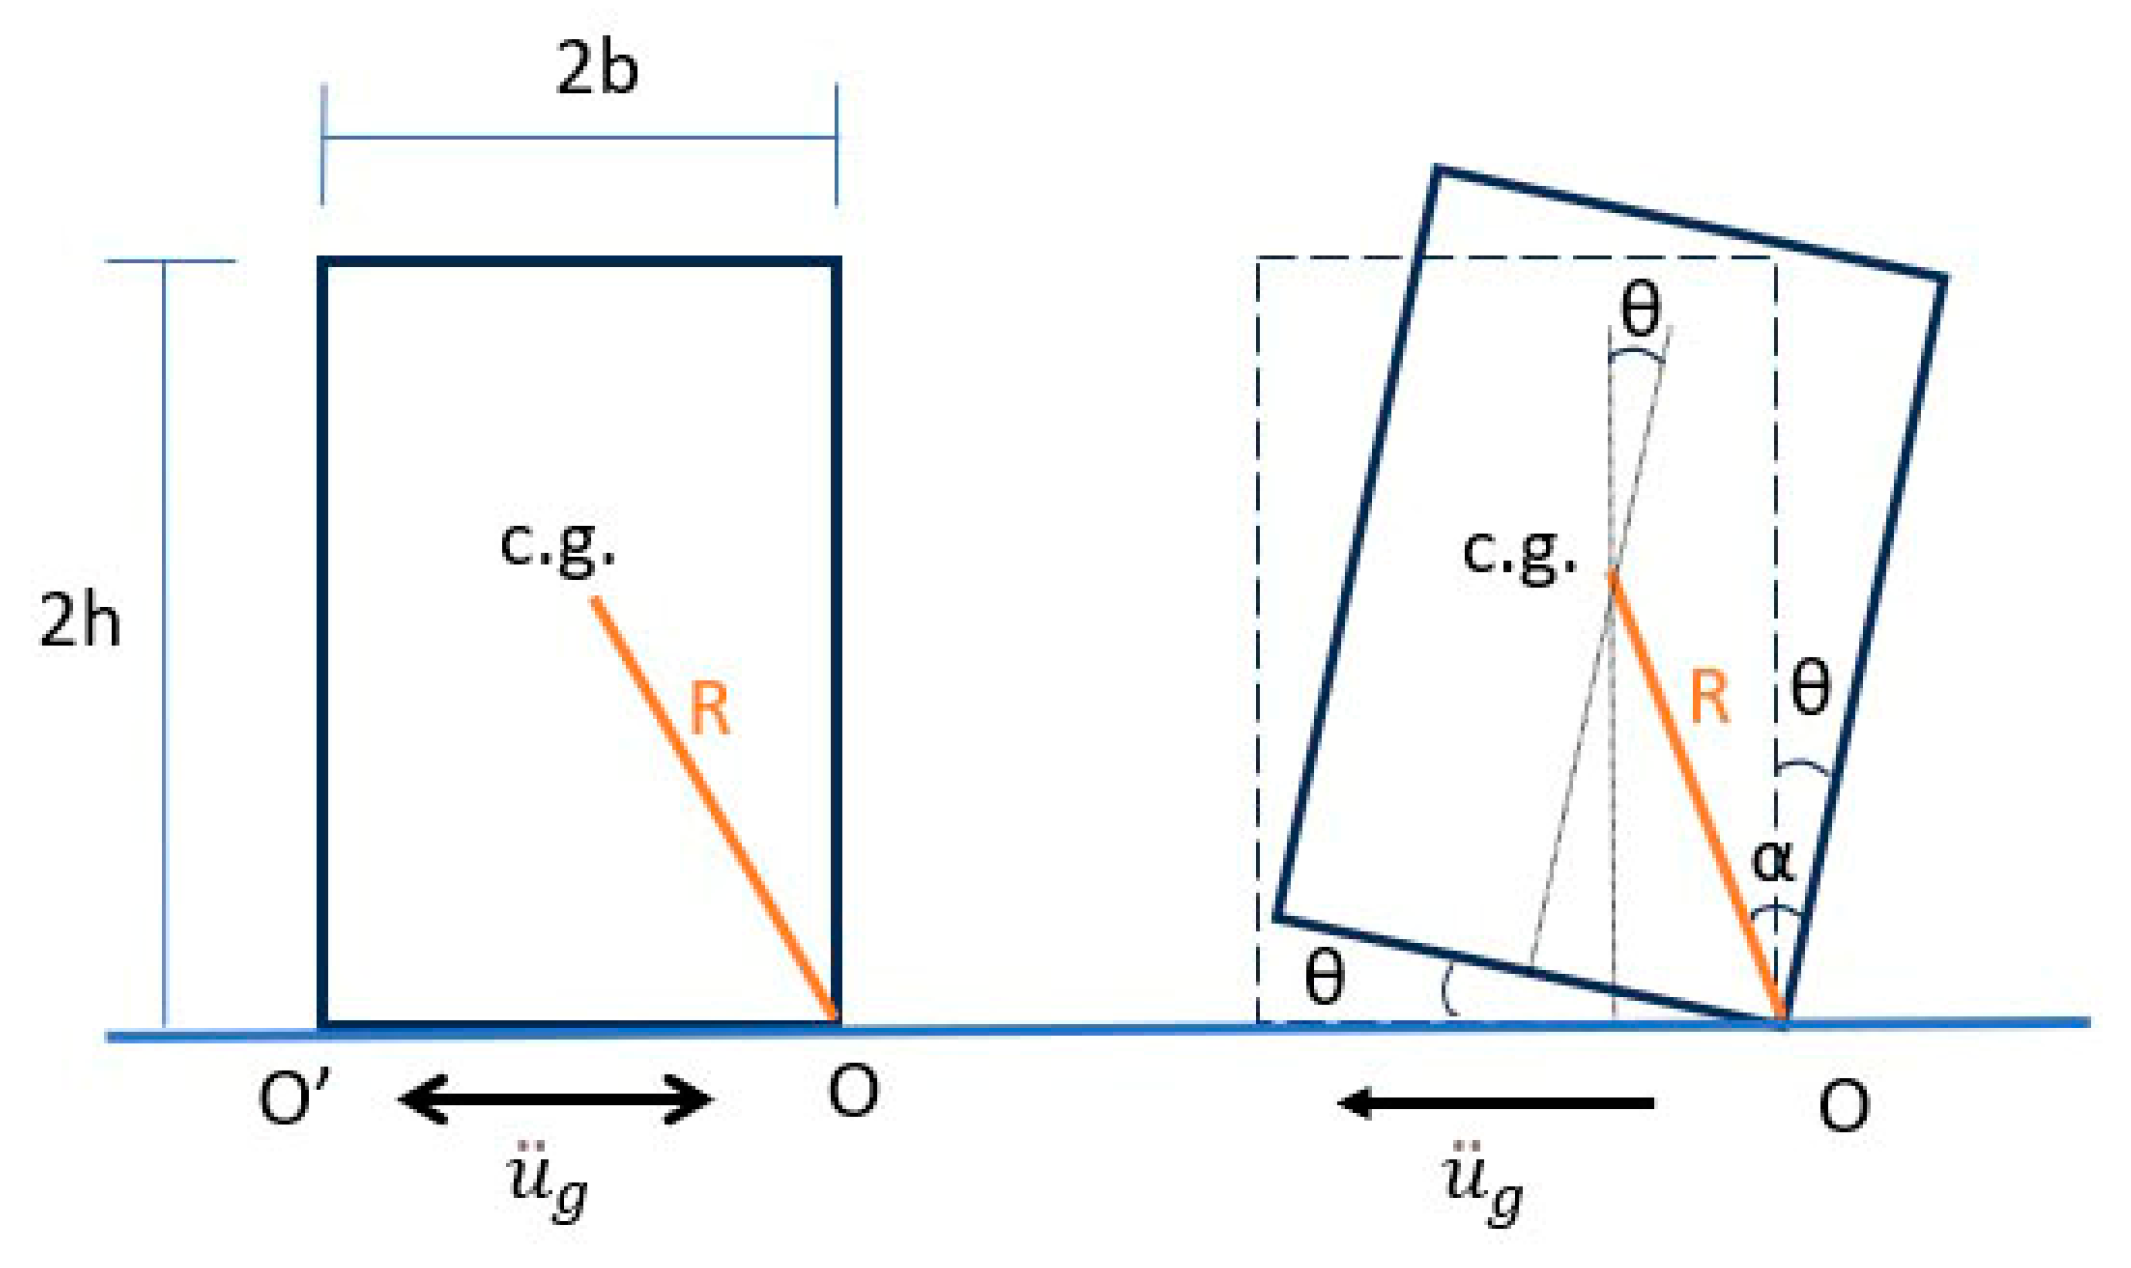
A uniform rigid object supported on a rigid base and subjected to base excitation will move in a plane parallel to the direction of excitation if the contact surfaces are smooth and free of imperfections. Its motion will include rocking and sliding depending on the coefficient of friction between the surfaces. Rocking occurs when the overturning moment about the object’s edges, caused by the inertia force, exceeds the restoring moment due to its weight [
28].
Figure 1 presents a rectangular object rocking around its edges due to a horizontal base excitation.
The equation of motion for rocking about O or O’ is as follows:
where
is the mass moment of inertia of the object about O,
m and
W are the mass and weight of the object respectively,
θ(
t) is the angle of rotation,
R is the distance from the center of gravity to the center of rotation,
g is the acceleration of gravity, α is the angle between
R and the vertical edge of the object,
is the base acceleration,
b is the horizontal distance of the center of gravity to the vertical edge of the object, and
h is the height of the center of gravity to the support surface. In addition,
sgnθ(
t) is the signum function with respect to
θ(
t), where
θ(
t) > 0 when the object rotates about O and
θ(
t) < 0 when it rotates about O′.
For a uniform rectangular object with its center of gravity in the mid-width and mid-height of the object, the conditions for rocking or sliding [
29] are given by the expressions (2) and (3).
- (a)
For rocking,
- (b)
For sliding,
where
μ is the coefficient of friction.
The base velocity required for a uniform rectangular object to overturn is given by the following expression:
where
b and
h are in cm and
v is in cm/sec.
For irregular objects, the ground acceleration needed to cause rocking is given by the following expressions [
11]:
where
b1 and
b2 are the horizontal distances of the object’s center of gravity, projected onto the base, to the two sides of the base parallel to the direction of excitation.
3. Experimental Set-Up and Procedure
The experimental set-up consisted of a shake table, an amplifier, three laser transducers, one accelerometer, one draw-wire sensor, a data acquisition system, one computer, and two figurines. The draw-wire sensor (Waycon, 225 mm) and the accelerometer (Kistler, 2 g) measured the motion of the base of support. The three laser transducers (Waycon, Brühl, Germany, LAS-T-500-A, 100–600 mm) measured the displacement of the figurines. Two of them measured the displacement of the top and bottom parts of the figurine parallel to the direction of excitation, and one measured the displacement of the figurine perpendicular to the direction of excitation. The data acquisition system and the computer were used to gather and analyze the data.
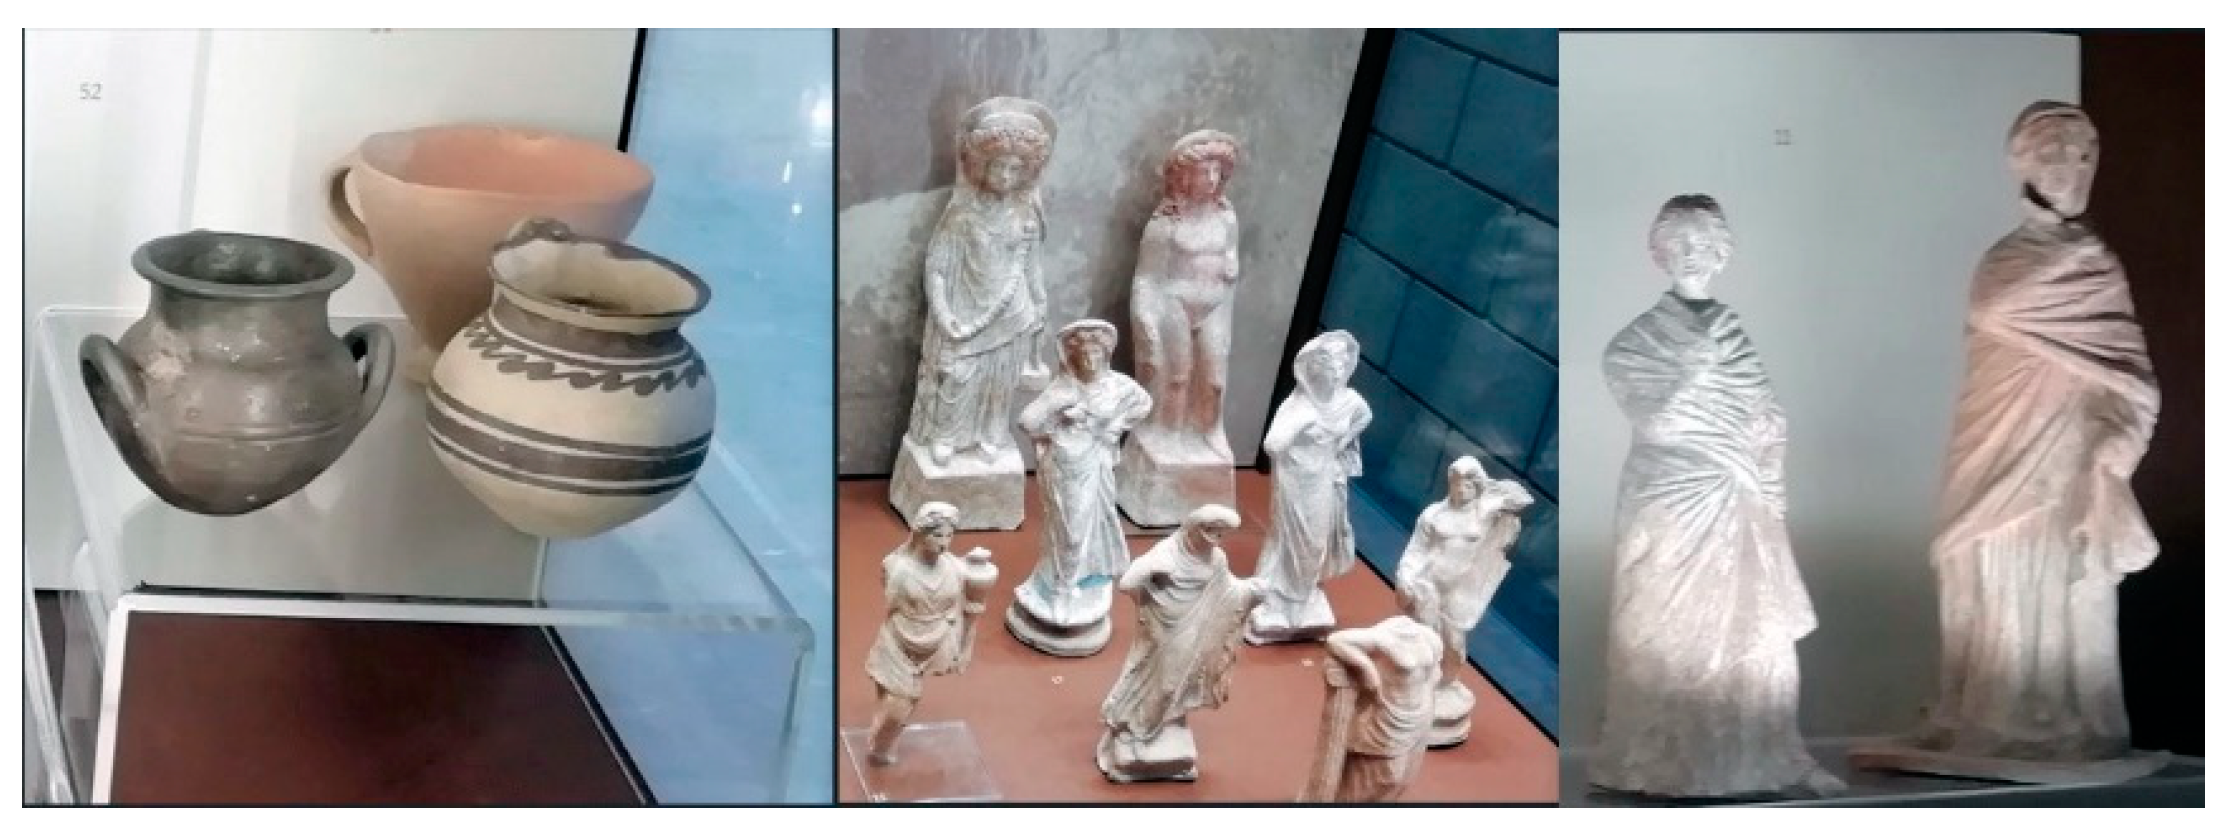
In museums, different types of support bases can be found for various monumental objects (
Figure 2). In the experimental investigation, three different bases of support were used: a steel plate, a steel plate covered with felt, and an acrylic block of a small size.
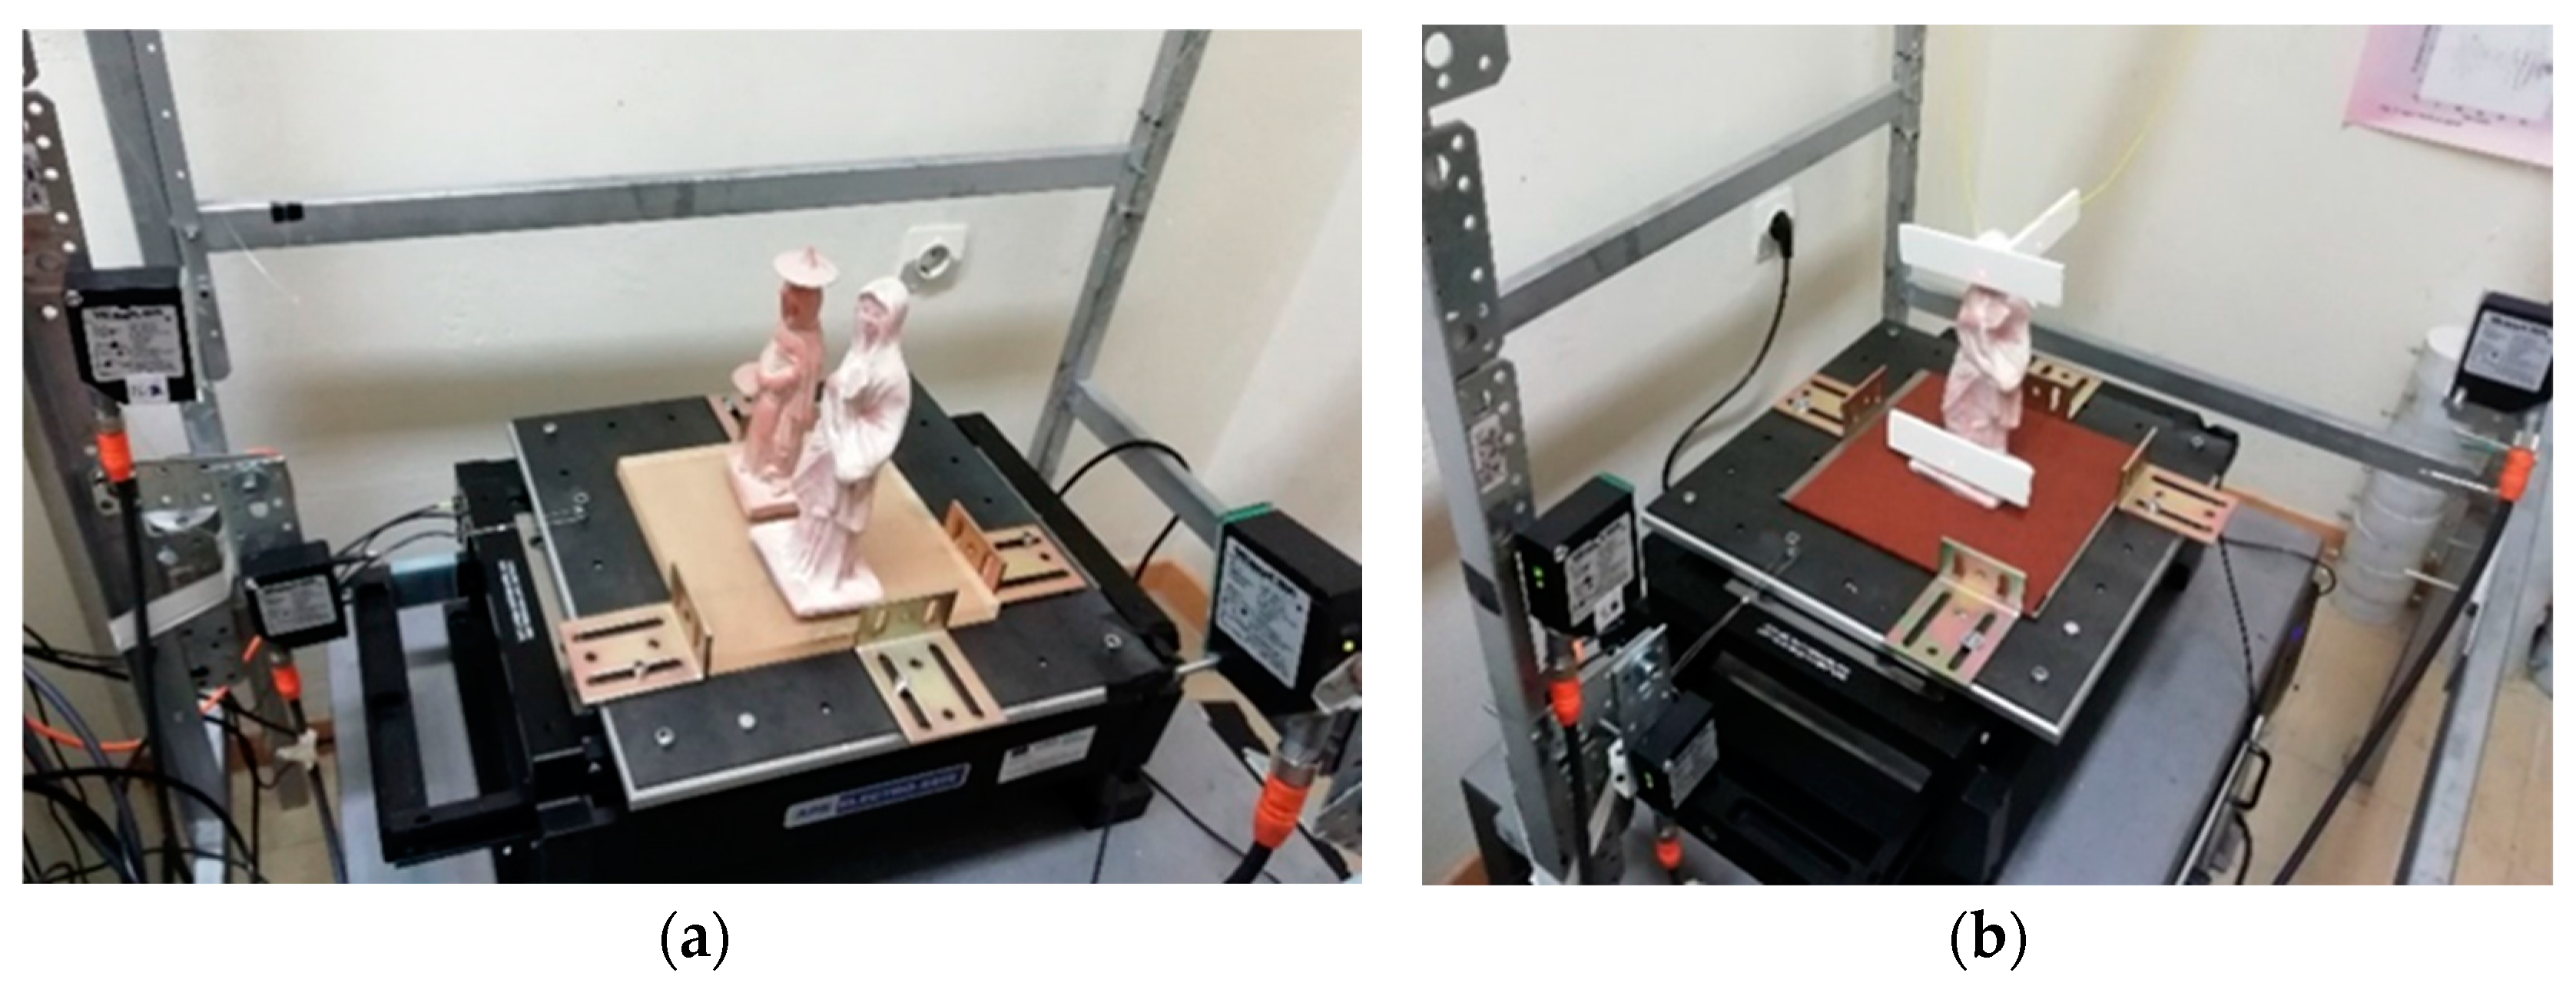
Two ceramic figurines were used for the experiments (
Figure 3a). Both were replicas of ancient Tanagra figurines. The original ones were made in the 3rd century BC. The first figurine (F1) had a rough texture, with a height of 21 cm, a base area of 55 cm
2, a center of gravity located 7.6 cm vertically from its base, and a mass of 441 g. Its body part contained a cavity that could be observed from its base. The second figurine (F2) was more polished, with a height of 20 cm, a base area of 30 cm
2, a center of gravity located 7 cm vertically from its base, and a mass of 319 g. No cavities could be observed. Since their geometry was irregular, to obtain more information about their motion, light pieces of cardboard were attached on their top and bottom parts in the direction of excitation, and one on the top perpendicular to the direction of excitation (
Figure 3b). When significant rotation of the object occurred, the accuracy of the results decreased, but valuable information about the object’s movement could still be obtained.
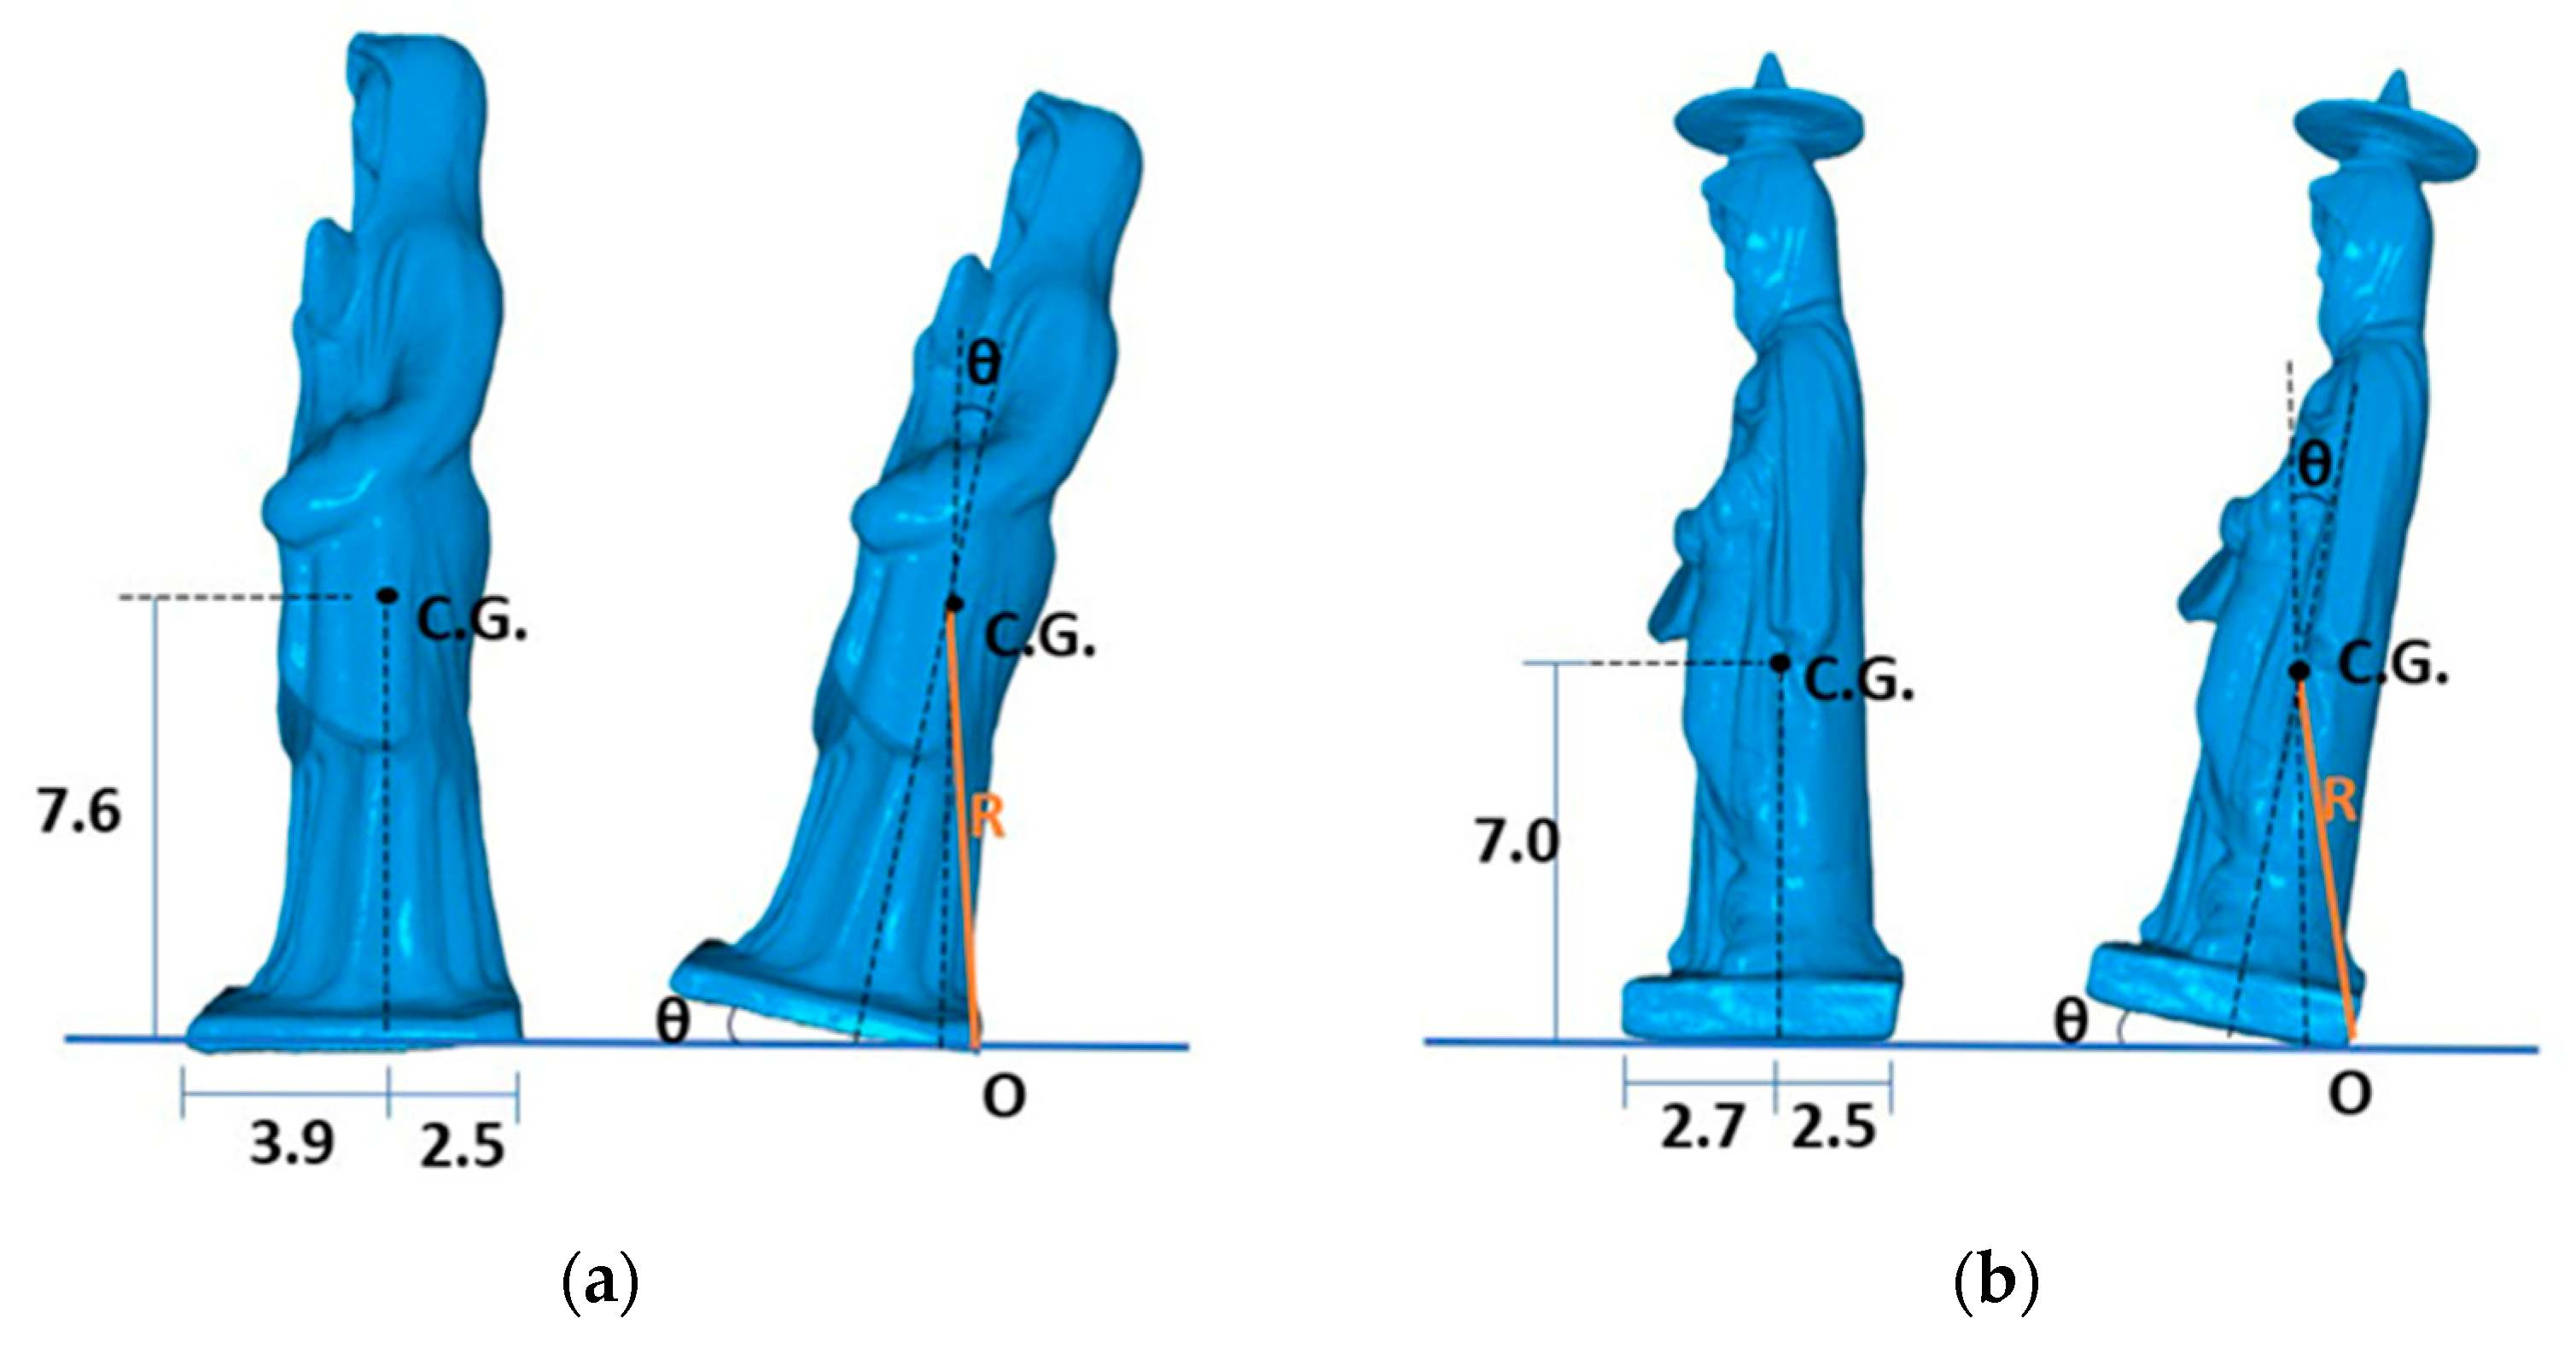
Figure 4 presents a 3-D scan of the two figurines showing their geometric irregularities. The center of gravity is not located at mid-height and mid-width, as in the case of the rectangular uniform object in
Figure 1. The smaller values of the important parameter
b/h are 0.33 and 0.36 for figurines F1 and F2, respectively.
The coefficients of friction between the figurines and their bases of support were measured by gradually inclining the base of support and recording the angle at which sliding began. The coefficients of friction between the faces of contact were approximately 0.34 for the steel base, 0.32 for the acrylic block, and higher than 0.4 for the steel base with a layer of felt attached. The base of support was securely fastened on top of the shaker with the help of four steel angles. The figurines were placed one at a time on their base of support. To avoid damaging them, they were loosely tied with strings with a safety frame that was placed around the experimental set-up.
The excitation consisted of harmonic and earthquake signals. The harmonic ones were sinusoidal, with frequencies ranging from 1 to 5 Hz. The earthquake signals had a frequency range from 0 to 8 Hz, covering most of the frequencies that are typically present in seismic excitations. The level of excitation did not remain constant but increased until the figurine overturned. Several sets of experiments were conducted, varying either the base of support, the figurines, or the excitation signal.
3.1. Harmonic Excitation
3.1.1. Figurine F1
Initially, figurine F1 was set on the steel base, with its weaker side (side view) parallel to the direction of excitation. It was excited by sinusoidal signals in the frequency range of 1–5 Hz, which corresponds to a large portion of the frequency range that can be found in most earthquake signals. Each signal had a duration of 10 s. The amplitude of excitation increased gradually until the overturning of the figurine. At low excitation frequencies (up to 3 Hz), the base acceleration required to overturn the object remained nearly constant, while the velocity decreased as the frequency increased (
Figure 5). When the amplitude was high enough, the figurine would rock, rotate around its vertical axis, and translate with each oscillation, even at an excitation frequency as low as 1 Hz. At higher excitation frequencies, the rocking was more intense, requiring higher levels of base acceleration and velocity to cause the figurine’s overturning. At 5 Hz, the object rocked intensely, rotated, and translated, but did not fall at the levels of excitation applied (up to almost 0.8 g). Similar behavior was noticed when the acrylic base was used as the figurine’s base of support. In
Figure 5, no mark appears in the curves at 5 Hz, indicating that the figurine did not fall at the excitation level applied.
The figurine’s behavior changed when a layer of felt was added to the top of the steel base of support, increasing the coefficient of friction. The motion of the figurine consisted of rocking parallel to the direction of excitation, without noticeable rotation or translation. The base acceleration that the figurine would fall at remained nearly constant up to 4 Hz, increasing at larger frequencies. In addition, the velocity levels causing the figurine’s fall decreased as the frequency increased up to 4 Hz, and then slightly increased again at 4.5–5 Hz.
At frequencies of excitation below 3 Hz, the different bases of support did not change the level of excitation that would cause the figurine to fall. At excitation frequencies above 3 Hz, the coefficient of friction played a significant role, reducing the excitation level required to cause the figurine to fall as friction increased. It is noticeable that with the acrylic and steel base without the felt, the excitations applied (even the high ones) could not cause the figurine to fall at 5 Hz.
Next, since figurine F1 exhibited significant asymmetry, it was rotated 180° and tested using the same sinusoidal signals. The results were similar to those of
Figure 5, with some differences in the high frequencies, particularly for the steel base of support (
Figure 6). At these high frequencies, the object rotated from the beginning around its vertical axis, positioning its stronger side parallel to the direction of excitation. Consequently, higher excitation levels were needed to induce overturning.
In
Figure 5 and
Figure 6, one can notice that if the acceleration required to cause overturning remains constant, the corresponding velocity associated with overturning decreases as the frequency increases. The peak velocity and acceleration that caused overturning are related through the frequency of excitation with the following formula:
, where
PBA and
PBV are the peak base acceleration and peak base velocity, respectively, required to cause overturning, and
f is the frequency of the excitation.
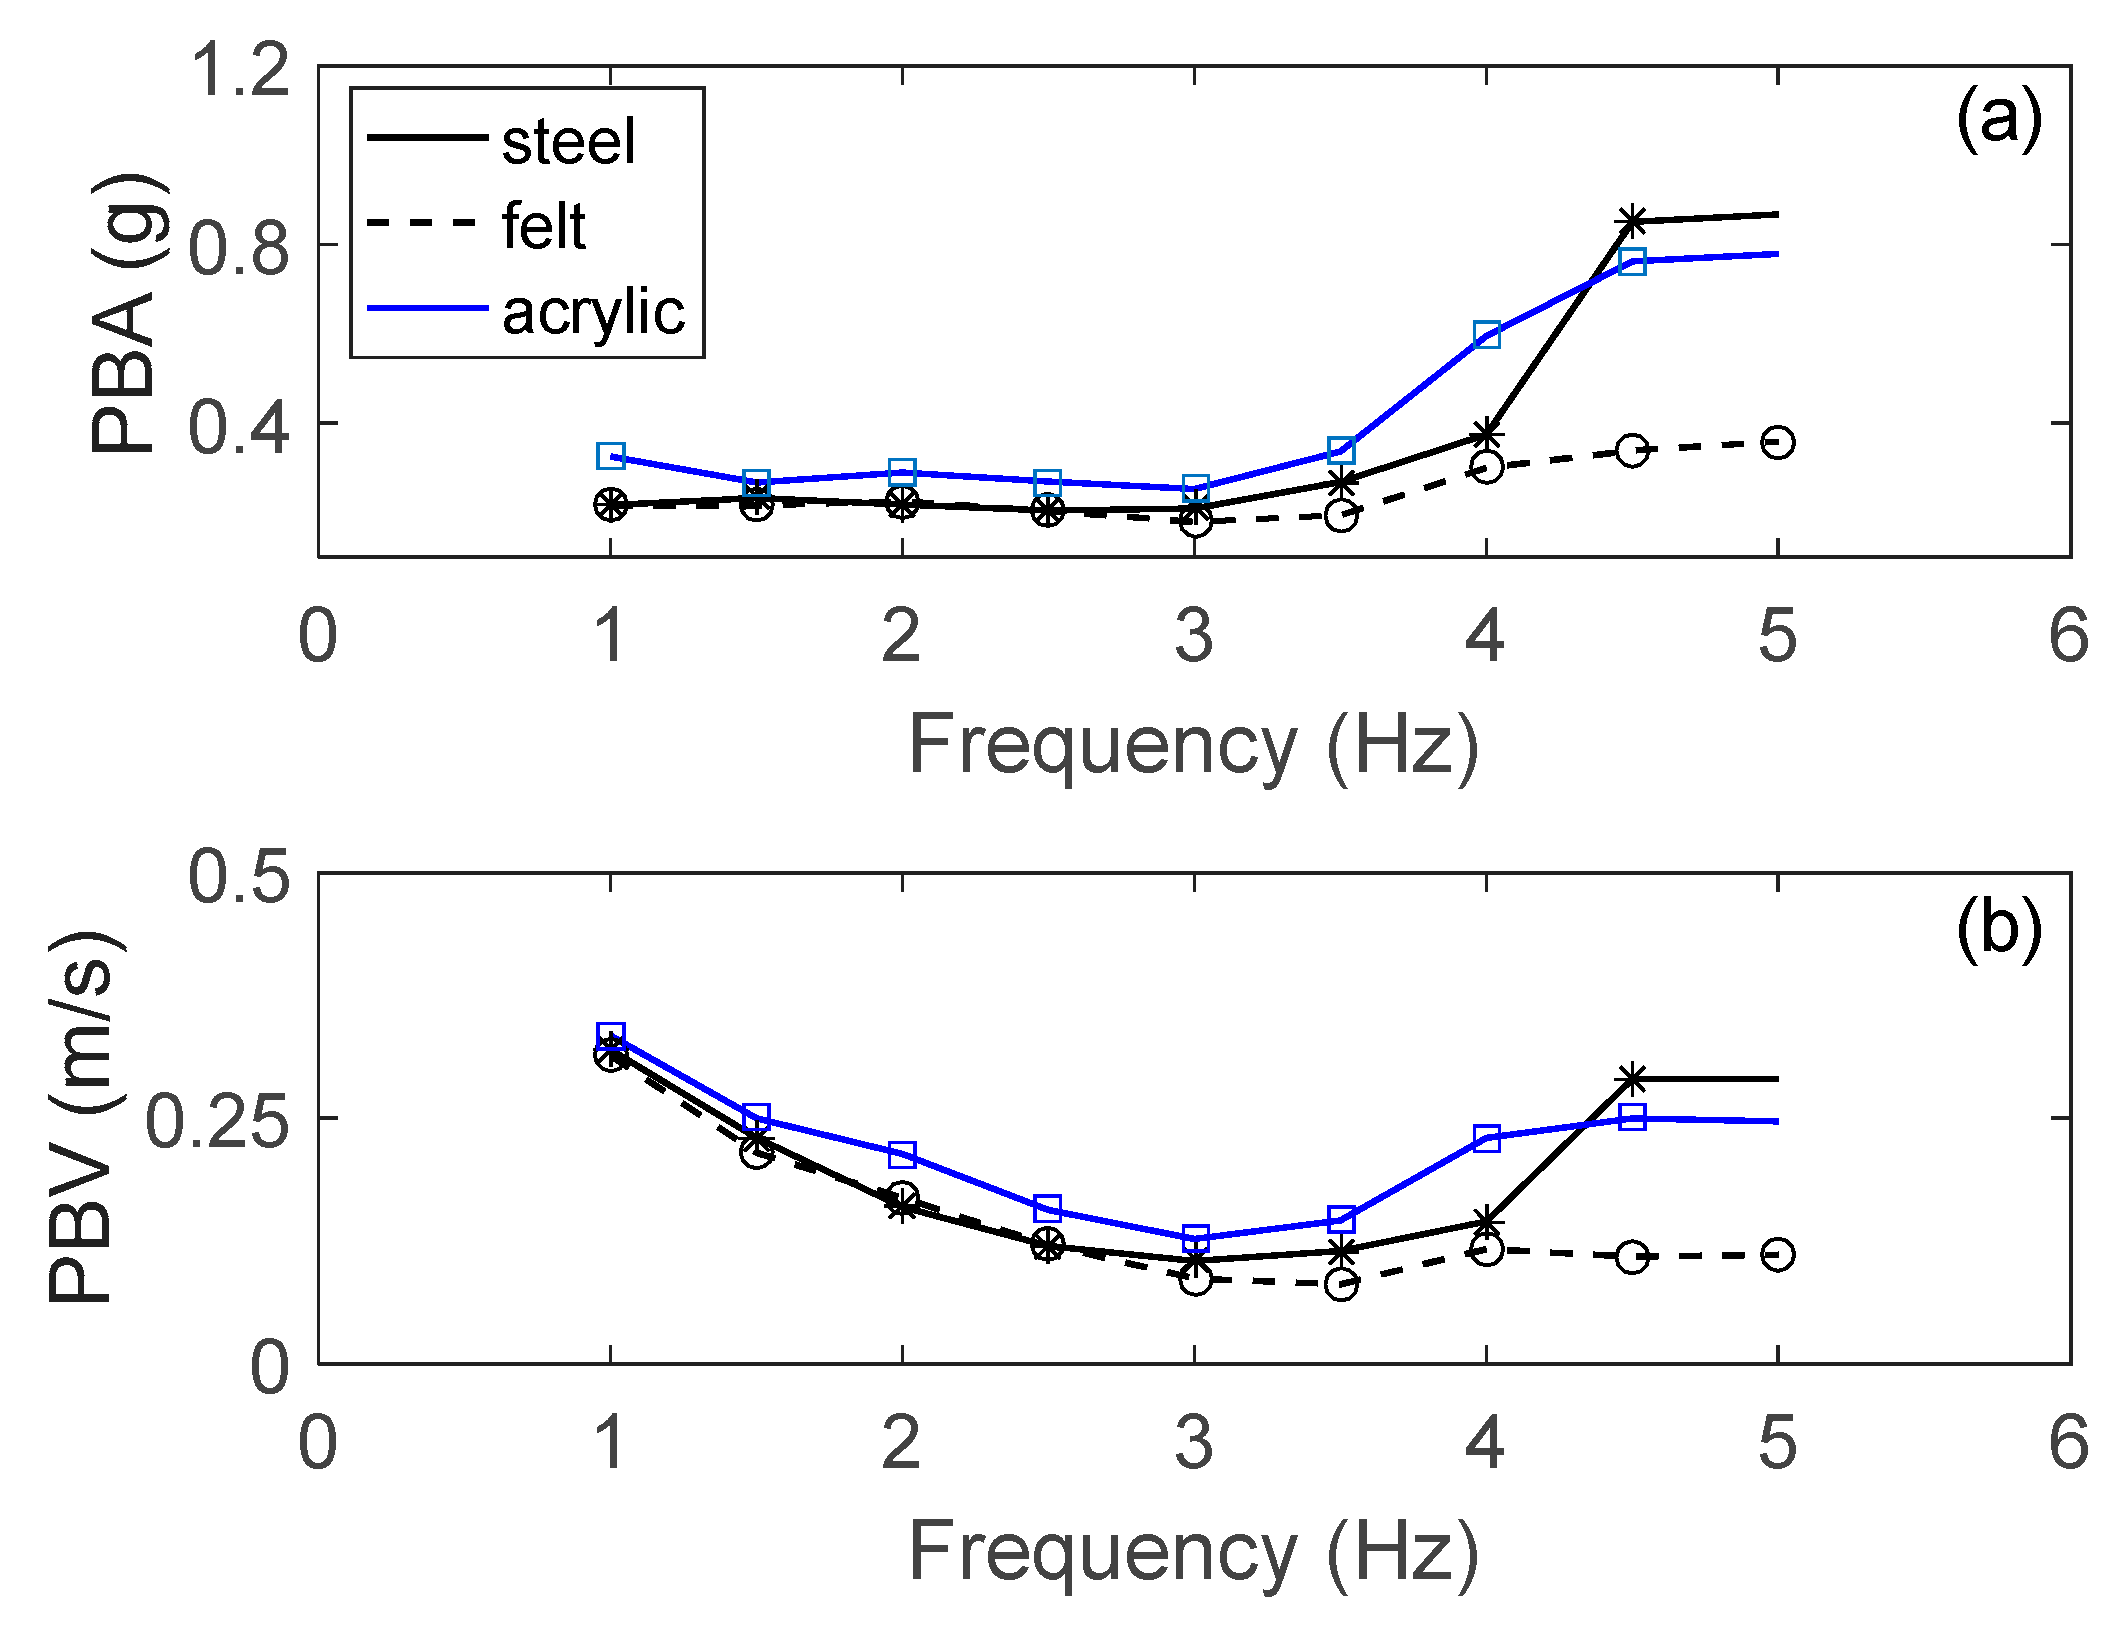
3.1.2. Figurine F2
For figurine F2, at excitation frequencies of 1 and 5 Hz, the level of excitation applied was not sufficient to cause overturning. This is indicated in the curves of
Figure 7 by the absence of marks. Similar behavior to figurine F1 was observed with less rotation at the lower excitation frequencies. At frequencies 3 Hz and above, higher excitation levels were required to cause the figurine to fall.
It is noticeable that the curves corresponding to the steel plate and the acrylic block, even though their coefficients of friction between their surfaces of contact were very close, differ for excitation frequencies higher than 3 Hz. In addition to the coefficient of friction, the coefficient of restitution plays an important role in the dynamic behavior of objects. According to Makris and Vassiliou [
30], in order for rocking to occur, the impact has to be inelastic. This was the case with the acrylic block, which had a much higher coefficient of restitution than the 1 mm steel base used in the experiments. Rocking motion with a high coefficient of restitution resulted in greater rotation about the object’s vertical axis. This increased the likelihood of aligning the object’s stronger side with the direction of excitation, requiring higher excitation levels for the object to fall.
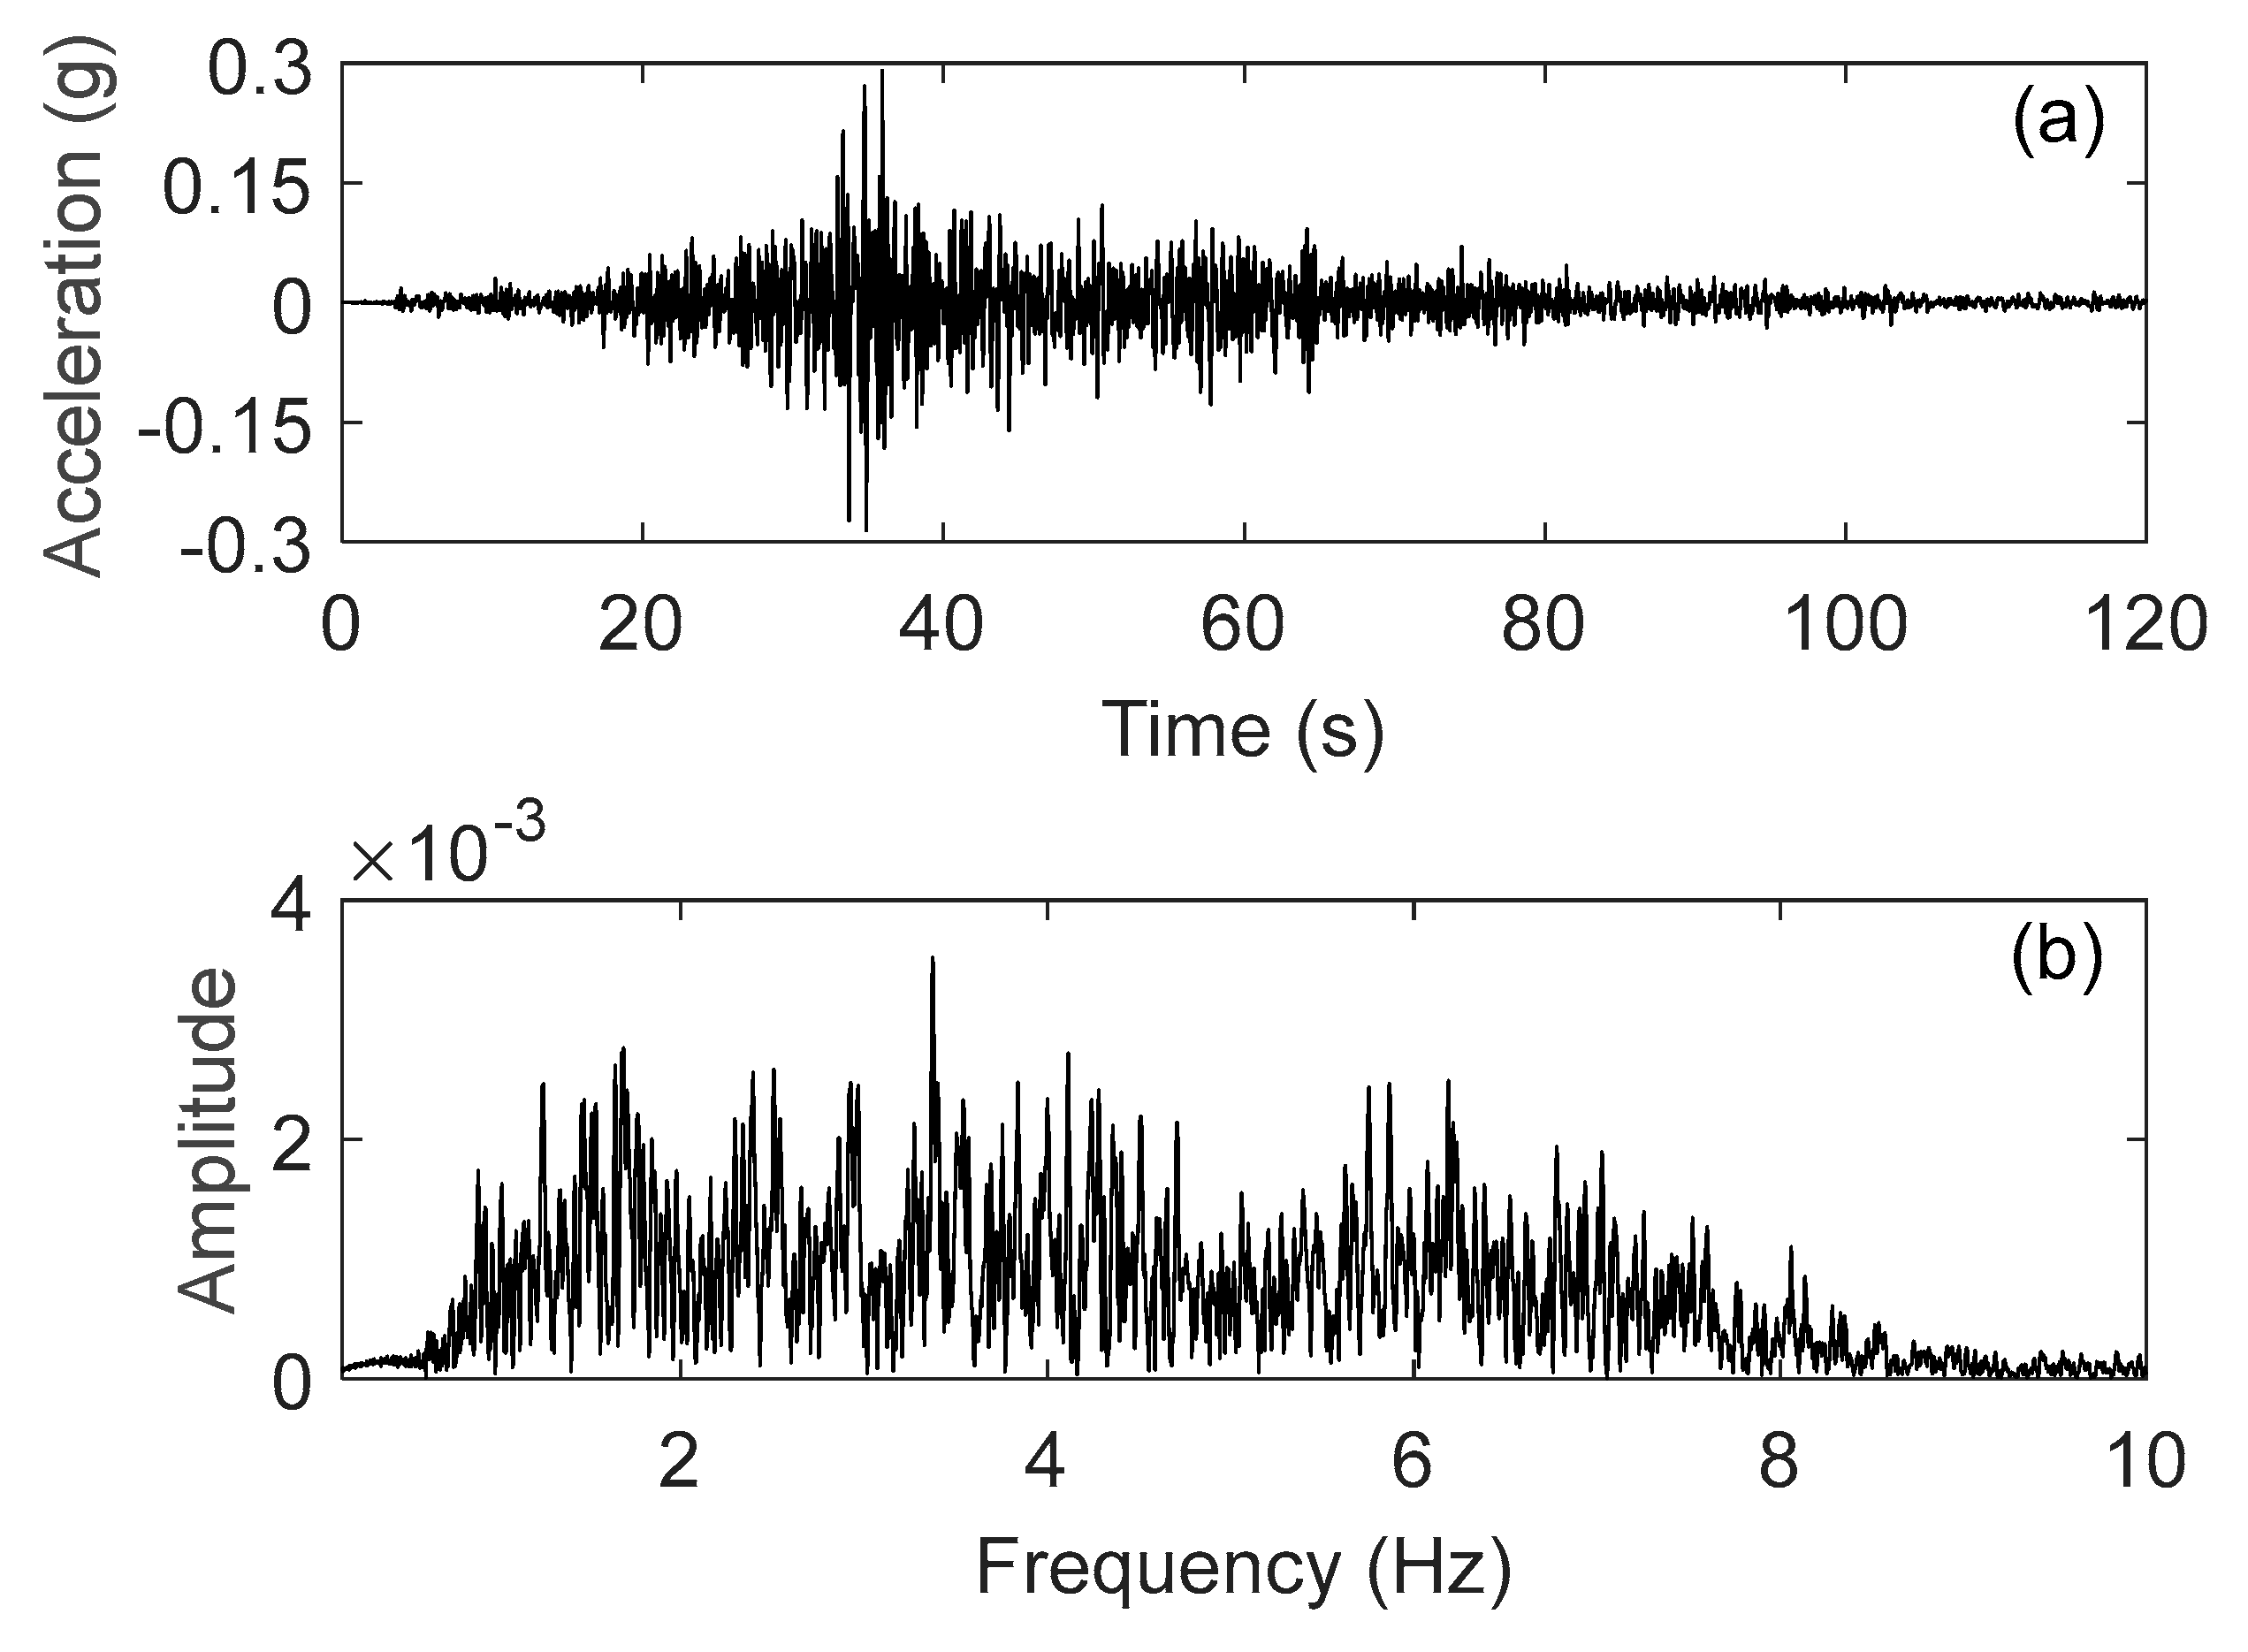
3.2. Earthquake Excitation
The figurines were excited by an earthquake signal (from a seismic event that occurred in Chile on 4 April 2014) with well-distributed frequencies from 0 to 8 Hz (
Figure 8). The motion of the figurine is presented by the peak relative displacement of the top and bottom of the figurine with respect to the displacement of the base of support, as well as the peak displacement of the top perpendicular to the direction of excitation. These displacements include the translation of the object that may occur during the excitation.
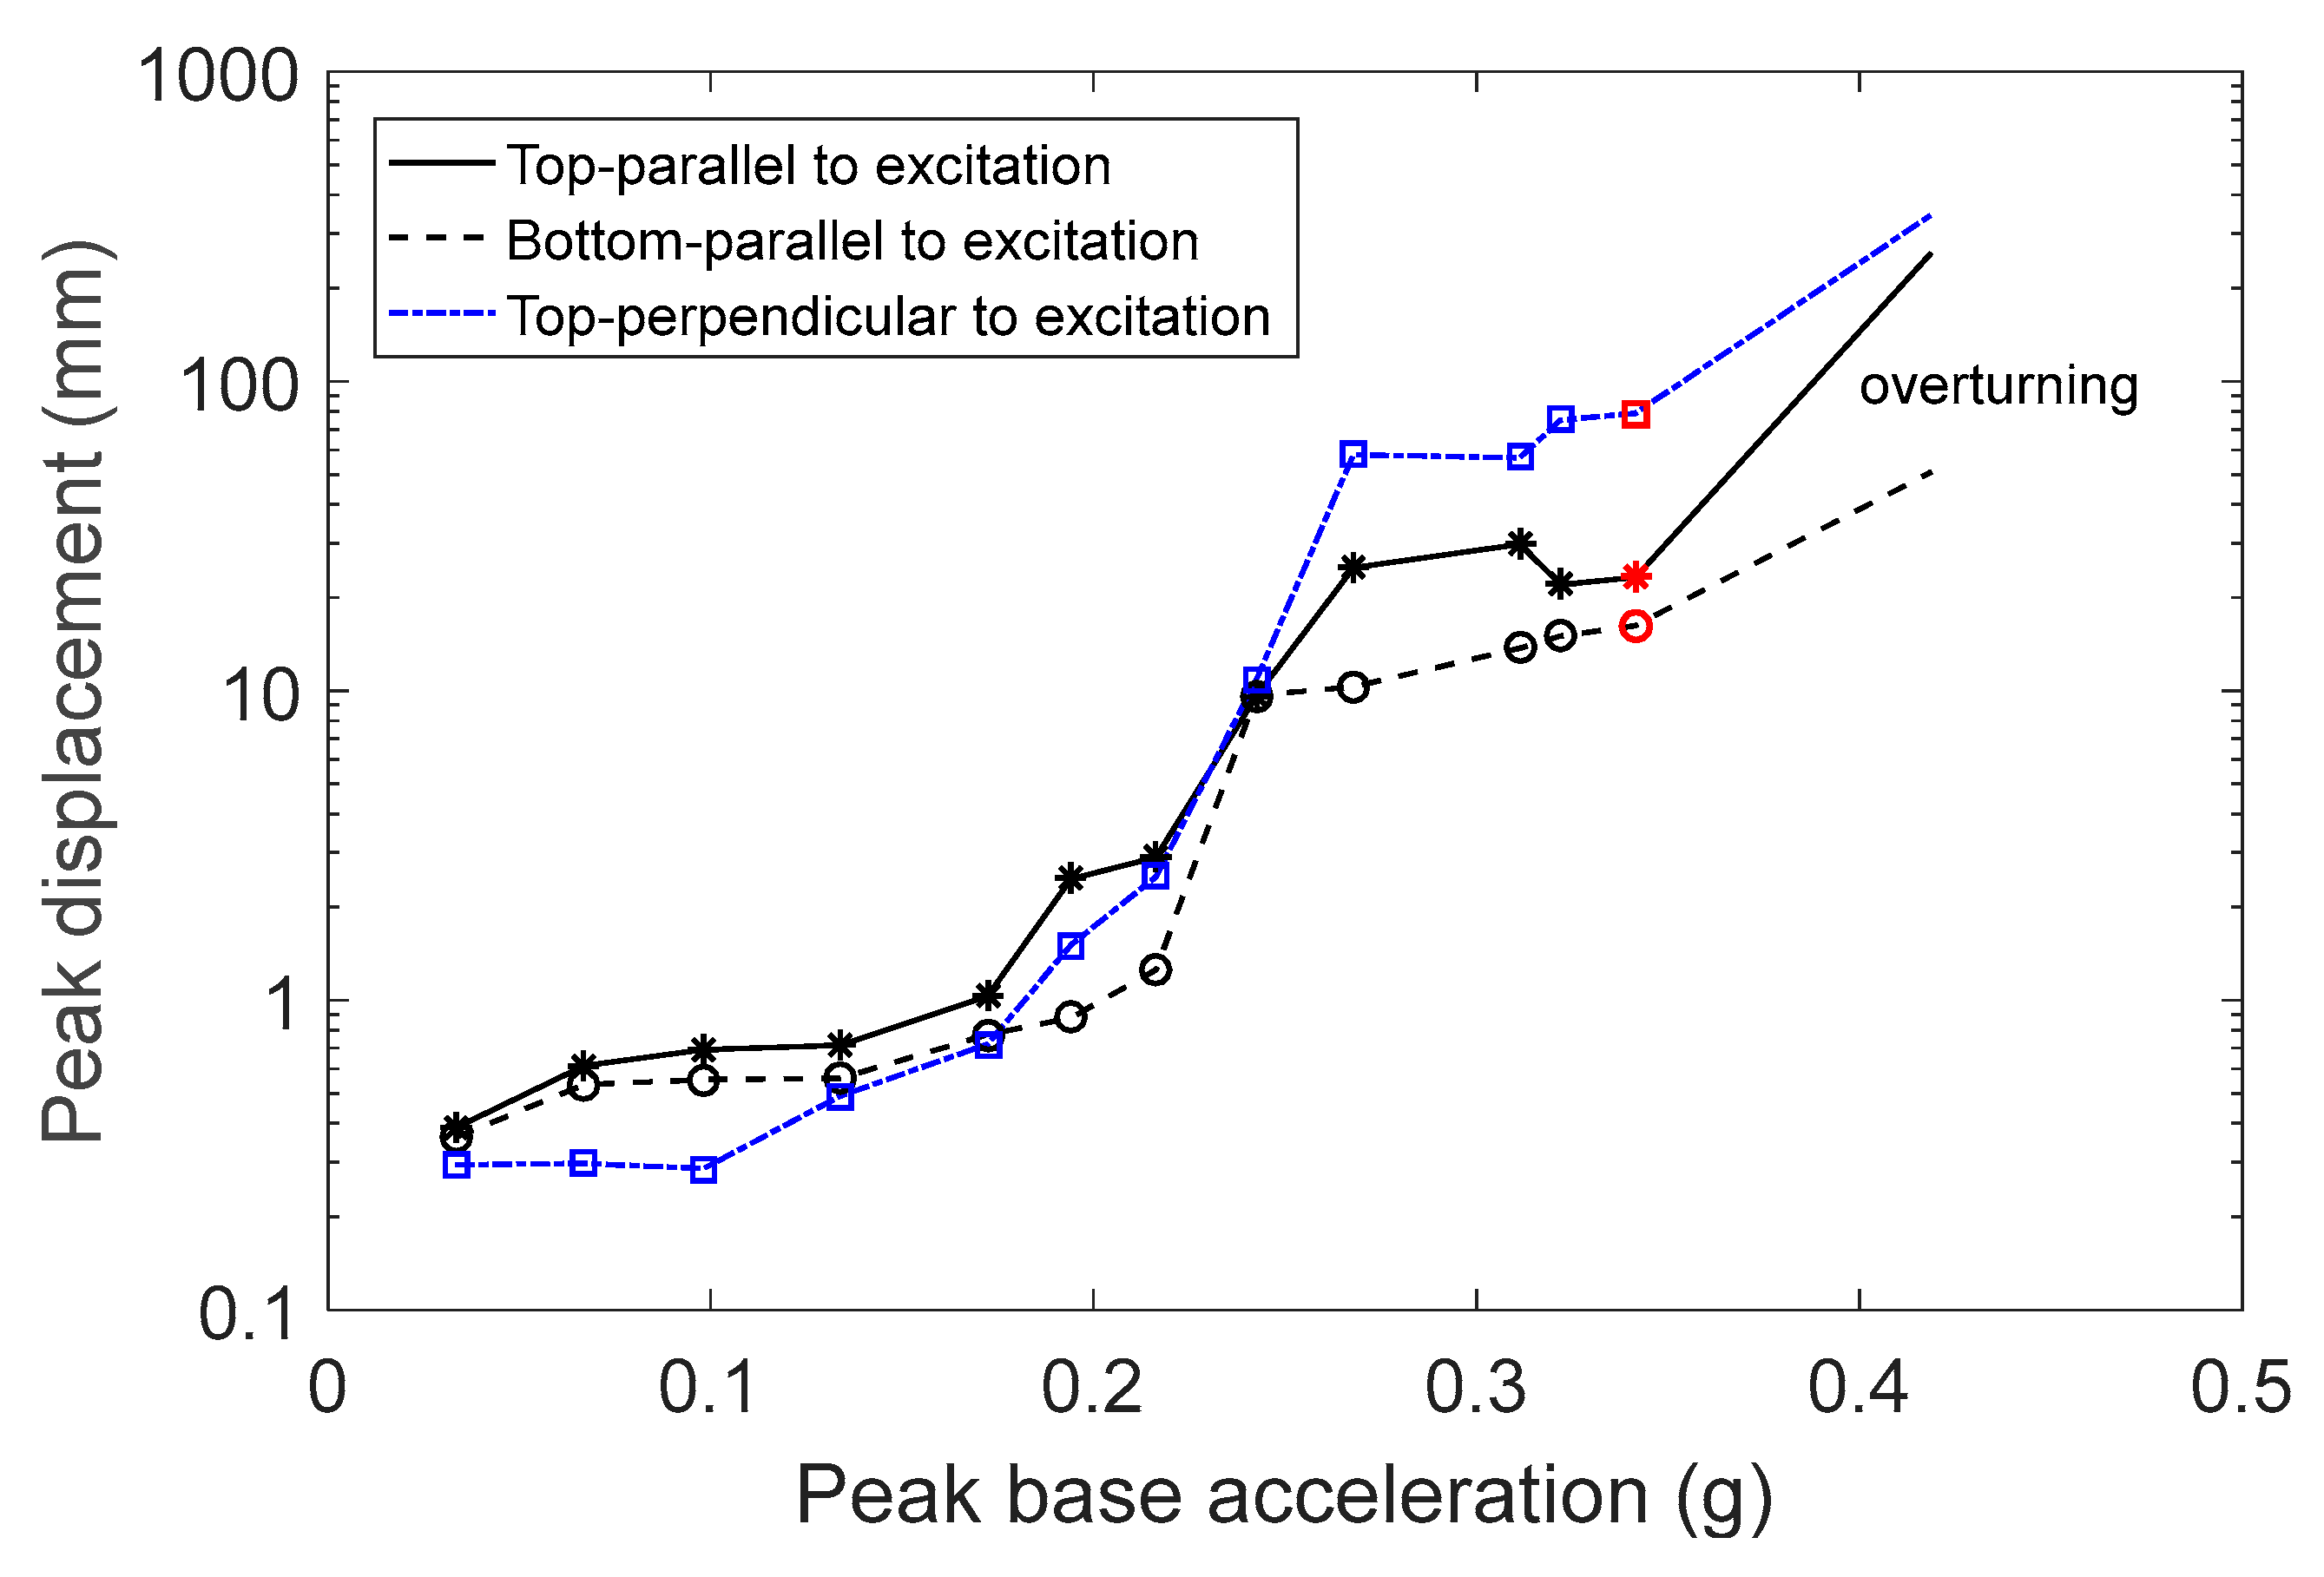
3.2.1. Figurine F1
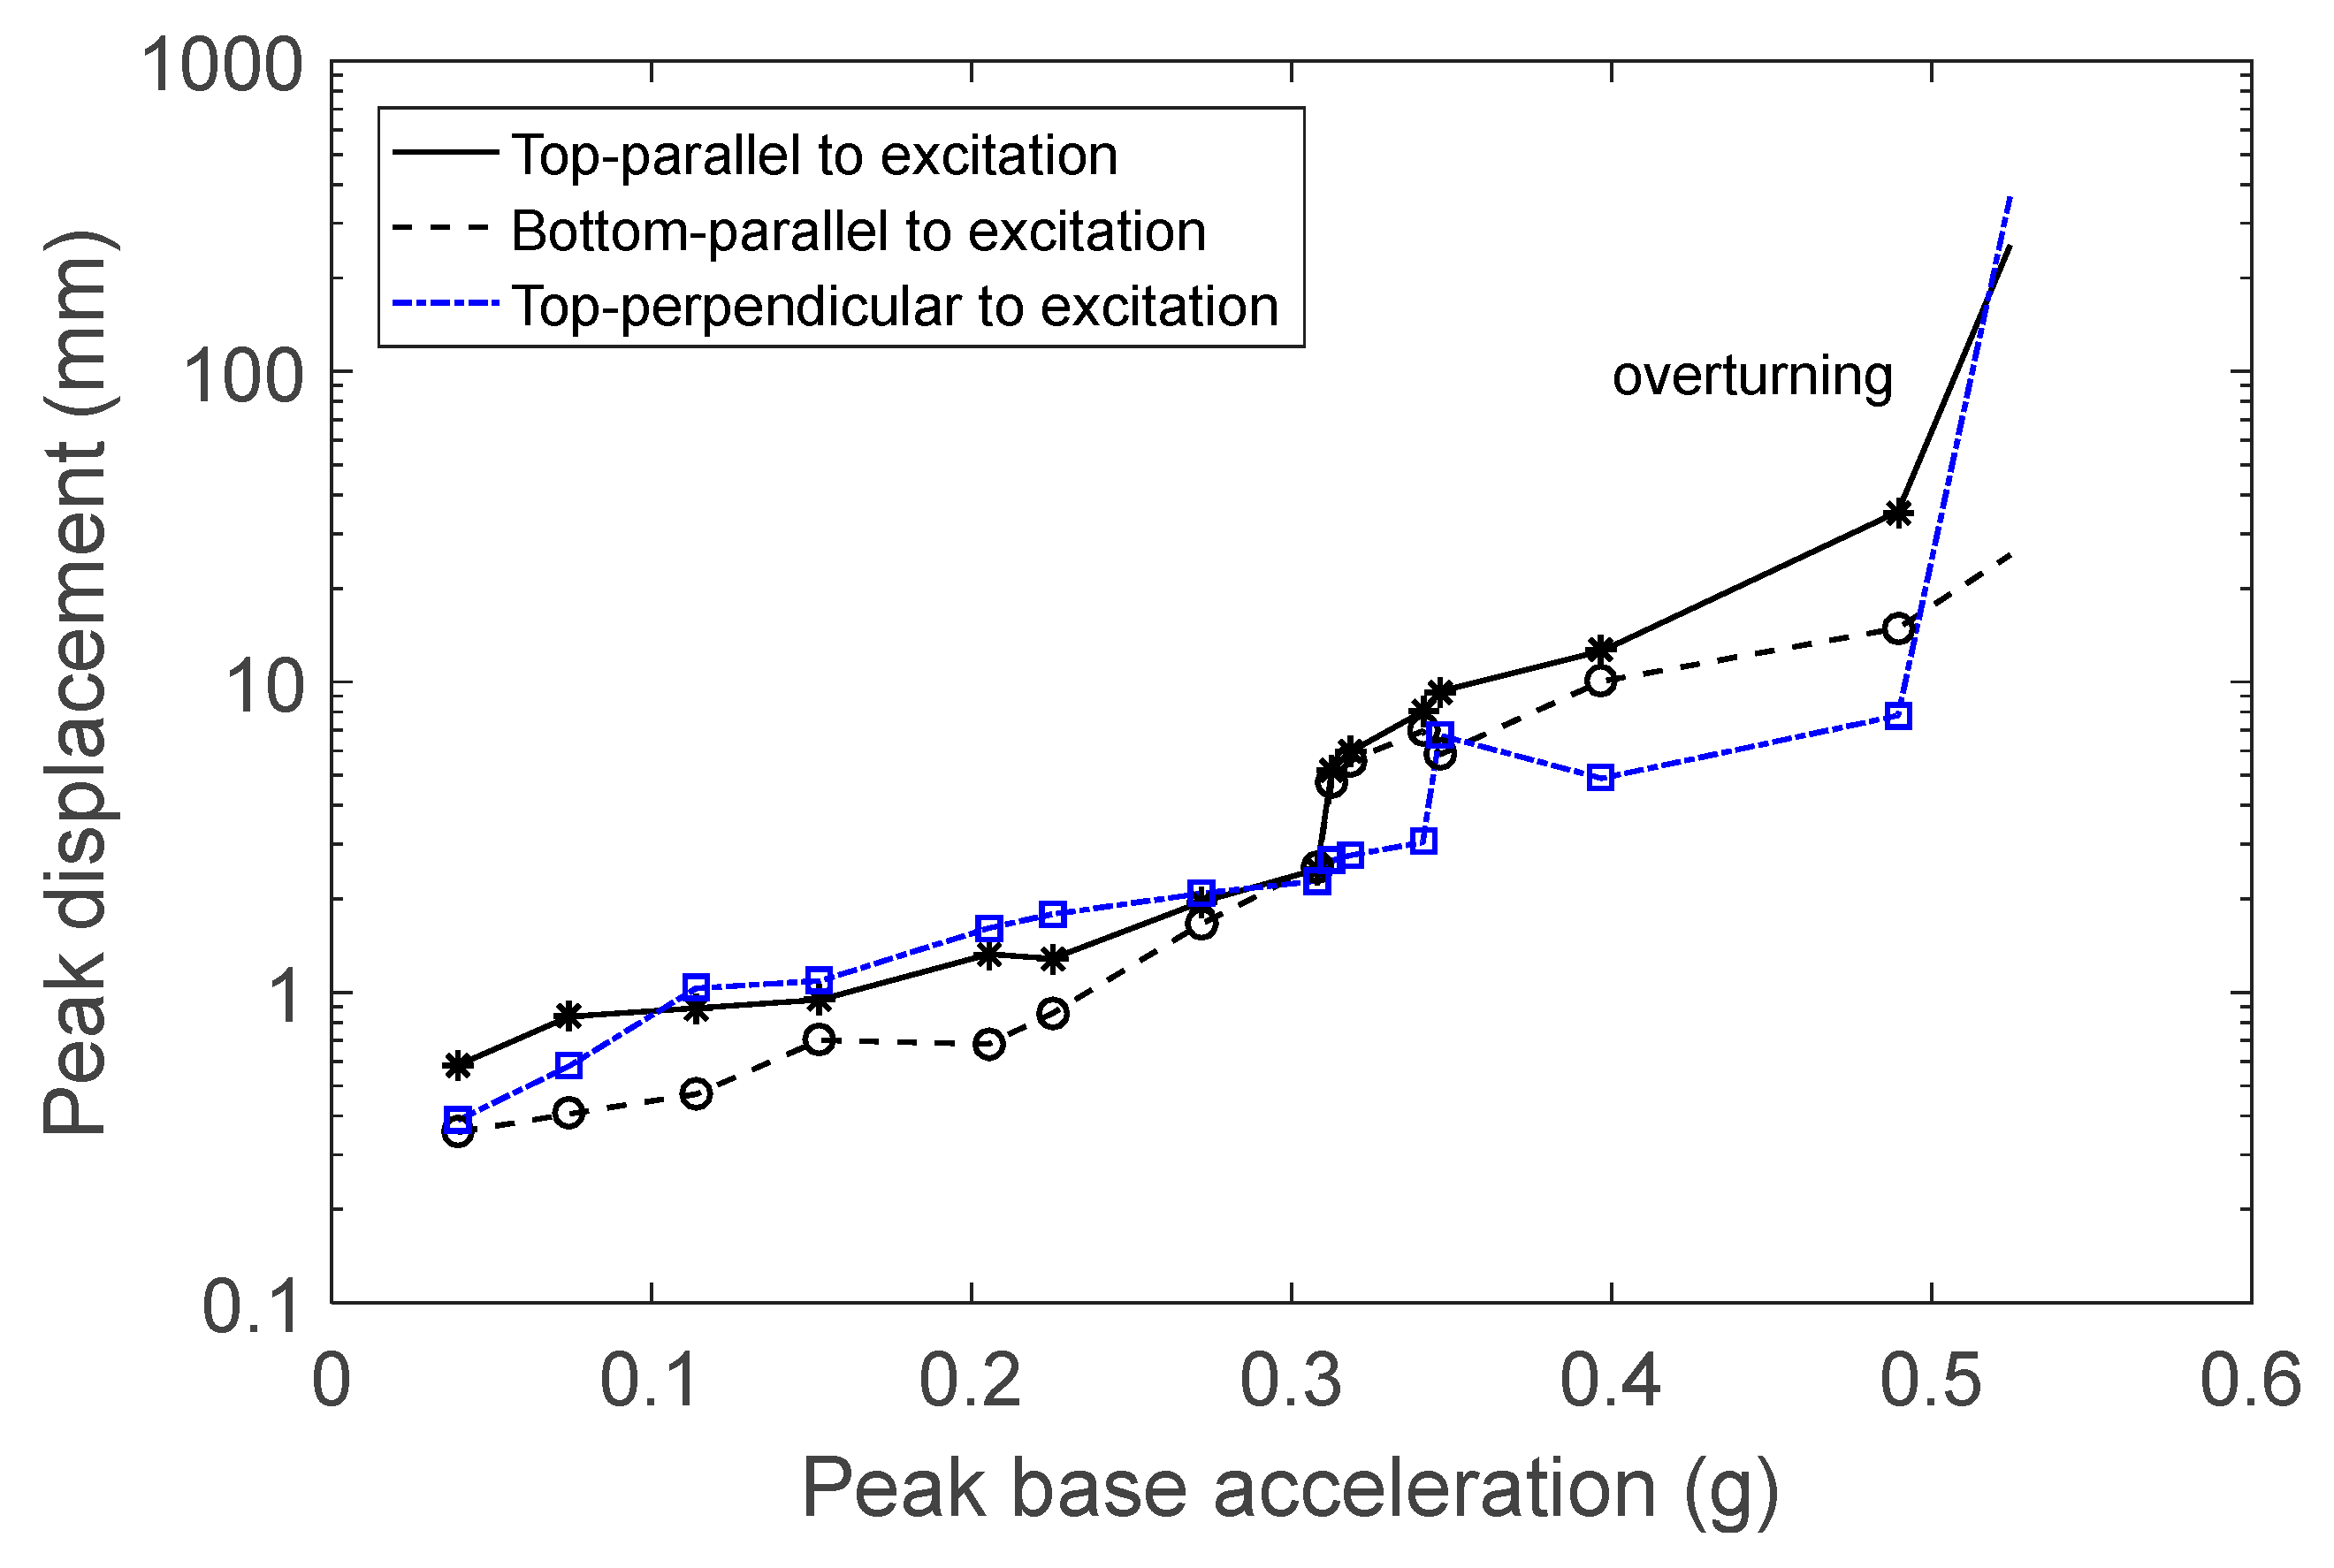
Initially, figurine F1 was placed on the steel base and excited by the earthquake signal. The amplitude of excitation was increased in every experiment until the object overturned. At low amplitude levels, the figurine would slightly rock, since its base was not completely straight, with small translation parallel and perpendicular to the direction of excitation (
Figure 9). According to theory, rocking should start when
g. However, rocking began earlier, at 0.24 g, as evident from the distance between the curves representing the displacement of the figurine’s top and bottom parts parallel to the direction of excitation (
Figure 9). At higher excitation amplitudes, the rocking intensity increased, and rotation was also observed. The maximum displacements shown in
Figure 9 include the figurine’s translation, which became significant at high levels of excitation. At these levels of excitation, the accuracy of the results is reduced, primarily in the direction perpendicular to the excitation due to the large rotation of the object. Nevertheless, valuable insights into the object’s behavior were still obtained. The large peak displacements perpendicular to the direction of excitation indicate large rotation of the object around its vertical axis. At excitation levels higher than 0.32 g (corresponding to a peak base velocity of 0.22 m/s), the object either fell or found its balance at the last moment. This is indicated by the red marks on the curves in
Figure 9.
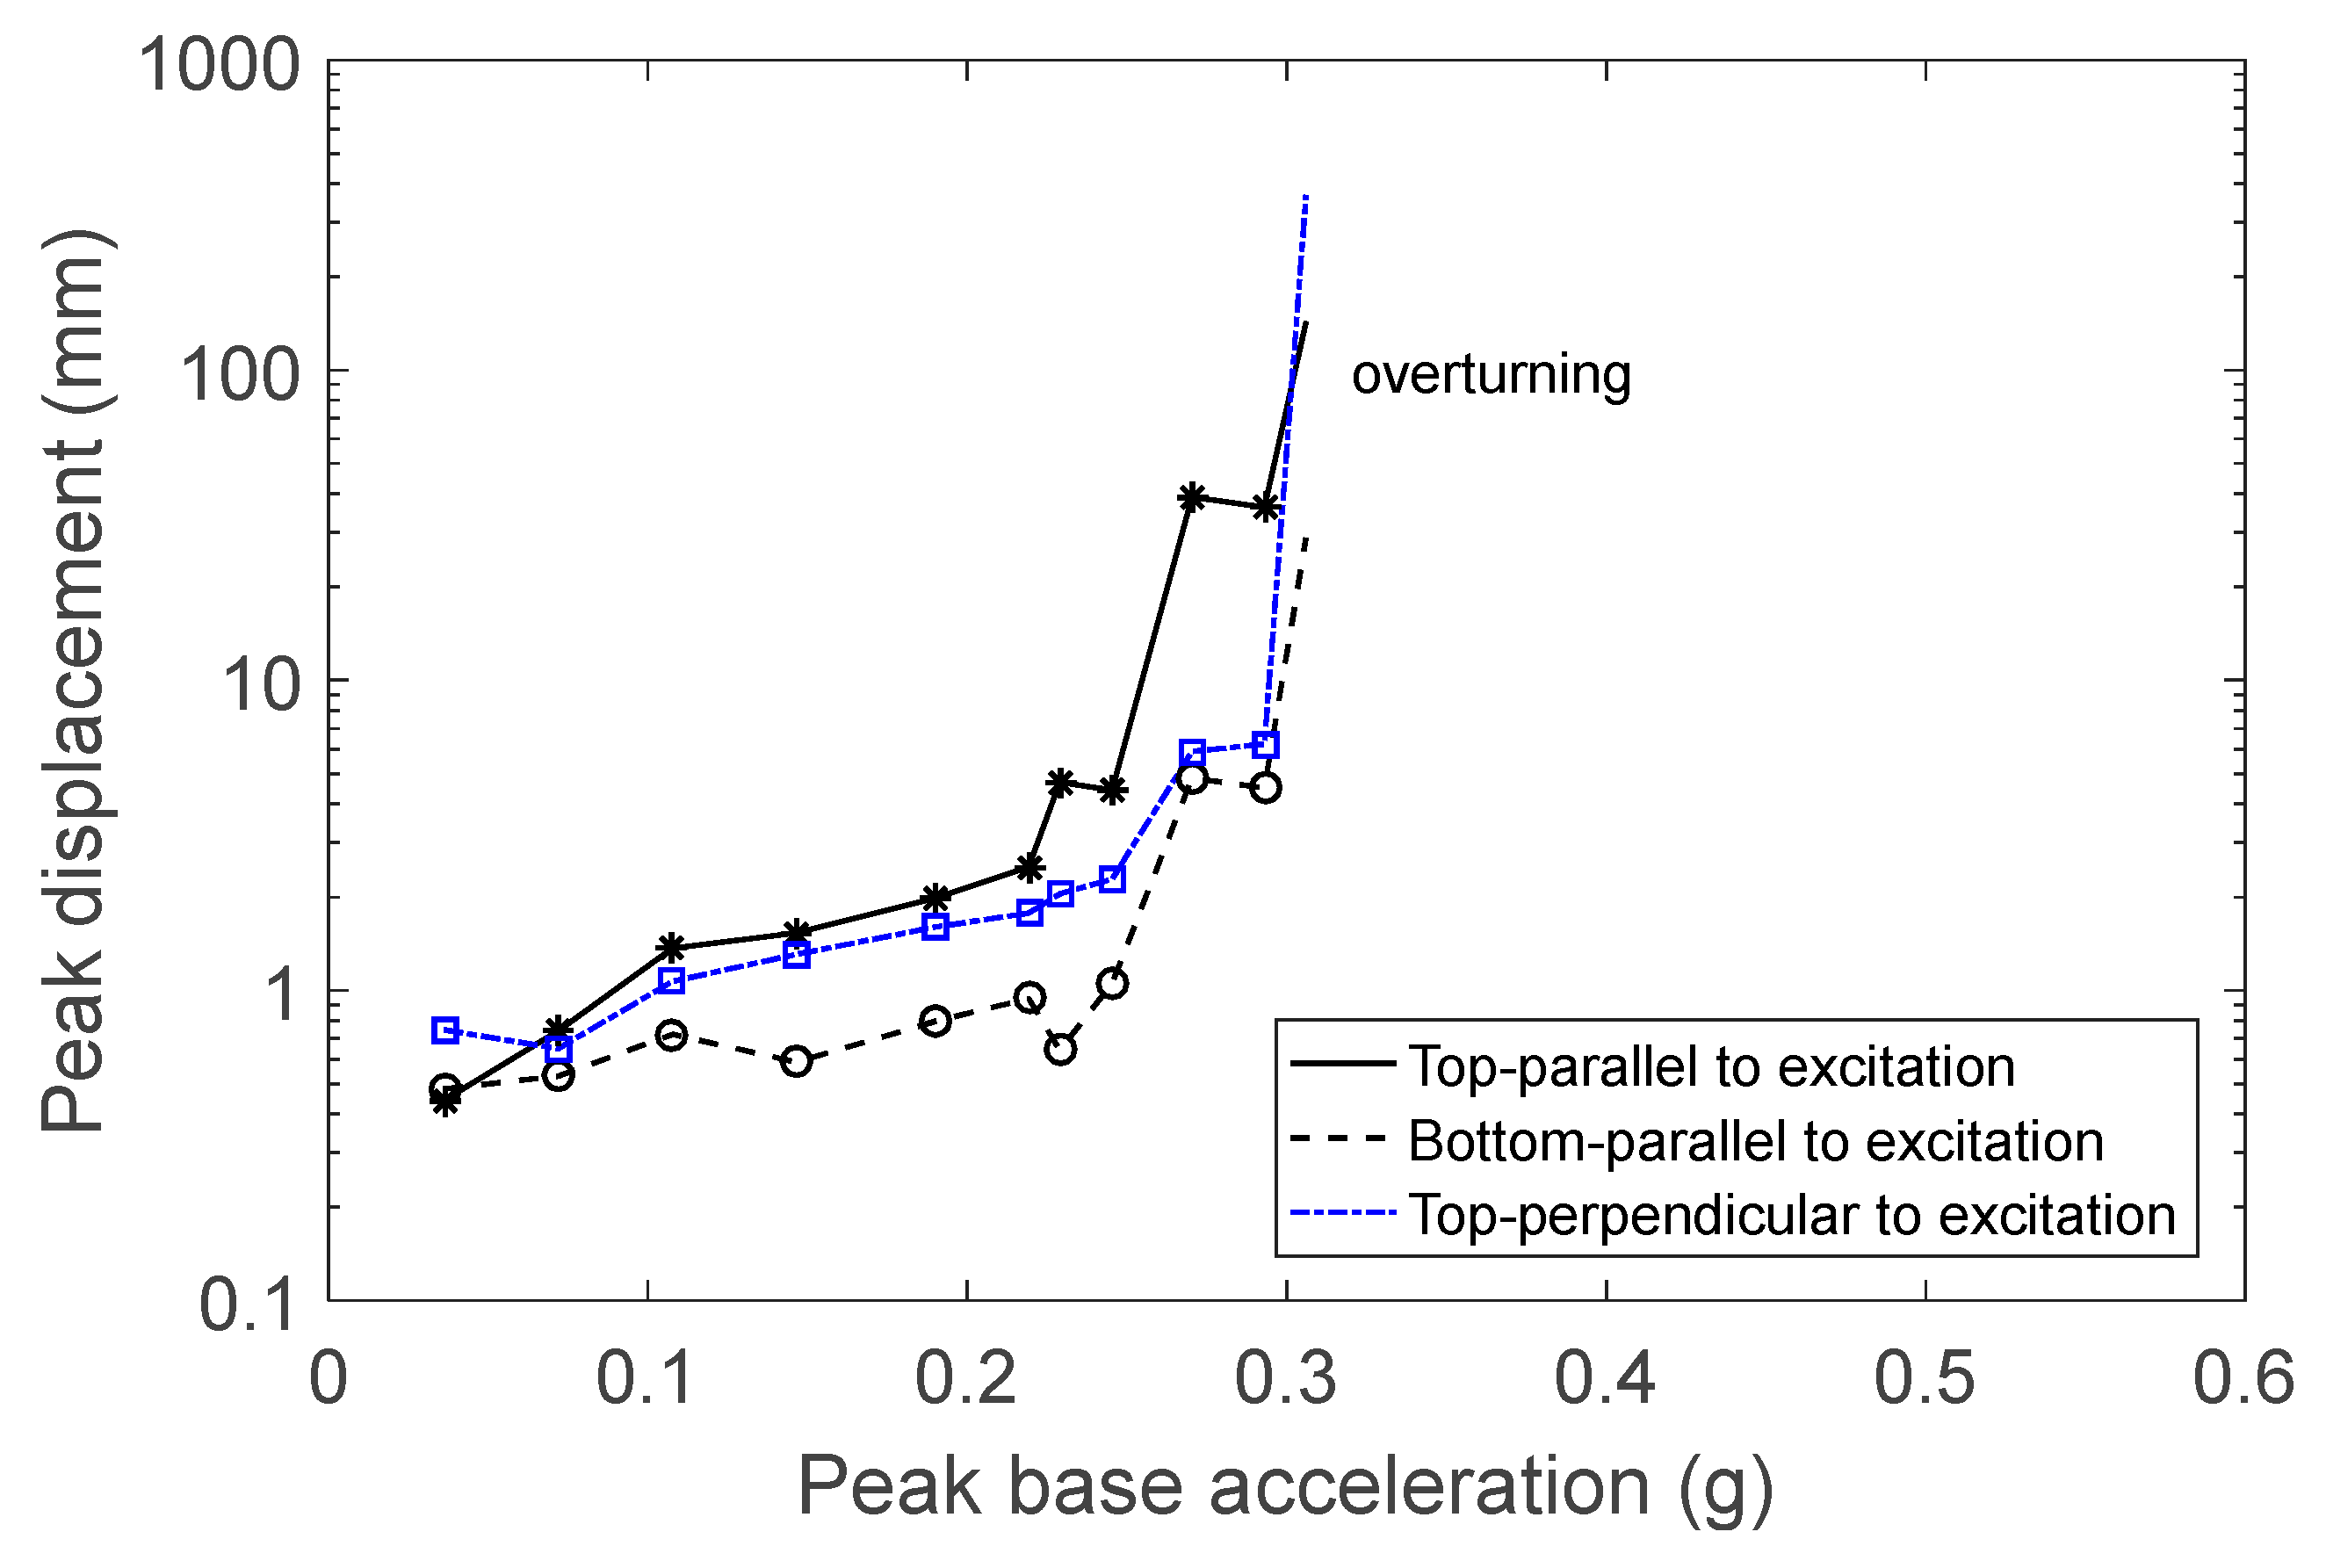
In the next set of experiments, a layer of felt was added to the top of the steel plate, increasing the coefficient of friction. The same excitation earthquake was used, and the displacement both parallel and perpendicular to the direction of excitation was measured. The motion of the figurine included rocking parallel to the direction of excitation, with very small translation and without rotation. The curves corresponding to the displacement of the top and bottom of the figurine parallel to the direction of excitation (
Figure 10) are well separated, indicating that the rocking motion started at low levels of excitation. The object overturned at a lower base acceleration than in the previous case, where a steel base was used without felt. The peak base velocity during the fall was 0.17 m/s, satisfying the theoretical condition. According to expression 4, the peak base velocity required for overturning needs to be greater than 0.16 m/s.
The object’s rocking motion began at lower excitation levels than predicted by theory. The theory predicted that rocking will start when
> 0.33 g (Equations (2) and (5)). In the case of figurine F1, the rocking motion started when the base acceleration was 0.16 g, which is considerably lower than 0.33 g. The difference between the theoretical and experimental results was mainly due to the irregular geometry and the uneven base of the object, which could initiate rocking at lower levels of excitation than expected. Similar conclusions were found by Papalou [
27].
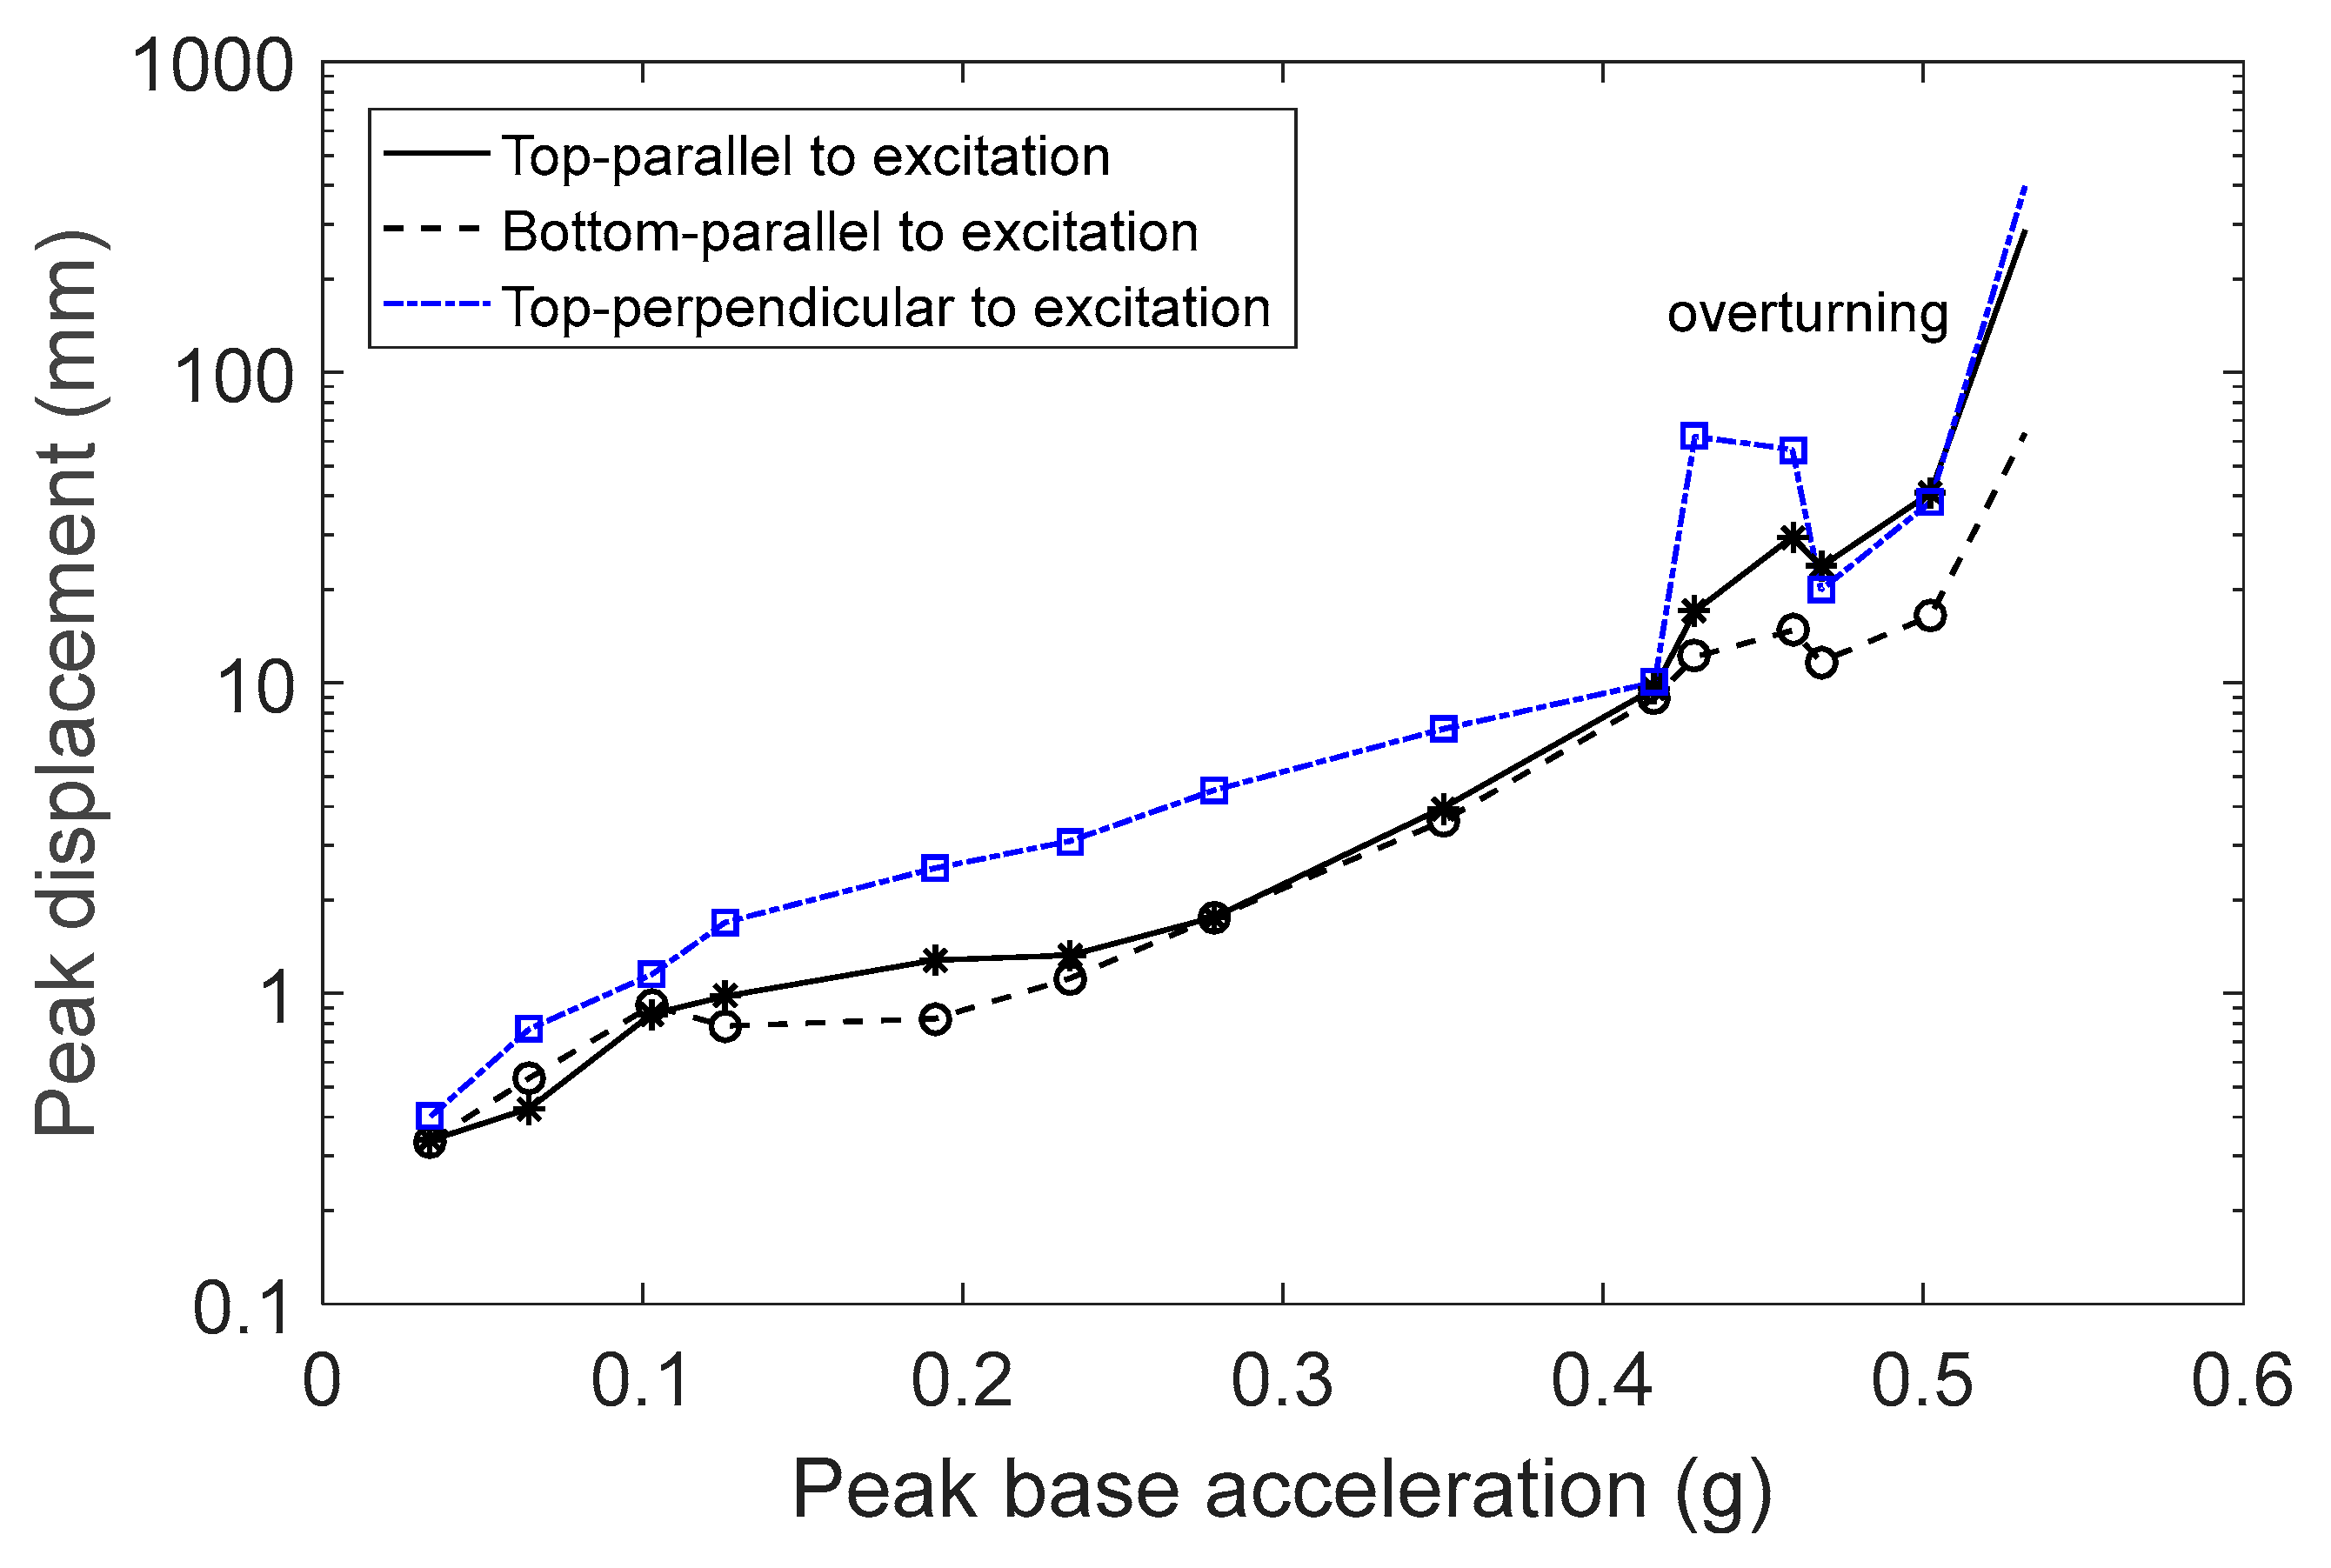
In the third set of experiments, an acrylic block was used as a base of support. The figurine’s behavior was similar to when it was supported by the steel base. When the excitation level was at 0.23 g, the figurine rocked slightly with a small translation. Rocking with small translation and rotation occurred at 0.28 g. At higher levels of excitation, the intensity of rocking increased, accompanied by larger translation and rotation. At these levels of excitation, the accuracy of the results was reduced, primarily in the direction perpendicular to the direction of excitation due to the large rotation of the object. In the last two experiments before the object fell, the laser measuring the displacement of the object perpendicular to the direction of excitation lost contact. The red marks in
Figure 11 indicate that from the corresponding excitation onward, the object could either fall or find its balance at the last moment. The peak base velocity that produced overturning was 0.31 m/s. Notably, the object exhibited large rotations at high excitation levels, with the coefficient of restitution playing an important role.
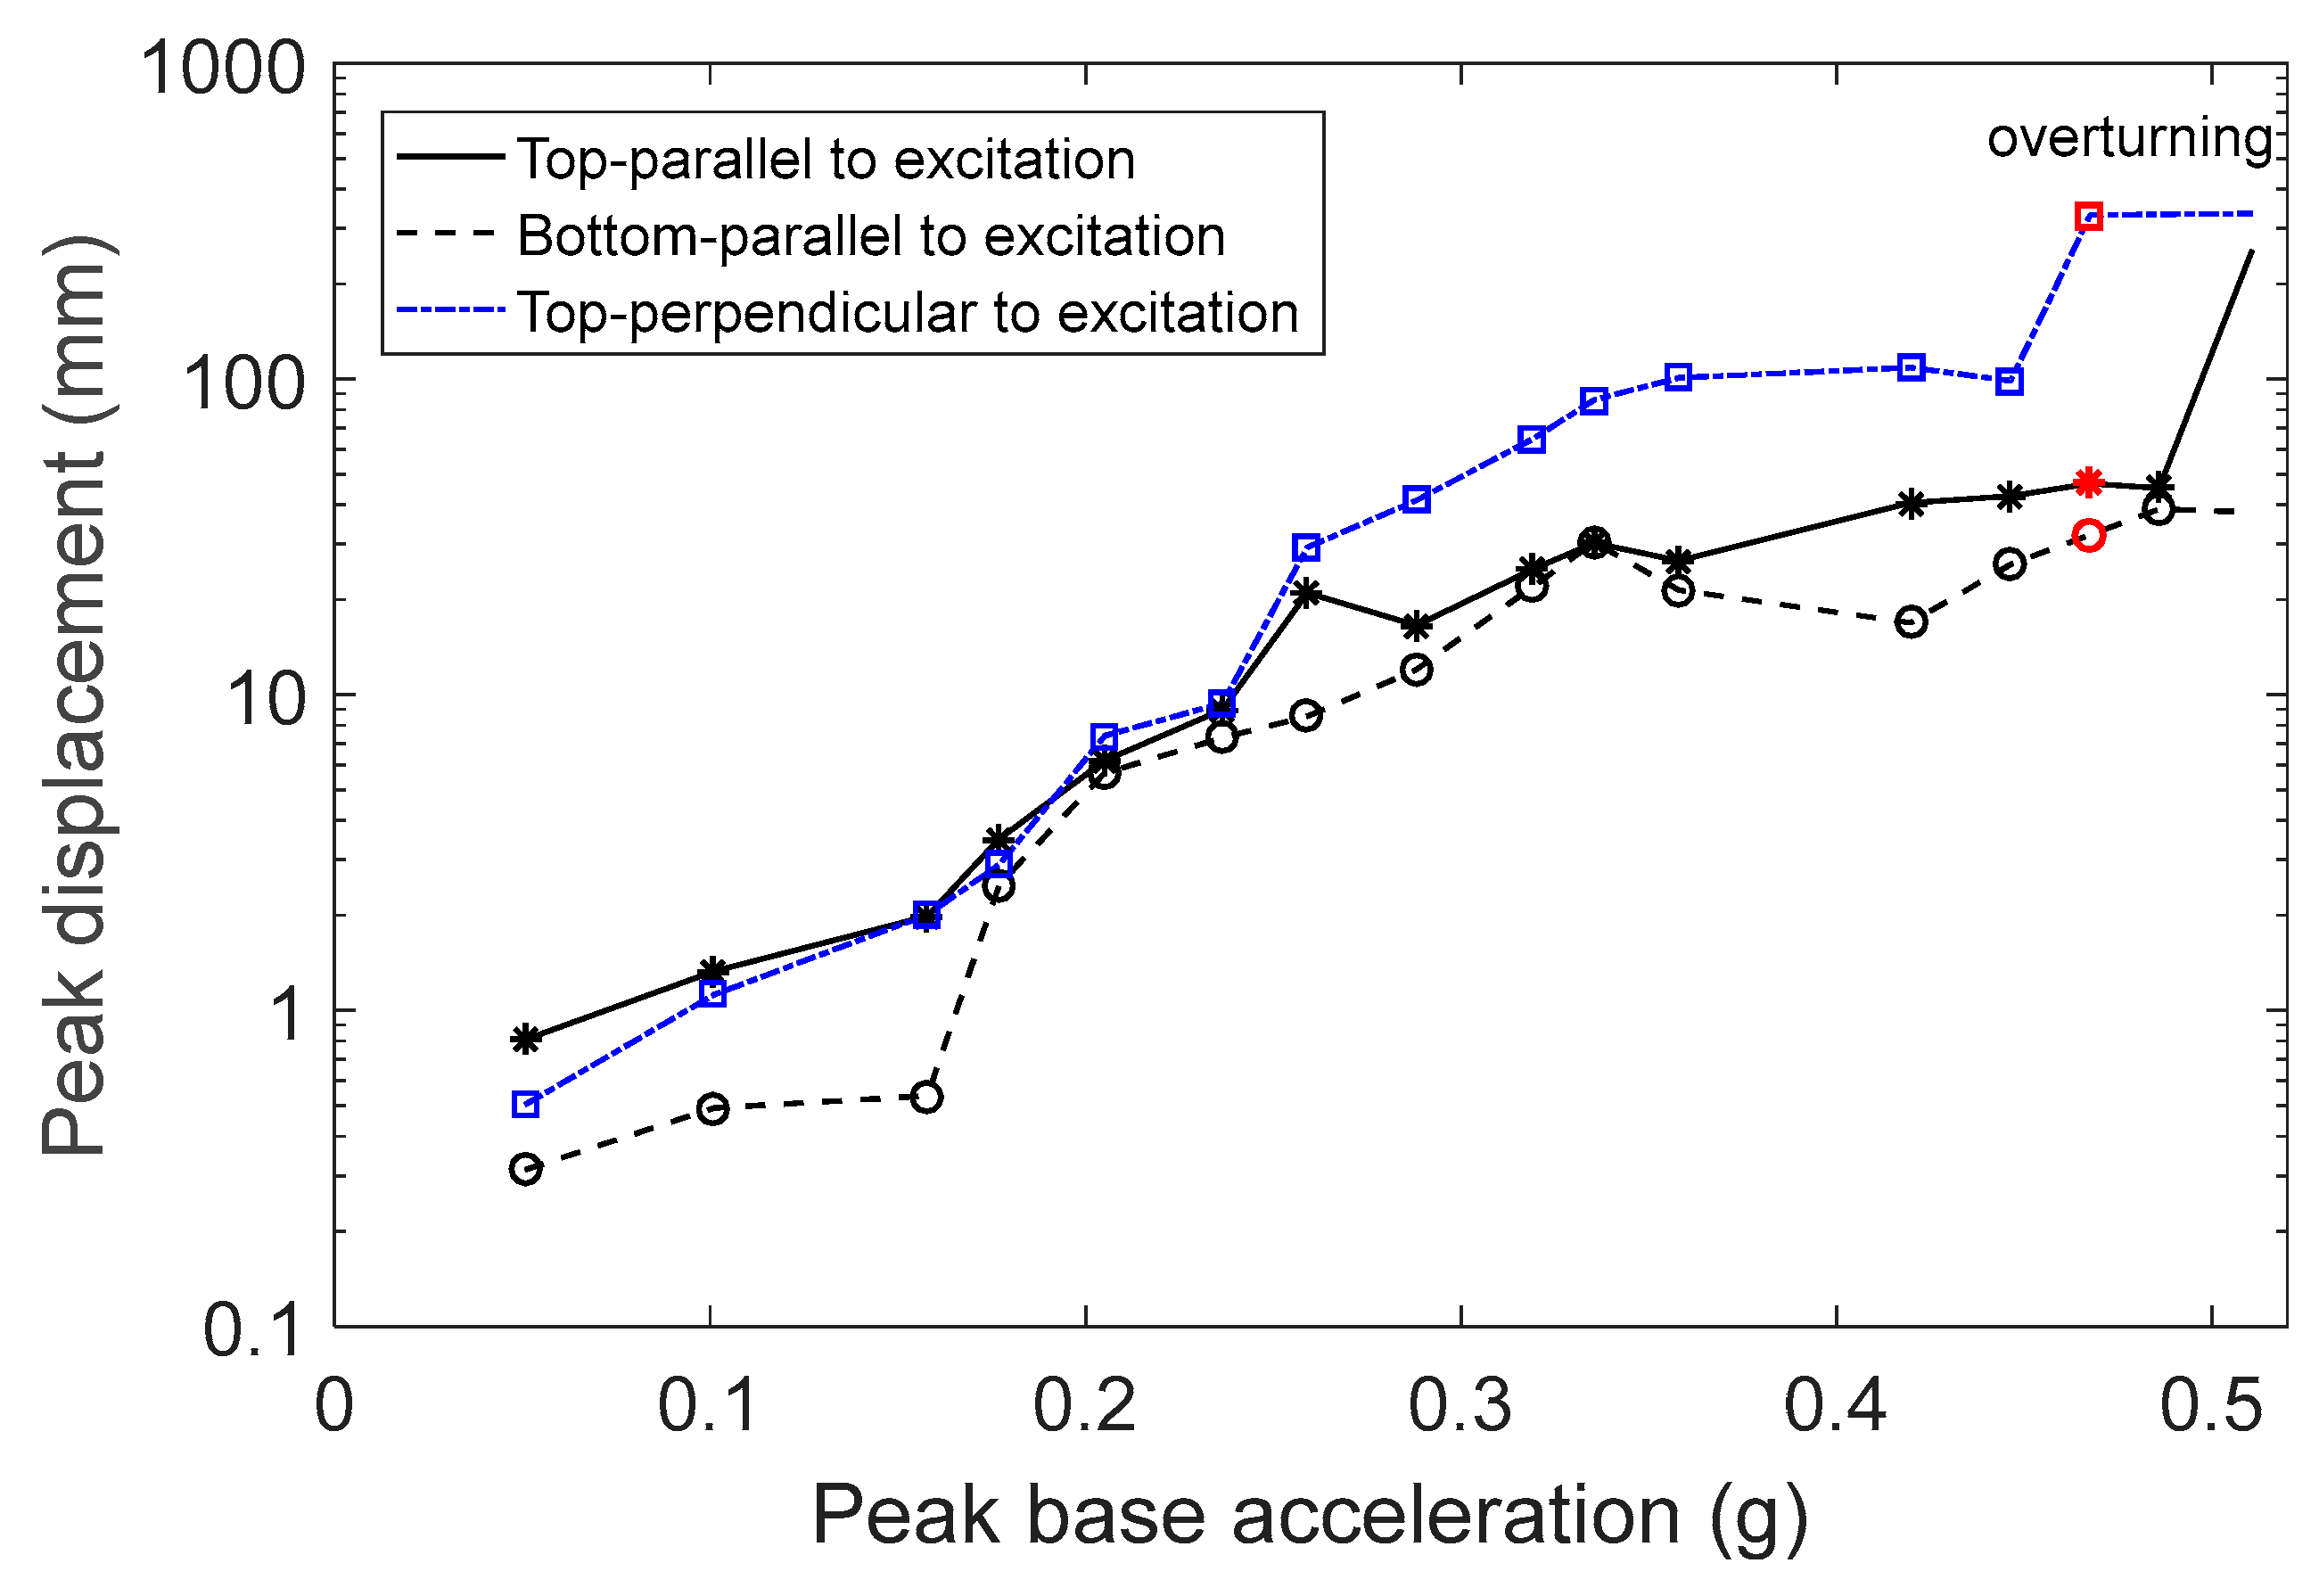
3.2.2. Figurine F2
In the next set of experiments, figurine F2 was placed on the steel base. Its behavior was different than that of figurine F1. At low excitation levels and up to 0.3 g, the figurine moved to a new position without any back-and-forth motion (
Figure 12). Rocking started close to 0.35 g. In addition to rocking, a small rotation started occurring at excitation levels close to 0.4 g. Overturning occurred when the peak base velocity was 0.34 m/s.
In the next set of experiments, a layer of felt was added to the top of the steel plate. The motion of the figurine involved rocking parallel to the direction of excitation without rotation. The curves corresponding to the displacement of the top and bottom of the figurine parallel to the direction of excitation are well separated, indicating that the rocking motion started at low levels of excitation, close to 0.22 g (
Figure 13). The object fell at a lower base acceleration compared to the previous case, where the steel base was used without felt. The peak base velocity during the fall was 0.17 m/s.
In the last set of experiments, the figurine was placed on the acrylic base. Sliding occurred at excitation levels ranging from 0.3 g to 0.4 g. This behavior can be observed in
Figure 14 by the coincidence of the two curves. At higher excitation levels, the motion of the figurine included rocking, translation, and rotation, with visible rocking starting close to 0.43 g. Overturning occurred at a peak base velocity of 0.34 m/s. According to theory, sliding of a rectangular object occurs when
< 0.36 g and
> 0.32 g. For figurine F2, sliding occurred close to the theoretical value range.
3.2.3. Angle of Rotation
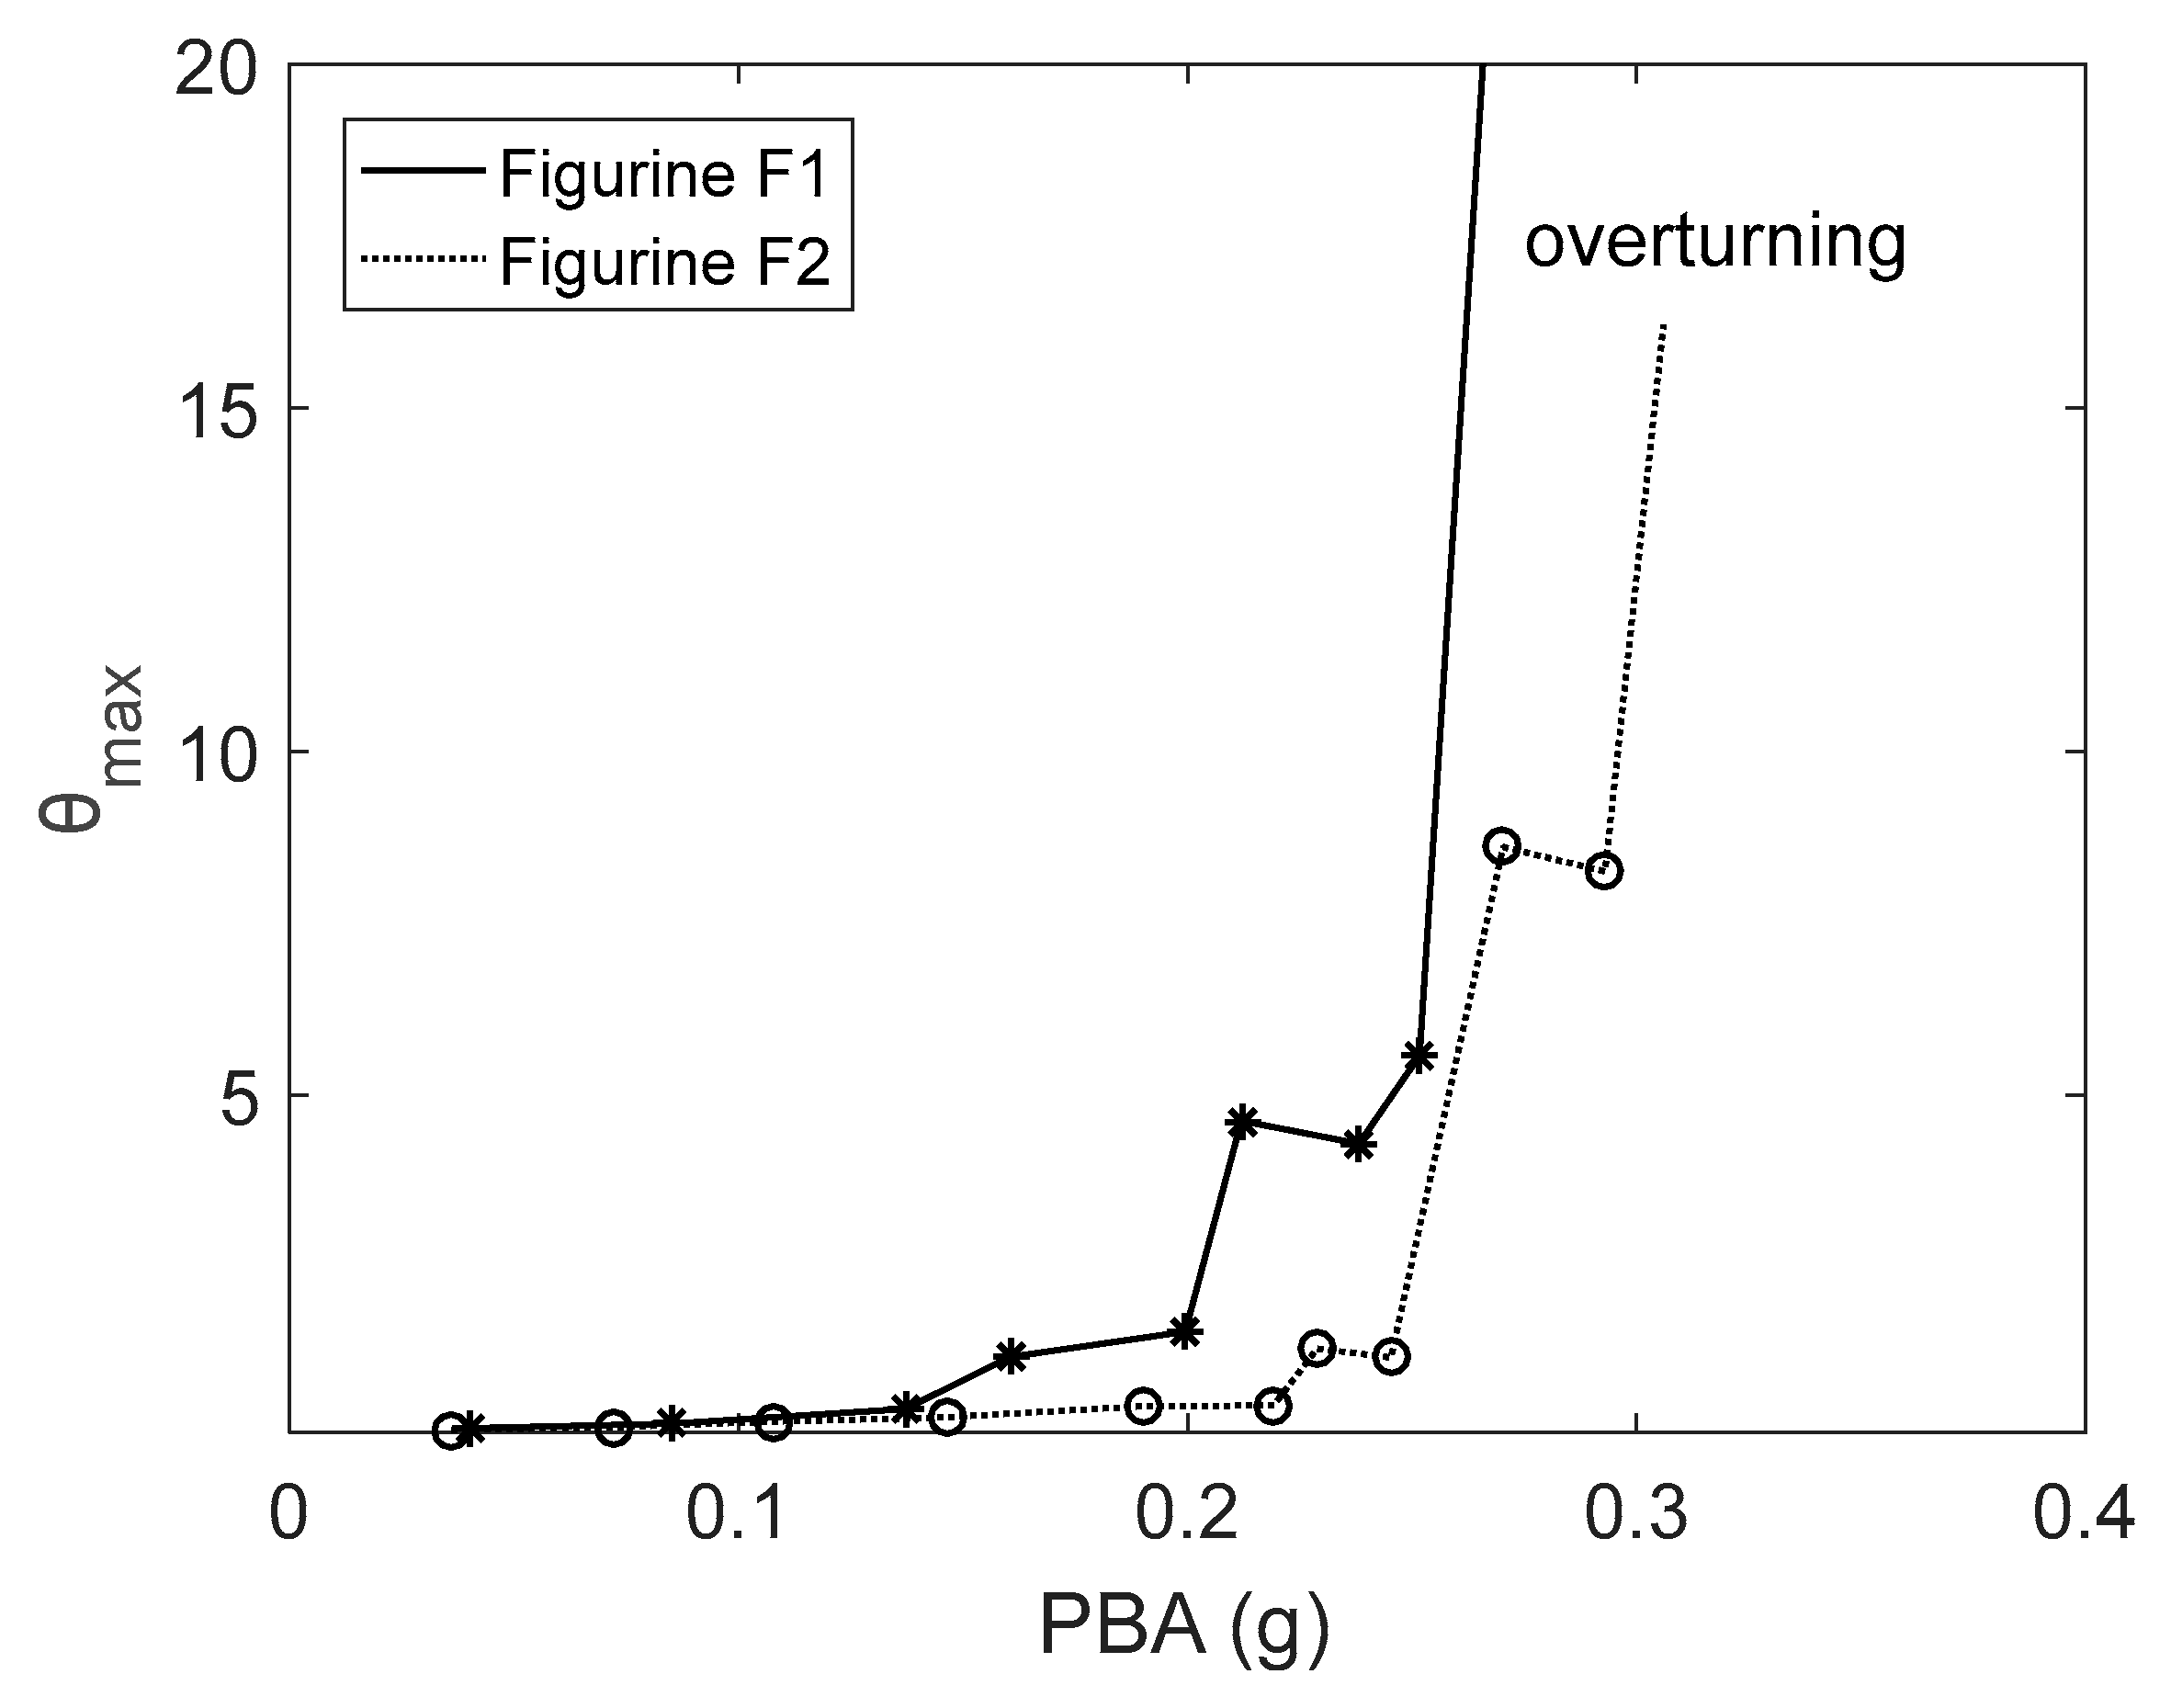
The motion of the two figurines was confined in a plane parallel to the direction of excitation when the steel base of support with attached felt was used. Since the displacement of the top and bottom parts was measured, and the height of the figurines was known, the angle of rotation that occurred during rocking could be calculated.
Figure 15 presents the maximum angle of rotation during rocking with respect to the peak base acceleration. Due to its geometrical features and uneven base, figurine F1 began rocking at a lower level of excitation, exhibited larger angles of rotation, and overturned at a lower excitation level than figurine F2.
4. Conclusions
This paper aimed to address the lack of experimental research by studying the dynamic behavior of replicas of small ancient art objects. The effect of excitation frequency on the dynamic response of the small artifacts was examined. It was found that the higher the frequency of excitation, the stronger the level of excitation needed to cause the object to fall. In addition, the effect of the coefficient of friction on the dynamic response of small artifacts was examined. A high coefficient of friction led to the object falling at lower excitation levels but reduced sliding, rotation, and translation. This is an important consideration when the objects or the walls of the exhibition cabinet are in close proximity. In addition, a high coefficient of restitution in rocking motion increased the object’s rotation about its vertical axis at high excitation levels.
Rotation of an object can sometimes be beneficial, aligning its stronger side of the object parallel to the direction of excitation and increasing the chances of surviving a fall. The experimental results differ from theoretical predictions, particularly regarding the excitation level at which rocking begins. These discrepancies are primarily due to geometric irregularities and small imperfections, especially at the object’s base.
Future studies can evaluate the existing techniques used in museums to exhibit artifacts and propose new ones to enhance their seismic safety.


