Article

Climate Pressures on Intangible Heritage

by
Jenny Richards
1,† and
Peter Brimblecombe
2,*,†
1
St John’s College, Oxford University, Oxford OX1 3JP, UK
2
School of Environmental Sciences, University of East Anglia, Norwich NR4 7TJ, UK
*
Author to whom correspondence should be addressed.
These authors contributed equally to this work.
Heritage 2025, 8(10), 407; https://doi.org/10.3390/heritage8100407
Submission received: 20 August 2025 / Revised: 17 September 2025 / Accepted: 25 September 2025 / Published: 28 September 2025

Abstract

Intangible heritage comprises a wealth of knowledge, crafts, and skills that are passed down through the generations, embodied in our cultural practices. Many of these intertwine with landscape and environment; so, they are sensitive to climate change. While there have been studies of the impact of climate change on intangible heritage, these typically use heritage as a lens to examine climate impacts. There are few assessments of specific climate processes that threaten heritage. A climate-based approach allows researchers to identify mechanisms of change and quantify past impacts and project these into the future to give a sense of management options. We explore the threats to UNESCO domains of intangible heritage using weather and climate data from a range of sources to assess threats demonstrating the importance of data-informed approaches and show that timing of season and frequency of extreme events are important in climate-based assessments. These play out over different spatial and temporal scales that reveal elements of sensitivity to environmental change. The management response to the climate threat seems in need of a rights-based approach to empower those who own, safeguard, or practice the heritage. Research to enhance conservation should be translated into a form that speaks to local values and social structures.

1. Introduction

Climate and environmental change has detrimental effects on our global heritage [1], with projections indicating increased threats over the next century [2]. There is a rapidly growing body of literature quantitatively evaluating the threat these changes pose to tangible heritage and historic materials [3,4,5], but such quantitative approaches have been less evident for intangible heritage.

1.1. Intangible Heritage

Intangible heritage is a broad concept that is difficult to define and subject to local interpretation. UNESCO (United Nations Educational, Scientific and Cultural Organization) regards intangible heritage as the wealth of knowledge and skills that is passed down through generations [6] and have identified five key domains:
  • Oral traditions and expressions, including language as a vehicle of intangible cultural heritage;
  • Performing arts;
  • Social practices, rituals, and festive events;
  • Knowledge and practices concerning nature and the universe;
  • Traditional craftsmanship.
These domains can be a useful starting point for considering the breadth of intangible heritage. However, UNESCO admits that “There is already a wide degree of variation, with some countries dividing up the manifestations of intangible cultural heritage differently, while others use broadly similar domains to those of the Convention with alternative names” [6]. Nevertheless, the list gives us some sense of the experience, expression, practice, and production that embodies intangible heritage and thus provides a helpful framework for analysing the impacts of climate change.
Intangible heritage is created and passed on through social activities and human performances. Such heritage is mutable and can change over time through mimetic processes that see it evolve [7]. Understanding the embodiment of these practices and how this relates to their environment is necessary for assessing how intangible heritage might be preserved for the future [7]. However, it can also be difficult to distinguish between tangible and intangible heritage e.g., in the case of craft skills, the knowledge and skill of making the object is intangible (e.g., weaving) but can lead to the creation of a tangible product (e.g., a basket). Furthermore, intangible heritage also takes place within a wider ecosystem; so, for example, the practice of fishing is imbued with knowledge and skill of the best locations or techniques for making catches, but it also will be affected by levels of fish stock and species diversity. Therefore, we recognise that tangible and intangible heritage are not binary opposites [8] but are part of a spectrum. Thus, intangible heritage can often include material elements or involve the use of objects. We will focus on heritage that strongly engages intangible elements, though we also explore links with the tangible.
The impacts of climate change on all aspects of natural and social systems are increasingly recognised [9]. However, there has typically been a greater concern for processes that directly relate to political and economic strategies. This has meant that the impact of climate change on localised material and symbolic values can be undervalued [10]; for example, Harrison [11] highlighted the effect of climate change on indigenous music, recognising it is “often without material references or inclinations” [p. 28].
Intangible heritage can be sensitive to changes in climate due to its situational nature, which means it is constantly recreated and passed down through generations. This can result in a sensitivity to changes in the environment in which it is undertaken that can also affect the experience and transmission of such heritage. UNESCO has instigated three initiatives to improve the safeguarding of intangible cultural heritage in relation to global challenges. One of these thematic initiatives focuses on climate change, and the Final Declaration was adopted at MONDIACULT2022 [12]. Furthermore, there is an inherent relationship between intangible cultural heritage and Sustainable Development Goals [13], but pinpointing the exact nature of the relationship and potential threats has been limited. In terms of the ways climate affects intangible heritage, it is useful to undertake work that looks more specifically at the way various elements of the climate are likely to pose threats.

1.2. Assessing Climate Change Impacts

Previous research assessing the impacts of climate change on intangible heritage has typically evaluated the threat by assessing the changes seen to the heritage, e.g., [14]. Many such studies use heritage as a lens to examine climate impacts. Taking a heritage-based approach to assessing the effects of climate change enables an in-depth assessment of impacts on specific heritage practices. However, there has been less concerted effort to assess the specific climate processes that threaten heritage, the mechanisms for change, or the temporal and spatial scales at which these act. This has made it uncommon to attribute specific elements of climate to the effect it has on heritage [5,15]. Consequently, while recognising the importance of climate change, many studies tend to be unclear about the particular climate conditions likely to bring about such changes. Orr et al. [5] further argue that some 60% of the studies on climate change and heritage do not specify a timescale for change.
Research into impacts of climate change on heritage can benefit from a climate-based approach, where climate is the lens through which the research is undertaken. We have previously argued for the need for a heritage climatology, where traditional climate metrics are refined to address specific processes that affect heritage [16]. A climate-based approach enables researchers to identify mechanisms of change, quantify past impacts, and project these into the future. However, climate data such as temperature, precipitation, sunshine, wind speed and direction, and relative humidity are not always in a form that makes it directly relevant to the threat it imposes on heritage. For example, temperature is one of the most common features of climate that is referred to when discussing climate change, but it is the specific characteristics of temperature that pose a threat, for example: (i) extreme temperatures can impact people’s ability to safely undertake certain actions, (ii) growing degree days can alter harvest dates; and (iii) seasonal temperatures can affect the timing of biological processes important for traditional ceremonies. Furthermore, it is likely that records may not be available over the right duration or the appropriate sampling frequency, and in some countries meteorological data are not collected at high spatial resolution; so, they may only be available for major cities or key airports. Climate data from sources such as meteorological agencies, homogenised datasets (e.g., the ERA5 reanalysis of the European Centre for Medium-Range Weather Forecasts), or climate models (e.g., Coupled Model Intercomparison Project, CMIP) can represent a more broadly based source and thus be usefully applied to heritage more globally, particularly when it is tuned to an appropriate metric [17].

1.3. Data-Driven Approach

In this paper, we explore how a data-driven approach can be used to assess the relationship between climate change and intangible heritage. We investigate how it can help us develop a deeper and more nuanced understanding of the impacts and threats that future changes have on such heritage. We use the UNESCO domains as a framework to examine the relationship between climate change and intangible heritage, using a range of data sources to illustrate key processes. The work also explores how factors such as place, timing and duration of activities, spatial and temporal scales, and sensitivity of heritage to change are important for understanding climate change impacts. This will be achieved by providing worked examples that apply a range of open-source climate datasets to forms of intangible cultural heritage as defined by UNESCO domains and make broader links from these to other forms of intangible heritage. Through this, we construct a heritage–climate approach, designed to help conceptualise and investigate specific links between climate and forms of intangible cultural heritage. We do this to support of our hypothesis that climate change can be parameterised in such a way that it reveals the likely effect it will have on intangible heritage.

2. Materials, Data, and Methods

2.1. Data Sources

Data are needed to provide valuable sources of evidence to understand how changes in climate may affect intangible cultural heritage. There is no single best format for data; these come in a wide range of forms and formats. For example, data can be sourced from historic observations of weather events, climate model output for past and future scenarios, information on human actions, and equations for assessing the relationship between climate and human behaviour. It is important to consider the differences between weather and climate. While, weather considers the conditions at a given time, climate refers to long-term weather patterns. It may be restricted to a few meteorological parameters but might also describe the entire climate as reflected in a climate zone (e.g., arid zone) or Köppen class (e.g., continental climate class).
Accessing the relevant data can sometimes seem challenging. However, there are many open-access sources that provide useful weather and climate data. Therefore, irrespective of a researcher’s computational skill or previous knowledge of climate data resources, climate data are likely available in some accessible format (see Table 1). For example, the World Bank Climate Change Knowledge Portal and the IPCC [18] websites provide detailed climate data on current and future climate variables, including extreme events for individual countries and regions. These datasets, though simple to access, may require basic computational skills to analyse them more thoroughly. These data can be downloaded to a .csv file for analysis in software such as Microsoft Excel (as part of Microsoft 365) or as input to more specific computer programs. The websites also provide graphical tools to give output as seasonal and annual trends for a range of climate variables. These World Bank and IPCC tools are a particularly good starting point for research questions aimed at understanding how climate change will affect intangible cultural heritage at a regional or national scale and can investigate past and projected future changes.
Open-access data sources also include published weather station data (e.g., European Climate Assessment and Dataset) and archival records. While these records only provide historical data (i.e., they do not include future predictions), if a weather station is located near a site or area of interest, it can yield a rich source of information on the micro-climate of the site and at high temporal resolutions (e.g., minute or hour resolution). Furthermore, a wealth of data has yet to be digitised, with for example, archives of weather observations, diaries and shipping logs representing potential sources of climate data. These sources can be more time consuming to engage with, but can provide new and unique datasets for analysis [19].
Many climate model and reanalysis datasets are also available open access through interfaces such as the Earth System Grid Federation (ESGF) archives. These can provide the greatest spatial coverage and flexibility in application. However, they require more advanced computational skills to access, and they require users to engage with large datasets in file formats such as NetCDF.

2.2. Metrics

As an analytical tool we have created climate metrics that are relevant to intangible heritage from meteorological data. Climate data, such as temperature, precipitation, sunshine, wind speed and direction, and relative humidity, are not always in the form that makes these data directly relevant to the threat [20] they impose on intangible heritage. Therefore, data almost always need some form of processing, to capture the physical processes driving the change in the intangible heritage. In many instances, identifying these physical processes can be challenging, as it requires separating out the drivers of change. However, to help identify these processes, it can be useful to consider the following questions:
  • What meteorological conditions would prevent humans from being able to perform a given activity required for intangible heritage to be practiced and passed on?
  • What conditions are needed for the environment or setting to be conducive for intangible cultural heritage?
  • What conditions would hinder the availability of key resources needed for intangible heritage?
The answers to these questions will help focus data on the relevant processes that drive change. We examine a range of intangible heritage domains and climate impacts to explore how these data can be effectively applied to understand the climate threats to intangible cultural heritage.

3. Results and Examples

3.1. Oral Traditions and Expressions

Oral traditions and expressions include “proverbs, riddles, tales, nursery rhymes, legends, myths, epic songs and poems, charms, prayers, chants, songs, dramatic performances…” [6], p. 4. Language plays a pivotal role in their creation and performance and is a living practice. There are many factors that affect how language changes over time, such as new technology, but a changing environment and climate can also play an important, if sometimes subtle role. This is part of the Sapir–Whorf hypothesis, which suggests linguistic relativity with vocabulary and features of a language shaping the speakers’ view of the world; words are powerful in drawing attention to things that are perceived as valuable [21].
The best-selling book, The Lost Words by Robert Macfarlane [22], illustrated by Jackie Morris was written in response to the removal of words associated with nature in the Oxford Junior Dictionary; these were replaced with words associated with technology. Macfarlane highlights that these changes in language are not solely driven by social change but also stresses the importance of language in addressing the biodiversity crisis, driven in part by climate change. “We’ve got more than 50% of species in decline. And names, good names, well used can help us see and they help us care. We find it hard to love what we cannot give a name to. And what we do not love we will not save” [22].
Beech is given as one of the lost words in the book. Beech trees (Fagus sylvatica) are native to the UK and can grow to over 40 m tall, providing a range of habitats for birds, mammals, insects, and fungi. They are often considered as the queen of British trees, and their branches have traditionally been used for divining water [23]. The population and distribution of beech trees are projected to decrease with increased drought severity [24] and elevated CO2 composition of the atmosphere [25]. Furthermore, the leaf-out date (the date of tree greening) is projected to arrive earlier under future climates. Wang et al. [26] and Martinez del Castillo et al. [24] show that there is a strong relationship between the location of beech trees in Europe and the mean annual temperature and rainfall. Beech trees are not typically found in regions where the mean annual temperatures rise above 12 °C; or where mean the annual temperatures are below 7 °C along with rainfall below ~600 mm a−1.
The impact of future climate change on the distribution of beech trees in the UK was assessed using CMIP6 data available from the World Bank Group Climate Change Knowledge Portal at a resolution of 25 km × 25 km [18]. These data are freely available from the Climate Knowledge Portal [18] and can be downloaded to .csv files that can be readily analysed using simple Microsoft Excel functions or transferred as input to computer programs. The data allow us to assess the past and projected future mean annual temperature and precipitation conditions for England. These data are used to assess the decadal changes in the mean annual temperature and precipitation from the 1950s to the 2090s under a high emissions scenario (ssp585). Figure 1 shows that annual precipitation in England remains around 800 mm a−1 between 1950 and 2100, but there is a substantial increase in the mean annual temperature from 9.2 °C in the 1950s to over 13.5 °C by the 2090s. This suggests that conditions in England will move beyond the optimum temperature for beech trees around the mid-21st century. Thus, one could envision that this additional climate stress would result in fewer beech trees being present and thus further threaten the presence of ‘beech’ as a word used within our lexicon.
The potential for reduction in the use of certain words due to shifts in climate is not only occurring in the English language but is also seen in the language of the Sámi people of northern Norway, Sweden, Finland, and the Kola Peninsula. Linguistic shifts paralleling climate change are increasingly found as “knowledge outdoors and in nature are lost, i.e., the thousands of Sámi words for snow, reindeer husbandry skills, reading of and preparing for different kinds of weather” [27].
Furthermore, climate and extreme weather can influence language in terms of the way it is used to convey meaning. Metaphors, as an example, frequently adopt the pathetic fallacy that attributes human emotion and conduct to natural things, e.g., “The use of setting, scenery or weather to mirror the mood of a human activity. Two people having an argument whilst a storm breaks out is an example” [28]. A changing climate and the frequency of notable weather events (storms, floods, and cold winters) can also be a source of inspiration. A heat wave resulting from the hot July of 1900 in Norfolk served as a backdrop to Hartley’s novel The Go Between [29], and its stormy end reflects a tense episode within the novel. Such examples suggest that in addition to evidence from meteorological records and climate models, data for assessing such past impacts can be drawn from archival documents [30], such as casual weather diaries [31], ships logs [32], literary works [33], or visual materials such as paintings [34].

3.2. Performing Arts

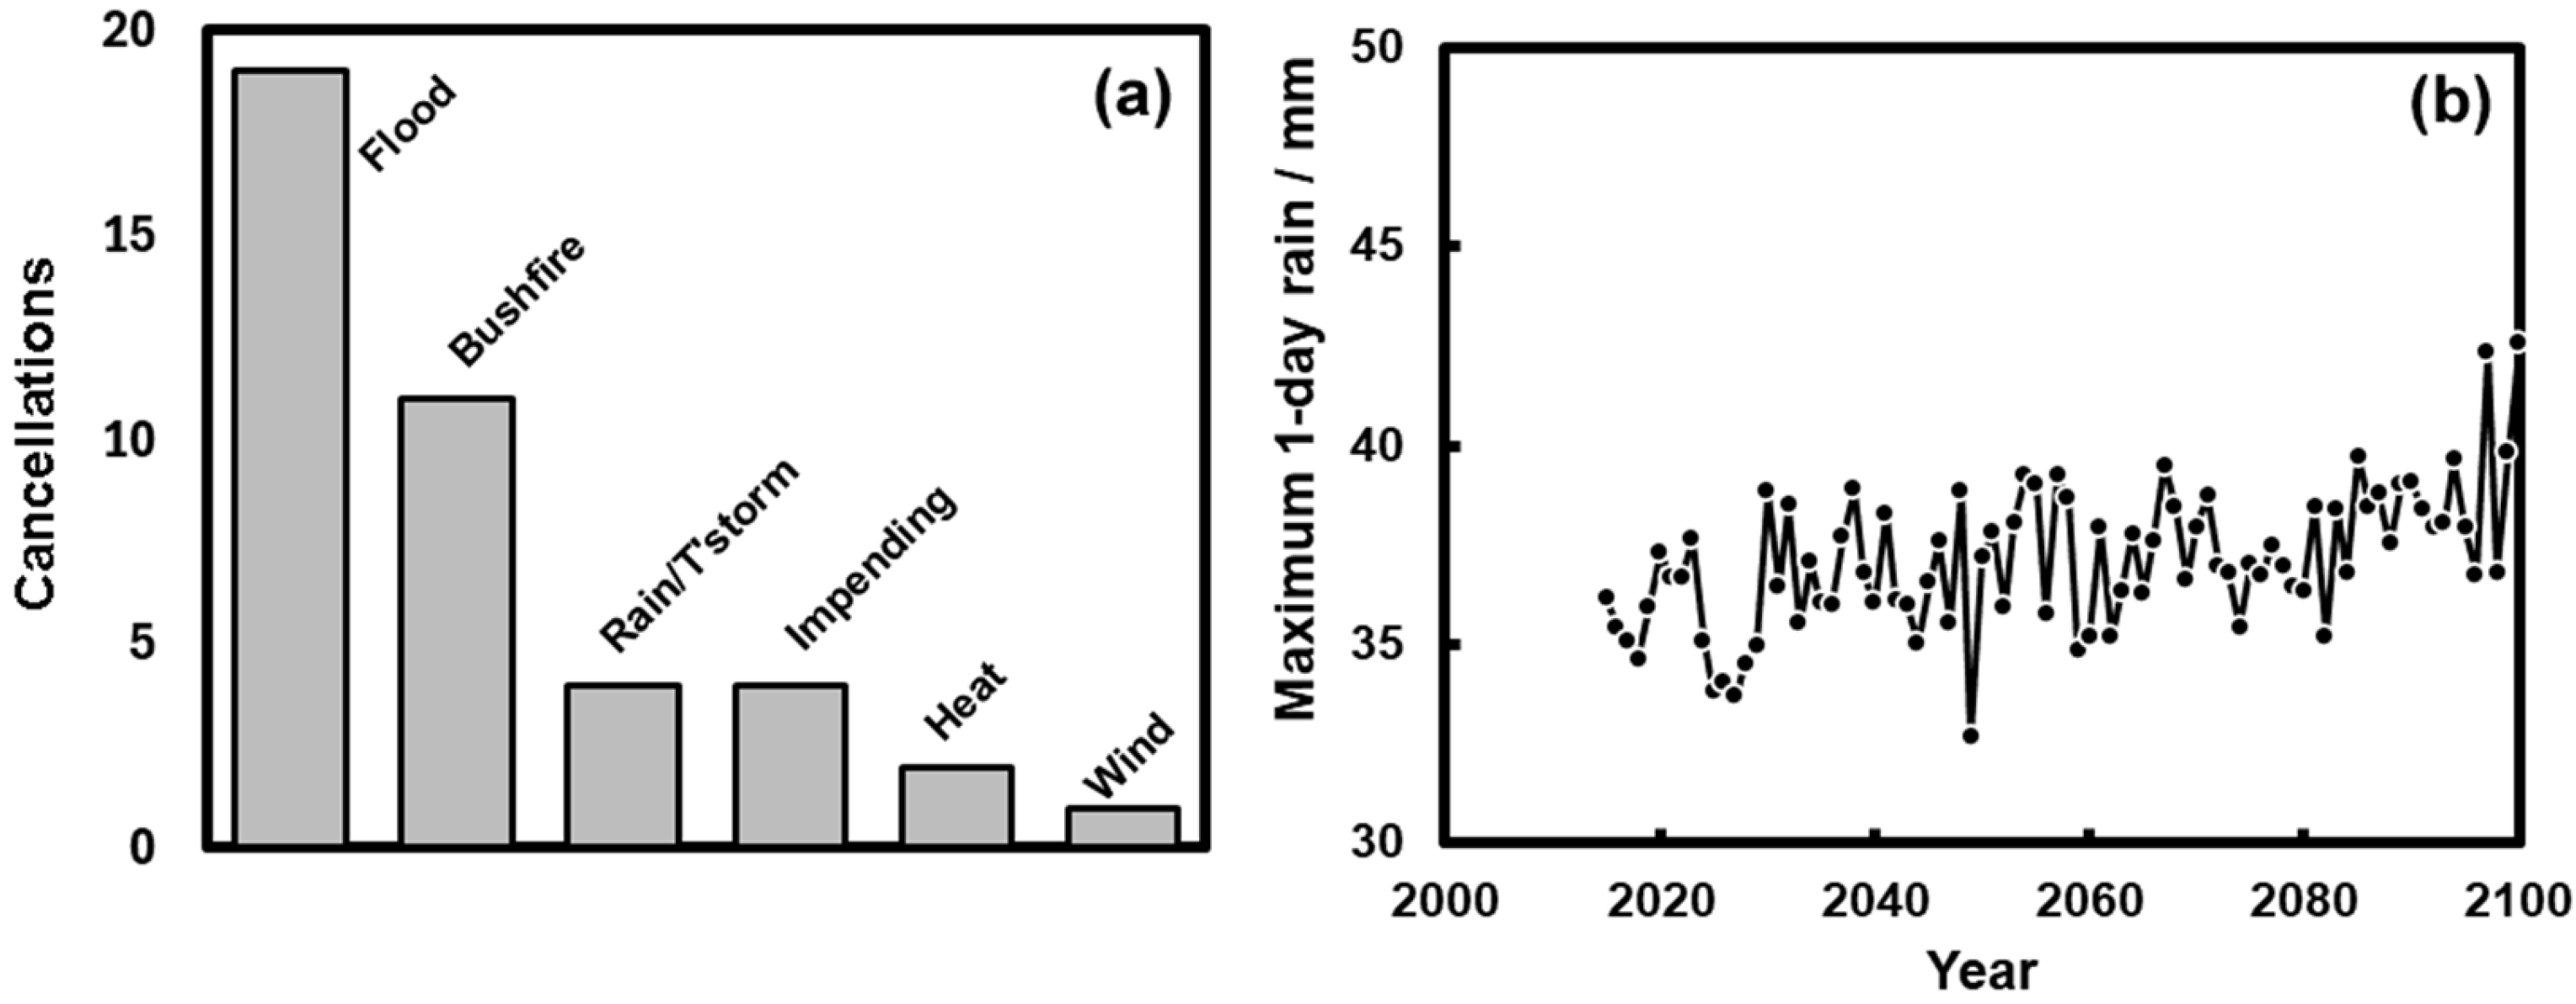
Performance can be directly affected by weather and climate, particularly where performances take place in exposed environments (e.g., outside). Outdoor concerts are very sensitive to weather [35]; so, it can especially be a problem for festivals, as many music and dance festivals are held in remote locations, where it boosts the regional economy [36]. In Australia, there has been concern that the changing climate is increasingly causing music festivals to be cancelled, especially where these are affected by extreme weather events such as floods and bushfires. Green and Strong’s [35] data show that, over the last decade, heavy rain and flooding have been the dominant cause of cancellation (Figure 2), while increased temperatures may have an important role in increasing the frequency of bushfires [37] and have lengthened the bushfire season [38]. In addition to the obvious threat posed by the fires, a further problem for festival attendees is caused by the potential health impacts on concert goers from the increased particle loads associated with bushfires [39].
The data provided by Green and Strong [35] were based on historic observations. However, model data can also be used to assess how these threats may change over the coming century. For example, the changing climate in Sydney has been summarised by Dean and Green [39]. When compared to a baseline period 1986–2005, the average annual temperature is projected to increase by 2.9 °C to 4.6 °C by 2090, and the number of days off extreme heat (>35 °C) is projected to increase from 3.1 days (average for 1981–2001) to between 8.2 and 15 per year by 2090. This has considerable potential for making heat an increasing problem for outdoor performance, although at the moment it is a relatively rare cause for cancellation. Furthermore, the maximum daily rainfall (Figure 2b) is projected to increase with rising temperatures [40]; so, it poses an enhanced threat to concerts from incidences of intense short bursts of intense rainfall, which could lead to more frequent flooding, particularly if the bursts follow a dry spell.
Such impacts are not unique to festivals, as weather also affects outdoor plays. As an example, O’Malley [41] argues that Shakespearean plays are often performed outdoors in summer months, such that the audience may be united by their experience of the weather. Mild weather can make the experience pleasurable, while more extreme weather can even create a sense of challenge [42]. Additionally, Luckman [43] suggests that the realities of weather enliven the location with agency and experience. Although inclement weather may be seen as having negative impacts, some argue that the very act of outdoor dance embodies an enriching experience of severe weather [44]. In other cases, performances are undertaken in special locations and over extended periods that can make them vulnerable to a range of climate threats. For example, the Hudhud Chants of the Ifugao in the Philippines are performed during the sowing season, rice harvest, and funeral wakes [45]. These can involve an elderly woman, the community’s historian, or preacher, retelling the communal history that can last several days [6].
Climate and weather also inspire artistic output and exhibitions. In some cases, the relationship between art and climate change can be very obvious and may even be that the production is motivated by climate change itself. For example, visions of landscapes are a frequent focus in many art forms, and such landscapes can be sensitive to changes in climate. This is especially seen in the cryosphere, which is seeing dramatic increases in temperature [46]. Art has become a progressive tool that can highlight climate change impacts on the environment rather than just illustrating the aesthetic beauty of landscapes. There have been exhibitions dedicated to the loss of glaciers (e.g., Watching the Glacier Disappear, https://artforglaciers.ch/en/ (accessed on 23 May 2025), and artists are using art installations to present the sounds of a retreating glacier (e.g., Sounds of a Dying Glacier; https://www.youtube.com/watch?v=EzL7ggJum2Q (accessed on 23 May 2025). Here, climate change could be seen as a driving force behind the creation of art, and such influences could be captured using metadata on relevant exhibitions and multi-media installations.

3.3. Social Practices, Rituals, and Festive Events

Many social practices are likely to be affected by a changing climate. Sport provides an opportunity for a community to come together to support their local or national sports person or team. A range of sporting celebrations have become part of the UNESCO Representative List of the Intangible Cultural Heritage of Humanity e.g., Silat (inscribed 2019) that represents Southeast Asian martial arts with music and ceremonial aspects or Bökh (inscribed 2010), which is Mongolian traditional wrestling, central to Mongolian festivals such as Naadam. Sport forms an important part of an individual’s or community’s sense of identity, either through participating in the sport or being a spectator to an event, e.g., [47]. Outdoor sports are particularly sensitive to weather and climate, such that extremes in particular, can result in sporting events being unable to take place, affecting not only the sporting endeavour but also the logistics around organising events and their financial backing [48].
Many outdoor sports are seasonal; so, they are undertaken when the required conditions needed for the sport are prevalent (e.g., skiing needs snow). However, changes in climate mean the conditions required for sports to take place are not always optimal (e.g., the snow or ice season could be shorter). Conditions can also pose a range of environmental-related risk factors on participants by exposure to low or high temperatures, ultraviolet radiation, severe winds, and hazards such as avalanches; see [49], for review.
Warming temperatures pose a challenge for many winter sports [50] that require snow- or ice-covered landscapes, e.g., [51,52]. The economic impact of skiing means that projected future climate threats have been well-researched with model data showing the threats faced from warmer climates and reduced snowfall posing a problem to ski resorts, particularly those at low altitudes. For example, some areas of the US are projected to experience a 50% reduction in season length for some downhill skiing locations by 2050 and 80% by 2090 [52].
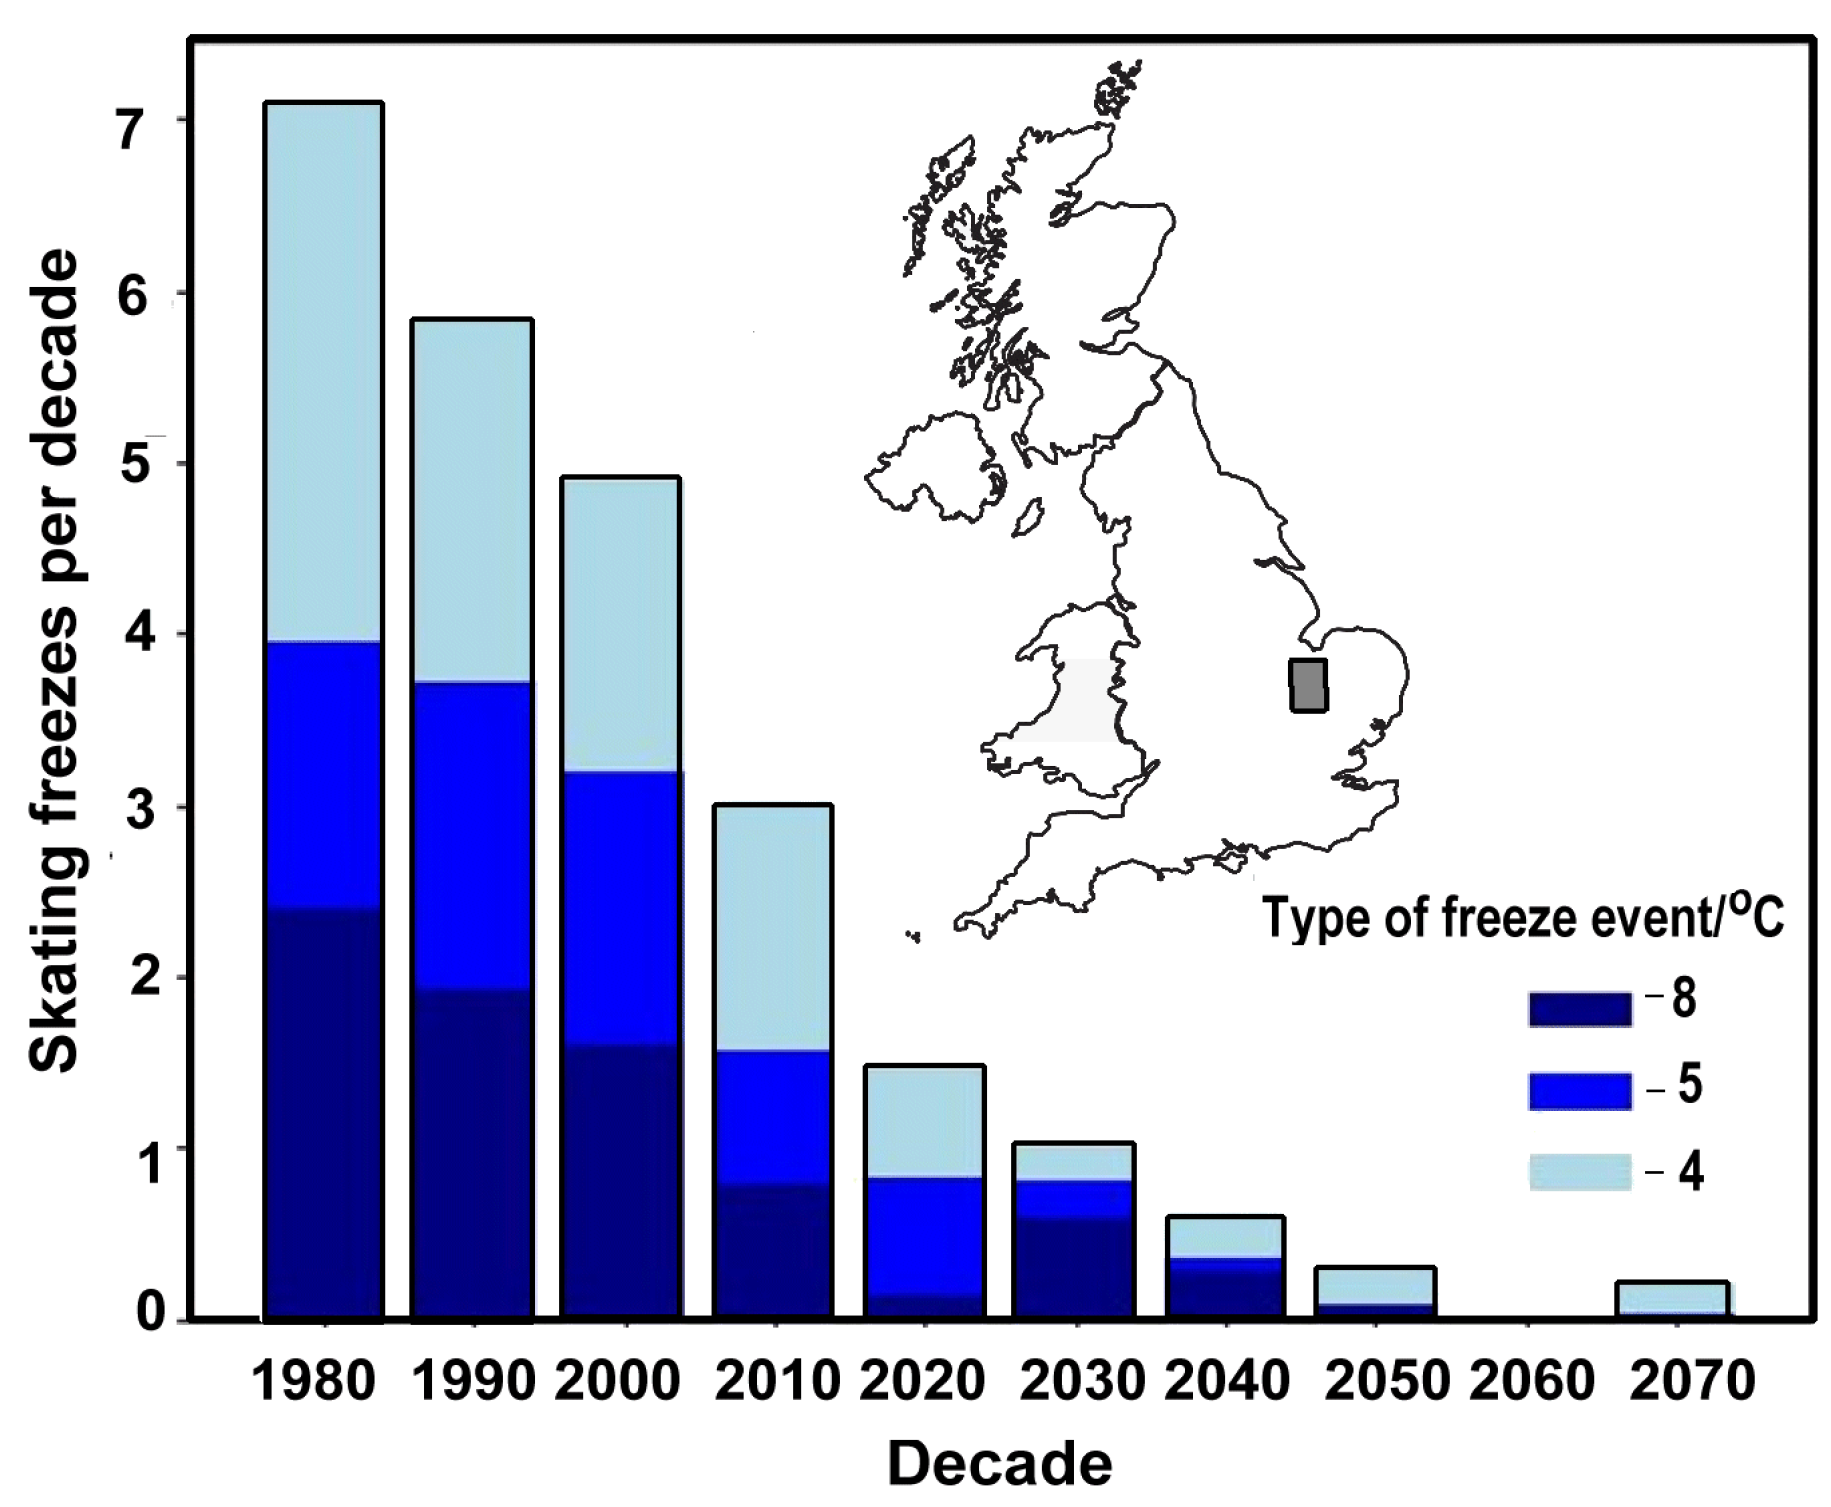
Outdoor ice skating has been less studied but plays an important part of cultural identities around the world, with skating being important in places such as China [53], Canada [47,51], the Netherlands [54] and the UK [55]. Warmer winters threaten the formation of ice required for these skating events. A skating freeze metric was constructed using local knowledge and newspaper archives by Richards [55]. The UKCP18 climate dataset (www.metoffice.gov.uk/research/approach/collaboration/ukcp last accessed 17 September 2025) was used to assess the future frequency and duration of freeze events in the Fenland region of the UK. This dataset is open access and provides a wealth of material on climate variables that can be post-processed to tailor the outputs to specific heritage applications. Effective engagement with this dataset requires the user to have moderate to good programming skills and the ability to work with large quantities of data.
The results from the analysis show a rapid decrease in the frequency of skating freezes over the coming century, with these becoming infrequent from the mid-21st century (Figure 3). As skating freezes become less frequent, opportunities for acquiring knowledge, for example about the best skating locations, will become more limited. Therefore, even if there was ice available for skating, the associated knowledge pertaining to the sport might be lost. There are suggestions that the sport could be moved to indoor ice rinks, but, for non-rink skating such as Fenland skating in the UK and marathon skating events in the Netherlands, this would lose the situational context, which is an important part of this cultural practice.
Summer sports are also affected by changes in climate. In particular, extremely high temperatures represent a threat to sport, with Mason et al. [56] highlighting challenges posed by heat for people undertaking and watching sport at events such as the Olympics. The threat posed by heat is well-documented in tennis, where heat rules are in place at major competitions. Wimbledon has implemented a heat rule that allows a 10 min break when the wet bulb globe temperature is at or above 30.1 °C [57]. The use of the wet bulb temperature includes a humidity component to the reading and so accounts for the evaporative cooling of the body. The Australian Open introduced a policy in 1998 that called for play on all courts to be stopped if the temperature reached 40 °C, which was changed to 38 °C in 2002, before implementing a 5-tier heat stress scale in 2019 based on the air temperature, radiant heat, humidity, and wind speed [58]. Furthermore, the Lawn Tennis Association (LTA) provides clear guidance on the acceptable levels of heat stress based on the air temperature and relative humidity [59]. If the heat stress index meets or exceeds an apparent temperature of 40.1 °C, play is to be suspended [59]. While these guidelines have been developed and adopted for tennis, the method is also applicable for other sports to help determine whether conditions are safe.
The LTA states that the air temperature and humidity data required for calculating this index can be found on the BBC website, weather app, and weather data, and there are online calculators to determine the heat stress caused by the conditions (e.g., https://www.calculator.net/heat-index-calculator.html last accessed 17 September 2025). Climate model output can also be used to assess how heat stress conditions are likely to change in the future. Heat stress at a global scale can take output from global climate models such as the CMIP6 (Coupled Model Intercomparison Project Phase 6) experiments. As with the UKCP18 datasets, these data can be downloaded from https://esgf-node.llnl.gov/ (last accessed 17 September 2025) as NetCDF files but requires programming knowledge to engage with the data.
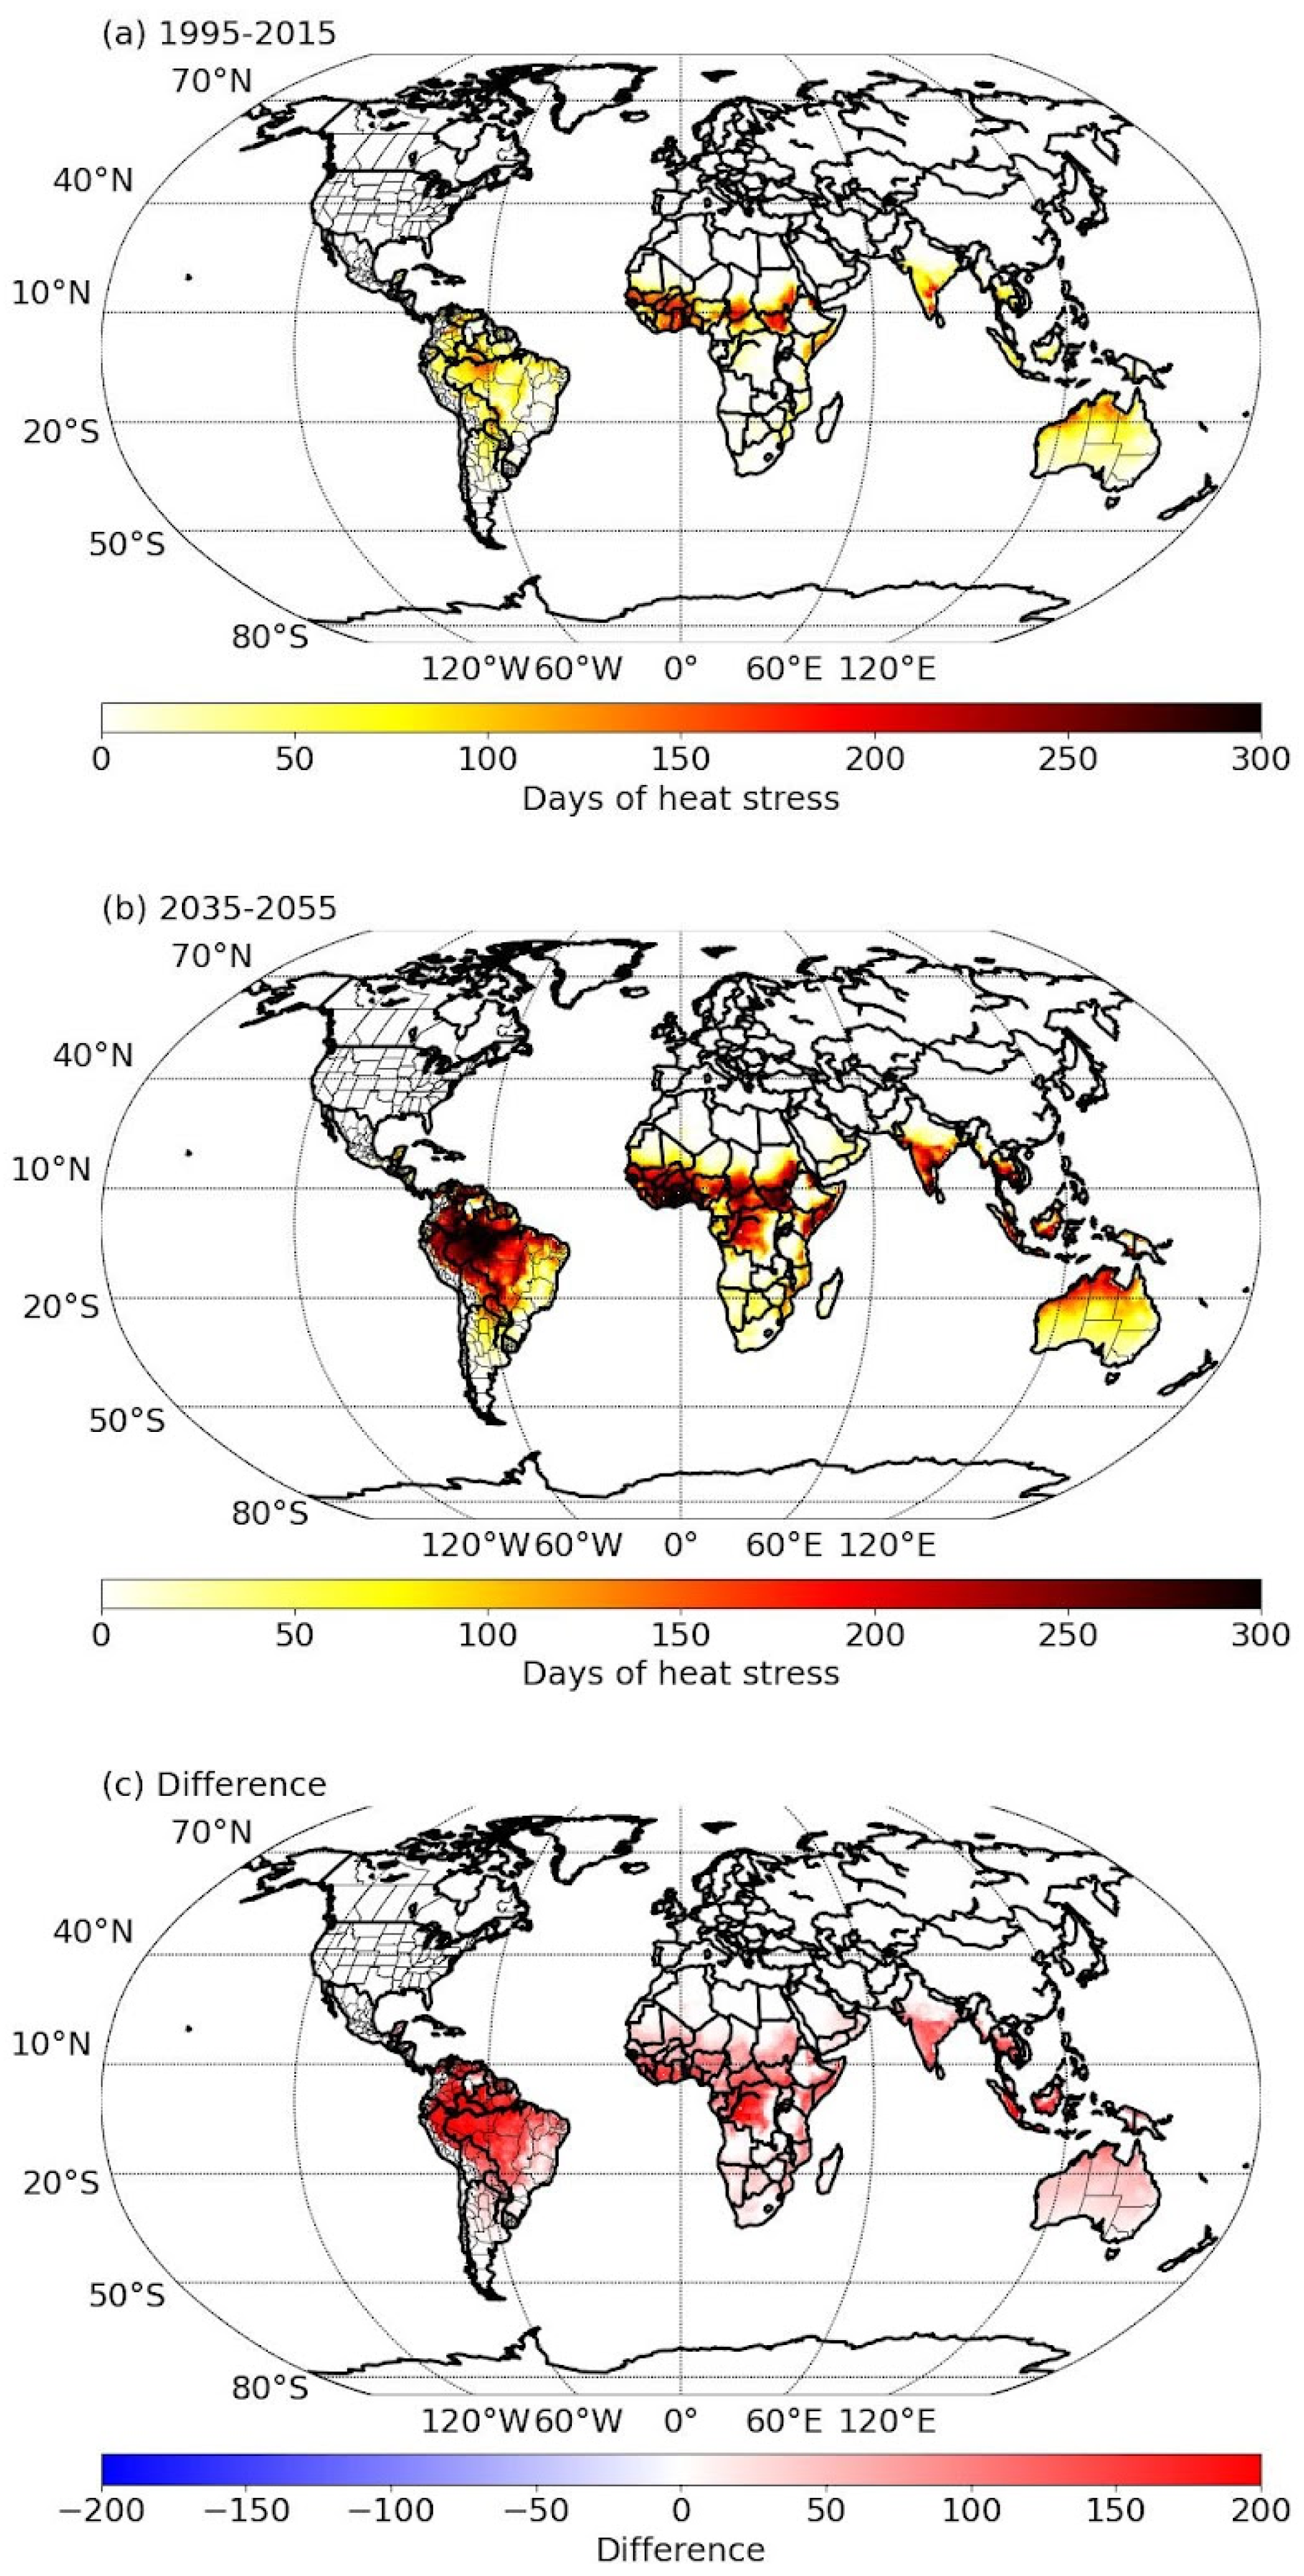
We used one of the CMIP6 models, HadGEM3-GC31-MM, to assess the number of days per year where the apparent temperature exceeds 40.1 °C in 1995–2015 and 2035–2055 under a high emission scenario (ssp585). Figure 4 shows that historically, areas frequently experiencing high heat stress days are located between ±30° latitude, with areas of West Africa likely to have >150 days of high heat stress per year. By 2035–2055, there will be a significant expansion of the areas experiencing high heat stress days and an increase in the number of these each year. This is particularly notable in South America, Central Africa, India, and Southeast Asia. Such changes are likely to make playing sport in summer months challenging and potentially dangerous. For example, in India, cricket is deeply embedded in the country’s culture and daily life and is often referred to as the “religion of India”. However, increases in heat stress could lead to exhaustion and dehydration for players and disrupted schedules. Pitches may become dry and cracked, potentially making them ideal for fast bowlers or spinners, although this could make it more difficult to swing the ball.
Climate plays an important part in our relationship with food. Washoku (inscribed by UNESCO in 2013 as Intangible Cultural Heritage), the traditional dietary culture of Japan, emphasises the importance of seasons: bamboo shoots and Sakura shrimp in spring, sweetfish (ayu) in summer, matsutake mushrooms and chestnuts in autumn, and fatty yellowtail (buri) or daikon in winter. In Korea Kimjang or Gimjang (inscribed by UNESCO in 2013) emphasises the collective production and sharing of kimchi as winter approaches. In the West, we can also find examples of the way in which a changing climate alters our food choices. In winter, mixed grill, French toast and Belgium waffle are more frequent purchases in restaurants [60], while ice cream and cold drinks are more popular in warm sunny weather [61]. Iced deserts play an important part in the iconic cuisine of many countries, e.g., Kakigōri in Japan or gelato in Italy. The relationship between ice cream and temperature has been apparent for so long that it has become an exercise for high school students [62]. Nevertheless, the issue may be complex, as the relationship between ice cream sales and temperature may break down when temperatures are very high. This was apparent during the European heatwave of July 2023, with Graeme Pitkethly, the CFO of major ice cream maker Unilever saying that it can be too hot for ice cream: “there’s a sweet spot for temperature… When it gets too hot, people move away from ice cream and buy a cold drink instead” [63]. Sales figures coupled with temperature observations from local weather stations could be used to examine the relationships between food and climate.
Weather and climate conditions also affect cultural practices which involve travel. For example, pilgrimages have been undertaken for thousands of years, typically for religious reasons, to seek spiritual growth, companionship, personal reflection, or fulfilment of religious duties. Pilgrimages are undertaken around the world with famous pilgrimages including the Hajj in Mecca (Islam), Saudi Arabia; the Way of St. James to Santiago de Compostela (Christianity) in Spain; Varanasi along the Ganges (Hinduism) in India; and Mount Kailash (Buddhism) in Tibet. Undertaking lengthy pilgrimages can be physically arduous through exposure to outdoor extremes. High temperatures have caused dangers to pilgrims on the Hajj during summer seasons [64,65], increased heat waves and heavy precipitation events affect the mountainous routes travelled by pilgrims walking the Camino de Santiago to Santiago de Compostela [66], and projected increases in temperature will impact pilgrims travelling by foot in Ethiopia [67]. Information on the conditions that affect the performance of such cultural practices can be garnered from oral testimonies, along with weather observation or climate model outputs.

3.4. Knowledge and Practices Concerning Nature and the Universe

Knowledge and practices concerning nature and the universe are developed and shaped by community interactions with the natural environment [6] and underpin many value and belief systems and social practices. Here, we examine some examples of intangible cultural heritage including rainmaking, farming, and the use of sacred groves.
Many societies have cultural practices centred around understanding and predicting rainfall, reflecting the importance of water for survival. Rainmaking is undertaken around the world with, for example, Native American tribes perceiving weather patterns and undertaking rain dances; shamans in ancient China performing sacrificial ceremonies [68], and cat-bathing practices in Malaysia [69]. Rainmaking also forms an important cultural practice across many regions of Africa, which can be undertaken as an individual or community practice [70]. For example, the Njele shrine in the Matobo Hills of Zimbabwe is visited annually by rainmakers in August and September ahead of the rainy season.
Rainmaking is based on knowledge of seasonal climate. As changes in climate cause rainfall patterns to alter, this makes predicting rainfall events more challenging. Christian [70] argued that changes in climate are increasingly making knowledge held by rainmakers obsolete as it does not reflect present conditions. The IPCC WGI Interactive Atlas (https://interactive-atlas.ipcc.ch/ last accessed 17 September 2025) provides a user-friendly graphical interface to explore annual and seasonal trends in climate variables such as precipitation. Future scenarios are projected using CMIP6 model data under a range of low and high emission scenarios. Outputs are viewable as summary plots and can be exported as .csv or .png files. This provides a valuable source of climate data but requires interpretation to translate outputs into impacts on intangible cultural heritage. These data are shown in Figure 5, where the mean monthly rainfall between May and November is projected to decrease by up to 50% by 2100 in East Southern Africa under a scenario of 1.5 °C warming. The magnitude and rate of these projected changes are unprecedented in terms of previous lived experience. Therefore, successful prediction of rainfall by rainmakers in future will not be able to rely on a knowledge of past events. Rainmakers will have to adapt the timing of their practices to reflect a changed climate.
In addition, climate change has already affected farming practices around the world by shifting the growing dates of crops [71,72]. In Germany, spring barley is harvested 16 days earlier than in the 1960s, while harvesting winter wheat has been brought forward 11 days [73]. Higher temperatures may cause premature ripening and oblige farmers to harvest grains within shorter periods, so that the grains have the correct moisture content. For many farming communities in Africa, as in Kenya, South Africa, and Burkina Faso, it may be important to adapt to climate change by altering the sowing dates for crops [74,75]. The climate can also affect crop yields, with those for potato reduced at higher temperatures, though this can be slightly offset by increased atmospheric CO2 concentrations [76]. Furthermore, it is not just food production; if crops fail, this also affects celebrations surrounding the harvest [70]. Temperature and rainfall are key parameters to assess these impacts, especially growing degree days [71] and seasonal rainfall, but a number of more complex parameterisations are available, see [73]. Data from websites such as the World Bank [18] provide a useful starting point along and can potentially be combined with information from diaries, yield figures, and weather stations.
Sacred groves provide a combination of cultural, spiritual, ecological, and traditional values; so, they are traditionally protected due to their significance in providing knowledge and a setting for rituals and practices important to community identity. Changes in climate are likely to affect the species composition, with Gyedu et al. [77] collecting field data to assess the relationship between tree species composition and environmental variables. Both rainfall and temperature were found to explain approximately 20% of the variation in tree species composition, making this sensitive to future changes in climate. Findings from such academic research can be used to explore how changes in species composition could alter people’s relationship with the grove and the ecological knowledge provided by the diversity of the species present.

3.5. Traditional Craftsmanship

Traditional crafts are sensitive to the availability of materials and resources required to undertake and make them. This can be seen as a rather tangible form of intangible heritage. Such crafts often form part of local festivals, many of which celebrate the progression of the seasons and as such are inherently sensitive to changes in seasonal weather patterns.
Flowers are often used in celebrations. These are essential to wreath making and as outdoor decoration for the feast of Corpus Christi in Poland [78]. Perhaps most notable are the floral carpets of peonies, poppies, cornflowers, guelder rose, wild lilac, daisies, pansies, tulips, and horse chestnut laid out in villages, most notably Spycimierz. Corpus Christi is a movable feast that occurs on the Thursday after Trinity Sunday. An ecclesiastical calculator [79] allowed us to plot the dates as crosses in grey squares from 1950 to 2100 (Figure 6). The typical flowering and maturity dates of the European pansy (Viola arvensis) were determined as 440 and 560 growing degree-days from a 5 °C base [80]. The estimates plotted in Figure 6 were made with average daily temperature data from CMCC-ESM2 under historic conditions and the high emissions scenario ssp585 between 1950 and 2099. We can see that the range of flowering dates for pansies increasingly fall outside the festival period as the century progresses. Using blooming dates [81] as a guide suggests that this will likely mean that the types of flowers dominating the carpets will be those with later flowering times (e.g., daisy Bellis perennis which typically blooms in June) or more persistent blossoms (e.g., cornflower Centaurea cyanus, which lasts until the first frost). A changing climate has already affected the use of cherry blossoms, which bloom too early now to decorate floats or palanquins in Japan; so, artificial flowers must be used [82].
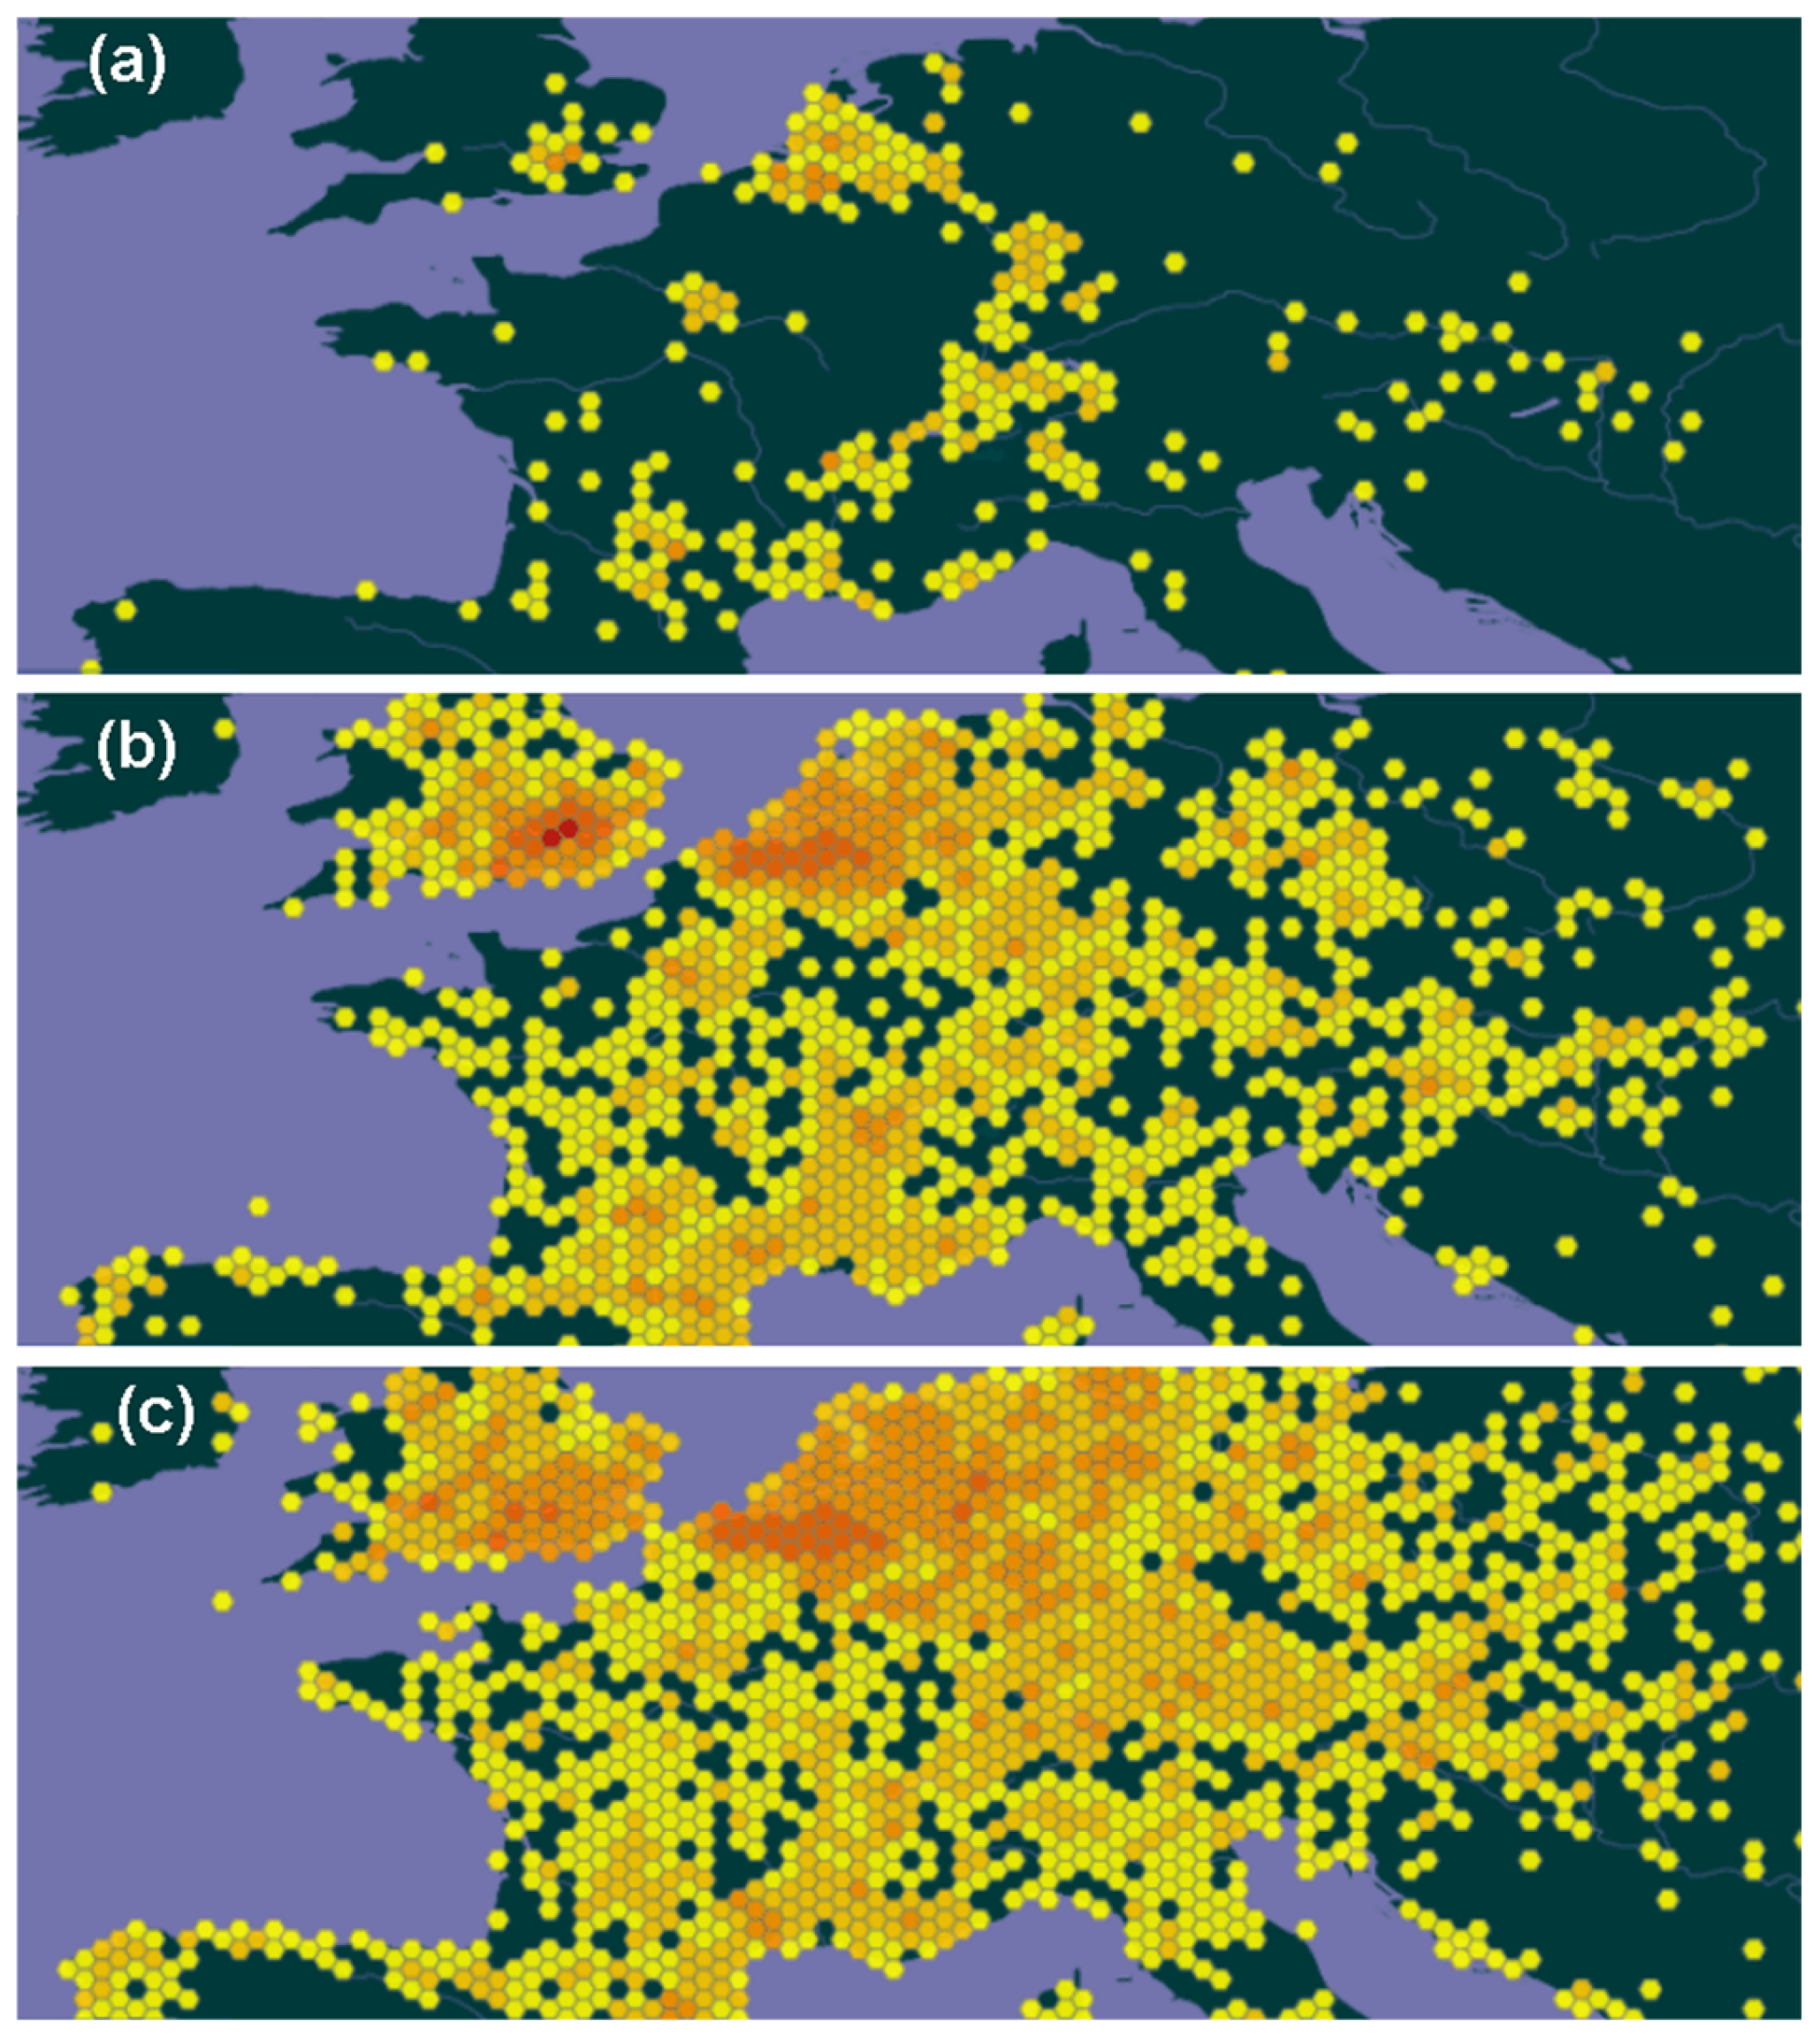
While a craft such as basket weaving might be conducted with relatively little concern over daily weather, it would nevertheless be affected by a changing climate that leads to a landscape where the necessary components, such as flax could no longer grow [83]. The willow has also been important in weaving, but there are strong seasonal effects on its growth, with the biomass yield of willow dependent on the number of degree days (base 5 °C), and the availability of water is important [84]. The willow is attacked by the willow sawfly larvae, Nematus oligospilus [85], while in Europe, boxwood is particularly affected by Cydalima perspectalis (box tree moth). This invasive insect has spread across the continent since the early 2000s, partially the result of global warming [86]. The increased recognition of its expansion is illustrated in Figure 7, which hints at how rapidly such invasions appear to grow. The larvae of this insect typically feed on the leaves and bark, but when infestation is severe, they can cause defloration, which means the leaves wither, and ultimately, the tree dies [87]. Boxwood (Buxus spp.) is an evergreen shrub used in various religious practices such as Easter palms or Easter baskets [88] and making musical instruments [89]. Because of its longevity, it symbolises immortality, resurrection, and life. The abundance of insects can be found on open-source databases such as the Global Biodiversity Information Facility (https://www.gbif.org/, accessed on 16 September 2025) and mapped in specific geospatial software or using mapping tools in Microsoft Excel.
The impact of climate change on traditional craftsmanship is also seen in the manufacture of musical instruments. Christian [70] argues that in an African setting, music forms an integral part of traditional religion, providing a means to express lived experiences in a rhythmic form and often accompanying traditional activities and ceremonies. Instruments are made from specific types of wood and animal skins, but increasingly, these are in short supply due to changes in climate and result in the use of inferior or fake materials. In general, the timber market may be affected by climate changes, and prices may decrease [91], but the quality and type of wood may decline. Using materials with different densities, especially as wood may become lighter in future [92], or alternative materials can negatively affect the patterns and intensity of sound produced by the instruments [70].
The dependence on traditional construction on changes to climate and the ecosystem are seen along the Trabocchi Coast in Italy. Here large traditional fishing machines (Trabocchi) were used in the past, but this 70 km-long stretch in Chieti (Abruzzo) province is currently threatened by storms and sea level change [93]. Traditional fishing may decline with the “scarcity of fish near the coast caused by climate change (storms and surges) and overfishing” [p. 15] and novel economic pressures, as activities shift from Trabocchi fishing to servicing seaside tourism.

4. Discussion

4.1. Climate Interface with Intangible Heritage

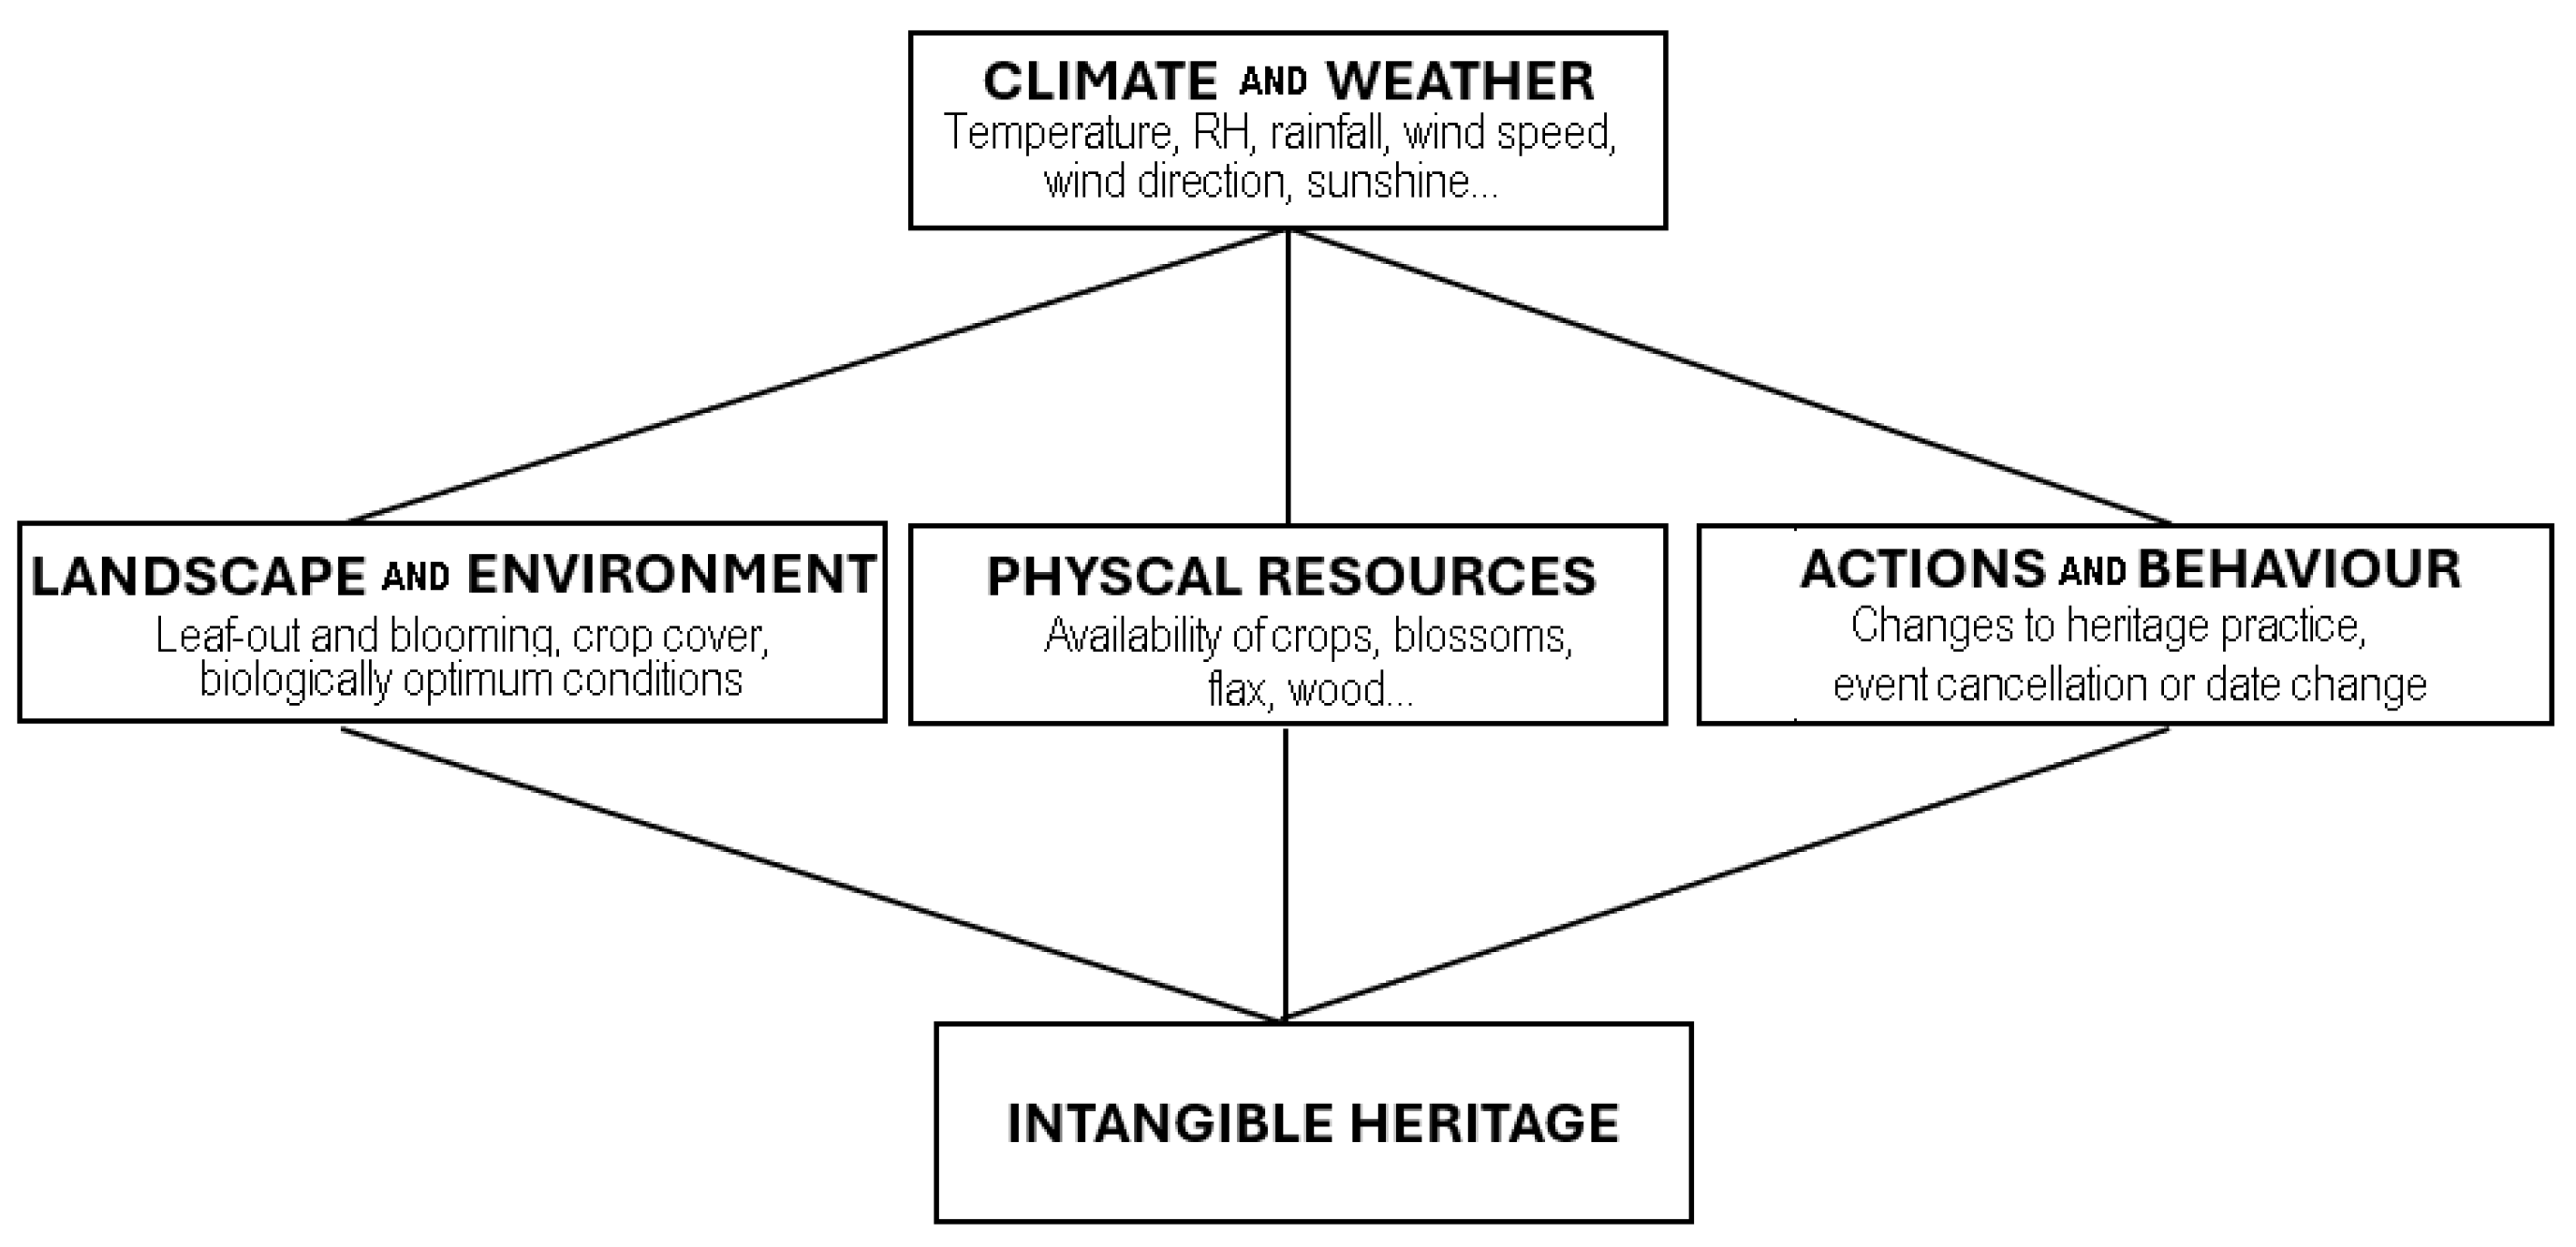
Intangible heritage is dynamic, with lived experience vital for these practices to be passed on to future generations. In the process of performing or undertaking these heritage practices, heritage is shaped by the local conditions. As such, intangible heritage is mimetic and can change or morph in response to present day conditions [7]. By using the UNESCO categories of intangible heritage to explore how past and projected future data can help us understand the relationship between climate and intangible heritage, we suggest that this mimetism can make heritage more resilient as it can constantly adapt to changing circumstances. However, it also poses a threat by either causing intangible heritage to drift so much from its original nature that it becomes unrecognisable, or substantial shifts in conditions could make heritage performances difficult. Therefore, to improve our understanding of the relationship between intangible heritage and climate, we suggest that there are a number of factors we need to consider in terms of how weather and climate interact with this heritage (Figure 8):
  • The setting or landscape that serves as a context for the heritage, as seen with the need for clement weather conditions for festivals to take place and cool climates for sports such as ice skating. Thus, intangible cultural heritage is influenced by the setting or landscape in which the practices take place.
  • The physical resources required, e.g., climate and weather can affect the physical resources needed for intangible heritage, e.g., the growth and collection of the flax needed for basket weaving.
  • People’s actions. Weather events can affect people’s actions, as seen with unpredictable rain affecting rainmaking practices and extreme heat curtailing sporting events.
Intangible heritage will be affected by the three mediating factors shown in Figure 8 in different ways and to different extents. For example, the local manufacture of musical instruments is likely to be constrained by the lack of resources needed in their production, while ice skating is affected by the elements of the landscape and climate that control the availability of frozen surfaces. Thus, the impact of climate on intangible heritage is mediated through the setting or landscape, people’s actions, or physical resources. Furthermore, while climate can act directly on tangible heritage: i.e., storms can damage buildings [94], humidity changes induce salt weathering that degrade facades [95], and increasing heat waves impose the need for architectural alterations such as air conditioning [96], with intangible heritage, the effects are less direct and typically mediated through factors related to our physical and social environment (Figure 8). These indirect impacts can make it more complex to tease out the effect of climate change on intangible heritage, but it is necessary if we are to be able to understand the full extent of the climate change threats.

4.2. Climate Processes

As discussed in our examples, climate plays a key role in influencing the factors that mediate effects on intangible heritage (Figure 8). We need to determine the critical elements in weather or climate events that capture relevant processes, such as degree-days being important for crop growth and blossoming dates or making landscapes conducive settings for activities or practices. Perhaps more challenging is the need to also determine how weather and climate events act as a source of inspiration for art or the way oral traditions can be affected by the climate in terms of its representation through the appearance of landscapes and the accompanying biota. Similarly challenging is capturing the role of extreme events on intangible heritage, as these events happen less frequently; so, they can be harder to study. Extreme events such as heat waves, storms, and floods that affect outdoor performances or sporting activity may have to be categorised in terms of the frequency of their occurrence, return periods, or in terms of the magnitude of the most extreme event.
Traditionally, seasons can be defined by the length of daylight, which, given it is a function of astronomical issues, is rather insensitive to climate change. Furthermore, the timing and length of seasons in which climate and weather events occur is important along with the predictability of seasonal events. In our examples, the duration of seasons is of particular importance for agriculture [97], pilgrimages [67], and festivals [98]. In some cases, the notion of a ‘season’ is more nuanced than the traditional four seasons commonly used in the western world but instead requires more flexible time windows of different durations [99]. Therefore, studies of seasonality and its impact on intangible heritage might need to define seasons in terms of the periods of cold or warmth, or rainfall or drought and also reflect local and regional seasonal processes such as wet and dry seasons or the monsoons. As climate changes, there will be shifts in the overall weather, with seasonal alterations especially recognised by an earlier spring and a later autumn. These are likely to alter planting and harvesting dates and affect celebrations and festivals that occur at particular times of the year.
The frequency of extreme events may increase, where outdoor sports, performing arts, oral and musical events, and dramatic and choreographic presentations are likely to be affected by changed climates in the future. It may be less the general climate than the weather on a given day or its frequency of occurrence that affects such events. Agriculture, in particular, can be sensitive to extreme weather such as heavy storms or hail.
Further challenges are found in translating the spatial scale of weather and climate processes to the scale at which intangible cultural heritage is performed. Weather and climate events can vary over very localised areas (e.g., in areas with extreme topography) but also reveal regional scale effects. Similarly, some intangible heritage is specific to an individual community, while other forms are important across countries or even transcend international borders. Therefore, care is needed to ensure, where possible, that the spatial scale of the weather events and climate processes being studied is relevant to the intangible heritage. Where this is not possible, e.g., using global climate models to project future climate scenarios onto an individual location, effort should be made to assess the relationship between locally collected observations and data produced from the model, so that bias corrections can be undertaken.
Modern modelling tools allow us to make projections of changes to climate. The use of ensembles of output from a range of models has given more confidence in assessing their reliability. It is necessary to consider that climate models are better at capturing some broad scale processes such as temperature, while it is more difficult to ensure reliability with others, such as more localised events such as precipitation. While traditional forms of social knowledge of nature can also draw upon past experience of weather and climate, these may be less reliable in the rapid climate changes of the future.

4.3. Managing Intangible Heritage in Changing Climates

Effective management of intangible heritage requires a bottom-up approach, empowering those who own, safeguard, or practice the heritage to conserve it in ways that are meaningful and sustainable for them and their community. Research output from climate change studies can inform such management but needs to recognise the rights-based context in which it is situated. Therefore, if management strategies or future policies are to be effective and acceptable, any research will need to be translated into a form that speaks to local values and social structure.
Management protocols will need to ensure an improved resilience to the threats imposed by a changing climate. This could be undertaken by assessing the three factors presented in Figure 8. Furthermore, this management will need to be mindful of the need to tune climate and weather data to properly represent the threat to intangible heritage, both in terms of the environmental processes and the temporal and spatial scales over which these operate. To gain this holistic understanding of the climate threats and the potential impacts to heritage, researchers need to recognise the way in which climate affects landscape, resources, human actions, and the transmission of intangible heritage. This will likely require researchers from heritage and climate backgrounds working together to gather climate and environmental data to couple with heritage-informed conservation strategies.
What constitutes success in the conservation of intangible heritage may be less clear than in the case of tangible heritage. Therefore, if measures of success are needed, they may instead need to be shaped around notions of community engagement or stakeholder perceptions of the heritage.

5. Conclusions

The effects of climate change on intangible heritage can often be overlooked or lack specificity, likely due to the intangibility that can make cause and effect relationships difficult to establish. In some cases, the memetic nature of intangible heritage can be seen as aiding its resilience to changes in climate by being able to accommodate external stressors. However, it also faces a multiplicity of potential threats that make it sensitive to the summation of external pressures. By exploring a range of examples, we show that intangible heritage can at the same time be both sensitive and resilient to climate change. This is illustrated in terms of the mediation of climate inputs on intangible heritage through changes in landscape, the availability of physical resources, and people’s actions.

Author Contributions

Conceptualization, P.B. and J.R.; methodology, P.B. and J.R.; software, P.B. and J.R.; formal analysis, P.B. and J.R.; investigation, P.B. and J.R.; writing—original draft preparation, P.B. and J.R.; writing—review and editing, P.B. and J.R.; visualization, P.B. and J.R. All authors have read and agreed to the published version of the manuscript.

Funding

This research received no external funding.

Data Availability Statement

The data used in the paper are available at the referenced links.

Conflicts of Interest

The authors declare no conflicts of interest.

References

  1. Colette, A. Case Studies on Climate Change and World Heritage; UNESCO Publishing: Paris, France, 2013. [Google Scholar]
  2. Sesana, E.; Gagnon, A.S.; Ciantelli, C.; Cassar, J.; Hughes, J.J. Climate change impacts on cultural heritage: A literature review. Wiley Interdiscip. Rev. Clim. Change 2021, 12, e710. [Google Scholar]
  3. Aboulnaga, M.; Abouaiana, A.; Puma, P.; Elsharkawy, M.; Farid, M.; Gamal, S.; Lucchi, E. Climate change and cultural heritage: A global mapping of the UNESCO thematic indicators in conjunction with advanced technologies for cultural sustainability. Sustainability 2024, 16, 4650. [Google Scholar] [CrossRef]
  4. Cacciotti, R.; Sardella, A.; Drdácký, M.; Bonazza, A. A methodology for vulnerability assessment of cultural heritage in extreme climate changes. Int. J. Disaster Risk Sci. 2024, 15, 404–420. [Google Scholar] [CrossRef]
  5. Orr, S.A.; Richards, J.; Fatorić, S. Climate change and cultural heritage: A systematic literature review (2016–2020). Hist. Environ. Policy Pract. 2021, 12, 434–477. [Google Scholar]
  6. UNESCO. Intangible Heritage Domains in the 2003 Convention. 2003. Available online: https://ich.unesco.org/en/intangible-heritage-domains-00052 (accessed on 21 April 2025).
  7. Wulf, C. Handbook on Intangible Cultural Practices as Global Strategies for the Future (Chapter 1); Springer Nature: Berlin/Heidelberg, Germany, 2024. [Google Scholar]
  8. Iacono, V.L.; Brown, D.H. Beyond binarism: Exploring a model of living cultural heritage for dance. Danc. Res. 2016, 34, 84–105. [Google Scholar]
  9. Upadhyay, R.K. Markers for global climate change and its impact on social, biological and ecological systems: A review. Am. J. Clim. Change 2020, 9, 159–203. [Google Scholar]
  10. Adger, W.N.; Barnett, J.; Chapin, F.S., III; Ellemor, H. This must be the place: Underrepresentation of identity and meaning in climate change decision-making. Glob. Environ. Politics 2011, 11, 1–25. [Google Scholar]
  11. Harrison, K. Indigenous music sustainability during climate change. Curr. Opin. Environ. Sustain. 2020, 43, 28–34. [Google Scholar] [CrossRef]
  12. UNESCO. MONDIACULT 2022 Ministerial Declaration Final Declaration. The UNESCO World Conference on Cultural Policies and Development Will Be Hosted by the Government of Mexico from 28 to 30 September 2022. Available online: https://www.unesco.org/en/mondiacult/2022 (accessed on 21 April 2025).
  13. Labadi, S.; Giliberto, F.; Rosetti, I.; Shetabi, L.; Yildirim, E. Heritage and the Sustainable Development Goals: Policy Guidance for Heritage and Development Actors; ICOMOS: Paris, France, 2021; pp. 1–16. Available online: https://kar.kent.ac.uk/89231/1/ICOMOS_SDGs_Policy_Guidance_2021.pdf (accessed on 17 September 2025).
  14. Laime, S.; Balcare, K.; Gailīte, E.; Grīnvalde, R.; Vaivade, A. Perspectives on Climate Change Impact on Intangible Cultural Heritage: The Case of Traditional Lamprey Fishing in Latvia. Anthropol. J. Eur. Cult. 2024, 33, 26–36. [Google Scholar]
  15. Richards, J.; Brimblecombe, P. The transfer of heritage modelling from research to practice. Her. Sci. 2022, 10, 17. [Google Scholar]
  16. Brimblecombe, P.; Richards, J. Applied climatology for heritage. Theor. Appl. Climatol. 2024, 155, 7325–7333. [Google Scholar] [CrossRef]
  17. Richards, J.; Brimblecombe, P. Tuning and effectiveness in heritage models. Heritage 2023, 6, 5516–5523. [Google Scholar] [CrossRef]
  18. World Bank. Climate Change Knowledge Portal. 2025. Available online: https://climateknowledgeportal.worldbank.org/ (accessed on 21 April 2025).
  19. Cooper, J. Rescue, Archival and Stewardship of Weather Records and Data. 2015. Available online: https://wmo.int/media/magazine-article/rescue-archival-and-stewardship-of-weather-records-and-data (accessed on 21 May 2025).
  20. Richards, J.; Brimblecombe, P. Moisture as a driver of long-term threats to timber heritage—Part I: Changing heritage climatology. Heritage 2022, 5, 1929–1946. [Google Scholar] [CrossRef]
  21. Ottenheimer, H. The Anthropology of Language: An Introduction To Linguistic Anthropology; Wadsworth Cengage Learning: Belmont, CA, USA, 2009; pp. 129–145. [Google Scholar]
  22. Macfarlane, R. The Lost Words: A Spell Book; Publisher Anansi International: Toronto, ON, Canada, 2018. [Google Scholar]
  23. Woodlands Trust. Common Beech. 28 February 2025. Available online: https://www.woodlandtrust.org.uk/trees-woods-and-wildlife/british-trees/a-z-of-british-trees/common-beech/ (accessed on 17 September 2025).
  24. Martinez del Castillo, E.; Zang, C.S.; Buras, A.; Hacket-Pain, A.; Esper, J.; Serrano-Notivoli, R.; Hartl, C.; Weigel, R.; Klesse, S.; Resco de Dios, V.; et al. Climate-change-driven growth decline of European beech forests. Commun. Biol. 2022, 5, 163. [Google Scholar] [CrossRef] [PubMed]
  25. Yu, J.; Berry, P.; Guillod, B.P.; Hickler, T. Climate change impacts on the future of forests in Great Britain. Front. Environ. Sci. 2021, 9, 640530. [Google Scholar] [CrossRef]
  26. Wang, H.; Lin, S.; Dai, J.; Ge, Q. Modeling the effect of adaptation to future climate change on spring phenological trend of European beech (Fagus sylvatica L.). Sci. Total Environ. 2022, 846, 157540. [Google Scholar] [CrossRef]
  27. Skogvang, B.O. Development of cultural and environmental awareness through Sámi outdoor life at Sámi/Indigenous festivals. Front. Sports Act. Living 2021, 3, 662929. [Google Scholar] [CrossRef]
  28. Pager-McClymont, K. A stylistic model of the converse of pathetic fallacy. Lang. Lit. 2024, 33, 44–68. [Google Scholar] [CrossRef]
  29. Hulme, M. ‘Telling a different tale’: Literary, historical and meteorological readings of a Norfolk heatwave. Clim. Change 2012, 113, 5–21. [Google Scholar] [CrossRef]
  30. Brimblecombe, P. Documentary records. In Global Change in the Holocene; Routledge: London, UK, 2014; pp. 159–167. [Google Scholar]
  31. Adamson, G.C. Private diaries as information sources in climate research. Wiley Interdiscip. Rev. Clim. Change 2015, 6, 599–611. [Google Scholar] [CrossRef]
  32. García-Herrera, R.; Barriopedro, D.; Gallego, D.; Mellado-Cano, J.; Wheeler, D.; Wilkinson, C. Understanding weather and climate of the last 300 years from ships’ logbooks. Wiley Interdiscip. Rev. Clim. Change 2018, 9, e544. [Google Scholar] [CrossRef]
  33. Aranuvachapun, S.; Brimblecombe, P. Tawatodsamad Klongdun-an old Thai weather poem. Weather 1979, 34, 459–464. [Google Scholar] [CrossRef]
  34. Khan, S.; Thornes, J.E.; Baker, J.; Olson, D.W.; Doescher, R.L. Monet at the Savoy. Area 2010, 42, 208–216. [Google Scholar] [CrossRef]
  35. Green, B.; Strong, C. ‘What if it rains? What if there are bushfires?’: Extreme weather, climate change and music festivals in Australia. Media Int. Aust. 2025, 195, 120–136. [Google Scholar] [CrossRef]
  36. Gibson, C. Music festivals: Transformations in non-metropolitan places, and in creative work. Media Int. Aust. 2007, 123, 65–81. [Google Scholar] [CrossRef]
  37. Spracklen, D.V.; Mickley, L.J.; Logan, J.A.; Hudman, R.C.; Yevich, R.; Flannigan, M.D.; Westerling, A.L. Impacts of climate change from 2000 to 2050 on wildfire activity and carbonaceous aerosol concentrations in the western United States. J. Geophys. Res. Atmos. 2009, 114, D20301. [Google Scholar] [CrossRef]
  38. City of Sydney, Energy and Climate Change. 2024. Available online: https://www.cityofsydney.nsw.gov.au/environmental-action/energy-and-climate-change (accessed on 3 May 2024).
  39. Dean, A.; Green, D. Climate change, air pollution and human health in Sydney, Australia: A review of the literature. Environ. Res. Lett. 2018, 13, 053003. [Google Scholar] [CrossRef]
  40. Herath, S.M.; Sarukkalige, R. Evaluation of empirical relationships between extreme rainfall and daily maximum temperature in Australia. J. Hydrol. 2018, 556, 1171–1181. [Google Scholar] [CrossRef]
  41. O’Malley, E. “To weather a play”: Audiences, Outdoor Shakespeares, and Avant-Garde Nostalgia at The Willow Globe. Shakespear. Bull. 2018, 36, 409–427. [Google Scholar] [CrossRef]
  42. O’Malley, E.M. The Natural Place for the Play: Outdoor Shakespeares, Environment, and an Ethnography of Audience Experience. Ph.D. Thesis, University of Exeter (United Kingdom), Exeter, UK, 2016. [Google Scholar]
  43. Luckman, S. Location, spatiality and liminality at outdoor music festivals: Doofs as journey. In The Festivalization of Culture; Routledge: London, UK, 2016; pp. 189–206. [Google Scholar]
  44. Kramer, P. Dancing Materiality. Ph.D. Thesis, Coventry University, Coventry, UK, 2015. [Google Scholar]
  45. Stanyukovich, M.V. A living shamanistic oral tradition: Ifugao hudhud, the Philippines. Oral Tradit. 2003, 18, 249–251. [Google Scholar] [CrossRef]
  46. Post, E.; Alley, R.B.; Christensen, T.R.; Macias-Fauria, M.; Forbes, B.C.; Gooseff, M.N.; Iler, A.; Kerby, J.T.; Laidre, K.L.; Mann, M.E.; et al. The polar regions in a 2 C warmer world. Sci. Adv. 2019, 5, eaaw9883. [Google Scholar] [CrossRef]
  47. Damyanov, N.N.; Matthews, H.D.; Mysak, L.A. Observed decreases in the Canadian outdoor skating season due to recent winter warming. Environ. Res. Lett. 2012, 7, 014028. [Google Scholar] [CrossRef]
  48. United Nations Climate Change, Global Climate Action. Sports for Climate Action Framework (Version 2.0). December 2018. Available online: https://unfccc.int/sites/default/files/resource/Sports_for_Climate_Action_Declaration_and_Framework.pdf (accessed on 17 September 2025).
  49. Brocherie, F.; Girard, O.; Millet, G.P. Emerging environmental and weather challenges in outdoor sports. Climate 2015, 3, 492–521. [Google Scholar] [CrossRef]
  50. Knowles, N.; Scott, D.; Steiger, R. Winter sports and climate change. In Sport and Environmental Sustainability; Routledge: London, UK, 2020; pp. 140–161. [Google Scholar]
  51. Brammer, J.R.; Samson, J.; Humphries, M.M. Declining availability of outdoor skating in Canada. Nat. Clim. Change 2014, 5, 2–4. [Google Scholar] [CrossRef]
  52. Wobus, C.; Small, E.E.; Hosterman, H.; Mills, D.; Stein, J.; Rissing, M.; Jones, R.; Duckworth, M.; Hall, R.; Kolian, M.; et al. Projected climate change impacts on skiing and snowmobiling: A case study of the United States. Glob. Environ. Change 2017, 45, 1–14. [Google Scholar] [CrossRef]
  53. Liu, J.; Cheng, H.; Sun, X.; Huang, L.; Fan, Q.; Liu, H. Effects of climate change on outdoor skating in the Bei Hai Park of Beijing and related adaptive strategies. Sustainability 2017, 9, 1147. [Google Scholar] [CrossRef]
  54. Visser, H.; Petersen, A.C. The likelihood of holding outdoor skating marathons in the Netherlands as a policy-relevant indicator of climate change. Clim. Change 2009, 93, 39–54. [Google Scholar] [CrossRef]
  55. Richards, J. Modelling the impact of climate change on cultural practices: The future of fen skating (1981–2079). Reg. Environ. Change 2024, 24, 61. [Google Scholar] [CrossRef]
  56. Mason, H.; Peden, A.; Leicht, A.; King, J.; Franklin, R. Extreme Heat Is a Killer for Outdoor Sporting Events—Let’s Plan Properly to Keep Everyone Safe. The Conversation. 2024. Available online: https://theconversation.com/extreme-heat-is-a-killer-for-outdoor-sporting-events-lets-plan-properly-to-keep-everyone-safe-229998 (accessed on 29 January 2025).
  57. Wimbledon 2024. Heat Rule. 28 February 2025. Available online: https://www.wimbledon.com/en_GB/about_wimbledon/heat_rule.html (accessed on 29 January 2025).
  58. Tennis Australia. Heat Stress Scale a Grand Slam First. 2018. Available online: https://ausopen.com/articles/news/ao-heat-stress-scale-grand-slam-first (accessed on 29 January 2025).
  59. Lawn Tennis Association. Extreme Heat Policy—LTA Competition Regulations; LTA: London, UK, 2022. [Google Scholar]
  60. Bujisic, M.; Bogicevic, V.; Parsa, H.G. The effect of weather factors on restaurant sales. J. Foodserv. Bus. Res. 2017, 20, 350–370. [Google Scholar] [CrossRef]
  61. Agnew, M.D.; Thornes, J.E. The weather sensitivity of the UK food retail and distribution industry. Meteorol. Appl. 1995, 2, 137–147. [Google Scholar] [CrossRef]
  62. Waite, J.L. A time and a place for ice cream. Geogr. Teach. 2020, 17, 104–108. [Google Scholar] [CrossRef]
  63. Ziady, H. The World’s Biggest Ice Cream Company Says Heat Waves May Not Help Sales. CBS News. Available online: https://www.cbsnews.com/sacramento/news/the-worlds-biggest-ice-cream-company-says-heat-waves-may-not-help-sales/ (accessed on 12 May 2025).
  64. Yezli, S.; Khan, A.; Bouchama, A. Summer Hajj pilgrimage in the era of global warming: A call for vigilance and better understanding of the risks. J. Travel Med. 2019, 26, taz069. [Google Scholar] [CrossRef] [PubMed]
  65. Saeed, F.; Schleussner, C.F.; Almazroui, M. From Paris to Makkah: Heat stress risks for Muslim pilgrims at 1.5 C and 2 C. Environ. Res. Lett. 2021, 16, 024037. [Google Scholar] [CrossRef]
  66. Tomatis, F. Analysis of possible repercussions of climate change on the Camino de Santiago Francés (“French Way”) as it passes throught Castilla y León (Spain). Rev. Interam. Ambiente Tur. 2020, 16, 202–216. [Google Scholar] [CrossRef]
  67. Brimblecombe, P.; Tola, H.G.; Richards, J. Climate change and pilgrimage to shrines in Ethiopia. Heritage 2023, 7, 95–106. [Google Scholar] [CrossRef]
  68. Hong, Z.; Slingerland, E.; Henrich, J. Magic and empiricism in early Chinese rainmaking: A cultural evolutionary analysis. Curr. Anthropol. 2024, 65, 343–363. [Google Scholar] [CrossRef]
  69. Forth, G. Making fun of animals: Ontological implications of rituals and taboos observed in geographically and linguistically discontinuous regions of Southeast Asia and southwestern China. Oceania 2022, 92, 267–286. [Google Scholar] [CrossRef]
  70. Christian, N.G. The impact of climate change on African traditional religious practices. J. Earth Sci. Clim. Change 2014, 5, 1–5. [Google Scholar] [CrossRef]
  71. Koufos, G.; Mavromatis, T.; Koundouras, S.; Fyllas, N.M.; Jones, G.V. Viticulture-climate relationships in Greece: The impacts of recent climate trends on harvest date variation. Int. J. Climatol. 2014, 34, 1445–1459. [Google Scholar] [CrossRef]
  72. Olesen, J.E.; Børgesen, C.D.; Elsgaard, L.; Palosuo, T.; Rötter, R.P.; Skjelvåg, A.O.; Peltonen-Sainio, P.; Börjesson, T.; Trnka, M.; Ewert, F.; et al. Changes in time of sowing, flowering and maturity of cereals in Europe under climate change. Food Addit. Contam. Part A 2012, 29, 1527–1542. [Google Scholar] [CrossRef]
  73. Prochnow, A.; Risius, H.; Hoffmann, T.; Chmielewski, F.M. Does climate change affect period, available field time and required capacities for grain harvesting in Brandenburg, Germany? Agric. For. Meteorol. 2015, 203, 43–53. [Google Scholar] [CrossRef]
  74. Waha, K.; Müller, C.; Bondeau, A.; Dietrich, J.P.; Kurukulasuriya, P.; Heinke, J.; Lotze-Campen, H. Adaptation to climate change through the choice of cropping system and sowing date in sub-Saharan Africa. Glob. Environ. Change 2013, 23, 130–143. [Google Scholar] [CrossRef]
  75. Waongo, M.; Laux, P.; Kunstmann, H. Adaptation to climate change: The impacts of optimized planting dates on attainable maize yields under rainfed conditions in Burkina Faso. Agric. For. Meteorol. 2015, 205, 23–39. [Google Scholar] [CrossRef]
  76. Raymundo, R.; Asseng, S.; Robertson, R.; Petsakos, A.; Hoogenboom, G.; Quiroz, R.; Hareau, G.; Wolf, J. Climate change impact on global potato production. Eur. J. Agron. 2018, 100, 87–98. [Google Scholar] [CrossRef]
  77. Gyedu, A.K.; Damptey, F.G.; Barnes, V.R.; Bentsi-Enchill, F.; Sarfo, D.A.; Mohammed, I.; Opuni-Frimpong, E. Multiple Anthropogenic and Climatic Factors Drive Tree Species Attributes in Ecologically Distinct Sacred Groves in Ghana. Int. J. For. Res. 2025, 2025, 9944297. [Google Scholar] [CrossRef]
  78. UNESCO. Elements Inscribed in 2021 on the Representative List of the Intangible Cultural Heritage of Humanity. 2021. Available online: https://ich.unesco.org/en/RL/flower-carpets-tradition-for-corpus-christi-processions-01743 (accessed on 27 May 2025).
  79. Available online: https://aulis.org/EnglishCalendar/#ecclesiastical (accessed on 24 May 2025).
  80. Damalas, C.A.; Koutroubas, S.D.; Fotiadis, S. Phenological development of natural populations of European field pansy (Viola arvensis) in a semi-arid Mediterranean environment. Plant Species Biol. 2018, 33, 212–220. [Google Scholar] [CrossRef]
  81. Jardine, M.I. Blooming dates. Landsc. Archit. 1924, 14, 270–278. [Google Scholar]
  82. Brimblecombe, P.; Hayashi, M. Pressures from long term environmental change at the shrines and temples of Nikkō. Herit. Sci. 2018, 6, 27. [Google Scholar] [CrossRef]
  83. Dziubata-Smykowska, K. Local Responses to Climate Change Impact on Intangible Cultural Heritage in Poland. Lit. Ludowa 2024, 68, 61–82. [Google Scholar] [CrossRef]
  84. Charles, J.G.; Allan, D.J. Development of the willow sawfly, Nematus oligospilus, at different temperatures, and an estimation of voltinism throughout New Zealand. N. Z. J. Zool. 2000, 27, 197–200. [Google Scholar] [CrossRef]
  85. Kopp, R.F.; Abrahamson, L.P.; White, E.H.; Volk, T.A.; Nowak, C.A.; Fillhart, R.C. Willow biomass production during ten successive annual harvests. Biomass Bioenergy 2001, 20, 1–7. [Google Scholar] [CrossRef]
  86. Oltean, I.; Hulujan, I.; Hulujan, I.; Varga, M.; Tötös, Ş.; Florian, T. Cydalima Perspectalis Walker (Lepidoptera, Crambidae) a New Dangerous Pest Report on Buxus Sempervirens in Cluj Area. Bulletin of the University of Agricultural Sciences & Veterinary Medicine Cluj-Napoca. Agriculture 2017, 74, 26–36. [Google Scholar]
  87. Geci, D.; Musliu, M.; Bilalli, A.; Ibrahimi, H. New records of Cydalima perspectalis (Walker, 1859)(Lepidoptera, Crambidae) from Albania and Kosovo. Natura Croatica: Periodicum Musei Historiae Naturalis Croatici 2020, 29, 135–138. [Google Scholar] [CrossRef]
  88. Skonieczna-Gawlik, D. Rośliny w zwyczajach i obrzędach mieszkańców województwa śląskiego. Rocznik Muzeum „Górnośląski Park Etnograficzny w Chorzowie” 2015, 3, 103–123. [Google Scholar]
  89. Zadro, M.G. Woods used for woodwind instruments since the 16th century—1. Early Music 1975, 3, 134–136. [Google Scholar] [CrossRef]
  90. GBIF Secretariat: GBIF Backbone Taxonomy. Available online: https://www.gbif.org/species/4532122 (accessed on 13 March 2025).
  91. Sohngen, B.; Mendelsohn, R.; Sedjo, R. A global model of climate change impacts on timber markets. J. Agric. Resour. Econ. 2001, 26, 326–343. [Google Scholar]
  92. Kherais, M.; Csébfalvi, A.; Len, A. The climate impact on timber structures. Int. J. Optim. Civ. Eng. 2021, 11, 143–154. [Google Scholar]
  93. López Campos, L.I.; Prestileo, F.; Stella, E.M.; Mascitelli, A.; Aruffo, E.; Chiacchiaretta, P.; Di Carlo, P.; Dietrich, S. Heritage Resilience and Identity: Lesson from Trabocchi Coast about Climate Change Adaptation Strategies. Sustainability 2024, 16, 5848. [Google Scholar] [CrossRef]
  94. Nikkanen, M.; Räsänen, A.; Juhola, S. The influence of socioeconomic factors on storm preparedness and experienced impacts in Finland. Int. J. Disaster Risk Reduct. 2021, 55, 102089. [Google Scholar] [CrossRef]
  95. Grossi, C.M.; Brimblecombe, P.; Menéndez, B.; Benavente, D.; Harris, I.; Déqué, M. Climatology of salt transitions and implications for stone weathering. Sci. Total Environ. 2011, 409, 2577–2585. [Google Scholar] [CrossRef]
  96. Muñoz-González, C.M.; León-Rodríguez, A.L.; Navarro-Casas, J. Air conditioning and passive environmental techniques in historic churches in Mediterranean climate. A proposed method to assess damage risk and thermal comfort pre-intervention, simulation-based. Energy Build. 2016, 130, 567–577. [Google Scholar] [CrossRef]
  97. Cui, X.; Xie, W. Adapting agriculture to climate change through growing season adjustments: Evidence from corn in China. Am. J. Agric. Econ. 2022, 104, 249–272. [Google Scholar] [CrossRef]
  98. Sakurai, R.; Jacobson, S.K.; Kobori, H.; Primack, R.; Oka, K.; Komatsu, N.; Machida, R. Culture and climate change: Japanese cherry blossom festivals and stakeholders’ knowledge and attitudes about global climate change. Biol. Conserv. 2011, 144, 654–658. [Google Scholar] [CrossRef]
  99. Richards, J.; Brimblecombe, P. Climate metrics for modelling conditions on pilgrimages in Ethiopia. Herit. Sci. 2025, in press. [Google Scholar]
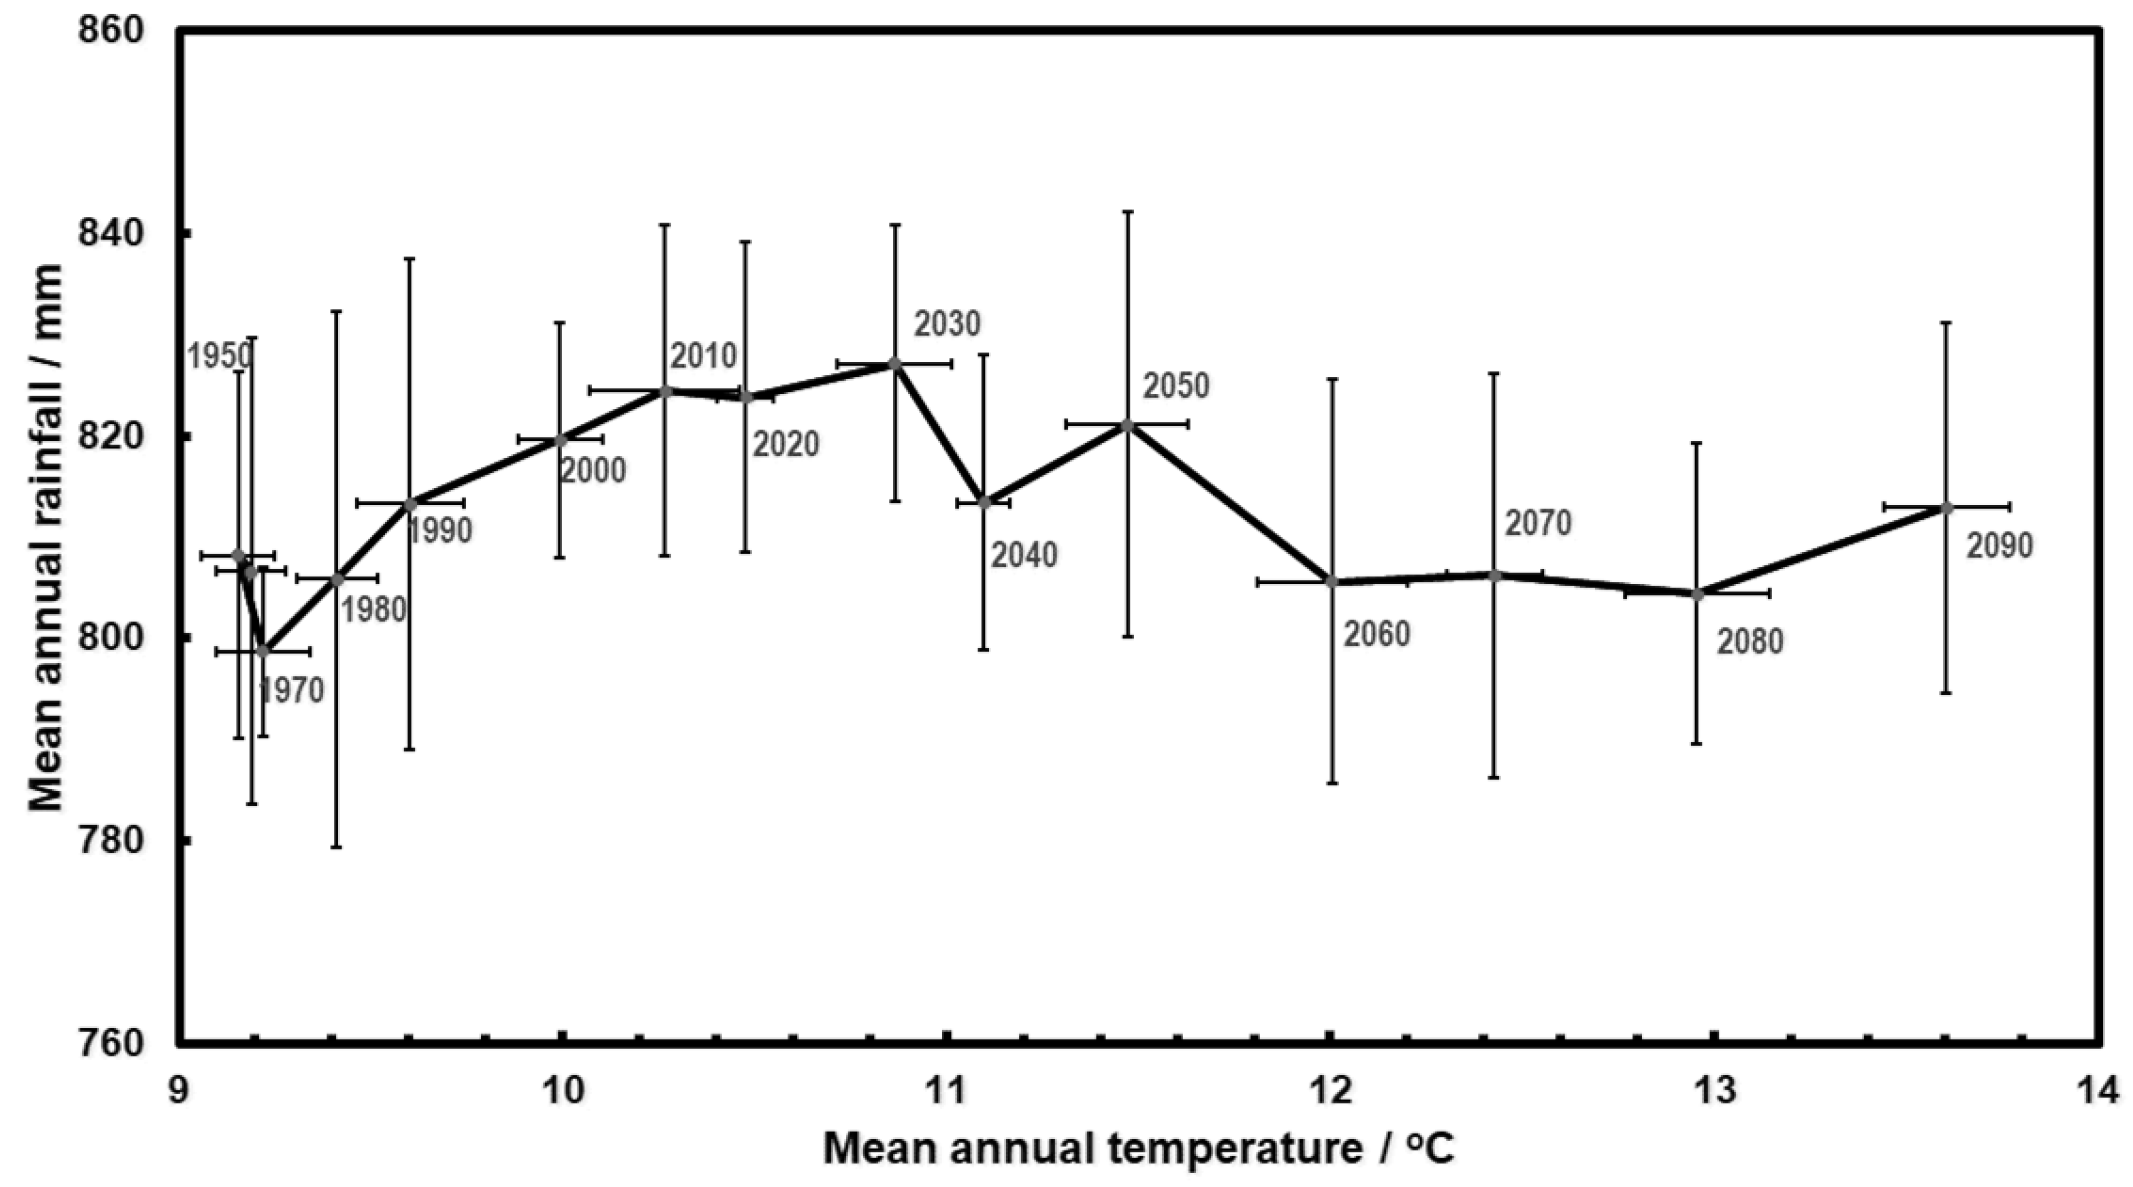
Figure 1. The decadal averages for the mean annual temperature and mean annual rainfall in England. Error bars are one standard deviation from the mean. Data were sourced from the World Bank Climate Change Knowledge Portal [18].
Heritage 08 00407 g001
Figure 2. (a) Reasons for climate related cancellations to outdoor music events in Australia 2012–2022 [35]. (b) Maximum 1-day rainfall each year for New South Wales as projected from an ensemble under the high emissions scenario (ssp585). Data were sourced from the World Bank Climate Change Knowledge Portal [18].
Heritage 08 00407 g002
Figure 3. The frequency of skating freezes between the 1980s and 2070s in the Fenland region of the UK, as marked in the inset by the grey grid cell in east of England. Adapted from Richards [55].
Heritage 08 00407 g003
Figure 4. The average number of days per year where conditions meet or exceed an apparent temperature of 40.1 °C in (a) 1995–2015 and (b) 2035–2055 and (c) the difference between (a,b).
Heritage 08 00407 g004
Figure 5. The percentage change in the mean monthly precipitation for a 1.5 °C warming scenario relative to 1850–1900 calculated using 33 CMIP6 models for the East Southern Africa region between 1950 and 2100. This figure is based on data provided by the IPCC WGI Interactive Atlas (https://interactive-atlas.ipcc.ch/ last accessed 17 September 2025).
Heritage 08 00407 g005
Figure 6. Dates of the Feast of Corpus Christi (as white crosses in grey squares). The grey shading indicates the range of possible dates from 21 May to 24 June. The orange area embraces the calculated time of the appearance of European field pansy flowers (Viola arvensis) and date of maturity. Note: Y-axis runs from 10 April to 19 July. Inset map shows the position of Spycimierz, Łódź Voivodeship, central Poland.
Heritage 08 00407 g006
Figure 7. Records of Cydalima perspectalis (a) 2011–15 (b) 2016–2020, and (c) 2021–2025 from the GBIF database [90]. The increasing number of records is denoted from changes: yellow through to red.
Heritage 08 00407 g007
Figure 8. Flowchart illustrating the mediation of climate inputs on intangible heritage by various factors.
Heritage 08 00407 g008
Table 1. Data sources mentioned in this paper. Note: NA, not available; T, temperature; P, precipitation; and RH, relative humidity. Note shading designates alternate rows.
DatasetTimescaleParametersFormatStrength
Limitations
URL
Archives
e.g., shipping logs,
diaries
VariableVariableHandwritten
or printed
documents
Rich source of past data
Variable in quality and
limited in spatial and
temporal resolution
Much data yet to be digitised
NA
CMIP6 model
data
1850–2100T, P, RHNetCDFMany climate parameters available
at multiple temporal resolutions
Output available for past and future
scenarios
Variable in quality and limited in
spatial and temporal resolution
Require computational skills
1
ERA5 reanalysis: European Centre for Medium-Range Weather Forecasts1940–2025T, P, RHGRIBHourly estimates of many climate
parameters
Spatially complete dataset at 0.25°
Requires computational skills
2
European Climate Assessment and Datasetvariable-2025T, P, RHASCII,
NetCDF,
maps
Data from 65 countries
Daily resolution
Quality controlled data series
Past data—no projections for future
3
Global Biodiversity Information Facility1800s–2025SpeciesMaps,
observations,
records…
Easy to make maps; spatially
and temporally tuneable
Large scientific community use
Need to implement quality controls
on observational records
No future projections
4
IPCC WGI
Interactive Atlas
1850–2100T, P, RH…Maps, graphs,
Excel
Easy use/access to a range of output
Graphical user interface to explore
past and a range of future scenarios
Includes model uncertainties
Less flexibility than using raw data
5
Published datasets in per reviewed
literature
variablevariableGraphs, tables,
spreadsheets
Rich source of peer reviewed data
May lack desired spatial or temporal
resolution and flexibility in applying
to different circumstances
NA
National climate model datasets (e.g., UKCP18)variableT, P, RH…NetCDFMany climate parameters available at
high spatial and temporal resolution
Output available for past and future scenarios
Output limited to a defined
geographical areas
Require computational skills
6
World Bank
Climate Change Knowledge Portal
1850–2100T, P, RH…Excel, maps,
Graphs…
Easy to use and range of output
Spatial resolution limited to provinces
Limited temporal scales (annual
or seasonal)
7
Disclaimer/Publisher’s Note: The statements, opinions and data contained in all publications are solely those of the individual author(s) and contributor(s) and not of MDPI and/or the editor(s). MDPI and/or the editor(s) disclaim responsibility for any injury to people or property resulting from any ideas, methods, instructions or products referred to in the content.