Article

Towards Using Digital Technologies to Balance Conservation and Fire Mitigation in Building Heritage Hosting Vulnerable Occupants: Rapid Evacuation Simulator Verification for the “Omero Museum” (Ancona, Italy)

by
Marco D’Orazio
,
Margherita Canafoglia
,
Gabriele Bernardini
* and
Enrico Quagliarini
DICEA Department, Università Politecnica delle Marche, Via Brecce Bianche, 60131 Ancona, Italy
*
Author to whom correspondence should be addressed.
Heritage 2024, 7(7), 3734-3755; https://doi.org/10.3390/heritage7070177
Submission received: 10 May 2024 / Revised: 10 July 2024 / Accepted: 11 July 2024 / Published: 14 July 2024
(This article belongs to the Special Issue Conservation Methodologies and Practices for Built Heritage)

Abstract

Digital technologies can support designers in balancing architectural heritage conservation and performances using multidisciplinary approaches. Fire safety represents a challenging issue, especially in public historical buildings hosting vulnerable occupants, since heavy modifications are often required to facilitate their evacuation. Digital tools based on evacuation simulation are able to verify the impact of other sustainable, compatible evacuation management and planning approaches, especially considering the use of generic software, which can be used by low-trained technicians according to rapid setups. Nevertheless, simulator reliability should be experimentally verified through case study applications. This work thus offers the experimental verification of a rapid setup-based generic evacuation simulator in the context of a significant case study (the “Omero Museum”, Ancona, Italy), placed in a historic building hosting vulnerable occupants (disabled, elderly, children), thanks to a full-scale evacuation drill. The rapid setup described different vulnerable occupants’ categories according to literature data. Comparisons between drill and simulation results, using consolidated verification indicators, showed the overall reliability of the proposed approach, and thus encourage additional tests in historical buildings. The proposed setup-based simulator could be combined with other digital tools (virtual reality, BIM-related) to provide full support to fire risk and evacuation assessments when vulnerable occupants are present.

1. Introduction

The role of digital technologies in supporting the design of strategies and solutions for the conservation and fruition of architectural heritage is constantly increasing [1,2,3,4]. In fact, thanks to multidisciplinary approaches, such technologies are able to properly represent the historic built environment and its hosted artefacts and combine such data by highlighting heritage identity features and vulnerabilities, related possible stressors, occupants and current/future intentions, and then adopt performance-based assessment actions through simulation approaches, thanks to the improvement in the level of knowledge of heritage critical issues in ordinary and extraordinary scenarios [1,3,5,6,7,8]. They can thus widely contribute to different challenges, including those related to sustainability issues [9], the preservation of heritage (including materials and surfaces) and its identity features [10,11]), operation and energy efficiency [5,12,13], management and maintenance [14], the continuous use of and balance between adaptation/retrofit/regeneration, and conservation [1,8].
Among these goals, risk reduction and mitigation issues surely relate to one of the most important topics, especially considering possible disasters and emergency conditions, considering events affecting single buildings (e.g., fires) [7,15,16] or the urban area where it is placed (e.g., floods, earthquakes, landslides, climate change) [6,17]. In both cases, digital tools for scenario creation, risk assessment and the evaluation of risk reduction/mitigation/preparedness strategies can actively support designers in evaluating probable conditions and moving towards the optimisation of both physical interventions in architectural heritage and management actions before and during an emergency [15,17,18,19,20,21].

1.1. Fire Safety in Architectural Heritage and Vulnerable Occupants

Fire surely represents a fundamental risk, as also remarked by consolidated safety regulations and research and practice efforts [7,15,16,22] aimed at balancing heritage conservation and occupant safety problems. Considering the building itself, physical vulnerability factors relating to fire risk are widely associated with morphological and construction features, including building technologies and materials, as well as with the historical, artistic and anthropological value of heritage and hosted artefacts [23]. Nevertheless, the complexity of this application topic increases while dealing with buildings open to the public due to the combination of building heritage vulnerabilities and hazards with factors related to the hosted occupants [15,16,21,24,25,26,27]. In fact, possible high exposure levels, due to possible significant crowding levels, can be coupled with the presence of vulnerable occupants.
First, occupants in public building heritage are often associated with visitors [13,16]. Typical vulnerabilities are correlated with their possible poor familiarity with the built environment, its layout and risk, and emergency procedures [24]. Moreover, occupant vulnerabilities can be correlated to age (e.g., the elderly, children), motion abilities (e.g., occupants with crutches, walking sticks, or wheelchairs) and sensory abilities (e.g., visibility impairments), which lead to specific effects on evacuation quantities, e.g., motion speed, evacuation choices, path selection and participation in evacuation [28,29,30]. As a result, besides suffering from limited fruition of the heritage and being treated as ordinary visitors [31], such vulnerable occupants can have different levels of autonomy in evacuation, thus altering fire risk with respect to basic occupancy conditions.
Second, typical protection and mitigation techniques aimed at mitigating damage levels and facilitating the evacuation process (e.g., fire compartmentation, evacuation paths redundancy and dimensions, creating temporary safe spaces where vulnerable occupants can wait for rescuers) may have an heavy impact on the building in view of the complexities of the building heritage and its layout, thus leading to unacceptable modifications [8,16,24]. Non-structural strategies, based on evacuation management and planning, could support fire risk mitigation by limiting the impact of physical interventions in architectural heritage [21,26,32,33,34]. In this sense, all vulnerable occupants who can move autonomously should be encouraged to properly act by themselves thanks to the support given by members of building emergency staff, thus allowing rescuers to focus on non-autonomous individuals.

1.2. Digital Technologies for Fire Safety Improvement: Simulation Tools

The contribution of digital tools such as simulators, BIM/HBIM and Virtual Reality could be relevant in the definition, application and management of fire safety measures in architectural heritage by also including non-structural strategies such as evacuation management and planning [16,25], particularly when the historical building hosts vulnerable occupants [26].
In particular, evacuation simulation models representing occupant features and emergency behaviours can contribute to this goal [15,21,24,33,34,35]. In fact, simulators can assess fire risk from a behavioural-based perspective and support the effective investigation of alternatives concerning mitigation strategies in building heritage [35,36]; this can also be performed in combination with tools for structural safety and fire-spreading simulation [18,20]. Moreover, they can be included in digital technologies supporting the whole conservation/restoration process, thus also being coupled with BIM/HBIM and tools for multi-criteria decision-making [8,15,16,37,38]. In particular, generic (e.g., commercial) evacuation simulators can be valuable in supporting the whole process [39]. They are aimed at simulating general-purpose and fire scenarios, allowing for the implementation of standard-based, easy-to-implement setups, which should be specific indeed in respect to the considered emergency scenarios, and thus also to the presence of vulnerable occupants, reducing complexities due to source code modifications or the use of dedicated plugins [40]. In this way, generic evacuation simulators can move towards quick use by non-specifically trained technicians, thus consolidating operational issues [2,17].
Nevertheless, simulators can be properly used when their reliability is demonstrated, thanks to calibration, verification and validation tasks [39]. Most of these activities concern controlled test conditions and basic scenarios in terms of layout (e.g., rooms, corridors, staircases and their combination with a limited extension), according to international guidelines [41,42]. Therefore, evacuation drills [24,43,44,45] performed in real-world scenarios can provide additional powerful support for the assessment of simulator reliability, by comparing simulation results with experimental data. Nevertheless, the availability of experimental data seems to be still limited essentially because of organisational complexities, especially when referring to full-scale drills [28,30,45]. In particular, those involving building heritage hosting vulnerable occupants are mostly still missing, to the best of the authors’ knowledge, and, thus, it can be assumed that a single study can contribute to the whole picture, although partial.

1.3. Work Aims

This work thus offers the experimental verification of a simplified setup for a generic evacuation simulator in the context of a specific case study, i.e., “Omero Museum” (Ancona, Italy). The museum is in a multi-story historical building and usually hosts disabled, elderly and child occupants. A full-scale evacuation drill was performed by involving the presence of such vulnerable occupants, other non-vulnerable adult visitors (without sensory/motion impairments) and emergency staff, who supported occupants according to the evacuation plan actions. Then, a digital model of the museum was implemented in a generic evacuation simulator based on microscopic modelling [46], boosting the capabilities of the simulator application in the context of building heritage for proper evacuation management and risk mitigation strategies design [15,21,23,24,26]. A specific literature-based rapid setup was then defined to consider behaviours and motion quantities depending on occupant vulnerabilities. Finally, consolidated verification indicators [39,41,42] were used to compare the simulation outcomes with the experimental drill results, determining the reliability of the approach for the considered case study.

2. Phases, Materials and Methods
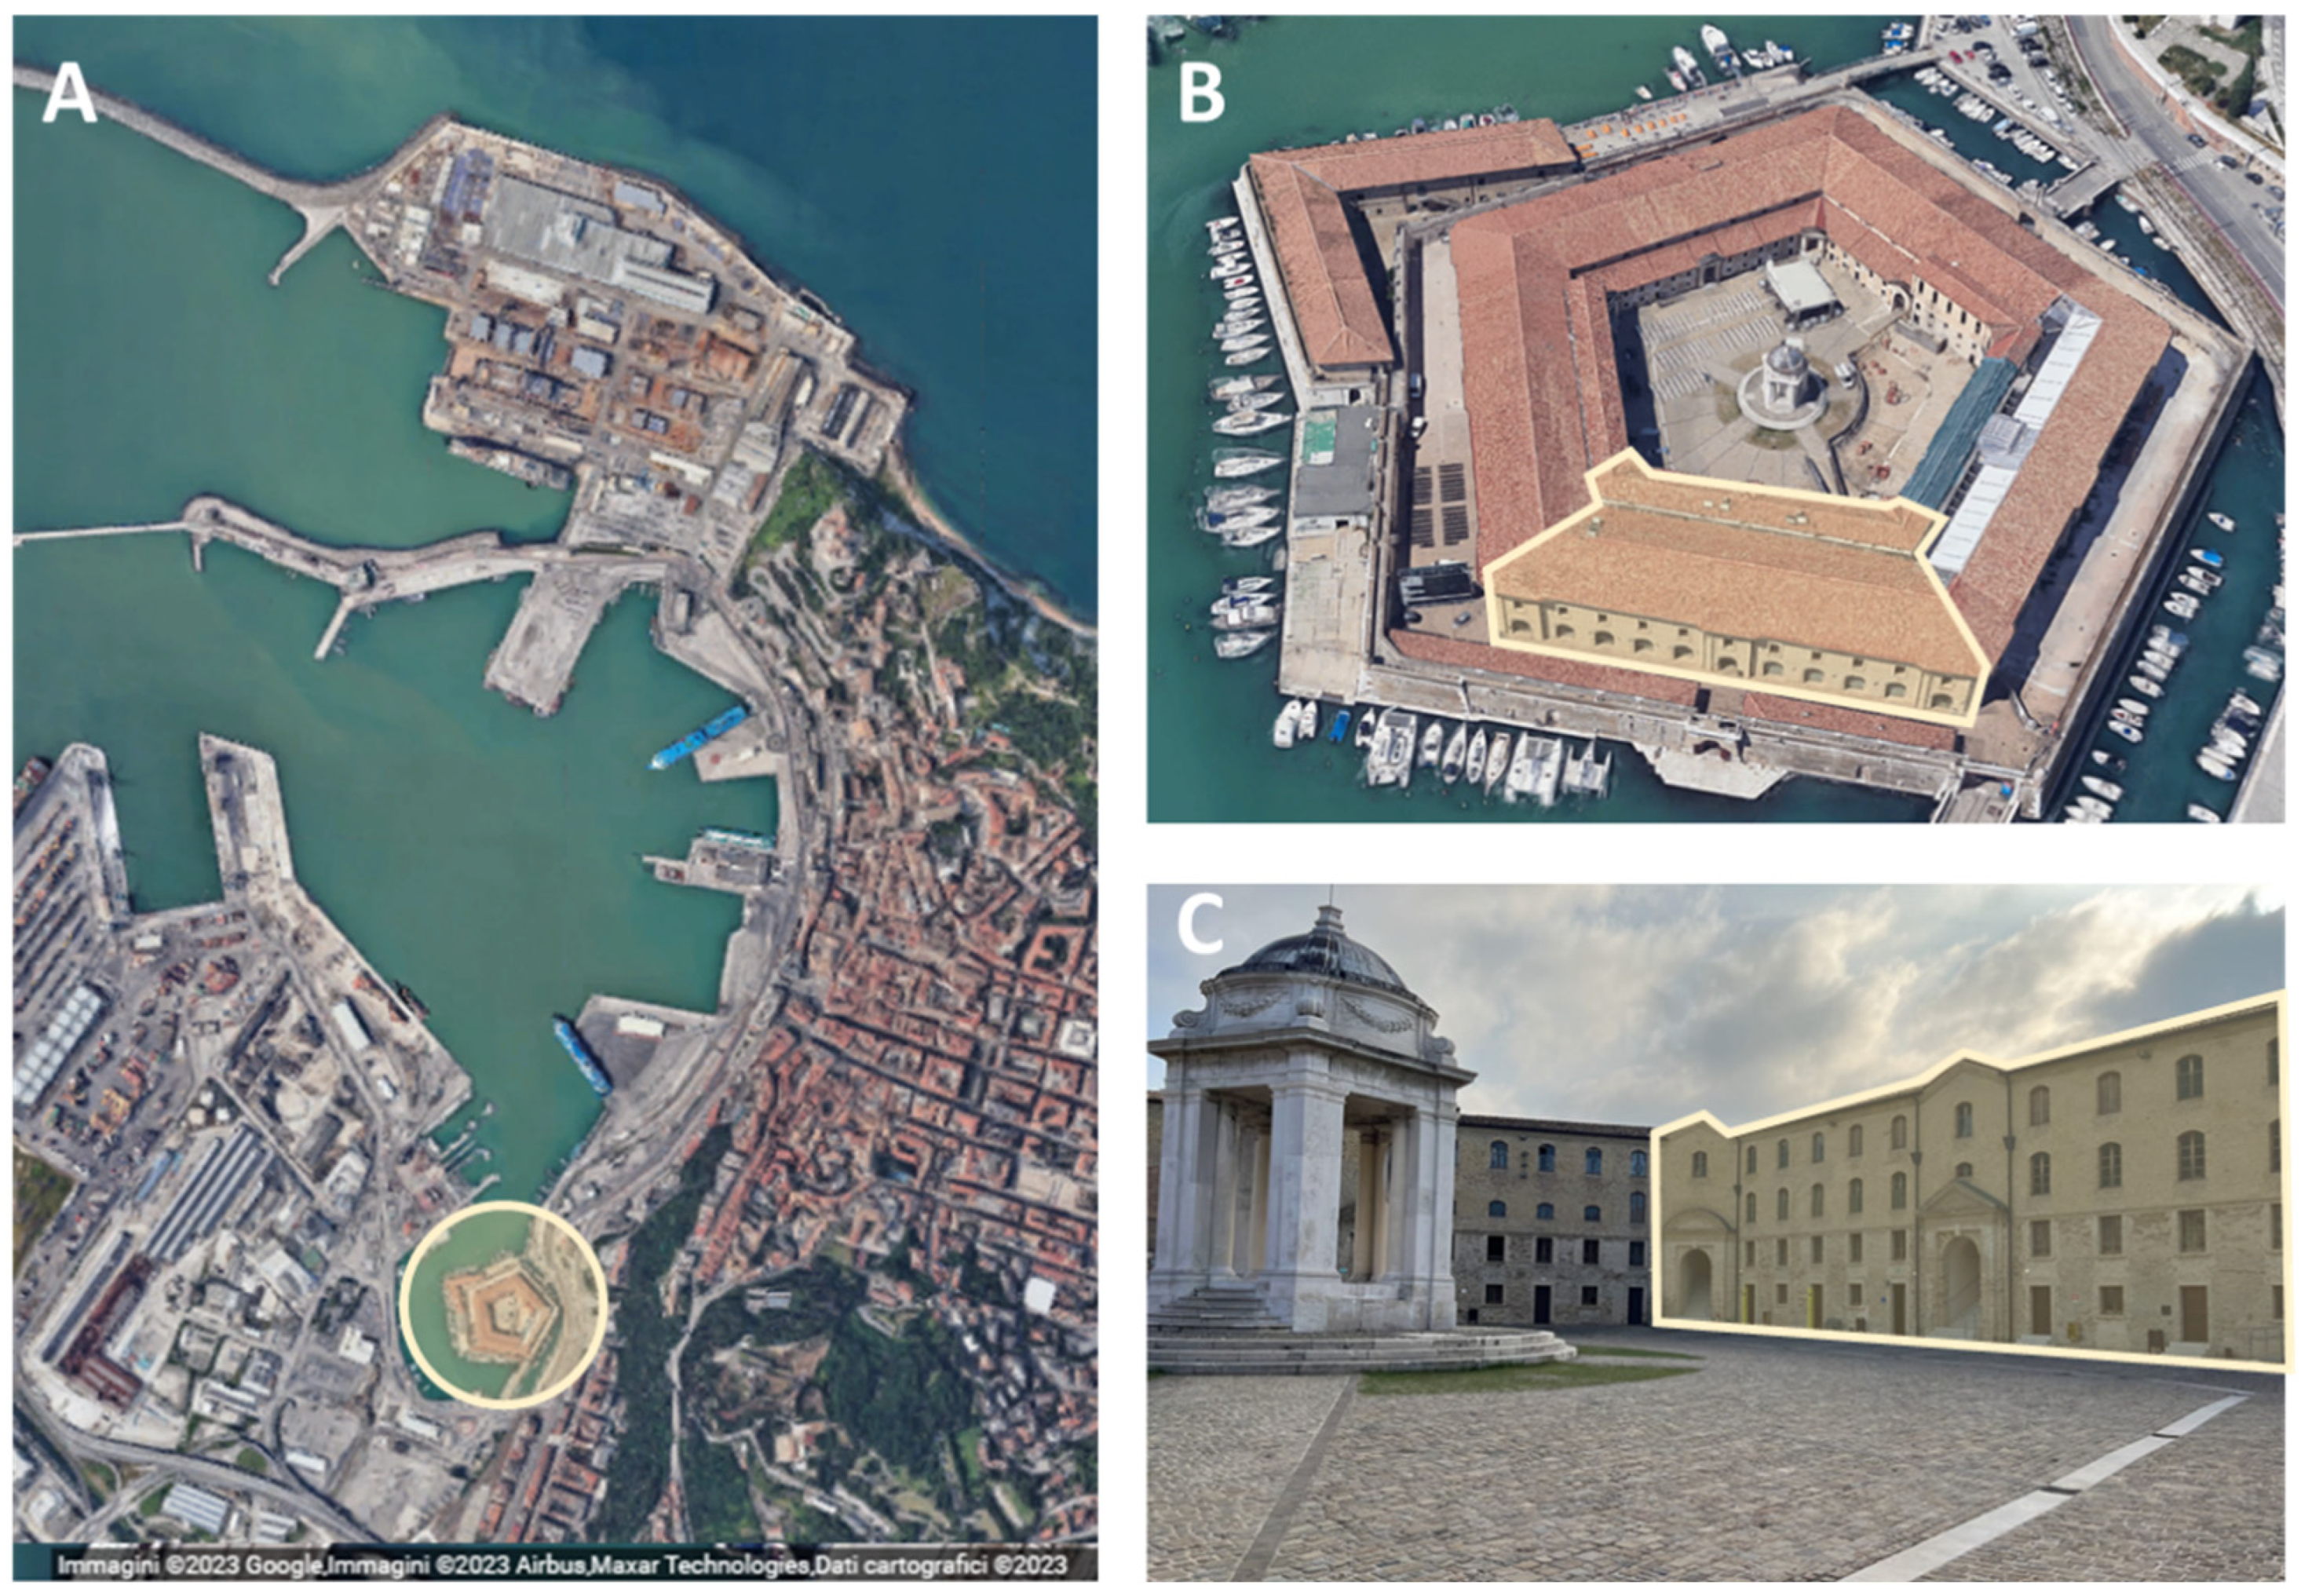
The work is organised according to the framework in Figure 1, which also includes the outlines of the related results sections. In the first phase, a full-scale evacuation drill was organised in the case study (Section 2.1). This full-scale drill was organised according to typical day-use conditions and the established emergency evacuation plan, and the results were analysed (Section 2.2). The second phase concerned the definition of the rapid setup of a commercial evacuation simulator, based on the experimental inputs (Section 2.3). Finally, the third phase concerned a comparison of the drill and simulation results for verification purposes (Section 2.4).

2.1. The Case Study

The State Tactile Museum “Omero”1 of Ancona, Italy, was selected as a relevant case study for this work since it normally hosts vulnerable occupants and is placed in a significant historic building.
The museum was created to promote the cultural growth of all vulnerable people, and, in particular, make art known through touch, and, thus, it is accessible to everyone including people with visual disabilities. Besides such vulnerable people, typical visitors of the museum are children (school groups) and the elderly, who are engaged in different learning and cultural events over the whole year.
The museum is located inside the “Mole Vanvitelliana”, located within the Ancona harbour (Figure 2A) [47,48]. Built between 1733 and 1743, and being one of the main landmarks of the city and harbour, the “Mole” is a historic masonry building that is composed of five levels, has a pentagonal shape, and hosts a small temple within the central courtyard (Figure 2B). The “Mole” was designed for multifunctional purposes, i.e., as quarantine places for travellers and goods, port warehouses and fortification. During the XIX century, the “Mole” was adapted into a sugar refinery, and then, in the XX century, it was adapted into a tobacco pressing factory. Complete regeneration actions have been carried out since 1989 by promoting its restoration and reuse for concerts, public events, and exhibitions, including the ones of the “Omero” museum (Figure 2C).
Figure 3 offers an overview of the museum levels, showing that the overall layout relies on a generally axial symmetry, thus being divided into two main sides (left and right). The building entrances are placed on the ground level (ground-level exit on the left side of the building—GEL) and the 1st level (first-level exit on the left side of the building–FEL) and they serve as safety exits. An additional safety exit is placed on the 1st level (first-level exit on the right side of the building—FER). GEL, FEL and FER are then connected to the central courtyard (Figure 2C) by external stairs. The 1st level also hosts the building service (BS) area, which includes the ticket office and the reception, as well as a permanent exhibition area (1st-level exhibition area on the left side of the building—1EL and 1st-level exhibition area on the right side of the building—1ER). The 2nd level hosts additional exhibition areas (in particular, during the test, the right side of the building was assumed to be unavailable due to the presence of fire/smoke, and, thus, only the 2nd-level exhibition area on the left side of the building—2EL was considered) and laboratory areas for school groups (2nd-level laboratory area on the left side of the building—2LL and 2nd-level laboratory area on the right side of the building—2LR). The 3rd level only comprises the administration offices—3OA, with limited access to the public.
Figure 3 also traces the following:
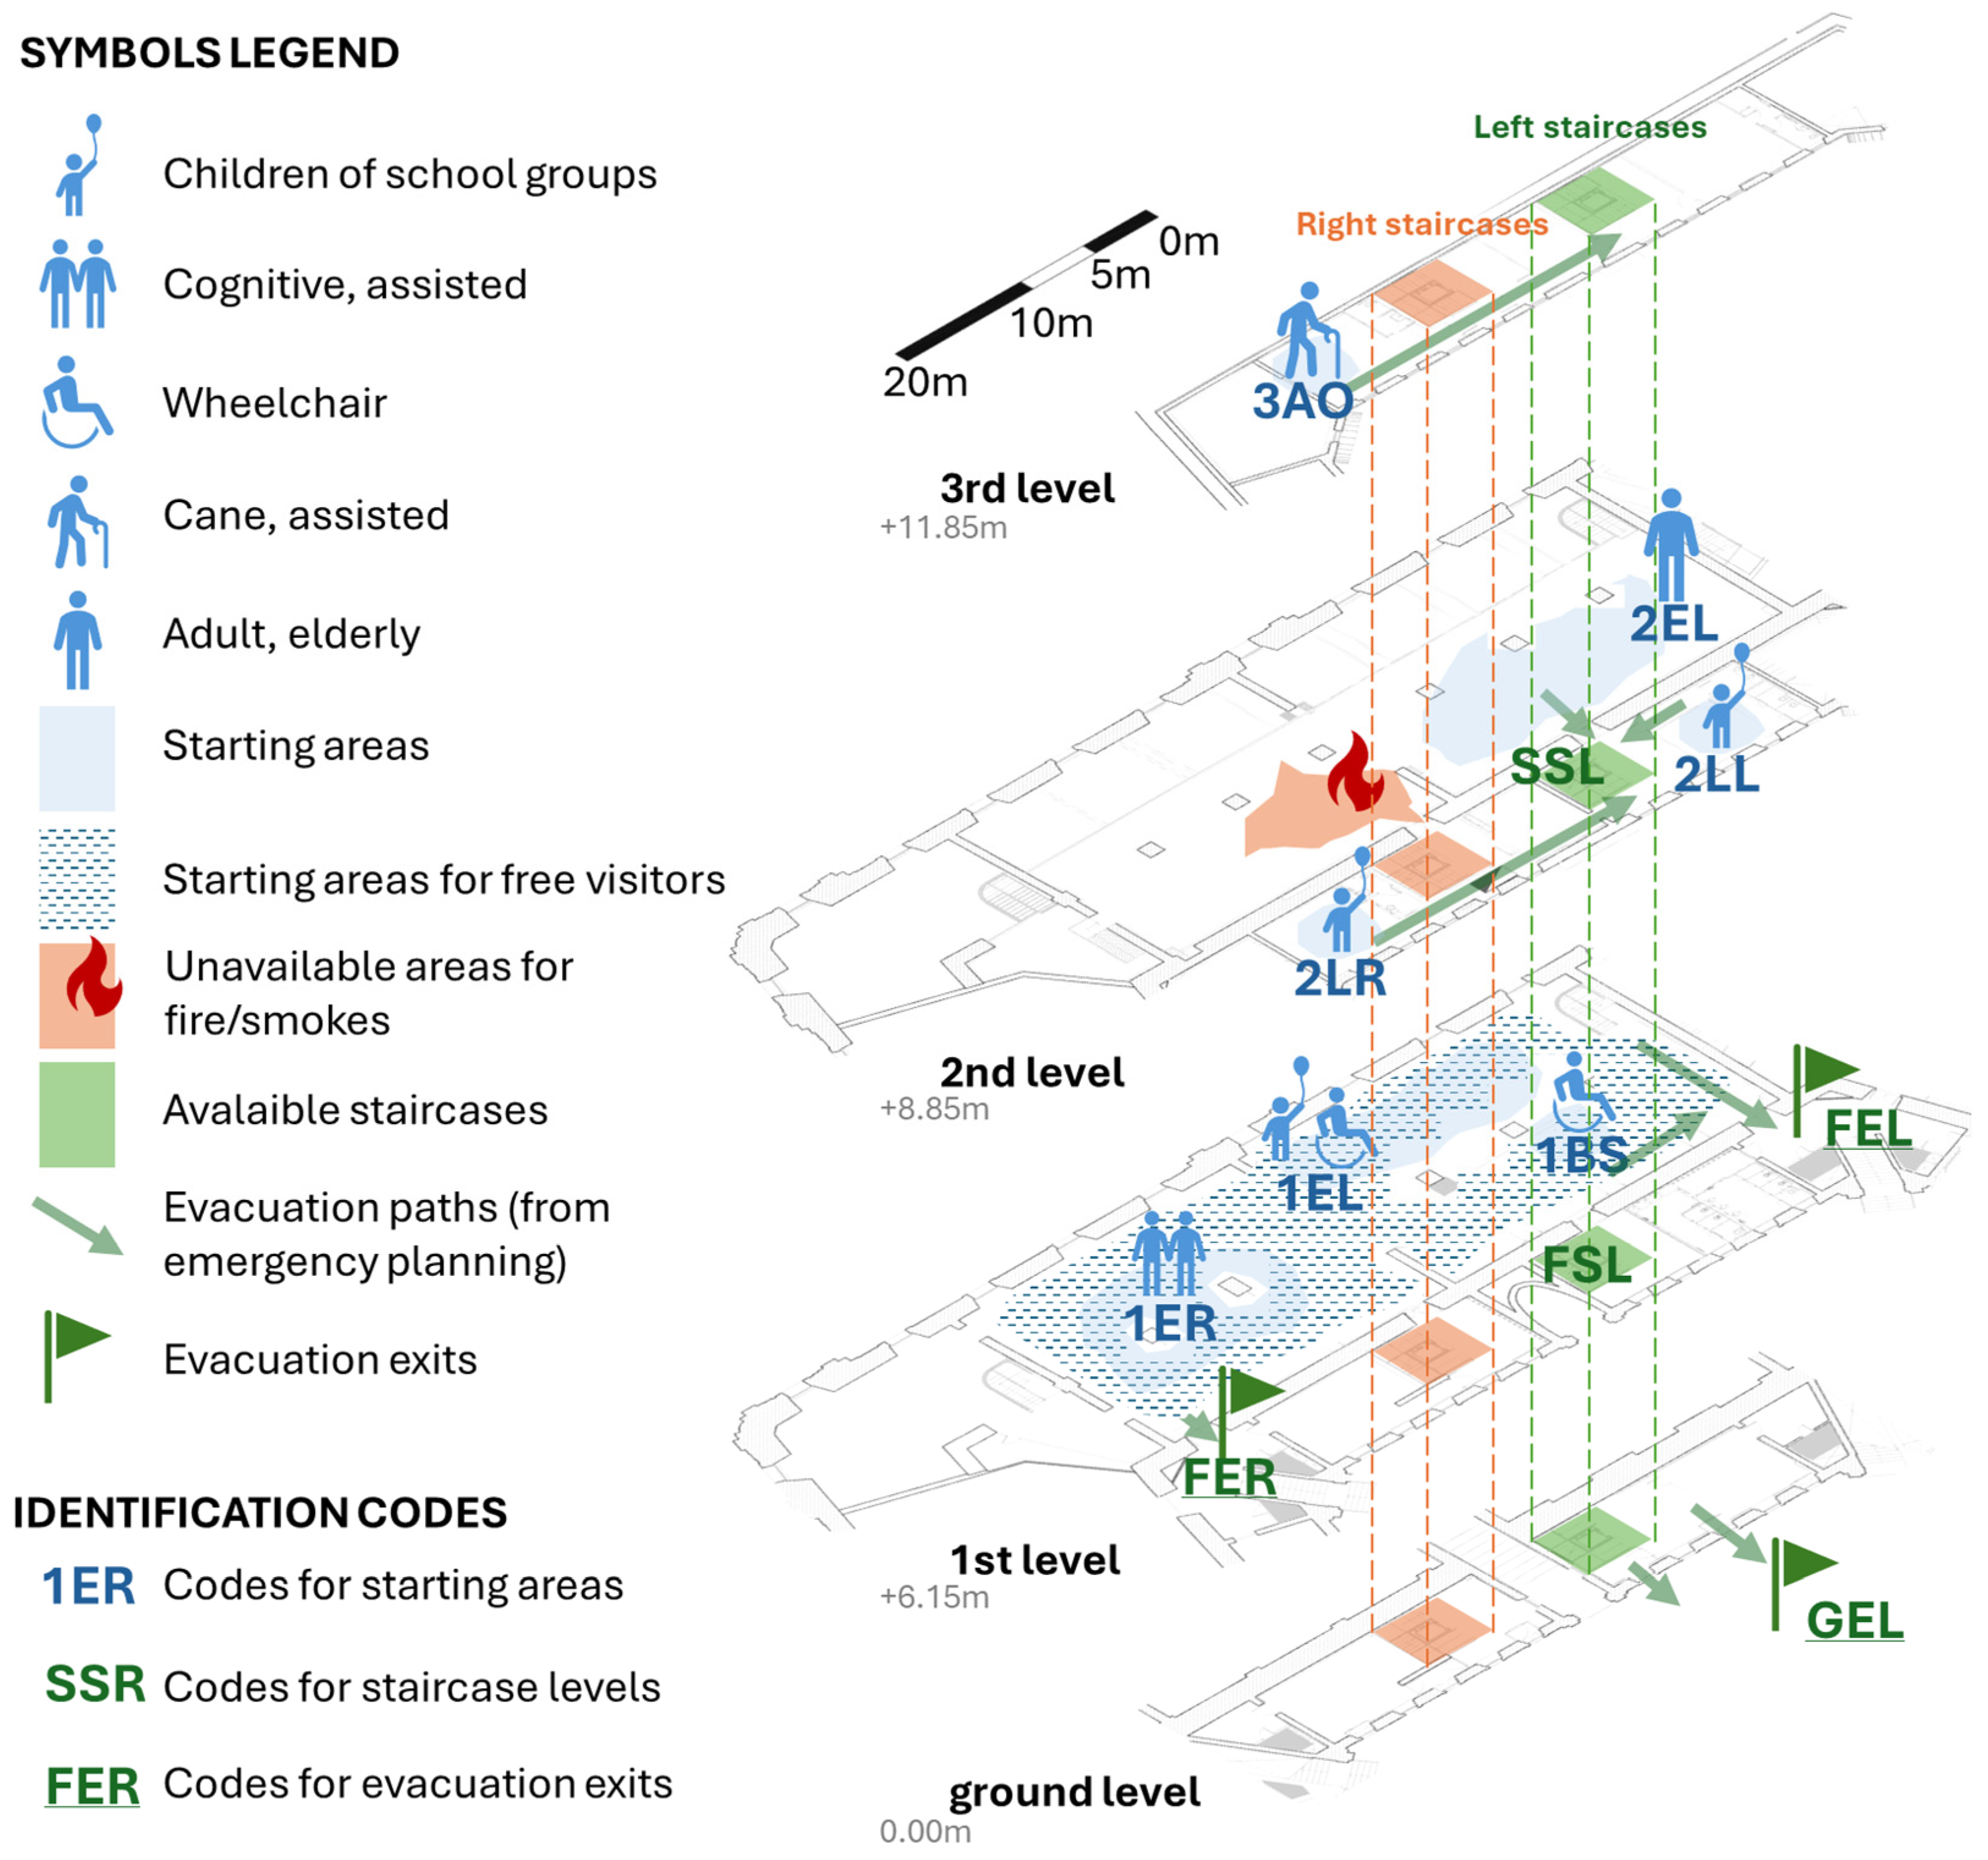
  • the starting areas (in blue), where occupants were placed when the drill started, including those for free visitors (dashed blue areas), according to Section 2.2, by outlining symbols for their main vulnerability-related typologies, according to Table 1 data;
  • the evacuation paths according to the museum emergency plan (green arrows);
  • the staircases, by outlining their availability (in green) and unavailability (in light orange), and the related intermediate areas monitored during the drill (i.e., first and second level of staircases on the left side of the building, respectively FSL and SSL), according to Section 2.2;
  • the final evacuation exits (by green flag), which are GEL, FEL and FER.
The current museum emergency evacuation layout and plan (including evacuation paths and exits, wayfinding signage, staff rules, and emergency procedures) fully respect Italian regulations regarding fire safety, e.g., DM n. 569, 20 May 1992, [49].

2.2. Experimental Drill

The full-scale evacuation drill was performed in collaboration with the museum administration and emergency management offices, as well as with the firefighters’ local command of Ancona. According to Table 1, 107 people voluntarily attended the full-scale drill. For safety issues, the drill was announced, although the starting time was not communicated to them. All the volunteers (except the members of the emergency staff and the administration office) declared being unfamiliar with the museum, and none of them was previously involved in training activities about the emergency procedures, nor informed of the evacuation plan and exit routes.
Table 1 traces the position and typology of drill participants according to the overview of the museum offered in Figure 3. In particular, 61% of participants were vulnerable people, most of them being children from school groups (36% of the total number of participants). For safety reasons, an elderly occupant initially placed on the 3rd level did not participate in the main evacuation process and started moving later, being assisted by a staff member. Furthermore, the emergency staff was composed of adults, and they were homogeneously placed within the building, according to the emergency plan.
The drill was performed during opening times, in typical normal use of the museum. According to the emergency procedures, the building fire alarm rang to point out a fire emergency implying evacuation, and the evacuation time started. The emergency staff assisted the other occupants as defined by the emergency procedures and plan, thus also ensuring the proper selection of evacuation paths. The drill was performed in free-of-smoke conditions, although one of the stairs (see the orange areas in Figure 3) was considered unavailable due to fire and smoke presence. The drill ended when the last building occupant exited from the museum, crossing one of the exits shown in Figure 3.
To obtain a complete overview of the process, fixed video cameras were placed along the evacuation paths, i.e., pointing at the starting areas, the monitored areas along the staircases and the safety exits. Evacuation path choices and timings were retrieved by manually analysing the recorded videotapes and defining evacuation curves for each monitored intermediate area (i.e., SSL, FSL) and exit (i.e., FEL, FER, GEL). In particular, concerning evacuation timing [s], besides pre-movement times by starting areas, the minimum time Tmin (first occupant exiting the building), median time T50, time at which 95% of occupants arrived at one of the building exits T95, and maximum time Tmax (last occupant exiting the building, thus equal to the Required Safe Egress Time) [32] were considered to describe the drill conditions from an overall perspective. In addition, the evacuation flows [persons/s] in respect of T50, T95 and Tmax were calculated as the ratio between the related number of occupants arriving at the building exits and the time differences between the considered timing and Tmin. This kind of indicator traced the rapidity of the process between different moments in the evacuation curves, thus approximating the slope of the curve. Such data were calculated for each exit and the whole process.
Moreover, an occupant evacuation speed assessment was provided by mainly considering data at the monitored intermediate areas and while approaching the evacuation exits to verify the consistency of results with individual speed setup-based values (see Section 2.3 and Appendix A). Speeds (approximated to 0.1 m/s) were organised by occupant vulnerability to fulfil this goal and by local density (approximated to 0.05 persons/m2) to evaluate if the results were affected or not by relevant crowding conditions with respect to those of typical (quasi-)free-flow motion within the fundamental diagrams of evacuation dynamics [29].

2.3. Rapid Setup Definition for Evacuation Simulation

The evacuation process was then replicated using Oasys MassMotion 11.0 [46]. This simulation tool allows for the easy representation and analysis of the dynamics of crowds in a built environment, in both normal use and emergency conditions, and has been previously verified according to international standards and used by the working group for setup and validation tests in other contexts (e.g., floods) [40]. MassMotion relies on a multi-agent simulation logic, which allows for the representation of evacuation interactions at a microscopic level for each simulated occupant, who is characterised by specific movement (e.g., path choice), size, speed and individual abilities. Evacuation motion rules are based on the Social Forces Model, in which each occupant is subject to repulsion (e.g., to avoid physical contact) and attraction (e.g., to reach an exit) forces with respect to the surrounding built environment elements and occupants [50]. In view of the above, also considering other commercial and generic evacuation simulators [35], it can be considered that the selected tool relies on consolidated and complex logic from the microscopic perspective, that is with respect to the rules of simulated agents, while setup-based logic can be applied by low-trained technicians, who have just to calibrate the basic parameters of the simulator (as discussed in the following sections).
The physical layout of the museum was modelled with Autocad and Revit2, starting from the floor plans in Figure 3. To avoid changes to the source code, the quick setup of occupants’ behaviours in the simulator mainly concerned their features that could be directly defined through existing interfaces, which were calibrated according to the drill data. The setup data are reported in Appendix A and they include the following:
  • The general evacuation model parameters, which refer to the starting areas for the evacuation process, where occupants were placed according to a uniform (randomised) distribution in space, and the monitored intermediate areas and exit, defined according to the emergency plan of the building in relation to the starting areas (considering that all the simulated people effectively selected the proper evacuation path). These data are based on Table 1.
  • The individual model parameters, which referred to speed and height. In detail, individual speed was randomly assigned depending on the distribution values (i.e., triangular distributions with minimum, mean and maximum values) derived from literature works and standards, depending on the typology of occupants [28,29,46]. Individual height was not used in the simulation since the smoke effects on motion were not considered, according to the free-of-smoke conditions of the drill.
The proposed setup then considered that occupants were randomly generated within the starting areas, according to the overall distribution shown in Table 1 and Appendix A, and, thus, the effective starting evacuation point for each simulated occupant varied in each simulation [46]. Furthermore, a pre-movement time was also associated with the occupants to represent the time necessary to hear the alarm and prepare for the evacuation (i.e., including interactions between occupants and staff to exchange information on the evacuation plan) [28,43,51]. Pursuing a quick setup approach, pre-movement times were defined according to preliminary videotape analysis of the drill (compare Section 2.1).
At least 10 simulation “runs” were performed to take into account behavioural uncertainties due to occupant speeds (see Appendix A) and starting positions. The convergence of the main evacuation indicators for the whole process and each of the building exits and main monitored intermediate areas was then verified [40,41]. In particular, Euclidean Relative Difference ERD, Secant Cosine SC and Euclidean Projection Coefficient EPC (which are described in Table 2) were used for convergence assessment purposes to estimate the impact of the number of “runs” on the specific indicator. In this case, the measure of the convergence of two relative indicators was performed by considering two consecutive average evacuation curves.
As for drill results, the considered main simulation outputs are based on evacuation paths, curves and timings at the monitored intermediate areas and safety exits.

2.4. Indicators for Comparison and Verification

To verify the reliability of the evacuation model in the case study, two different comparisons were carried out between the experimental drill and the MassMotion simulation results, according to consolidated literature works [40,41]. First, a graphical comparison of the evacuation curves was performed to give a preliminary check of the overall trend.
Then, the literature-based indicator comparison allowed us to quantitatively investigate differences between real-world and setup behaviours. These analyses were carried out for the whole process and each monitored intermediate area/exit of the museum. T95 [s] was used to evaluate the differences in the overall evacuation process by excluding the effects of behavioural outliers due to specific aspects in crowd motion (extreme values in the distribution of occupant initial position, evacuation path choice and individual speed) [40,41]. In this sense, the percentage difference between T95 in the simulations and drill was calculated because the simulations were affected by stochastic effects, as discussed in Section 2.3 [46].
The other adopted indicators are summarised in Table 2, providing their meaning and interpretation, as well as the calculation equations. They were used to measure differences between the experimental and simulation curves in terms of shape, distance and scale [40,41] by focusing on the overall effects of the vulnerable occupants’ presence rather than just examining their specific performance in evacuation. In particular, ERD, SC and EPD were calculated considering the whole experimental curve and the whole average simulation curve. DAUC was calculated at different percentiles of evacuation time, that is, the 5th percentile, to analyse the arrival of the first occupants but excluding behavioural outliers placed too close to an exit or with significantly high evacuation speeds; the 50th percentile, to analyse median and thus recurrent behaviours in cases of non-normal evacuation time distributions; the 95th percentile, in relation to T95, as discussed above; and the 100th percentile, that is at Tmax, to determine the arrival of the last occupant to the building exits.
To confirm proper verification goals, ERD, SC and EPD were acceptable if they were close to the interpretation values expressed in Table 2, while the percentage acceptability threshold for the percentage difference of T95 and the DAUC values was set up to about 10% [40].

3. Results

3.1. Drill Results

Occupants evacuated the building in an orderly manner, thanks to the direct support of the staff members, who ensured that the emergency procedures of the museum were adopted. A pre-movement phase was noticed [28,51]. Occupants collected information about the emergency and the proper procedure to be adopted, thanks to the direct support of the staff members. Differences among the different areas of the museum (Figure 3) were noticed, leading to pre-movement time values of 40s for 1ER and 1EL, 85s for 2EL, 87s for 2LR, 95s for 2LL, and 110s for 3AO. In general terms, these values seemed to be in line with those of previous works [45]. Nevertheless, in each starting area, occupants started to evacuate almost at the same moment, and, thus, the same pre-movement time was considered for them. These data were then used in simulations, as defined in Section 2.3.
A high level of interaction between staff and occupants (to provide direct help and exchange information) was also noticed in the movement phase, ensuring that the chosen paths were consistent with the ones of the emergency plan. In this sense, as expected, no occupant selected paths towards FER since it was considered unavailable due to fire and smoke. A wider discussion of such interactions is provided in Section 3.2 in comparison with the outcomes of the evacuation simulator.
Table 3 summarises the evacuation process statistics through Section 2.2 indicators. Flow values for the whole building and each exit demonstrated how the evacuation was performed in an orderly manner, being almost constant at the values corresponding to T50 and T95. Nevertheless, the FER exit did not have the same trend due to the limited number of occupants selecting the door and the short time difference between T50 and T95. Differences between the flows for T95 and Tmax were essentially due to the “rapidity” reduction in the evacuation process for the last occupants, e.g., due to their speed and unfavourable initial position or other group phenomena slowing down their movement. In this sense, it is also worth noting that Tmax and T95 for the whole building are essentially affected by data on GEL. Slight differences existed between T95 and Tmax, without considering the evacuation process of the blind, assisted occupant initially placed at 3AO. In fact, this occupant and the assisting adult exited in a much longer time (371 s) for safety reasons during the drill. As a consequence, this value was filtered by further evaluation and the verification process, being “anomalous” in view of the drill participation rules. Moreover, this also points out that the safety of the egress process can be affected by additional critical vulnerability-related conditions. Appendix B also shows Tmax values by starting areas.
Finally, Figure 4 shows a boxplot representation of the individual evacuation speeds of occupants, considering their vulnerability (Figure 4A) and the surrounding density (Figure 4B). Values refer to movement along horizontal paths, considering the monitored intermediate areas and the areas near the evacuation exits. Data of occupants with disabilities (i.e., assisted children in a wheelchair, assisted and unassisted adults with cognitive disability, and assisted elderly with cane) were grouped within the same group (Figure 4A), with the statistical dimension of these samples being lower than those of the other categories (compare with Section 2.1 and Appendix A). Similarly, adults and staff were merged together when there was no specific vulnerability in motion. In general terms, Figure 4A confirms the general speed ranges adopted by the rapid setup, although some maximum values were slightly higher than those in the reference literature works, especially for the elderly and children [28]. Nevertheless, they represented a marginal sample related to extreme values. Minimum speed values of emergency staff and adults seemed to be slightly lower than the setup ones, essentially because they related to occupants who reduced their speed to wait for vulnerable occupants (compare with the behavioural dynamics discussed in Section 3.2). Nevertheless, values seemed to refer to quasi-free-flow conditions for occupant motions, according to the very limited density values shown in Figure 4B. This outcome confirms that the occupant modelling data in the rapid setup could be considered coherent with the experimental data.

3.2. Simulation Verification Results

Performing 10 simulations allowed us to reach adequate convergence for the ERD, SC and EPC values, as defined in Section 2.3 and shown in Appendix C. Thus, the number of repetitions seemed to be adequate to represent simulation outputs using the proposed setup of MassMotion.
Figure 5 offers a graphic comparison of the whole evacuation curve for the simulation model (grey curve) and experimental drill (blue curve), which shows the same general trend.
Figure 6 shows some video frames from the experimental drill, clarifying the main behaviours that provoked differences between the simulation and drill curves. In particular, such behaviours were correlated to the horizontal plateaus in the evacuation process, which were not simulated by the rapid setup simulation results but existed in the drills. In fact, in the drills, plateaus were linked to affiliative behaviours in the evacuation process, which were mainly noticed between vulnerable occupants and staff members. As shown in Figure 6, children tended to increase group cohesion, especially with the staff members, by gathering before moving (Figure 6A, related to the stair access at the second level, near SSL) and looking for staff members’ instruction (including directional ones), organising evacuation motion in non-single file (Figure 6B). The group cohesion confirmed the outcomes of previous works [52], although crowd congestion phenomena seemed to be less evident for the case study than in other contexts, in view of the limited density of occupants while moving along the staircases. In this sense, the staff organisation and actions could have played a paramount role in this outcome, and a generally low level of excitement by children seemed to be noticed too.
Nevertheless, the group cohesion phenomenon was not noticed in the simulator, which essentially adopted the quasi-single-file movement of occupants and thus made the curve “more homogeneous” than the drill one.
Figure 7 shows details of the evacuation curves by considering each of the building exits (Figure 7A) and the monitored intermediate areas (Figure 7B) according to simulations (grey) and the drill (blue). All the curves had the same trend and slope, thus confirming their similarity from a graphical perspective. Nevertheless, some differences could be noticed. In particular, the curve related to GEL in the drill (Figure 7A) showed the general presence of plateaus, which affected the whole evacuation curve regarding the aforementioned interaction and grouping behaviours among vulnerable occupants and staff members (see Figure 6B). Similarly, in the simulation, for the FSL gate, 40 s of delay was noticed in comparison with the drill data, while the two curves showed the same trend and slope. This delay could be attributed to two drill-noticed behaviours. First, children and staff members interacted by grouping and waiting before entering the staircase (see Figure 6A). Second, in the drill, the elderly initially placed in 2EL spent additional time interacting with staff members in door selection and use, and the staff members also checked the occupancy status of 2EL before leaving, according to the emergency procedures (see Figure 6D). The second phenomenon implied slight differences in the curves in Figure 7B referring to both SSL and these occupants’ arrival to FSL (FSL FROM SSL).
Considering the Section 2.4 indicators, Table 4 shows that these drill-noticed occupants’ organisation in evacuation and related behavioural uncertainties seemed to have quite a limited impact in quantitative terms since they were essentially linked to the aforementioned monitored intermediate areas and exits. In fact, SC, EPC and ERD values seemed to converge to ideal values for the whole evacuation curve and FEL. For FER, a good agreement about both general shape (SC) and scale factor (EPC) could be noticed. Nevertheless, the experimental curve showed the first occupants passing through the FER exit before what was noticed in simulations. This outcome affected the initial slope of the curve (i.e., between about 50 and 60 s), with the FER experimental values being higher than the simulation values. Therefore, ERD did not converge towards 0 and was higher than GEL and FEL. For SSL, FSL and FSL FROM SSL, agreement was confirmed about the shape (SC) due to the specific behaviours mentioned above. For GEL, only the angle between the simulation and drill curves (ERD) tended to converge due to the similarities in the starting and end points, but differences in SC and EPC demonstrated the local variability due to the aforementioned behavioural uncertainties.
According to Table 4, the general modelling reliability was also demonstrated by the percentage differences in T95, for the whole curve and the specific building exits, which were all significantly < 10%. Nevertheless, in simulations, Tmax = 267 s, thus being >10% with respect to experimental Tmax (see Table 3). Although this result confirmed that some behavioural uncertainty and subtitles could affect the simulation results, the rapid setup could be considered valid since the evacuation process was overestimated according to T95, Tmax and DAUC.

4. Discussion

The case study used for the definition and verification of the proposed rapid setup-based generic simulator provides promising insights into the applicability of the proposed approach (Section 4.1) and encourages future research on the matter (Section 4.2) and on model coupling with digital tools for building heritage (Section 4.3)

4.1. Key Findings

The results highlight the general reliability of the setup. In particular, the experimental curve trend for the whole process was close to the simulated curve, as shown by both graphical and literature indicator-based analysis. In simulations, the evacuation time at 95% of the exited occupants overestimated the drill, according to a conservative approach in risk assessment, but the overestimation was modest (around 0.4%) and below the literature threshold of 10%. This confirms the validity of the setup including the occupant behaviour, except for possible behavioural outliers [40,41]. In addition, the analysis of drill evacuation speeds for the occupants seemed to confirm the validity of literature-based assumptions on these selected parameters [27].

4.2. Limitations and Future Works

Considering the drill–simulation results comparisons, the use of a rapid setup seems to be unable to fully represent microscopic interactions between vulnerable occupants and between them and staff members due to grouping and affiliative phenomena during the evacuation process. Deeper setup procedures and source code modifications can be included to improve the assisted evacuation of vulnerable occupants, adapting previous modelling methods for, for instance, healthcare scenarios, where non-autonomous occupants are fully assisted in movement and thus can also move as a “compact” group [33,34]. In particular, staff members should first move towards vulnerable occupants (i.e., those who are placed closer) and organise them into groups, remembering social group concepts [53], e.g., managing their proximity. This can affect the pre-movement time too. Then, close contact among vulnerable occupants should be ensured by, for example, adding social attractive forces or limiting repulsive ones between simulated agents [34,50], modelling proximity-based rules relying on a sort of “maximum” social distance radius criteria [54] and, thus, even creating subgroups in evacuation motion, with occupants moving close one to each other. This can replicate hand-assisted movement and move from quasi-single-file to more “messy” movement of, for example, children. Integrating such approaches can impact the evacuation curve shape, making it more consistent with experimental data.
Considering that this work used a relevant but still single case study application for simulator verifications, it should be noted that specific features of real-world scenarios in terms of layout or emergency plans, other occupant vulnerabilities and their modelling could affect the verification results in other contexts. Thus, additional full-scale drills should be carried out to increase the validity of the comparison results and widely demonstrate the general trends provided by this work.
Nevertheless, as also remarked by previous research involving vulnerable occupants in public buildings [52], this work encourages further research about verification using full- or partial-scale drill results since these data can also be used in the context of other models and other experimental data can be used by replicating the setup methodology of this work. Then, application to real-world scenarios could be achieved by analysing different scenarios in terms of variations in the setup values about pre-movement, path choices and individual speed to verify the impact of these variables on fire evacuation risk. Nevertheless, to this end, actions aimed at experimental data collection and analysis should be coupled with modelling activities to create dependencies among the typology of occupants (among vulnerable ones and among vulnerable and non-vulnerable staff members) for each of these variables.
Therefore, this work represents a first step towards these goals, and additional drills should be performed in future works by involving other typologies of occupants regarding vulnerability and disability [26,28,45,52]. This can promote the development of a common database of related evacuation quantities. At the same time, the capabilities of the quick setup-based simulation tool demonstrate that it can be easily used by fire safety designers and decision-makers for real-world preliminary applications, confirming previous works on the same approach for other kinds of disasters [28].

4.3. Simulation Model Coupling in Digital Tools

As a final output of this research topic, such simulators could then be coupled with other consolidated digital tools [4,10,19,22], such as HBIM, to create a complete design suite exploring the different goals in architectural heritage use, conservation/retrofitting/adaptation/reuse, or Virtual Reality, to include the visualisation of data on common platforms and move towards training designers, stakeholders and occupants (both building staff and end-users, such as visitors) in the context of solutions exploitation (i.e., emergency safety procedures).

5. Conclusions

Digital technologies can support the conservation of architectural heritage, providing representation and simulation data that are useful to understand the impact of different strategies on heritage performances. Among these performances, fire safety surely represents a key issue, especially when considering historical buildings open to the public and hosting vulnerable occupants, such as museums.
Digital tools exploiting evacuation simulation can significantly support designers and stakeholders in identifying the most efficient but sustainable solutions (in terms of invasiveness and compatibility with heritage features) while considering their impact on the typologies of occupants, their mutual interactions within a crowd and their interactions with the built environment and emergency planning. According to this perspective, they could be reliable in understanding the effectiveness of easy-to-apply and low-impact strategies encompassing emergency and evacuation management. Nevertheless, verification tasks should be performed to determine the reliability of evacuation simulators before their application.
In this study, the rapid setup of an existing evacuation simulation model was provided to pursue applicability quickness, and verification was performed thanks to data from a full-scale evacuation drill in a historic museum hosting vulnerable occupants, like children, the elderly, and people with disabilities. The verification performed by drill–simulation results comparisons encourages the future use of such kinds of digital tools in the process of balancing architectural heritage conservations and safety performance assessments. In particular, simulation-based analyses of compatible risk mitigation strategies for historic public buildings would consider management, wayfinding and alter systems, non-invasive layout adaptation, and occupancy areas organisation, and be oriented towards vulnerable occupants and their evacuation behaviours.

Author Contributions

Conceptualisation, M.D., G.B. and E.Q.; methodology, M.D., G.B. and E.Q.; software, M.C. and G.B.; validation, G.B.; formal analysis, M.C. and G.B.; investigation, G.B.; resources, M.D. and E.Q.; data curation, M.C. and G.B.; writing—original draft preparation, M.C. and G.B.; writing—review and editing, M.D. and E.Q.; visualisation, G.B.; supervision, M.D. and E.Q.; project administration, M.D. and E.Q.; funding acquisition, M.D. and E.Q. All authors have read and agreed to the published version of the manuscript.

Funding

This research received no external funding.

Data Availability Statement

Organised data from the experiments are included in this article. Additional raw datasets on the full-scale evacuation drill and simulations will be made available upon reasonable request.

Acknowledgments

The authors thank the Command and Fire Station of Ancona (Italy) of the “Department of Firefighters, Public Rescue and Civil Defence (Corpo Nazionale dei Vigili del Fuoco)”, and, in particular, Mariano Tusa for the experiment authorisation and precious support that was provided during the drill and the Museo Omero (AN, Italy) organisation and its staff for the experiment authorisation and proactive participation in the drills. The software license of the MassMotion simulation software was supplied to the researchers by Oaysis Ltd. in the context of the Mutual Non-Disclosure Agreement “Simulating human behaviours during emergencies to improve the safety of buildings: testing and validation of the MassMotion simulation software”.

Conflicts of Interest

The authors declare no conflicts of interest.

Ethics Statement

According to other similar studies also performed by our research group at the Università Politecnica delle Marche-DICEA department [24], ethical issues included the need to properly and fully inform volunteers about the experiment procedures and the analysed data, in collaboration with the Command and Fire Station of Ancona and the Museo Omero staff and managers. No sensitive information was collected, and data were anonymised.

Appendix A. Occupant Modelling Details

Table A1. Occupant-related setup within the simulation model, according to Section 2.3 criteria, in terms of egress model parameters (i.e., type, number, starting point and chosen exit, referring to Figure 3). Data are consistent with those of Table 1. * Disabled occupant is part of the staff; ^ the occupants are administration office members.
Type of OccupantNumber of OccupantsStarting AreasChosen Exit
Adult in a wheelchair, unassisted *1BSFEL
Staff member2BSFEL
Adult71ELFEL
Child131ELFEL
Staff member11ELFEL
Child in a wheelchair, assisted11ELFEL
Free visitor2BSFEL
Staff member21ERFER
Adult31ERFER
Adult with a cognitive disability41ERFER
Adult + elderly person192ELGEL
Staff member22ELGEL
Free visitor (adult + elderly person)41EL and 1ERGEL
Elderly person with cane, assisted11EL and 1ERGEL
Child132LLGEL
Staff member12LLGEL
Child with disability12LLGEL
Adult32LLGEL
Child132LRGEL
Adult + elderly person62LRGEL
Staff member22LRGEL
Adult ^ + elderly person ^43AOGEL
Table A2. Literature-based [27] occupant-related setup within the simulation model, in terms of individual model parameters (i.e., speed and height), by distinguishing vulnerable occupants and other occupants. * Same speed for the vulnerable occupant and their assisting member of staff or adult.
Type of OccupantMin Speed [m/s]Mean Speed [m/s]Max Speed [m/s]Height [m]
Vulnerable occupants:
Child in a wheelchair, assisted *0.300.600.901.00
Child0.600.901.201.00
Adult with cognitive disability, assisted *0.630.931.231.75
Adult in a wheelchair0.390.690.991.30
Elderly person0.801.041.541.75
Elderly person (with cane, assisted) *0.260.811.601.75
Other occupants:
Staff member *1.051.351.651.75
Adult *0.941.241.541.75

Appendix B. Evacuation Timing Data

Table A3. Maximum evacuation time based on the initial position and chosen exit. ^ Assisted elderly occupant.
DescriptionTmax [s]Chosen Exit
1st level, building services (BS)128FEL
1st level, exhibition area, left side (1EL)99FEL
1st level, exhibition area, right side (1ER)70FER
2nd level, exhibition area, left side (2EL)188SSL-GEL
2nd level, laboratory areas, left side (2LL)231GEL
2nd level, laboratory areas, right side (2LR)186GEL
3rd level, administration offices (3AO)237; 371 ^GEL
1st level, exhibition area (1EL and 1ER)117FEL

Appendix C. Convergence Measurements

Table A4. Convergence measurements performed on the 10 simulations of the test setup.
Indicator [Unit of Measure]TOTGELFERFELSSLFSLFSL from SSL
ERD [-]000.020.010.060.010.02
SC [-]1.02111111
EPC [-]1.0111.0111.0410.99

Appendix D. Notations

Table A5. Notations table.
Symbols and AcronymsDefinitionUnit of Measure
FEL, FERBuilding exits on the 1st floor, see Section 2.1-
GELBuilding exits on the ground floor, see Section 2.1-
SSL, FSLMonitored intermediate areas, see Section 2.1-
BS, 1EL, 1ERStarting areas on the 1st floor, see Section 2.1-
2EL, 2LL, 2LRStarting areas on the 2nd floor, see Section 2.1-
3AOStarting areas on the 3rd floor, see Section 2.1-
EPDVerification indicator concerning “Euclidean Projection Coefficient”, see Section 2.4[-]
ERCVerification indicator concerning “Euclidean Relative Difference”, see Section 2.4[-]
DAUCVerification indicator concerning “Difference of the Area Under the Curves”, see Section 2.4[%]
SCVerification indicator concerning “Secant Cosine”, see Section 2.4[-]
T50Median evacuation time, that is, the time at which 50% of occupants arrived at one of the building exits, see Section 2.2[s]
T95Time at which 95% of occupants arrived at one of the building exits, see Section 2.2 and Section 2.4[s]
TminTime needed by the first occupant to exit the building, see Section 2.2[s]
TmaxTime needed by the last occupant to exit the building, see Section 2.2 and Section 2.4[s]

Notes

1
Available online: https://www.museoomero.it/en/ (accessed on 15 September 2023).
2
Autocad Version 2024. Available online: https://www.autodesk.it/products/autocad (accessed on 9 May 2024); Revit version 2024, https://www.autodesk.it/products/revit ( access on 15 September 2023)–educational license

References

  1. Crisan, A.; Pepe, M.; Costantino, D.; Herban, S. From 3D Point Cloud to an Intelligent Model Set for Cultural Heritage Conservation. Heritage 2024, 7, 1419–1437. [Google Scholar] [CrossRef]
  2. Lucchi, E. Digital Twins for the Automation of the Heritage Construction Sector. Autom. Constr. 2023, 156, 105073. [Google Scholar] [CrossRef]
  3. Elabd, N.M.; Mansour, Y.M.; Khodier, L.M. Utilizing Innovative Technologies to Achieve Resilience in Heritage Buildings Preservation. Dev. Built Environ. 2021, 8, 100058. [Google Scholar] [CrossRef]
  4. Lovell, L.J.; Davies, R.J.; Hunt, D.V.L. The Application of Historic Building Information Modelling (HBIM) to Cultural Heritage: A Review. Heritage 2023, 6, 6691–6717. [Google Scholar] [CrossRef]
  5. Elnagar, E.; Munde, S.; Lemort, V. Energy Efficiency Measures Applied to Heritage Retrofit Buildings: A Simulated Student Housing Case Study in Vienna. Heritage 2021, 4, 3919–3937. [Google Scholar] [CrossRef]
  6. Iliopoulou, T.; Dimitriadis, P.; Koutsoyiannis, D. Pluvial Flood Risk Assessment in Urban Areas: A Case Study for the Archaeological Site of the Roman Agora, Athens. Heritage 2023, 6, 7230–7243. [Google Scholar] [CrossRef]
  7. Naziris, I.A.; Mitropoulou, C.C.; Lagaros, N.D. Innovative Computational Techniques for Multi Criteria Decision Making, in the Context of Cultural Heritage Structures’ Fire Protection: Case Studies. Heritage 2022, 5, 1883–1909. [Google Scholar] [CrossRef]
  8. Rebec, K.M.; Deanovič, B.; Oostwegel, L. Old Buildings Need New Ideas: Holistic Integration of Conservation-Restoration Process Data Using Heritage Building Information Modelling. J. Cult. Herit. 2022, 55, 30–42. [Google Scholar] [CrossRef]
  9. Khalil, A.; Hammouda, N.; El-Deeb, K. Implementing Sustainability in Retrofitting Heritage Buildings. Case Study: Villa Antoniadis, Alexandria, Egypt. Heritage 2018, 1, 57–87. [Google Scholar] [CrossRef]
  10. Castellazzi, G.; Cardillo, E.; Lo Presti, N.; D’Altri, A.M.; de Miranda, S.; Bertani, G.; Ferretti, F.; Mazzotti, C. Advancing Cultural Heritage Structures Conservation: Integrating BIM and Cloud-Based Solutions for Enhanced Management and Visualization. Heritage 2023, 6, 7316–7342. [Google Scholar] [CrossRef]
  11. De Fino, M.; Galantucci, R.A.; Fatiguso, F. Condition Assessment of Heritage Buildings via Photogrammetry: A Scoping Review from the Perspective of Decision Makers. Heritage 2023, 6, 7031–7067. [Google Scholar] [CrossRef]
  12. Lucchi, E. Review of Preventive Conservation in Museum Buildings. J. Cult. Herit. 2018, 29, 180–193. [Google Scholar] [CrossRef]
  13. Rolim, R.; López-González, C.; Viñals, M.J. Analysis of the Current Status of Sensors and HBIM Integration: A Review Based on Bibliometric Analysis. Heritage 2024, 7, 2071–2087. [Google Scholar] [CrossRef]
  14. Tahoon, D.; El-Zohairy, A.; Hendawy, H.I. Cost Impact Comparative Analysis via BIM between Heritage Regular Maintenance Projects and Long-Term Restoration Projects—A Case Study. Heritage 2023, 7, 50–75. [Google Scholar] [CrossRef]
  15. Garcia-Castillo, E.; Paya-Zaforteza, I.; Hospitaler, A. Fire in Heritage and Historic Buildings, a Major Challenge for the 21st Century. Dev. Built Environ. 2023, 13, 100102. [Google Scholar] [CrossRef]
  16. Naziris, I.A.; Mitropoulou, C.C.; Lagaros, N.D. Innovative Computational Techniques for Multi-Criteria Decision Making, in the Context of Cultural Heritage Structures’ Fire Protection: Theory. Heritage 2022, 5, 1719–1733. [Google Scholar] [CrossRef]
  17. Bonazza, A.; Sardella, A. Climate Change and Cultural Heritage: Methods and Approaches for Damage and Risk Assessment Addressed to a Practical Application. Heritage 2023, 6, 3578–3589. [Google Scholar] [CrossRef]
  18. Guibaud, A.; Mindeguia, J.-C.; Albuerne, A.; Parent, T.; Torero, J. Notre-Dame de Paris as a Validation Case to Improve Fire Safety Modelling in Historic Buildings. J. Cult. Herit. 2023, 65, 145–154. [Google Scholar] [CrossRef]
  19. Taileb, A.; Dekkiche, H.; Sherzad, M.F. HBIM: A Tool for Enhancing the Diagnosis of Historical Buildings: The Case of St. George’s Memorial Anglican Church, Oshawa. Heritage 2023, 6, 5848–5866. [Google Scholar] [CrossRef]
  20. Gernay, T. Performance-Based Design for Structures in Fire: Advances, Challenges, and Perspectives. Fire Saf. J. 2023, 142, 104036. [Google Scholar] [CrossRef]
  21. Caliendo, C.; Ciambelli, P.; Del Regno, R.; Meo, M.G.; Russo, P. Modelling and Numerical Simulation of Pedestrian Flow Evacuation from a Multi-Storey Historical Building in the Event of Fire Applying Safety Engineering Tools. J. Cult. Herit. 2020, 41, 188–199. [Google Scholar] [CrossRef]
  22. Scorgie, D.; Feng, Z.; Paes, D.; Parisi, F.; Yiu, T.W.; Lovreglio, R. Virtual Reality for Safety Training: A Systematic Literature Review and Meta-Analysis. Saf. Sci. 2024, 171, 106372. [Google Scholar] [CrossRef]
  23. Marrion, C.E. More Effectively Addressing Fire/Disaster Challenges to Protect Our Cultural Heritage. J. Cult. Herit. 2016, 20, 746–749. [Google Scholar] [CrossRef]
  24. Bernardini, G. Fire Safety of Historical Buildings. Traditional versus Innovative “Behavioural Design” Solutions by Using Wayfinding Systems, 1st ed.; Springer International Publishing: Berlin/Heidelberg, Germany, 2017; ISBN 978-3-319-55744-1. [Google Scholar]
  25. Campinho, M.; Sidani, A.; Couto, A. Tools for Fire Safety in Historic Buildings: Review. In Occupational and Environmental Safety and Health V; Studies in Systems, Decision and Control; Arezes, P.M., Melo, R.B., Carneiro, P., Castelo Branco, J., Colim, A., Costa, N., Costa, S., Duarte, J., Guedes, J.C., Perestrelo, G., et al., Eds.; Springer: Cham, Switzerland, 2024; Volume 492, pp. 753–770. [Google Scholar]
  26. Hostetter, H.; Naser, M.Z. Characterizing Disability in Fire: A Progressive Review. J. Build. Eng. 2022, 53, 104573. [Google Scholar] [CrossRef]
  27. Salazar, L.G.F.; Romão, X.; Paupério, E. Review of Vulnerability Indicators for Fire Risk Assessment in Cultural Heritage. Int. J. Disaster Risk Reduct. 2021, 60, 102286. [Google Scholar] [CrossRef]
  28. Shi, L.; Xie, Q.; Cheng, X.; Chen, L.; Zhou, Y.; Zhang, R. Developing a Database for Emergency Evacuation Model. Build. Environ. 2009, 44, 1724–1729. [Google Scholar] [CrossRef]
  29. Bosina, E.; Weidmann, U. Estimating Pedestrian Speed Using Aggregated Literature Data. Phys. A Stat. Mech. Its Appl. 2017, 468, 1–29. [Google Scholar] [CrossRef]
  30. Tong, Y.; Bode, N.W.F. Simulation Investigation on Crowd Evacuation Strategies for Helping Vulnerable Pedestrians at Different Stages of Egress. Int. J. Disaster Risk Reduct. 2023, 84, 103479. [Google Scholar] [CrossRef]
  31. Kasemsarn, K.; Sawadsri, A.; Harrison, D.; Nickpour, F. Museums for Older Adults and Mobility-Impaired People: Applying Inclusive Design Principles and Digital Storytelling Guidelines—A Review. Heritage 2024, 7, 1893–1916. [Google Scholar] [CrossRef]
  32. Tinaburri, A. Principles for Monte Carlo Agent-Based Evacuation Simulations Including Occupants Who Need Assistance. From RSET to RiSET. Fire Saf. J. 2022, 127, 103510. [Google Scholar] [CrossRef]
  33. Abir, I.M.; Ibrahim, A.M.; Toha, S.F.; Shafie, A.A. A Review on the Hospital Evacuation Simulation Models. Int. J. Disaster Risk Reduct. 2022, 77, 103083. [Google Scholar] [CrossRef]
  34. Fu, L.; Qin, H.; He, Y.; Shi, Y. Application of the Social Force Modelling Method to Evacuation Dynamics Involving Pedestrians with Disabilities. Appl. Math. Comput. 2024, 460, 128297. [Google Scholar] [CrossRef]
  35. Kuligowski, E.D. Computer Evacuation Models for Buildings. In SFPE Handbook of Fire Protection Engineering; Springer: New York, NY, USA, 2016; pp. 2152–2180. [Google Scholar]
  36. Ministero dell’Interno. DM 03/08/2015: Codice Di Prevenzione Incendi (Testo Coordinato Dell’allegato I Del DM 3 Agosto 2015 e Ss.Mm.Ii); Ministero dell’Interno: Rome, Italy, 2015.
  37. Tang, S.; Shelden, D.R.; Eastman, C.M.; Pishdad-Bozorgi, P.; Gao, X. A Review of Building Information Modeling (BIM) and the Internet of Things (IoT) Devices Integration: Present Status and Future Trends. Autom. Constr. 2019, 101, 127–139. [Google Scholar] [CrossRef]
  38. Huang, Y.; Guo, Z.; Chu, H.; Sengupta, R. Evacuation Simulation Implemented by ABM-BIM of Unity in Students’ Dormitory Based on Delay Time. ISPRS Int. J. Geo-Inf. 2023, 12, 160. [Google Scholar] [CrossRef]
  39. Ronchi, E. Developing and Validating Evacuation Models for Fire Safety Engineering. Fire Saf. J. 2021, 120, 103020. [Google Scholar] [CrossRef]
  40. Quagliarini, E.; Bernardini, G.; Romano, G.; D’Orazio, M. Simplified Flood Evacuation Simulation in Outdoor Built Environments. Preliminary Comparison between Setup-Based Generic Software and Custom Simulator. Sustain. Cities Soc. 2022, 81, 103848. [Google Scholar] [CrossRef]
  41. Ronchi, E.; Kuligowski, E.D.; Reneke, P.A.; Peacock, R.D.; Nilsson, D. The Process of Verification and Validation of Building Fire Evacuation Models; NIST Technical Note; National Institute of Standards and Technology: Gaithersburg, MD, USA, 2013; Volume 1822.
  42. Grandison, A.; Deere, S.; Lawrence, P.; Galea, E.R. The Use of Confidence Intervals to Determine Convergence of the Total Evacuation Time for Stochastic Evacuation Models. Ocean. Eng. 2017, 146, 234–245. [Google Scholar] [CrossRef]
  43. Haghani, M.; Sarvi, M. Crowd Behaviour and Motion: Empirical Methods. Transp. Res. Part B Methodol. 2018, 107, 253–294. [Google Scholar] [CrossRef]
  44. Galea, E.R.; Xie, H.; Deere, S.; Cooney, D.; Filippidis, L. Evaluating the Effectiveness of an Improved Active Dynamic Signage System Using Full Scale Evacuation Trials. Fire Saf. J. 2017, 91, 908–917. [Google Scholar] [CrossRef]
  45. Hostetter, H.; Naser, M.Z.; Randall, K.; Murray-Tuite, P. Evacuation Preparedness and Intellectual Disability: Insights from a University Fire Drill. J. Build. Eng. 2024, 84, 108578. [Google Scholar] [CrossRef]
  46. MassMotion. MassMotion Guide. Available online: https://www.oasys-software.com/wp-content/uploads/2017/12/MassMotion.pdf (accessed on 21 April 2024).
  47. Comune di Ancona; Pinacoteca, F.P.; Galleria d’Arte Moderna. Il Lazzaretto di Luigi Vanvitelli: Indagine su Un’opera; Galleria comunale d’Arte Moderna: Rome, Italy, 1980; ISBN ANA0001260. [Google Scholar]
  48. VV.AA. Il Lazzaretto Tra Mare e Città: Dalla Conoscenza al Restauro Verso Il Riuso della Mole di Luigi Vanvitelli. Atti del Convegno: Ancona, 9–10 Marzo 1990; Cassa di risparmio di Verona, Vicenza, Belluno e Ancona: Ancona, Italy, 1990. [Google Scholar]
  49. Ministero dell’Interno. Testo Coordinato del DM 10 Marzo 1998 Criteri Generali di Sicurezza Antincendio e per la Gestione Dell’emergenza nei Luoghi di Lavoro; Ministero dell’Interno: Rome, Italy, 2021.
  50. Helbing, D.; Farkas, I.; Vicsek, T. Simulating Dynamical Features of Escape Panic. Nature 2000, 407, 487–490. [Google Scholar] [CrossRef] [PubMed]
  51. Forssberg, M.; Kjellström, J.; Frantzich, H.; Mossberg, A.; Nilsson, D. The Variation of Pre-Movement Time in Building Evacuation. Fire Technol. 2019, 55, 2491–2513. [Google Scholar] [CrossRef]
  52. Rostami, R.; Alaghmandan, M. Performance-Based Design in Emergency Evacuation: From Maneuver to Simulation in School Design. J. Build. Eng. 2021, 33, 101598. [Google Scholar] [CrossRef]
  53. Huang, L.; Li, W.; Gong, J. Simulation of the Emergency Evacuation about Social Groups in a Complex Subway Station. Phys. A Stat. Mech. Its Appl. 2024, 637, 129535. [Google Scholar] [CrossRef]
  54. Ronchi, E.; Lovreglio, R. EXPOSED: An Occupant Exposure Model for Confined Spaces to Retrofit Crowd Models during a Pandemic. Saf. Sci. 2020, 130, 104834. [Google Scholar] [CrossRef]
Figure 1. Research framework including references to the methodological and results sections.
Heritage 07 00177 g001
Figure 2. The “Mole Vanvitelliana” and the State Tactile Museum “Omero”: its location within the City of Ancona (A), a general aerial view of the building by marking the areas hosting the museum, (B) and an internal view from the central courtyard (C). The museum is marked within the light yellow areas (base map from Immagini ©2023 Google, Immagini ©2023 Airbus, Maxar Technologies, and Dati cartografici ©2023).
Heritage 07 00177 g002
Figure 3. Overview of the “Omero Museum” organisation by level (axonometric view, including metric scale), including details on the experimental drill.
Heritage 07 00177 g003
Figure 4. Boxplots of experimental evacuation speeds of occupants by vulnerability (A) and density (B).
Heritage 07 00177 g004
Figure 5. Comparison of the evacuation curves for the whole building in the simulation (grey) and drill (blue).
Heritage 07 00177 g005
Figure 6. Video frames from the drill concerning vulnerable occupants’ behaviours. (A) Children interacting with staff members and gathering before using staircases at the 2nd level (in the red circle). (B) Interaction between children and members in looking for direction instruction and organising non-single-file movement when placed near GEL (direction by red arrow). (C) Younger children hand-assisted by staff members (in the red circle) and by other older children (in the green circle) when placed near GEL. (D) Elderly (in the red circle) supported by staff members in exit door selection and use (in green circle) when placed in 2EL.
Heritage 07 00177 g006
Figure 7. Comparison of the evacuation curves for the single building exits (A) and monitored intermediate gates (B) in the simulations (grey) and drill (blue). For codes of building exits and monitored intermediate areas, please refer to Figure 3.
Heritage 07 00177 g007
Table 1. Initial position and type of volunteers participating in the evacuation drill. The “notes” column reports general comments, as well as disability types and assistance in motion * Disabled occupant is part of the staff; ^ the occupants are administration office members and evacuate later than the others for safety reasons.
Description (Identification Code in Blue in Figure 3)TotalChildren of School GroupsAdult Visitors (Elderly)StaffDisabled ChildrenDisabled Adults (Elderly)Notes
1st level, building services (BS)300 (0)201 (0) *Wheelchair, unassisted
1st level, exhibition area, left side (1EL)22137 (0)110 (0)Wheelchair, assisted by an adult visitor
1st level, exhibition area, right side (1ER)903 (0)204 (0)Cognitive, assisted
1st level, exhibition area (1EL and 1ER)703 (3)301 (1)Cane, assisted; all the occupants are considered free visitors
2nd level, exhibition area, left side (2EL)21019 (10)200 (0)
2nd level, laboratory areas, left side (2LL)18133 (0)110 (0)
2nd level, laboratory areas, right side (2LR)21136 (1)200 (0)
3rd level, administration offices (3AO)604 (1) ^101 (1) ^Blind, assisted ^
TOTAL1073945 (15)1427 (2)
Table 2. Adopted literature-based indicators for quantitative comparison between the evacuation curves in simulation and experimental outputs [40,41].
Indicator [Unit of Measure]Meaning/InterpretationFormula (x = Simulation Data; y = Experimental Data)
Euclidean Relative Difference ERD [-]Represents the agreement between two curves in terms of angle; the curves can be considered close if ERD is close to 0ERD = | x y | | | y | |
Secant Cosine SC [-]Measures the differences in shape between two curves as their first derivative; the shapes are similar if SC is close to 1SC = < x , y > x   | y |
Euclidean Projection Coefficient EPC [-]Evaluates the differences between the curves, compared to the translation of the points that compose them, and thus allows one to measure a sort of scale factor; the curves can be considered similar if EPC is close to 1EPC = < x , y > | y | 2
Difference between the graphic Areas Under the Curves DAUC [%]Expresses a sort of “rapidity” of the evacuation process given the whole area under the curve, although DAUC should be close to 0% to have similar “rapidity”; acceptable results rely on DAUC > 0%, which implies that the simulation curve is “slower” than the experimental one, and, thus, the simulation model predicts values in a conservative approachDAUC = x y y · 100
Table 3. Statistics of the evacuation process for the whole building (total) and each exit (Figure 3). ^ excluding the blind, assisted occupant from 3AO and the assisting adult.
Parameter [Unit of Measure]TotalGELFELFER
Occupants [persons]10769299
Tmin [s]501175058
T50 [s]1491777760
T95 [s]23123310168
Tmax [s] ^23723712970
Flow for T50 [persons/s]0.540.570.522.00
Flow for T95 [persons/s]0.560.560.530.80
Flow for Tmax [persons/s]0.330.270.370.75
Table 4. Literature-based indicators for quantitative comparison between the evacuation curves in the simulation, according to Section 2.4.
Indicator [Unit of Measure]TotalGELFELFERSSLFSLFSL FROM SSL
ERD [-]0.040.070.090.310.340.290.39
SC [-]1.021.1810.960.990.970.93
EPC [-]1.021.371.041.071.270.770.79
T95 [s]23423412773---
Perc. Diff in T95 [%]0.40.414---
DAUC 5th perc [%]1272020201715
DAUC 50th perc [%]4.288126713
DAUC 95th perc [%]0.1350.1668.221.618.98
DAUC 100th perc [%]1.52170.09121.398.817
Disclaimer/Publisher’s Note: The statements, opinions and data contained in all publications are solely those of the individual author(s) and contributor(s) and not of MDPI and/or the editor(s). MDPI and/or the editor(s) disclaim responsibility for any injury to people or property resulting from any ideas, methods, instructions or products referred to in the content.

