Abstract
Accurate documentation of the geometry of historical buildings presents a considerable challenge, especially when dealing with complex structures like the Metropolitan Cathedral of Valencia. Advanced technologies such as 3D laser scanning has enabled detailed spatial data capture. Still, efficient handling of this data remains challenging due to the volume and complexity of the information. This study explores the application of clustering techniques employing Machine Learning-based algorithms, such as DBSCAN and K-means, to automate the process of point cloud analysis and modelling, focusing on identifying and extracting floor plans. The proposed methodology includes data geo-referencing, culling points to reduce file size, and automated floor plan extraction through filtering and segmentation. This approach aims to streamline the documentation and modelling of historical buildings and enhance the accuracy of historical architectural surveys, significantly contributing to the preservation of cultural heritage by providing a more efficient and accurate method of data analysis.
1. Introduction
The Metropolitan Cathedral of Valencia (Spain) was used as a case study for the development of the research. This religious building began to be constructed in 1262 following the Christian conquest of Valencia, with Romanesque influences such as the Romanesque Door or Palace Door [1]. It has a Latin cross plan with three naves and an ambulatory, following the Gothic style. In the 14th century, the Chapter House (currently housing the Holy Chalice relic) and the bell tower, popularly known as the Miguelete, were constructed. These two structures were annexed to the church in the 15th century, with the addition known as the “Obra Nova”. Subsequently, the ambulatory was clad on the exterior with a Renaissance facade, and in the 17th century, the apse and its main facade were adorned with Baroque ornamentation. Finally, it was modified in the Neoclassical style. All these modifications and expansions have transformed the building into an evolving structure, with the superimposition of architectures from different historical periods. This complexity makes it challenging to understand it as a unit; simultaneously, it makes the Cathedral an excellent example for experimenting with the automation of point cloud-based processes, facilitating the detailed documentation and analysis of its evolving architecture.
The documentation of historical buildings presents a significant challenge in accurately capturing their geometry. In recent decades, advanced techniques such as photogrammetry and terrestrial laser scanning (TLS) have been adopted to address this challenge. Laser scanning has become an invaluable tool by rapidly providing much spatial data. The acquisition and analysis of this data are crucial for the detailed examination of buildings and the early detection of problems related to the negative impact of tourism, structural damage, and loss of historical identity [2,3,4]. This capability has increased the use of point clouds in projects involving complex geometries, thus facilitating the detailed capture and analysis of historical structures. The intrinsic complexity of historical buildings necessitates meticulous identification and classification of large volumes of data for accurate documentation [5]. Many surveys are still conducted using CAD, a tool that, while effective, requires considerable modelling time, especially for historical buildings. Heritage Building Information Modelling (HBIM) is increasingly being implemented as a complementary methodology to document these structures [6,7,8]. However, in most cases, the workflow begins with a point cloud. Various authors have highlighted the capabilities of this technology, particularly in workflows such as Scan-to-CAD [9,10,11] and Scan-to-BIM [12,13], which automate processes and significantly reduce the time required to convert spatial points into precise geometric models. However, given the large volume of data generated in point clouds, it is essential to reduce the data size through segmentation and filtering. This process typically begins with noise removal to eliminate irrelevant or erroneous points. Additionally, point cloud density can be reduced by either setting a minimum spacing between points or defining a fixed number of points to retain. Proper filtering is crucial to optimise the dataset for processing in various software tools.
2. Background and Related Works
Currently, the generation of 2D floor plans from 3D point clouds primarily aims to automate the process of creating BIM models. Various approaches have been proposed in recent years to tackle the challenge of translating unlabelled three-dimensional data into two-dimensional representations. In this context, the development of Machine Learning (ML) models has enabled the automation of point segmentation and classification in unstructured 3D spaces using algorithms such as DBSCAN, K-means [14], and Random Sample Consensus (RANSAC) [15,16,17,18]. Applying these algorithms significantly reduces data classification time, optimising both the accuracy and quality of results.
For example, Gankhuyag and Han [19] employ an approach that analyses building floor plans from unstructured and unclassified point clouds. This method is based on the Manhattan-World (MW) model [20], which assumes that most built structures can be approximated by flat surfaces aligned with the axes of an orthogonal coordinate system. The process involves a wall detection algorithm that operates directly on the point cloud, although it relies on orthogonal orientation to be effective. The final result consists of superimposed floor plans that must be interpreted and converted into CAD format to generate accurate two-dimensional representations.
Another approach, by Bae and Kim [21], uses the 2D projection of 3D point clouds through downsampling via voxel grids. It eliminates histogram ranges corresponding to floors and ceilings, preserving only the walls. This method combines density-based clustering with the DBSCAN algorithm and SOR (Statistical Outlier Removal) filtering to remove outliers. Additionally, it uses an unsupervised nearest-neighbour search algorithm based on a radius criterion. Similarly, Stojanovic [22] proposes an approach that segments the floor and ceiling of a point cloud to create a voxel model representing a room’s interior with regular shapes. This is achieved by detecting the floor and ceiling planes that contain the highest number of points. Furthermore, a model is developed for non-rectangular rooms, generating a Boundary Representation (B-Rep) tailored to the space defined by the point cloud.
Javanmardi [23] suggests generating a 2D multilayer vector map from a 3D point cloud. The process involves sectioning the point cloud and projecting the points onto the floor to generate a 2D cloud. Vertical segments are extracted from this cloud using the RANSAC algorithm to identify lines.
Walczak [24] presents a point cloud segmentation method based on the hierarchical division of space driven by histograms inspired by the kd-tree [25], a multidimensional binary search tree used for associative searching.
These studies mainly focus on cases with regular and orthogonal geometries, working in 3D space through the detection of planes or voxels. However, when applied to complex historical buildings, implementing these technologies becomes more challenging due to the intricate geometry of heritage structures. In terms of cultural heritage, the use of these tools remains underdeveloped. Improving the efficiency and accuracy of documenting historic buildings remains a challenge, particularly concerning point cloud segmentation, as the data is frequently unclassified.
3. Materials and Methods
This study aims to optimise the time and improve the accuracy of generating 2D floor plans by applying automatic models for segment detection based on 3D points. This approach differs from others by focusing on the combination of various algorithms used on unlabelled points in complex and irregular spaces.
3.1. Data Acquisition
In this work, the precise identification and segmentation of points related to pavements have been explored, aiming to create detailed and accurate representations of paved areas, which is particularly important for the preservation of historic buildings. Additionally, the goal is to automate the survey process. Automating the generation of 2D geometries can optimise tasks involving complex structures, including the creation of geometries that can be exported to CAD and BIM formats. This results in a significant reduction in drawing times and an increase in documentation efficiency, ensuring that detailed information about monuments is accessible and useful for future conservation efforts. Additionally, data analysis methods such as DBSCAN and K-means are used to generate the 2D representation of the building. The aim here is to assess which of these approaches is more effective for data segmentation, thereby facilitating a better understanding and delineation of the lines in the sections of the Cathedral.
The challenge of digitising a cathedral goes beyond what typically involves working with a conventional building, where geometric regularity predominates. In this case, the structure is characterised by remarkable constructive complexity, marked by the juxtaposition of multiple spaces. The data acquisition was carried out using 3D laser scanning technology.
The equipment used for spatial data acquisition included two laser scanners: the Faro® Focus Premium S-150 and Focus Premium S-350 (FARO Technologies, Lake Mary, FL, USA), with ranges of 150 and 350 m, respectively. For smaller spaces, such as spiral staircases, the handheld FARO® Freestyle 2 scanner was used. These devices have a 3D accuracy with a margin of error of 2 mm for distances up to 10 m. In the case of the Valencia Cathedral, the survey included 543 scans, with a general resolution of 1/8 and 4× quality, with a point spacing of 12 mm at 10 metres for the interiors. Each point cloud was registered using Faro® Scene software, version 2023.1, achieving an average registration error of 1.2 mm and encompassing more than 4 billion points, with a total processed cloud size of 220 GB. During the process, some scans were removed due to data capture errors that resulted in inaccuracies.
Once processed, the point clouds were grouped and organised to generate a composite cloud by overlaying all the obtained points. Additionally, they were georeferenced using global positioning systems (GPS) in ETRS89. This process ensures that the coordinates of each point in the cloud are aligned with a standard geographic coordinate system, allowing for an accurate representation that correlates with actual spatial data. Subsequently, duplicate points were removed to avoid redundancies in the information.
The complete point cloud of the Cathedral was exported in two formats: e57, which is widely compatible with various 3D scanning software and hardware tools, with a size of 104 GB, and the RCS (Realistic Colour Scanning) format, with a size of 72.6 GB. These data volumes are considerable, representing billions of points, with a distance between them in many cases less than 2 mm, indicating an excess of information for analysis and modelling purposes. To optimise the handling of the point cloud across various software platforms and reduce computer resource consumption, experiments were conducted to adjust the point spacing. By increasing this distance to 5 mm, the file size was reduced by approximately 78.26 times, equivalent to a 98.72% reduction (Figure 1). This reduction was sufficient to facilitate efficient manipulation and integration of data in ongoing work. Additionally, different point spacings were tested, such as 5, 10, 20, 50, and 100 mm (Table 1), demonstrating an exponential reduction in both the number of points and file size. A spacing of 100 mm is considered optimal for working at the building scale. In contrast, a spacing of 20 mm is recommended for room-scale work to ensure greater accuracy in capturing details.
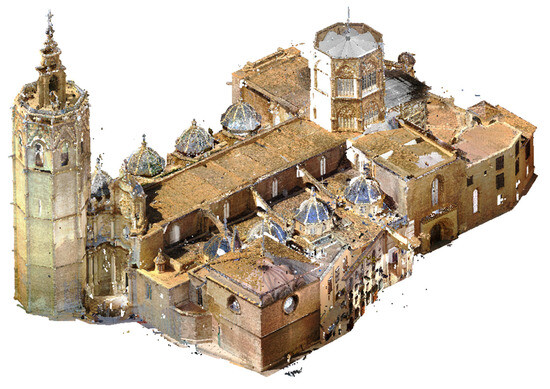
Figure 1.
Point cloud of the Valencia Cathedral with a 5 mm point spacing.

Table 1.
Characteristics of E57 files based on point spacing obtained from the Valencia Cathedral.
3.2. Data Analysis for the Automatic Extraction of Floor Points
Given the 3D spatial data with colour information (RGB) and scalar fields, it is necessary to develop specific workflows to address each challenge. To tackle the segmentation and analysis of point clouds, a Python script has been developed that employs various specialised libraries, such as NumPy [26], SciPy [27], Shapely [28], and Open3D [29].
In the first stage, the point cloud is loaded from a file using NumPy to manage the data. The next step involves filtering these points based on specific height intervals in the Z-axis. This filtering aims to identify the height ranges where the highest concentration of points is found (Figure 2), which can reveal particular features of the analysed structure, such as floors. The hypothesis is that the Z-value where the most points are concentrated in a building corresponds to a flat surface, likely a floor.
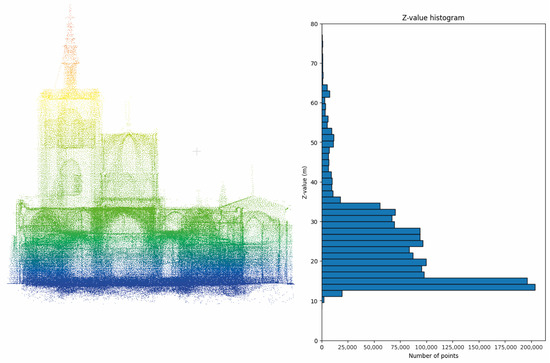
Figure 2.
Histogram and distribution of points from the Valencia Cathedral based on the Z-axis.
The analysis revealed that the highest concentration of points along the Z-axis is within the range of (14.3003 to 15.1003) m. After identifying this range, the point cloud of the Cathedral was filtered using this Z-interval, complemented by a SOR filter. This filtering process eliminates points considered outliers or noise based on a statistical analysis of the distance between each point and its nearest neighbours. Finally, the points are projected on the Z-plane (Figure 3) to prevent errors by assigning a constant value derived from the obtained mean. This approach ensures accurate area calculations based on the point cloud.
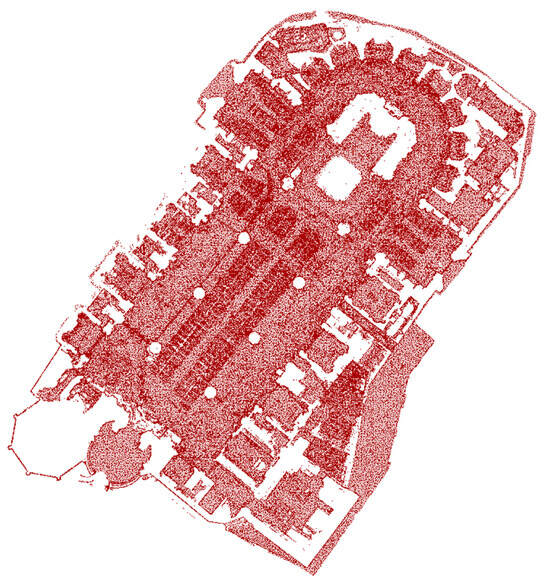
Figure 3.
Discretisation of the points forming the floor of the Valencia Cathedral.
The floor point cloud is processed through a density analysis to identify clusters. The DBSCAN algorithm is utilised for this, which organises points based on their proximity and density. This method allows for identifying areas with a high concentration of points, facilitating the delineation of independent zones.
Once the clusters are identified, the next step is to generate the corresponding polygons for each detected surface. The 2D geometry of the areas is calculated from the point clusters using the convex hull method. The convex hull is a computational geometry technique that constructs the smallest convex shape that can enclose all the points in a cluster. This approach effectively represents the detected surfaces on a plane by creating a simple shape that delineates the boundaries of each cluster.
Finally, the area of each polygon is calculated to determine the extent of the identified surfaces. The generated polygons are then exported to a DXF file using the ezdxf library, enabling seamless integration into CAD applications. This approach provides a precise and detailed representation of the analysed surfaces, which is beneficial for engineering and architectural applications.
3.3. Data Analysis for Converting Points into 2D Section Lines
Starting from the original point cloud, points corresponding to a specific height interval of the Z-coordinate were extracted (Figure 4). In this case, the interval calculated for the floor (14.3003 m to 15.1003 m) was used, with an additional 2 m added to obtain a cutting section at Z = 17.1 m in the Cathedral. This section focused on capturing the geometry relevant to that height.
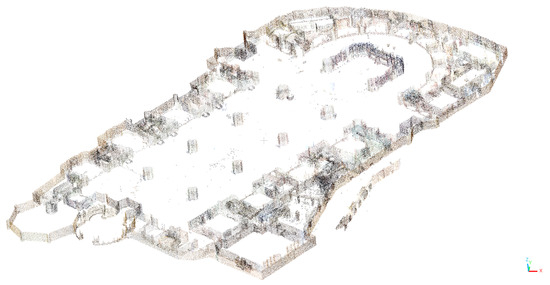
Figure 4.
Section of the point cloud of the Valencia Cathedral.
The obtained points were subsequently unified to a constant Z height to avoid future errors in processing. This way, only the X and Y coordinates were retained, resulting in a section of approximately 25,000 points.
Given the complexity of the geometries, the automatic conversion of points to lines differed significantly from what would be performed in modern buildings with simpler shapes. After experimenting with various methods, such as using Voronoi diagrams combined with Delaunay triangulation and the KD-Tree algorithm (Figure 5), which did not achieve the desired results, a decision was made to change the approach.
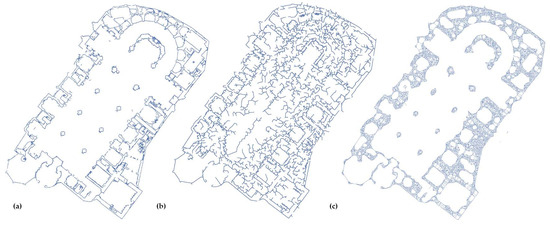
Figure 5.
Automatic section of the Valencia Cathedral at Z = 17.1 m (a) points; (b) processing of points with KD-Tree; (c) processing of points with Delaunay triangulation.
A dual approach was chosen to face these challenges, applying two Machine Learning-based clustering methods. We worked with an unlabelled dataset, which required unsupervised learning to identify groups or categories within the data. Unlike other methods, clustering does not need a training phase and is particularly useful when categories are not predefined. The process involves defining a similarity metric to group elements with shared characteristics into clusters. DBSCAN and K-means [30,31,32] were applied to a sample of the Chapel of the Holy Chalice floor plan in the Valencia Cathedral.
3.3.1. Clustering with DBSCAN
DBSCAN is an unsupervised clustering algorithm that is particularly useful for datasets with high-density areas and noise. In our case, DBSCAN was applied to group coplanar points in the X and Y coordinates. The algorithm allowed the formation of clusters based on density, generating a variable number of groupings depending on the epsilon (ε) and min sample parameters. Epsilon defines the radius of a neighbourhood around each point, within which other neighbouring points are searched for, and min samples sets the minimum number of points that must be found within this radius (including the central point) for the group to be considered a cluster.
In this way, the algorithm not only considers the position of the points in the X and Y coordinates but also the local point density. This enables the identification of dense groups of points and the distinction between those and regions of noise or low density.
Experiments were conducted with the point cloud data from the floor plan of the Cathedral and the Chapel of the Holy Chalice, using a smaller sample of 1600 points. In these cases, the optimal epsilon value for generating the highest number of clusters was analysed based on varying min samples parameters, as shown in Figure 6 and Table 2.
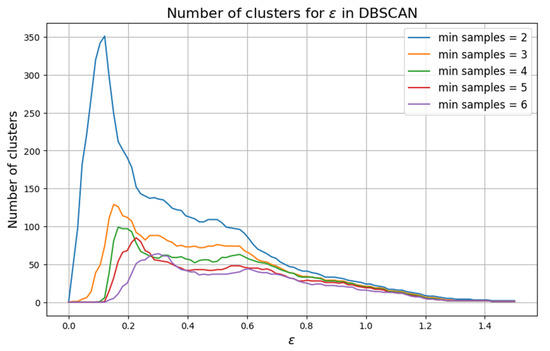
Figure 6.
Analysis of points from the Chapel of the Holy Chalice to determine ε.

Table 2.
Number of clusters in DBSCAN for ε.
Once the clusters were generated with DBSCAN, trend lines were calculated for each group of points. These points were transformed into individual lines, which provided a clear definition in the final drawing as the number of clusters increased (Figure 7). The trend lines generated from the clusters were merged and exported into a CAD file in DXF format, enabling a detailed and accurate representation of the section at the specified height within the Cathedral.
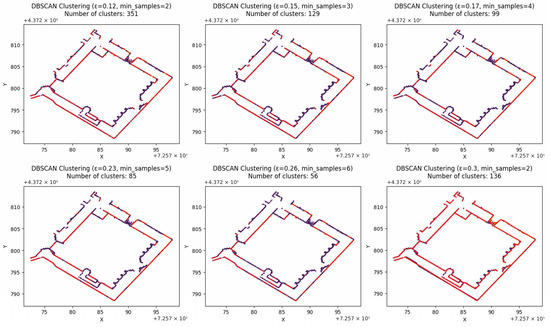
Figure 7.
Analysis of the Chapel of the Holy Chalice using the DBSCAN algorithm, showing the regression lines generated from the clustering, which are marked in red.
3.3.2. Clustering with K-Means
Complementarily, the K-means algorithm was applied, another clustering method that groups points based on minimising the distance between the points and the cluster centres. Unlike DBSCAN, K-means requires specifying the number of clusters a priori.
The silhouette coefficient is used to determine the number of clusters, which evaluates the quality of the clusters based on the similarity of the points within each cluster and the difference from the points in other clusters. A high silhouette coefficient indicates that the points are well grouped. Based on this method, it has been established that the optimal number of clusters for the points of the Chapel of the Holy Chalice is 106 (Figure 8).
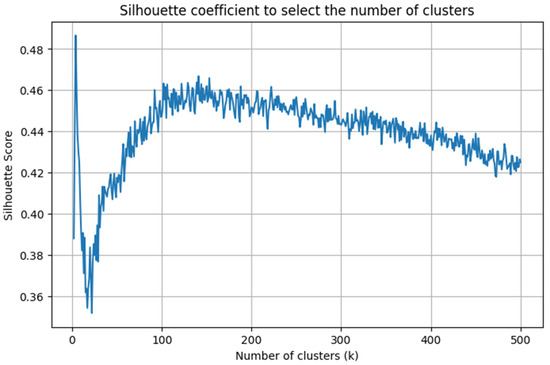
Figure 8.
Analysis of the points from the Chapel of the Holy Chalice to determine the number of clusters.
Tests were conducted with various configurations on the number of clusters generated (5, 10, 20, 106, 200, 300) to identify the best representation of the data (Figure 9).
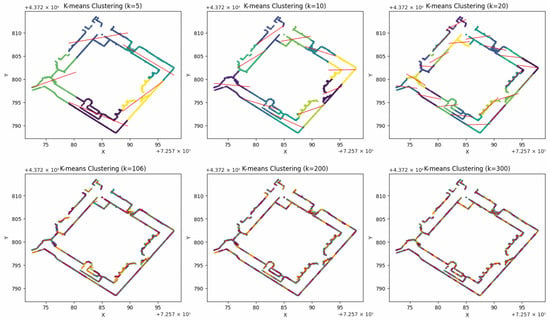
Figure 9.
Analysis of the Chapel of the Holy Chalice using the K-means algorithm, showing the regression lines generated from the clustering. The different clusters are displayed in various colours, and the detected lines are shown in red.
In the K-means process, points were assigned to clusters based on proximity to the calculated centres. Similar to DBSCAN, trend lines were calculated from the groups of points, and these lines were also generated and exported in DXF format files. This allowed for a precise visualisation of the detected surfaces and facilitated the integration of the results into CAD applications.
4. Results
Based on the workflow outlined in the previous section, the floor plan of the cathedral was generated using the points obtained through the routine above. As shown in Figure 10, adjusting the radius (ε) value of the DBSCAN algorithm was necessary to achieve greater accuracy in point clustering.
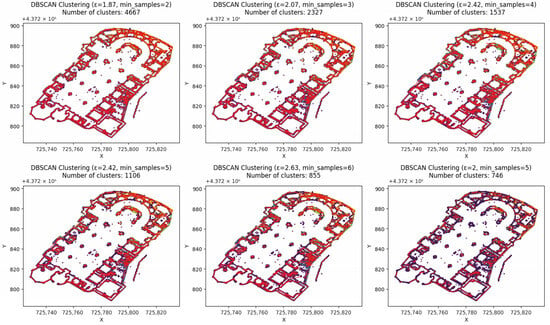
Figure 10.
Analysis of the Valencia Cathedral floor plan using the DBSCAN algorithm shows the regression lines generated from the clustering marked in red.
It is important to note that this workflow does not convert 100% of the points due to the presence of noise or anomalies. All noise points would need to be cleaned to obtain an optimal result. However, this task can be time-consuming and might compromise the objective of optimising the time required to develop survey plans, which is the purpose of this workflow.
Despite certain limitations, the results obtained are satisfactory (Figure 11). There has been a significant reduction in the time required to convert point cloud data into 2D drawings, thereby optimising the process of digitising sections. Nonetheless, it is essential to continue making adjustments to refine the accuracy of the final results and ensure the quality of the generated plans.
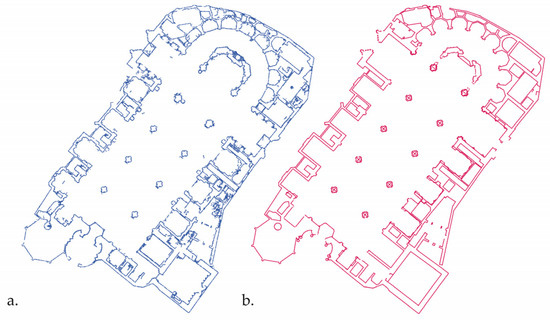
Figure 11.
Plan of the Valencia Cathedral (a) point cloud (b) result obtained from the workflow.
Furthermore, we experimented creating the 2D floor plan manually using CAD software. By importing a point cloud of the cathedral’s floor plan, we connected the points by hand to delineate the segments that define the building’s floor plan. This process took approximately 4.5 h for around 23,000 points, generating approximately 6400 segments. In contrast, the proposed method takes only about 50 s to produce the same segments.
5. Discussion of Results
When comparing the results obtained from both algorithms (K-means and DBSCAN), approximations to the building’s geometry were observed, albeit with variations in precision. To validate the employed methods, the average error between the original points and the generated lines was calculated using the mean absolute error (MAE). In the analysis of the Chapel of the Holy Grail, the results revealed an average error of 0.0753 for the K-means method and 0.0091 for DBSCAN.
DBSCAN proved to be more accurate by adjusting the epsilon (ε) radius within a range of 0.3 to 0.5 m, which allowed for more precise delineation of structures from the sample points. On the other hand, K-means improved in precision as the number of clusters increased. The effectiveness of this algorithm is closely related to the number of points in the sample. In our case, with 23,247 points, the best result was achieved using 50 clusters. So, it can be considered that DBSCAN was the most effective of the two methods, as it enabled a clearer identification of most of the lines from the sample points.
Among the limitations identified, the presence of noise points stands out, as these can lead to errors in the automation process, particularly in the intersection of lines. Therefore, it is essential to work with a point cloud that is as clean and optimised as possible in terms of data size, point spacing, and noise elimination. However, the over-application of noise filters, such as the SOR method, risks losing point density, which could, in turn, reduce the accuracy of the resulting plan.
Additionally, when dealing with points aligned in straight lines, the model generates a segment for each connection. However, in certain cases, these could be simplified into a single line. It is crucial to consider the point density to ensure greater data definition. In regular spaces, a point separation of 0.1 m is recommended, while in more complex areas, a minimum density of 0.03 m would be more appropriate.
The optimal approach would involve using a higher point density in more complex areas, where greater detail is needed while reducing the number of points in more orthogonal regions, where less information is required. This would allow the process to be optimised without compromising the precision of the outcome.
6. Conclusions
Implementing workflows based on point cloud data analysis of the Metropolitan Valencia Cathedral has proven to be highly efficient in identifying and segmenting points corresponding to floors, allowing for precise calculations of irregular surfaces. This methodology is essential for generating detailed and accurate representations of paved areas, especially in the context of historic building preservation. The automation of the process, which enables the creation of 2D geometries that can be exported to CAD formats, significantly optimises surveying tasks in complex buildings, drastically reducing drawing times—from approximately 4.5 h to 50 s for similar tasks—and increasing efficiency in documentation.
Moreover, the application of clustering methods such as DBSCAN and K-means has provided useful 2D representations, with DBSCAN standing out as the most effective algorithm for this type of segmentation. The comparison between these approaches has allowed for a better understanding and delineation of lines in the Cathedral sections, facilitating their analysis and representation in engineering and architectural applications. This approach streamlines the documentation process and enhances precision in the conservation and detailed analysis of historic architecture, contributing significantly to cultural heritage preservation.
The automation in the generation of 2D geometry not only simplifies the export to platforms like GIS and BIM for further modelling and analysis but also strengthens the integration of these technologies into heritage preservation processes, ensuring that detailed knowledge of these monuments is accessible and usable in future conservation interventions.
Author Contributions
Conceptualization, P.A.E.; methodology, P.A.E.; software, P.A.E.; validation, M.C.L.G. and J.L.G.V.; formal analysis, P.A.E.; investigation, P.A.E.; resources, P.A.E., M.C.L.G. and J.L.G.V.; data curation, P.A.E.; writing—original draft preparation, P.A.E.; writing—review and editing, P.A.E.; visualization, P.A.E.; supervision, M.C.L.G. and J.L.G.V.; project administration, M.C.L.G.; funding acquisition, M.C.L.G. All authors have read and agreed to the published version of the manuscript.
Funding
This research was funded by the project “Análisis y desarrollo de la integración HBIM en SIG para la creación de un protocolo de planificación turística del Patrimonio Cultural de un destino” (ref. PID2020-119088RB-I00), funded by the State Research Agency (AEI), Ministry of Science and Innovation, Government of Spain, and by the grant “Análisis y desarrollo de la integración HBIM en SIG para la creación de un protocolo de planificación turística del Patrimonio Cultural de un destino” (ref. PRE2021-097263), funded by the State Research Agency (AEI), Ministry of Science and Innovation, Government of Spain.
Data Availability Statement
The datasets used and analysed during the current study are available from the first author upon reasonable request.
Conflicts of Interest
The authors declare no conflicts of interest.
References
- Beuter, P.A. Primera Parte de la Coronica General de Toda España y Especialmente del Reyno de Valencia; Joan Mey: Valencia, Spain, 1546. [Google Scholar]
- Castellazzi, G.; D’Altri, A.M.; Bitelli, G.; Selvaggi, I.; Lambertini, A. From Laser Scanning to Finite Element Analysis of Complex Buildings Using a Semi-Automatic Procedure. Sensors 2015, 15, 18360–18380. [Google Scholar] [CrossRef] [PubMed]
- Xu, W.; Neumann, I. Finite Element Analysis based on A Parametric Model by Approximating Point Clouds. Remote Sens. 2020, 12, 518. [Google Scholar] [CrossRef]
- Liu, J.; Azhar, S.; Willkens, D.; Li, B. Static Terrestrial Laser Scanning (TLS) for Heritage Building Information Modeling (HBIM): A Systematic Review. Virtual Worlds 2023, 2, 90–114. [Google Scholar] [CrossRef]
- Brumana, R.; Della Torre, S.; Oreni, D.; Previtali, M.; Cantini, L.; Barazzetti, L.; Franchi, A.; Banfi, F. The HBIM Challenge between Complexity Paradigms, Tools, and Preservation: The Collemaggio Basilica 8 Years after the Earthquake (L’Aquila). ISPRS Arch. 2017, 42, 97–104. [Google Scholar] [CrossRef]
- Murphy, M.; McGovern, E.; Pavia, S. Historic Building Information Modelling (HBIM). ISPRS Int. Arch. Photogramm. Remote Sens. Spat. Inf. Sci. 2009, 27, 311–327. [Google Scholar] [CrossRef]
- Oreni, D.; Brumana, R.; Georgopoulos, A.; Cuca, B. HBIM for Conservation and Management of Built Heritage: Towards a Library of Vaults and Wooden Beam Floors. ISPRS Ann. Photogramm. Remote Sens. Spat. Inf. Sci. 2013, II-5/W1, 215–221. [Google Scholar] [CrossRef]
- Brumana, R.; Oreni, D.; Raimondi, A.; Georgopoulos, A.; Bregianni, A. From survey to HBIM for documentation, dissemination and management of built heritage: The case study of St. Maria in Scaria d’Intelvi. In Proceedings of the 2013 Digital Heritage International Congress (DigitalHeritage), Marseille, France, 28 October–1 November 2013; pp. 497–504. [Google Scholar] [CrossRef]
- Salihu, D.; Misik, A.; Hofbauer, M.; Steinbach, E. S2CMAF: Multi-Method Assessment Fusion for Scan-to-CAD Methods. In Proceedings of the 2022 IEEE International Symposium on Multimedia (ISM), Naples, Italy, 5–7 December 2022; pp. 129–136. [Google Scholar] [CrossRef]
- Avetisyan, A.; Dahnert, M.; Dai, A.; Savva, M.; Chang, A.X.; Nießner, M. Scan2CAD: Learning CAD Model Alignment in RGB-D Scans. In Proceedings of the 2019 IEEE/CVF Conference on Computer Vision and Pattern Recognition (CVPR), Long Beach, CA, USA, 15–20 June 2019; pp. 2609–2618. [Google Scholar]
- Barazzetti, L.; Banfi, F.; Brumana, R.; Gusmeroli, G.; Oreni, D.; Previtali, M.; Roncoroni, F.; Schiantarelli, G. BIM from Laser Clouds and Finite Element Analysis: Combining Structural Analysis and Geometric Complexity. Int. Arch. Photogramm. Remote Sens. Spat. Inf. Sci. 2015, XL-5/W4, 345–350. [Google Scholar] [CrossRef]
- Rocha, G.; Mateus, L.; Fernández, J.; Ferreira, V. A Scan-to-BIM Methodology Applied to Heritage Buildings. Heritage 2020, 3, 47–67. [Google Scholar] [CrossRef]
- Banfi, F. HBIM Generation: Extending Geometric Primitives and BIM Modelling Tools for Heritage Structures and Complex Vaulted Systems. Int. Arch. Photogramm. Remote Sens. Spat. Inf. Sci. 2019, XLII-2/W15, 139–148. [Google Scholar] [CrossRef]
- Dehariya, V.; Shrivastava, S.; Jain, R. Clustering of image data set using k-means and fuzzy k-means algorithms. In Proceedings of the IEEE International Conference on Computational Intelligence and Communication Networks (CICN), Bhopal, India, 26–28 November 2010; pp. 386–391. [Google Scholar]
- Fischler, M.A.; Bolles, R.C. Random Sample Consensus: A Paradigm for Model Fitting with Applications to Image Analysis and Automated Cartography. Commun. ACM 1981, 24, 381–395. [Google Scholar] [CrossRef]
- Schnabel, R.; Wahl, R.; Klein, R. Efficient RANSAC for Point-Cloud Shape Detection. Comput. Graph. Forum 2007, 26, 214–226. [Google Scholar] [CrossRef]
- Xu, Y.; Tuttas, S.; Hoegner, L.; Stilla, U. Geometric Primitive Extraction from Point Clouds of Construction Sites Using VGS. IEEE Geosci. Remote Sens. Lett. 2017, 14, 424–428. [Google Scholar] [CrossRef]
- Wang, F.; Zhou, G.; Xie, J.; Fu, B.; You, H.; Chen, J.; Shi, X.; Zhou, B. An Automatic Hierarchical Clustering Method for the LiDAR Point Cloud Segmentation of Buildings via Shape Classification and Outliers Reassignment. Remote Sens. 2023, 15, 2432. [Google Scholar] [CrossRef]
- Gankhuyag, U.; Han, J.-H. Generación automática de planos de planta en 2D CAD a partir de nubes de puntos en 3D. Appl. Sci. 2020, 10, 2817. [Google Scholar] [CrossRef]
- Coughlan, J.; Yuille, A. Manhattan world: Compass direction from a single image by Bayesian inference. IEEE ICCV 1999, 2, 941–947. [Google Scholar]
- Bae, S.-J.; Kim, J.-Y. Método de eliminación de objetos de desorden en interiores para un modelo de información de construcción as-built utilizando un enfoque de proyección bidimensional. Appl. Sci. 2023, 13, 9636. [Google Scholar] [CrossRef]
- Stojanovic, V.; Trapp, M.; Richter, R.; Döllner, J. Generation of Approximate 2D and 3D Floor Plans from 3D Point Clouds. In Proceedings of the 14th International Joint Conference on Computer Vision, Imaging and Computer Graphics Theory and Applications (VISIGRAPP 2019), Prague, Czech Republic, 25–27 February 2019; pp. 177–184. [Google Scholar] [CrossRef]
- Javanmardi, E.; Gu, Y.; Javanmardi, M.; Kamijo, S. Autonomous Vehicle Self-Localization Based on Abstract Map and Multi-Channel LiDAR in Urban Area. IATSS Res. 2019, 43, 1–13. [Google Scholar] [CrossRef]
- Walczak, J.; Poreda, T.; Wojciechowski, A. Effective Planar Cluster Detection in Point Clouds Using Histogram-Driven Kd-Like Partition and Shifted Mahalanobis Distance Based Regression. Remote Sens. 2019, 11, 2465. [Google Scholar] [CrossRef]
- Bentley, J.L. Multidimensional Binary Search Trees Used for Associative Searching. Commun. ACM 1975, 18, 509–517. [Google Scholar] [CrossRef]
- Harris, C.R.; Millman, K.J.; van der Walt, S.J.; Gommers, R.; Virtanen, P.; Cournapeau, D.; Wieser, E.; Taylor, J.; Berg, S.; Smith, N.J.; et al. Array programming with NumPy. Nature 2020, 585, 357–362. [Google Scholar] [CrossRef]
- Virtanen, P.; Gommers, R.; Oliphant, T.E.; Haberland, M.; Reddy, T.; Cournapeau, D.; Burovski, E.; Peterson, P.; Weckesser, W.; Bright, J.; et al. SciPy 1.0: Fundamental Algorithms for Scientific Computing in Python. Nat. Methods 2020, 17, 261–272. [Google Scholar] [CrossRef] [PubMed]
- Gillies, S.; Shapely: Geospatial Analysis Library. Shapely Documentation 2023. Available online: https://shapely.readthedocs.io/ (accessed on 1 October 2024).
- Zhou, Q.Y.; Park, J.; Koltun, V. Open3D: A Modern Library for 3D Data Processing. arXiv 2018, arXiv:1801.09847. [Google Scholar]
- MacQueen, J. Some methods for classification and analysis of multivariate observations. In Proceedings of the 5th Berkeley Symposium on Mathematical Statistics and Probability; University of California Press: Berkeley, CA, USA, 1967; pp. 281–297. [Google Scholar]
- Xu, R.; Wunsch, D.; Jain, A.; Murty, M.; Flynn, P. Data Clustering: A Review. ACM Comput. Surv. 1999, 31, 264. [Google Scholar]
- Xu, Y.; Boerner, R.; Yao, W.; Hoegner, L.; Stilla, U. Automated Coarse Registration of Point Clouds in 3D Urban Scenes Using Voxel Based Plane Constraint. ISPRS Ann. Photogramm. Remote Sens. Spat. Inf. Sci. 2017, IV-2/W4, 185–191. [Google Scholar] [CrossRef]
Disclaimer/Publisher’s Note: The statements, opinions and data contained in all publications are solely those of the individual author(s) and contributor(s) and not of MDPI and/or the editor(s). MDPI and/or the editor(s) disclaim responsibility for any injury to people or property resulting from any ideas, methods, instructions or products referred to in the content. |
© 2024 by the authors. Licensee MDPI, Basel, Switzerland. This article is an open access article distributed under the terms and conditions of the Creative Commons Attribution (CC BY) license (https://creativecommons.org/licenses/by/4.0/).