1. Introduction
Over the last few decades, the topic of the hypothetical reconstruction of architectural and archaeological heritage has progressively assumed recognisability and autonomy. Some international initiatives [
1,
2,
3,
4] have put the basis of addressing the problem of standardizing the scientific sharing of knowledge into this context. All these contributions share the goal of bringing forward the awareness that 3D reconstructions can be considered scientific outcomes if properly documented, shared, and communicated.
Despite the fact that some work still needs to be done to achieve these objectives, some steps forward have been made to delineate and systematise good practices for the process of reconstruction and its dissemination, as well as defining the development and evaluation of an applicable methodology for hypothetical 3D historical reconstruction based on a shared theoretical approach.
On the one hand, for example, Kuroczyński et al. [
5] focused on a low-threshold, application-oriented method of the Scientific Reference Model (SRM) as a documented and published basic model, made available for further research, edits, and refinement, as well as further derivatives (special applications). On the other hand, numerous scientific works have tried to define new methodologies to improve the transparency of the level of plausibility, reliability, or uncertainty of the results achieved, not only from a terminological point of view but also from a methodological one.
This contribution aims to take a step forward in the analysis and visualisation of uncertainty, which, among the various concepts and terms assumed, is the one most used and shared within the scientific community.
Even if some authors have proposed various approaches to visualise the uncertainty for individual buildings [
6,
7,
8,
9], case studies at the urban scale are rarely investigated. This research, therefore, starting from a pluriannual experience of the evaluation of uncertainty applied to individual buildings, proposes an improved, source-based, multi-feature approach based on false-colour shading to analyse, visualise, and communicate the uncertainty of hypothetical 3D digital models extended to urban areas. The main purpose is to define a methodology and a more mature and systematised procedure with which to improve the objectiveness, unambiguity, transparency, reusability, and readability of the formalised uncertainty scale.
2. The Case Study of Piazza delle Erbe in Verona
The case study of the hypothetical 3D reconstruction of the medieval marketplace in
Piazza delle Erbe in Verona (
Figure 1) was part of a broader project titled
Piazze palazzi del potere mercati del cibo nell’Italia di Dante [
10], presented at Expo 2015 and awarded as an “academic excellence project” by CRUI (
Conferenza dei Rettori delle Università Italiane). The reconstructed 3D model was presented as a 30-min-long animated docufilm. It was developed by a multidisciplinary team composed of architects and historians coming from different Italian universities (IULM, Milan; UNIBO, Bologna). The overall project focused on medieval food and markets in four different Italian cities: Milano, Firenze, Bologna, and Verona. The main marketplaces of the aforementioned cities were digitally reconstructed in 3D in their medieval layouts. In particular, our research group (affiliated with the Department of Architecture of the University of Bologna) focused on the hypothetical reconstruction of the buildings situated in
Piazza delle Erbe in Verona. The example of Verona is a perfect case study for the definition of a general method for the analysis and visualisation of uncertainty at the urban scale because it was characterised by a relevant complexity, both in what concerned the reconstruction of the marketplace (e.g., foodstuffs, stalls, sellers and buyers, etc.) and the architectural elements (e.g., buildings, monuments, fountains, etc.). In this article, we will mainly focus on the architectural elements.
2.1. Historical Context: The Medieval Food Market in Verona
Piazza delle Erbe stands in the area of the ancient Roman forum, which has kept its overall dimensions, but changed its shape from rectangular to the more distinctive spindle shape in the Middle Ages. As is well known, both the Roman forum and the medieval piazza had several functions, one of the most important being that of a food market [
11]. The Medieval
Piazza delle Erbe established its layout from the 12th century onwards, with the construction of the tower and the
Palazzo del Comune on the eastern side, whereas, at least since 1179, the wooden building of the
Domus Mercatorum, the seat of the activities related to trade and the craft guilds, stood on the western side, and the
Loggia dei Cambiatori (money changers) was built on the northern side. Between the 12th and 13th centuries,
Piazza delle Erbe was surrounded by towers and tower-houses belonging to families of the military and mercantile elite of the time [
12].
During the lordship (or signoria) of the family della Scala of Verona (Scaligeri), who ruled from 1277 to 1387, several buildings were erected, such as the Domus Nova (extension of the Town Hall), the Domus Merçariorum, and the Domus Bladorum (later public granaries), while the original wooden Domus Mercatorum (Mercanzia residence) was rebuilt in brickwork around 1301.
Information on the arrangement of the market stalls in Piazza delle Erbe can be found in the 14th-century city statutes (1327–1328, 1378). Regarding the former, a statute (rubric III, book IV) of Cangrande I della Scala (ruling 1308–1329) prescribed, for totum Mercatum Fori (whole marketplace), a type of paving (de quarellis seu lapidibus) which was strictly functional for the spatial organisation of the market. However, documentary evidence from a later period indeed shows that a certain amount of quarelli (square tiles) were assigned to each commodity sector. All types of goods were sold in the Middle Ages in the Mercatum Fori, except grain, wood, coal, straw, and animals. Concerning the arrangement and location of the stalls, the sellers had to follow strict rules. On the eastern side of the Piazza, at the Stadera Tower, duties were levied on goods and checks were carried out on the weights and measures used by market traders, who were also required to have scales approved by civic authorities (Statute 1328, rubric 7, book IV).
What follows is the distribution of the foodstuff stalls. On the eastern side of the marketplace, not far from the
Loggia dei Cambiatori, there were the poultry and vegetable stalls; on the opposite side, facing the
Domus Bladorum, there was a row of fruit vendor stalls; in front of the
Domus Mercatorum, there were poulterers’ stalls going up to the spot called the “
Pietra del Pesce” (fish’s stone), where fish caught in the Adige River were sold until 3 pm. Pork and oil were sold around the
Capitello, a monument built in the 13th century which served various functions, such as the ceremony of the appointment of the chief magistrate of the
Commune and the place where the punishment inflicted on those who committed fraud was made public. Cansignorio della Scala (ruling 1359–1375) rebuilt the
Gardello Tower, which is also known as the Tower of the Hours, as it was equipped with one of the oldest public clocks in Europe [
12]. After restoring the Roman aqueduct, he also provided the
Piazza with a drinking fountain for the erection of which he used a Roman
labrum as a basin; he also had the fountain surmounted by a Roman statue of a female goddess. Cansignorio’s deliberate use of Roman elements strongly emphasises the Veronese Roman past [
13]. Beyond the symbolic value, there is no doubt that these initiatives contributed significantly to endowing
Piazza delle Erbe with important features that also characterise other European medieval marketplaces.
2.2. The 3D Reconstruction Process of Piazza delle Erbe in Verona
The 3D reconstruction process of
Piazza delle Erbe in Verona (
Figure 2) was extensively described in [
14,
15]. The hypothetical 3D model was reconstructed based on several sources:
Various historical cadastral maps from different ages (Catasto Austriaco 1839–1912; Catasto Napoleonico 1807–1816);
The point cloud of the current state, acquired through photogrammetric and laser scanning campaigns;
Various graphical sources such as paintings, etchings, drawings, and photos;
Historical textual archival sources.
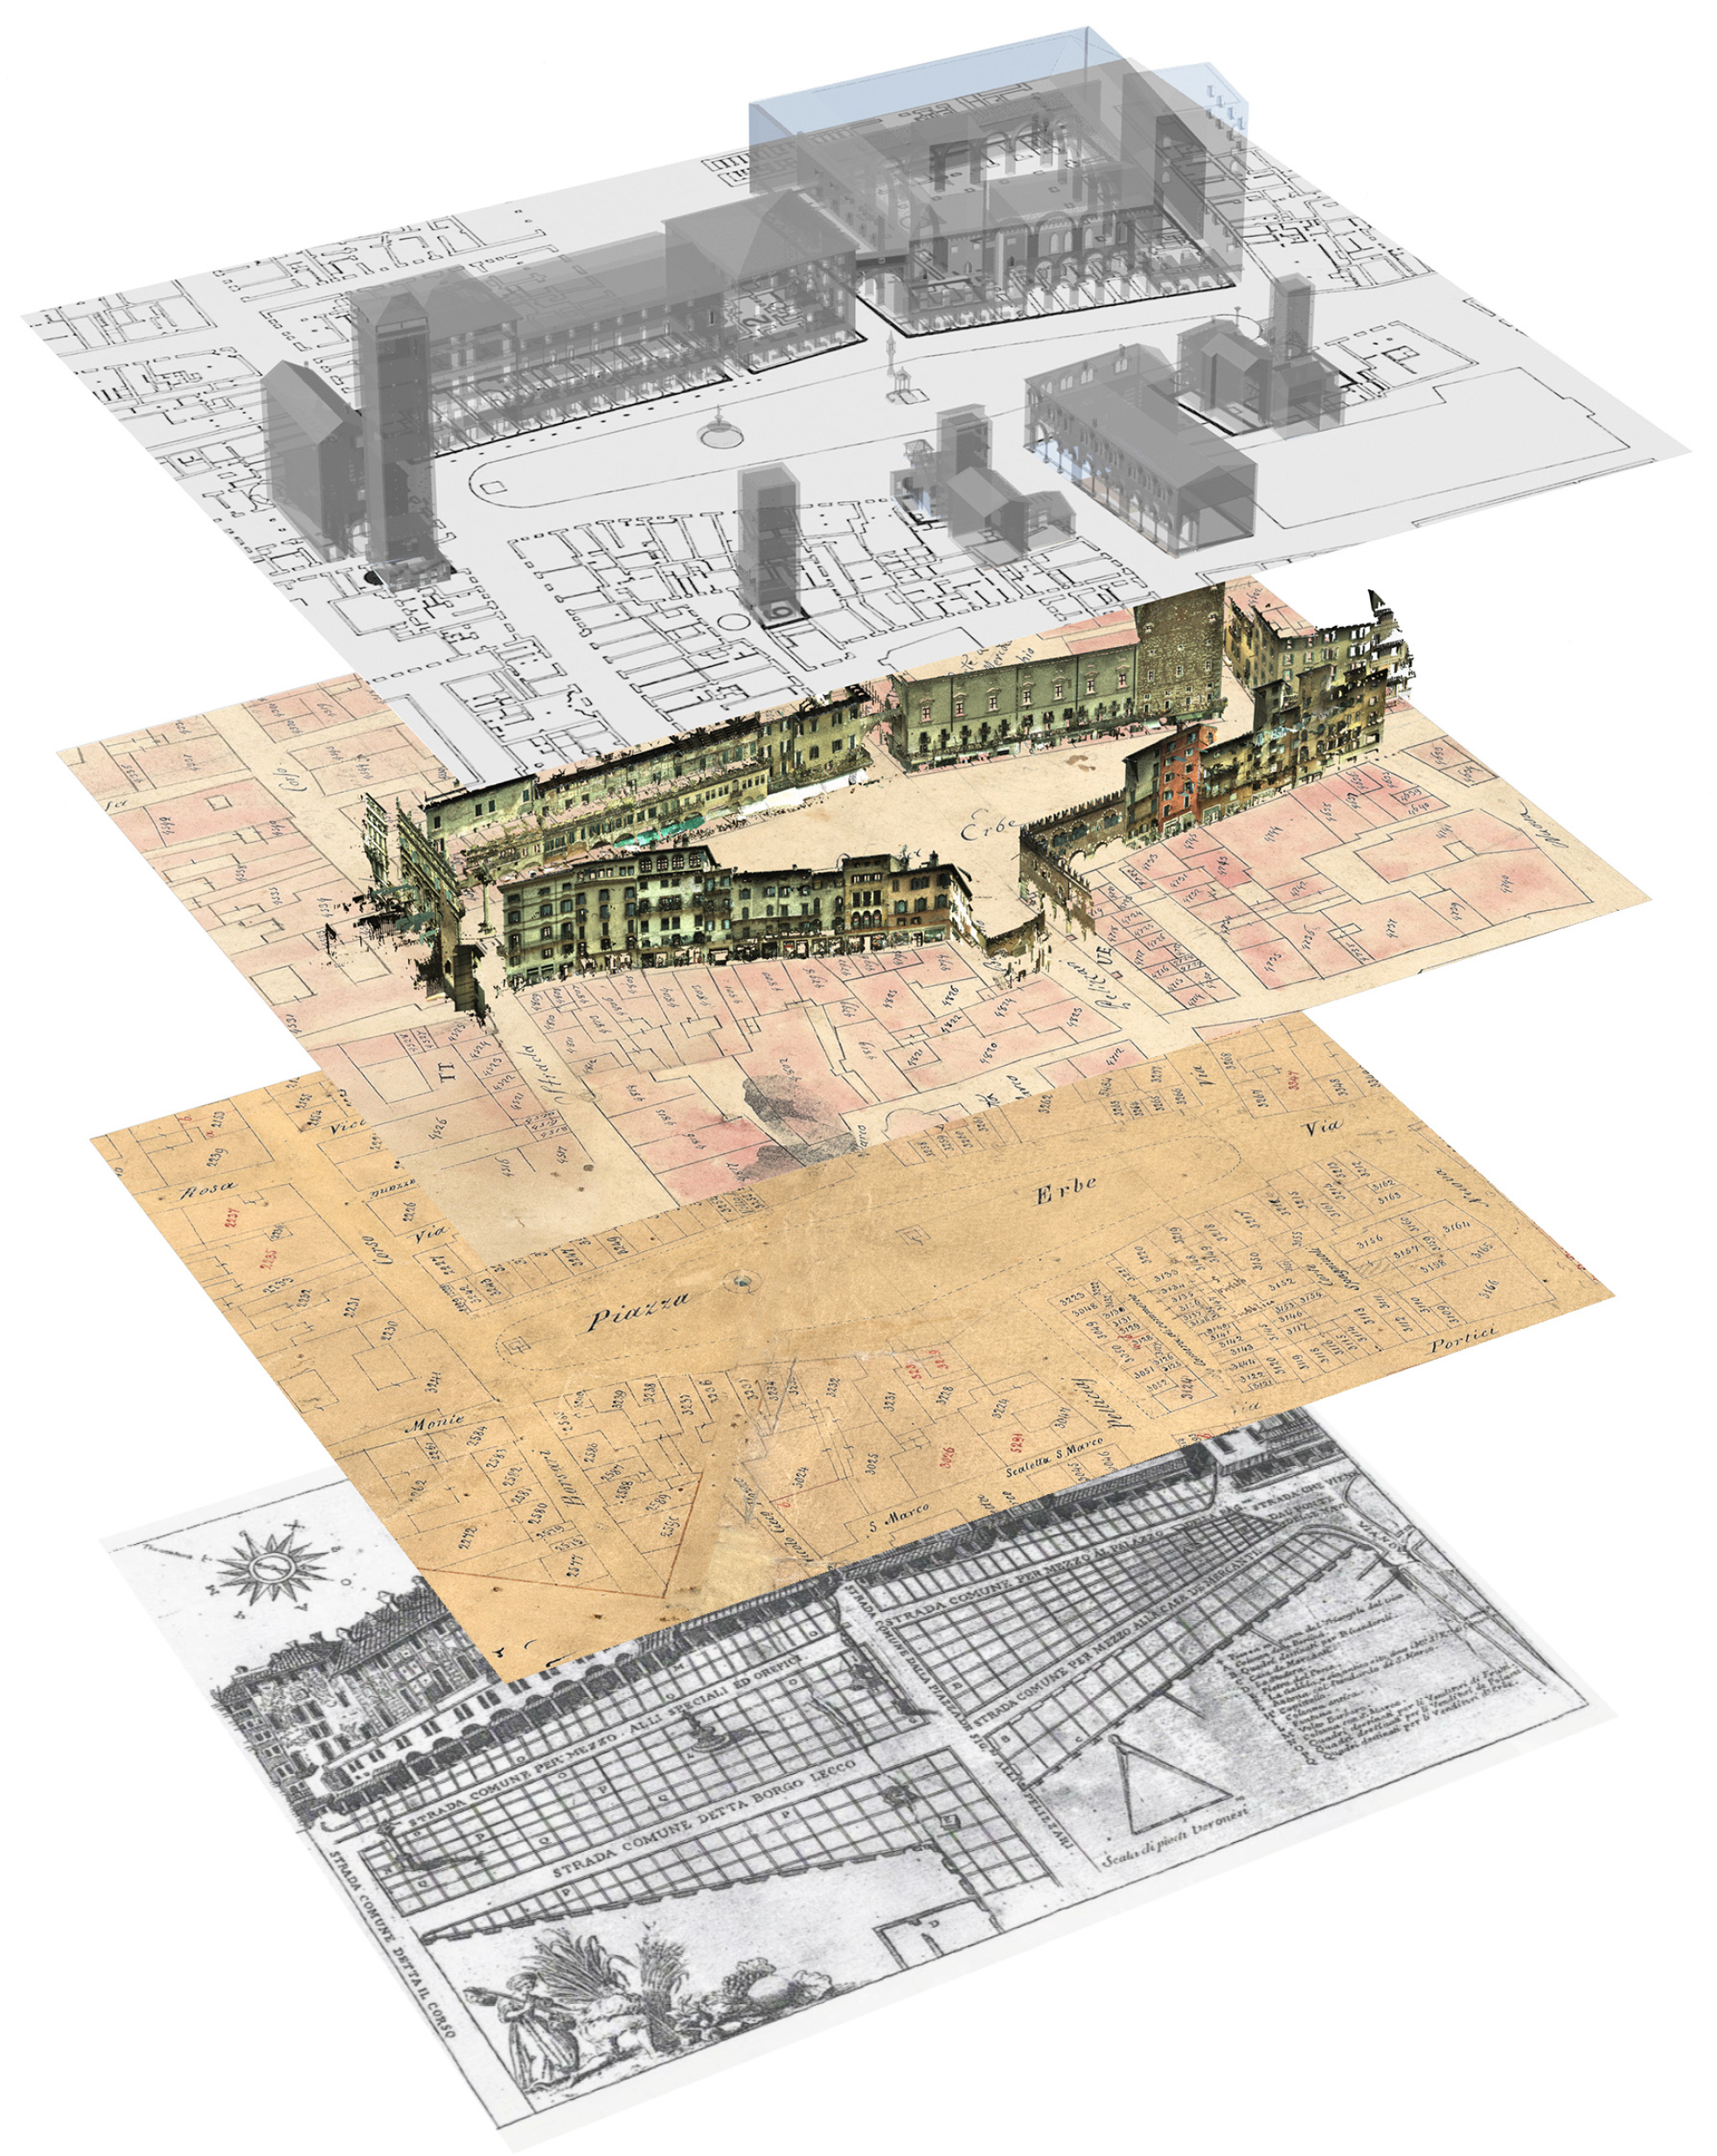
Figure 2.
Reconstruction process. From the bottom: Piazza Grande Verona (1589); Catasto Austriaco tav. 16 (1839–1912); Catasto Napoleonico tav. 17 (1807–1816); laser-scanned point cloud; hypothetical 3D reconstructed model of the better-documented buildings facing the
Piazza delle Erbe. A variation of this image was published in [
14].
Some architectonic elements placed in the middle of the piazza, such as the fountain and the
Capitello (also called Tribuna) (
Figure 3), were not subject to relevant alterations compared to the reference period, so they were reconstructed by referring mainly to the data acquired through the survey campaign. The monumental ancient column was originally positioned next to the
Capitello, but was repositioned later in the southeast part of the piazza, so it was acquired through photogrammetry and laser scanning and repositioned according to direct and indirect textual sources. Some buildings, such as Mercanzia residence (
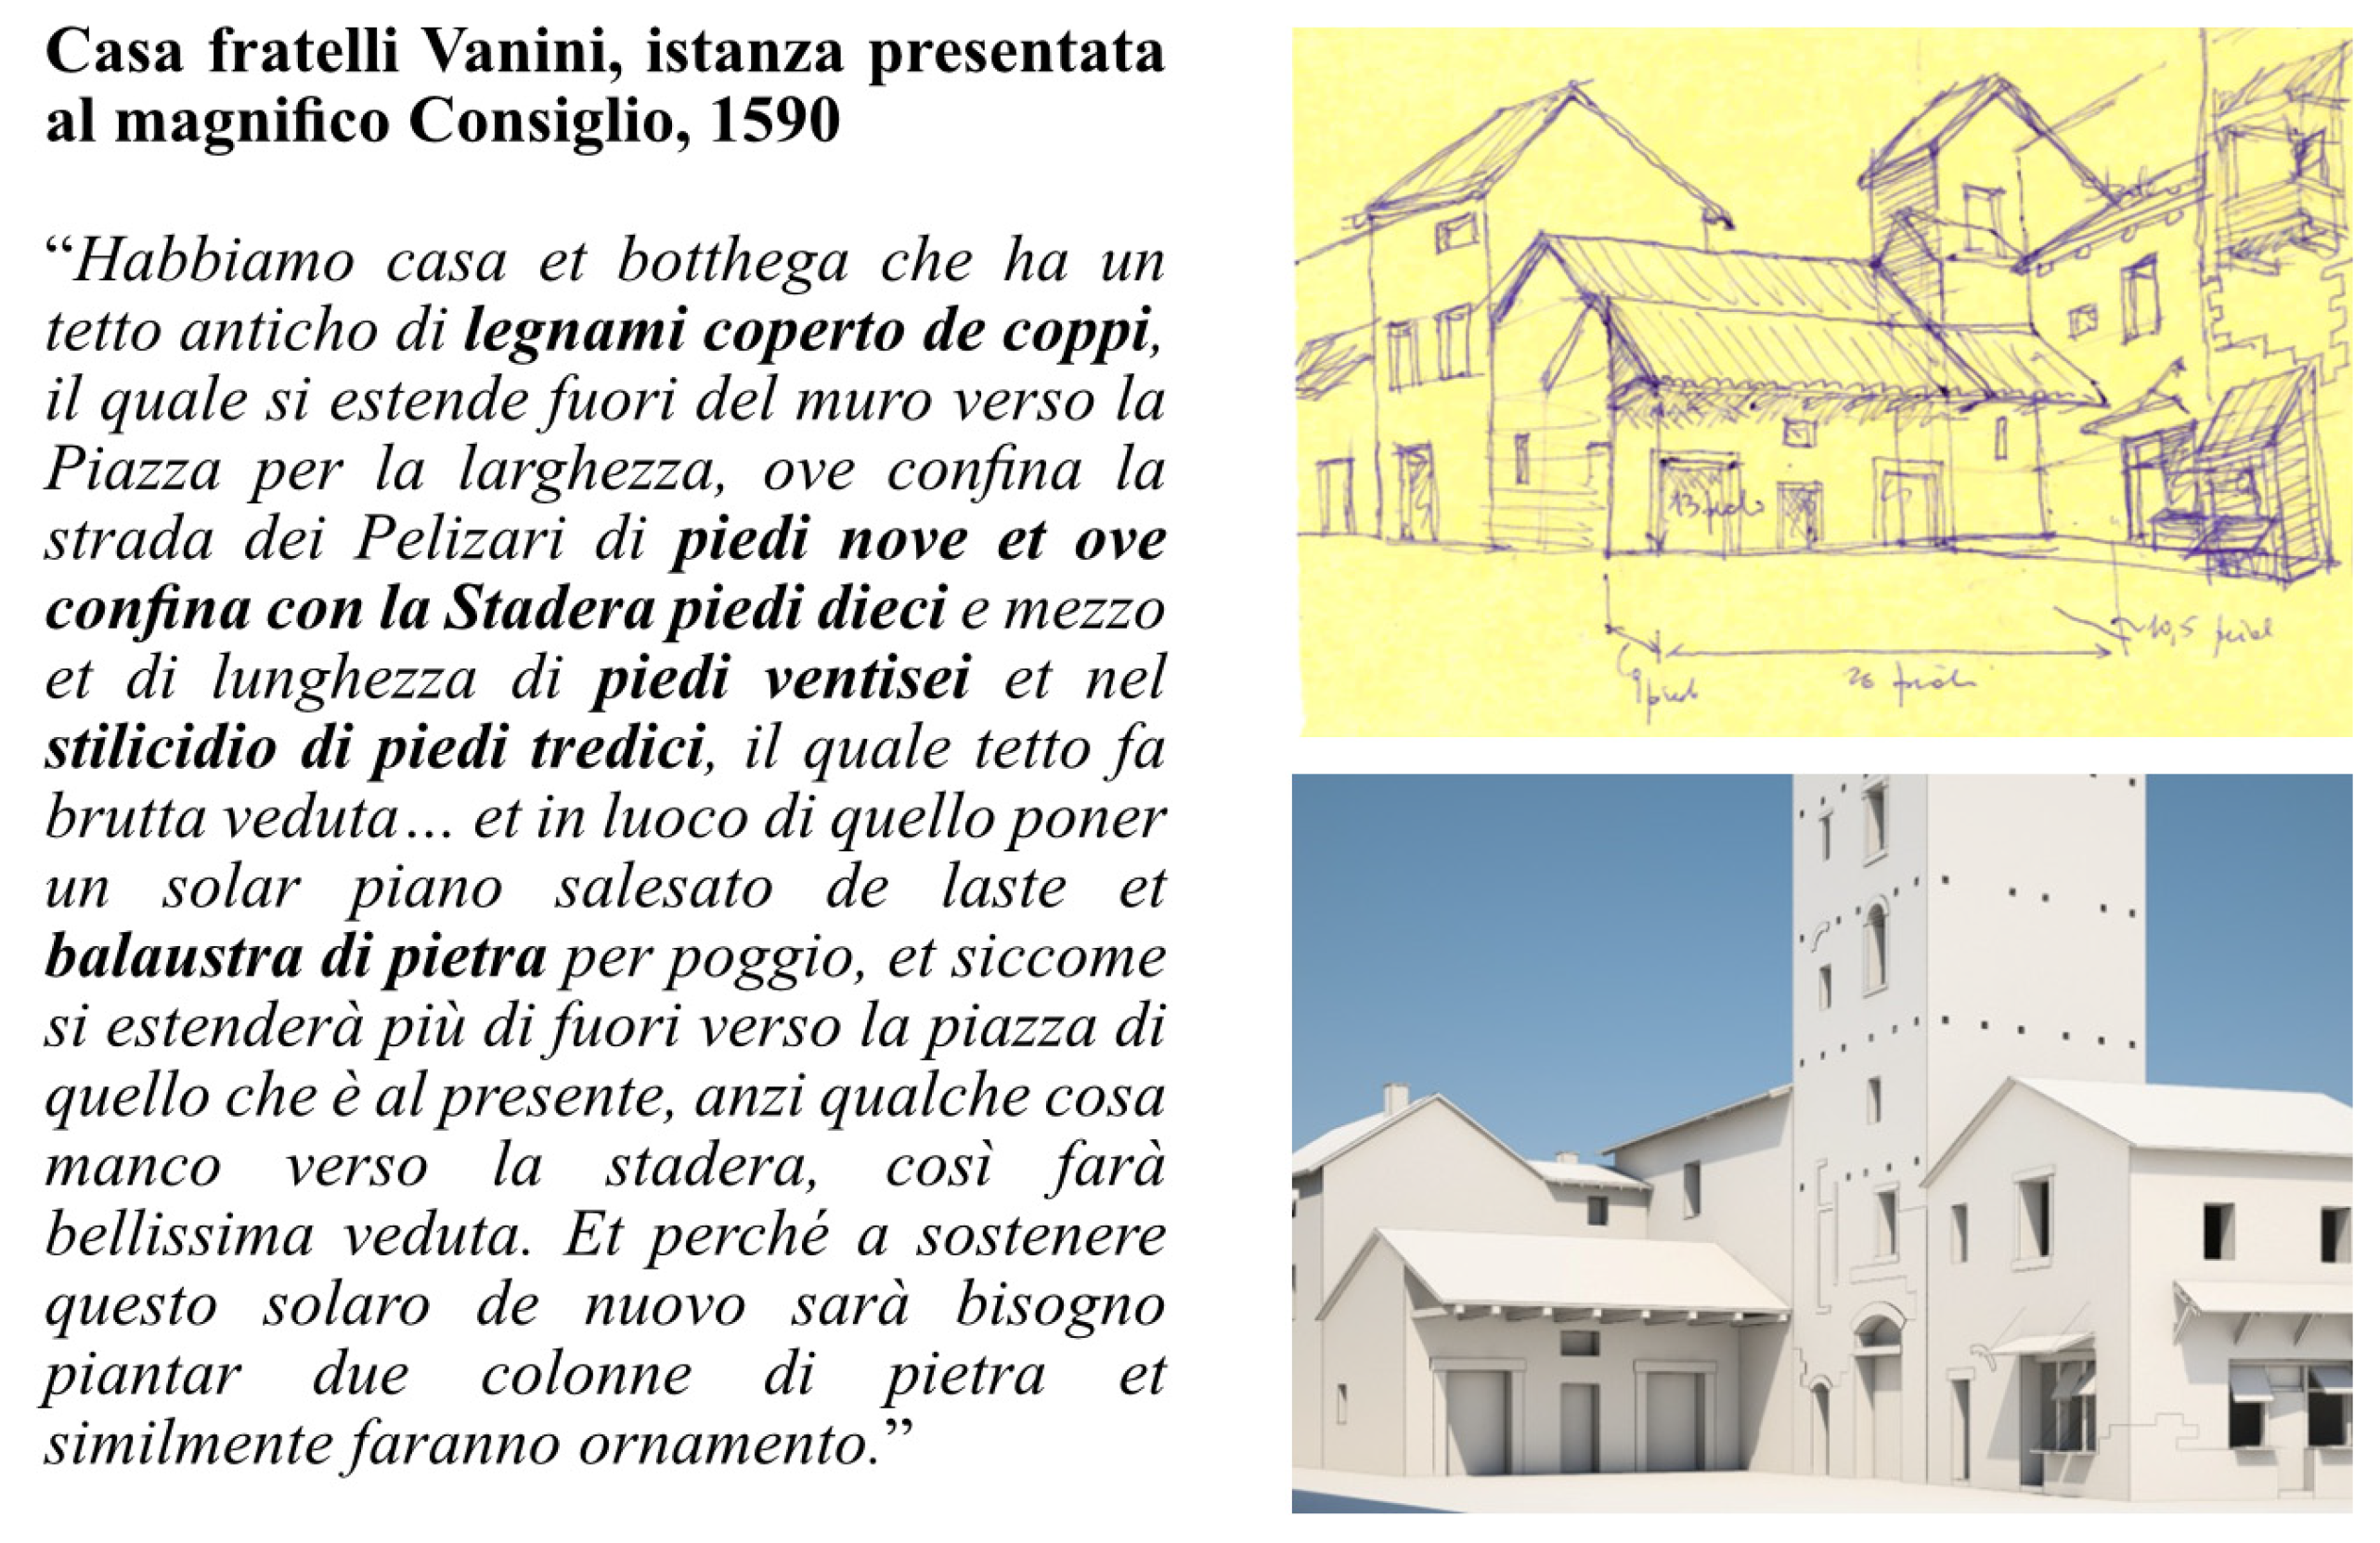
Figure 4) or Gardello’s tower, maintained their global configuration but changed minor features over the ages, so their volumes and positions were based on the survey campaign, while the smaller-scale details and textures were based on other direct or indirect documental sources. Other elements and buildings were reconstructed based on cross-referencing the available cadastral data with accurate textual descriptions from historical archival data, such as Fratelli Vanini’s house (
Figure 5).
More than half of the buildings facing the piazza were sufficiently documented in terms of their geometry; position; and, more rarely, their constructive system. However, direct sources that also documented their surface appearance (e.g., colour, roughness, dirt, bumpiness, etc.) were almost always unavailable. Most of the graphical sources available were black and white (e.g., engravings), and the few coloured paintings available presented unplausible colours or depicted the buildings at different ages after renovations and restoration works. However, since the project required photorealistic textures, coeval buildings of the same geographical area were taken as references. To create plausible textures, photographs of said buildings were captured and post-processed to produce seamless textures.
The complexity of the reconstruction and the different approaches followed for each element and feature (geometry, constructive system, surface appearance, and position) highlighted the need for a dedicated methodology for the documentation and visualisation of the uncertainty.
3. The Evaluation of Uncertainty from the Architectural to Urban Scale
Uncertainty evaluation is a methodology of analysis that is widely used in the context of hypothetical 3D architectural reconstruction at the academic level. Various approaches have been proposed over the years [
6,
7,
8]. For example, the scale presented in [
9] is a scale which was originally designed for evaluating the uncertainty of hypothetical 3D reconstructions of never-built or lost individual buildings or manufact, and was refined over the years. That scale considers the authorship, quality, consistency, readability, and accuracy of the reference sources used to build the various 3D elements, and it uses these characteristics to assign a univocal, specific level of uncertainty to each element with minimal ambiguities and overlapping. Such a strategy was chosen to avoid assigning a level of uncertainty subjectively, as occurred in [
21,
22]. The minimisation of subjectivity and human biases is crucial in every process that aims to be scientific. Thus, given that the hypothetical reconstruction process can never be 100% objective by definition, it is particularly crucial to be able to keep track of such uncertainties and evaluate or communicate them in the most objective way possible. The ambition is to develop a user-independent assessment methodology capable of evaluating the level of uncertainty of certain types of hypothetical reconstructions based on objective data retrievable from the sources, the documentation, and the model itself. Thus, the scale was designed to maximise the following aspects:
Reusability;
Exhaustivity;
Unambiguity;
Objectiveness.
Reusability refers to the characteristic of the scale which makes it applicable to other case studies. This feature fosters comparability with different 3D models made by other scholars.
Exhaustivity deals with the comprehensiveness of the scale in its context of application, meaning that it should have all the levels needed to cover all the possible cases in its context of application. In an ideal scenario, when applying a certain scale of uncertainty to a given 3D reconstructed model, there should never be a situation where the operator is not capable of assigning a level of uncertainty to a certain element because it encountered a case that was unpredicted by the creator of the scale.
Unambiguity is another important characteristic that fosters reusability as well as readability. Ambiguity might appear both in textual definitions and in the choice of the graphical elements that will be used to visually identify the various levels (e.g., colours, icons, patterns, etc.). In the scale presented in [
9], colours are used to visually indicate each level, but in other scales, other graphical elements are sometimes used, such as icons [
23] (p. 149), alphanumerical symbols [
23] (p. 144), patterns, and shades of grey [
23] (p. 156). Ambiguity might prevent the operators from using the scale properly, or could cause misconceptions at the visualisation stage; thus, it is very important to minimise ambiguities in the creation of new uncertainty scales.
For example, in the scale proposed in [
9], the textual definitions were written in the most complete and clear, yet synthetic, way possible, and the colours assigned to each level were chosen to minimise perceptual or cultural misinterpretations. In particular, the shades of colours were chosen to be as different as possible to make them easily recognisable even when applied to a shaded 3D model. The colour red was used to indicate the highest level of uncertainty, because in Western and Eastern cultures, most often, the colour red is used to indicate alerts, errors, danger, etc. Other scholars have used it to indicate the lowest uncertainty [
24]; however, this choice might create ambiguities because casual viewers might interpret it with an opposite meaning, since red in modern culture and various fields is rarely used to indicate the highest reliability. The shades of colours are sorted by following the wavelengths of the visible light spectrum, since this is a popular way to define false-colour scales in many different fields, such as fluids analysis [
25] (pp. 178–179), weather forecasting [
26] (pp. 63–67), etc. The choice of adopting an already popular way of assigning colours to data helps to improve the intuitive understanding of the sorting of the colours at a glance. All these choices help to minimise ambiguities and might help to enable a basic understanding of the distribution of uncertainty at the visualisation stage of a given 3D reconstruction without even needing to read the legend, which is a practice often adopted by casual visitors to museums and other dissemination contexts.
Objectiveness enables the reproducibility of the results, which is a critical aspect in the scientific context. Objectiveness, obviously, does not refer to the absence of subjectivity in the whole hypothetical reconstruction process, because hypothetical reconstructions by definition need subjective interpretation by an author. Objectiveness, in this context, refers only to the application of the scale of uncertainty, i.e., if two different operators are asked to analyse the same known hypothetical reconstructive 3D model through the use of an objective scale, they will be able to independently apply the scale and output comparable results. The method proposed in [
9] aimed to improve the objectivity and comparability of the analysis of uncertainty by developing a mathematical formulation to calculate the average global uncertainty of the whole reconstructed model. This value (named AU_V) was calculated by averaging the uncertainty of each architectural element, weighting them with their volume. The weighting-with-volume step allowed for a user-independent result, and thus improved the objectivity of the result.
Even though the scale presented in [
9] has been used effectively in many different cases, it was designed specifically for the analysis of individual buildings or manufacts, and it was tested mainly on architectural case studies where the surface appearance was left unsolved. This is, of course, too restrictive in all those cases where both geometry and surface appearance are reconstructed, especially when referring to different sources, which was the case for most buildings in the reconstruction of
Piazza delle Erbe in Verona. In addition, architectonic-scale reconstructions usually rely on a higher number of more exhaustive reference sources, as they enable a much higher level of detail and overall higher reliability to be reached. In the case of urban-scale reconstructions, the sources are often more spread and rarely provide enough information to reconstruct individual buildings with a reliably high level of detail. Furthermore, it is not often necessary to reach the architectural-scale level of detail for all buildings. For this reason, an improved methodology for the analysis and visualisation of uncertainty, specifically designed for urban-scale case studies, was developed and will be presented in detail in
Section 5.
4. Representing the Level of Uncertainty through Colours
The use of chromatic scales (also known as false-colour scales, e.g., pseudo-colour, density slicing, and choropleths) has wide applications in numerous scientific disciplines thanks to the ability to represent features that are not readily discernible otherwise in a clear way according to widely shared semantic codes.
Among the various methods which have been adopted and proposed to represent the degree of uncertainty that characterises the reconstructive hypothesis in the context of hypothetical reconstructions, the use of colours is considered one of the most effective methods. In fact, it has become a frequently used tool within the disciplines that use virtual reconstruction as an investigative tool [
23].
Therefore, the use of colours in 3D visualisation can be considered as a tool capable of allowing for the evaluation/estimation of the uncertainty that characterises each element based on a subjective, but controlled, analysis and interpretation of the available data. False-colour views (as well as pseudo-colour, etc.) are one of the most popular ways to improve readability in data visualisation in fields that use virtual reconstruction as an investigative tool [
23,
27], and in data analysis in general.
4.1. Choosing Clear and Readable Colour Palettes for Data Analysis
Stone [
28] provides an extensive overview of the effectiveness of colour palettes in data analysis and explains how hue, value, and chroma can all play important roles in the readability of data. The colour hue represents the name of the colour (e.g., red, orange, blue, green, etc.), namely, the point in the visible colour spectrum where that colour is placed; colours farther in the colour spectrum are more easily recognisable. The value represents the lightness or darkness of the colour; contrasting values can be used to improve readability and attract attention. Chroma represents the vivacity of a colour, or how pure a colour is (the highest-chroma colour contains no black or white); changes in chroma can be used to highlight certain elements.
Although chroma is often used as a synonym for saturation, the Commission Internationale de l’Eclairage (CIE) [
29] defines them differently [
30]. Not only are the definitions different, but also, manipulating colours with a colour wheel based on hue, chroma, and value (Munsell colour wheel [
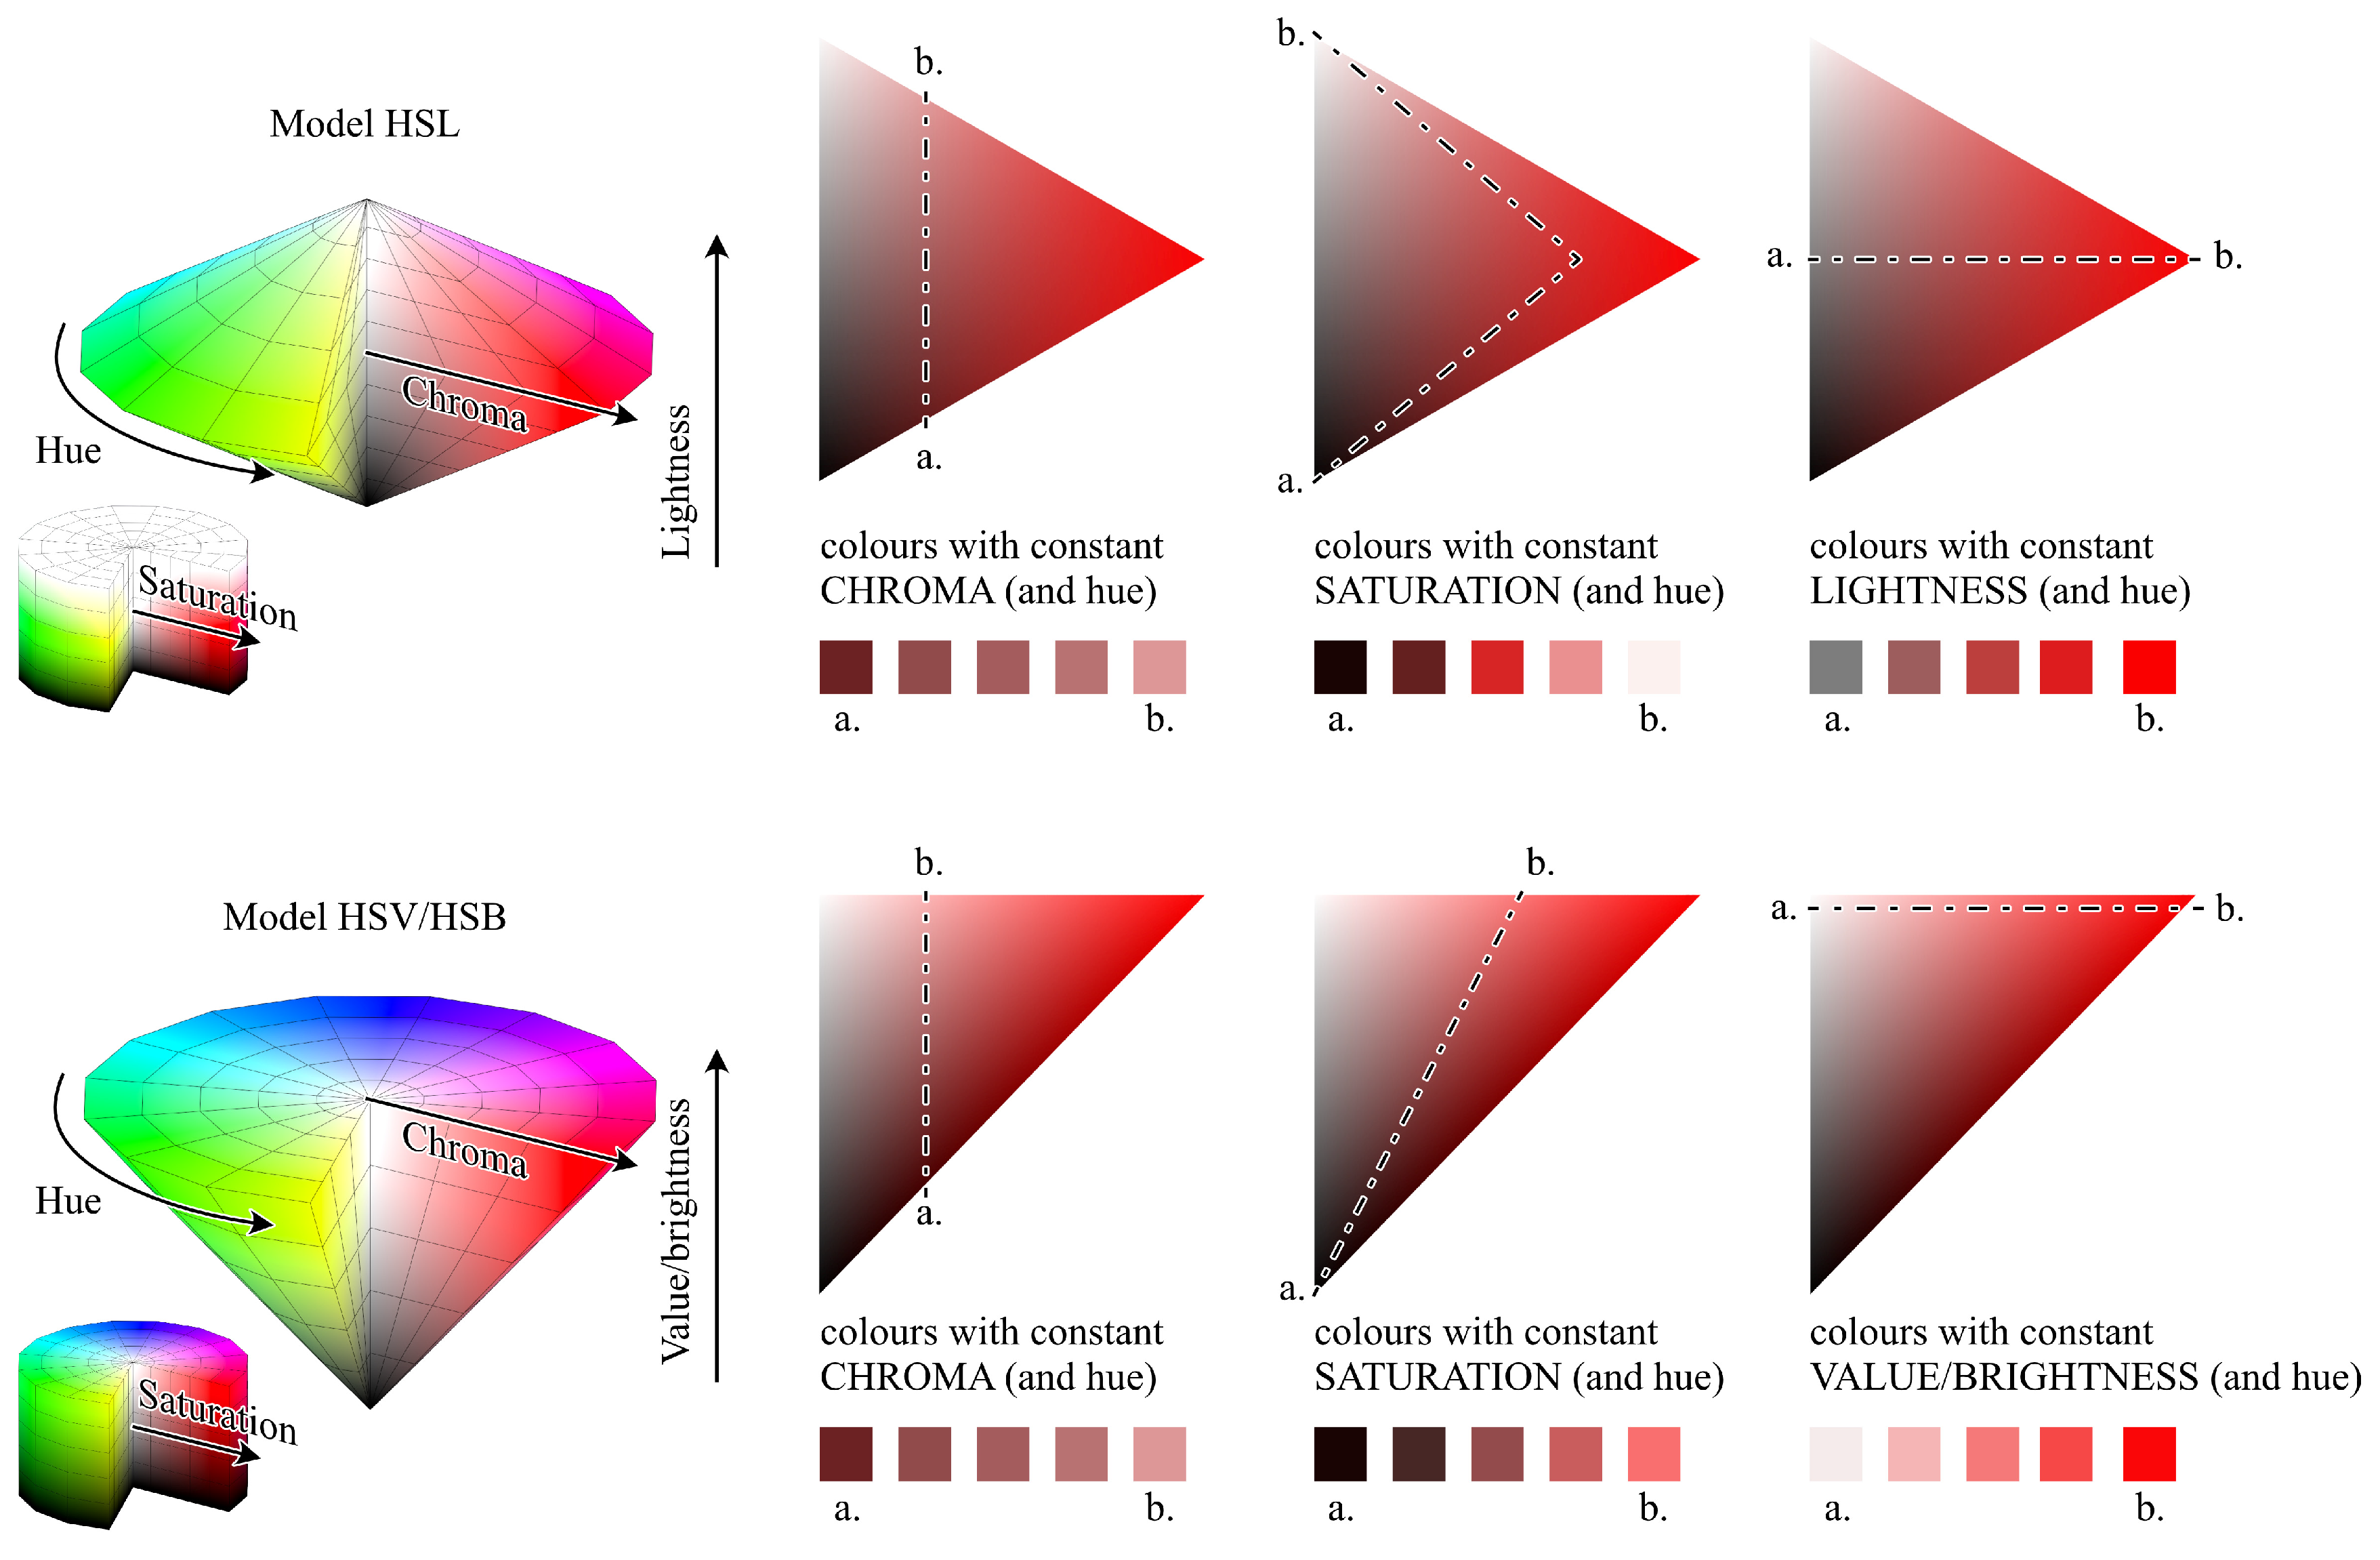
31]) is not the same as manipulating colours with a colour wheel based on hue, saturation, and value (HSV) or hue, saturation, and lightness (HSL). Despite this, most of the observations made by Stone are still valid even when transferred to a saturation-based workflow, which is one of the most often used in recent colour-rendering applications. The differences between chroma and saturation and between value (or brightness) and lightness in both HSL and HSV (or HSB) are shown in
Figure 6.
In summary, hue, saturation, and value can be calibrated to improve readability, grouping, highlighting, and separation of graphic elements; however, when working with shaded 3D scenes, the selection of readable colours also needs to take into consideration other boundary conditions, such as personal cognitive biases, lights and shadows, and other environmental components. There are numerous studies in the field of cognitive and neuroscience [
32,
33,
34] that have attempted to identify which effects and elements influence the readability and interpretation of colours in shaded pictures. Concerning this problem, Briggs [
35] demonstrated that in a shaded scene, when the same colour was unevenly illuminated, a shift in the perception of value and chroma of the colour was more likely to happen (unless there were other white objects with the same lighting condition that the brain could use as a comparison). On the contrary, the hue was less subject to such a perceptual shift [
30,
35]. Thus, it is preferable not to rely exclusively on variations in value and chroma (and constant hue) when choosing the colour palettes for false-colouring 3D-rendered shaded scenes, as scales with variable hues are more reliable and easier to read.
4.2. Good Practices for False-Colour Analysis and Visualisation of 3D Reconstructions
As seen above, shadows and lights in an illuminated 3D scene can cause perceptive HSV shifting of the original palette. To limit perception biases or misinterpretation of colours due to changing lighting conditions, the following rules of thumb might be followed:
Use white lights;
Avoid sharp dark shadows;
Use diffuse lights;
Reduce the contrast between illuminated and shadowed areas;
Use dim shading as much as possible.
When rendering a 3D false-coloured scene, white lights can be used to minimise the hue shifting of the colours applied to the 3D elements. To also minimise perceptual shifts in value and saturation, it is preferable to reduce the contrast between illuminated and shadowed areas, which can be achieved through diffuse lights. In particularly critical scenes, it might also be helpful to dim the shading effects (lights and shadows) to a point where they are almost imperceptible, up to a limit where only their base colours and silhouettes are visible; this would help to avoid unwanted shifting of the perceived colours, but information about the three-dimensionality of objects would be lost. Thus, it is preferable not to dim the shading completely, or to complement the completely dimmed solution with an additional, more traditional, shaded image of the same subject.
In shaded visualisations of 3D scenes where the colours need to be individually legible, it is preferable to avoid scales of colours where only their value and saturation vary, or scales with too many levels, because this would imply hue values closer to each other and they would be harder to recognise, especially under non-uniform lighting conditions. This is especially true when the colours of the scale are not all present in the scene, because the possibility of comparing one to the other would not be available.
The following good practices can help in choosing the colours for false-coloured visualisations of shaded 3D scenes while maximizing legibility:
Varying the hue parameter with wide steps helps to improve the recognisability of the various colours even if not uniformly illuminated;
Varying value and saturation can improve highlighting, grouping, or contrast;
Varying value and saturation alone might be insufficient to guarantee legibility in all kinds of lighting conditions and all 3D shaded scenes. Thus, it is not recommended to exclusively vary these two parameters, especially if the colours need to be individually recognisable or if the colours are not all present in the scene (unless the scales of the colours have a small number of steps and the lighting conditions are properly calibrated).
5. An Improved Scale of Uncertainty for Urban-Scale Hypothetical Reconstructions
When the scale of uncertainty presented in [
9] was tested on the case study of
Piazza delle Erbe, it was suddenly evident that it was not suitable for evaluating all the aspects of the reconstruction. Thus, the scale needed revision to make it applicable to a wider set of case studies, such as urban-scale case studies.
The previous scale was designed for individual architectonic-scale reconstructions, and it was aimed to evaluate the uncertainty of geometry, the constructive system, the surface appearance, and the position at once. This approach worked because, in architectonic-scale reconstructions, all these features are often derived from the same source; thus, they have matching uncertainty. However, in the case of urban-scale reconstruction, it often happens that the geometry, constructive system, surface appearance, and position are inferred from completely different sources with different uncertainty levels (due to limited sources available for each building).
Furthermore, architectonic-scale hypothetical reconstructions are often modelled with architectonic detail; thus, it was not necessary to define the target level of detail chosen for the reconstruction. On the contrary, urban-scale hypothetical reconstructions often aim to reach a level of detail which is often lower than the one that the sources would be able to provide due to limited time, budget, or need.
5.1. Features of the 3D Architectural Model: Geometry, Constructive System, Surface Appearance, and Position
Given these premises, the first improvement was to make the scale capable of evaluating individual features of the 3D model:
Geometry (concerns dimensions and formal features of the object of study);
Constructive system (concerns the constructive technology, the stratigraphy, the manufacturing system, etc.);
Surface appearance (concerns the visible surface features of the material, such as colour, roughness, reflectivity, etc.);
Position (concerns the location of the building/architectural element with regard to its context).
The first three features have already been considered in [
36], and we added the positional feature, which is crucial for urban-scale cases. To avoid terminological ambiguities, we renamed the “material” feature proposed in [
36] to “constructive system”. For the evaluation of the uncertainty of these four features individually, it would be possible to design four individual scales. However, to avoid overcomplicating the application of the feature-based analysis, the improved scale was developed in a way that is compatible with all four features.
The authorship type and quality of the sources were already considered in the scale proposed in [
9], while the level of detail (LoD) provided by the sources compared to the target LoD of the 3D reconstruction was added ex novo. Thus, the next step was defining the possible LoDs of the various features (geometry, constructive system, surface appearance, and position).
5.2. Level of Detail (LoD) for the Geometry
The analysis of architectural objects based on their LoD has been widely discussed in various contexts; for example, one of the most popular standard LoD scales is the one developed in the context of CityGML [
37]. This scale differentiates the geometric and semantic complexity of a 3D-modelled building into five LoDs numbered from 0 to 4. The definitions of each level are shown in
Table 1.
This scale was further implemented over the years. For example, Biljecki et al. [
38] proposed a more granular definition by adding four more sub-LoDs for each of the original LoDs. BIM-based methodologies also refer to standardised LoD charts. These standard charts always follow the same basic principles. For example, the LoD is always sorted with increasing geometric detail and semantic complexity; nevertheless, the number of levels or the definitions of the single levels often change from one country to the other and are updated over the years as soon as new standard guidelines are released. A good, recent literature review on this topic was published by Abualdenien and Borrmann [
39], showing a wide variety of possible LoD scales. Since many different LoD scales exist and are standard only for specific contexts, it is always recommended to specify which LoD scale of reference is used in each context. Thus, in the case of the hypothetical reconstruction of
Piazza delle Erbe, for the evaluation of the geometric LoD, we referred to the CityGML scale reported in
Table 1, and the target LoD chosen for the reconstruction was set to LoD3 because, in the docufilm, the 3D model was framed up close in several walkthroughs at human height, and a high level of detail was necessary.
5.3. The LoD for Surface Appearance
The LoD of surface appearance is a concept that is also used in computer graphics, and it is usually related exclusively to the resolution of the textures used to compose the digital shaders (Mipmapping). However, this is too simplistic in the field of hypothetical reconstructions of architectural heritage. The list reported in
Table 2 is a newly developed LoD chart for the surface appearance.
To define the surface appearance in digital rendering, many different effects are calculated individually and stacked one over the other to compose the final image:
Base colour (also known as albedo or diffuse colour);
Roughness/glossiness (the level of smoothness of the reflections);
Reflectivity (the amount of specular/glossy reflection);
Reflection colour (metals usually have coloured specular/glossy reflections, while dielectric materials have white specular/glossy reflections);
Bump/normal (the medium-/high-frequency details/ruggedness of the surface that are visible to the naked eye and which could be modelled in 3D, but are instead baked into the texture to make the light calculation lighter at the rendering stage);
Metalness (related to the IOR of the material, it is a property that controls the intensity of specular/glossy reflections and their colour at the same time).
Alpha (also called cutout or opacity, it is used to represent cuts or holes in the surface);
etc.
It could be possible to develop a specific LoD chart for each of these aspects; however, such an approach would be too granular for an urban-scale project, and maybe even for an architectonic-scale project. Such a precise analysis of all these features would require a relevant investment of time or budget, which are always limited in most reconstructive projects.
Thus, the surface appearance of the 3D hypothetical reconstruction of
Piazza delle Erbe refers to the three-level LoD scale presented in
Table 2, and the target LoD chosen for the surface appearance for the reconstruction was the LoD2.
5.4. The LoD for the Constructive System
Examples of LoD charts specifically designed for constructive systems are not known to the authors. Nevertheless, the constructive system sometimes plays a role in the definition of the LoD of a 3D model in BIM workflows; however, it is integrated into the “global” LoD scales, which also consider other aspects of the model (for example, the geometry). Thus, the newly developed LoD chart for the constructive system is presented in
Table 3.
The LoD of the constructive system can also influence the LoD of the surface appearance, because, if the constructive system’s LoD is high, the surface appearance’s LoD could also be high. However, this is not always the case. In fact, for example, in a hypothetical reconstruction, we might have very detailed textual sources providing a high LoD for the constructive system of a wall while providing very little or no information about the fresco on the surface of the wall. For this reason, we propose that these two features be differentiated.
For the case study of the 3D hypothetical reconstruction of Piazza delle Erbe, the target LoD for the constructive system was set to LoD1.
5.5. The Definition of the Scale Levels
Now that the reference LoD scales are clarified (no LoD scale is necessary for the positional feature), we will discuss how the improved scale implements this multifeatured LoD-based concept. The improved scale of uncertainty is based on the following five characteristics of the sources:
Availability of the sources (available, unavailable);
Authorship (same author/s, different or unknown authors);
Types of sources (physical remains, direct/primary, or indirect/secondary);
Quality of the sources (readable or unreadable, consistent or inconsistent, well preserved or damaged, etc.);
LoD (LoD provided by the sources compared with the target LoD of the reconstruction).
The first four characteristics were inherited from the previously published scale (presented in [
9]) to which the LoD evaluation was added. The scale was subdivided into seven levels (plus one for abstention), numbered from one to seven, with increasing uncertainty (as shown in
Table 4). The 7-step scale was proven to have the best balance between versatility and usability based on empirical tests. The definitions were rewritten to make the scale compatible with all four features: geometry, constructive system, surface appearance, and position.
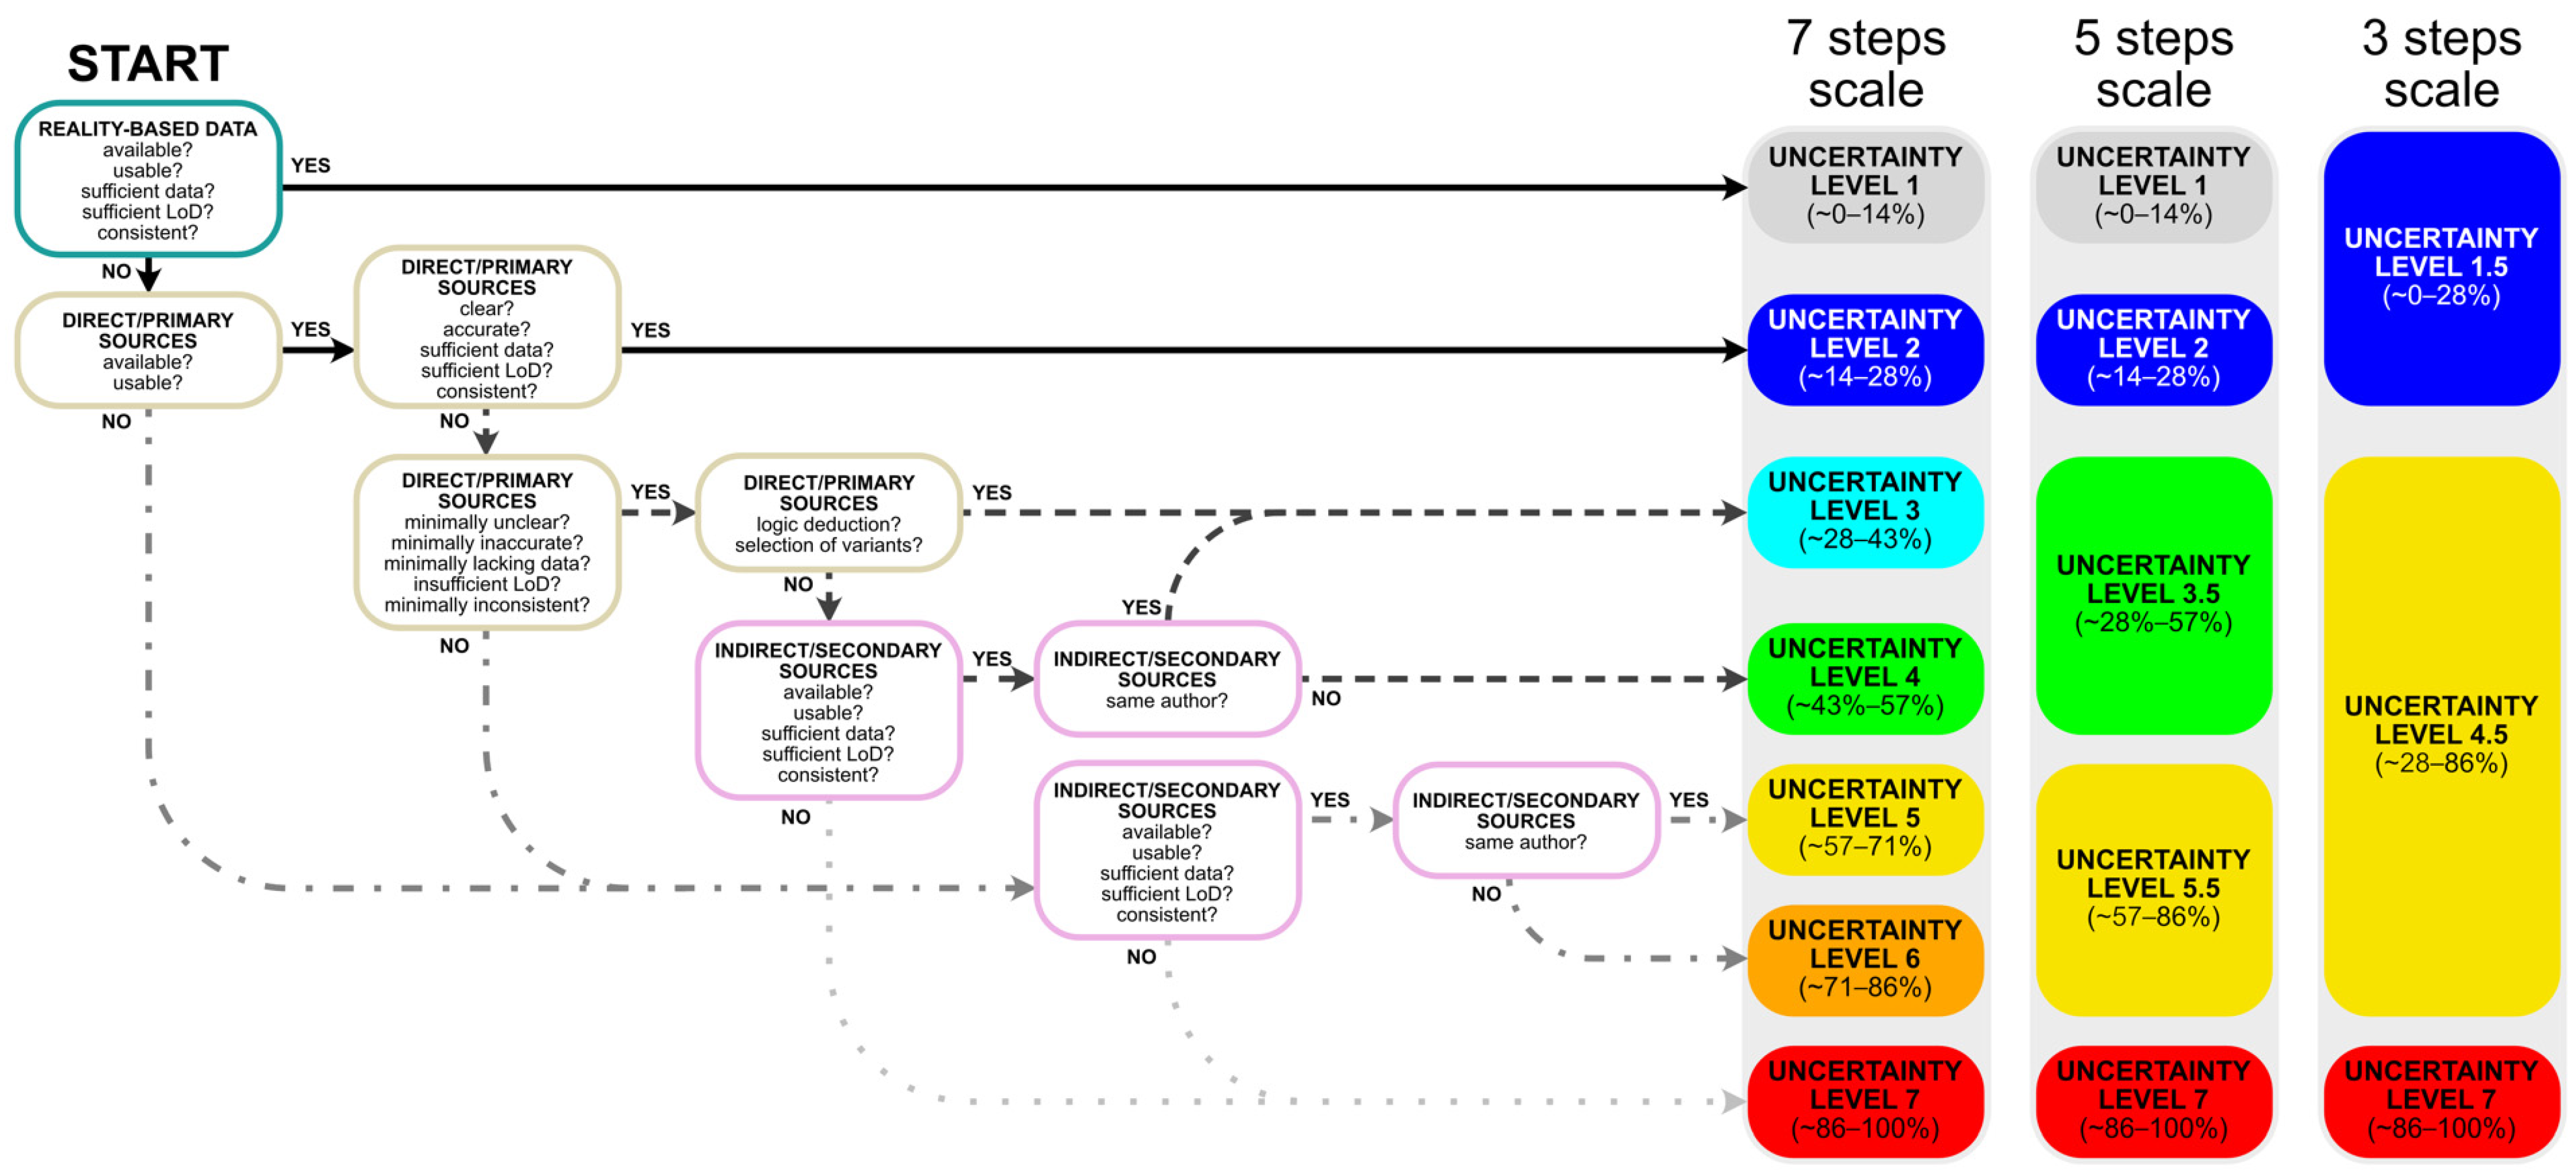
The granularity feature, which has already been theorised on the older scale of uncertainty and which allowed the user to choose between three versions of the same scale, with seven, five, or three levels, was repurposed here. On the five-level scale (
Table 5), the levels that differentiate the uncertainty according to authorship are collapsed into one single level. In the three-level scale (
Table 6) two further levels are collapsed and the sources are subdivided only into direct and indirect. The three-level scale is the most simplistic, but it can still be useful in projects with limited time or budgets. In the case of
Piazza delle Erbe, we rarely had direct sources attributed to the original designers of the buildings; thus, in this context, the scale with five levels was more suitable.
5.6. A Graphical Aid to Identify the Correct Level of Uncertainty
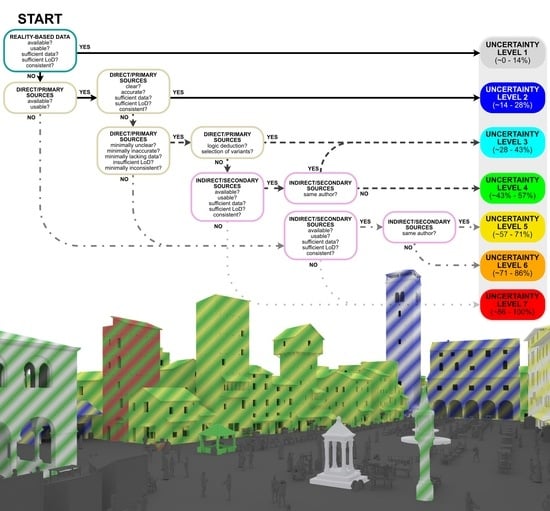
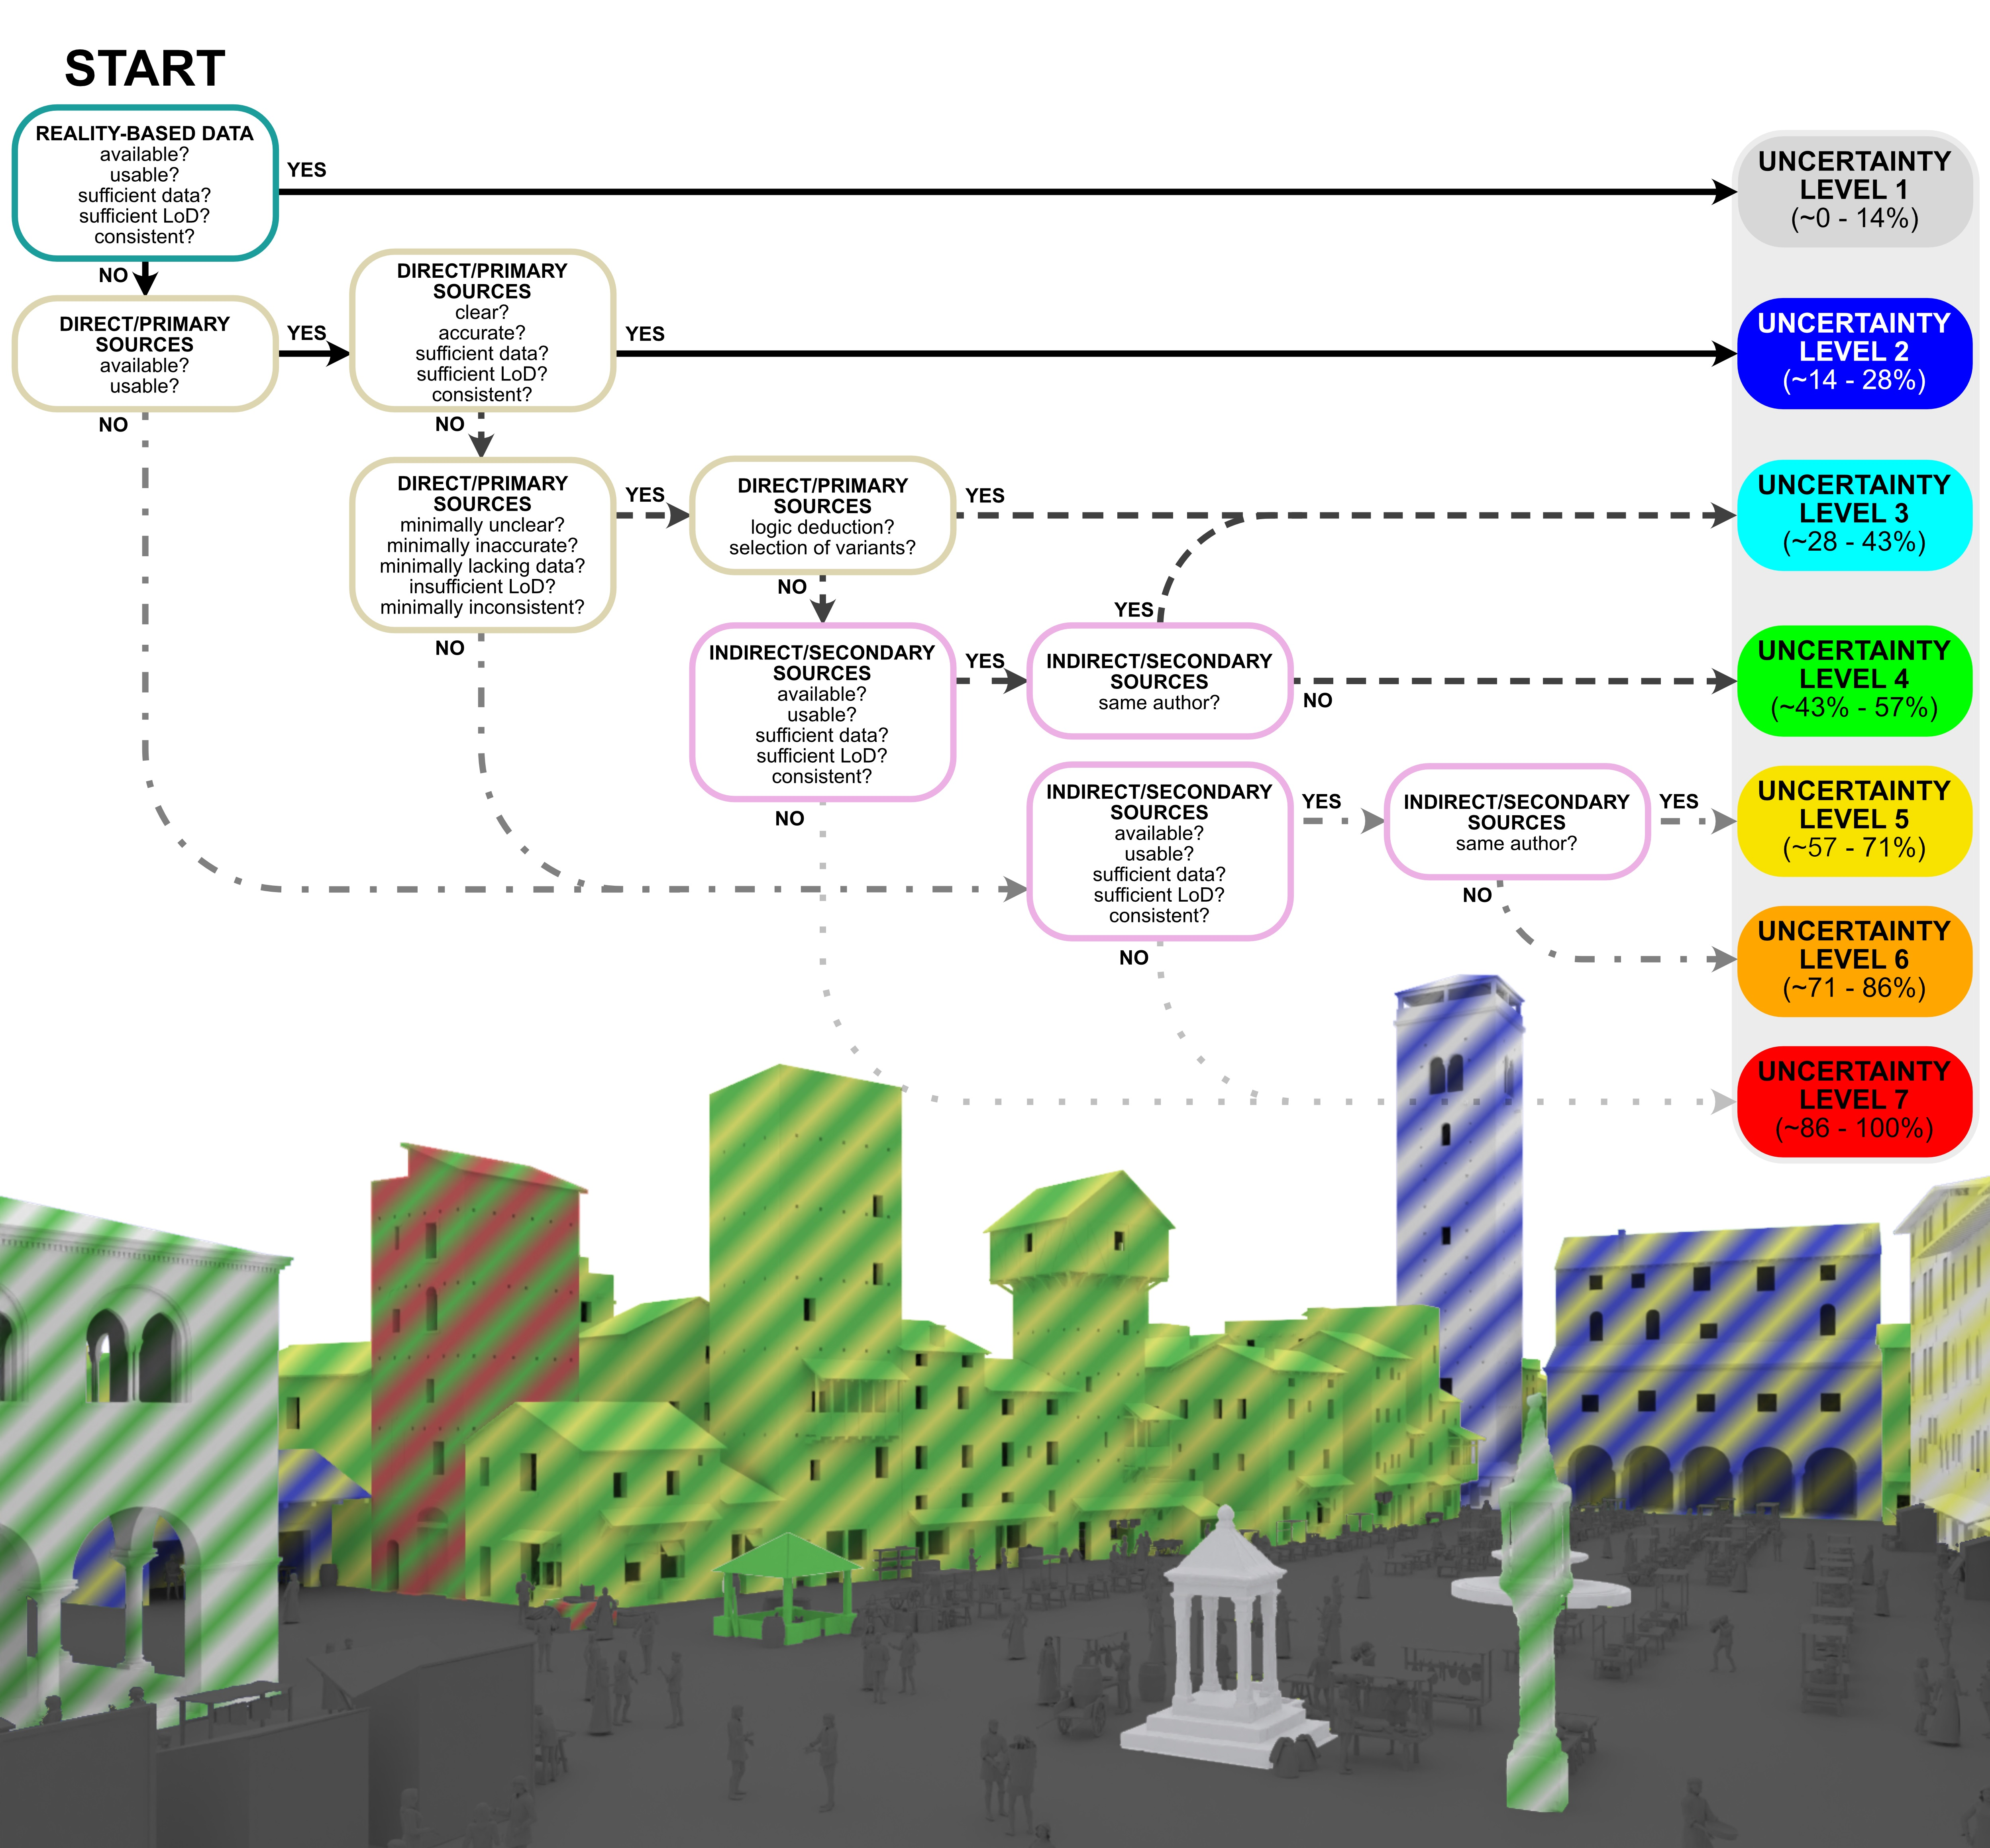
In order to foster the reuse of a certain scale of uncertainty by others, it must be not only exhaustive, unambiguous, and objective, but also easy to use. Thus, to simplify its use and foster its spread, we developed a yes/no flow chart (presented in
Figure 7) which can be used as an aid to find the correct level of uncertainty for each feature of the analysed reconstructed 3D element. For example, we want to find out what level of uncertainty characterises the geometry of a given Doric capital, so we start from the top left node and read the question: “Is reality-based data available/usable, does it provide sufficient data and does it reach the target LoD?”. If the answer is “yes”, we proceed to the right and we find that its uncertainty level is level one. If the answer is “no”, we follow the path downwards and read the second question: “Are any direct/primary sources available/usable?” If the answer is “yes”, we proceed to the right; if it is “no”, to the bottom, and so on until we reach any other uncertainty level.
5.7. The Definition of the Scale Colours
The colours assigned to each level of the scale were chosen considering the studies on colour perception mentioned in
Section 4. The levels have different hues sorted according to the visible spectrum of light. The hues were distributed between blue and red, as in the previously developed scale [
9], to maximise the delta hue from one level to the other as much as possible. Two further colours were added at the beginning and the end of the scale, light grey and dark grey, indicating elements based on reality-based sources and abstention, respectively. The choice of using colours that are univocally nominable (e.g., white, blue, cyan, green, yellow, orange, red, black) and not specific RGB values was made in order to avoid overcomplicating the problem, because RGB values make little sense if not referred to specific colour spaces and visualisation devices. Furthermore, using only nominable colours and not specific RGB values gives the users some flexibility when choosing HSV values, because they can adjust the palette slightly to their taste or graphic styles without a loss of comparability to the original scale (as long as the hues do not change too much).
6. The Visualisation of the Uncertainty of Piazza delle Erbe
The visualisation of the uncertainty for the case of
Piazza delle Erbe in Verona was carried out considering all the issues addressed in the previous sections and using the updated five-level scale shown in
Table 5. The five-level scale was more suitable in this case because the authorship of the sources was not relevant to the evaluation of the overall uncertainty. The analysis was carried out for four features: geometry, constructive system, surface appearance, and position. This produced four different false-coloured views, one for each feature. Since the rendering process of complex 3D scenes requires some time, the colours were applied in post-production. In this way, it was possible to render the scene only once. To accomplish this, two render passes were extracted at the same time:
The definition of the groups of models for the matte colour pass was carried out by considering buildings that were reconstructed with an analogous process and referencing analogous sources. At this stage, the colours assigned to the matte colour pass did not match the colours of the scale of uncertainty yet, as they were randomly assigned by the software just to differentiate each group from the others. Then, the two passes were imported into photo-editing software and blended using the “multiply” blending mode (
Figure 9). The matte colour pass was then decomposed into multiple layers, one for each colour, and recoloured based on the uncertainty of the specific feature being analysed. In this way, the four false-colour views, referring to geometry, constructive system, surface appearance, and position, were produced much more rapidly (
Figure 10,
Figure 11,
Figure 12 and
Figure 13).
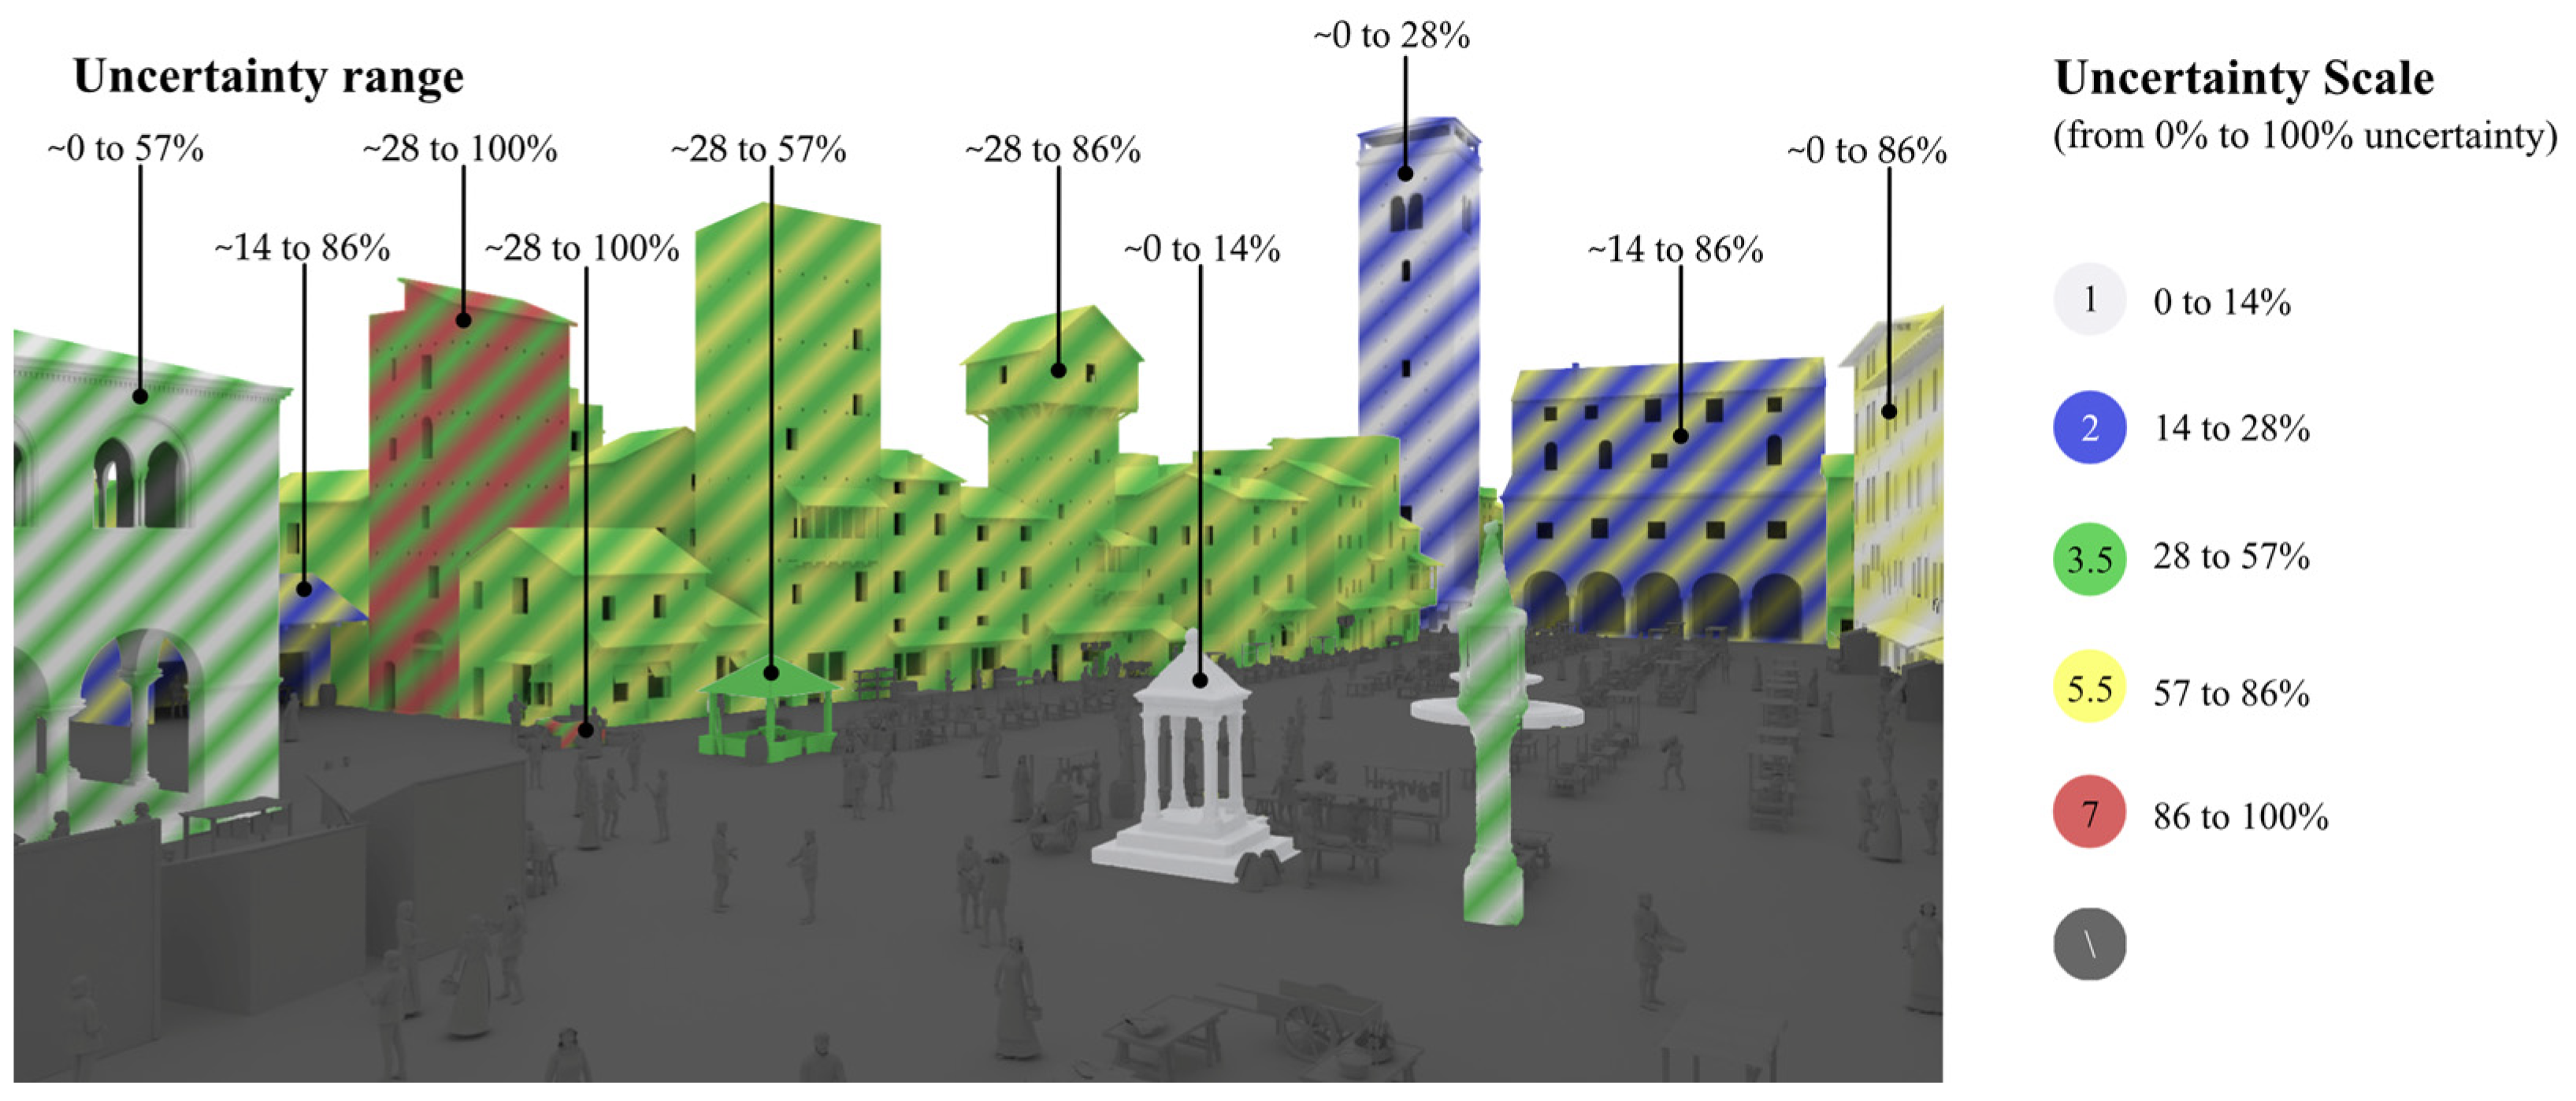
To improve the readability of the data, an additional image that synthetised the previous four images was produced (
Figure 14). This illustration must be considered as a complementary image which aims to clarify the range of uncertainty of each building concerning all its features. In this way, the viewers do not have to jump from one image to the other in order to see which buildings are more or less reliable.
7. The Average Uncertainty Weighted on the Volume (AU_V)
In
Section 3, we briefly discussed how the average global uncertainty for the hypothetical reconstruction of individual buildings is a useful tool to improve comparability, and how it could be calculated in a more user-independent way by averaging the uncertainty of each architectonic element weighted for its volume [
9]. The weighting with the volume is a crucial step to guarantee user-independent results; in fact, by just averaging the uncertainty of each individual element of the 3D model without weighting for their volume, the result would change depending on how the model is subdivided.
However, this method was tested on reconstructions that focused only on one feature (geometry). In the multi-feature uncertainty analysis proposed in this paper, before proceeding with the calculation of the global average uncertainty weighted on the volume (AU_V), we needed to calculate the average feature-based uncertainty of each building/element. To accomplish this, we simply averaged all of the uncertainty values of each feature (geometry, constructive system, surface appearance, and position), obtaining an individual, omni-comprehensive uncertainty coefficient for each building/element (which synthesised the uncertainty of all four features for each element). After this first step, the local average uncertainty of each building/element could be used to calculate the global AU_V with the same formula presented in [
9], as follows:
where:
AU_V is the total average uncertainty weighted with the volume of the individual elements;
n is the total number of elements;
i is the index of the considered element;
Vol is the volume of the considered element;
Uncert is the uncertainty value of the considered element (which corresponds to the number of the specific assigned level of uncertainty retrievable from
Table 4,
Table 5 and
Table 6).
To simplify the weighting with the volume calculation, the buildings can be substituted temporarily with their bounding boxes or with approximated polyhedra. This helps to speed up the calculation even when the scene is very densely detailed. In our case, we set up an algorithm in Grasshopper (plug-in for Rhinoceros) to automatise this process. For
Piazza delle Erbe, the AU_V calculation returned a global average uncertainty of about 53% (refer to the data reported in
Table 7).
The AU_V formulation was complemented with another alternative formulation (AU_VR), where each 3D reconstructive element was weighted with an additional relevance factor as follows:
where:
AU_VR is the average uncertainty weighted with the volume of the individual elements and a relevance factor assigned by the operator based on the importance of the individual elements;
Relev is the relevance factor (which can be larger or smaller than 1, but never smaller than 0).
The relevance factor allows the users to differentiate the weights of the uncertainties of the various 3D reconstructed elements based not only on volume, but also on importance. This second formulation was developed to achieve a more user-dependent but more knowledge-oriented result. The AU_VR subjectively depends on the operator’s choice of the relevance factor; however, in some cases, the less relevant parts of the reconstructions might have bigger volumes, as in this case, which would produce an unplausible, over-dimensioned average uncertainty. Thus, the AU_VR formulation was developed to solve this problem. For Piazza delle Erbe, we reduced the importance of the residential buildings by multiplying them by a relevance factor of 0.25; thus, the formation of the AU_VR returned an uncertainty value of about 28%.
8. Summary and Conclusions
In conclusion, this paper presented an improved and general methodology through which to analyse and visualise the uncertainty of an urban-scale 3D digital hypothetical reconstruction. The methodology consists of an updated visual approach based on false-colour multi-feature visualisation, which analyses the 3D scene by subdividing its features into geometry, constructive system, surface appearance, and position. The uncertainty is evaluated and visualised by applying an updated scale of uncertainty based on the availability, authorship, type, quality, and LoD of the sources used, which can be applied to all the features of the 3D model. The scale is specifically designed to maximise reusability, exhaustiveness, unambiguity, and objectivity. To achieve these objectives, the textual definitions were developed to be as clear and concise as possible, and the colour palette was designed to improve readability and reduce ambiguity as much as possible. A yes/no flow chart was developed to simplify the application of the scale. Furthermore, two formulas, AU_V and AU_VR, were proposed in order to extract two alternative/complementary numerical values of the average global uncertainty. The former gives a more user-independent result (with a given reconstructive model), and the second one is more user-dependent, but more knowledge-enriched since it considers the importance of the individual elements assigned by the operator. The proposed methodology was applied to a case study involving the hypothetical 3D digital reconstruction of the medieval marketplace in Piazza delle Erbe in Verona, a project presented at Expo 2015 in Milan. The methodology proved to be effective in handling the complexity of this particular urban-scale case study with all its challenges, and it was an opportunity to develop a general methodology that is potentially applicable to comparable cases.
If such an approach to evaluate, quantify, communicate, and visualise the uncertainty of reconstructive 3D models were to become systemic in the field, it would simplify the comparison and, thus, the readability and reusability of the models in a shared research environment.
Future works might take into consideration the testing of similar multi-feature approaches on architectural-scale hypothetical reconstructions, or the exploration of non-colour-based scales to help people with various colour vision deficiencies. Furthermore, to test the effectiveness of this methodology with a larger audience, it would be interesting to carry out an expert user evaluation.
Author Contributions
Conceptualisation, F.I.A., F.F. and R.F.; methodology, F.I.A., F.F. and R.F.; software, R.F.; validation, F.I.A., F.F. and R.F.; formal analysis, R.F.; investigation, R.F.; resources, F.I.A., F.F., R.F. and R.S.; data curation, R.F.; writing—original draft preparation, R.F.; writing—review and editing, F.F., F.I.A., R.F. and R.S.; visualisation, R.F.; supervision, F.I.A.; project administration, F.I.A.; funding acquisition, F.I.A. All authors have read and agreed to the published version of the manuscript.
Funding
This research was financially supported with RFO and BIR funds from the University of Bologna (scientific director F. I. Apollonio) and IULM, Milan (P. I. R. Smurra). The project at EXPO was originally presented by two universities UNIBO and IULM, and selected as “Eccellenza Universitaria” by CRUI, it was founded by IULM Milan.
Data Availability Statement
The datasets presented in this article are not readily available because the data are copyright-protected. Requests to access the 3D models or other data should be directed to the corresponding author.
Acknowledgments
Our thanks to Francesca Bocchi, who was the coordinator for IULM, for the scientific research in the Expo project in 2015. We also thank Michele Berretta for the modelling of the foodstuff, characters, and stalls used to populate the marketplace. Finally, we thank Elisabetta Caterina Giovannini, who contributed in 2015 to the acquisition campaign, the 3D modelling of the Palazzo della Ragione, and the photogrammetric acquisition of the sculptural elements.
Conflicts of Interest
The authors declare no conflicts of interest.
References
- London Charter Website. Available online: http://www.londoncharter.org/index.html (accessed on 25 November 2023).
- Seville Principles Website. Available online: http://smartheritage.com/seville-principles/seville-principles (accessed on 25 November 2023).
- DFG Website. Available online: https://www.gw.uni-jena.de/en/faculty/juniorprofessur-fuer-digital-humanities/research/dfg-netzwerk-3d-rekonstruktion (accessed on 25 November 2023).
- CoVHer (Computer-Based Visualisation of Architectural Cultural Heritage) Erasmus Plus Project (ID KA220-HED-88555713) Website. Available online: www.CoVHer.eu (accessed on 25 November 2023).
- Kuroczyński, P.; Apollonio, F.I.; Bajena, I.P.; Cazzaro, I. Scientific Reference Model—Defining Standards, Methodology and Implementation of Serious 3d Models in Archaeology, Art and Architectural History. Int. Arch. Photogramm. Remote Sens. Spat. Inf. Sci. 2023, 48, 895–902. [Google Scholar] [CrossRef]
- Apollonio, F.I.; Gaiani, M.; Sun, Z. 3D modeling and data enrichment in digital reconstruction of architectural heritage. Int. Arch. Photogramm. Remote Sens. Spat. Inf. Sci. 2013, 40, 43–48. [Google Scholar] [CrossRef]
- Ortiz-Cordero, R.; Pastor, E.L.; Fernández, R.E.H. Proposal for the improvement and modification in the scale of evidence for virtual reconstruction of the cultural heritage: A first approach in the mosque-cathedral and the fluvial landscape of Cordoba. J. Cult. Herit. 2018, 30, 10–15. [Google Scholar] [CrossRef]
- Ferdani, D.; Fanini, B.; Piccioli, M.C.; Carboni, F.; Vigliarolo, P. 3D reconstruction and validation of historical background for immersive VR applications and games: The case study of the Forum of Augustus in Rome. J. Cult. Herit. 2020, 43, 129–143. [Google Scholar] [CrossRef]
- Apollonio, F.I.; Fallavollita, F.; Foschi, R. The Critical Digital Model for the Study of Unbuilt Architecture. In Workshop on Research and Education in Urban History in the Age of Digital Libraries; Springer International Publishing: Cham, Switzerland, 2019; pp. 3–24. [Google Scholar]
- Piazza, Palazzi del Potere, Mercati del Cibo nell’Italia di Dante: Milano, Firenze, Bologna Verona, Expo Milano 2015, Padiglione Italia, 8 Luglio 2015. Available online: http://www.centrofasoli.unibo.it/centro_italiano/Expo2015_01.html (accessed on 25 November 2023).
- Simeoni, L. L’antico Mercato Veronese e i Suoi Supposti Capitelli; Tip. G. Marchioni: Verona, Italy, 1899. [Google Scholar]
- Varanini, G.M. Torri e casetorri a Verona in età comunale. Assetto urbano e classe dirigente. In Paesaggi Urbani dell’Italia Padana nei Secoli VIII–XIV; Cappelli: Bologna, Italy, 1988; pp. 173–249. [Google Scholar]
- Di Lieto, A. Una piazza comunale e scaligera: Piazza delle Erbe. In Gli Scaligeri 1277–1387; Varanini, G.M., Ed.; Arnoldo Mondadori: Verona, Italy, 1988; pp. 245–254. [Google Scholar]
- Apollonio, F.I.; Gaiani, M.; Fallavollita, F.; Giovannini, E.C.; Foschi, R. Digital reconstruction of Piazza delle Erbe in Verona at XIVth century. In Le Ragioni del Disegno. Pensiero, Forma e Modello nella Gestione della Complessità; Gangemi Editore: Rome, Italy, 2016; pp. 57–62. [Google Scholar]
- Apollonio, F.I.; Gaiani, M.; Fallavollita, F.; Giovannini, E.C.; Foschi, R. A Journey in the Fourteenth Century. A Digital Reconstruction of Piazza delle Erbe in Verona. In The Reasons of Drawing, English Version; Unione Italiana del Disegno: Rome, Italy, 2017; pp. 35–44. [Google Scholar]
- Bauernfeind G. (Draw) Closs A. (Engraver). Piazza delle Erbe con Bancarelle (Antique Print). In Italia. Viaggio Pittoresco dall’Alpi all’Etna. 1885, Milano, Fratelli Treves Editori. Available online: https://www.ebay.it/itm/292675943399?mkevt=1&mkcid=1&mkrid=724-53478-19255-0&campid=5338722076&customid=&toolid=10050 (accessed on 25 November 2023).
- Quaglio, D.; Moore, G. Piazza delle Erbe—Verona, Litography, Londra. 1845. Available online: https://www.libreriaperini.com/it/verona/stampe-antiche/piazza-delle-erbe-verona/7094/dcm (accessed on 25 November 2023).
- Francois, C.J. Piazza Delle Erbe Verona 2—Belgian School—19th Century. Available online: https://www.alamy.it/carabain-jacques-francois-piazza-delle-erbe-verona-2-scuola-belga-19-secolo-image371716792.html (accessed on 25 November 2023).
- Ligozzi, P. Engraved by Valegio, F. Verona Citta Celeberima. 1620. Available online: https://www.raremaps.com/gallery/detail/33453/verona-citta-celeberima-ligozzi?q=0 (accessed on 25 November 2023).
- Lenotti, T. Piazza Erbe; Edizioni di Vita Veronese: Verona, Italy, 1954; pp. 50–51. [Google Scholar]
- 3DVisA Index of 3D Projects: Architectural and Urban Studies. Available online: https://3dvisa.cch.kcl.ac.uk/project6.html (accessed on 25 November 2023).
- Nicolucci, F.; Hermon, S. A fuzzy logic approach to reliability in archaeological virtual reconstruction. In Proceedings of the CAA 2004 Proceedings, Computer Applications & Quantitative Methods in Archaeology, Prato, Italy, 13–16 April 2004. [Google Scholar]
- Cazzaro, I. Digital 3D Reconstruction as a Research Environment in Art and Architecture History: Uncertainty Classification and Visualization. Ph.D. Thesis, Alma Mater Studiorum Università di Bologna, Bologna, Italy, 2023. [Google Scholar]
- Project Byzantium 1200, Case of Portus Theodosiacus. Available online: https://www.byzantium1200.com/port_t.html (accessed on 25 November 2023).
- Hackert-Oschätzchen, M.; Paul, R.; Kowalicka, M.; Kuhna, D.; Meichsnerb, G.; Zineckera, M.; Schuberta, A. Characterization of an Electrochemical Machining Process for Precise Internal Geometries by Multiphysics Simulation. Procedia CIRP 2017, 58, 175–180. [Google Scholar] [CrossRef]
- Tomassetti, B.; Lombardi, A.; Cerasani, E.; Di Sabatino, A.; Pace, L.; Ammazzalorso, D.; Verdecchia, M. Mapping of Alternaria and Pleospora concentrations in Central Italy using meteorological forecast and neural network estimator. Aerobiologia 2012, 29, 55–70. [Google Scholar] [CrossRef]
- Kensek, A. Survey of Methods for Showing Missing Data, Multiple Alternatives, and Uncertainty in Reconstructions. CSA Newsletter 2007, 19. Available online: https://csanet.org/newsletter/winter07/nlw0702.html (accessed on 25 November 2023).
- Stone, M. Choosing Colors for Data Visualization. 2006. Available online: https://www.semanticscholar.org/paper/Choosing-Colors-for-Data-Visualization-Stone/318e4fd97436e5d866d1dae5b89ce5a646e43484 (accessed on 25 November 2023).
- CIE Website. Available online: https://cie.co.at/ (accessed on 25 November 2023).
- The Difference between Chroma and Saturation, in Munsell Color Website. Available online: https://munsell.com/color-blog/difference-chroma-saturation/ (accessed on 25 November 2023).
- Werth, A. Web-Based Munsell Colour Wheel, in Andrew Werth’s Webpage. Available online: https://www.andrewwerth.com/aboutmunsell/ (accessed on 25 November 2023).
- Lafer-Sousa, R.; Hermann, K.L.; Conway, B.R. Striking individual differences in color perception uncovered by ‘the dress’ photograph. Curr. Biol. 2015, 25, R545–R546. [Google Scholar] [CrossRef] [PubMed]
- Rabin, J.; Houser, B.; Talbert, C.; Patel, R. Blue-black or white-gold? Early stage processing and the color of the dress. PLoS ONE 2016, 11, e0161090. [Google Scholar] [CrossRef] [PubMed]
- Adelson, E.H. Checkershadow Illusion. 1995. Available online: http://persci.mit.edu/gallery/checkershadow (accessed on 25 November 2023).
- Briggs, D. The Dimensions of Colour: Saturation. Available online: http://www.huevaluechroma.com/017.php (accessed on 25 November 2023).
- Apollonio, F.I. Classification schemes for visualization of uncertainty in digital hypothetical reconstruction. In 3D Research Challenges in Cultural Heritage II: How to Manage Data and Knowledge Related to Interpretative Digital 3D Reconstructions of Cultural Heritage; Springer International Publishing: Berlin/Heidelberg, Germany, 2016; pp. 173–197. [Google Scholar]
- Gröger, G.; Kolbe, T.H.; Czerwinski, A.; Nagel, C. (Eds.) OpenGIS® City Geography Markup Language (CityGML), Encoding Standard; OGC 07-023r2; Version 0.9; Open Geospatial Consortium Inc.: Wayland, MA, USA, 2008; Available online: https://repository.oceanbestpractices.org/handle/11329/1109 (accessed on 25 November 2023).
- Biljecki, F.; Ledoux, H.; Stoter, J. An improved LOD specification for 3D building models. Comput. Environ. Urban Syst. 2016, 59, 25–37. [Google Scholar] [CrossRef]
- Abualdenien, J.; Borrmann, A. Levels of detail, development, definition, and information need: A critical literature review. J. Inf. Technol. Constr. 2022, 27, 363–392. [Google Scholar] [CrossRef]
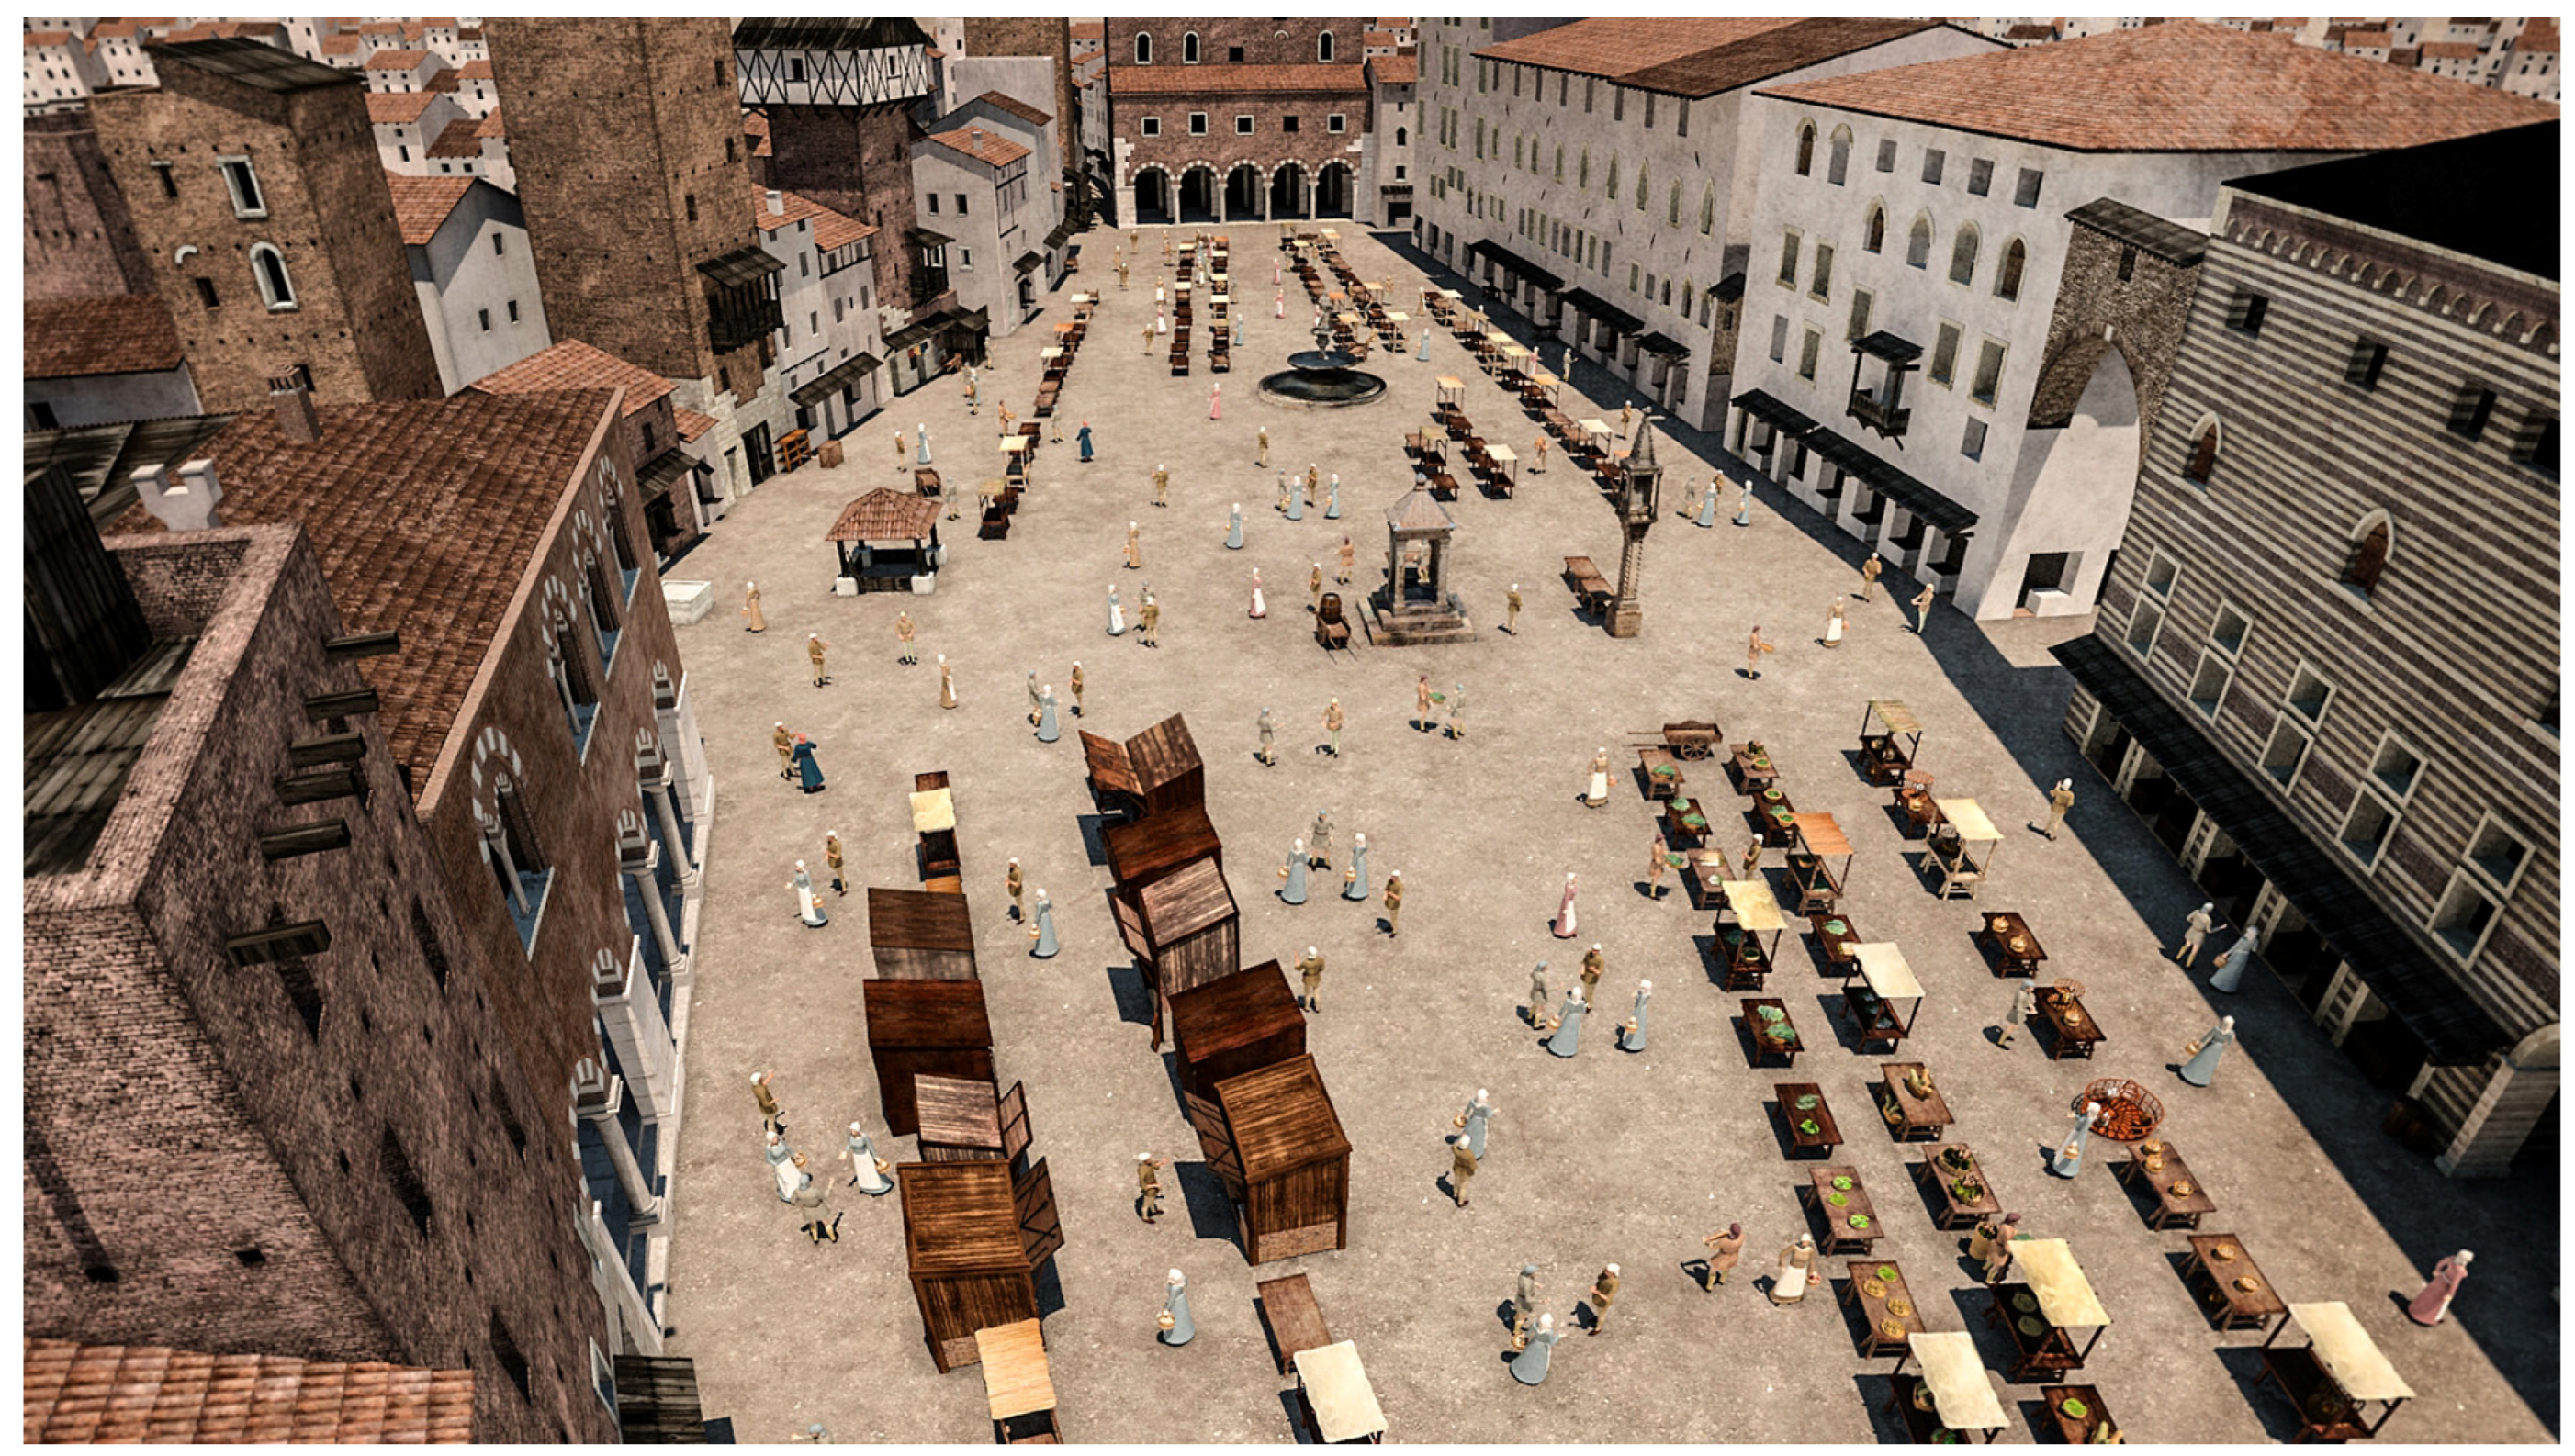
Figure 1.
Bird’s eye view of the finished, textured, and populated scene.
Figure 1.
Bird’s eye view of the finished, textured, and populated scene.
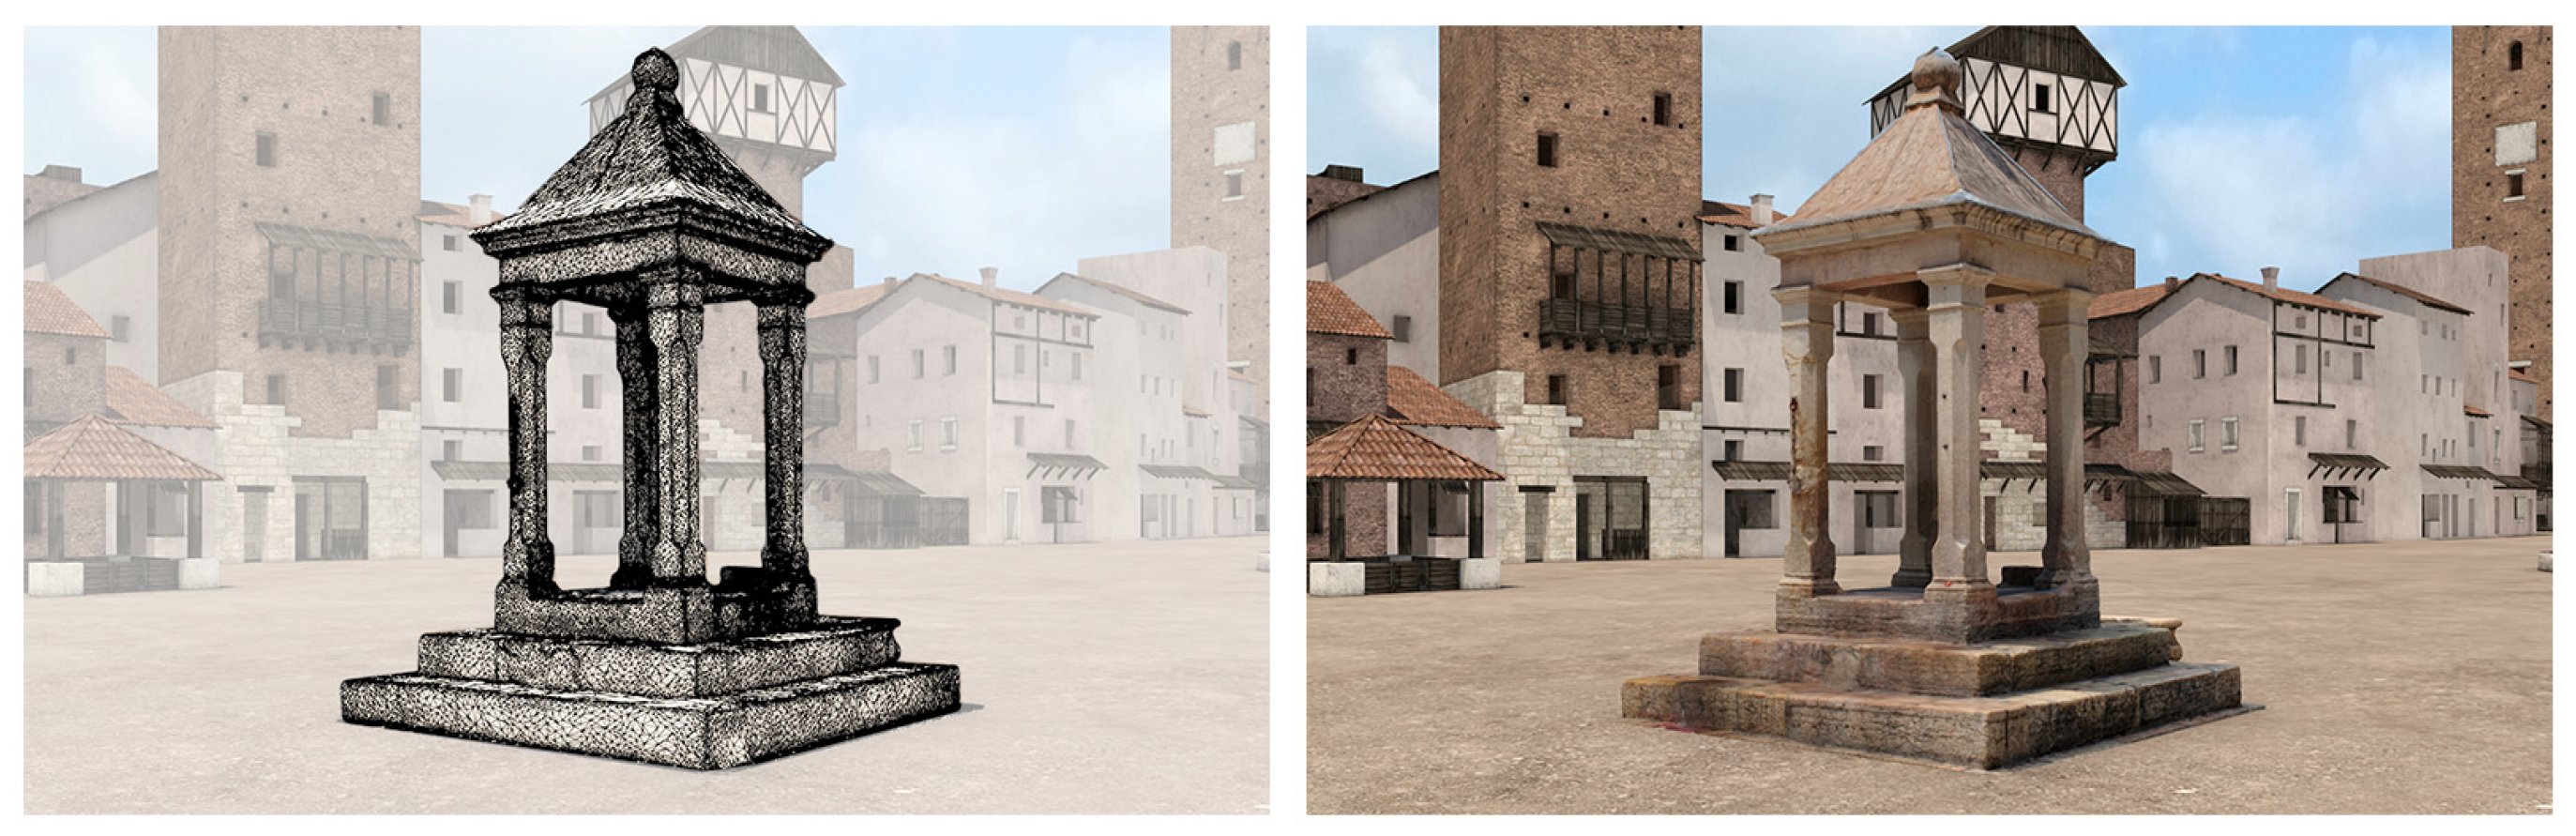
Figure 3.
The reality-based model of the
Capitello of
Piazza delle Erbe, which still exists today in a good state of preservation. A variation of this image was published in [
14].
Figure 3.
The reality-based model of the
Capitello of
Piazza delle Erbe, which still exists today in a good state of preservation. A variation of this image was published in [
14].
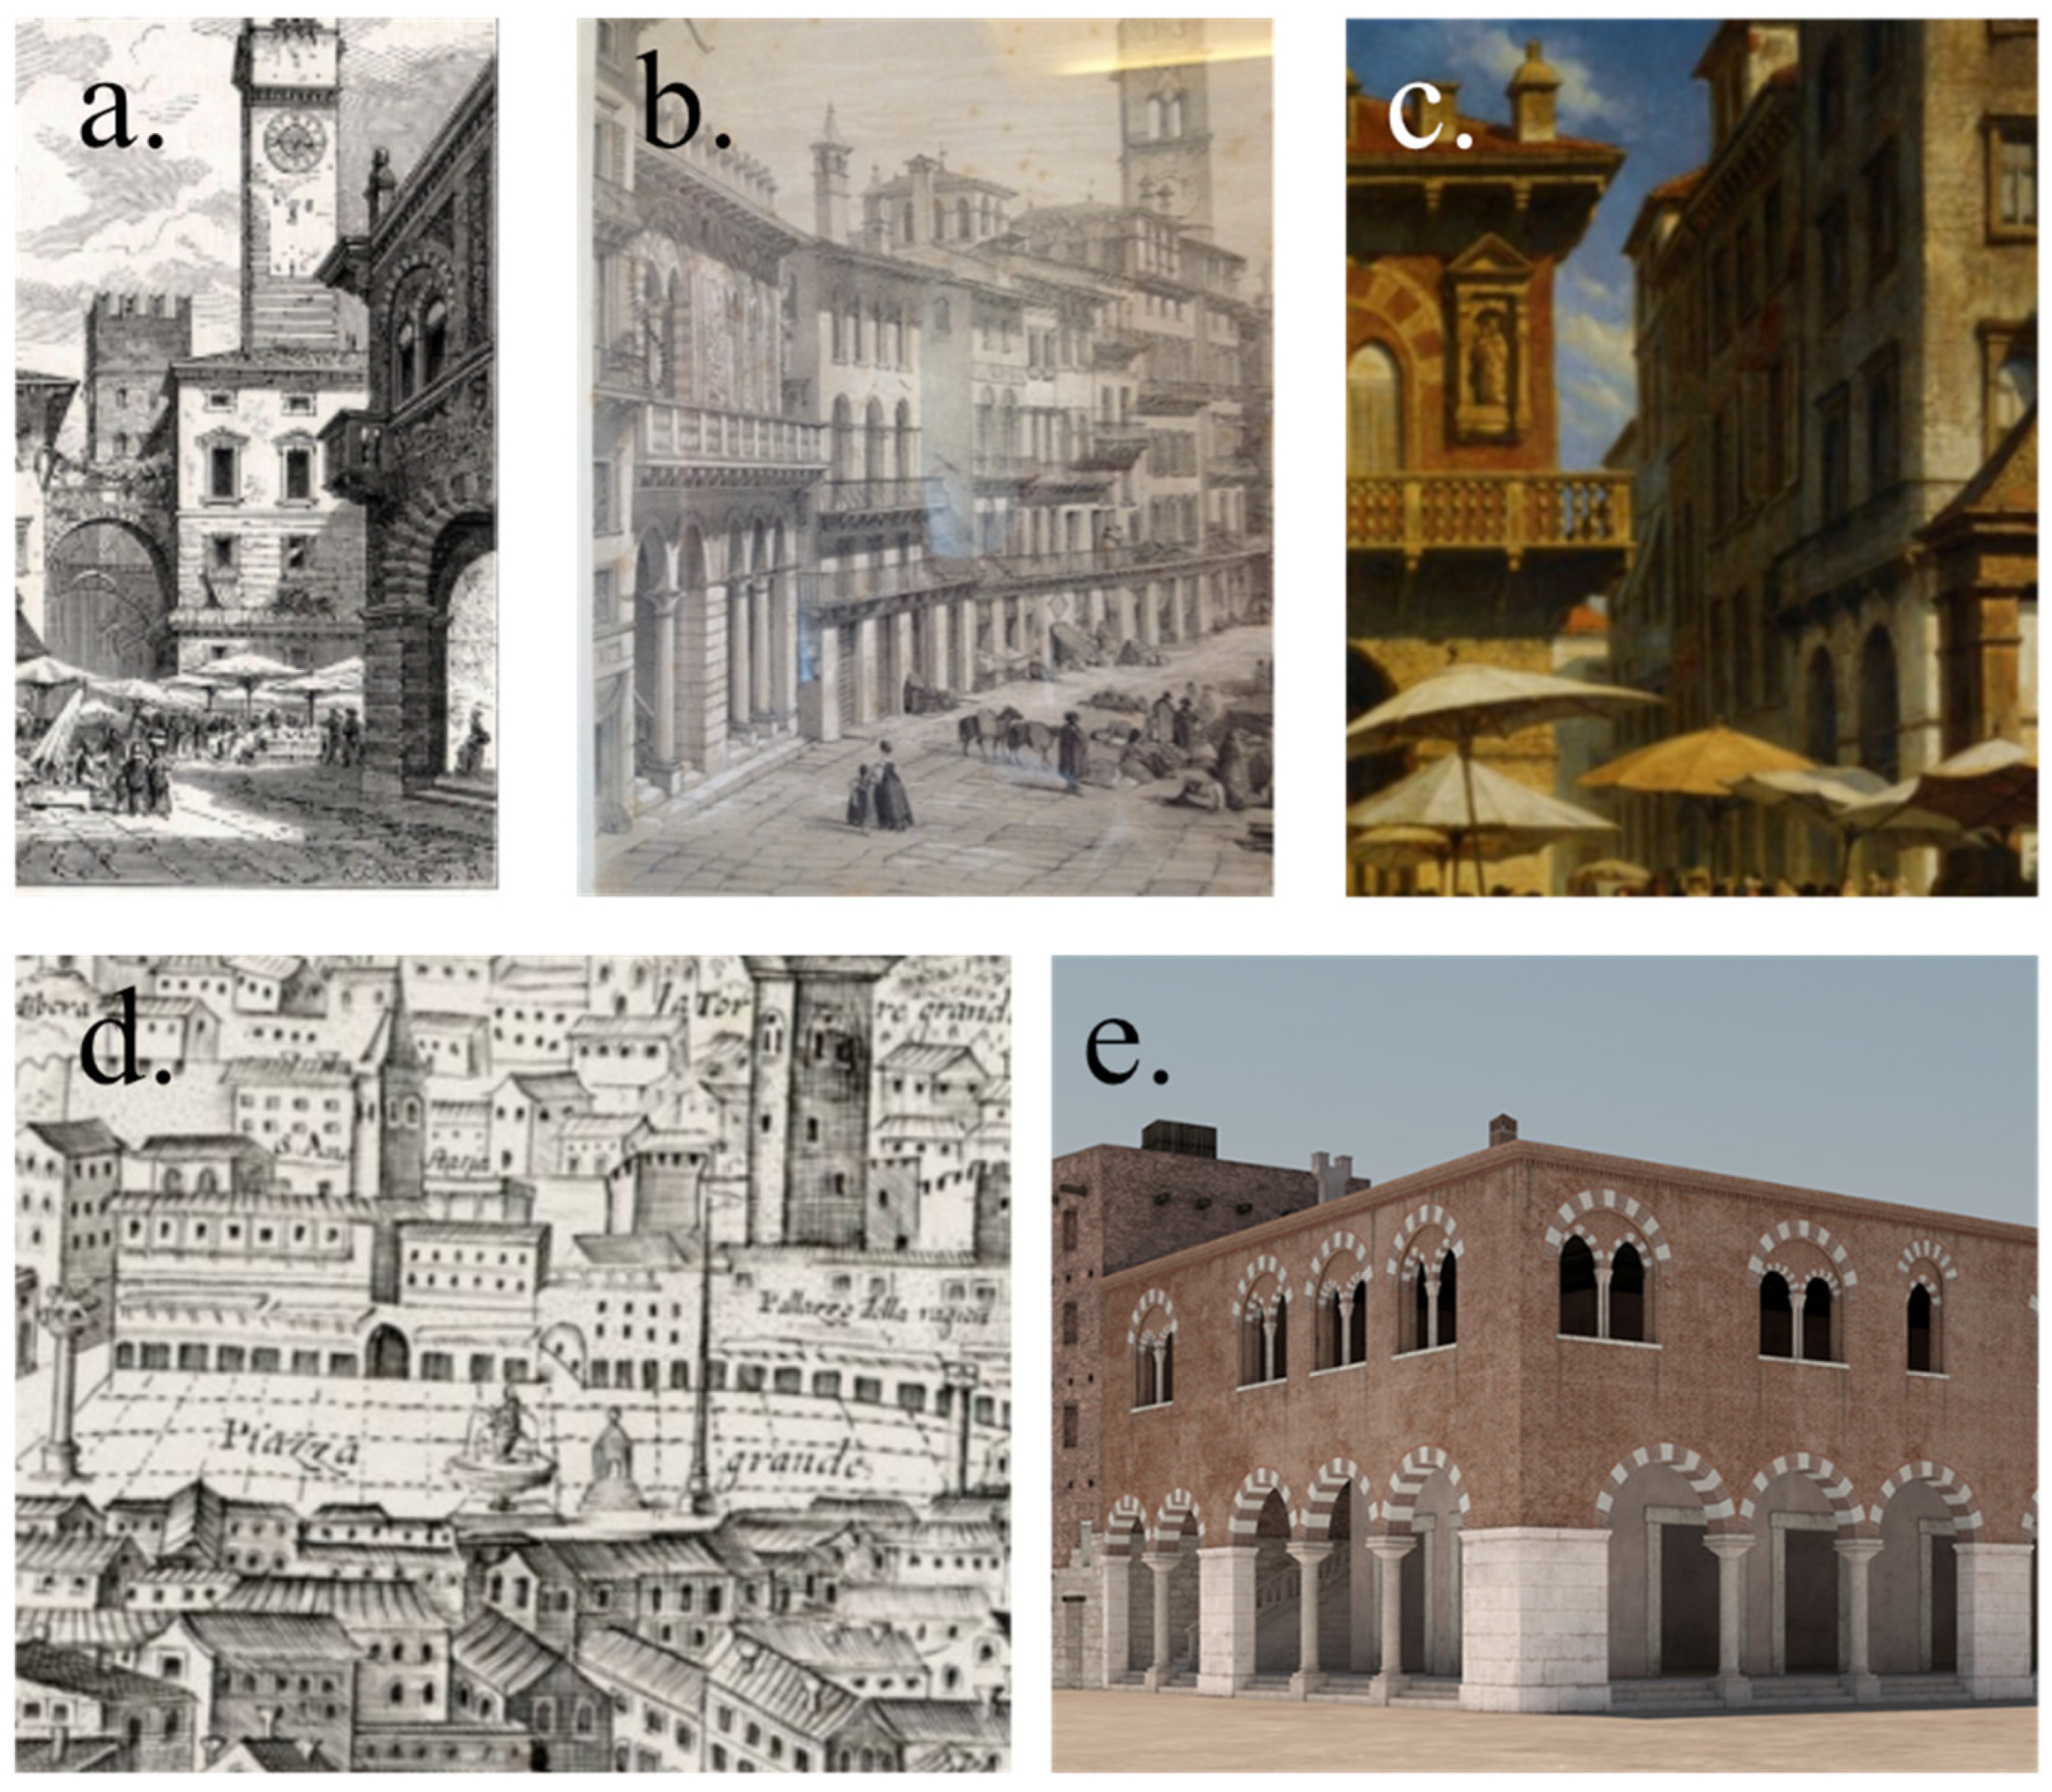
Figure 4.
(
a) Ancient print of
Piazza delle Erbe with stalls by G. Bauernfeind, 1885 [
16]; (
b) lithography of
Piazza delle Erbe in Verona by D. Quaglio and G. Moore, Londra, 1845 [
17]; (
c) painting of
Piazza delle Erbe Verona 2 by Carabain Jacques Francois, Belgian School, 19th century [
18]; (
d) Verona Citta Celeberima by P. Ligozzi, 1620 [
19]; (
e) 3D textured model of Mercanzia residence built from various historical sources. All the available graphical sources depict a later configuration of the building, in fact, the battlements on the roof and the balcony were not modelled because they were added after the reference period.
Figure 5.
Casa Fratelli Vanini, reconstructed from textual sources [
20] cross-referenced with planimetric information from the available historical cadastral maps.
Figure 5.
Casa Fratelli Vanini, reconstructed from textual sources [
20] cross-referenced with planimetric information from the available historical cadastral maps.
Figure 6.
Differences between chroma and saturation and between value (or brightness) and lightness in HSL and HSV/B models.
Figure 6.
Differences between chroma and saturation and between value (or brightness) and lightness in HSL and HSV/B models.
Figure 7.
Yes/no flow chart that aids the use of the updated scale of uncertainty.
Figure 7.
Yes/no flow chart that aids the use of the updated scale of uncertainty.
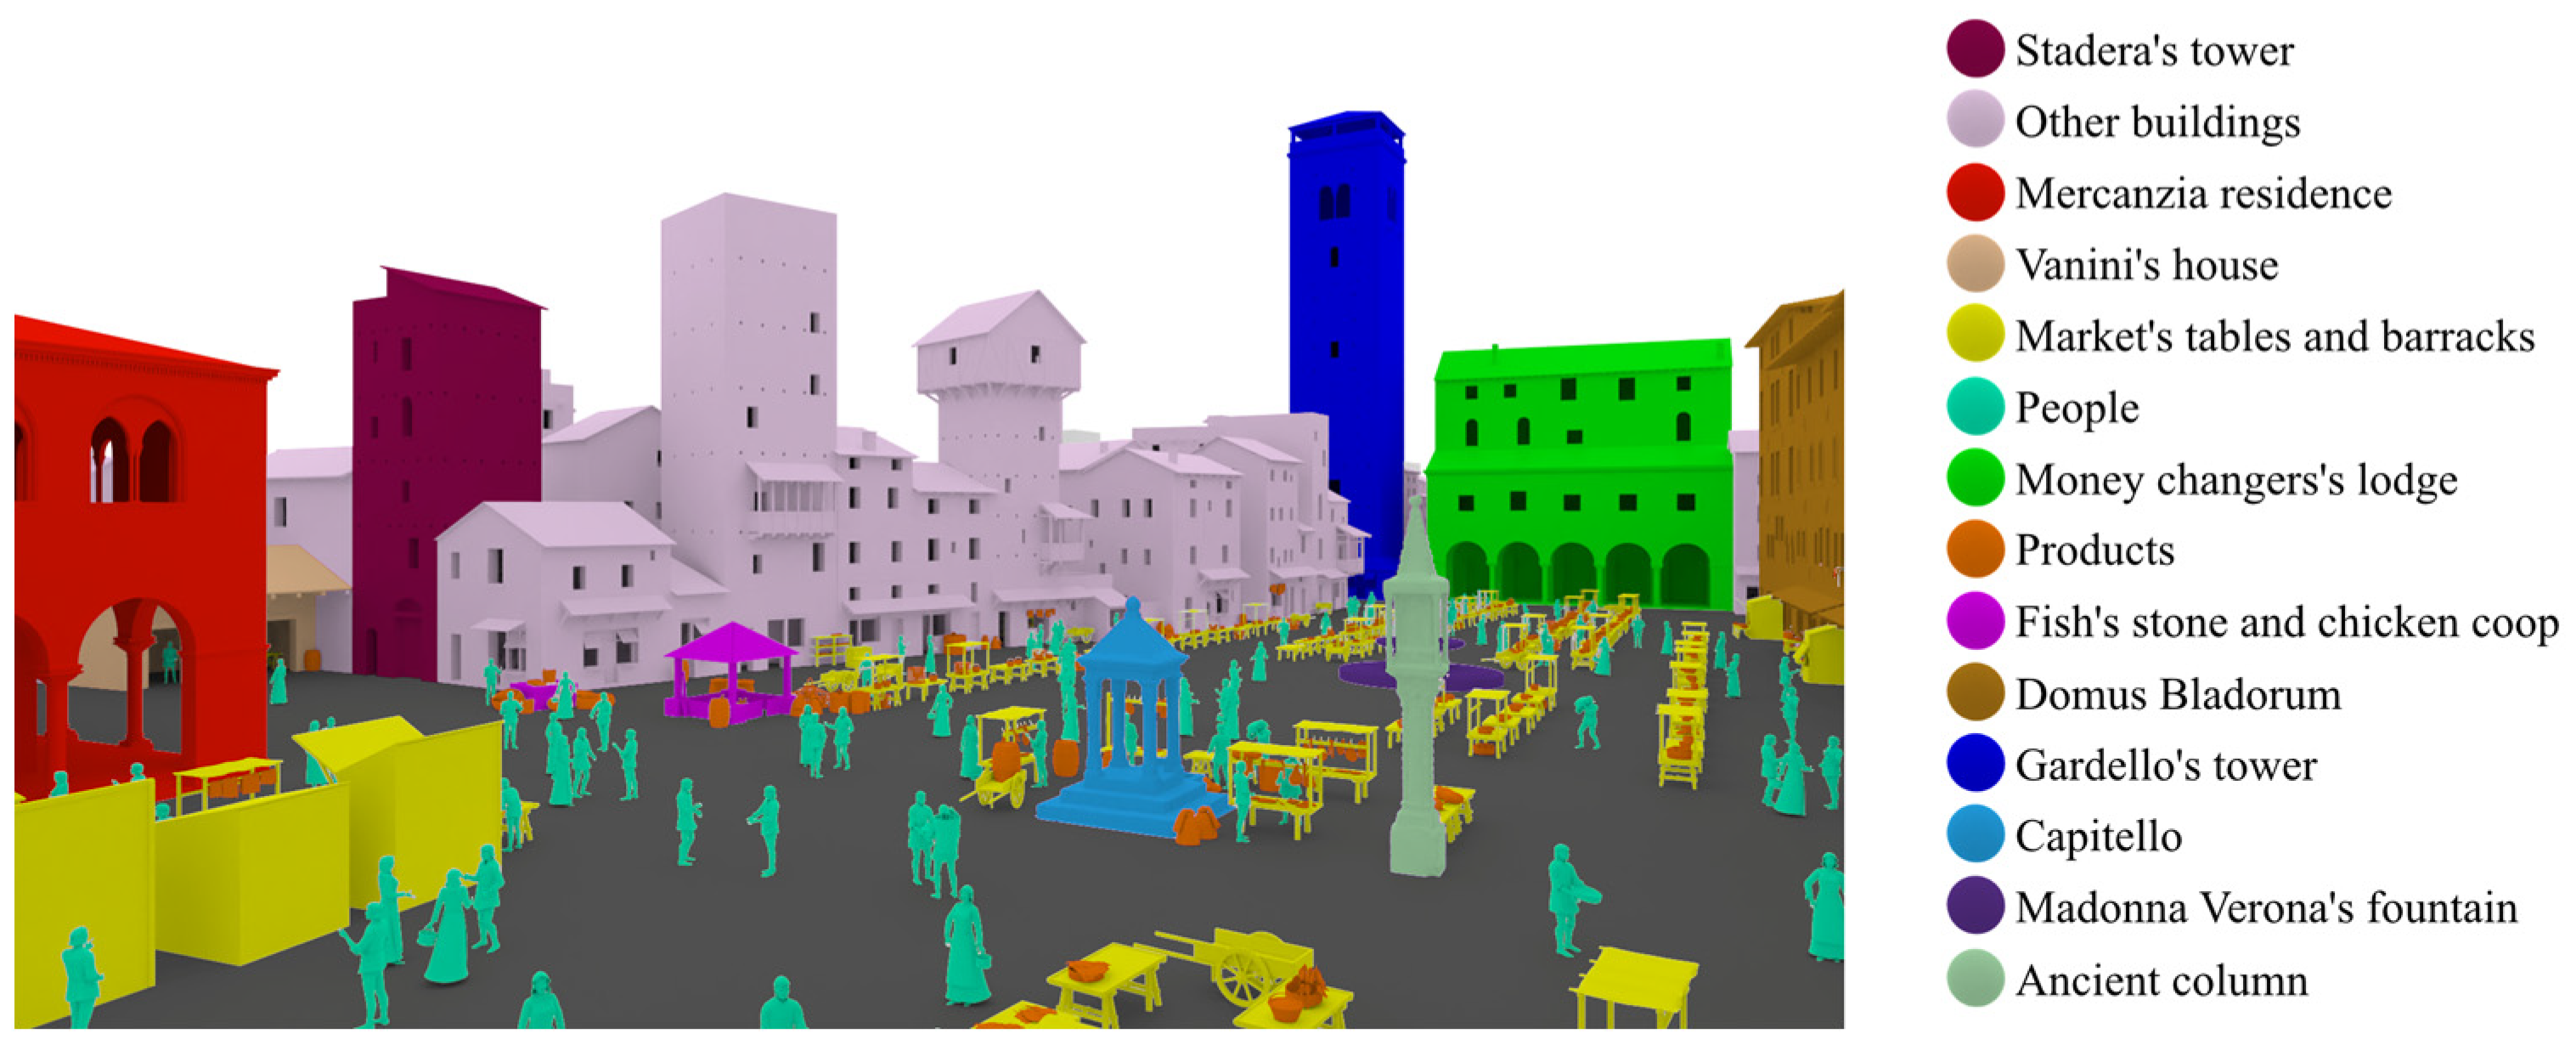
Figure 8.
Subdivision of the 3D model of Piazza delle Erbe into families of analogous elements. At this stage, the colours of the scale of uncertainty had not been assigned yet, and random colours were assigned only to differentiate the various elements.
Figure 8.
Subdivision of the 3D model of Piazza delle Erbe into families of analogous elements. At this stage, the colours of the scale of uncertainty had not been assigned yet, and random colours were assigned only to differentiate the various elements.
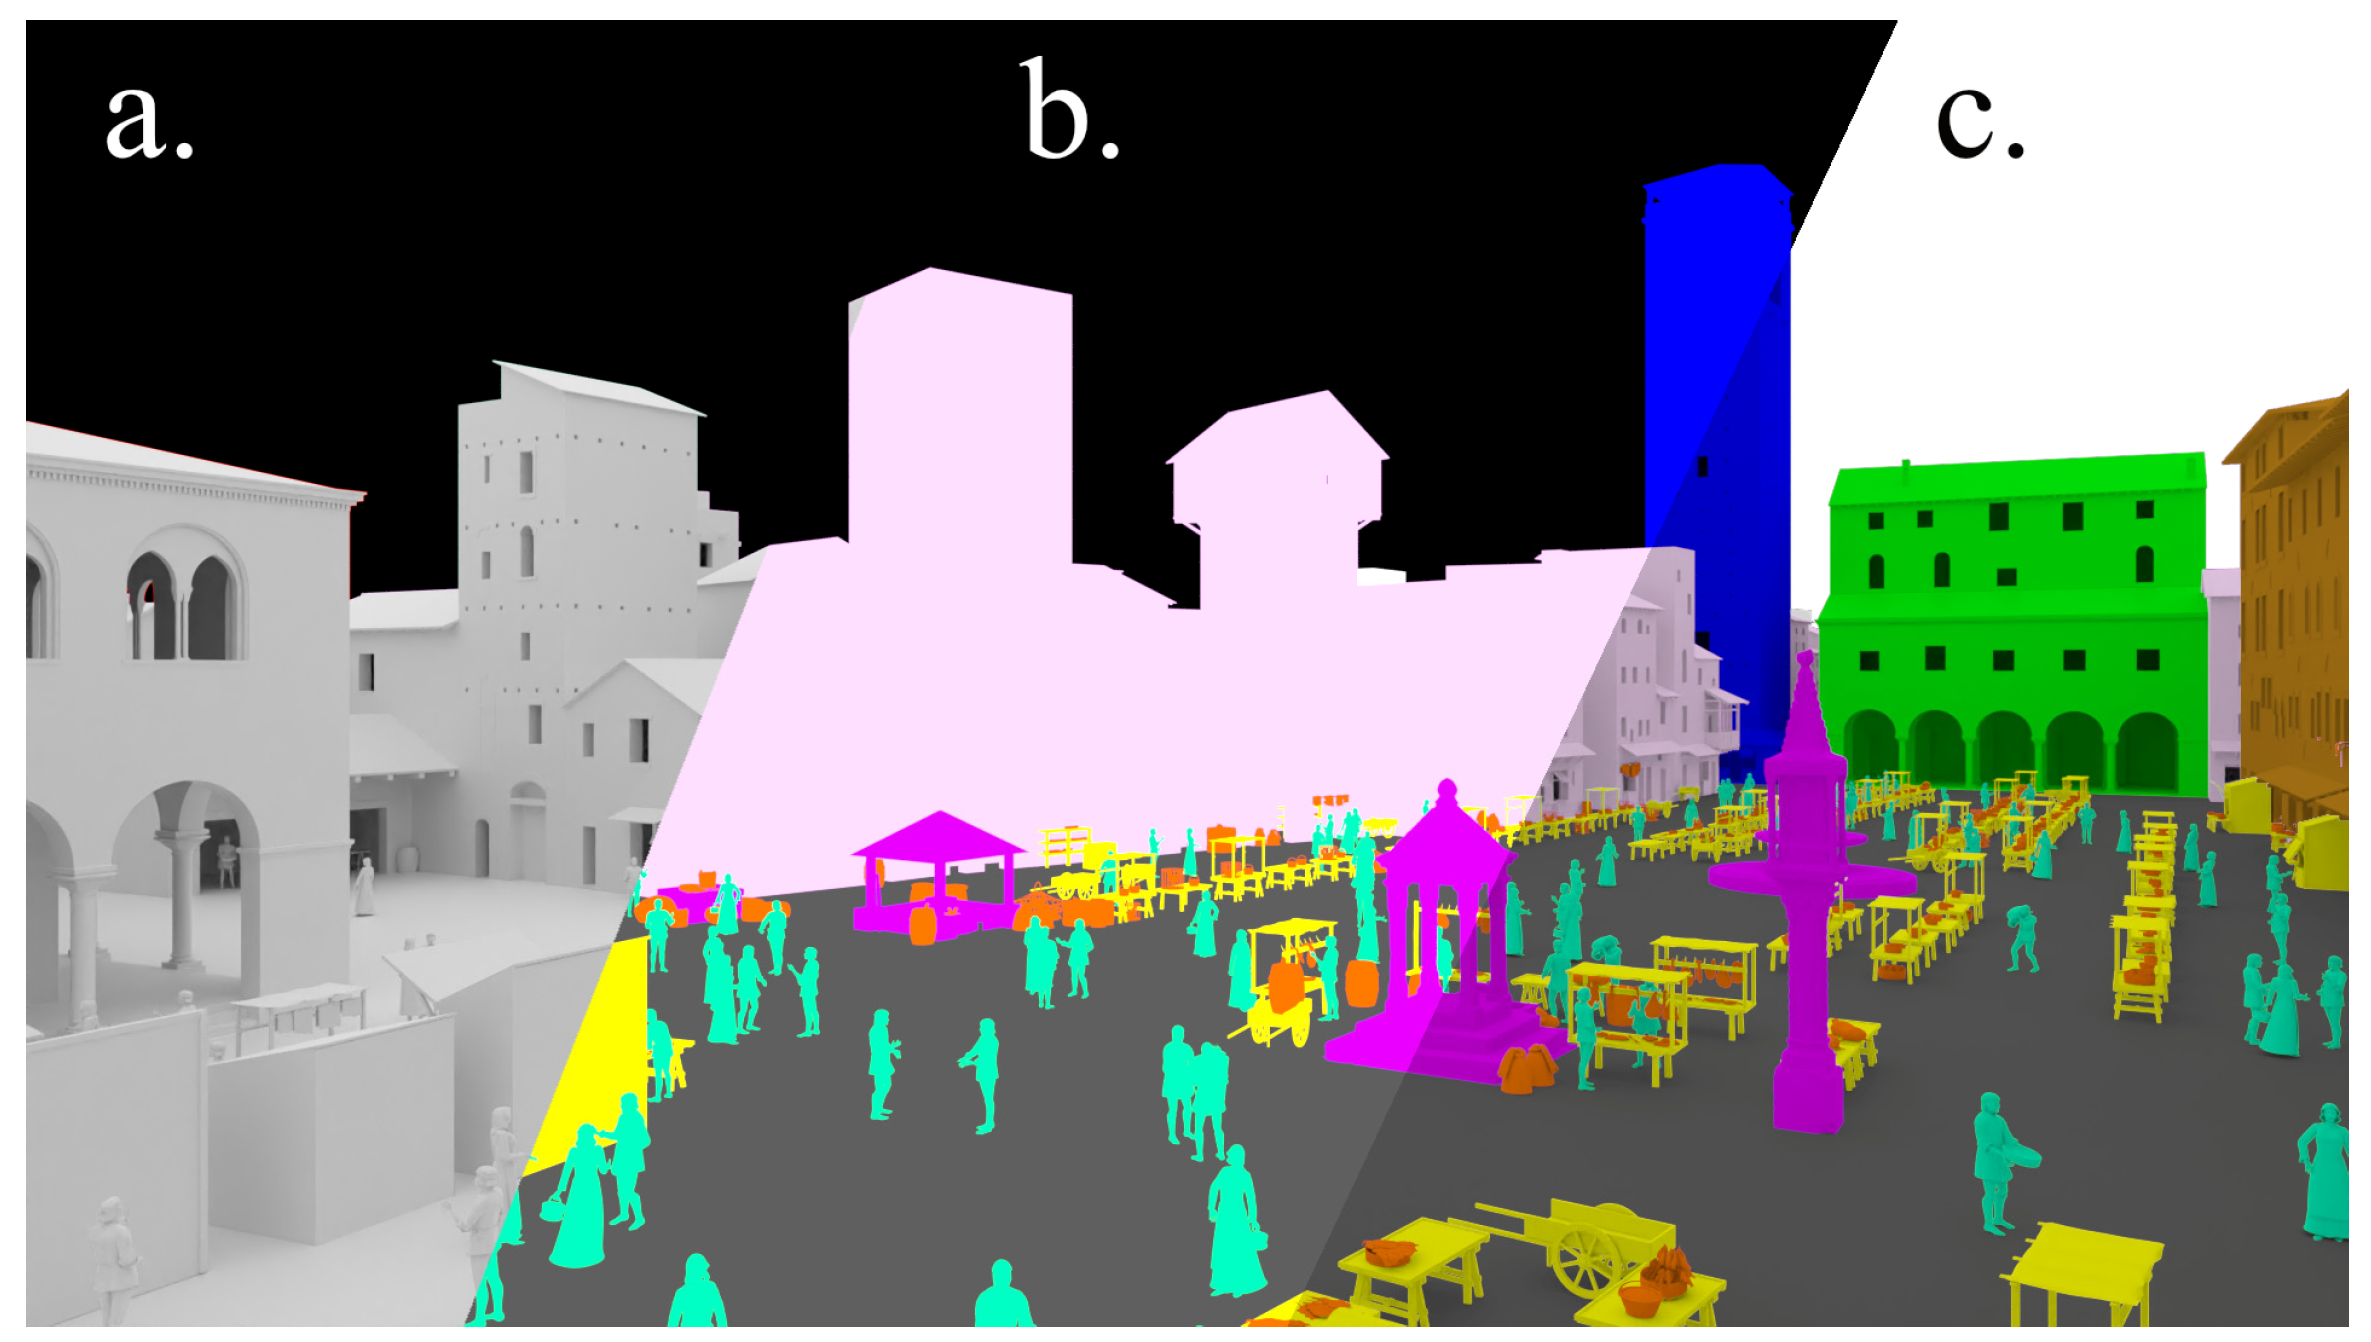
Figure 9.
Process of colourisation of the renderings: (a) override white mono-material shaded pass, (b) matte colours pass, (c) composition of the two passes with a multiply blending mode.
Figure 9.
Process of colourisation of the renderings: (a) override white mono-material shaded pass, (b) matte colours pass, (c) composition of the two passes with a multiply blending mode.
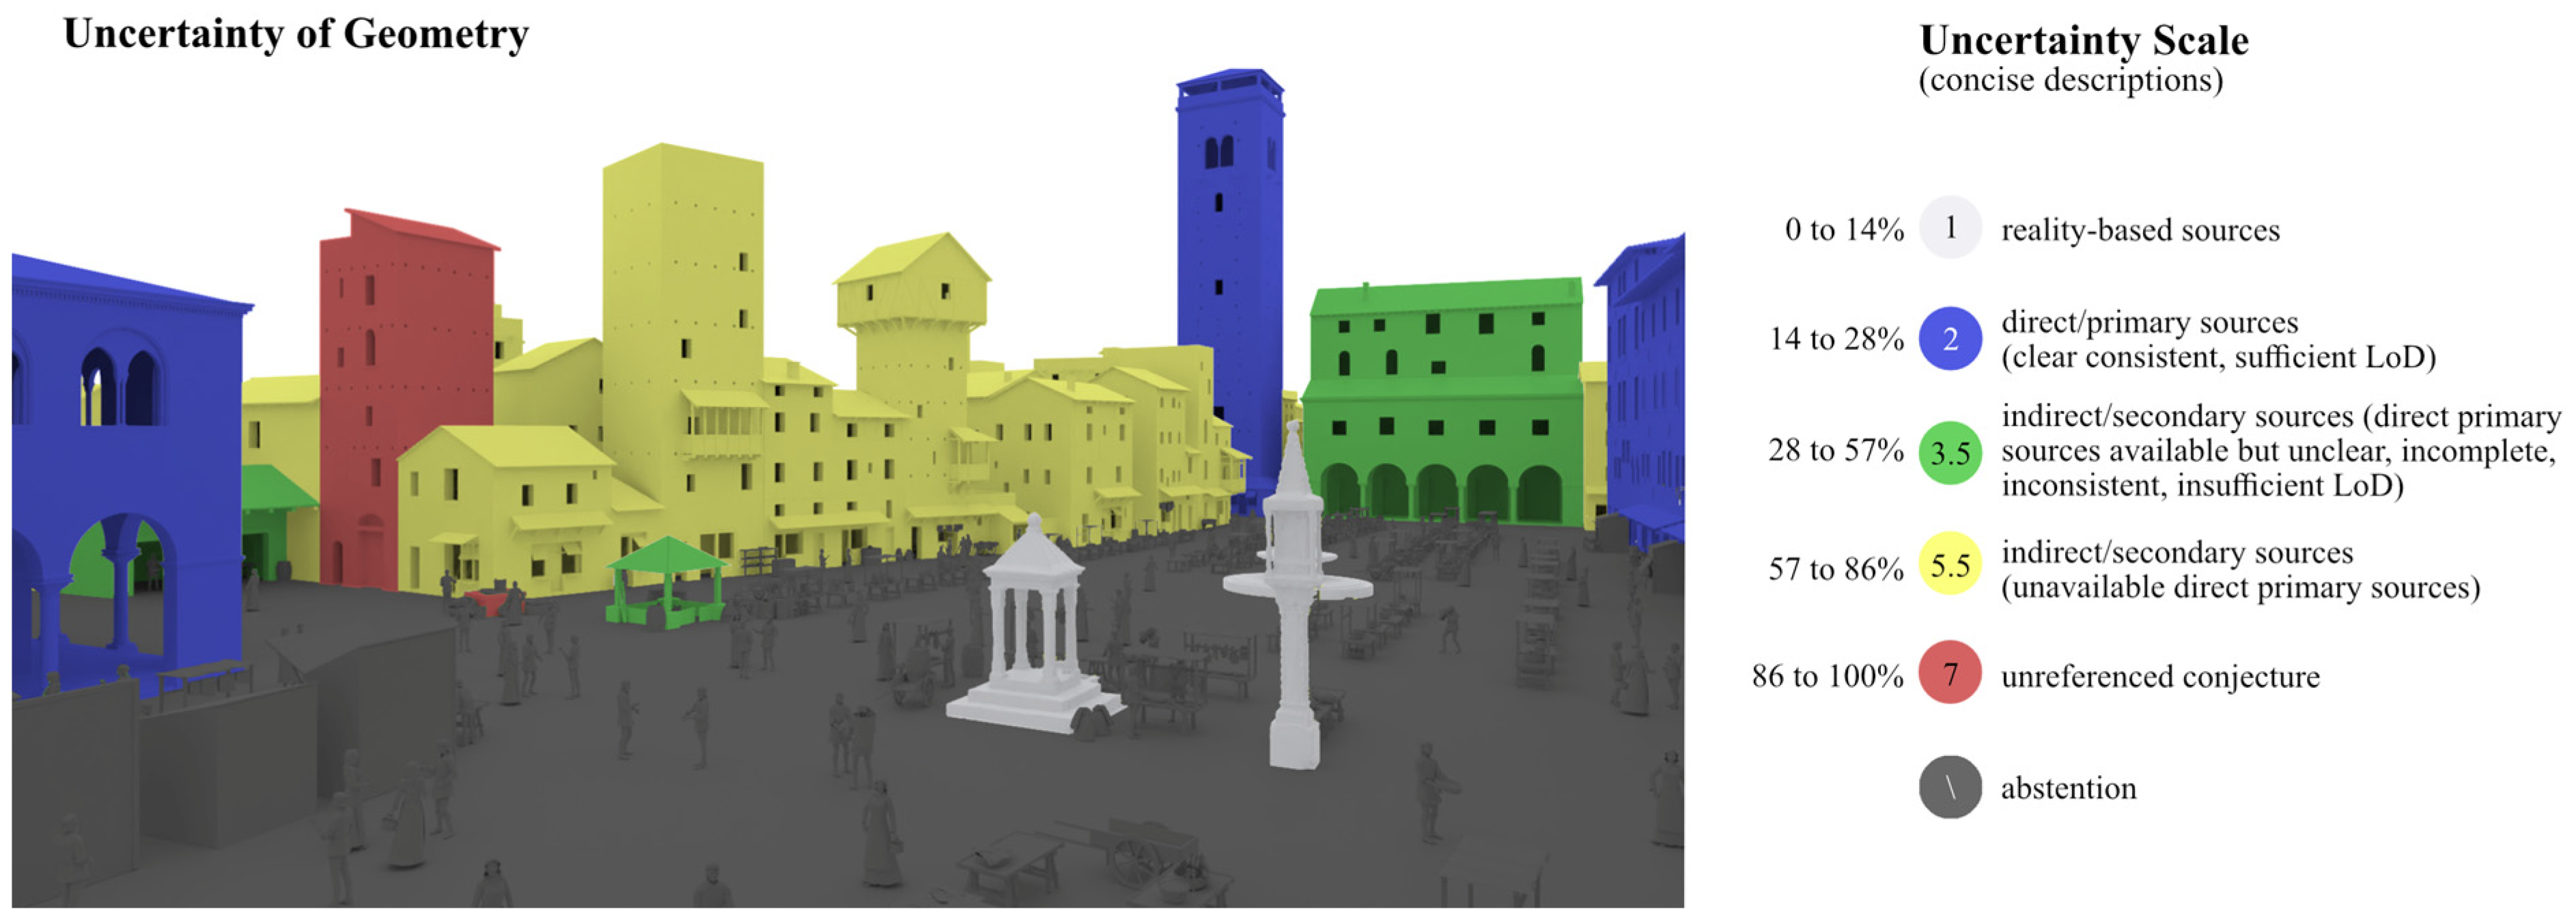
Figure 10.
False-colour view of the uncertainty of the geometry of
Piazza delle Erbe (the false-colour scale refers to
Table 5).
Figure 10.
False-colour view of the uncertainty of the geometry of
Piazza delle Erbe (the false-colour scale refers to
Table 5).
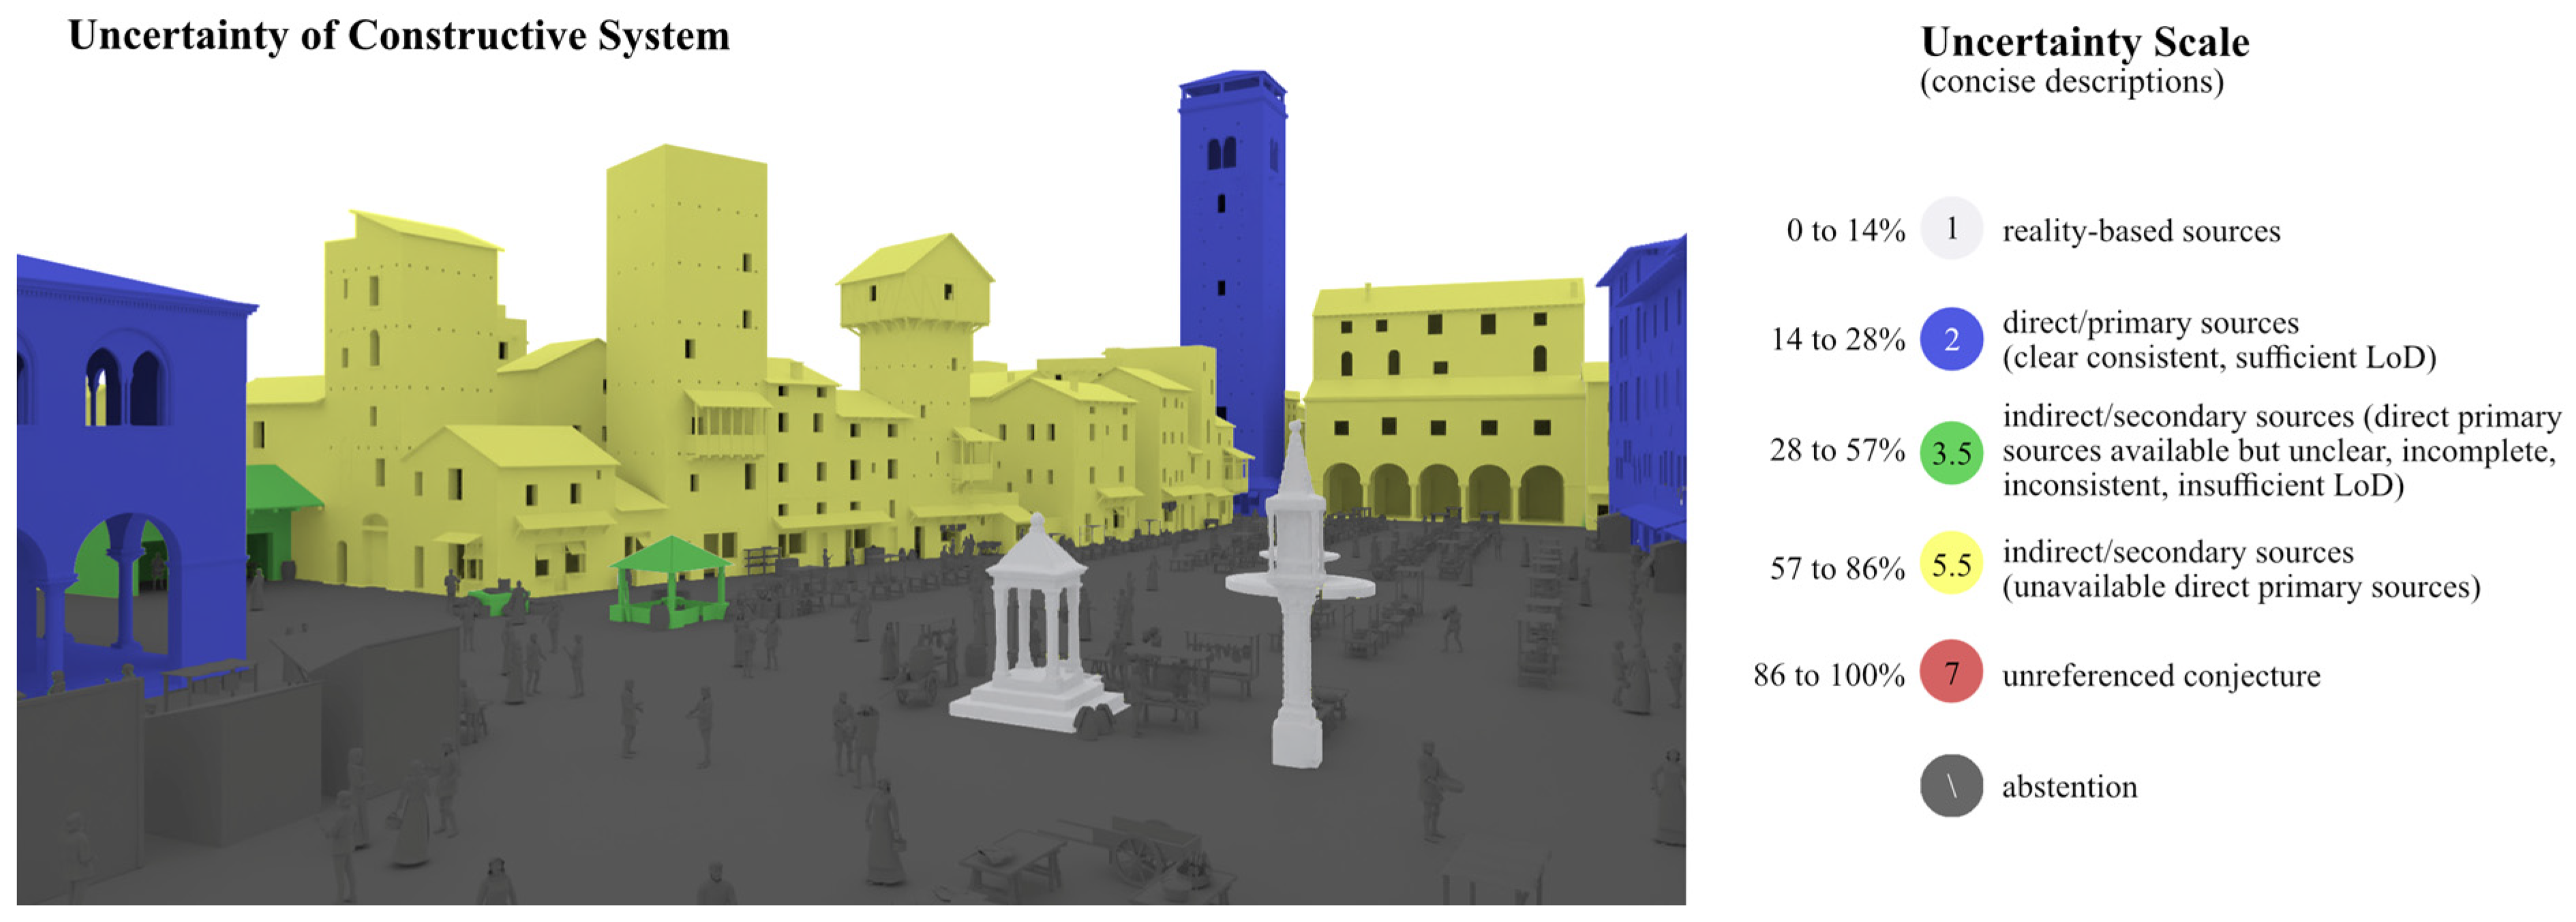
Figure 11.
False-colour view of the uncertainty of the constructive system of
Piazza delle Erbe (the false-colour scale refers to
Table 5).
Figure 11.
False-colour view of the uncertainty of the constructive system of
Piazza delle Erbe (the false-colour scale refers to
Table 5).
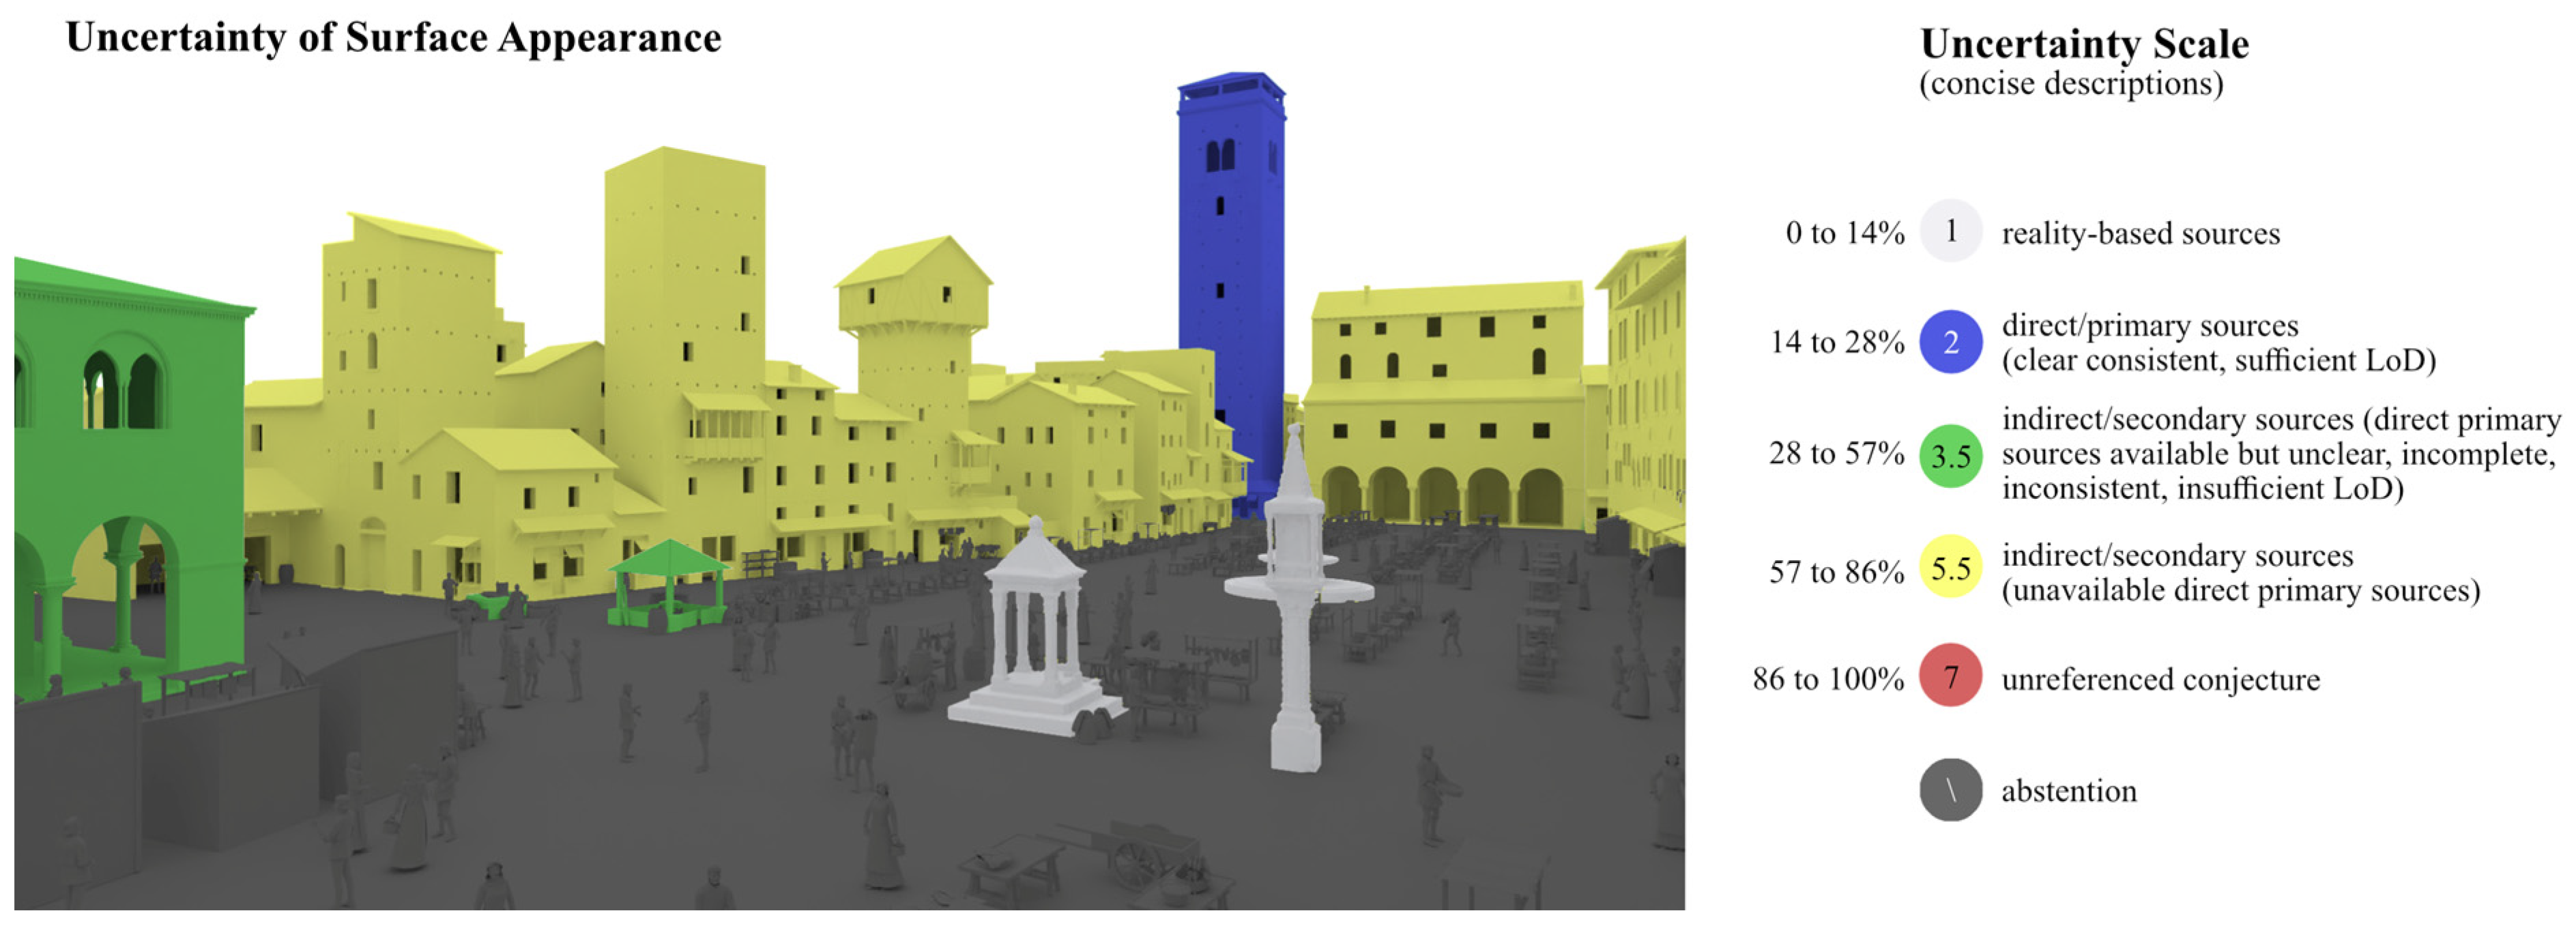
Figure 12.
False-colour view of the uncertainty of the surface appearance of
Piazza delle Erbe (the false-colour scale refers to
Table 5).
Figure 12.
False-colour view of the uncertainty of the surface appearance of
Piazza delle Erbe (the false-colour scale refers to
Table 5).
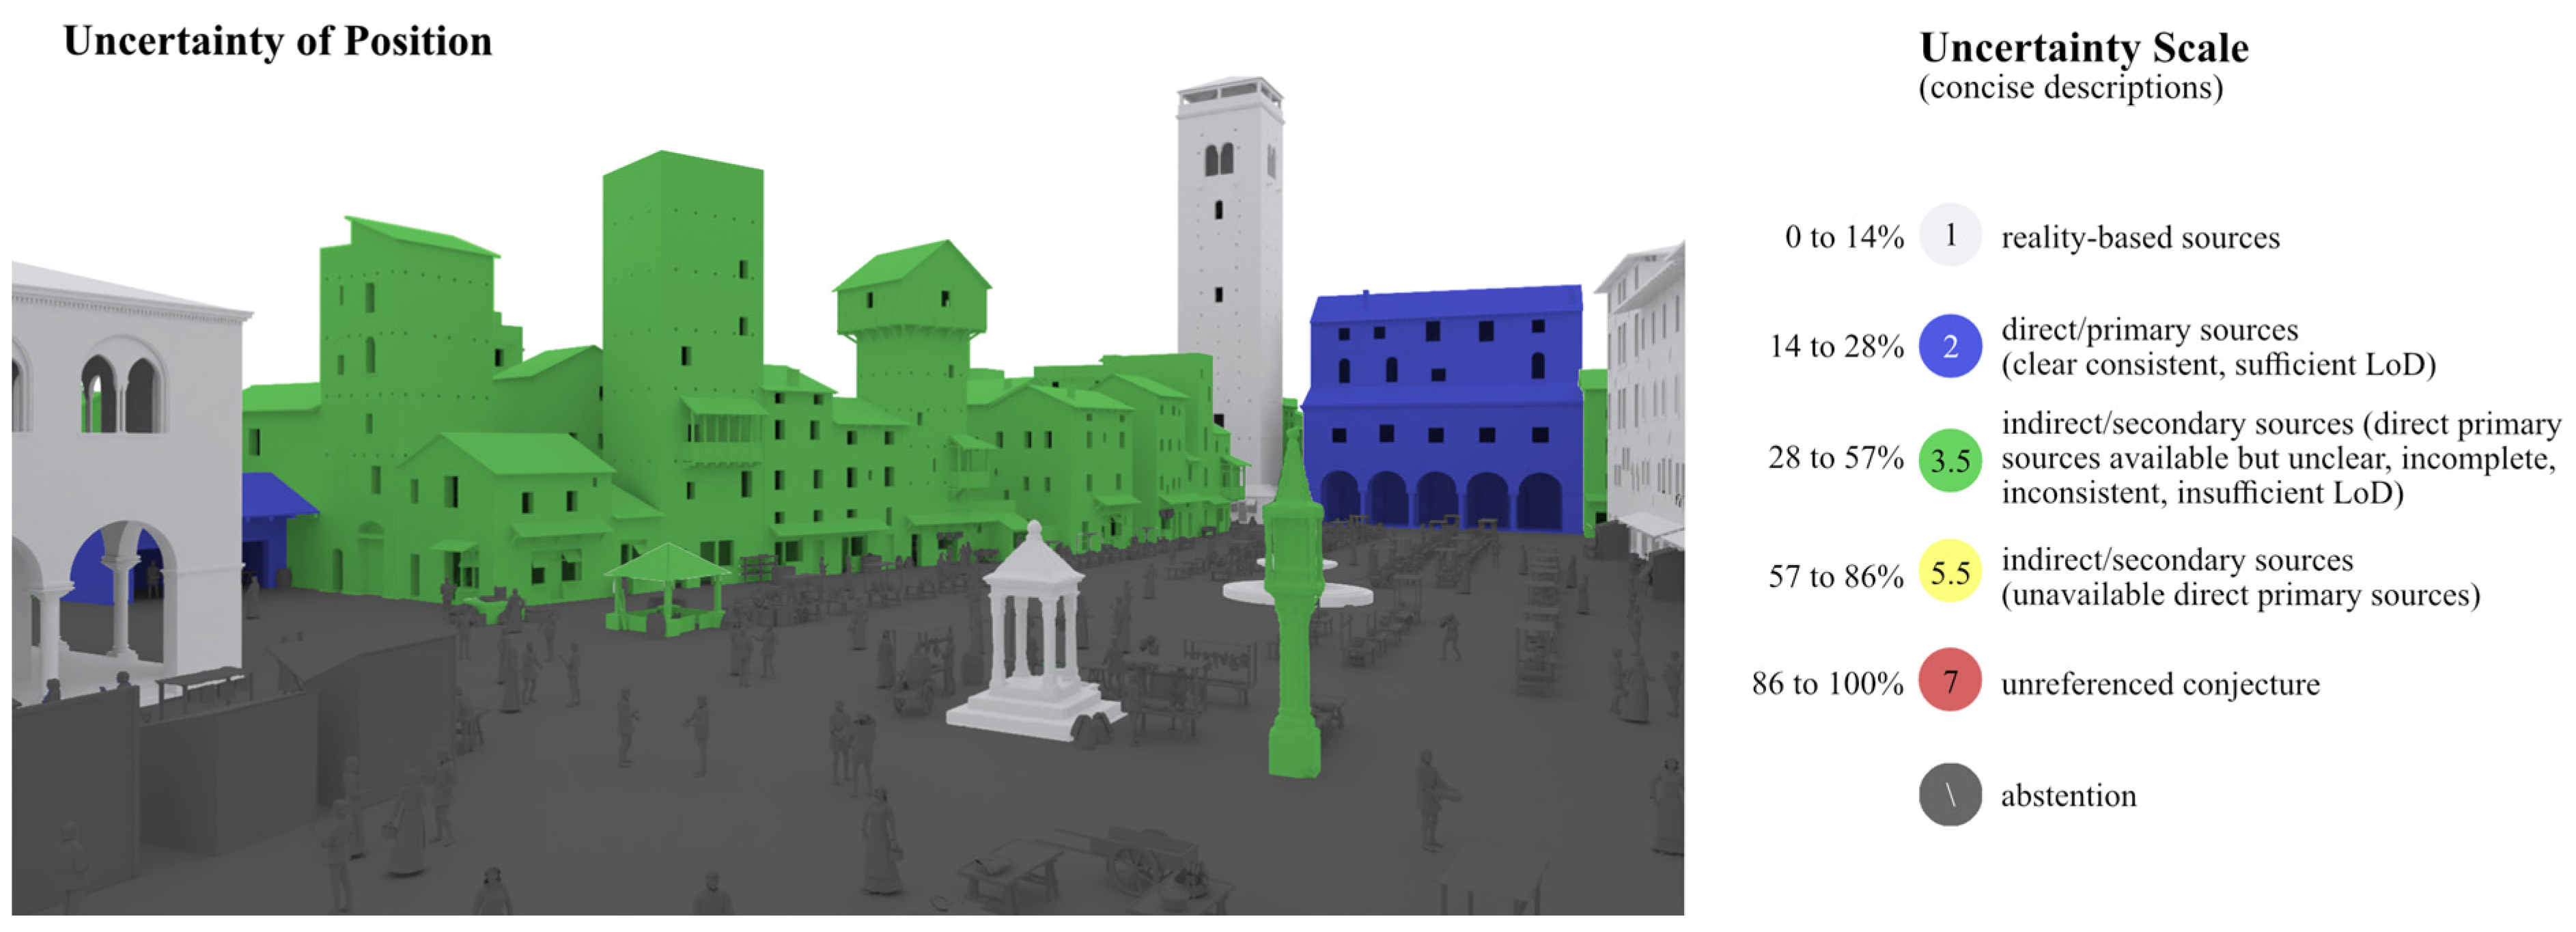
Figure 13.
False-colour view of the uncertainty of the position of
Piazza delle Erbe (the false-colour scale refers to
Table 5).
Figure 13.
False-colour view of the uncertainty of the position of
Piazza delle Erbe (the false-colour scale refers to
Table 5).
Figure 14.
False-colour view of the range of uncertainty for each building of
Piazza delle Erbe. The buildings coloured with striped patterns are those buildings where the individual features (geometry, constructive system, surface appearance, and position) have different uncertainties (the false-colour scale refers to
Table 5).
Table 1.
CityGML scale of the geometric level of detail [
37].
Table 1.
CityGML scale of the geometric level of detail [
37].
| CityGML LoD Levels | Description |
|---|
| LoD 0 | Only the 2D footprint (or projection of roofs) of the buildings is available, useful for regional landscapes |
| LoD 1 | 3D coarse prismatic models, usually obtained by extruding LoD0 data along the Z axis (e.g., known number of floors, heights), useful for cities and regions |
| LoD 2 | 3D simple models that approximate roof shapes, useful for city districts |
| LoD 3 | 3D refined models with architecturally detailed outdoor aspects (with doors, chimneys, windows, etc.), useful for landmarks |
| LoD 4 | 3D refined models that also present indoor features, useful for architectonic scale |
Table 2.
Scale of the level of detail for the surface appearance.
Table 2.
Scale of the level of detail for the surface appearance.
| LoD for Surface Appearance | Description |
|---|
| LoD 0 | The surface appearance is not defined, and only a flat generic base colour (e.g., flat grey, white, brown, etc.) is applied without defining details at any scale |
| LoD 1 | The surface appearance is drafted up to large-scale details (overall colours of the various parts, arrangement and layouts of patterns and constructive elements at surface level, no small-scale details) |
| LoD 2 | The surface appearance is defined up to small-scale details (bumps, crevices, dirt particles, roughness, etc.) |
Table 3.
Scale of the level of detail for the constructive system.
Table 3.
Scale of the level of detail for the constructive system.
| LoD of Constructive System | Description |
|---|
| LoD 0 | The constructive system is not defined. |
| LoD 1 | Only the general type of constructive system is defined (e.g., wooden beams and pillars with brick infill, load-bearing concrete walls, brick masonry walls, etc.). |
| LoD 2 | The constructive system is defined in detail (e.g., stratigraphy, type, materials, variety, arrangement of the blocks/elements/bricks, etc.). |
Table 4.
The updated scale of uncertainty with 7 (+1) levels. It can be used for any of the features of the 3D reconstructive model (geometry, constructive system, surface appearance, position), and it introduces the concept of LoD. It is closely related to the older scale in order to guarantee backward compatibility and comparability of the results.
| Colour Code | Uncertainty | Description |
|---|
| 1 | Lowest uncertainty
(~0 to 14% uncertain 1) | The analysed feature 2 of the 3D model is derived mainly from good-quality, REALITY-BASED DATA which reach the target LoD 3
(e.g., the walls of the ground floor were reconstructed based on the laser-scanned point cloud of the archaeological site). |
| 2 | Low uncertainty
(~14 to 28% uncertain) | Reliable conjecture based mainly on clear and accurate DIRECT 4/PRIMARY 5 SOURCES which reach the target LoD.
When REALITY-BASED DATA are unavailable, available but unusable, or not reaching the target LoD
(e.g., the column is reconstructed based on executive drawings in a good state of preservation drawn on a scale of 1:100, which provides a LoD compatible with the target LoD chosen for the reconstruction). |
| 3 | Average-to-low
uncertainty
(~28 to 43% uncertain) | Conjecture based mainly on INDIRECT/SECONDARY SOURCES, by the SAME AUTHOR/S, which reach the target LoD, or logic deduction/selection of variants.
When DIRECT/PRIMARY SOURCES ARE AVAILABLE, but minimally unclear, damaged, inconsistent, inaccurate, or not reaching the target LoD
(e.g., the size and shape of a window are not clear because the drawing is ruined/deformed in that area, so it is deduced from a similar window drawn in a better-preserved part of the drawing). |
| 4 | Average uncertainty
(~43 to 57% uncertain) | Conjecture based mainly on INDIRECT/SECONDARY sources by DIFFERENT AUTHOR/S (or unknown authors) which reach the target LoD.
When DIRECT/PRIMARY SOURCES ARE AVAILABLE, but minimally unclear, damaged, inconsistent, inaccurate, or not reaching the target LoD
(e.g., direct sources of the building are drawn at a scale of 1:200, so the Doric capitals are not drawn with a sufficient LoD compared to the target LoD chosen for the reconstruction; hence, the sources are integrated with the drawings of the Doric order retrieved from a treaty written by a coeval author). |
| 5 | Average-to-high
uncertainty
(~57 to 71% uncertain) | Conjecture based mainly on INDIRECT/SECONDARY SOURCES by the SAME AUTHOR/S which reach the target LoD.
When DIRECT/PRIMARY SOURCES ARE NOT AVAILABLE or unusable
(e.g., there are no direct sources on the type of vault designed for that particular room of the building, so it is conjectured based on another similar coeval project of the same author). |
| 6 | High uncertainty
(~71 to 86% uncertain) | Conjecture based mainly on INDIRECT/SECONDARY sources by DIFFERENT AUTHOR/S (or unknown authors) which reach the target LoD.
When DIRECT/PRIMARY SOURCES ARE NOT AVAILABLE or unusable
(e.g., there are no direct sources on the surface appearance of the floor of the main entrance; hence, it is reconstructed based on coeval buildings of the same area and style by different authors). |
| 7 | Highest uncertainty
(~86 to 100% uncertain) | Conjecture based mainly on personal knowledge due to missing or UNREFERENCED SOURCES
(e.g., there are no sources that describe how the staircase appeared, so I decide to reconstruct it as a spiral staircase based only on my knowledge, without referring to any secondary source in particular because I am in a hurry). |
| \ | Abstention | Not relevant, not considered, left unsolved, missing data, and missing conjecture (does not count for the calculation of the average uncertainty). |
Table 5.
The updated scale of uncertainty with 5 (+1) levels. This more compact version does not consider authorship, but its results are still comparable with the previous version because the uncertainty % intervals are summed up.
Table 5.
The updated scale of uncertainty with 5 (+1) levels. This more compact version does not consider authorship, but its results are still comparable with the previous version because the uncertainty % intervals are summed up.
| Colour Code | Uncertainty | Description |
|---|
| 1 | Lowest uncertainty
(~0 to 14% uncertain) | The analysed feature of the 3D model is derived mainly from good-quality, REALITY-BASED DATA which reach the target LoD. |
| 2 | Low uncertainty
(~14 to 28% uncertain) | Reliable conjecture based mainly on clear and accurate DIRECT/PRIMARY sources which reach the target LoD.
When REALITY-BASED DATA are not available, available but unusable, or do not reach the target LoD. |
| 3,5 | Average uncertainty
(~28 to 57% uncertain) | Conjecture based mainly on INDIRECT/SECONDARY SOURCES, which reach a sufficient LoD, or logical deduction/selection of variants.
When DIRECT/PRIMARY SOURCES ARE AVAILABLE, but minimally unclear, damaged, inconsistent, inaccurate, or do not reach the target LoD. |
| 5,5 | High uncertainty
(~57 to 86% uncertain) | Conjecture based mainly on INDIRECT/SECONDARY sources which reach the target LoD.
When DIRECT/PRIMARY SOURCES ARE NOT AVAILABLE or unusable. |
| 7 | Highest uncertainty
(~86 to 100% uncertain) | Conjecture based mainly on personal knowledge due to missing or UNREFERENCED SOURCES. |
| \ | Abstention | Not relevant, not considered, left unsolved, missing data, and missing conjecture (does not count for the calculation of the average uncertainty). |
Table 6.
The updated scale of uncertainty with 3 (+1) levels. This even more compact version considers only the availability, the type, and the LoD of the sources, but its results are still comparable with the previous version because the uncertainty % intervals are summed up.
Table 6.
The updated scale of uncertainty with 3 (+1) levels. This even more compact version considers only the availability, the type, and the LoD of the sources, but its results are still comparable with the previous version because the uncertainty % intervals are summed up.
| Colour Code | Uncertainty | Description |
|---|
| 1,5 | Lowest uncertainty
(~0 to 28% uncertain) | The analysed feature of the 3D model is derived mainly from good-quality, REALITY-BASED DATA or from a reliable conjecture based mainly on clear and accurate DIRECT/PRIMARY SOURCES which reach the target LoD. |
| 4,5 | Average uncertainty
(~28 to 86% uncertain) | Conjecture based mainly on INDIRECT/SECONDARY SOURCES which reach the target LoD, or logical deduction/selection of variants.
When DIRECT/PRIMARY SOURCES are available but minimally unclear, damaged, inconsistent, inaccurate, or do not reach the target LoD. |
| 7 | Highest uncertainty
(~86 to 100% uncertain) | Conjecture based mainly on personal knowledge due to missing or UNREFERENCED SOURCES. |
| \ | Abstention | Not relevant, not considered, left unsolved, missing data, and missing conjecture (does not count for the calculation of the average uncertainty). |
Table 7.
Values used for the calculation of the AU_V and AU_VR. For the colour code refer to
Table 4.
Table 7.
Values used for the calculation of the AU_V and AU_VR. For the colour code refer to
Table 4.
| Element | Uncertainty Level | Relev. | Volume |
|---|
| Geom. | Constr. Syst. | Surf. | Pos. | Average |
|---|
| Stadera’s tower | 2 | 2 | 2 | 1 | 1.75 (≈25%) | 1 | 630 m3 |
| Other buildings | 5.5 | 5.5 | 5.5 | 3.5 | 5 (≈71%) | 0.25 | 48,926 m3 |
| Mercanzia residence | 2 | 2 | 3.5 | 1 | 2.125 (≈30%) | 1 | 7558 m3 |
| Vanini’s house | 3.5 | 3.5 | 5.5 | 2 | 3.625 (≈51%) | 1 | 211 m3 |
| Money changer’s lodge | 3.5 | 5.5 | 5.5 | 2 | 4.125 (≈59%) | 1 | 5640 m3 |
| Fish’s stone and chicken coop | 3.5 | 3.5 | 3.5 | 3.5 | 3.5 (≈50%) | 1 | 32 m3 |
| Domus Bladorum (+Mazzanti house and Region’s Palace) | 2 | 2 | 5.5 | 1 | 2.625 (≈37%) | 1 | 41,016 m3 |
| Gardello’s tower | 2 | 2 | 2 | 1 | 1.65 (≈24%) | 1 | 2775 m3 |
| Capitello | 1 | 1 | 1 | 1 | 1 (≈14%) | 1 | 20 m3 |
| Madonna Verona’s fountain | 1 | 1 | 1 | 1 | 1 (≈14%) | 1 | 45 m3 |
| Ancient column | 1 | 1 | 1 | 3.5 | 1.625 (≈23%) | 1 | 7 m3 |
| Disclaimer/Publisher’s Note: The statements, opinions and data contained in all publications are solely those of the individual author(s) and contributor(s) and not of MDPI and/or the editor(s). MDPI and/or the editor(s) disclaim responsibility for any injury to people or property resulting from any ideas, methods, instructions or products referred to in the content. |
© 2024 by the authors. Licensee MDPI, Basel, Switzerland. This article is an open access article distributed under the terms and conditions of the Creative Commons Attribution (CC BY) license (https://creativecommons.org/licenses/by/4.0/).


