
Ontology and Software Tools for the Formalization of the Visualisation of Cultural Heritage Knowledge Graphs


Abstract
1. Introduction
- Cronology: Origin: Qing Period (1644–1911 d.C.)/XIX Century
- Origin: Orient/China/France/Holland
2. Previous Work
- RVL is complex, with a low level of readability and significant learning costs. This implies the need for experts in this language to define a visualisation system. The philosophy of this work is to take the graph to be visualised, the VISO ontology and the RVL language as a base. Using this information, the scene is represented using a viewer-software tool. This framework may be acceptable in intermediate or simple graphical scenarios. However, if the goal is to implement a visualisation system with advanced interfaces or complex scenes, the number of RVL scripts required will be large. This results in high development and maintenance costs. In addition, the user interface definition in RVL is limited, and there is no way to connect to external APIs.
- The RVL viewer software tool has been developed and is freely available. However, it requires a lot of work to be able to display many elements of a scene with basic complexity.
- Given its specific domain application a priori, it does not have much in common with cultural heritage, and characteristics such as uncertainty or granularity are not considered. However, at its core, it is still an element located in space, and its position and characteristics can change over time. This means that it can be used to represent cultural heritage data, but extensions will have to be designed to take into account granularity, uncertainty and time. On a temporal level, the main difference is that VUMO is very real-time-oriented, so hours and minutes are particularly important in urban traffic problems. However, this information has never been considered in heritage research.
- Graphic customisation is extremely limited and does not include the use of three-dimensional elements.
- No VUMO Viewer software tool has yet been developed.
- Map the concepts of the knowledge graph to be represented using the appropriate concepts of a visualisation ontology. This concept is used in VUMO and VISO.
- Delegate to an external system the task of visualising the information in the ontology by means of scene types. This idea is used in the VUMO.
- The GRAPHICS ontology developed by VISO represents different graphical possibilities with a high level of depth.
3. Visualisation Model
- Visual objects are graphic elements that can be visually recognised. These elements are related to the scenario or visual scene in which they are represented. Visual objects are further divided into two concepts:
- ○
- Visual Element: a graphical object representing a set of heritage objects belonging to the same class. It is related to the knowledge graph concept that supports domain data.
- ○
- Scene, which represents the global visual content to be rendered. This concept contains defining properties and relationships with all the visual elements within the scene.
- Interaction Actions: This concept formalises the actions that are allowed to be performed in the scene, either to facilitate interaction with the user, as in other applications, or as events in the visualisation system. These processes have consequences for scene representation.
3.1. Visual Elements
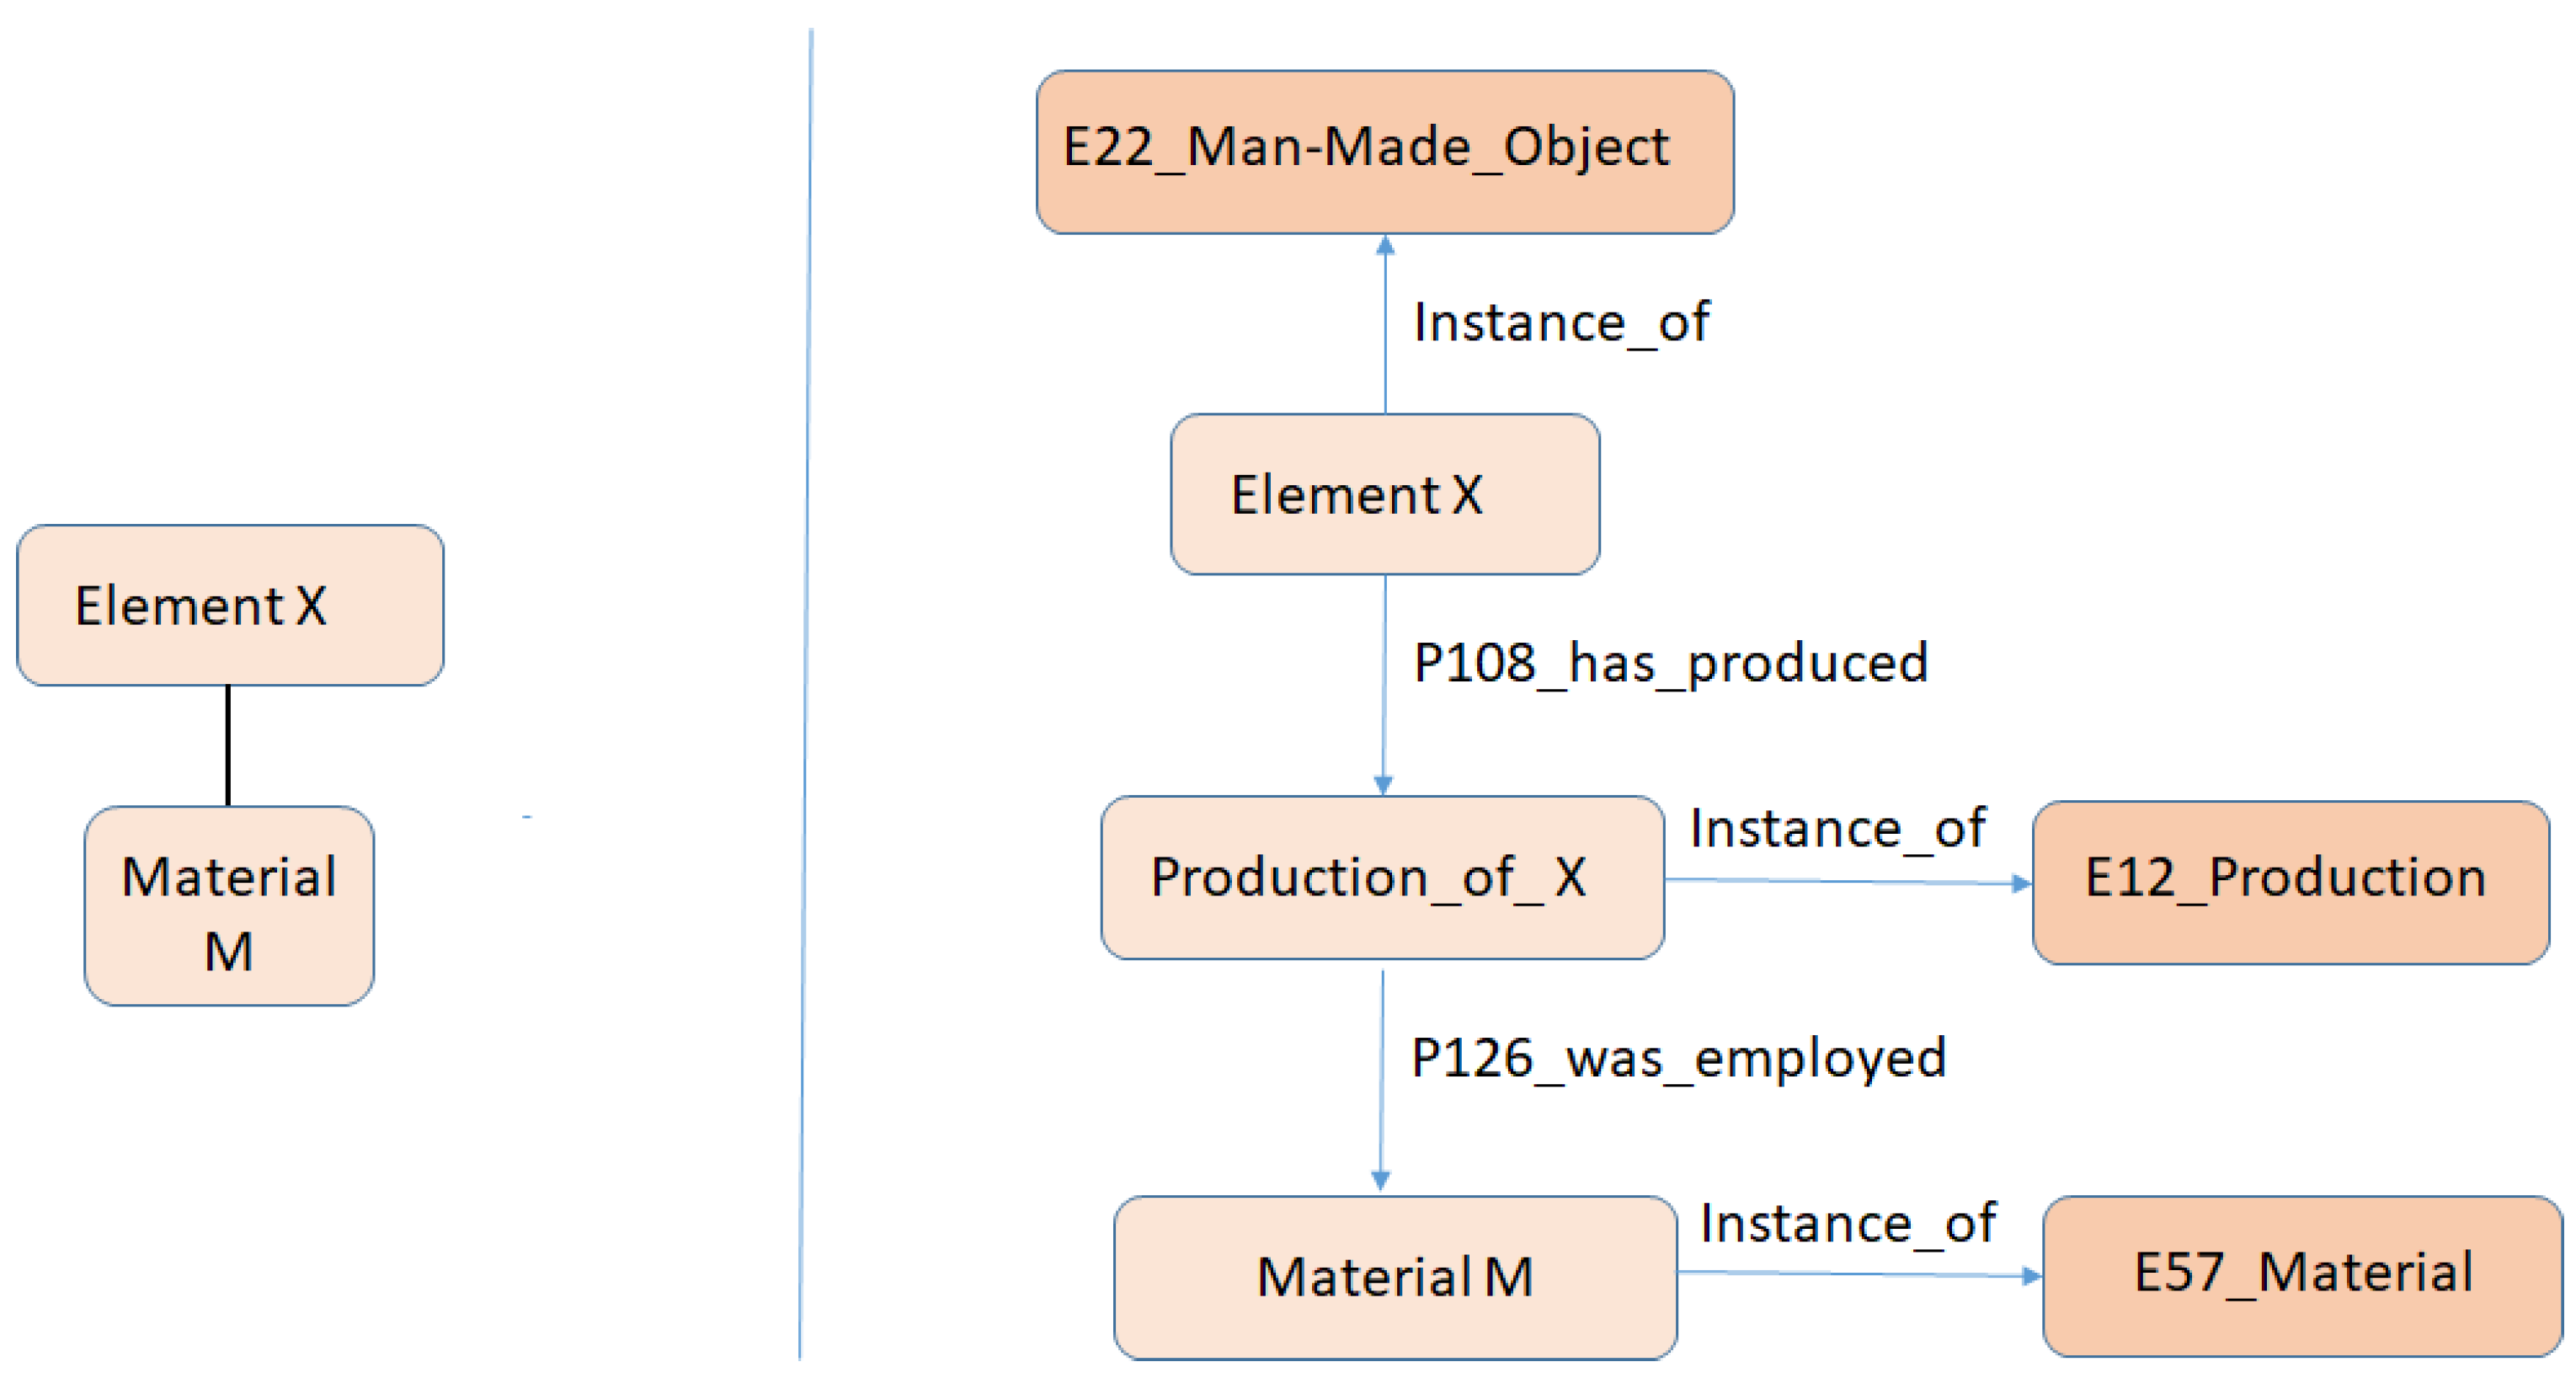
- SELECT distinct ?materialLabel
- WHERE {
- ?s rdf:type <http://erlangen-crm.org/current/E12_Production>;
- <http://erlangen-crm.org/current/P108_has_produced> Element_URI.;
- ?q <http://www.w3.org/2004/02/skos/core#prefLabel> ?materialLabel
- }
3.2. Scene
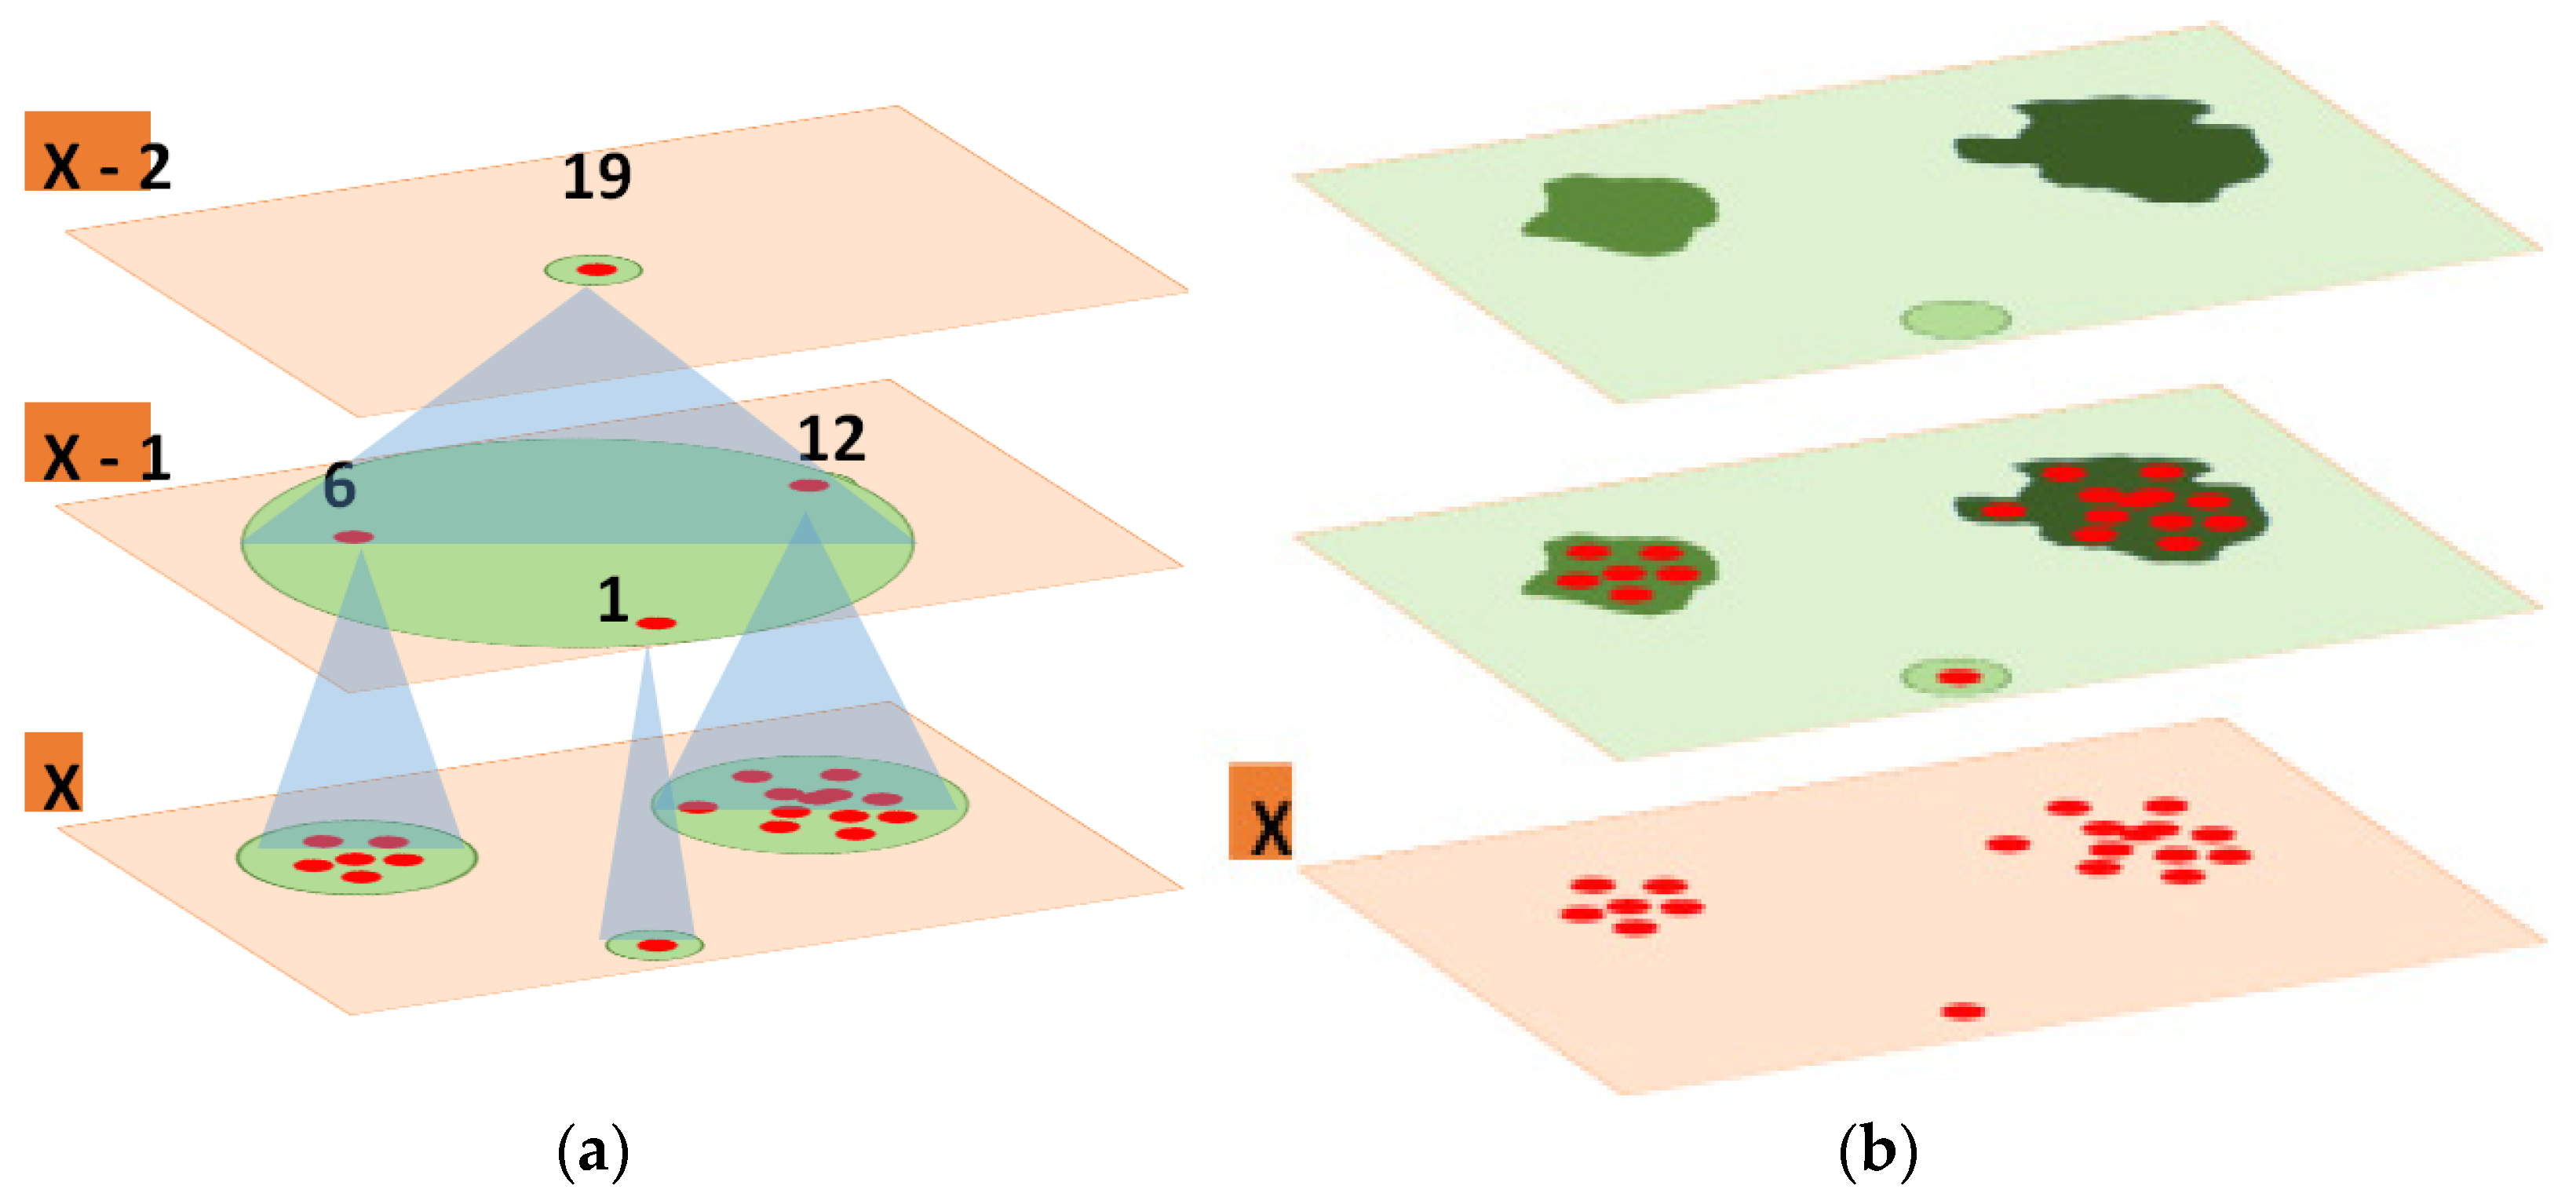
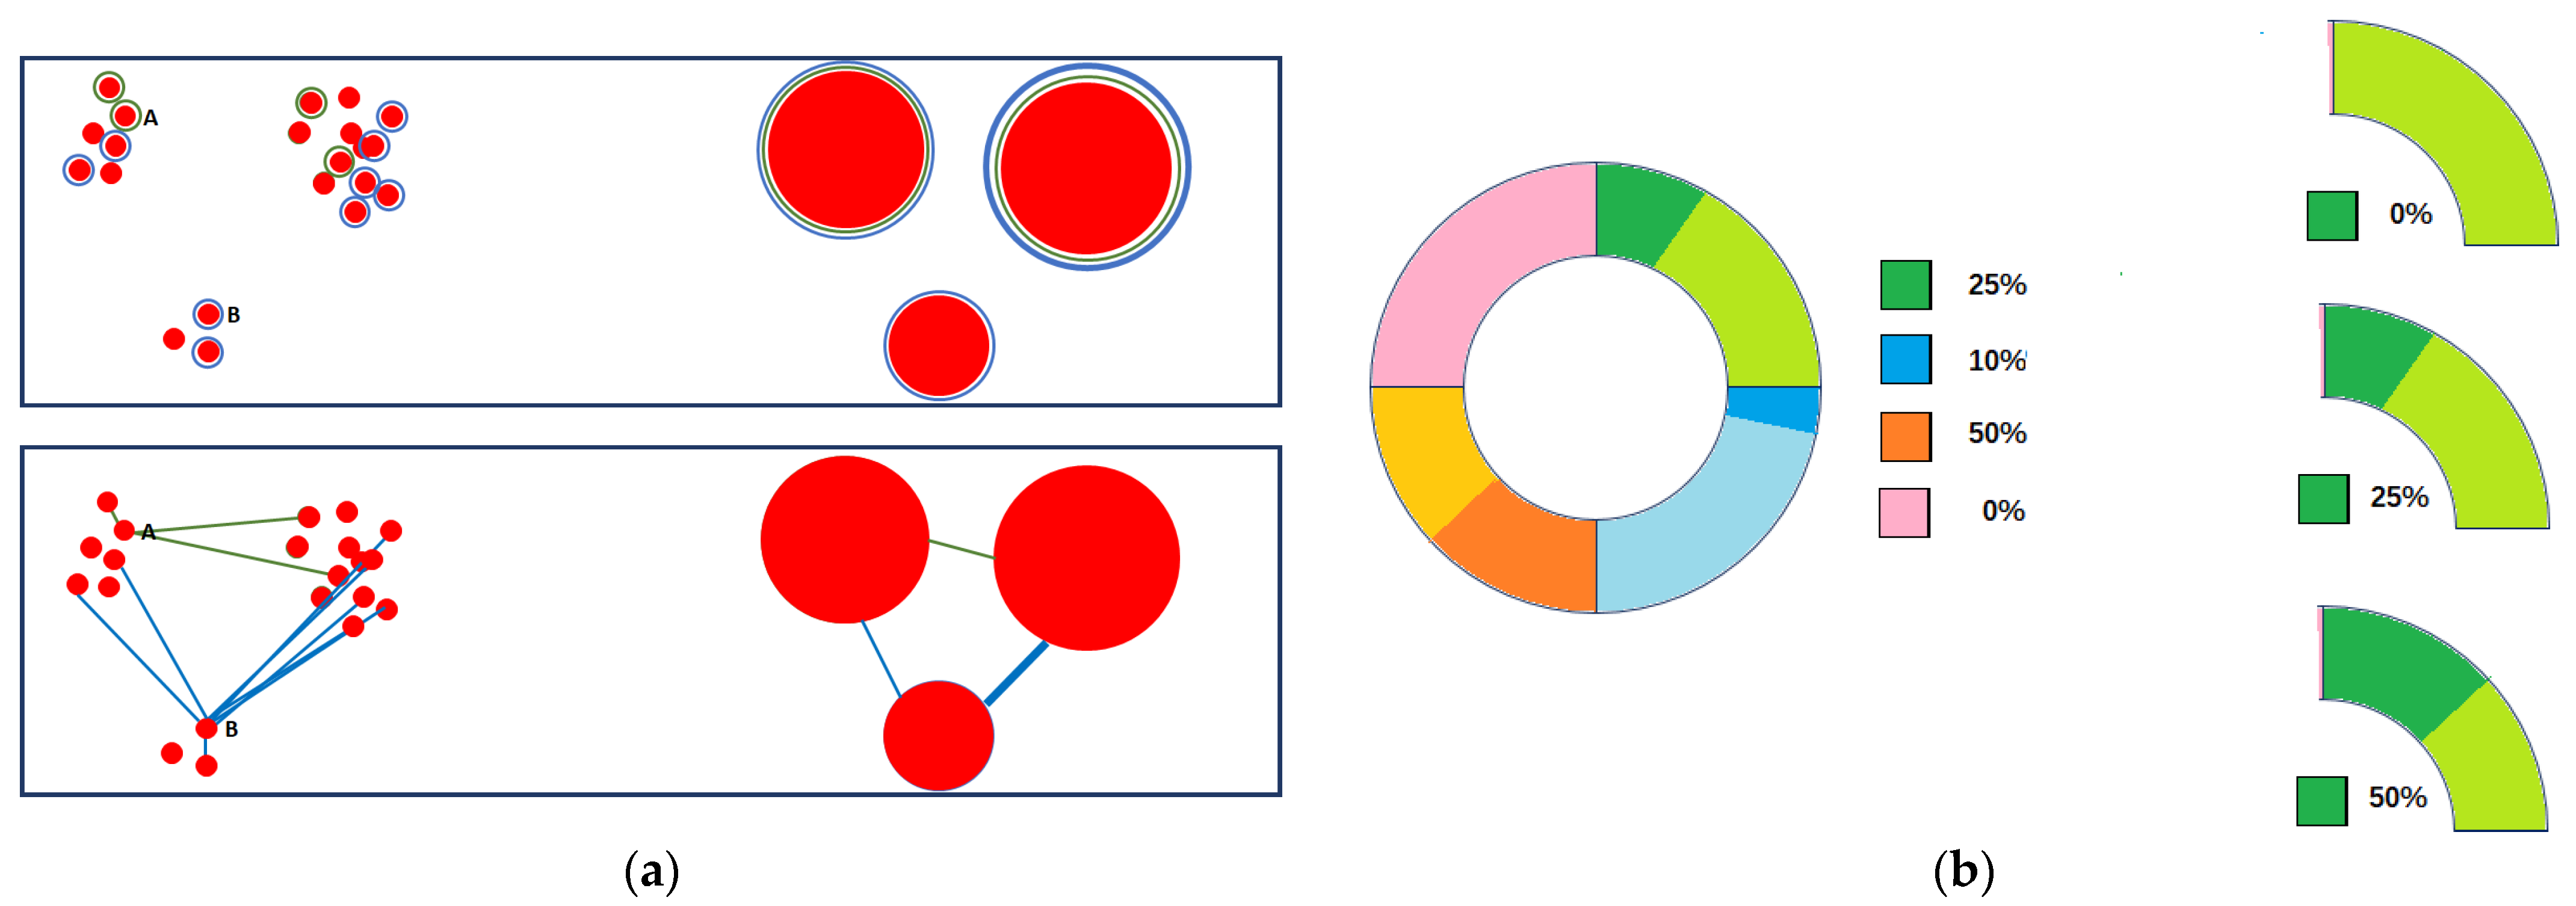
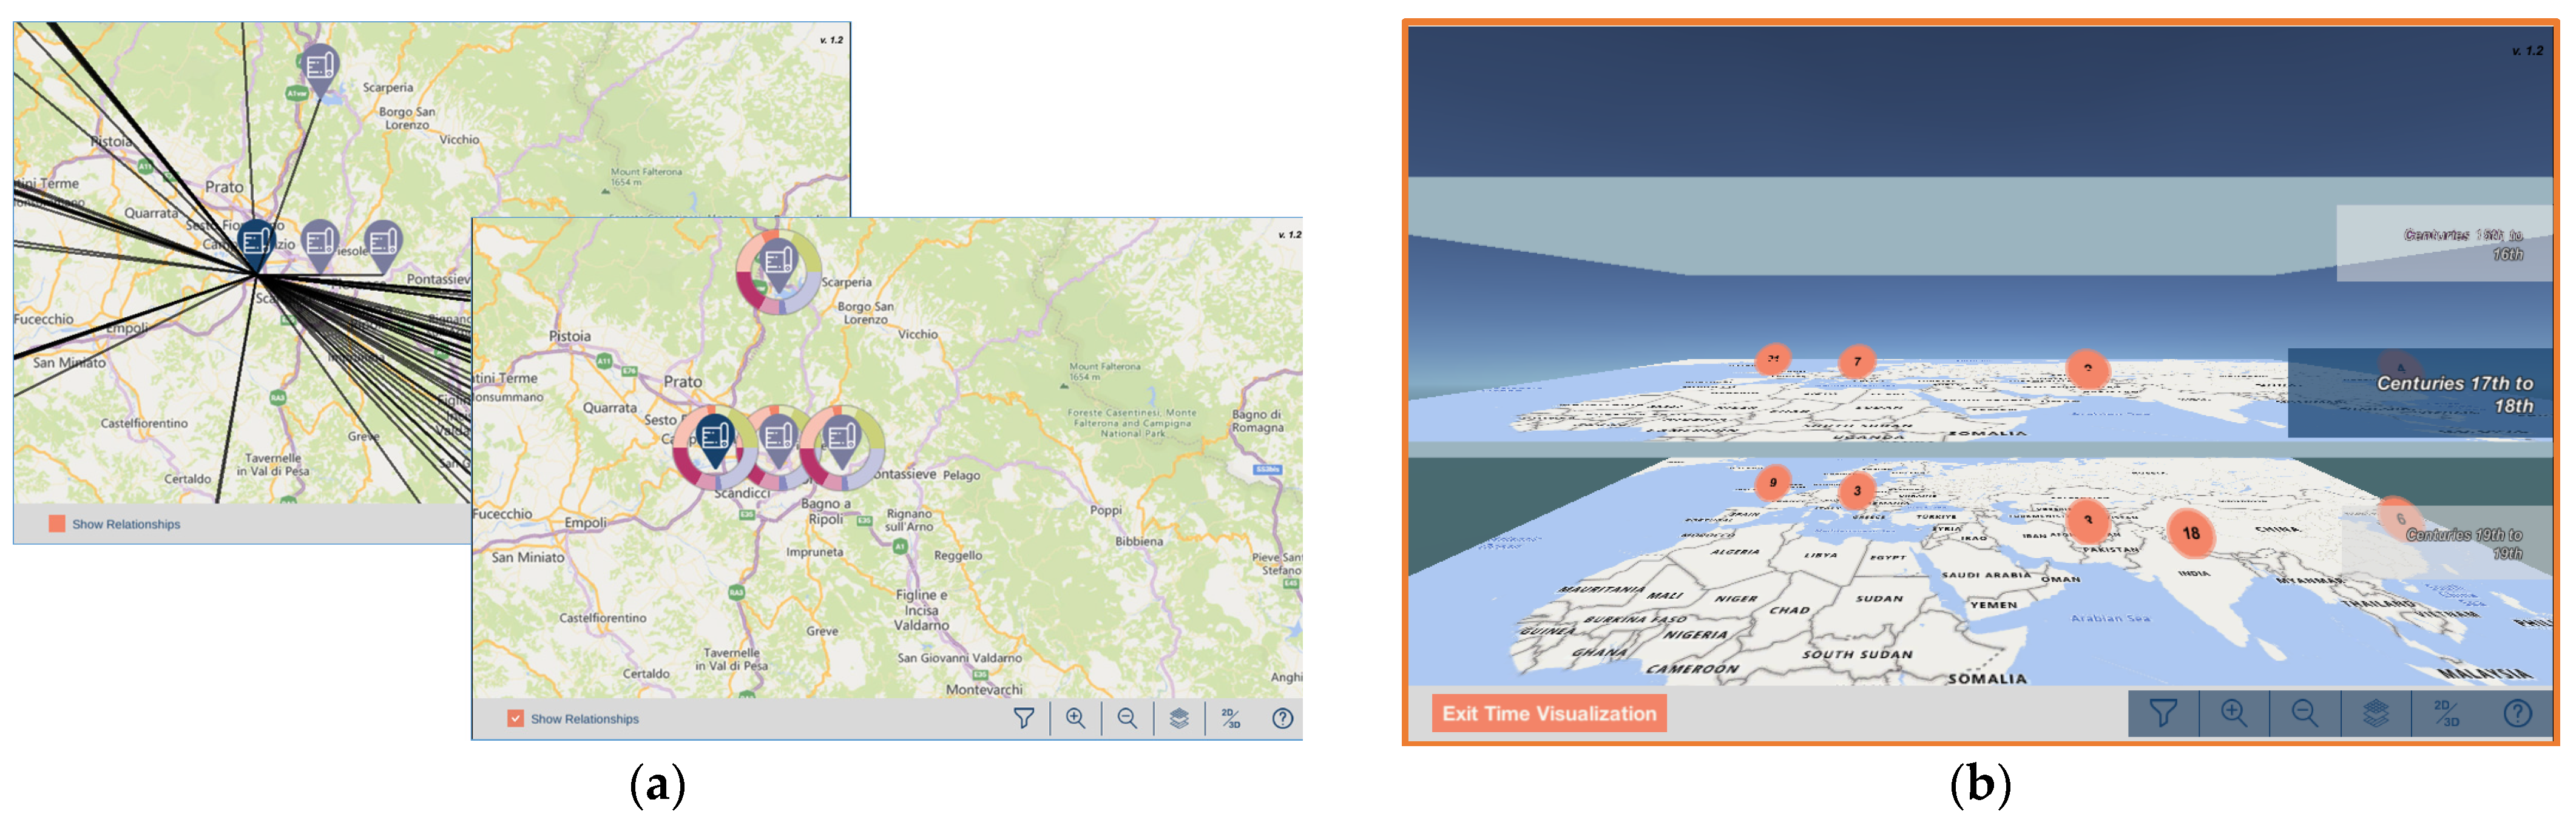
- Grouping around a representative marker. It replaces groups of objects from a region with a representative marker, which is usually located in the centre of the region defined by the group. This process is repeated at all levels of detail, so that at a maximum level X, all the markers represent objects of the dataset, but at a level X − 1, with less detail, the markers could represent not only objects but also a group of objects defined starting from the representative markers of level X.
- Heat maps. The data groups are created in a manner similar to that in the previous form. Scene regions are assigned to each group based on their densities. Each area is assigned a colour, which is usually more intense depending on the amount of data it contains or even changes colour depending on the amount of data. This type of grouping is static. Once the regions are defined and coloured, they do not change, even if the user navigates to a different level of detail.
- The values are predefined. Each property that can be filtered has a set of associated values.
- The values are obtained from the dataset for display. The user may select one of the different property values in the dataset.
- Differentiating related objects using a colour or characteristic graphic mark.
- Connecting the objects related to each other by lines or arcs, whose thickness or colour intensity can vary according to the number of related data points if they are groups.
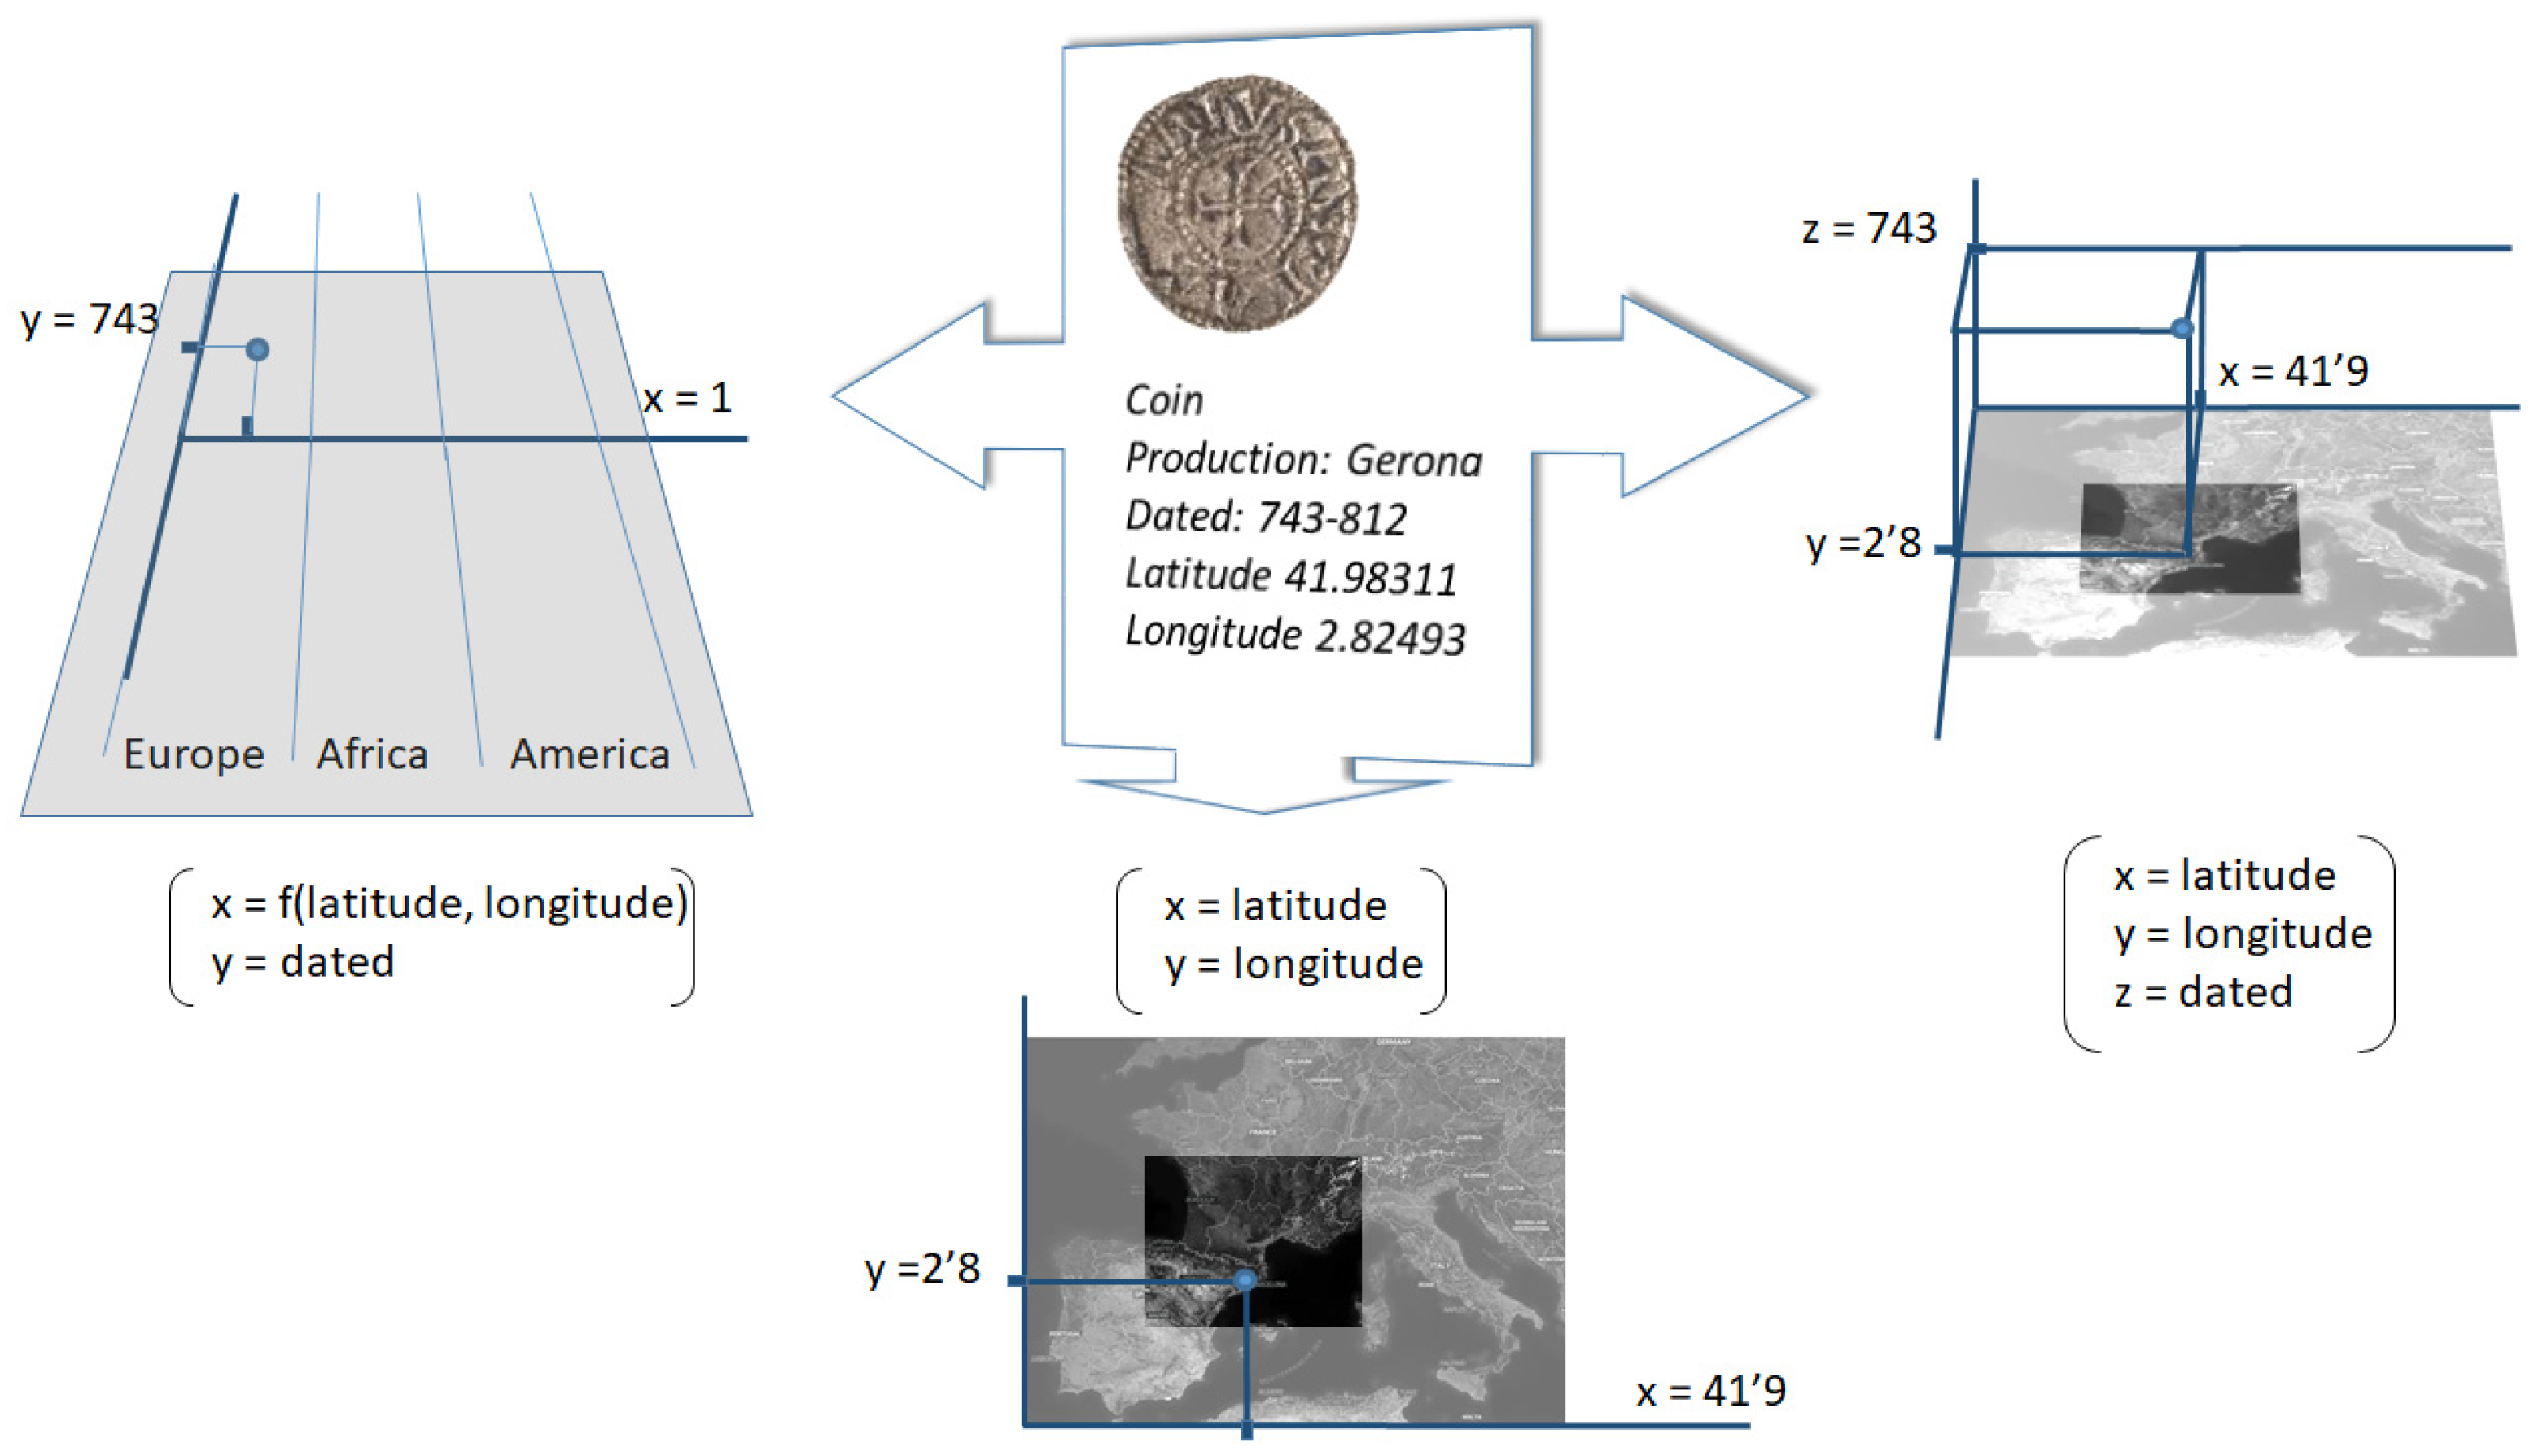
- A two-dimensional display where each point on the timeline corresponds to a frame and the objects displayed are those related to the selected point on the timeline. This allows the user to view the passage of time as if it were a video.
- Three-dimensional visualisation using a hypercube. The user visualises the data at any point on the time scale. The hypercube can be simple, display data continuously, or contain sections or slices, displaying only the data for each section.
4. Implementation
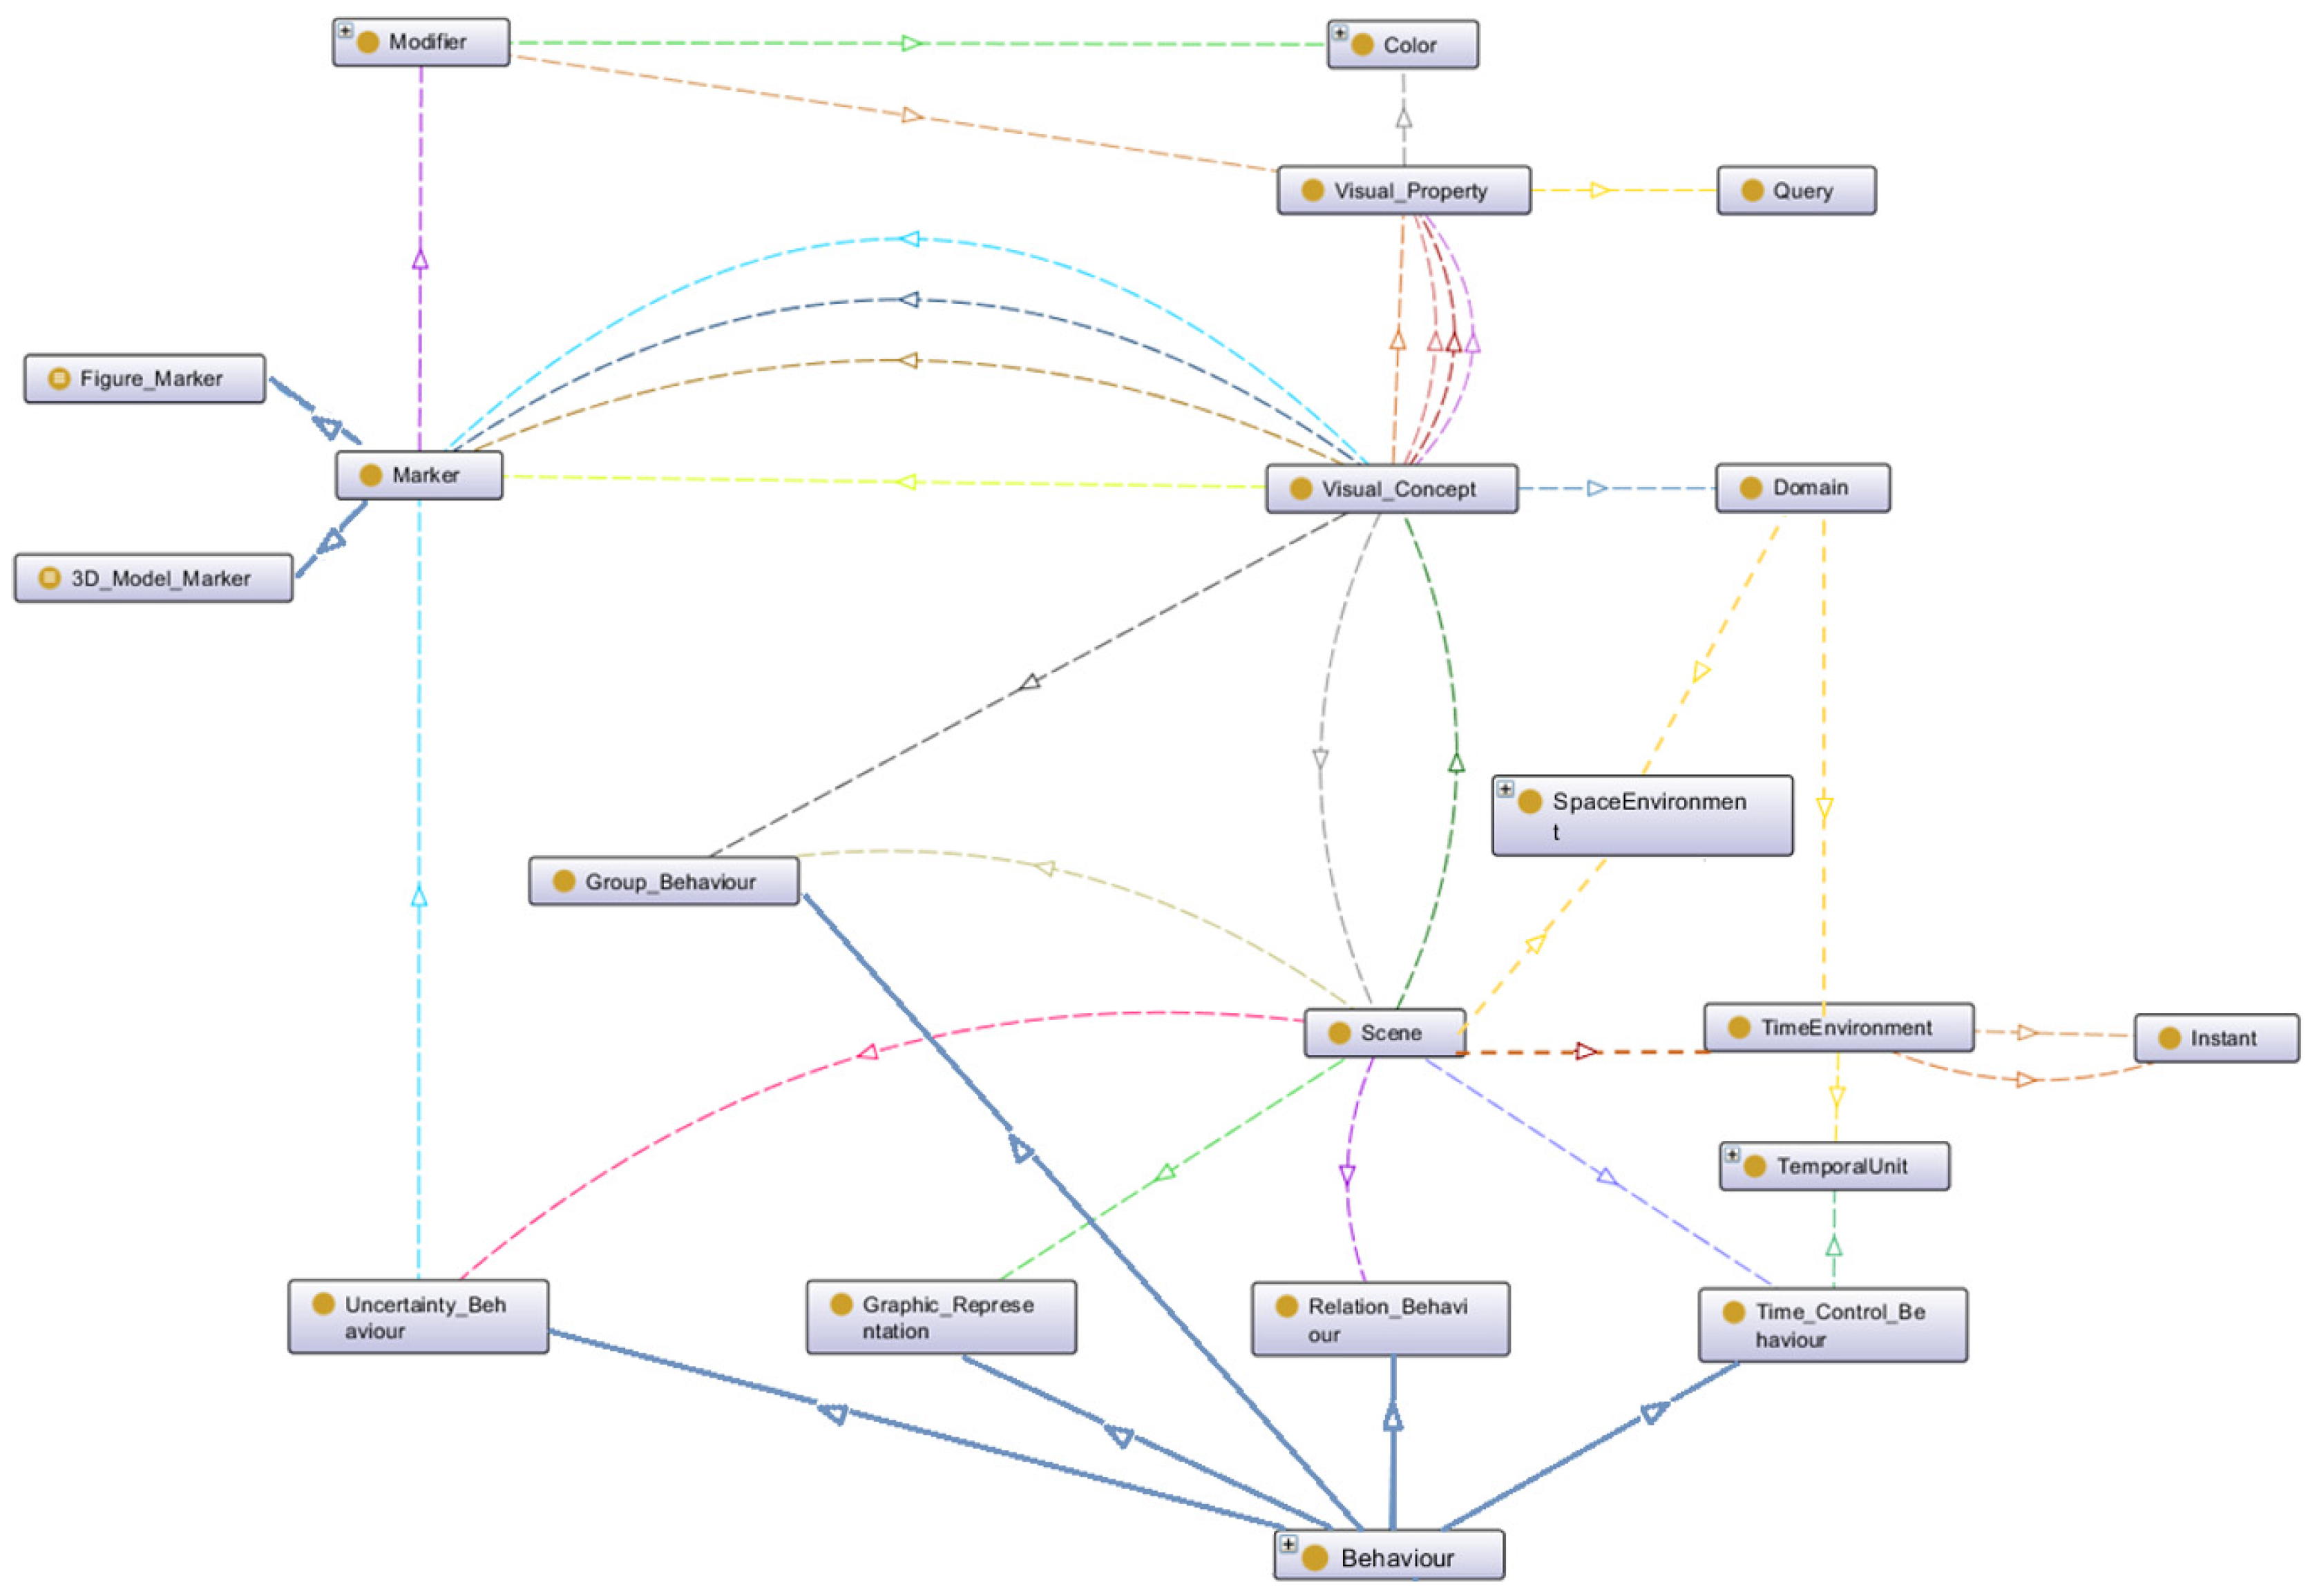
4.1. Ontology
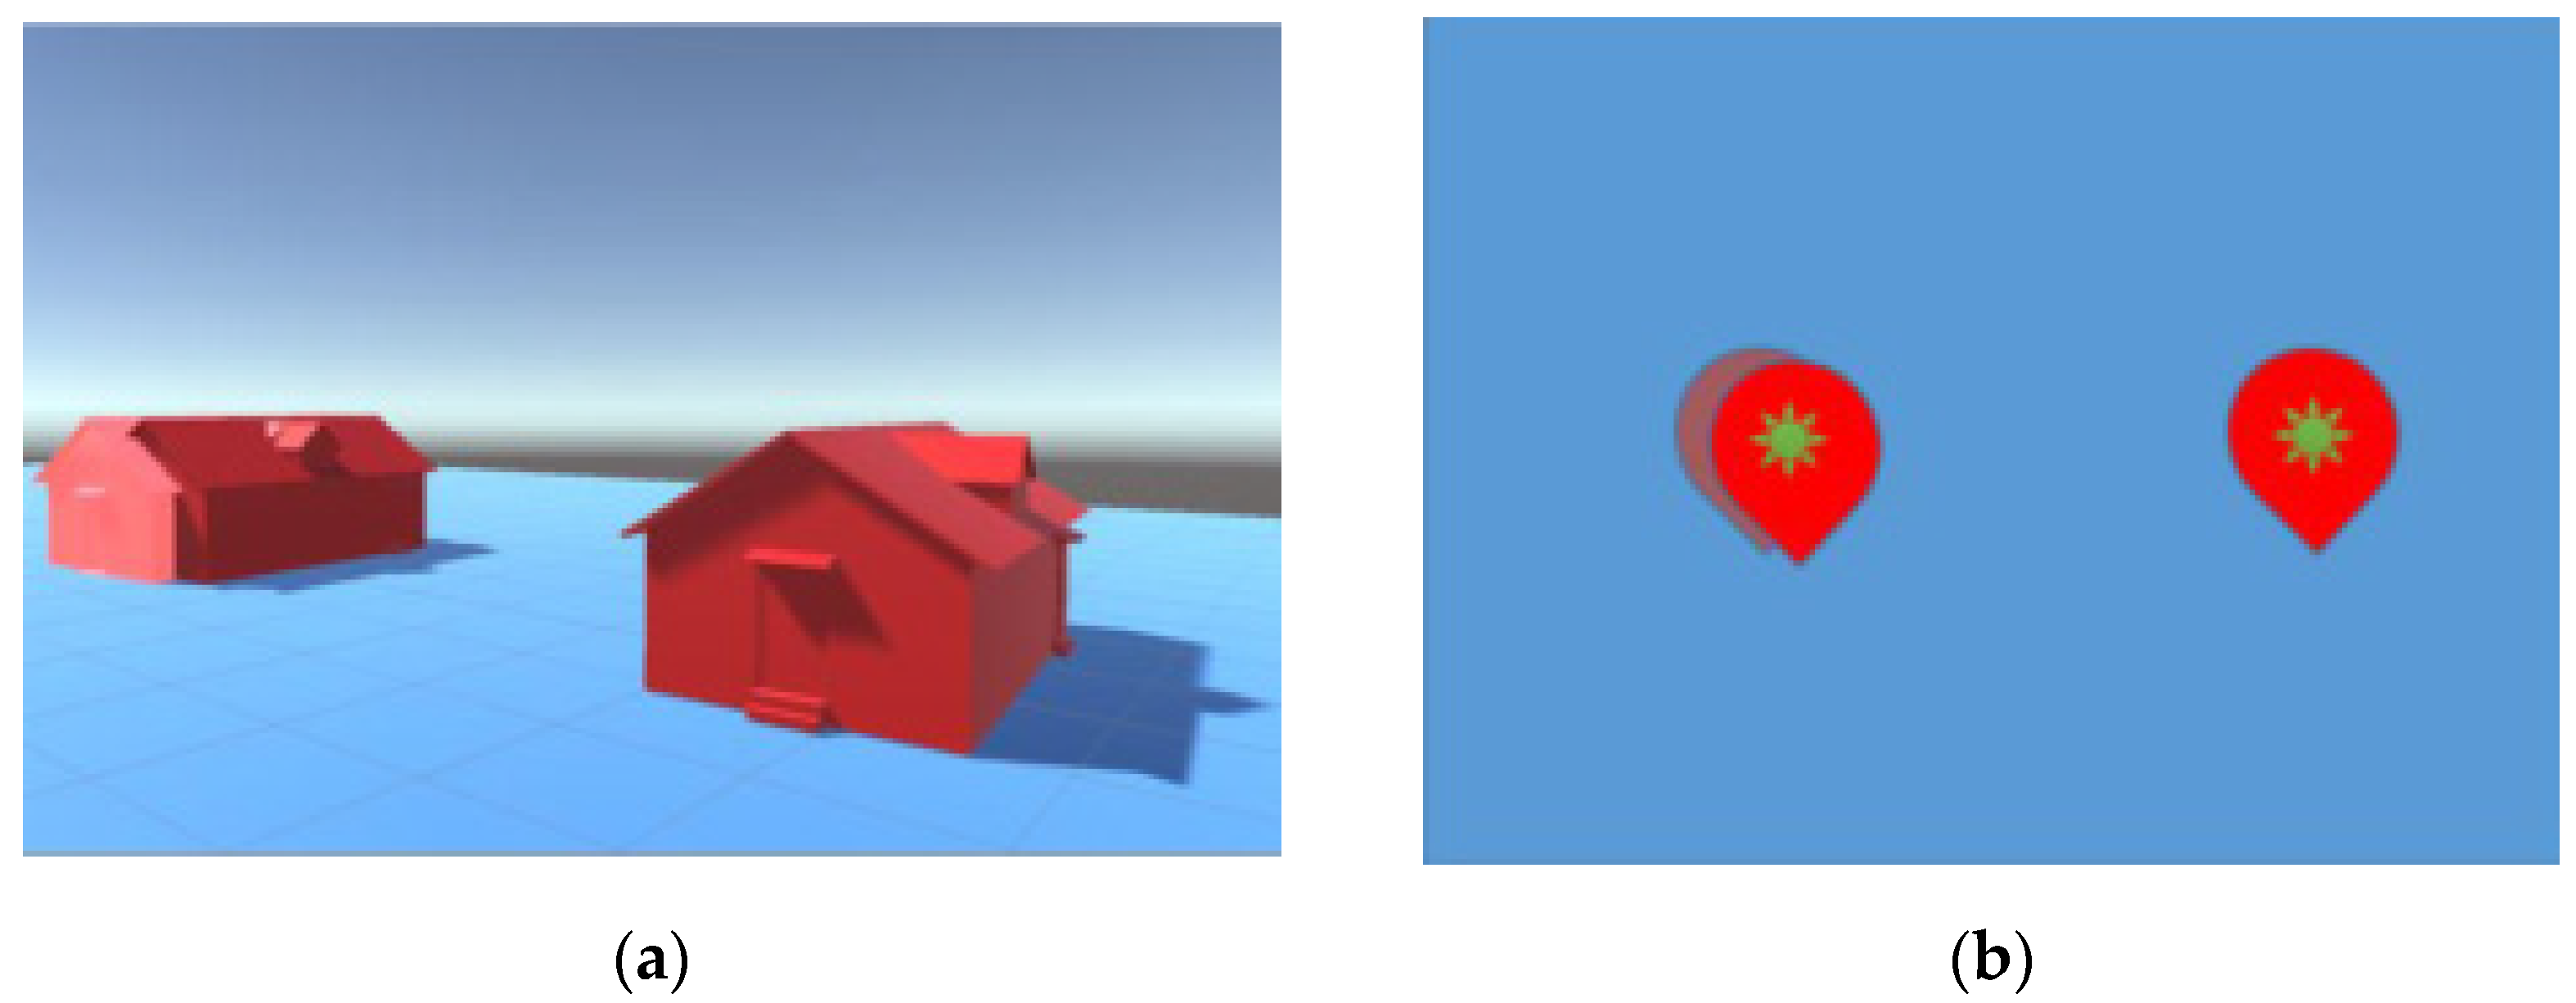
- VISO GRAPHICS for the specification of graphic objects, with extensions of three-dimensional scenes.
- TIME [31]. A W3C consortium ontology for representing temporal units and durations.
- IGF. Coordinate systems ontology developed by the Institut National de l’Information Géographique et Forestière (IGF) [32].
- -
- Time interval (start and end).
- -
- Spatial reference.
- -
- Set of properties displayed in the visualisation system.
4.2. STEVO Framework
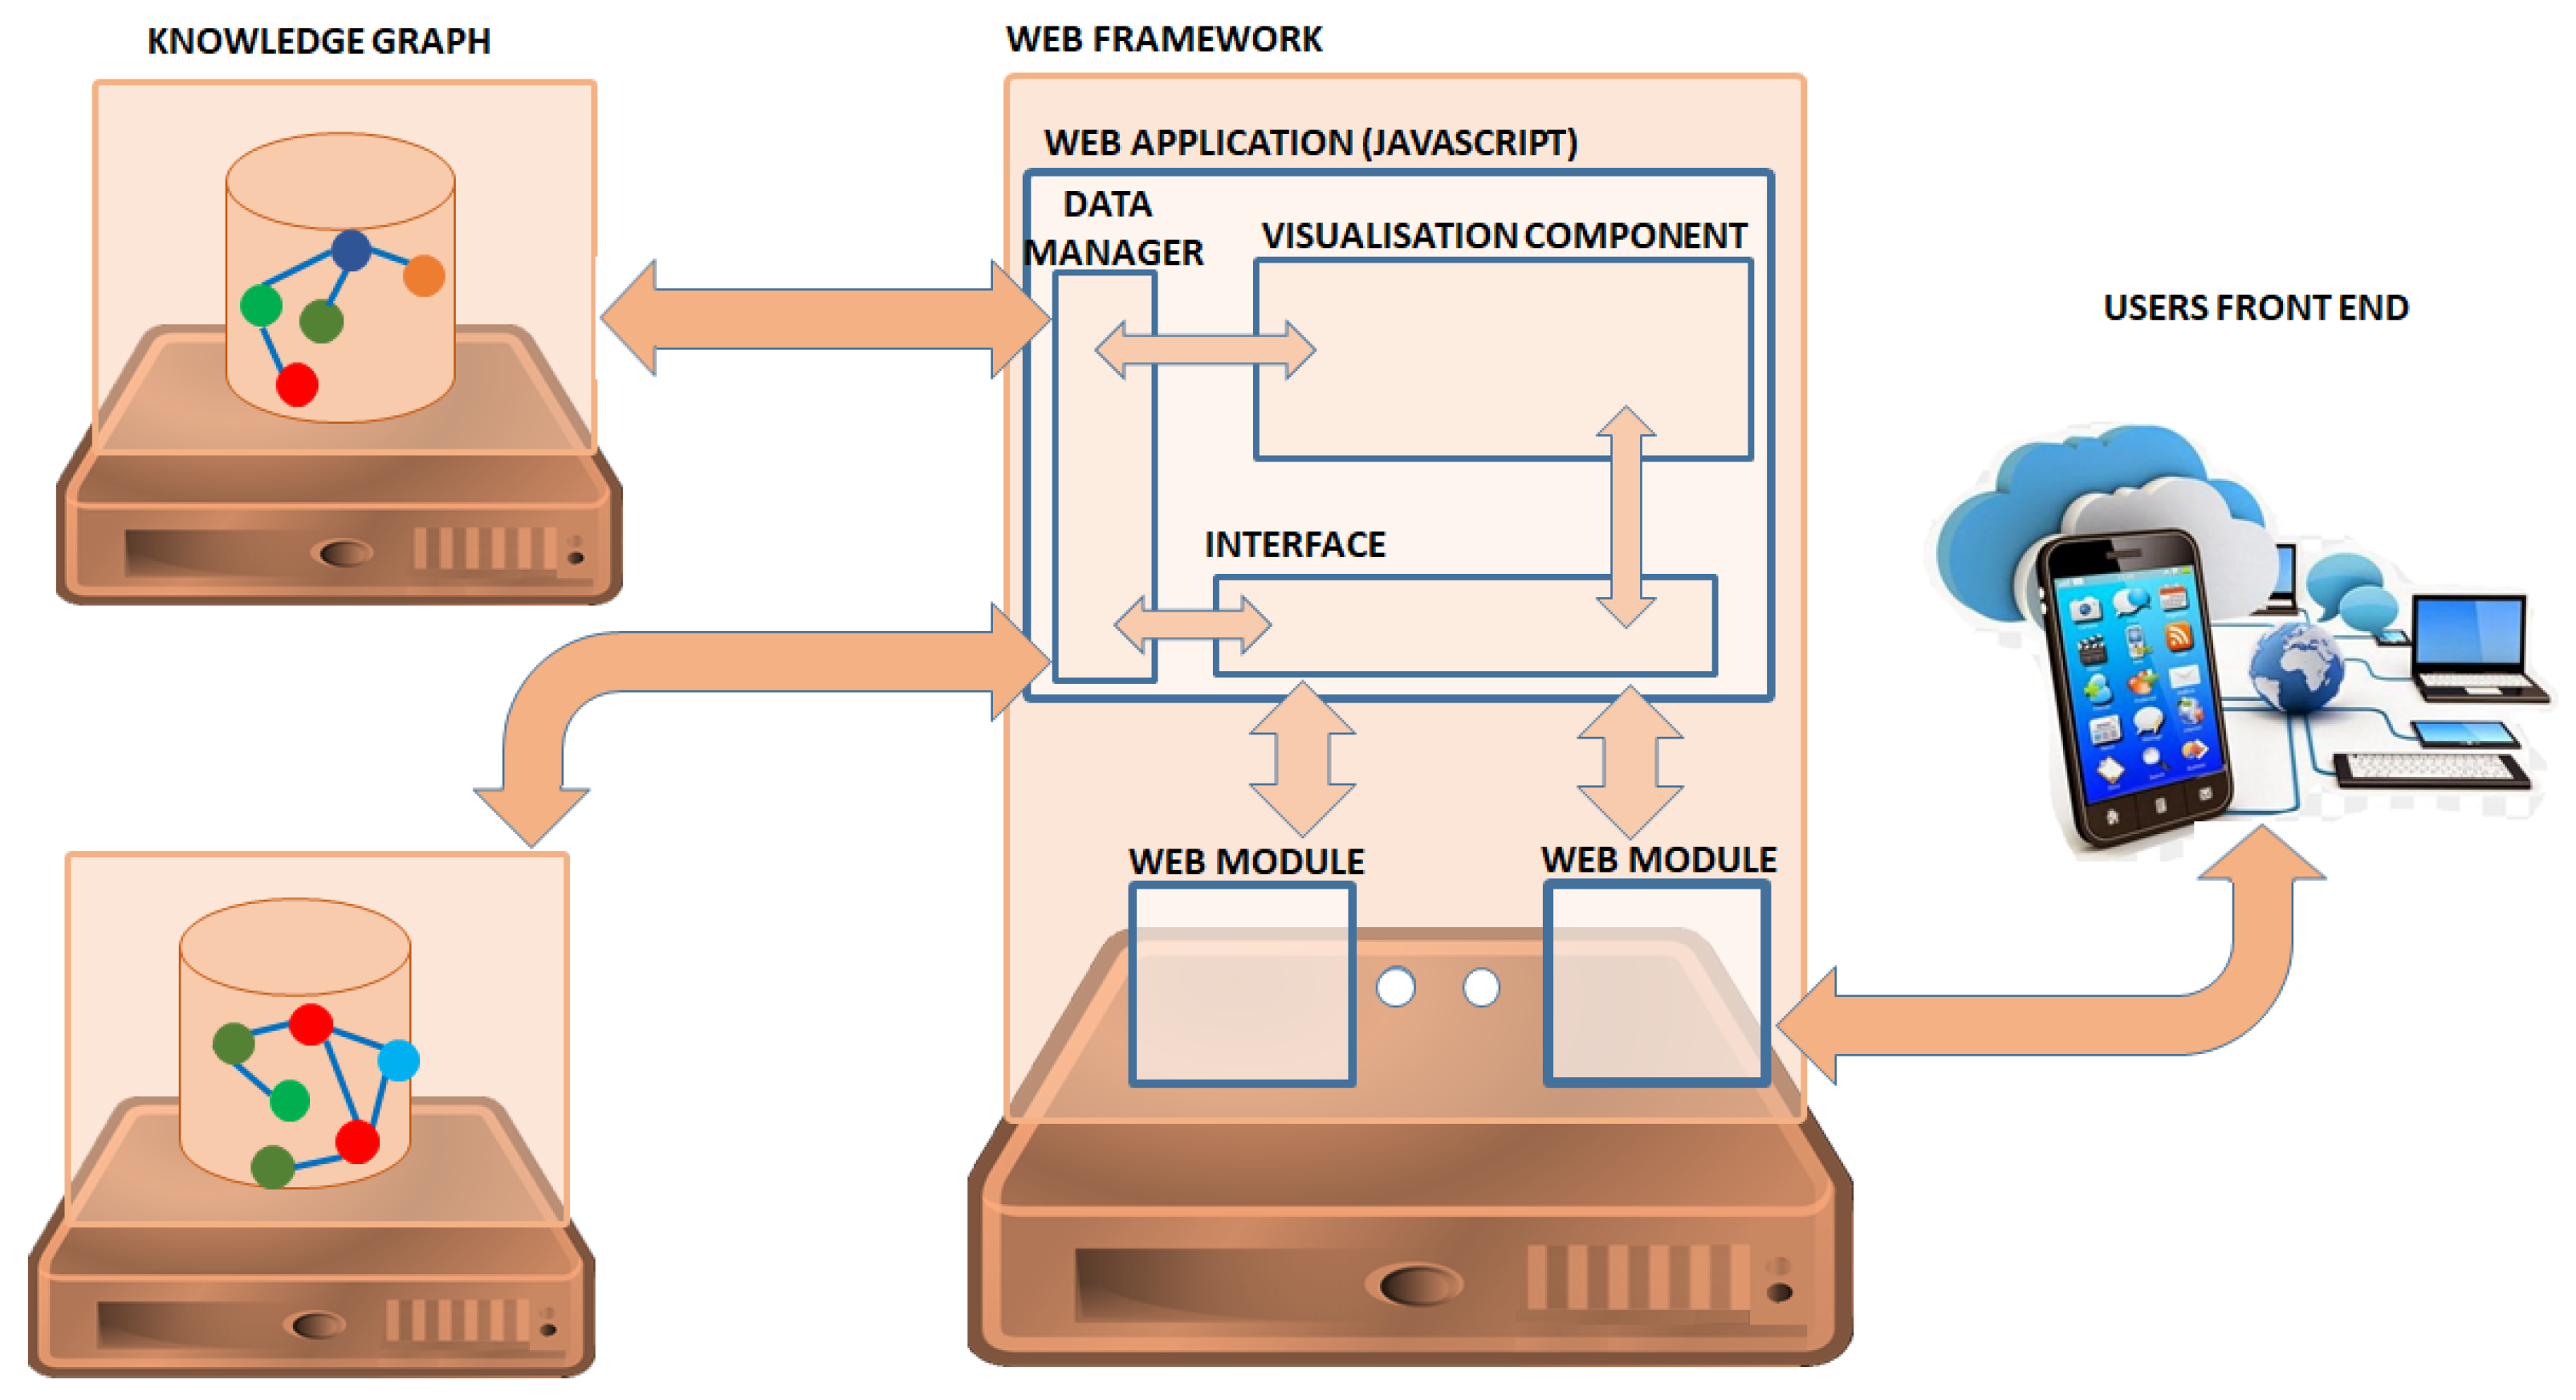
- Hardware and software design to support and provide access to the content of the STEVO ontology.
- Definition and development of modules for accessing knowledge graph content.
- Web support is used to deploy web applications.
- Development of a visualisation component that allows data to be visualised in two and three dimensions on web platforms.
5. Assessment
6. Discussion
- The first relates to the STEVO framework. The existing limitations on the size of the dataset must be removed in the framework design and in the developed version. In the currently implemented version, too much responsibility is delegated to the WebGL display component. There is no data paging management or data request based on the zone or the current level of detail. This situation causes memory problems in load tests. The use of Service Worker technology [38], which allows background processes to run in JavaScript, is essential to solving this problem.
- The definition of new temporal and spatial relationships. The STEVO ontology allows the definition of a temporal, visual and spatial reference property in the scene. This is restrictive because the user of the system may be interested in where and when the data were created, but may also be interested in where the data are now and how long they have been in that location. Therefore, it is necessary that a STEVO scene be able to define several temporal and spatial visual properties associated with different behaviours. These improvements will require changes to the STEVO ontology and STEVO framework.
- Improvement of graphical elements and creation of new base scenes to be able to use the framework in more projects. This has a major impact on the STEVO framework.
Author Contributions
Funding
Institutional Review Board Statement
Informed Consent Statement
Data Availability Statement
Conflicts of Interest
References
- Garcia-Moreno, M.A.; Hernández-Pérez, T. Patrimonio cultural europeo digitalizado: Europeana. Pragmatizes 2019, 140–155. [Google Scholar] [CrossRef]
- European Commission. Commission Staff Working Document Evaluation of the Commission Recommendation of 27 October 2011 on the Digitisation and Online Accessibility of Cultural Material and Digital Preservation (SWD/2021/0015 Final). Available online: https://eur-lex.europa.eu/legal-content/EN/TXT/PDF/?uri=CELEX:52021SC0015&from=EN (accessed on 20 April 2023).
- Europeana Pro. Available online: https://pro.europeana.eu/ (accessed on 20 April 2023).
- Network of European Museum Organisations. Final Report Digitasitation and IPR in European Museums. Available online: https://www.ne-mo.org/fileadmin/Dateien/public/Publications/NEMO_Final_Report_Digitisation_and_IPR_in_European_Museums_WG_07.2020.pdf (accessed on 20 April 2023).
- Sevilla, J.; Casanova, P.; Samper, J.J.; Portales, C. Semap: A Project on sematisation and visualisation of cultural heritage data. In Proceedings of the 11th Euro American Conference on Telematics and Information Systems (EATIS 22), Aveiro, Portugal, 1–3 June 2022; Association for Computing Machinery: New York, NY, USA, 2022; pp. 1–8. [Google Scholar] [CrossRef]
- Portalés, C.; Sebastián, J.; Alba, E.; Sevilla, J.; Gaitán, M.; Ruiz, P.; Fernández, M. Interactive Tools for the Preservation, Dissemination and Study of Silk Heritage—An Introduction to the SILKNOW Project. Multimodal Technol. Interact. 2018, 2, 28. [Google Scholar] [CrossRef]
- Arxiu Valencià del Disseny: Shaping the Future, Designing the Present, Rescuing the Past. Available online: https://arxiuvalencia.eu (accessed on 20 April 2023).
- Aga Khan Documentation Center AT, MIT. LayerCake: New Data Visualization Tool. 2019. Available online: https://layercake.mit.edu/ (accessed on 20 April 2023).
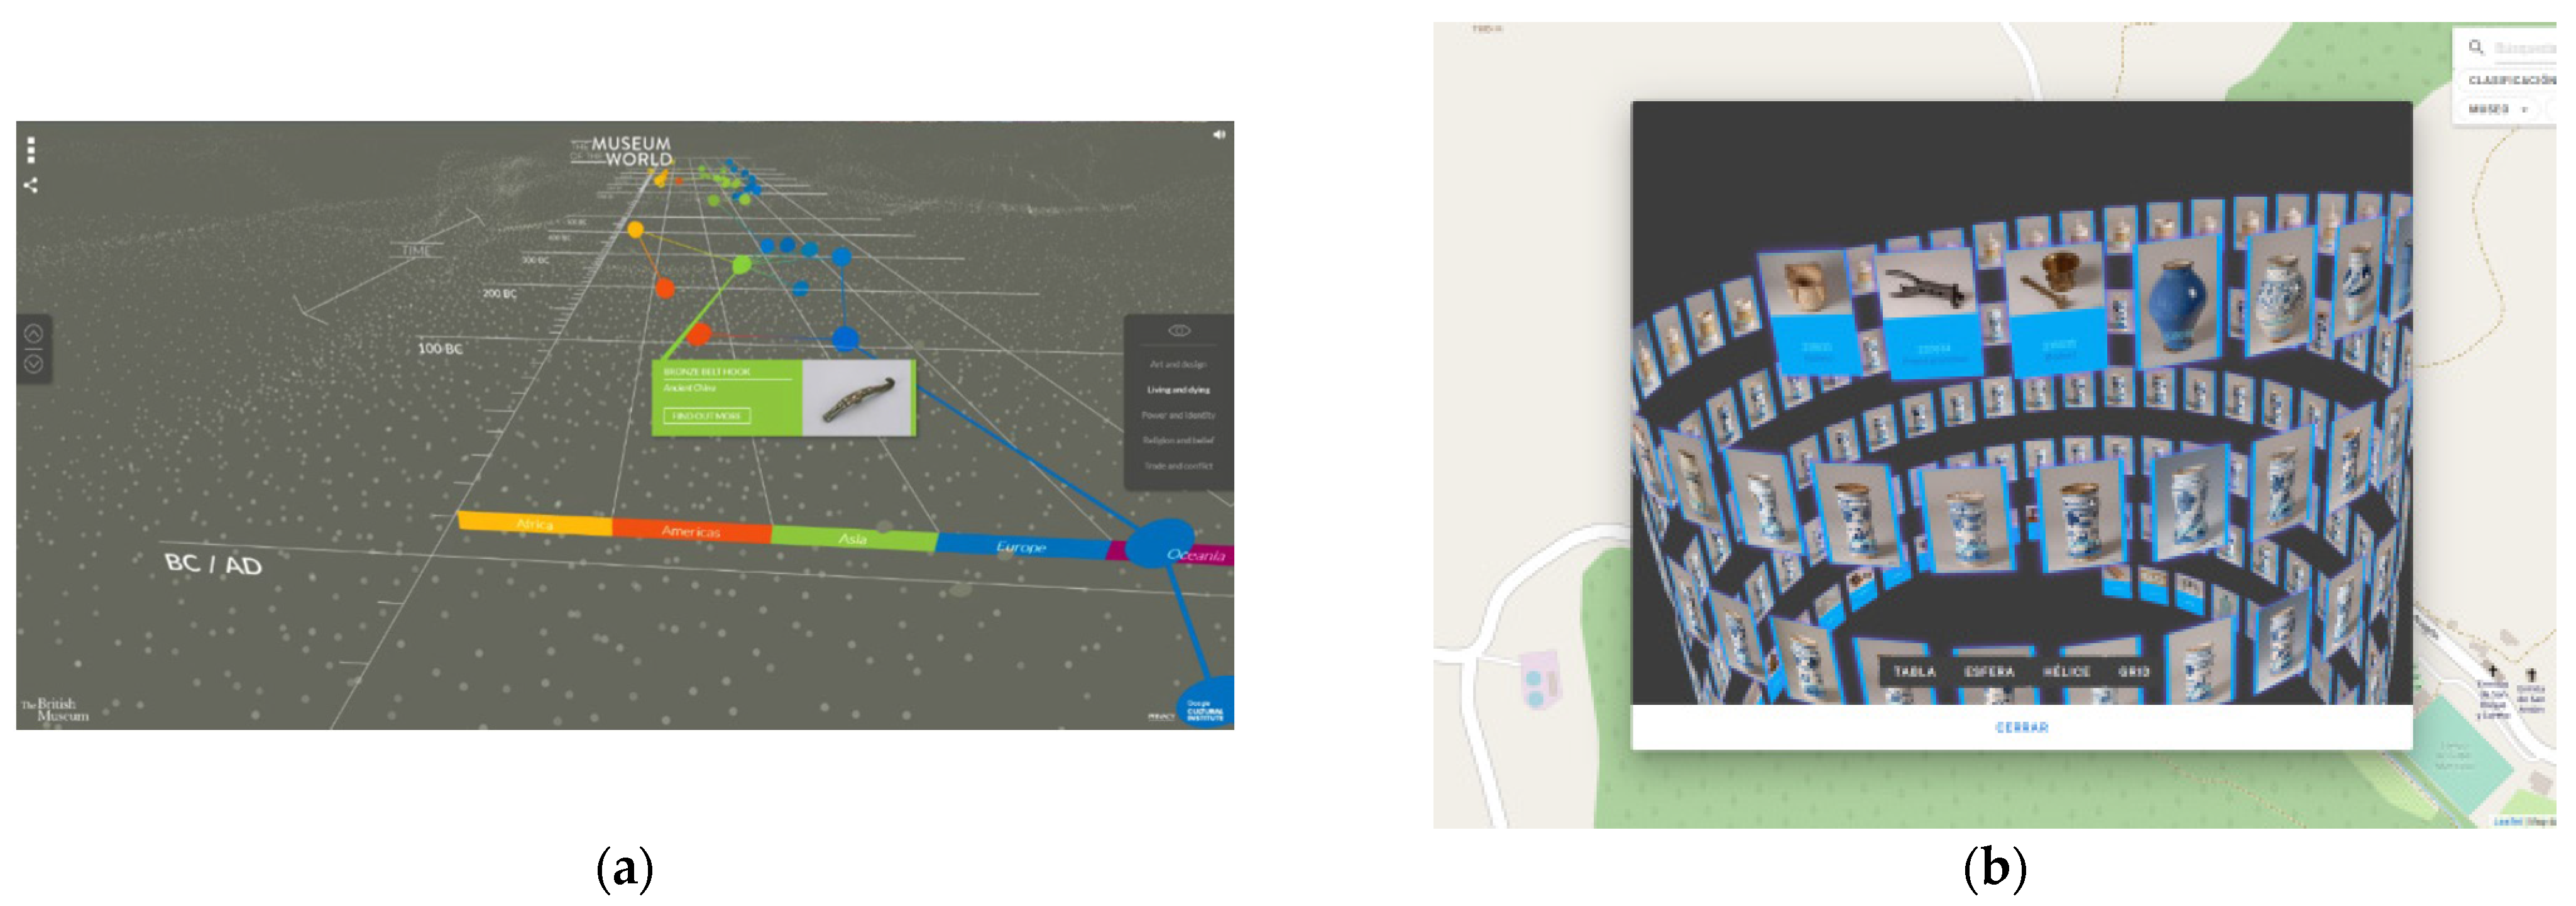
- British Museum and Google Cultural Institute. The Museum of the Wordl. 2015. Available online: https://britishmuseum.withgoogle.com/ (accessed on 20 April 2023).
- IMATEX. Textile 8784. Available online: http://imatex.cdmt.cat/fitxa_fitxa.aspx?m=n&num_id=8238&t=616 (accessed on 20 April 2023).
- Gonzalez-Perez, C. Vagueness. In Information Modelling for Archaeology and Anthropology; Springer: Cham, Switzerland, 2018. [Google Scholar] [CrossRef]
- Tobalina-Pulido, L.; González-Pérez, C. Valoración de la calidad de los datos arqueológicos a través de la gestión de su vaguedad. Aplicación al estudio del poblamiento tardorromano. Complutum 2020, 31, 343–360. [Google Scholar] [CrossRef]
- Windhager, F.; Federico, P.; Schreder, G.; Glinka, K.; Dork, M.; Miksch, S.; Mayr, E. Visualization of Cultural Heritage Collection Data: State of the Art and Future Challenges. IEEE Trans. Vis. Comput. Graph. 2018, 25, 2311–2330. [Google Scholar] [CrossRef] [PubMed]
- Windhager, F.; Filipov, V.; Salisu, S.; Mayr, E. Visualizing Uncertainty in Cultural Heritage Collection. In Proceedings of the EuroVis Workshop on Reproducibility, Verification, and Validation in Visualization (EuroRV3), Brno, Czech Republic, 4 June 2018; Eurographics Association: Brno, Czech Republic, 2018; p. 5. [Google Scholar] [CrossRef]
- Deufemia, V.; Paolino, L.; Tortora, G.; Traverso, A.; Mascardi, V.; Ancona, M.; Martelli, M.; Bianchi, N.; De Lumley, H. Investigative analysis across documents and drawings: Visual analytics for archaeologists. In Proceedings of the International Working Conference on Advanced Visual Interfaces (AVI ‘12), Capri Island, Italy, 21–25 May 2012; Association for Computing Machinery: New York, NY, USA, 2012; pp. 539–546. [Google Scholar] [CrossRef]
- Hinton, S.; Whitelaw, M. Exploring the digital commons: An approach to the visualisation of large heritage datasets. In Proceedings of the Electronic Visualisation and the Arts (EVA 2010) (EVA), London, UK, 5–7 July 2010. [Google Scholar] [CrossRef]
- Zerbini, A. Developing a Heritage Database for the Middle East and North Africa. J. Field Archaeol. 2018, 43, S9–S18. [Google Scholar] [CrossRef]
- Dietmar, A. The Chronas Project. Available online: https://chronas.org (accessed on 20 April 2023).
- Bolivar, H.; González, R.; Sanjuán, O. Ontology of a scene base don Java 3D architecture. Int. J. Interact. Multimed. Artif. Intell. 2009, 1, 14–19. [Google Scholar]
- Polowinski, J.; Voigt, M. VISO: A shared, formal knowledge base as a foundation for semi-automatic infovis systems. In CHI’13 Extended Abstracts on Human Factors in Computing Systems; Association for Computing Machinery: New York, NY, USA, 2013; pp. 1791–1796. [Google Scholar]
- Polowinski, J. Towards RVL: A Declarative Language for Visualizing RDFS/OWL Data. In Proceedings of the 3rd International Conference on Web Intelligence, Mining and Semantics, Madrid, Spain, 12–14 June 2013; pp. 1–11. [Google Scholar] [CrossRef]
- Sobral, T.; Galvão, T.; Borges, J. An Ontology-based approach to Knowledge-assisted Integration and Visualization of Urban Mobility Data. Expert Syst. Appl. 2020, 150, 113260. [Google Scholar] [CrossRef]
- Hengl, T.; Roudier, P.; Beaudette, D.; Pebesma, E. plotKML: Scientific Visualization of Spatio-Temporal Data. J. Stat. Softw. 2015, 63, 1–25. [Google Scholar] [CrossRef]
- Jaffali, S.; Jamoussi, S.; Kheli, N.; Hamadou, A.B. Survey on Social Networks Data Analisys. In Innovations for Community Services; Springer International Publishing: Cham, Switzerland, 2020; pp. 100–119. [Google Scholar] [CrossRef]
- Zhong, C.; Wang, T.; Zeng, W.; Arisona, S.M. Spatiotemporal Visualisation: A Survey and Outlook. In Digital Urban Modeling and Simulation; Springer: Berlin/Heidelberg, Germany, 2012; pp. 299–317. [Google Scholar] [CrossRef]
- Zheng, K.; Gu, D.; Fang, F.; Wang, Y.; Liu, H.; Zhao, W.; Zhang, M.; Li, Q. Visualization of spatio-temporal relations in movement event using multi-view. ISPRS Int. Arch. Photogramm. Remote. Sens. Spat. Inf. Sci. 2017, XLII-2/W7, 1469–1476. [Google Scholar] [CrossRef]
- Bekiari, C.; Bruseker, G.; Doerr, M.; Ore, C.E.; Stead, S.; Velios, A. Definition of the CIDOC Conceptual Reference Model v7.1.1; The CIDOC Conceptual Reference Model Special Interest Group, 2021; Available online: https://cidoc-crm.org/Resources/definition-of-the-cidoc-conceptual-reference-model-v7.1.1 (accessed on 20 April 2023). [CrossRef]
- Pu, J.; Teng, Z.; Gong, R.; Wen, C.; Xu, Y. Sci-Fin: Visual Mining Spatial and Temporal Behavior Features from Social Media. Sensors 2016, 16, 2194. [Google Scholar] [CrossRef] [PubMed]
- Corcho, O.; Fernández-López, M.; Gómez-Pérez, A.; López-Cima, A. Building Legal Ontologies with METHONTOLOGY and WebODE. In Law and the Semantic Web. Lecture Notes in Computer Science; Benjamins, V.R., Casanovas, P., Breuker, J., Gangemi, A., Eds.; Springer: Berlin/Heidelberg, Germany, 2005; Volume 3369. [Google Scholar] [CrossRef]
- Sevilla, J. STEVO Ontology. Available online: https://github.com/javier-sevilla/STEVO (accessed on 20 April 2023).
- W3C. Time Ontology in OWL. 2020. Available online: https://www.w3.org/TR/owl-time/ (accessed on 20 April 2023).
- Abadie, N.; Atemeizing, A. Ontology of Coordinates Reference Systems. 2015. Available online: http://data.ign.fr/def/ignf/20150505.en.htm#classes (accessed on 20 April 2023).
- Unity3D Home Page. Available online: https://www.unity.com (accessed on 20 April 2023).
- Sevilla, J.; Samper, J.J.; Fernández, M. Visualización del Contenido de Grafos de Conocimiento del Patrimonio Cultural. Phd. Available online: https://roderic.uv.es/handle/10550/83829 (accessed on 20 April 2023).
- Brooke, J. SUS: A retrospective. J. Usability Stud. 2013, 8, 29–40. [Google Scholar]
- Silknow Web. 2022. Available online: https://silknow.eu (accessed on 22 April 2023).
- Crealab Web. 2022. Available online: https://www.uv.es/crealab/ (accessed on 22 April 2023).
- Google. Service Worker. 2022. Available online: https://developers.google.com/web/fundamentals/primers/service-workers (accessed on 22 April 2023).


Disclaimer/Publisher’s Note: The statements, opinions and data contained in all publications are solely those of the individual author(s) and contributor(s) and not of MDPI and/or the editor(s). MDPI and/or the editor(s) disclaim responsibility for any injury to people or property resulting from any ideas, methods, instructions or products referred to in the content. |
© 2023 by the authors. Licensee MDPI, Basel, Switzerland. This article is an open access article distributed under the terms and conditions of the Creative Commons Attribution (CC BY) license (https://creativecommons.org/licenses/by/4.0/).
Share and Cite
Sevilla, J.; Samper, J.J.; Fernández, M.; León, A. Ontology and Software Tools for the Formalization of the Visualisation of Cultural Heritage Knowledge Graphs. Heritage 2023, 6, 4722-4736. https://doi.org/10.3390/heritage6060251
Sevilla J, Samper JJ, Fernández M, León A. Ontology and Software Tools for the Formalization of the Visualisation of Cultural Heritage Knowledge Graphs. Heritage. 2023; 6(6):4722-4736. https://doi.org/10.3390/heritage6060251
Chicago/Turabian StyleSevilla, Javier, Jose Javier Samper, Marcos Fernández, and Arabella León. 2023. "Ontology and Software Tools for the Formalization of the Visualisation of Cultural Heritage Knowledge Graphs" Heritage 6, no. 6: 4722-4736. https://doi.org/10.3390/heritage6060251
APA StyleSevilla, J., Samper, J. J., Fernández, M., & León, A. (2023). Ontology and Software Tools for the Formalization of the Visualisation of Cultural Heritage Knowledge Graphs. Heritage, 6(6), 4722-4736. https://doi.org/10.3390/heritage6060251