1. Introduction
This novel, simple but effective model, using only an Excel spreadsheet, was developed by conservators working with environmental scientists, for use in historic buildings in the UK, as a means of promoting preventive conservation and housekeeping standards, and ensuring that the care of interiors and collections remains both physically and economically sustainable. It was initially devised in response to the challenge of determining appropriate staffing levels in properties which were welcoming ever-increasing numbers of visitors, and where staff needed sufficient time, skills and resources to care for historic interiors and collections. The model evolved over several years, becoming more sophisticated with time and external advice, and is easily adapted for use in other heritage buildings, museums and galleries with collections on open display.
The practice of preventive conservation was introduced to historic houses in the late 1970s [
1]. Based on traditional housekeeping practices documented since the eighteenth century, these were updated with conservation science used in national museums and galleries. In the 1990s, the preventive conservation framework devised by the Canadian Conservation Institute [
2,
3] was adopted, and further developments in collective knowledge, skills and experience led to the publication of a much-expanded ‘National Trust Manual of Housekeeping—care and conservation of collections in historic houses’ [
4].
In 2000, a research partnership was formed between English Heritage, Historic Royal Palaces, the National Trust and the University of East Anglia Environmental Sciences, initially funded by the Leverhulme Trust, to investigate ‘Controls on Irreversible Soiling’ in historic buildings open to visitors [
5,
6]; this work built on earlier studies of coarse particulate soiling in museums [
7,
8,
9]. The research studied the effect of visitors on dust in historic collections [
10], and the consequent impacts of dust on the care and management of collections [
11], dust in historic libraries [
12], staff and visitor perceptions of dust [
13,
14,
15,
16,
17], the economics of dust [
18], and causes of cementation [
19,
20]. The work concluded with guidance on low-technology methods of monitoring dust deposition [
21] and a dust atlas enabling the identification of coarse dust particles [
22].
Research outcomes provided scientific evidence to support housekeeping policies and practices, adding authority to the associated advice and guidance. Conservators are now better equipped to make rational assessments of the cleaning time for historic interiors of all shapes and sizes, ranging from small closets to long galleries; these spaces display collections of diverse fragility and significance, from robust brown furniture to decaying silk curtains, and from unique tapestries and state beds to assorted ephemera.
Heritage organisations have always been aware of the need to balance access and preservation. For example, John Bailey, chairman of the National Trust in 1923-31, said: ”Preservation may always permit of access, while without preservation access becomes for ever impossible” [
23]. In 2005, its responsibilities for care of land, buildings and nature were redefined: “Conservation is the careful management of change; it is about revealing and sharing the significance of places and ensuring that their special qualities are protected, enhanced, enjoyed and understood by present and future generations” [
24]. This twenty-first century definition enshrines the Trust’s dual purposes (of preservation and public benefit), supports the ongoing need to achieve a sustainable balance between preservation and access, and emphasises the positive contribution which conservation makes to enabling access.
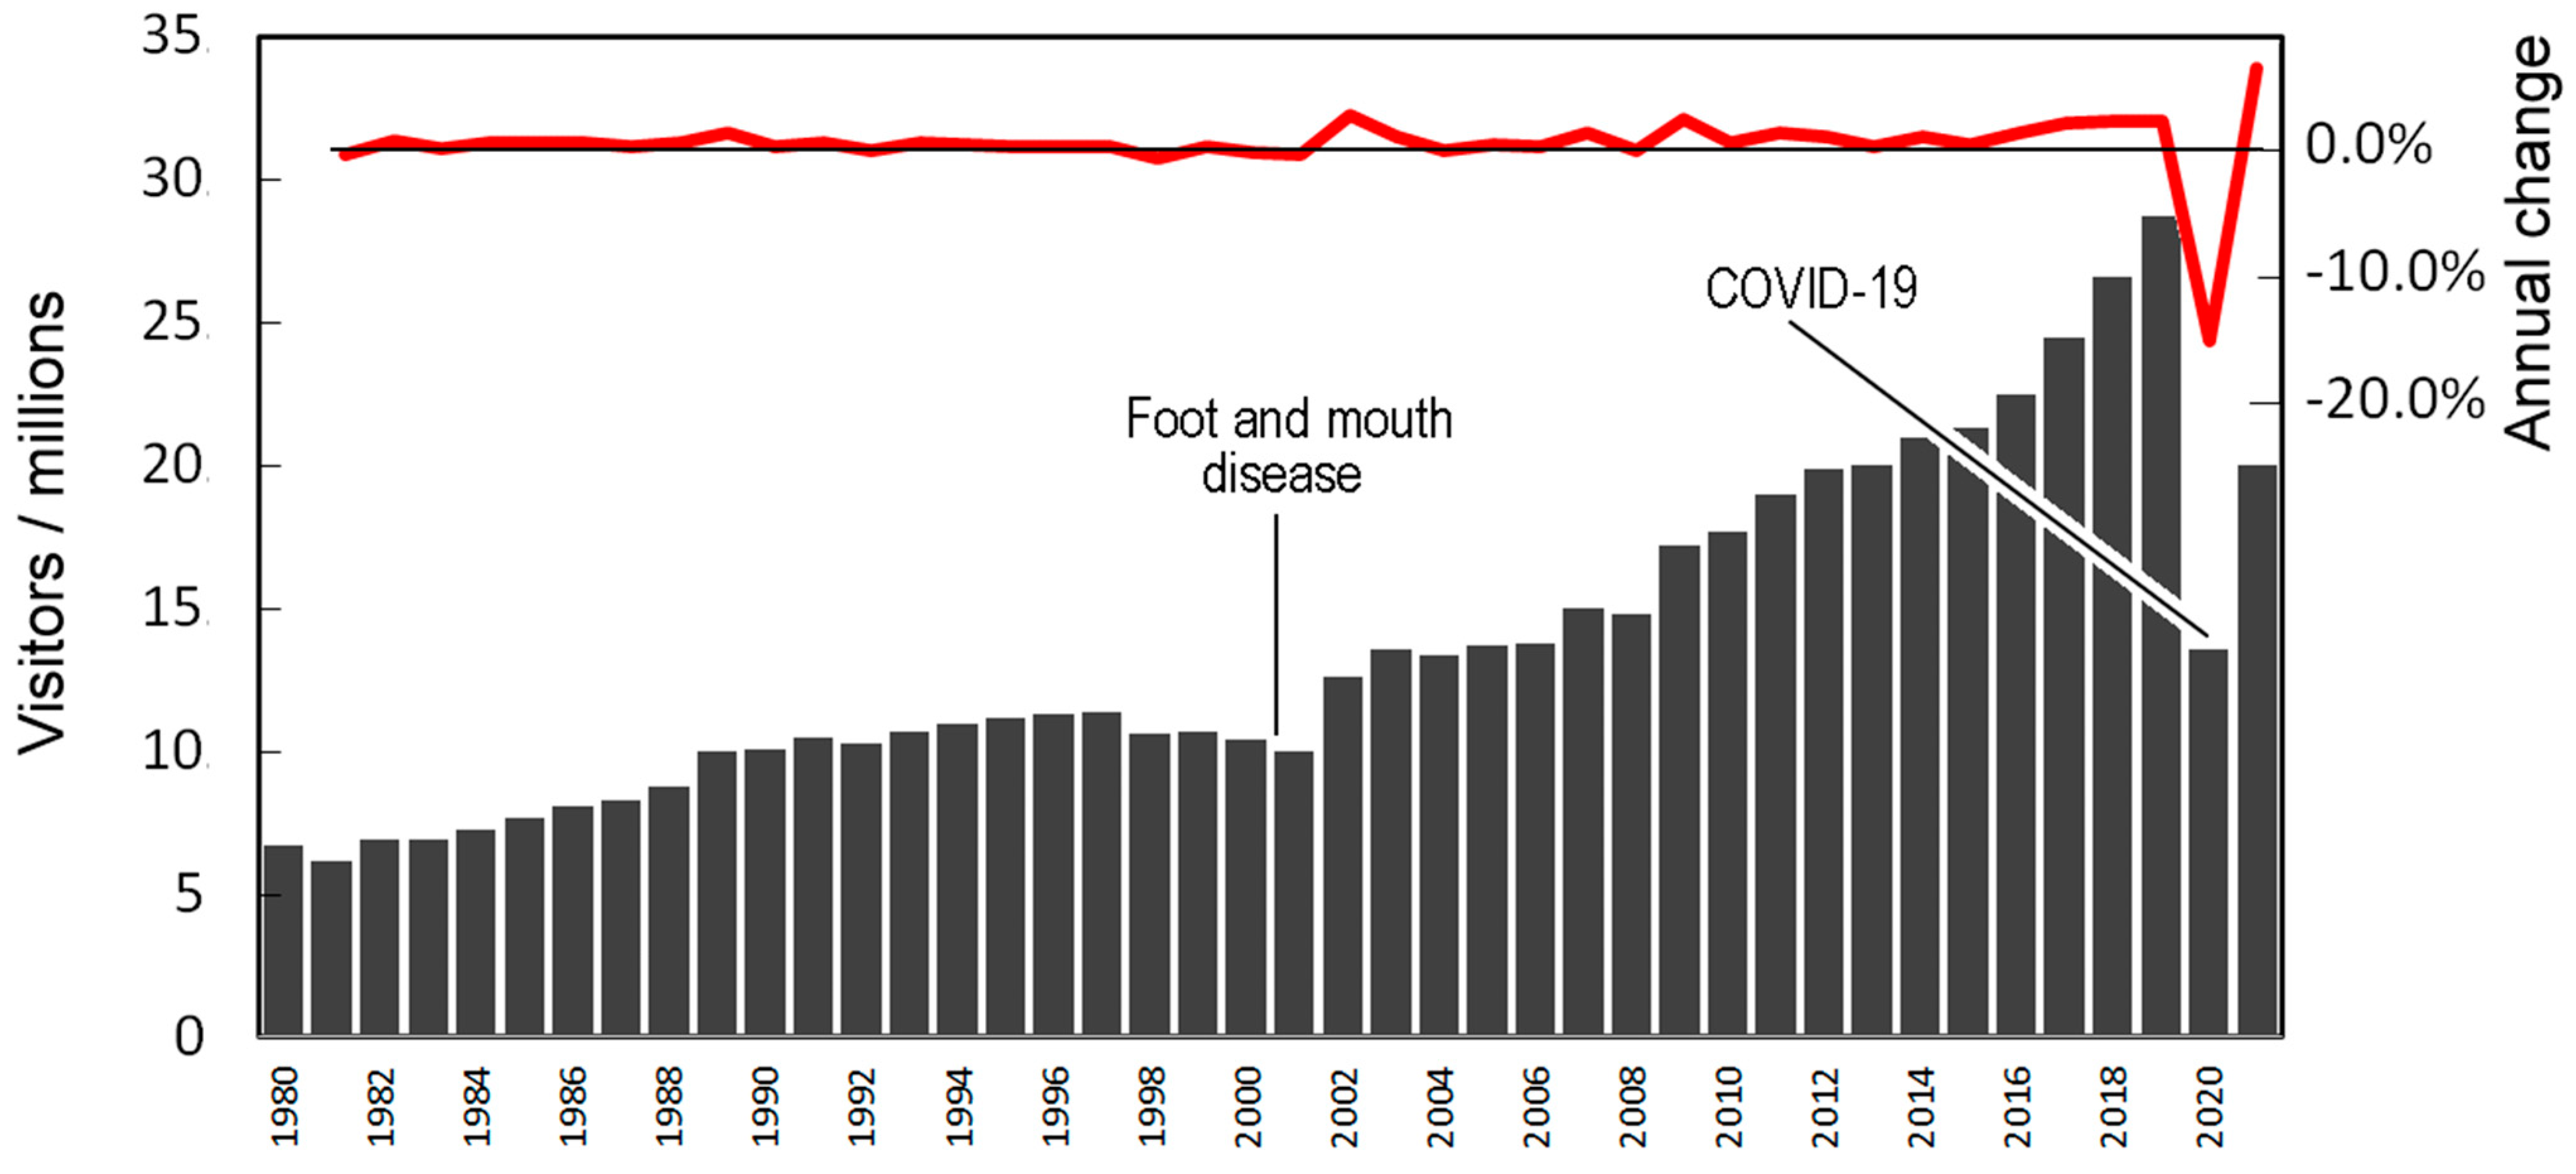
However, since the 1970s, the volume of visitors desiring access to heritage sites, both outdoors and indoors, has grown steadily (
Figure 1). Over 40 years, access to historic interiors has increased dramatically—not only in the numbers of people, but also in the hours of opening—thus reducing the time available for collections care, and exposing furnishings to more hours of daylight, and greater rates of dust deposition [
25].
For example, from 1980–2020, National Trust properties as a whole experienced a five-fold increase in visitor numbers. Houses, at first open to the public for six months in spring and summer, for five days a week, four hours a day, and closed for six months in autumn and winter, could expect to welcome 20,000–50,000 visitors each year. In the twenty-first century, many houses are open for 10–12 months a year, from February to November and over Christmas/New Year, for 6–7 days a week and 6–7 h a day; they now anticipate between 50,000 and 150,000 annual visitors.
This increase prompted the senior staff responsible for gardens, houses and visitor services to collaborate with property managers to devise a method of assessing the impact of public access on the management of each property. Together they created processes by which the impacts of changing access and the accompanying need for conservation resources could be measured objectively, thus supporting a sustainable balance between staffing, visitors, conservation and costs. Since 2005 a ‘Conservation for Access’ toolkit has been used by properties which plan to change their hours, days and months of access [
26,
27]. In essence, the toolkit prompts property managers and regional consultants to assess the current levels of staffing, and hours committed to housekeeping and/or gardening, and promotes the cost-benefit of increasing these resources in response to higher visitor numbers.
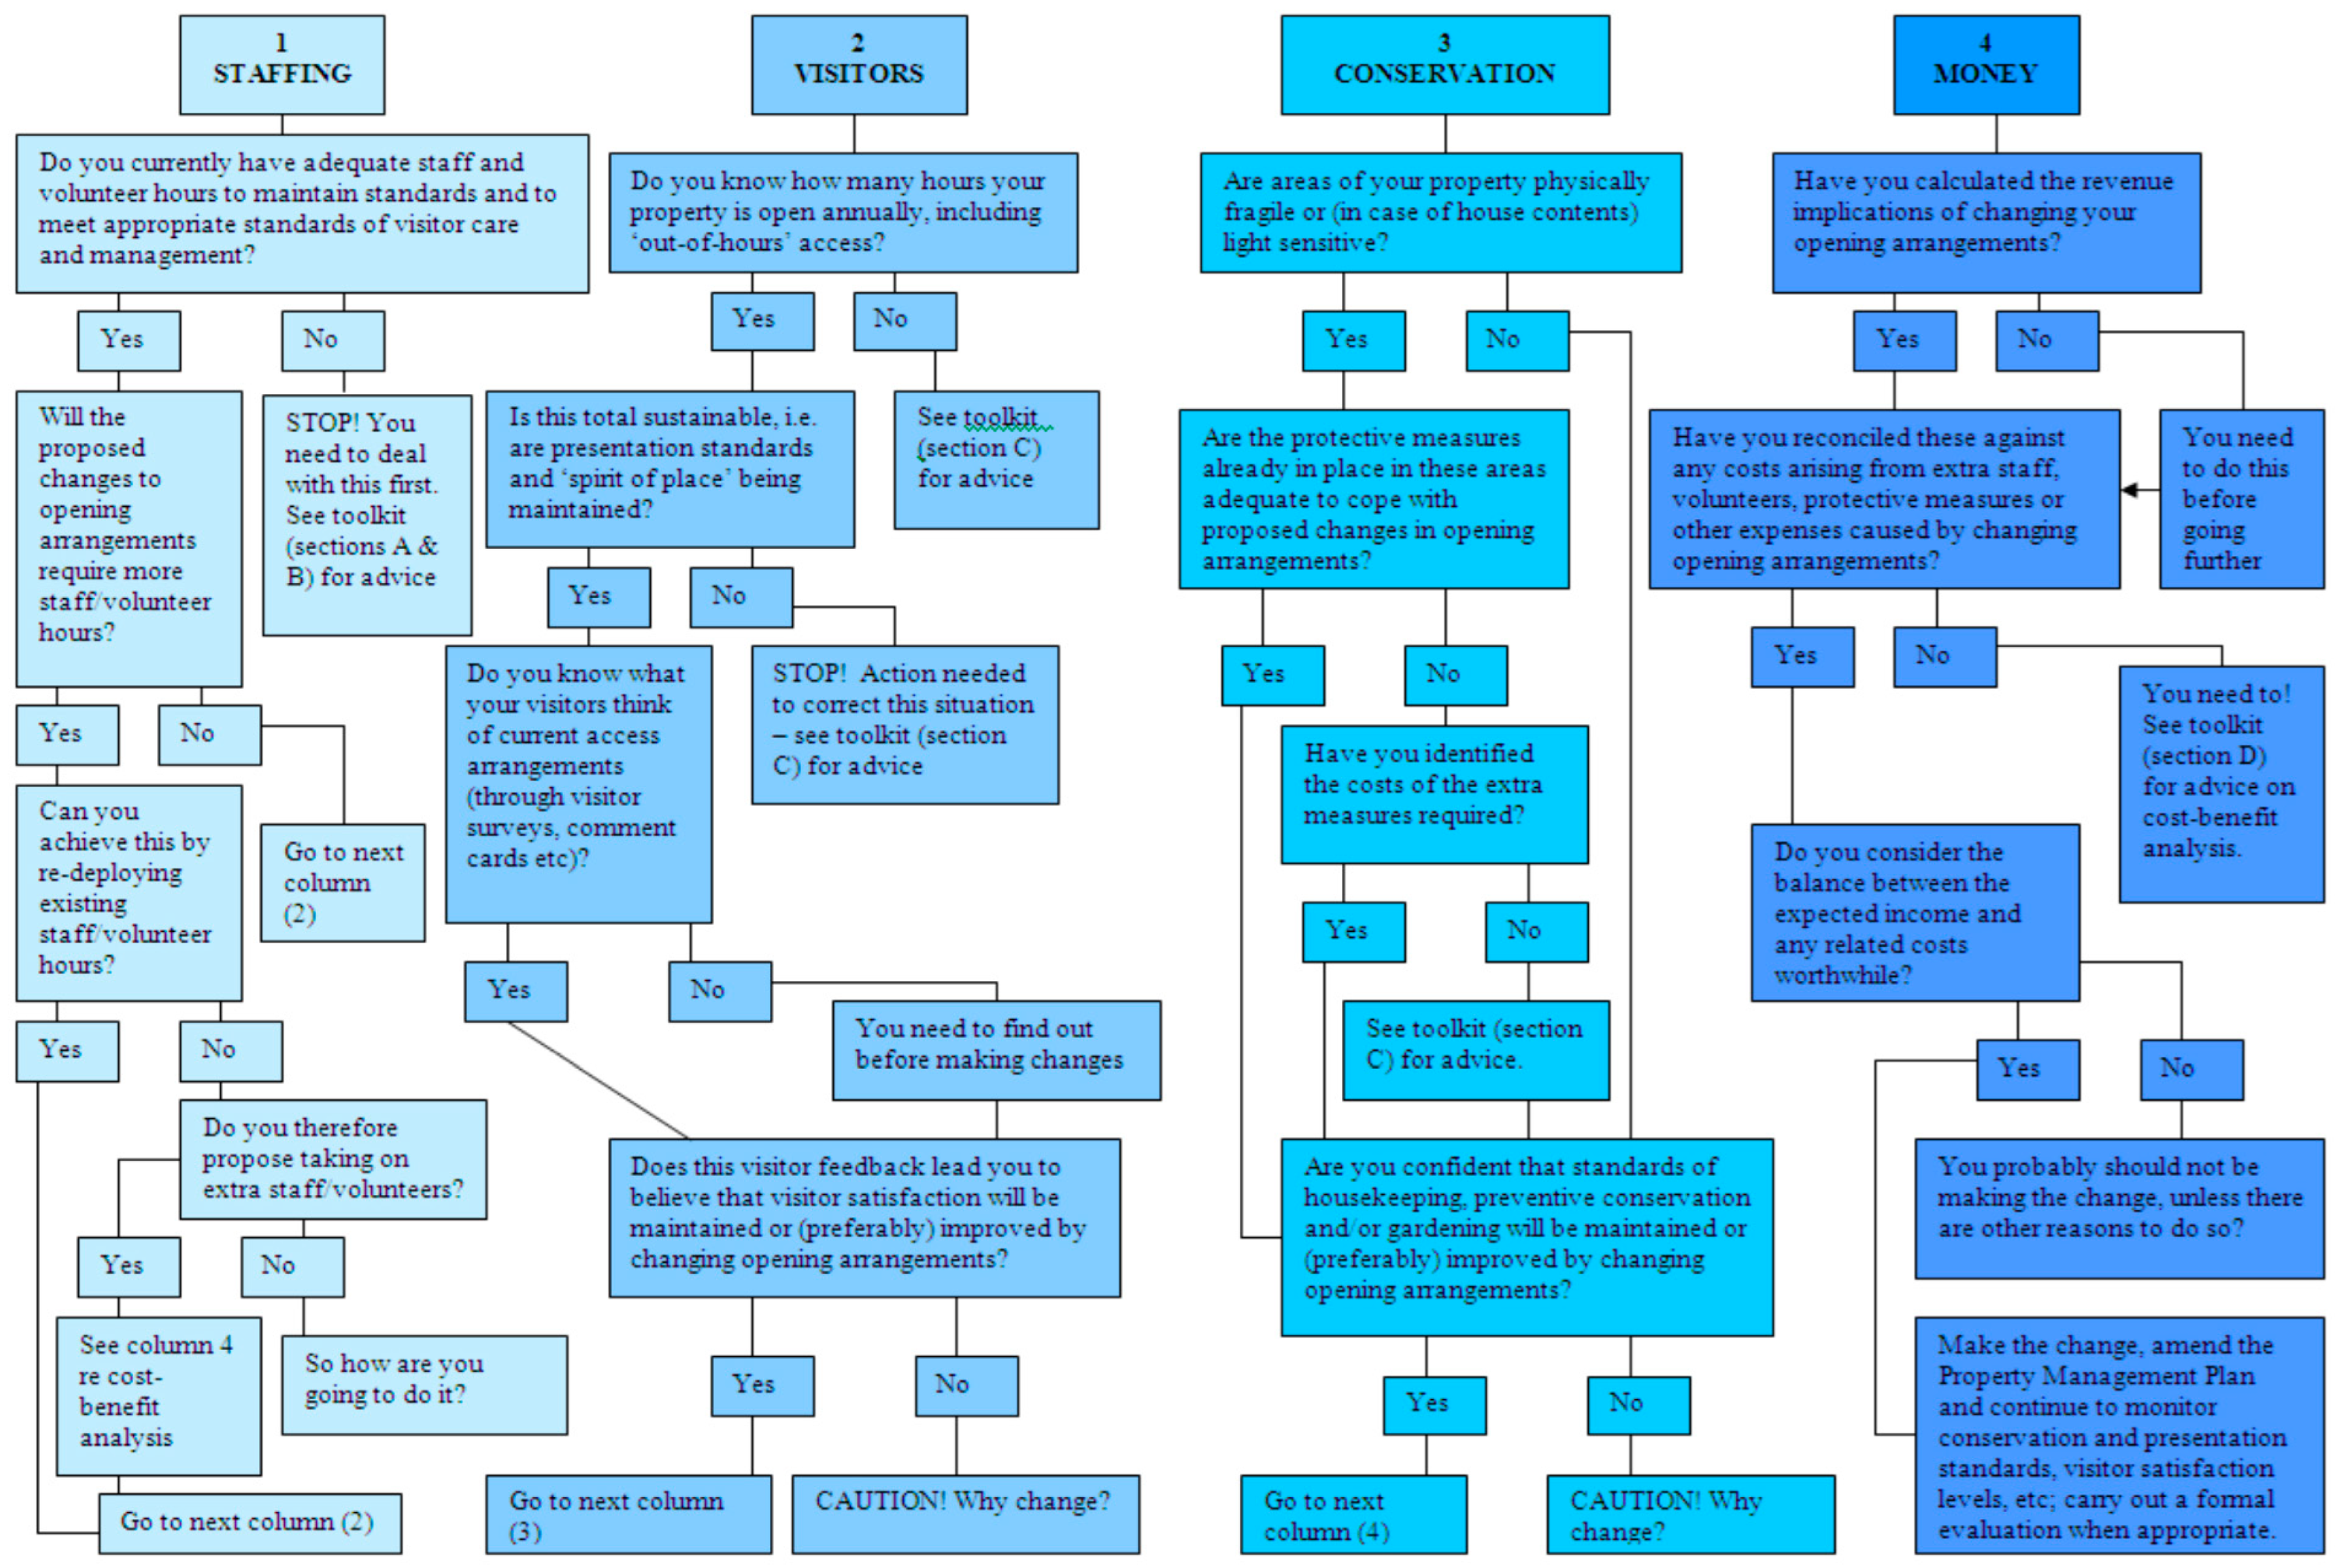
Worksheets have been used to compare the current numbers of visitors and hours of access with the capacity of each space to accommodate more; additionally, to measure the peaks and troughs of visitor entry flow and assess the effect of overcrowding on visitors’ experience and enjoyment, as well as the physical impact on the building/landscape and fragile materials/plants. In interiors, the toolkit assesses the condition and fragility of the collections, and the sensitivity of materials to light exposure, together with the costs of protection measures, and of maintaining the standards of housekeeping and preventive conservation. And last, but not least, the toolkit compares the costs of changing access with the potential for increased revenue, and estimates the budgetary requirements to make conservation sustainable. The flowchart decision tree enables property staff to determine which parts of the ‘Conservation for Access’ toolkit it will be most useful for them to complete [
28,
29] (
Figure 2).
It is relatively straightforward to count the number of visitors who can be accommodated in each space at one time, without risk of physical damage to furnishings or detriment to their experience; then an entry flow rate can be calculated, which ensures this capacity is not exceeded [
29]. It is also possible to calculate the annual hours of light exposure, using blue wool dosimeters and data loggers [
30].
However, it is less easy to assess how many housekeeping hours are required daily to remove the dust deposited on the furnishings by yesterday’s visitors. The rate of deposition relates directly to the number of people and their proximity to the collections, but the frequency of cleaning varies with the fragility of materials and their proximity to visitors [
10].
A simple model was needed, which could account for the significance and fragility of each house, the diversity of its collections and complexity of their needs for care, the size of its inventory and library, the number of spaces accessible to visitors, the total annual visitors and hours of access, and weekly hours needed to clean its spaces and collections on open display. Ideally, the model would also help to estimate the non-wage costs of preventive conservation in historic properties; this calculation would set realistic targets for annual budgets at each place, and support a proportionate distribution of available resources between properties.
Over two decades, an operations model evolved, the quality and quantity of data improved, calculations became more sophisticated, and further uses were developed in response to conservation management challenges. This article describes its uses at many stages of evolution from simple to more complex; the data is, therefore, occasionally inconsistent between the tables, which illustrate calculations made at different times for a variety of purposes and properties.
The model sets out to quantify the ‘dimensions’ of the housekeeping challenge at each property, and is thus known as the Dimensions model. Its purpose is to introduce both facts and fairness into conservation recommendations and management decisions: how many collections care staff should each historic house employ, and how large an annual budget is required to fund non-wage costs of preventive and interventive in situ conservation? How could central advice on staffing structures be made consistent and rational, yet tailored to the individual and developing circumstances of each property?
The Dimensions model has also been used to monitor and rate conservation performance, for example, how well house teams are meeting their target of cleaning hours per week, as part of a wider property conservation performance review [
31]. A further use has been to estimate the scale of budget needed by each property for preventive conservation equipment and materials, and to allocate fairly between properties the resources for routine maintenance and cyclical in situ treatments by freelance conservators [
32].
2. Method
Every historic property is unique, and offers a different amount of access, to a variable number of interiors with more or less dense displays of collections, some fragile and others robust. The aim was simply to find a way to understand, quantify and rationalise the factors which influence resource needs for the diverse interiors and collections found in a national collection of 360 historic properties, of which 160 contain libraries.
The model evolved as an iterative process over two decades, and was tested at every stage by national and regional conservators, validating the outcomes against their practical experience of working with staff in a wide range of historic houses. Initially, the method was largely intuitive and experimental, as there was no existing internal or external benchmark against which the process could be measured, nor another model to follow.
Eight criteria for measurement were selected:
four qualitative: significance, fragility, complexity of interiors and collections, and average of the significance and size of library;
four quantitative: size of inventory, number of historic spaces, annual visitors, and the hours of access.
Initially, the ranges for each criterium were estimated, and each property given rough scores of 1 to 4, where 1 was low and 4 was high. The 1–4 scoring was chosen to encourage decisiveness in allocating qualitative scores, and to prevent overloading of the central value. A larger number would have made choices difficult, and an uneven number of, say 1–5, could have produced too many scores of 3, on the cusp between high and low.
Qualitative assessments were made by comparing individual properties with their neighbours; quantitative data for each criterion was obtainable from individual properties, but not yet centrally collated. Regional conservators obtained the data for properties in each region, and their qualitative scores were moderated by a national conservator (familiar with all the properties), to ensure equity within and between the diverse regional portfolios of properties.
2.1. Criteria and Simple Methods of Scoring
After adding the scores for each property, and converting the total to a percentage of the maximum possible score, the properties can then be ranked in descending order of percentage score, revealing the diversity of the housekeeping challenge presented by each property, from the largest to smallest.
2.2. Fine-Tuning the Ranges and Calculations
The initial simple scoring system was useful, and offers a good starting point when adapting the model for use in other circumstances (e.g., museums, galleries, churches, private historic houses and other heritage buildings). However, initial results demonstrated that many quantitative criteria were under-represented; to achieve results more evenly distributed across a nationwide portfolio of collections, the ranges needed adjustment. With the full scope of quantitative data now evident, it was decided to abandon simple 1–4 scores, in favour of accurate calculations to two decimal points, as a proportion of the maximum for each range.
Table 1 tabulates the revised ranges.
2.3. Fine-Tuning the Structure of the Spreadsheet (Quality and Quantity)
The Excel spreadsheet is now subdivided into several sections, with the first two summarizing quality and quantity. Some quantitative factors, such as inventory and library sizes, and the annual hours of access, have extensive ranges by comparison with the 1–4 scale adopted for qualitative and other factors. A logarithmic calculation now represents these larger ranges, using scores from 0–4, comparable with the other factors.
2.4. Fine-Tuning Historic Spaces as Cleaning Units
The sizes of rooms in historic houses vary widely, from an intimate closet to a long gallery. The density and fragility of each room’s furnishings influence the extent of daily cleaning required, in response to the number of visitors and their proximity to the collections, both factors which influence the rate of coarse dust deposition [
10,
11,
12].
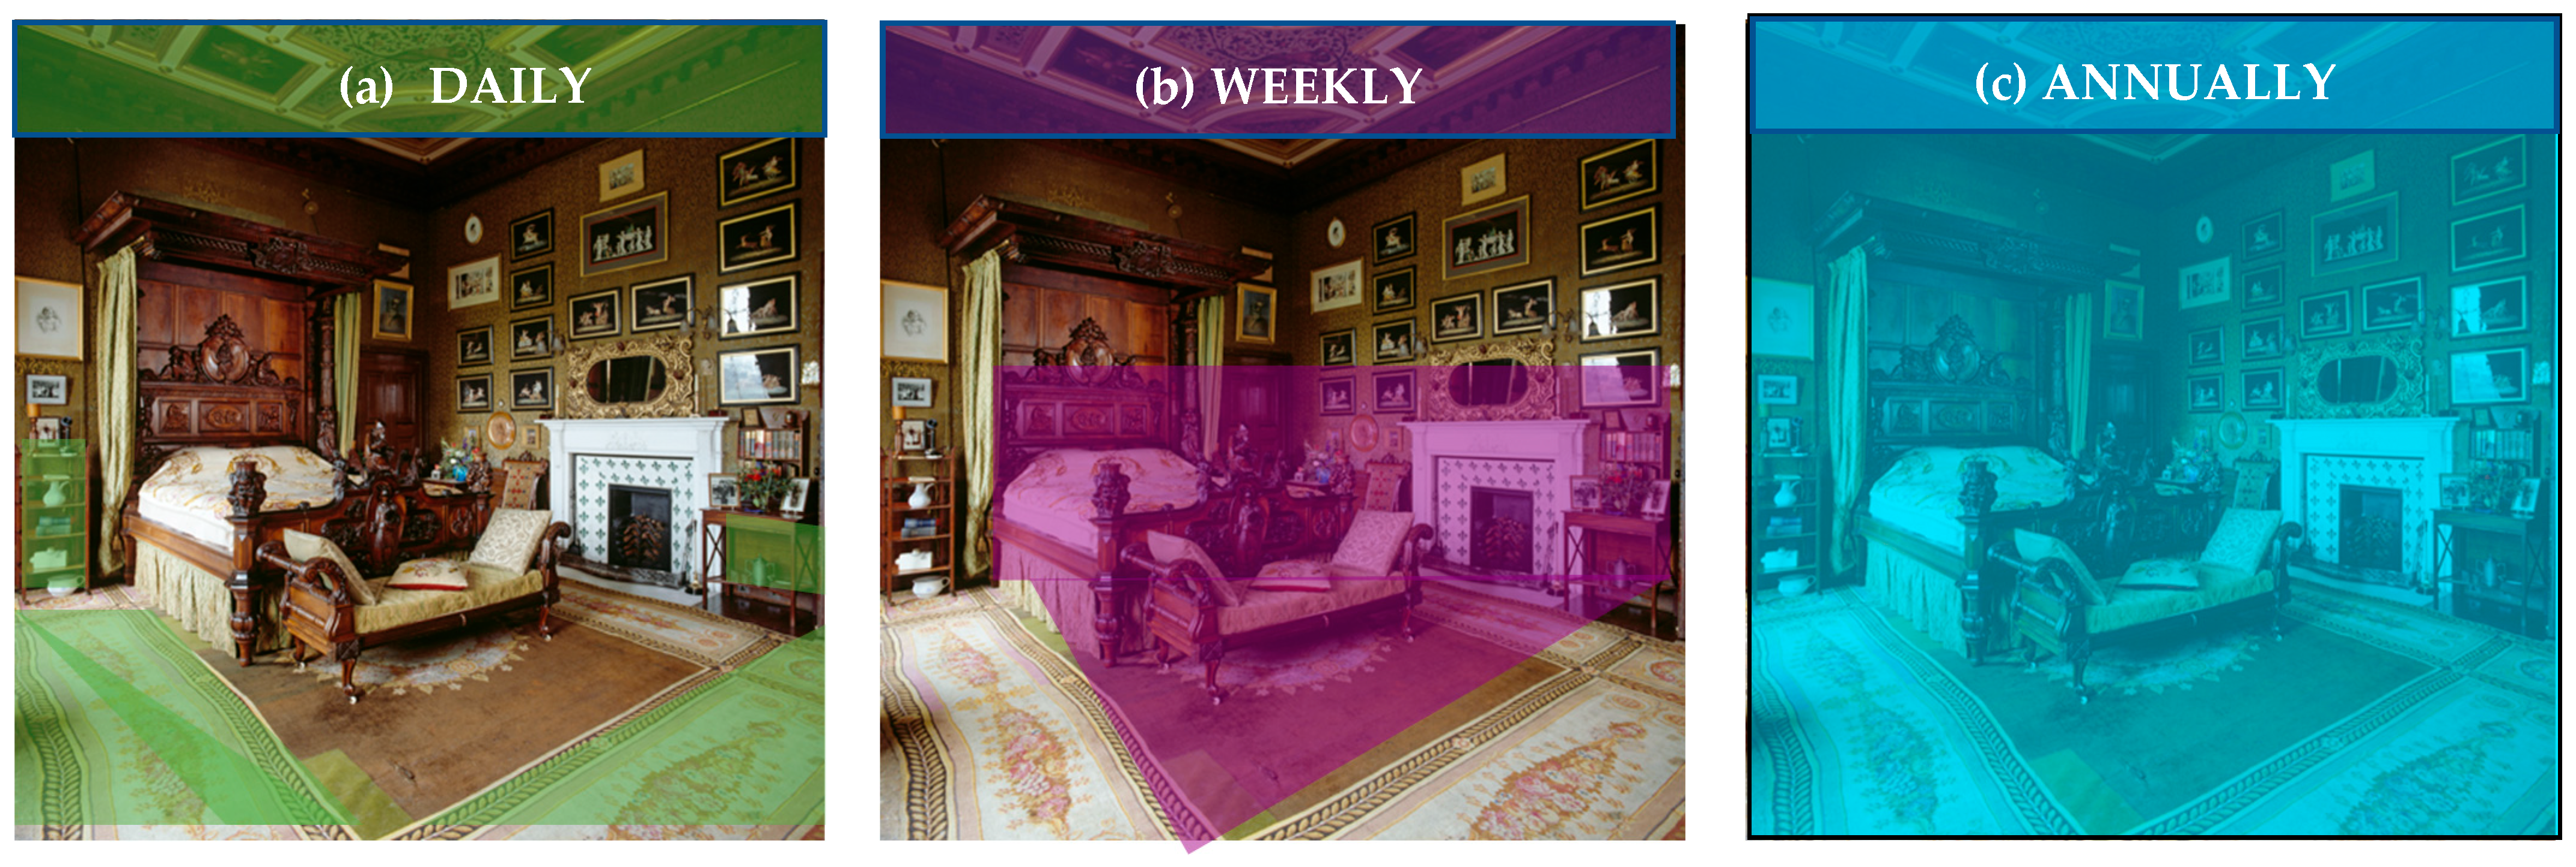
Conservators generally recommend that daily cleaning in historic interiors is restricted to vacuuming of every robust floor surface on which visitors have walked, and removing dust particles from robust horizontal surfaces within sight of the visitor route. Weekly cleaning routines tackle 2–3 rooms each week in rotation, cleaning vertical surfaces up to head height, and horizontal surfaces further from the visitor route, wherever particles are visibly accumulating and undermining standards of presentation [
36,
37].
Annual ‘spring’ or ‘deep’ cleaning includes inspection, monitoring and, where necessary, cleaning of all surfaces—from ceilings and cornices via the walls and windows to the floor—also paying attention to surfaces usually concealed behind paintings, wall hangings and furniture, and beneath carpets. The purpose is to remove accumulations of dust and reduce the risk of particles becoming cemented to surfaces and thus requiring more interventive—and expensive—removal by specialist conservators using more sophisticated skills [
19,
20,
32]. Annual deep cleaning also includes detailed cleaning (e.g., inside, outside, behind and beneath) of individual portable items of furniture, upholstery, ceramics, metalwork and decorative objects; this latter work may be undertaken at any time of year, often in front of visitors, to engage their interest in traditional housekeeping methods, and in the benefits of using preventive conservation techniques and materials to improve collections care.
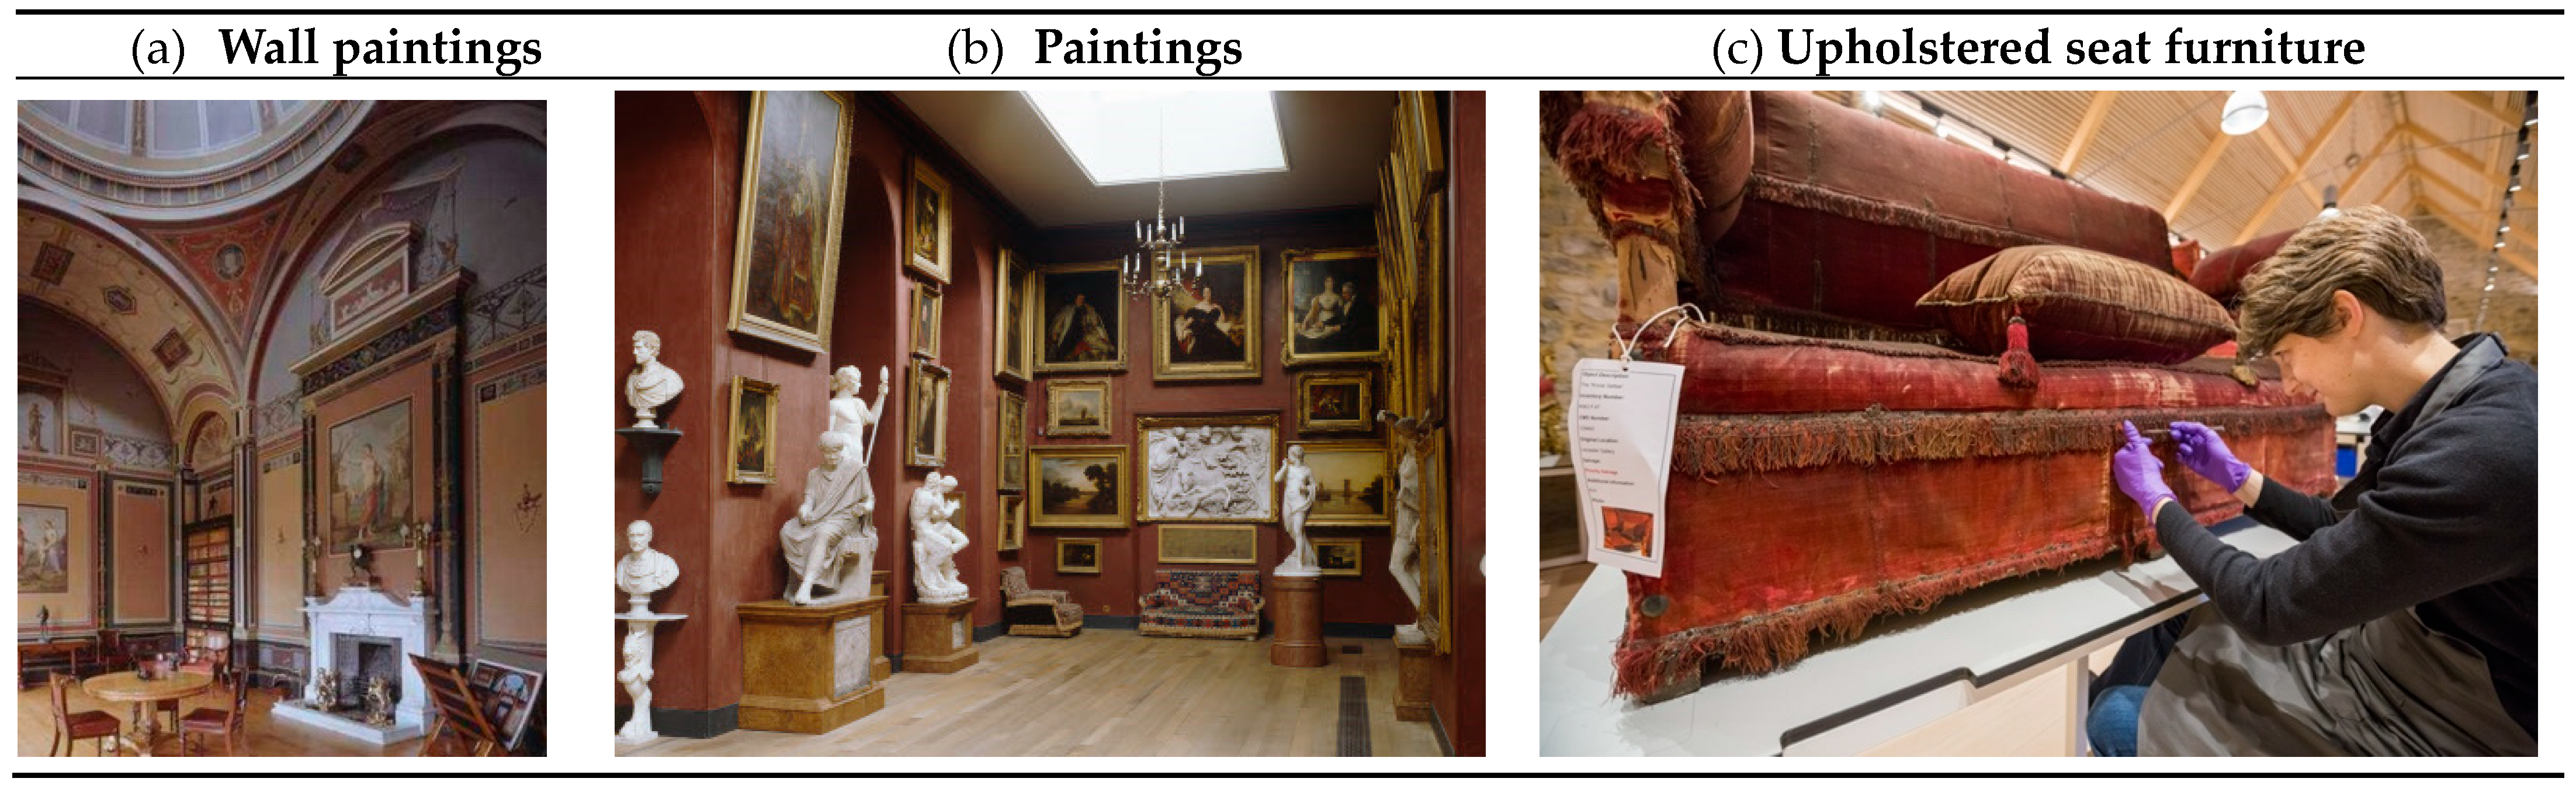
Figure 3a–c illustrates how resources for cleaning are allocated in proportion to the distribution of furnishings and extent of public access, in Mr Bankes’ Bedroom at Kingston Lacy in Dorset:
Initially, a ‘rule of thumb’ was used to assess the cleaning time needed for each historic space. Experience of cleaning heavily-visited houses over three decades (prior to the COVID SARS-2 pandemic in 2020) suggested that, on average, 20 min/day are required to clean those parts of each room accessed daily by visitors; an equal amount of time is needed weekly on closed days to clean areas not accessed by visitors, but where coarse dust will accumulate and become visible, if not occasionally removed. These 20 min are counted ‘from door to door’, in other words from the moment a room is entered (including opening shutters and blinds and plugging in vacuum cleaners) to the moment when a room is vacated (cleaning completed, equipment and tools collected, shutters and blinds closed). For the ‘rule of thumb’ to work, every accessible space must be counted, irrespective of size and density of furnishings—including every porch, lobby, closet, landing, flight of stairs, corridor and passage along the visitor route [
37].
It is important to emphasise here that the average of 20 min cleaning per space is indicative, not an absolute; the model can be adjusted to suit different circumstances, for example where more or less access—temporal and/or spatial—is offered to a building, its interiors, and its collections. Pictures hanging in galleries, or collections protected within glazed cabinets in museums, might require a different allocation of time per space; similarly in cathedrals and churches where access for worship and tourism follows a variable weekly pattern; and in private houses where the needs of the residents parallel those of the collections and the visitors. The number of visitors per day will also influence the rate of dust deposition and frequency of need for cleaning [
10]. In every case, it is helpful for the house team to undertake a time-and-motion study, testing the allocation of time per space to verify that it has not been over- or under-estimated.
Following the research into ‘Controls on irreversible soiling’ [
5,
6,
10,
11,
12,
13,
14,
15,
16,
17,
18,
19,
20,
21,
22], and a greater understanding of the sources and distribution of coarse dust in response to the number of visitors and their proximity to collections, the cleaning schedules were refined. Cleaning resources were allocated more precisely, in proportion to the size of each room, the area accessible to visitors, and the fragility and density of its furnishings and collections. Staffing resources for routine housekeeping are now counted as ‘cleaning units’, with each unit requiring just 20 min of one person’s input per day.
An Excel worksheet, from the ‘Conservation for Access’ toolkit, is used by house teams and conservators to fine tune the ‘rule of thumb’ assessment, allocating more precise timings to each individual space [
26]. For example, a closet might require a 0.25 cleaning unit per day (5 min), whereas 9 units (3 h) might be needed to vacuum a long gallery whose area is equivalent to 9 large rooms on an adjacent floor. A large, densely-furnished room with a drugget walkway over a fragile carpet and barrier ropes to prevent visitors straying, might require 2 units (40 min) per day, whereas a sparsely furnished hall of a similar size, allowing unrestricted visitor access, might need 4–6 units of time to vacuum the wood or stone floor and remove dust from robust furniture (80–120 min).
The resulting daily total is the indicative time needed for cleaning the house, but it is only sufficient if every member of the team is present every day. There are many reasons for absence—holidays, sickness, meetings, training, etc—and it is essential to recognise that many houses now open to visitors on six or seven days per week, whereas staff are generally employed for only five days. To create enough flexibility in the weekly rota to compensate for staff absences, the cleaning time per day should be increased to an average of 30 min per room or cleaning unit; this generates a more realistic and sustainable outcome. This ‘optimum’ allowance of time (30 min) enables the construction of a staffing rota to deliver sufficient cleaning time every day, and, therefore, ensures sustainable housekeeping practices for the long term. See the Supplementary for sample staff rotas for details of these calculations, and sample staff rotas for five- and seven-day working weeks (
Table S1a–c). Where houses are closed to visitors during the winter months, cleaning hours can be consolidated into a five-day working week.
3. Results
The length and breadth of the Excel spreadsheet used by the Dimensions model makes illustration in its entirety difficult; therefore, the text describes the calculations used in each section of the model.
3.1. Quality
The first section of the model calculates the Quality factor. The working assumption is that each factor has roughly the same weighting, to avoid biasing one factor over another. The calculation takes the scores for the significance, fragility and complexity of interiors and collections, to which it adds an average of the two scores for the size and significance of the library. It calculates the number of volumes in libraries where only the number of titles is known, and the logarithmic adjustment to fit within the 0–4 scale. The calculation can be summarised as:
| | Interiors and Collections | Library | |
| Quality =
|
(significance + fragility + complexity) +
|
(significance + log of volumes)
| / 4 |
| | | 2 | |
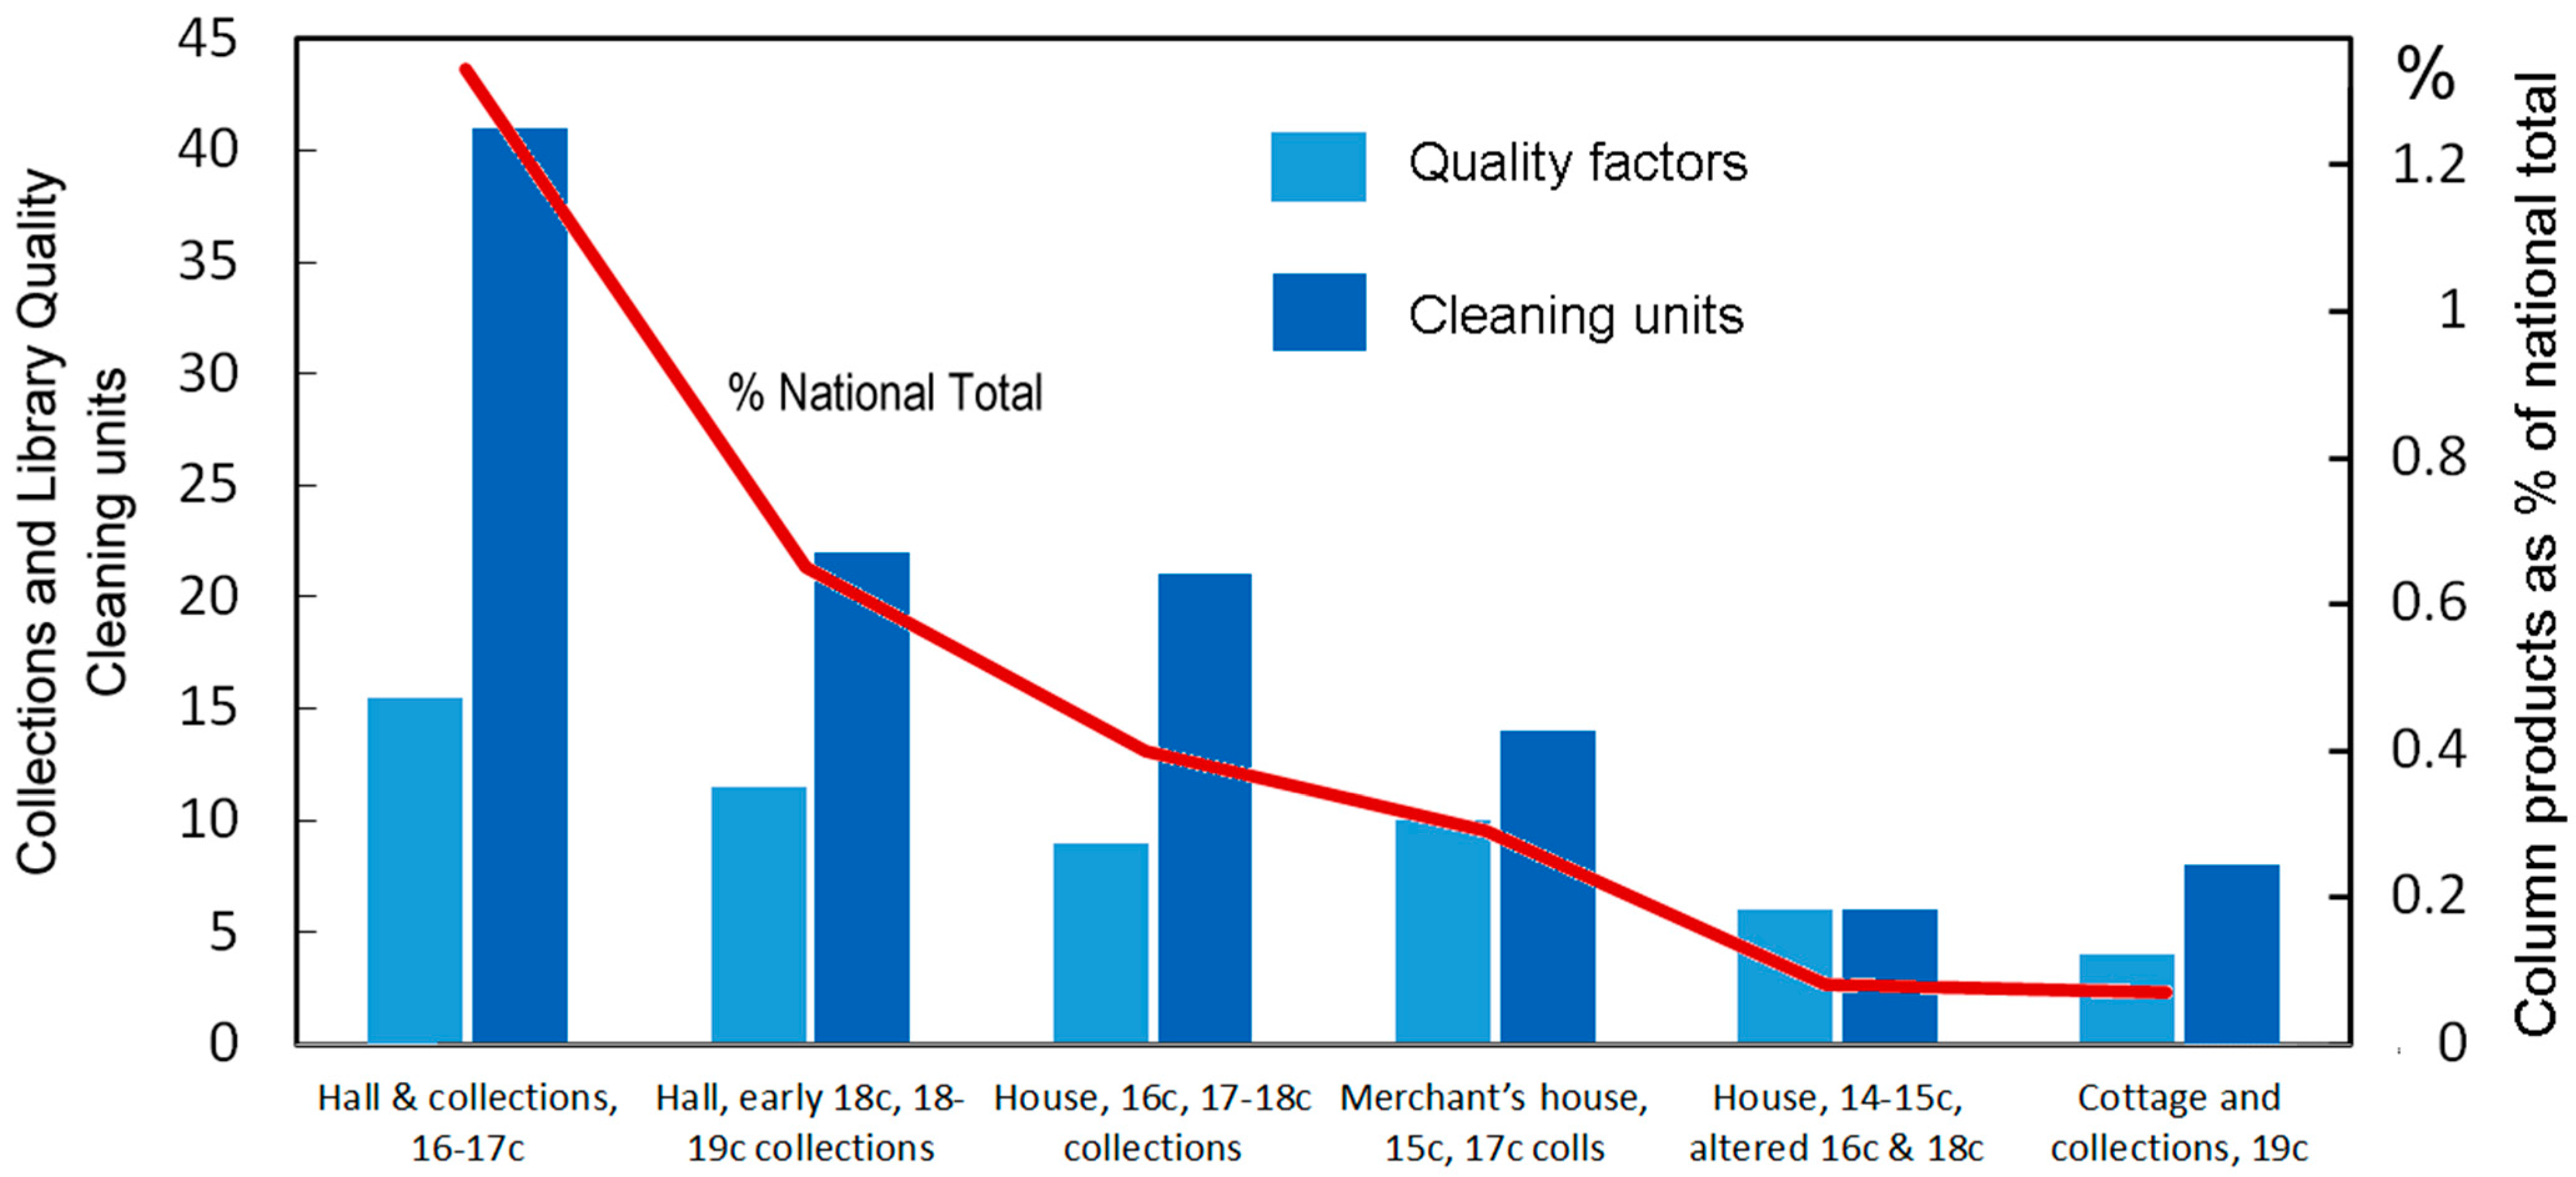
Table 2 illustrates the calculation of quality factors for six historic buildings from the fourteenth to nineteenth centuries, housing collections from the seventeenth to twentieth centuries, with and without libraries, with some located in towns and others in the countryside.
3.2. Quantity
The second section of the model provides the Quantity factor. Again, the working assumption is that each factor has roughly the same weighting, so that one is not biased over another. This section calculates the quantity of collections (via inventory or CMS digital records), accessible spaces (counted as cleaning units), annual visitors and the hours of access. The calculation can be summarised as:
The data in
Table 3 represents the same six historic buildings as in
Table 2, of which one property is large with a substantial collection, two are medium with a modest collection, and three are smaller with fewer furnishings. Visitor numbers vary greatly, from >100,000 to <2000, and the annual hours of access range from almost 2000 to less than 500.
3.3. Linking Dimensions Data to Staffing Structures and Pay Ranges
The subtotals for quality and quantity are averaged and converted to a percentage of the maximum achievable. These percentages are ranked in descending order and, starting from the highest, a different level of staff seniority (reflecting their qualifications and experience) is allocated to each 10%, to indicate a recommended staffing structure for full-time house roles.
For example, the resulting structure may include, where merited, a qualified and experienced museum professional as the head of department for the house (two grades), with 1–2 full-time supporting staff (e.g., house operations manager, and house team leader—two grades), as necessary to provide 24/7 security cover, oversee staff rosters, supervise collections care, and manage public access. Where scores drop below 40%, the interiors and collections may merit only a part-time conservation-trained cleaner, and below 30%, only a seasonal or contract cleaner (conservation training not essential).
Table S2 provides the data and staffing structure for six historic collections.
In other heritage organisations, a similar process of relating Dimensions scores to salary grades can be adopted, but a different allocation of percentages might be needed, according to the local circumstances.
The resulting staffing recommendations are indicative and proportionate to the housekeeping challenges quantified in the Dimensions model. The number of full-time supporting roles required at each property is validated by the regional conservator, using their experience of how well a house team is currently performing in the collections care, and what improvements in resources might be needed. Decisions on staffing are based on many factors, and each property manager must reconcile conservation advice with the availability of property resources, and the staffing needs of other departments on the property (for example, challenges presented by the garden may outweigh those of the house, or vice versa).
3.4. Calculating Cleaning Hours
The next section of the Dimensions model calculates how many cleaning hours should be achieved per house per week, in response to the days of access, and how many part-time team members are needed, with each achieving 20 h of cleaning per week, but employed for 22.5 h (i.e., 0.65 full-time equivalent (FTE)) to allow 30 min per day for a refreshment break and to maintain cleaning equipment and tools.
As discussed in 2.4 above, if every member of the team were on duty every day, only the indicative number of roles would be needed. However, staff work a 5-day week, and cover may be needed for 6–7-days of visitor access, as well as holidays, sickness and absence for meetings and training; therefore, the optimum recommendation is more realistic and sustainable. Where possible, rotas are designed to include working on one or two closed days per week to undertake the weekly/occasional tasks which are difficult to achieve while visitors are present; where a house is open 7 days, teams work additional hours each week, equivalent to an 8th day.
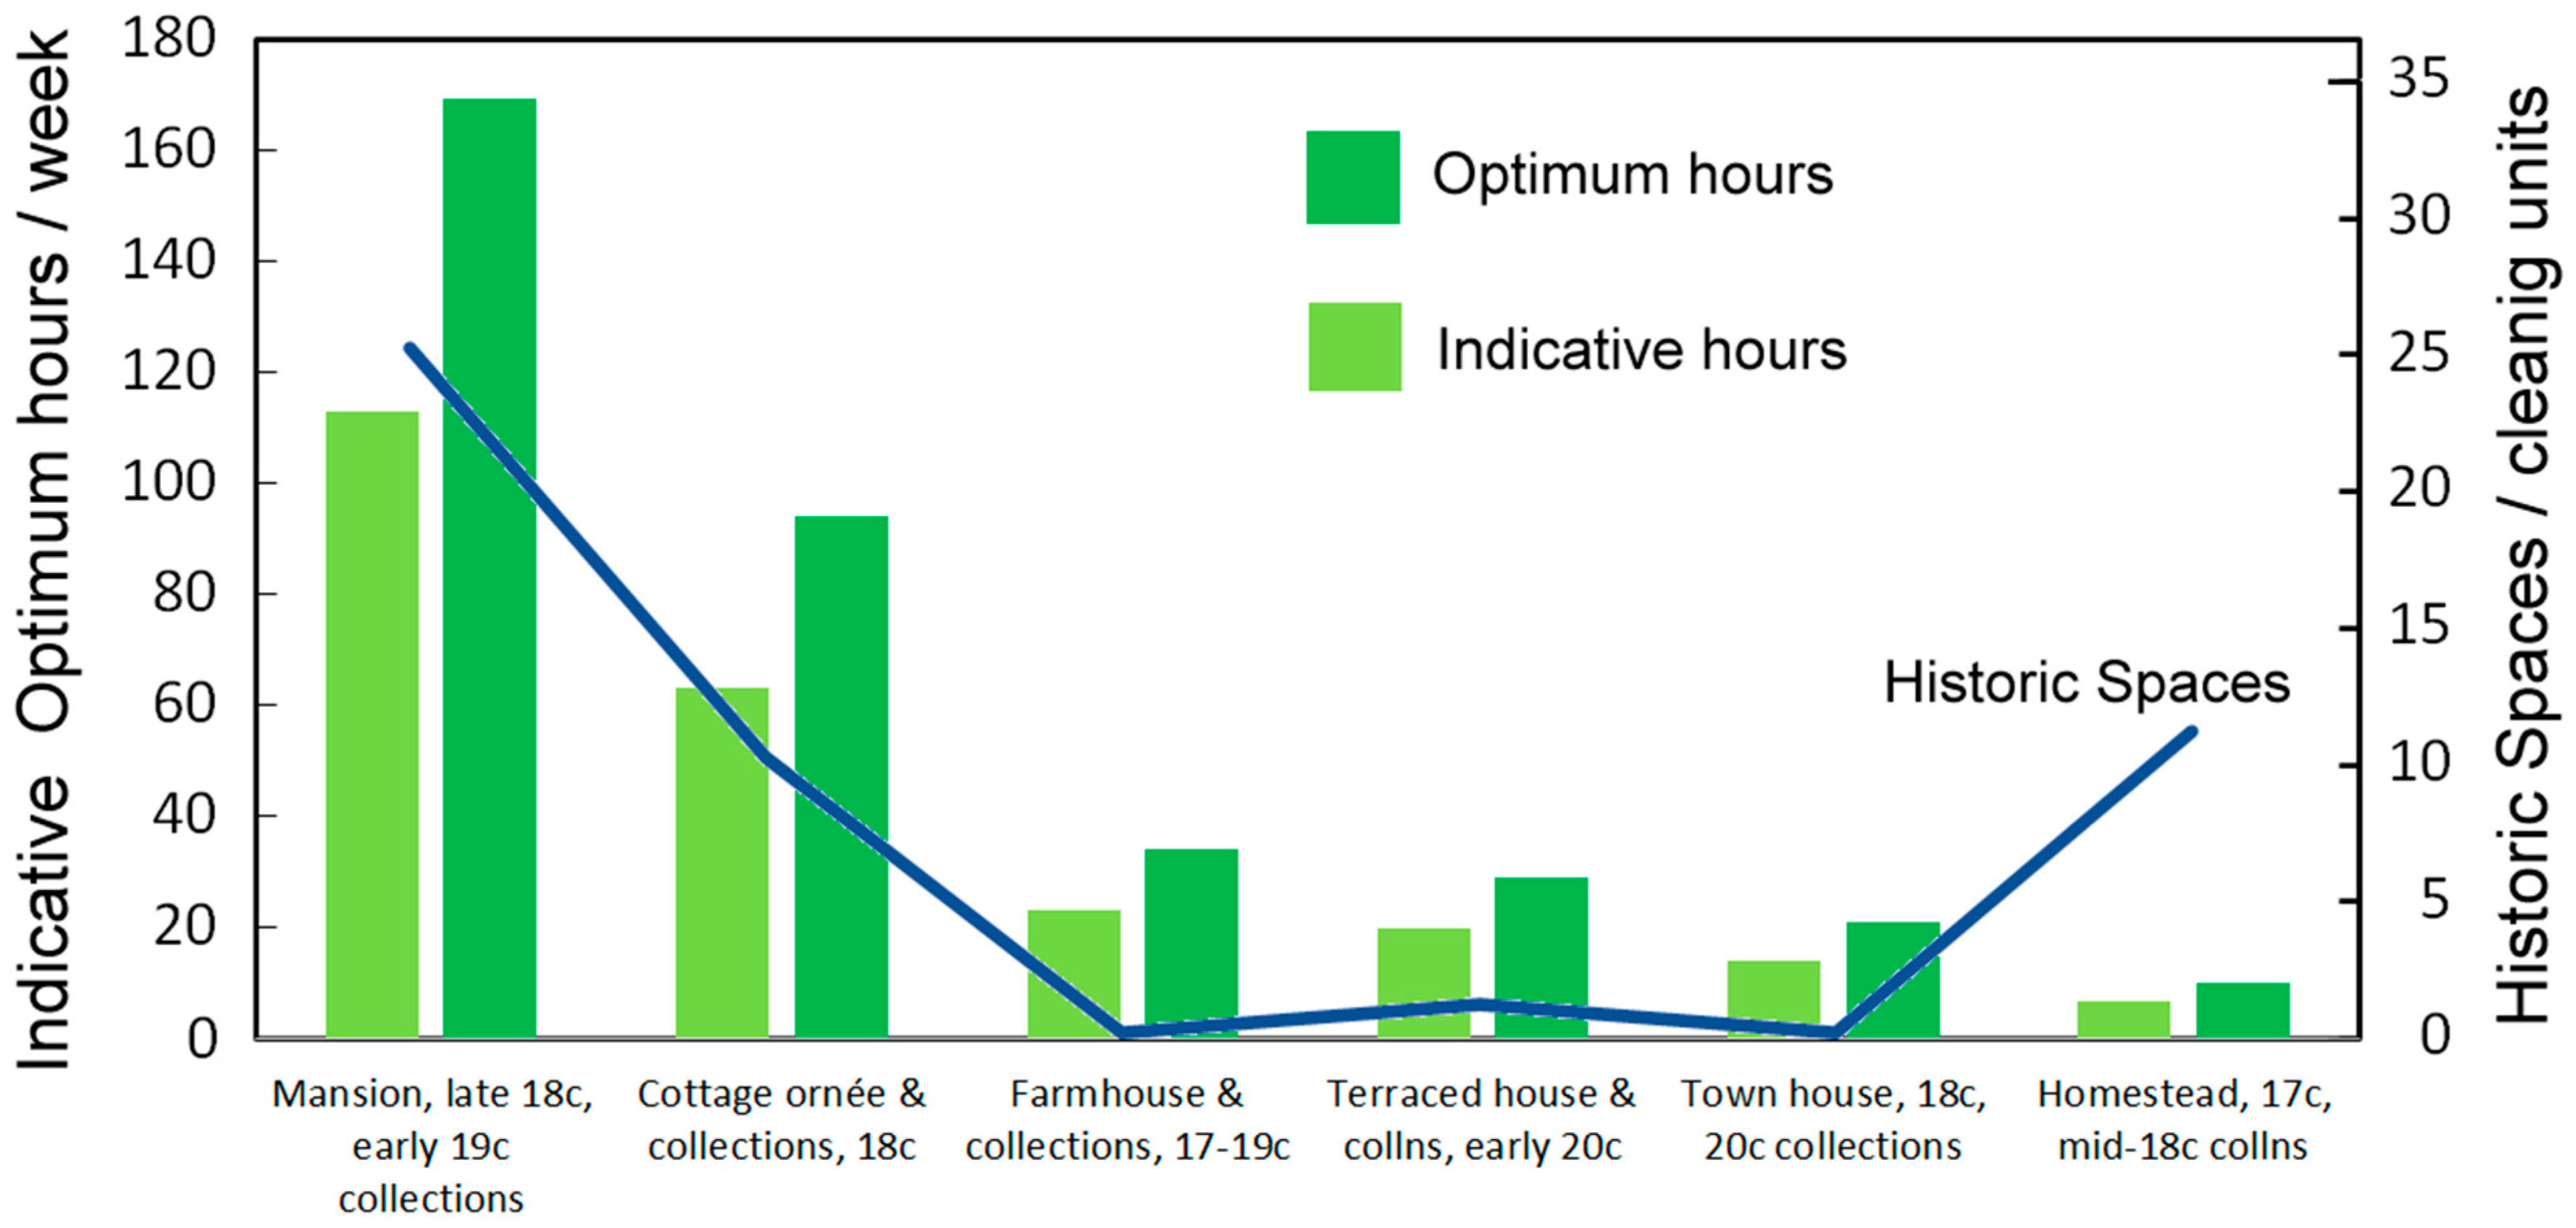
The quality factor is used to guide decisions on whether a house requires indicative or optimum hours of cleaning—the higher the quality factor, the greater the need for optimum hours. The calculations can be summarised as:
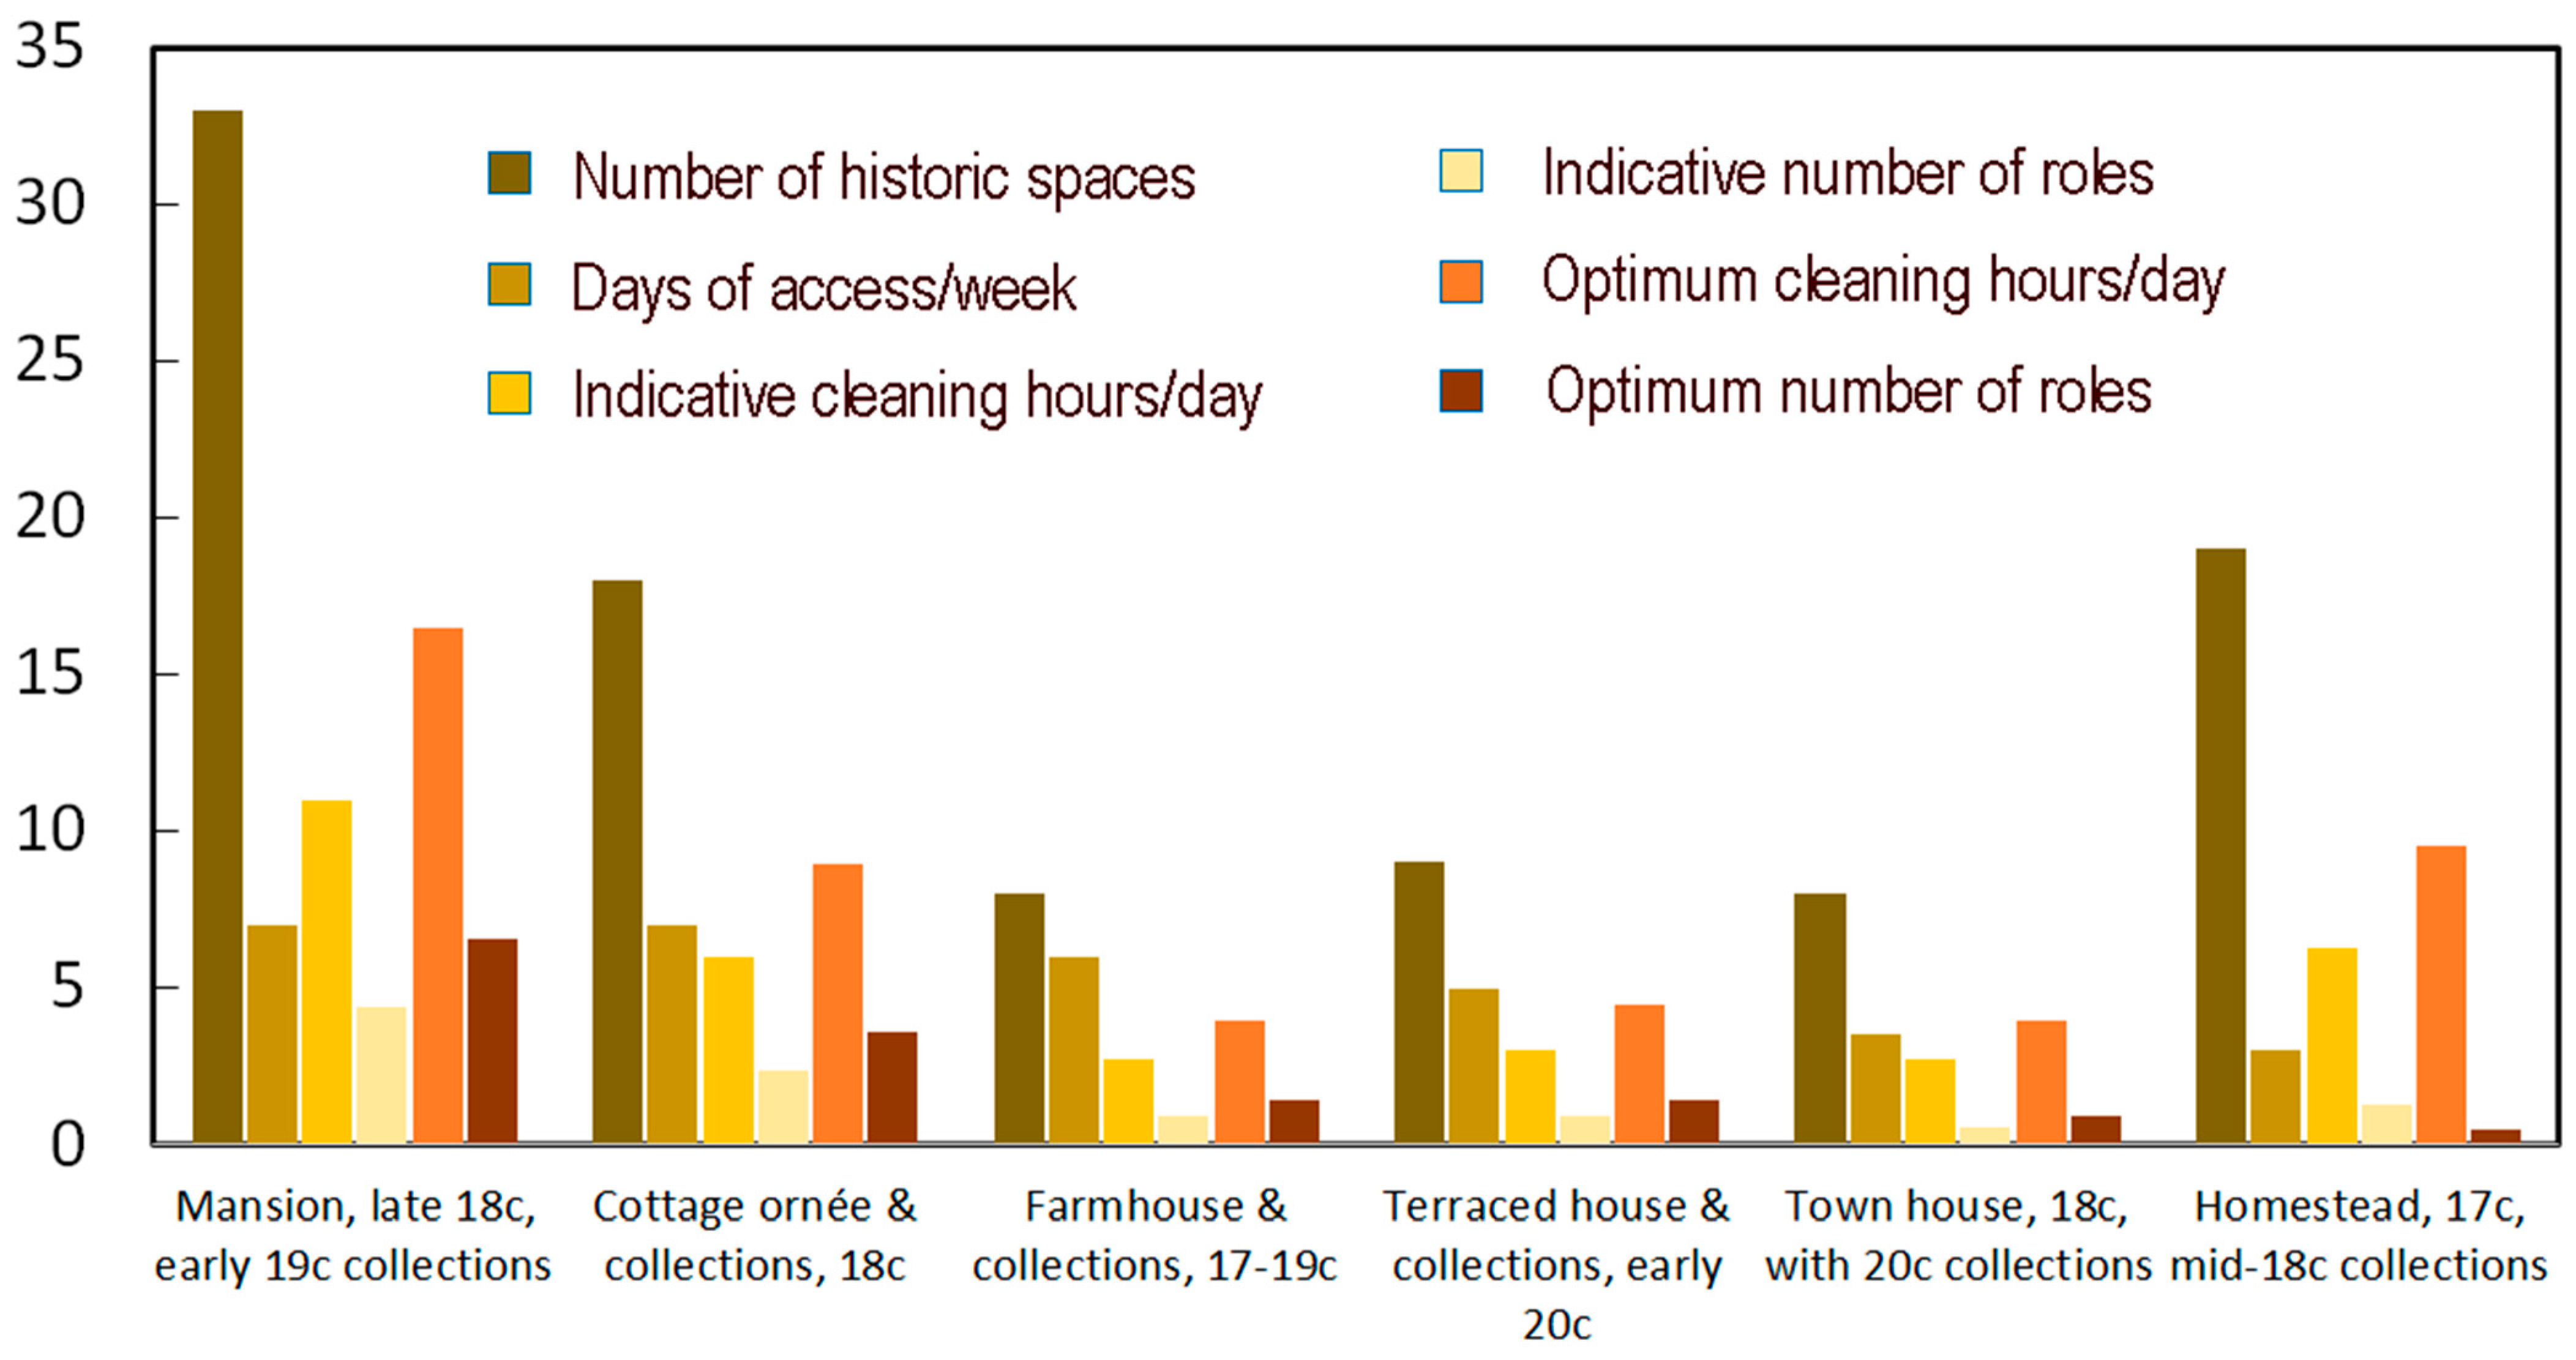
Figure 4 shows the variable number of part-time conservation cleaning roles, commensurate with the dimensions of the housekeeping challenge presented by each property. The results range from the need for a team of 6.6 part-time conservation-trained roles at a large mansion with high quality collections, open to visitors 7 days per week, to a few hours of weekly cleaning at a small property with robust collections.
Table S3 provides the data used in the calculation.
3.5. Winter Access and Deep Cleaning
A further section of the Dimensions model is used to estimate the number of weekly hours needed to undertake annual ‘deep cleaning’. Smaller properties may close for several months during the winter, and undertake this work using the same number of daily cleaning hours as calculated for the open season; the weekly hours of cleaning are re-allocated between spaces, so that rooms densely furnished with fragile materials receive more detailed attention to deep cleaning than the rooms sparsely furnished with robust materials (which would have benefitted from more frequent cleaning during the open season). However, to accommodate Christmas and New Year festivities, and school half-term holidays in February, larger properties may open intermittently or consistently throughout the winter (i.e., 363 days per year); this leaves a house team with the double challenge of preparing the house daily for visitor access, while at the same time undertaking the annual deep clean.
Two calculations are made: one for properties offering little or no visitor access between November and March, where a team can concentrate on deep cleaning; the other estimating how much additional time is needed to prepare a house for visitor access in winter, while also embarking on a programme of deep cleaning the ceilings, walls and floors, and collection items inaccessible during public access. Deep cleaning involves a significant disruption to each room in turn, moving furniture and carpets so that tower scaffolds and stepladders can be used; to make this activity safe for staff and visitors, one room at a time may need to be closed to public access but, where possible and safe to do so, the conservation work is demonstrated to visitors. The calculations can be summarized as:
For limited winter access + deep cleaning:
For year-round access + deep cleaning:
Small houses with few and/or robust collections may not need many, if any, additional hours for deep cleaning; however, highly significant houses with larger fragile collections may need to employ additional roles, or supervise the work of volunteers providing additional support, in order to complete deep cleaning simultaneously with visitor access. The optimum weekly cleaning hours become the target for measuring the conservation performance (CP), as discussed in 4.1 below.
Figure 5 shows the results for the same six properties, and
Table S4 provides the data used in the calculation.
4. Discussion
Over the two decades during which the Dimensions model has gradually evolved, national conservators have occasionally been challenged by management colleagues to devise ways in which property performance could be objectively measured and national resources equitably distributed. The Dimensions model has proved a useful starting point for developing new calculations, as it contains core data which enable distinctions to be made between the quality and quantity of the housekeeping challenge faced by each individual property, enabling national resources to be apportioned fairly between them.
4.1. Conservation Performance Assessment
The Dimensions model can be used to set, monitor and rate the conservation performance (CP), for example, how well house teams are meeting their target of housekeeping and cleaning hours per week. This assessment could form part of a periodic review, designed to measure improvements in conservation across every department on an estate including the archaeology, buildings, gardens, parks, woodlands and farmland [
28].
For this assessment, properties can be divided into four bands, namely, A-D, in relation to their percentage score for Quality and Quantity; the targets for each band can vary according to the risks associated with a failure to achieve sufficient hours of conservation cleaning. Taking the optimum cleaning hours per week as the target for each large and significant collection (and in small robust properties, taking the indicative hours), the percentage of hours achieved can be measured, and the property’s performance graded accordingly.
Table S5a,b illustrates a set of bands, success measures, and ratings of performance against relevant targets.
If higher percentage targets are set for significant and fragile collections, and lower percentage targets for smaller, more robust collections, small houses which meet most of their target may achieve a greater measure of success than larger houses which fail to reach their target. This weighting of the targets and success measures is logical, as the conservation consequences of failure to meet the relevant target are more serious for highly significant, fragile and complex collections, especially those offering the longest hours of access to the largest numbers of visitors and/or accumulating the highest rates of deposition of coarse dust.
4.2. Estimating and Distributing National Resources to Meet Preventive Conservation and Specialist Maintenance Needs
The Dimensions model can be used to inform the re-balancing of historical inequities in individual property endowment funds, and channel additional resources to those properties unable to meet their routine conservation and maintenance needs. (Through this process, no property already consistently spending more on conservation than its basic need loses any funds, but those properties historically disadvantaged are eligible for additional central support.) Each property is assessed for its ability to fund its maintenance needs from its own resources (i.e., investment and rental income; visitor admissions and member visit credits; and retail and catering profits); where necessary, an amount of top-up funding is agreed on to support those needs.
The model supports properties in anticipating and making provision for the non-wage costs of preventive conservation, such as equipment, materials and fuel costs for conservation heating; it also helps to distribute top-up funding for routine maintenance and in situ treatments by freelance conservators. Two calculations are required, as follows.
4.2.1. ‘Basic’ Conservation and Maintenance Need
Heads of profession and national specialists assess the basic conservation and maintenance needs for their area of responsibility, whether they be buildings, countryside, collections and interiors, gardens or interpretation. The ‘basic need’ for each component of a property is consistently defined as:
Calculation of the ‘maintenance need’ for collections and interiors is more complex than for other components of an estate. It cannot be simply reduced to, say, GBP 1 per item on each property’s inventory, as this favours numerically large collections of robust items (e.g., brown furniture) usually needing less attention, while neglecting the fragility and complexity of significant items requiring intermittent specialist care (e.g., historic textiles).
To determine the scale of the national budget required annually for basic collections conservation needs (i.e., specialist care and maintenance), a rough calculation first takes the average maintenance cost per item for the most numerous collection items (e.g., textiles, costumes, and books) and the average maintenance cost for all other material items, multiplied by the average quality and quantity factors across all properties. This calculation (made in 2014) encompasses data from 348 properties with collections, 870,456 digital CMS records, and a total of 660 Quality and Quantity factors, averaging 1.896 each. It indicates that the national objective should be to allocate c. GBP 3m per year to conservation and maintenance needs (
Table 4).
4.2.2. Preventive Conservation Equipment, Materials and Fuel
A questionnaire was used to gather information from 30 properties about the quantities and average lifespans of preventive conservation and housekeeping equipment in use (e.g., environmental control, protective materials for access/display and storage, emergency salvage equipment, cleaning equipment and materials, and personal protective equipment) (
Table 5).
These costs (updated periodically using the UK Retail Price Index) are divided by the equipment’s lifespan (in years), and multiplied by the quantity at each property, to estimate an annual figure sufficient to replace these resources as they become exhausted. The data is collated in an Excel spreadsheet within the ‘Conservation for Access’ toolkit, to support property teams in calculating appropriate budgets for preventive conservation equipment. This process is described in other publications [
18,
26,
27,
28,
32].
For financial planning purposes, specialist conservation advisers suggest the average frequency of need for condition surveys and STC maintenance of each category of collection material, together with an average cost per item. Three examples of the frequencies and costs of STC maintenance are shown in
Figure 6a–c below, and more detail is published in [
32].
Together, these calculations indicate that national objectives should be to spend GBP 6 m per year on meeting STC conservation needs—GBP 3 m on preventive conservation equipment and GBP 3 m on the maintenance of collections by specialist conservators. The Dimensions model is used to indicate roughly how much each property should spend per year, as its contribution to achieving the national objective to spend GBP 3 m on preventive conservation. It also offers a mechanism for allocating central top-up resources to under-endowed properties, as percentage shares of GBP 3 m, in proportion to the quality and quantity factors of each collection.
The calculation can be summarised as:
The same % of £3m is the property target for its annual preventive conservation equipment budget.
Table S6 provides the data and calculation for the six properties discussed above. More recent outcomes (2019) for six different properties, using updated scores for significance, are illustrated in
Figure 7, with the underlying data and calculations in
Table S7.
The calculations raise awareness of the individual property responsibilities for identifying annual budgets for maintenance and conservation; however, the national top-up funds remain insufficient to bridge all the historic gaps in resources, leaving some properties still challenged to generate sufficient income to meet their basic preventive conservation equipment and maintenance needs. Regional conservators monitor the expenditure at each place, and use the Dimensions model to promote the need for funding commensurate with the quality of each collection, and the quantity of interiors in which each collection is displayed, with each space requiring a regular renewal of room-scale preventive measures and protective materials, as well as specialist maintenance.
4.3. Staff Resources and Job Evaluation
In a large national organisation, where the local management is devolved to regions and properties, there are advantages to having one simple system which can be applied consistently at a local level, as well as supporting a central overview of the national resource needs. The transparency of the data underpinning the calculations enables everyone to understand the full extent of the differences between properties and their needs for resources. The simplicity of the model enables it to be readily understood by non-specialists, whether they be local house staff, consultants in other professional disciplines, or national heads of profession who collaborate to develop national strategy and operational policy, influence the distribution of funds, and support professional development.
Using the model, advice on staffing structures and cleaning hours can be offered by email or telephone, without the need for time-consuming travel to each property, provided that care is first taken to update the qualitative and quantitative data relevant to each property. Discussion with each property manager of the core ingredients in the calculations increases their understanding of the scale of the challenge at their property and how it differs from its regional neighbours, but how it might compare more directly with a property in another region, with which they may not be familiar. This understanding reduces the likelihood of competition for resources between dissimilar neighbouring properties; it also helps property heads of department (who aspire to equal salary grades) to recognise that the challenges in the house may merit leadership of a greater/lesser calibre than the garden, countryside, visitor services, retail or catering.
When applications for re-grading of individual staff roles are received, the Dimensions model is effective in quantifying the scale of challenge at that property, and guiding a central discussion on whether the property merits a more senior role, or whether staff should be encouraged to consider a career move to a property offering greater challenges and opportunities for promotion.
5. Conclusions
The Dimensions model contributes to the achievement of a sustainable balance between access and conservation. It is effective in helping conservators and property managers to ensure that each historic house is aware of its needs for conservation housekeeping staff and financial resources, commensurate with the quality and quantity of its interiors and collections, and with the extent of access offered to its visitors. The model has proven effective in practice, and its outputs reflect conservators’ professional assessments of the individual property needs for staff and financial resources. The regular refreshing of data ensures that the results of calculations correlate with the practical experience of supporting house teams and property portfolios. The model also establishes benchmarks against which resources and performance can be monitored and measured. For national consultants, it provides reassurance that their professional opinion is underpinned by hard facts, and that their advice is consistent over time and between properties.
The model is effective in making multiple uses of one large set of data; this simplifies the updating of core information, while also supporting the evolution and adaptation of the model for exploratory calculations in response to new management challenges. It enables the monitoring of how well resources are used; it helps to identify gaps, and supports advocacy for how those gaps might be filled, whether by employing more staff, increasing the skills of existing staff, seeking external funds, or prompting a fairer allocation of the existing resources.
To be effective, the criterion chosen for use in the model must be relevant to the local circumstances, and be able to be tested and validated, so that conservators, property managers and their teams have confidence in the outcomes. The assessments of cleaning units, and the allocations of indicative/optimum timings to each unit, are not absolutes; these figures should always be tested and validated, and may need adjustment before use in different contexts. The methodology described here had worked well for more than two decades but, following the COVID-19 pandemic, some parameters were adjusted to reflect the changing circumstances: reduced visitor numbers (generating less coarse dust), reduced access (fewer rooms open for fewer days/weeks/months), and/or more diverse visitor offerings, including pre-booked guided tours, events, and demonstrations of conservation in action. These parameters remain under review as visitor access at properties gradually returns to pre-pandemic levels.
More sophisticated formulae could be developed, but those described and illustrated here require only GCSE mathematics and an elementary use of an Excel spreadsheet; therefore, they are within the capability of many potential users. To make the calculations more mathematically sound would require the factors to be individually weighted, necessitating a justification and validation of the weightings. Future refinements remain possible and, in the course of writing this paper, two recent publications were drawn to the attention of the author, suggesting different approaches for future investigation [
38,
39].
Last but not least, it is important to emphasise that, to remain effective, models need to be supported, so that their data is consistently refreshed, and their uses can be continuously fine-tuned, improved and developed to offer robust and sustainable solutions to conservation management challenges.


