1. Introduction
The Spanish
Galleon Santiago de Galicia was constructed in Italy in the 1590s and sank outside the port of Ribadeo, Galicia in 1597. This important wreck, lying in 10m of water, has been investigated by a multi-disciplinary team led by Miguel San Claudio since 2011 [
1]; also see Moreno-Garcia et al. and Castrol et al. in this edition for further detail on the site background, historical narrative, artefactual assemblage, and nautical characteristics of the galleon.
Targeted photogrammetry survey has been undertaken since 2015, initially as an opportunistic after-thought to an extensive fieldwork campaign, but subsequently, as a key element utilised to record the hull structure and artefactual evidence, sedimentary context and changes to the overall bedform, as well as to highlight potential threats, both anthropogenic and environmental.
The results of the multi-season photogrammetric survey have not only provided pre- and post-disturbance records but have also highlighted the data potential and limitations to understand diverse aspects including monitoring short- and long-term change, extrapolation of visible structural elements and dissemination for diverse audiences [
2,
3,
4]. Key to this has been the increasingly important question of how we not only communicate our ideas beyond the archaeological sphere for the greatest impact and public benefit [
5,
6] but also how can we ensure that the data being gathered are optimised for study within the team of diverse and geographically dispersed specialists and members of the archaeological team [
7], often with varying levels of access to 3D software platforms and the skills to interrogate these natively three-dimensional data.
This paper explores the workflows for collecting, developing and interpreting photogrammetry data as the basis for further 3D modelling which is beginning to yield deeper insights into the archaeology of this internationally important shipwreck. As such, we focus here on methods and approaches, with some initial examples of results, followed by a discussion of the issues encountered and possible ways forward as we continue with this work-in-progress project.
2. Materials and Methods: Multi-Application Photogrammetry Survey
As with any archaeological site, recording, interpretation and communication of the material culture encountered have been fundamental to the archaeological process since work began on Ribadeo I following its discovery in 2011.
The Maritime Archaeology Trust (MAT) became involved with Ribadeo I in 2015 as the work by Miguel San Claudio was being supported by the Marie Curie funded ForSEAdiscovery Programme led by Ana Crespo Solana, Consejo Superior de Investigaciones Científicas (CSIC). The MAT has a strong focus on outreach and public benefit derived from over 30 years of work on underwater cultural heritage sites in the UK and internationally, with numerous research and outreach programmes developed and delivered in that time. To further these aims, the MAT has been developing a focussed capability in underwater photogrammetry since 2012 [
8,
9], acquiring equipment, experience on various UCH site types, and developing knowledge from working with a diverse range of professionals around the world over the last decades.
Photogrammetry software 2.0.0 selection has been based on a number of factors. Agisoft Metashape (previously Photoscan) has been used to create photogrammetry models throughout successive seasons due to its ability to automatically calibrate image distortion models based on the input image data set. This is particularly important in underwater contexts where parameters such as light refraction, temperature, salinity and turbidity all represent uncontrolled variables that can change by the day, often by the hour, in underwater contexts. These have the potential to affect the fixed distortion models utilised in most software packages.
2.1. 2015 Survey
The first opportunistic multi-image photogrammetry survey of Ribadeo I was undertaken on the last dive of 2015 on 29 June. This followed a long season of pre-disturbance surveys followed by a targeted dendrochronological analysis of the wreck driven by the ForSEAdiscovery Programme under the direction of Ana Crespo Solana and Professor Nigel Nayling which ran from 2014 to 2018 [
10].
Looking back 8 years later, the photographic equipment deployed was already rather dated, comprising a Nikon D200 with a 10 mm Nikon wide-angle lens shot in ambient light conditions.
The model was derived from 1293 images acquired with less than 30 min of bottom time by an MAT diving archaeologist with no previous experience with the site. Scaling was provided solely by direct measurement of tagged timbers and framing elements recorded by the ForSEAdiscovery team in the preceding weeks which were entered during the reconstruction process. No scales or ground control points were deployed due to time constraints.
The resulting 3D surface was visualised in the 3DHop online viewer and published as part of the full archive hosted on the Archaeology Data Service (ADS) web portal. While the dark green areas on the model texture (
Figure 1) indicate a lack of overlapping image coverage and hence geometry, this meant that surface distortion was inevitable and certainly pronounced near the model edges. However, the results provided the first whole-site optical-image derived view of the exposed material and the contemporary bedform and demonstrated that value could be derived from a rapid opportunistic survey while suggesting that there was also room for significant improvement.
2.2. 2018 Survey
The next opportunity to continue developing the photogrammetry survey approach on Ribadeo I was the 2018 fieldwork campaign, which focussed on a full site, pre-disturbance survey (
Figure 2 and
Figure 3) and subsequently timber cataloguing through the targeted excavation of trenches located on the starboard frames (
Figure 4).
The cameras had been upgraded to Nikon D7000 in Sealux Housing with Tokina 10 mm fisheye lenses, with Orcalight Seawolf 1860 wide-beam lighting also deployed experimentally and sparingly.
2.3. 2019 Survey
The final and most comprehensive survey coverage of all of the campaign seasons to-date, this year was focussed on a pre-disturbance survey followed by targeted excavation of Trench 4, with post-excavation back-filling and site closure also recorded on a whole-site basis.
The use of powerful, wide beam, always-on video lighting (Orcalight Seawolf 2860) was particularly effective for imaging the deeper excavation and structures encountered in Trench 4, especially between the buttresses and sister-keel elements, in order to capture as much detail on timber grain to understand direction and continuity, fastenings and overall form.
A full site pre-disturbance survey was captured prior to further intrusive work, as well as the maximum extent of excavation on Trench 4, with two additional interim views also recorded over the 3 weeks of fieldwork. Crucially, diver-based survey swim patterns were much improved resulting in better coverage and image alignment (
Figure 5).
2.4. 2020–2022 Seasons
Further surveys have been limited by the pandemic, with no photogrammetry work undertaken on Ribadeo I in 2020 and with a smaller team deployed by San Claudio in subsequent years and no full-site photogrammetry acquired.
In 2021, the reduced team focussed on understanding the wider spread of finds out of context in the area and increased sedimentation over Ribadeo I, however small, multi-image photogrammetry surveys of Trenches 5 and 6 were captured but do not form part of this paper.
In 2022, the Ribadeo I site was briefly revisited, and it was confirmed that the sand cover was at least 0.7m deep across the wreck. No photogrammetry was undertaken on the main assemblage, but three other sites were recorded with photogrammetry.
A survey was undertaken at Ribadeo II, a site with a distribution of exposed timber and probable stone ballast which was recorded but not excavated. Due to the wide spread of material and poor visibility encountered, the feature was difficult to interpret underwater, but the photogrammetry established that a raised area located in the centre of the site is likely to contain further preserved material and could be the focus for potential excavations in the future.
A further site, Ribadeo III, currently interpreted as a part of a composite flat-bottomed boat dated to the 11th to 13th Centuries AD by C14 was recorded pre-excavation and post-excavation using photogrammetry. The model has been used to measure, interpret and make further comparisons with other boat finds through a process of reconstruction.
Ribadeo IV is another new site located during the 2022 season which exhibits confirmed ships timbers and other material including Portuguese pottery and whale remains. The area surveyed by photogrammetry covers approximately 20 m × 20 m where seven clear features were identified. The digital terrain models deriving from the survey indicate a slightly higher ground in the south-eastern area of the site with a lower dip southeast of the surveyed area showing potential areas of buried material.
2.5. Control Points and Positioning
Returning the focus to Ribadeo I and the main wreck assemblage, due to the nature of the deep sand deposits in the vicinity of the hull, no fixed off-wreck ground control points or permanent references have been established on Ribadeo I to date, which makes accurately referencing multi-year photogrammetry surveys against each other challenging.
In addition, the Ribadeo I photogrammetry has not been accurately georeferenced to the real world so far. While these difficulties are common to underwater archaeological sites and marine projects in general, this can be achieved in the future by the acquisition of multi-beam echo sounder (MBES) data at a period of exposure, ideally immediately prior to, or following, full site photogrammetry survey. However, with a modest available budget and limited site-time, the team has so far relied on a combination of repeat high-resolution surveys of the tagged frames (including their copper nail fixings,
Figure 4) as well as hard, concreted elements, such as the iron bar-shaped concretion at the highest point of the wreck in the midship section, a large protruding concretion in the stern area and also a prominent mound in the bow area where it has been possible to visual identify common features across survey years. Together, these elements have made it possible to achieve good alignment between whole site surveys as well as trench-specific surveys that can then be well positioned within the relatively-referenced 3D site plans [
11].
2.6. Data Processing, Deliverables, and Outputs
Rapid processing was generally undertaken at the end of each day’s survey in all campaigns in order to communicate the material distribution to the team and to aid planning for the next day of survey and excavation in all campaigns.
Further development of the photogrammetry data sets has been undertaken post-fieldwork, with several important pre-processing and post-processing stages undertaken, the latter dependent on the intended use of the data. These include:
Digital Terrain Models: high-resolution surface models typically presented with false colour mapping representing changes in depth/height over a linear colour ramp;
Orthomosaics: orthographically corrected 2D imagery combined to produce a single view, usually in plan, enabling accurate horizontal distances to be extracted from the overall mosaic;
Vertices and point clouds: individual vertices extracted from multiple images that represent various surfaces within the scene, particularly useful when visualising highly occluded areas where not all surfaces can be seen from the camera position, as well as the automatic classification of points in GIS and photogrammetry software;
Faces and 3D models: composed of faces created across three points (triangles) or four points (quads) to create an open or closed surface geometry;
Textures and shader maps: primarily concerned with representing realism, these are developed by combining the original images into a single image file and mapping this onto the x, y, z coordinates of the model using the arbitrary u, v coordinates of the image (known as UV mapping); for web-publishing and game engine environments where more optimised geometry and generally lower-resolution is required, additional image types representing the interaction of light with fine surface detail (normal), ambient occlusion (baked in shadows), and physically-based rendering (PBR) textures are produced. The latter represent material properties such as reflection or roughness of different parts of the model (specular/glossiness or metalness/roughness workflows) and are commonly generated in third-party applications as part of a 3D processing software pipeline;
Materials: also in third-party software, various materials can be assigned to elements within a 3D model, working within selections of the overall geometry, ranging from simple colour values to highly realistic real-world material simulations from cloth or wood with grain to tarnished silver and so on. This process can be used to classify elements within a 3D scene (e.g., by context, element type, or confidence), to highlight archaeological interpretation (e.g., timber fastenings, edges, tool marks), or assign transparency or emissive properties to accentuate particular aspects; materials can be combined with other textures or used to create new textures to provide a different representation and understanding of the site or artefact;
Renders: single images, or combined to create animated sequences, a scene render combines the subject, materials, textures, lighting effects (ambient, global illumination, spots, path tracing), camera parameters (intrinsic: focal length, aspect ratio, etc; and, extrinsic: distance, perspective, etc) for an overall mise-en-scène which may emulate more traditional archaeological conventions such as plan and section line drawings, or views that exploit the potential of the natively three-dimensional data, such as wireframe or transparent renders.
The generation of these assets has led to the development of several workflows and software pipelines to optimise the results for various outputs, many of which are borrowed from specialisms which have a longer history of 3D software application, such as games, films and television industries.
The methods used in related disciplines demonstrate that there is a need and value to go beyond basic model generation when working with 3D data acquisition in archaeology as much as in any other field. This may be motivated by a requirement to optimise data to maximise audience reach; or to further enhance; develop and creatively present data in order to provide outputs useful to other specialists within an archaeological team; colleagues who may be geographically dispersed and/or without access to native 3D software platforms and/or not well-versed in the skills to use them.
2.7. Software Workflows and Pipelines
A typical software workflow for the Ribadeo I full-site photogrammetry coverage has been broad as follows:
RAW image pre-processing in Adobe Lightroom, Darktable or similar: orientation, exposure, white balance, shadows, lens correction (vignette, not distortion), colour calibration;
A hugely important stage in the pipeline: RAW images capture much more information, provide wide latitude for post-processing and maximising subsequent image alignment and texture quality, and can be used to develop lossless-quality imagery for long-term archiving;
Agisoft Metashape: camera calibration groups checked and defined per physical camera, per survey; alignment, depth map generation, mesh reconstruction (high and low poly-models using mesh decimation), basic mesh editing, mesh scaling, orientation/ground control point referencing, texture map generation (diffuse, also normal and ambient occlusion for rapid dissemination in recent software versions, otherwise third-party later in the pipeline), orthomosaic and DTM generation. Deliverables export: high and low poly meshes, textures, ortho, digital terrain models (DTM);
Used to develop the primary deliverables and 3D assets, it is currently the most reliable photogrammetry software for working with automatic calibration and distortion modelling required for underwater multi-image photogrammetry known to the authors;
Mesh editing, including holes, floating or unwanted geometry, retopology or further decimation, depending on the surface or object type;
- ○
ZBrush has been used to edit 3D geometry due to the capability for organic modelling and sculpting traditionally used in character modelling in the film, television and games industries. ZBrush also facilitates surface retopology, optimisation, vertex painting, materials IDs and geometry classification, and simple augmentation with other elements such as scales and arrows, extrapolation of structural features, and other interpretive layers and geometry. Other software packages are equally capable depending on the preference and skills of the 3D specialist, including Autodesk Maya, the open-source and multi-capability Blender platform, and other related approaches to 3D modelling such as McNeel Rhinoceros which has mesh capability but is focussed on splines, arcs and NURBS modelling, all highly applicable to nautical architecture and archaeology [
12,
13].
UV map editing or recreation for control of texture layout and seamlines;
- ○
Photogrammetry software typically generates automatic UV maps which cannot be edited in standard 2D image editing software such as Adobe Photoshop or Krita due to the random distribution of elements of the UV map known as islands across the texture image space. Seamlines can be created on the three-dimensional geometry to define UV islands that can then be edited in any of the software applications cited above in order to edit the textures to improve understanding or add additional interpretive markup layers;
Re-import to photogrammetry software to recreate textures for new UV layout if updated;
- ○
Using the newly created UV maps, the original software generates the textures conforming to the UV islands specified by the user;
Re-export to mesh editing software (e.g., Blender, ZBrush, Maya, Rhino) for the creation of mesh profiles, sections, ground planes, scales, markers, north arrows, miscellaneous layers and other presentational or interpretive features such as bases or ghosted elements or pre-existing models.
Further texture map editing and/or generation: Blender, ZBrush, Substance Painter for diffuse map editing and shader maps for realistic PBR workflows including, for example, transparency and bloom effects which can support interpretation and communication.
- ○
This final stage has been used mostly in relation to 3D artefacts where there are a number of different material components within the subject. ‘Painting’ archaeological interpretation over generated texture layers in a native 3D environment is something the authors are currently experimenting with, and which could be applied to Ribadeo I in future seasons.
2.8. Data Interpretation and Communication
To address the key question of how we transmit meaningful data to other team specialists, for example, to nautical archaeologists and scholars of naval architecture more widely, several approaches have, and continue to be, explored for Ribadeo I using the software and methods outlined above. These efforts have been focused on rapidly generating 2D representations data according to accepted archaeological conventions, including elevation plans, sections and profiles, from the results of the photogrammetry survey.
The perceived advantages and limitations of the main methods are outlined below:
2D/3D GIS enables drawing directly onto the scene or model. In terms of advantages, it follows archaeological conventions and is familiar to most archaeologists. For example, ArcGIS provides simple tracing tools, but the process is highly time-consuming and is not very accurate [
14].
GIS software is simply not as sophisticated or capable as other natively 3D software platforms, being a limited tool with file size and polycount limitations (resolution), as well as proprietary with no strong open-source 3D GIS alternative.
While challenges with site georeferencing at Ribadeo I have been discussed briefly above, the use of multiple scale bars and direct survey measurements, combined with high-density orthogonal photogrammetry survey patterns, provides a model with accurate scaling and minimal distortion which produces reliable 3D models and 2D orthomosaics. The latter is a good fit for working in desktop GIS platforms for image georeferencing against other georeferenced data, such as multibeam or sub-bottom surveys, GPS control points, or points acquired with a total station and pole-mounted reflectors for shallow sites located close to shore. The GIS platform can then be used to develop ‘virtual ground control points’, selecting reliably identifiable and solidly fixed features over multiple campaigns to produce a series of control points that can then be imported into photogrammetry software as a means of tying all multi-year season 3D data survey together with real-world coordinates.
2.9. Native 3D Software Applications
As much as possible, the authors have focussed on utilising full 3D software environments to develop deliverables that can be used and easily understood by members of the team, as opposed to manually sketching polylines and polygons on top of orthorectified imagery, such as in GIS or other vector graphics software such as Adobe Illustrator.
One rapid method has been to develop line-art render passes from the 3D geometry in various classic orthographic views. This technique uses automatic geometry translation to render visible edges as 2D lines for more traditional plan, section and profile views. However, it involves limited archaeological interpretation or interaction but can be edited and augmented in open-source image editing software. The exports are not in yet in scalable vector graphic (SVG) format, but this is likely to be possible using one or more software processes. The strength of the approach is quick and analogous to existing archaeological conventions and can be achieved while still in the field. This method can be combined with the erasing technique used by Yamafune et al. on the Gnallic wreck to add archaeological intervention and interpretation for rapid simplification [
11].
Component classification produced by working in a fully 3D software environment has been the focus of post-excavation 3D work on Ribadeo I. Several software platforms enable the slicing, grouping, and further organic interpolation or extrapolation of surfaces to explore aspects including isolating discrete elements, or grouping disparate elements interpreted as being part of the same feature, based on the archaeologist’s decision-making process.
Sections, profiles and elevations can be rapidly generated by using native Boolean modifier tools commonly available in most dedicated 3D software packages, such as Blender, Autodesk Maya and ZBrush. We used ZBrush to create three planes which can be modified interactively to create Boolean intersection slices through the photogrammetry surface or solid model at any position. These can be adjusted as required and displayed in a variety of ways including in isolation, with the main surface ghosted, or with the slice highlighted on the original surface. Exporting 2D orthographic renders or exporting new mesh sections and profiles to other software is then a trivial next stage.
Software specifically developed for the modelling of arcs and splines that describe, manipulate and fair representations of the lines and stations of a ship’s hull, notably Rhinoceros 3D, have been shown to be the most currently effective method of shipwreck reconstruction [
12,
13,
15]. Utilising rapid exports of section and profile models via the methods described above in this way will be an important aspect of the further work on Ribadeo I as the recording of the buried hull continues in future campaigns. To date, only Trench 4 has been subject to significant excavation and 3D recording to date, though the initial results derived from the analysis of the wider distribution of exposed frame ends by the Ribadeo team are already highly insightful.
3. Results
In exploring a variety of possible options for extracting key archaeological information for the interpretation of the structural remains, this paper seeks to dovetail with the previous and following paper.
The campaign seasons and methods described above have resulted in multi-year photogrammetric visualisations of Ribadeo I and other newly discovered features in the immediate vicinity which have fed into several distinct areas, each with their own challenges, questions and priorities. They are all essentially concerned with the communication of information acquired during fieldwork campaigns to various audiences and for differing purposes.
For reasons of brevity and focus, this paper concentrates on the first and second aspects of the main uses of photogrammetry data that the MAT and the Ribadeo team have been exploring together.
Phased, general survey and excavation documentation—basis for subsequent phases and on-site communication and planning of fieldwork progress;
Archaeological reconstruction—extracting meaningful information, archaeological interpretation process;
Recovered artefact and timber recording techniques and methodologies;
Site monitoring, including sediment levels and changes to the overall bedform—surface difference, time sequences; and
Outreach and public engagement—low-polygon model optimisation for web-based platforms; high-poly, high fidelity for high-impact renders and the latest gaming engines for environmental reconstruction and immersive site visualisation in VR/AR/desktop and mobile.
In terms of specific results from the analysis and archaeological interpretation of the recorded structure and artefact assemblages, see the accompanying papers in this edition.
3.1. Pre/Post-Disturbance, Full Site Coverage
A series of high-resolution full-site photogrammetry models and trench-specific models, as well as some limited artefacts, have been created for Ribadeo I:
2015:
- i.
full site visualisation, post-season coverage, some uncorrected distortion effects with data gaps;
2018:
- i.
full site pre-disturbance survey; good coverage, minimal distortion;
- ii.
Trenches 1–3, photogrammetry models focussed on exposed frame-ends and timber indentation tag recording;
- iii.
artefact scan: Bronze Cauldron, recovered to surface.
2019:
- i.
full site pre-disturbance survey; good coverage, minimal distortion;
- ii.
full site survey post-ballast removal over Trench 4;
- iii.
full site survey, interim excavation of Trench 4;
- iv.
full site survey, maximum excavation of Trench 4 (
Figure 6).
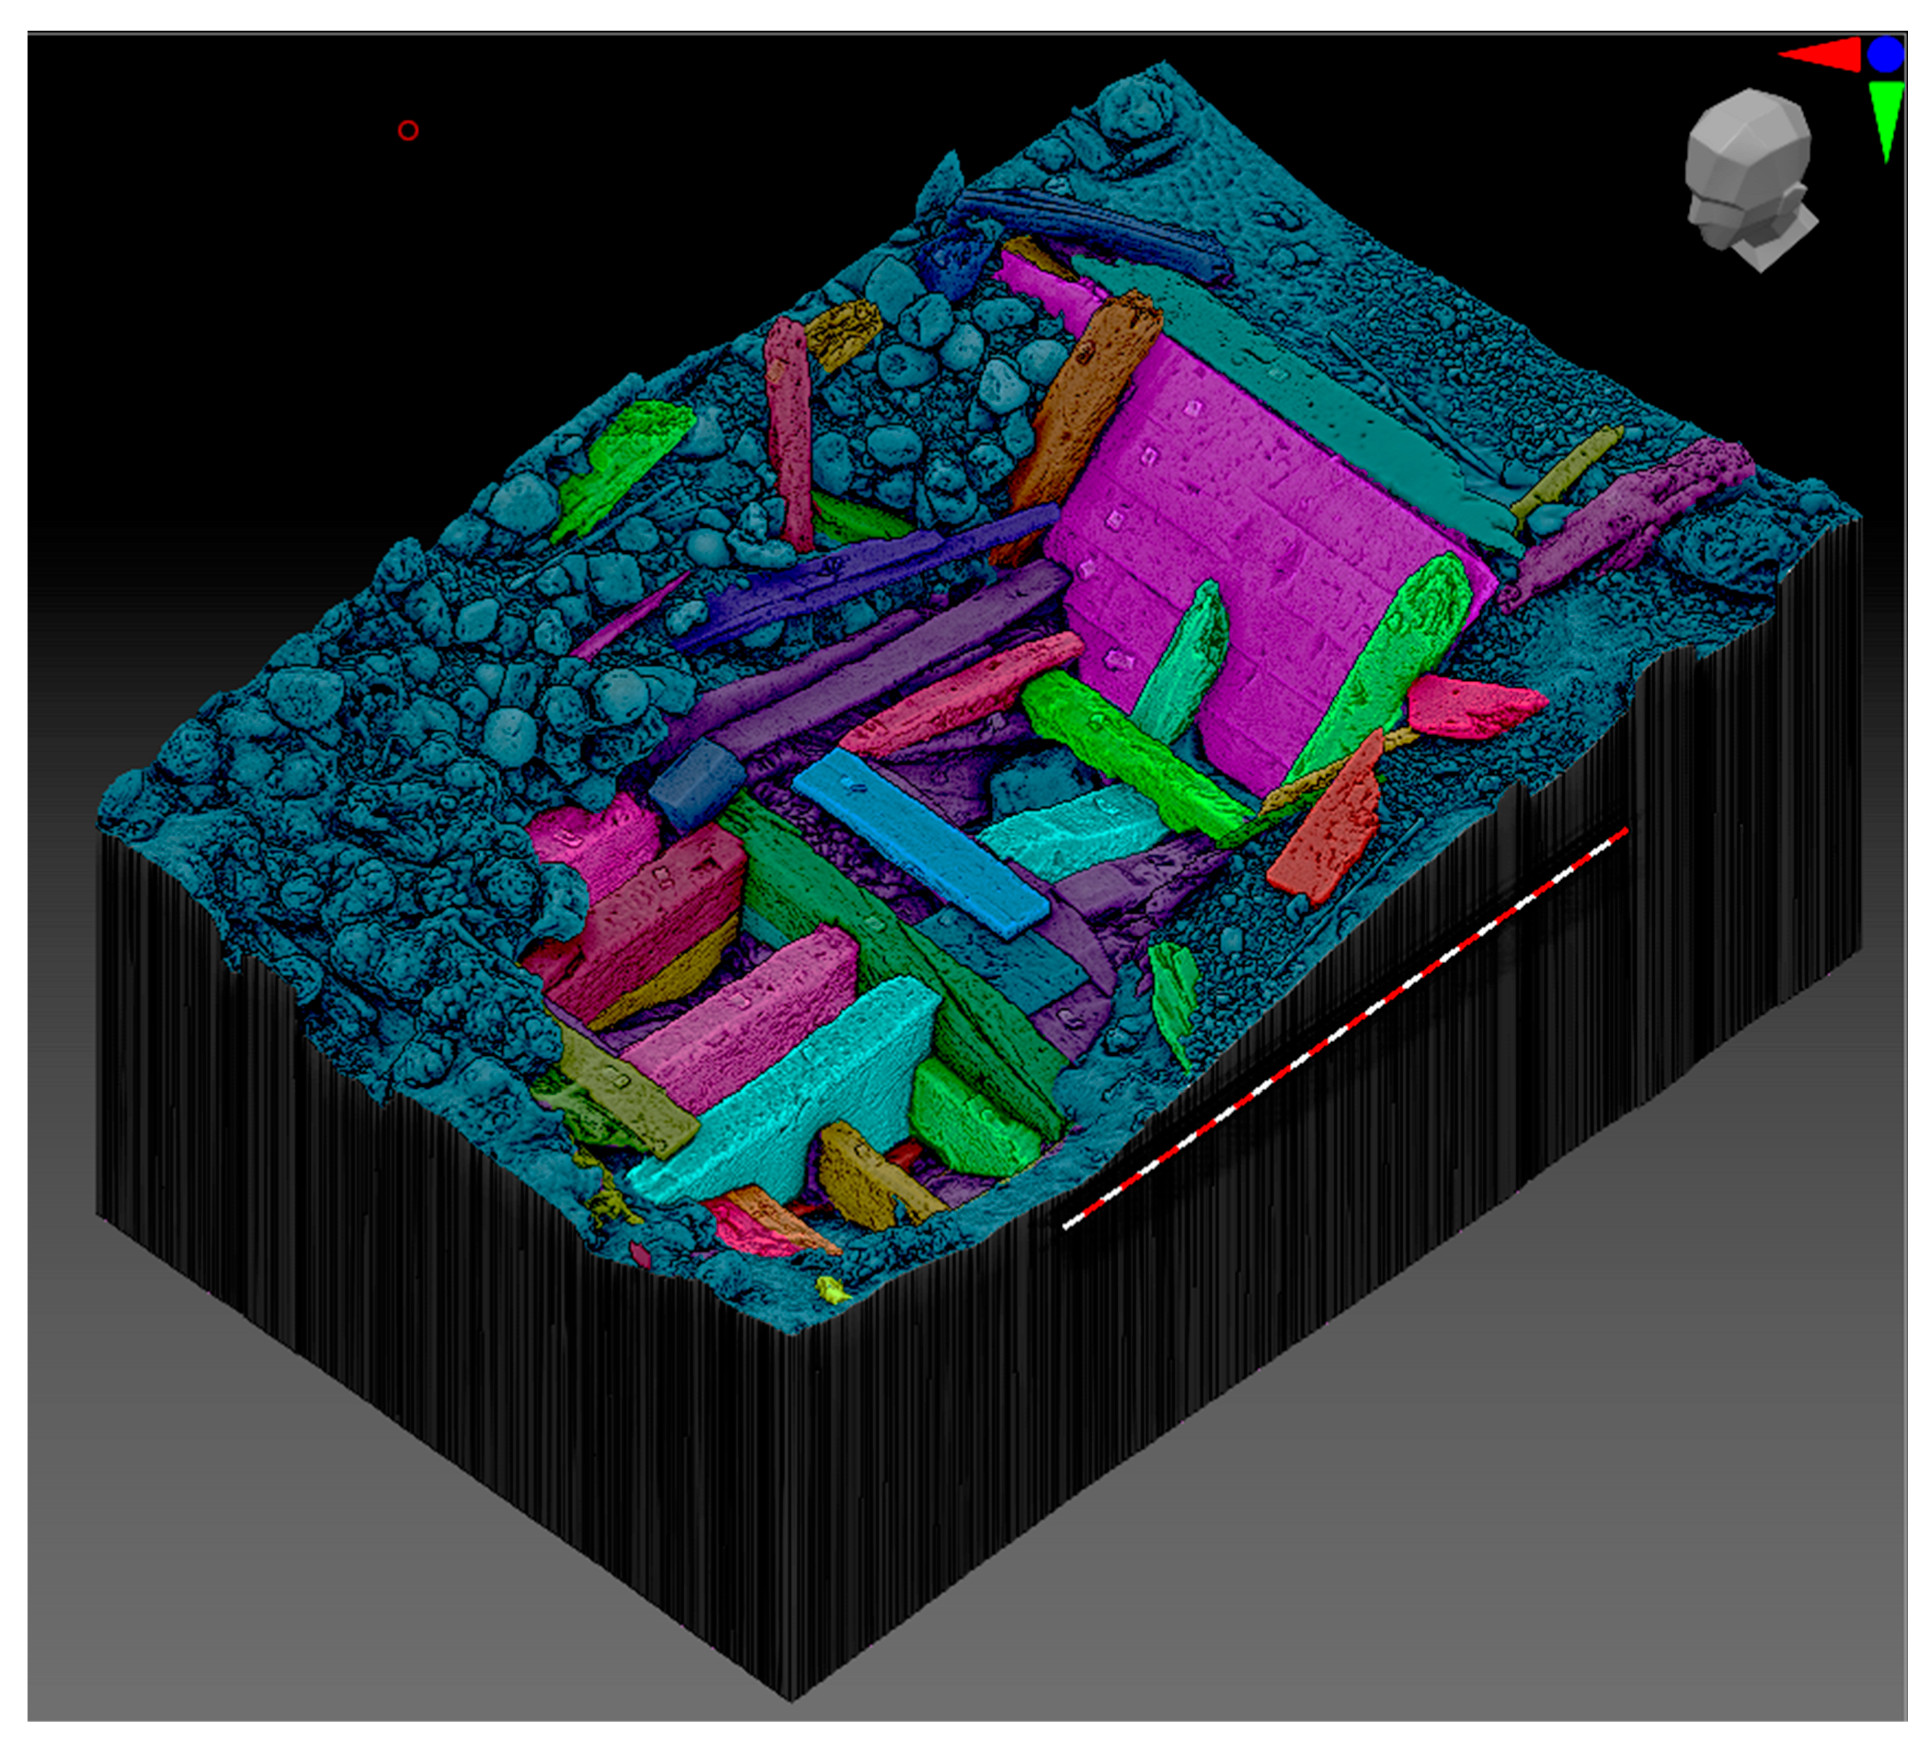
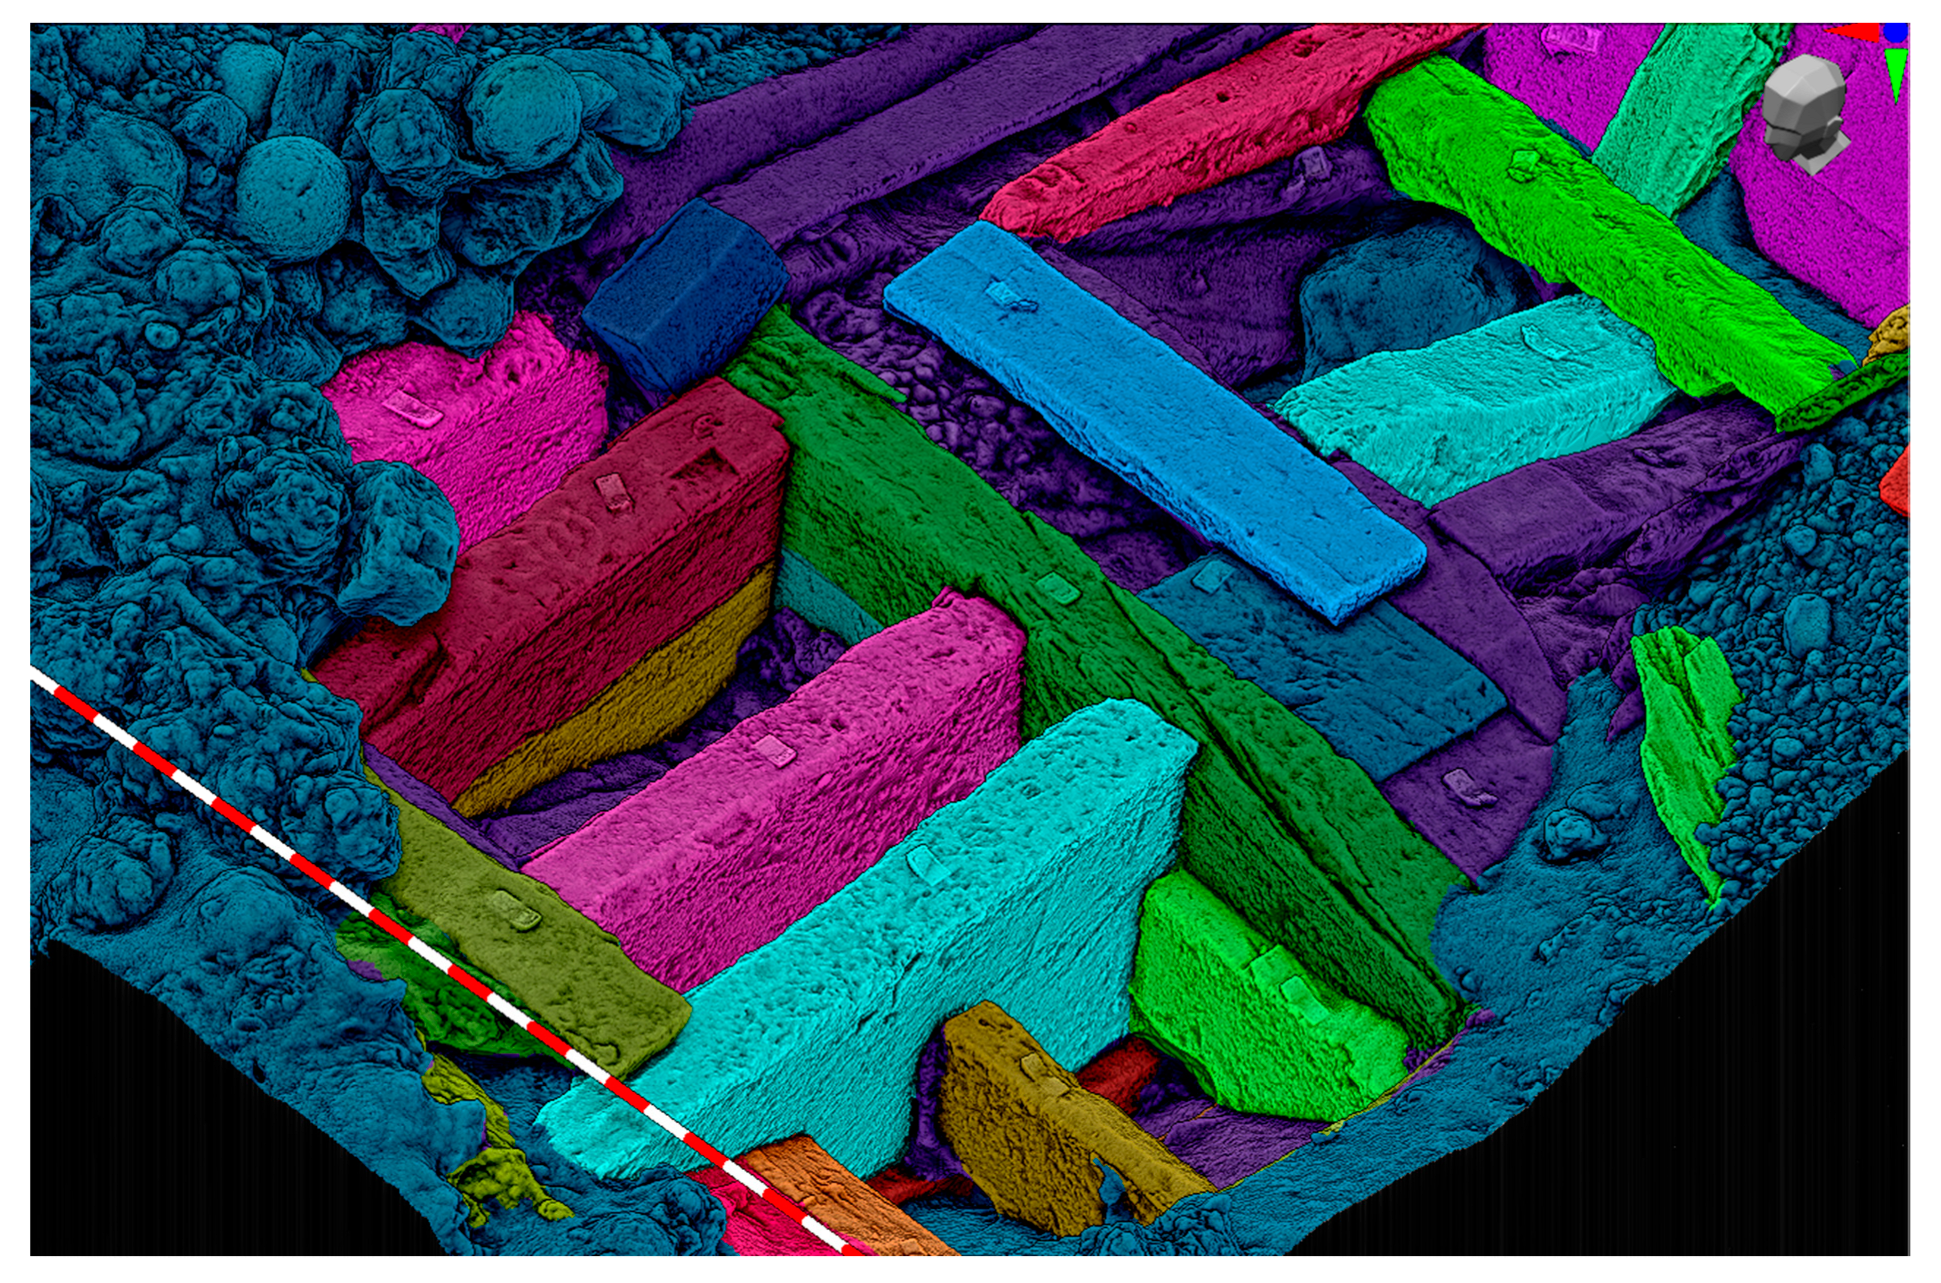
3.2. Excavation—Trench 4
A high-resolution 3D model comprising 10 million faces was imported from Agisoft to ZBrush where individual timbers were isolated using the lasso selection tools and polygrouped (assigned a false colour). Surrounding, cannon balls, stone ballast and other artefacts have not yet been grouped in this way in the image (
Figure 7,
Figure 8 and
Figure 9).
Next, a material was applied to the entire model to emphasise surface details. The selected material is called FlatSkecth01 and is pre-installed in ZBrush. Similar materials can be created in other 3D software packages. Finally, a 3 m scale with 0.1 m increments and a north arrow were added to the scene (
Figure 8).
This approach provides an initial opportunity to begin to critically interrogate and classify the data from an archaeological view. It requires continuous decisions to be made regarding edge and join selection, contiguous surfaces, and confidence in areas of poorer quality geometry. Toggling between the material and the colour texture as well as working ‘in the round’ in a full 3D environment significantly enhances the ability to understand and interpret the model.
A section of Trench 4 (
Figure 10) and profiles developed in ZBrush are shown below These use Boolean intersections as described in the methodology above to interactively select various stations across the scene (
Figure 11). Once more structural data is available for Ribadeo I in future campaigns, these sections will be exported to Rhinoceros 3D (
Figure 11). While these surfaces can be generated in other software including Rhino 3D, ZBrush offers, and an array of powerful mesh manipulation tools that can complement other software packages. Once developed, these types of sections facilitate the comparison of the as-found hull assemblage with various reconstruction hypotheses and may inform the subsequent fairing of lines to further develop these types of models. Despite the limited intervention undertaken so far, good progress has already been made with developing lines based on 16th-century Mediterranean vessel research and measurements derived from Ribadeo I (see Castro et al. in this edition).
4. Discussion
There are various approaches to bridging the relatively new world of three-dimensional surveys and so-called reality-capture with traditional recording conventions and archaeological interpretative processes.
Does every team member need to become a 3D expert? Does a 3D specialist in a team need to be an archaeologist? Is it enough to have a specialist 3D ‘navigator’, someone who can drive the software while the other team-passenger provides direction, or acts as a guide to a wider team through the data to identify the information that they need to deliver their own interpretation of the evidence? If conventional outputs are required, such as plans, sections, profiles and other nautical-specific views such as half-breadth and body plans, how can these be generated from the available photogrammetry data in order to provide familiar and comparable information to those who speak this type of visual language?
While there are no definitive answers to these questions, the work on Ribadeo I has highlighted some key challenges in addition to the great potential of rapid multi-image survey and recording techniques that have been used to examine the wreck. Specialists within a team can be highly adept at processing and developing three-dimensional representations of the archaeology recorded in the field, but how do we communicate this to the outside of the specialist software environment with which we become familiar?
These software platforms, whether concerned with 2D (CAD, (traditional) GIS, various vector graphics packages), 3D surface geometry and materials (Autodesk Maya, ZBrush, Blender), texture baking and material capture (Adobe Substance Suite, Quixel, Marmoset Toolbag) create new opportunities for visualising archaeological interventions and their products, and expressing archaeological interpretation of the resulting material. However, they can also create new barriers within a team of specialists who need to continue to work with data that is natively three-dimensional and yet which might require an unfeasible learning curve to use, preventing the extraction or presentation of the data in a way that facilitates, and does not hinder, their ability to interrogate the source material and then use it further their own work.
The methods and techniques we have outlined here go some way towards answering these questions, but there is also much work to be done in establishing truly collaborative data sharing across teams in remote locations. Software environments where existing tools can be used to work across multiple team members are becoming more established and widely available, for example, NVIDIA’s Omniverse which can run cloud-based instances of numerous 3D software platforms for multi-user access and development (
https://www.nvidia.com/en-us/omniverse/ (accessed on 30 December 2022)), and this type of approach seems to hold much promise for the future.
Next Steps and Further Work
The methods and techniques described in this paper have been focused on the translation of 3D data into conventional archaeological media that can be useful and acceptable to archaeologists and peers. More nuanced challenges remain, and it is possible that photogrammetry, at least when conducted in challenging environments, such as submerged shipwrecks, may not yet be able to adequately deliver sufficient accuracy to satisfy these requirements.
While very fine details such as fastenings, tool marks, original edges, erosion patterns and joins between timbers can and often are successfully imaged through multi-image photogrammetry survey, overall survey quality, particularly on a site or area basis as opposed to a single object, tends to be highly variable in terms of resolution, fidelity, and surface integrity. Some of these aspects are mitigated by the experience of the archaeologist as a photographer, and by the preceding stages such as image pre-processing, to maximise the information that can be extracted from each component image, but confidence is inevitably reduced when expected geometry is either exaggerated or missing from the final surface. This can be compensated for by the 3D specialist being a trained and experienced (maritime) archaeologist, able to balance the digital outputs with their understanding of the source material, but overall confidence needs to be effectively communicated to the wider team once again. Confidence reports and false colour imagery produced in photogrammetry software such as Agisoft Metashape can be an effective way to achieve this.
Going further, if we accept the limitations of rapid photogrammetry and can understand when the information presented should be treated with caution, we can begin to think about further classification and recording of timber in terms of edges, faces, grain, tool marks, continuity and interconnectedness in the 3D sphere, ideally without resorting to sketching over 2D representations in other traditional software. The work on the 15th Century Newport Ship made significant progress with developing methodologies for digital recording, classification and interpretation of ship’s timbers using Faro Arms technology for contact probe-based, sub-millimetric measurements and definition of key features driven solely by an archaeological decision-making process [
13]. If a similar approach can be taken with Ribadeo I and other shipwreck sites in the future, then we need to consider how the lessons of the Newport Ship and subsequent applications of those methods can be adapted and applied to photogrammetric models in lieu of the source material being recovered to the surface.
In-situ photogrammetry offers the possibility of applying these advances to a shipwreck that has not been fully excavated or even had any major elements raised from the water, but in order to make this effective and useful a key consideration will be recording uncertainty and confidence, both in the integrity of the visible surface and also regarding faces of elements that remain buried, or which run below other elements and may or may not form a contiguous surface. Again, this should be undertaken within the native 3D environment, viewing and considering the data from all the perspectives that the software can offer.
The answer to this is likely to lie in the continuous development in the marriage of native 3D software applications, such as Blender, and truly 3D GIS packages that form geographic databases capturing metadata and combined with powerful 3D surface editing and interrogation tools [
16]. In this way, the abstracted archaeological interpretation such as that generated by the Newport Ship project and numerous other projects undertaken by members of the Faro-Arm Rhino Archaeological Users Group (FRAUG) could be initially generated and fully integrated within the wider spatial context of the as-found ship and its environs. Currently, numerous workarounds do exist to transit between the 3D world and the well-established 2D GIS environment and have been used for many decades, but the truly 3D GIS offering still does not promise the same capabilities on a widely available, open-source or commercial basis, though clearly, they do exist [
17]. However, the space is changing rapidly and once viable platforms become widely adopted, we can expect the deposited 3D data to encompass the full site archive including geo-located artefacts and samples, ship reconstructions, animations and eventually full environmental reconstructions in a unified platform.
5. Conclusions
While identifying and developing appropriate methodologies for gathering, processing and interpreting native 3D data have been rapidly developing over the past decade and more, it is clear that we still need a more ambitious approach to integrating data from underwater photogrammetry surveys with other research elements and maximising the value of these data.
Multi-image photogrammetry can be a versatile, cost-effective and highly appropriate tool for rapid data collection, analysis and dissemination, and it has yielded great results on many projects including Ribadeo I, but there are still challenges to overcome and key areas which are expected to improve as a natively three-dimensional, digital-first approach becomes ever more ubiquitous and also accessible with each passing season.
The Ribadeo team has not answered all of these questions and sharing the 3D data during the project has been far from perfect, but solutions continue to be identified and methods more defined going into 2023 compared with the first ad-hoc photogrammetry survey of 2015. As more of this exciting and unique shipwreck continues to be investigated, we expect to be in a strong position to apply the lessons of the past eight years and the experiences of other practitioners to maximise the benefit of future seasons and ensure a stronger overall approach to knowledge sharing and communication.


