

Fragility Curves for Historical Structures with Degradation Factors Obtained from 3D Photogrammetry


Abstract
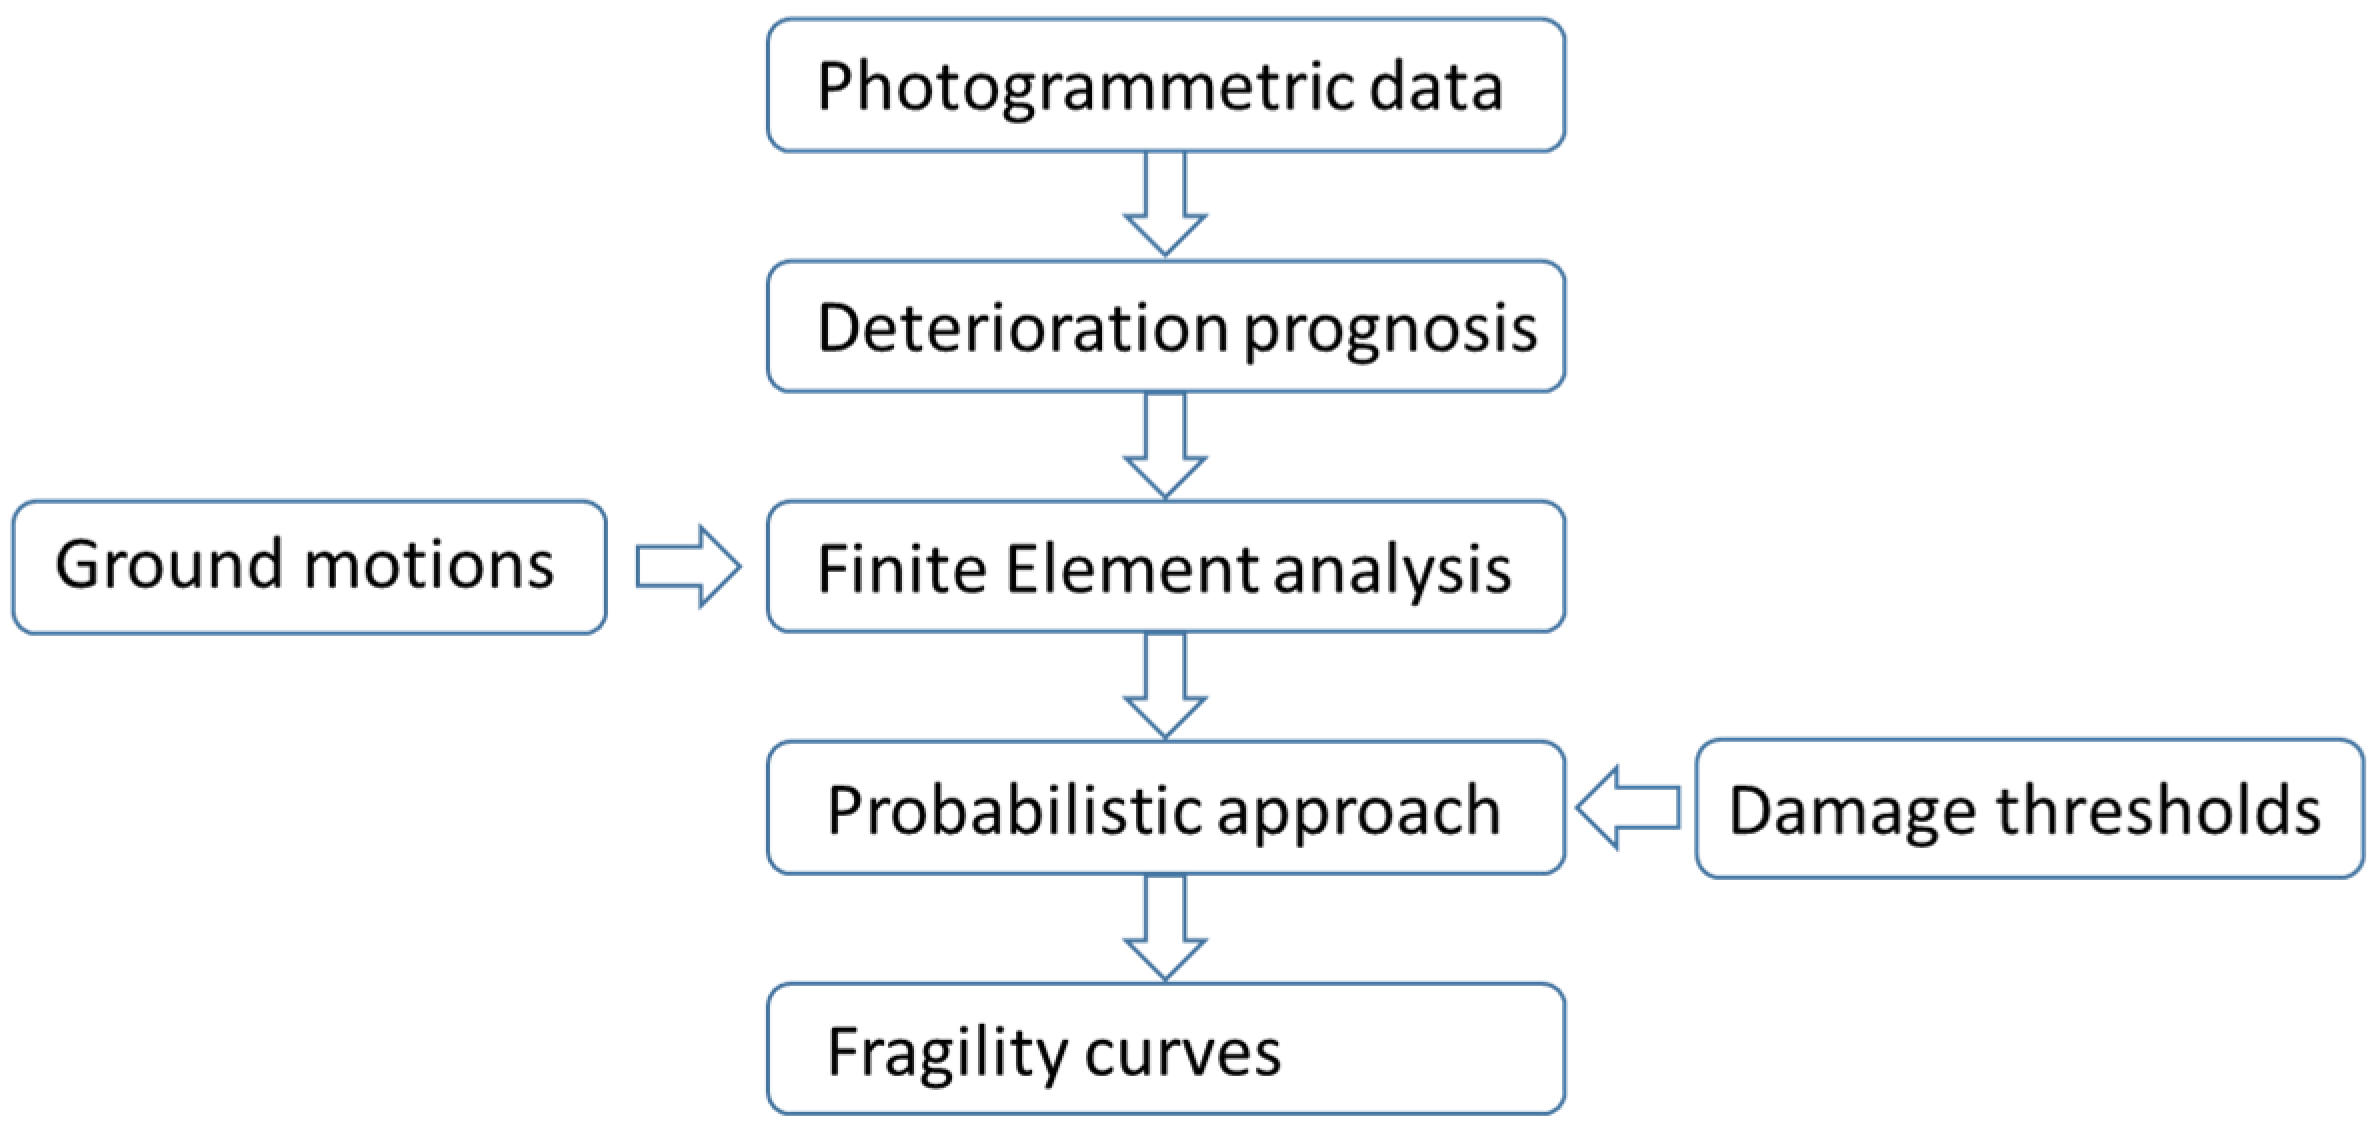
1. Introduction
2. Materials and Methods
2.1. Cases of Study Description and Historical Background
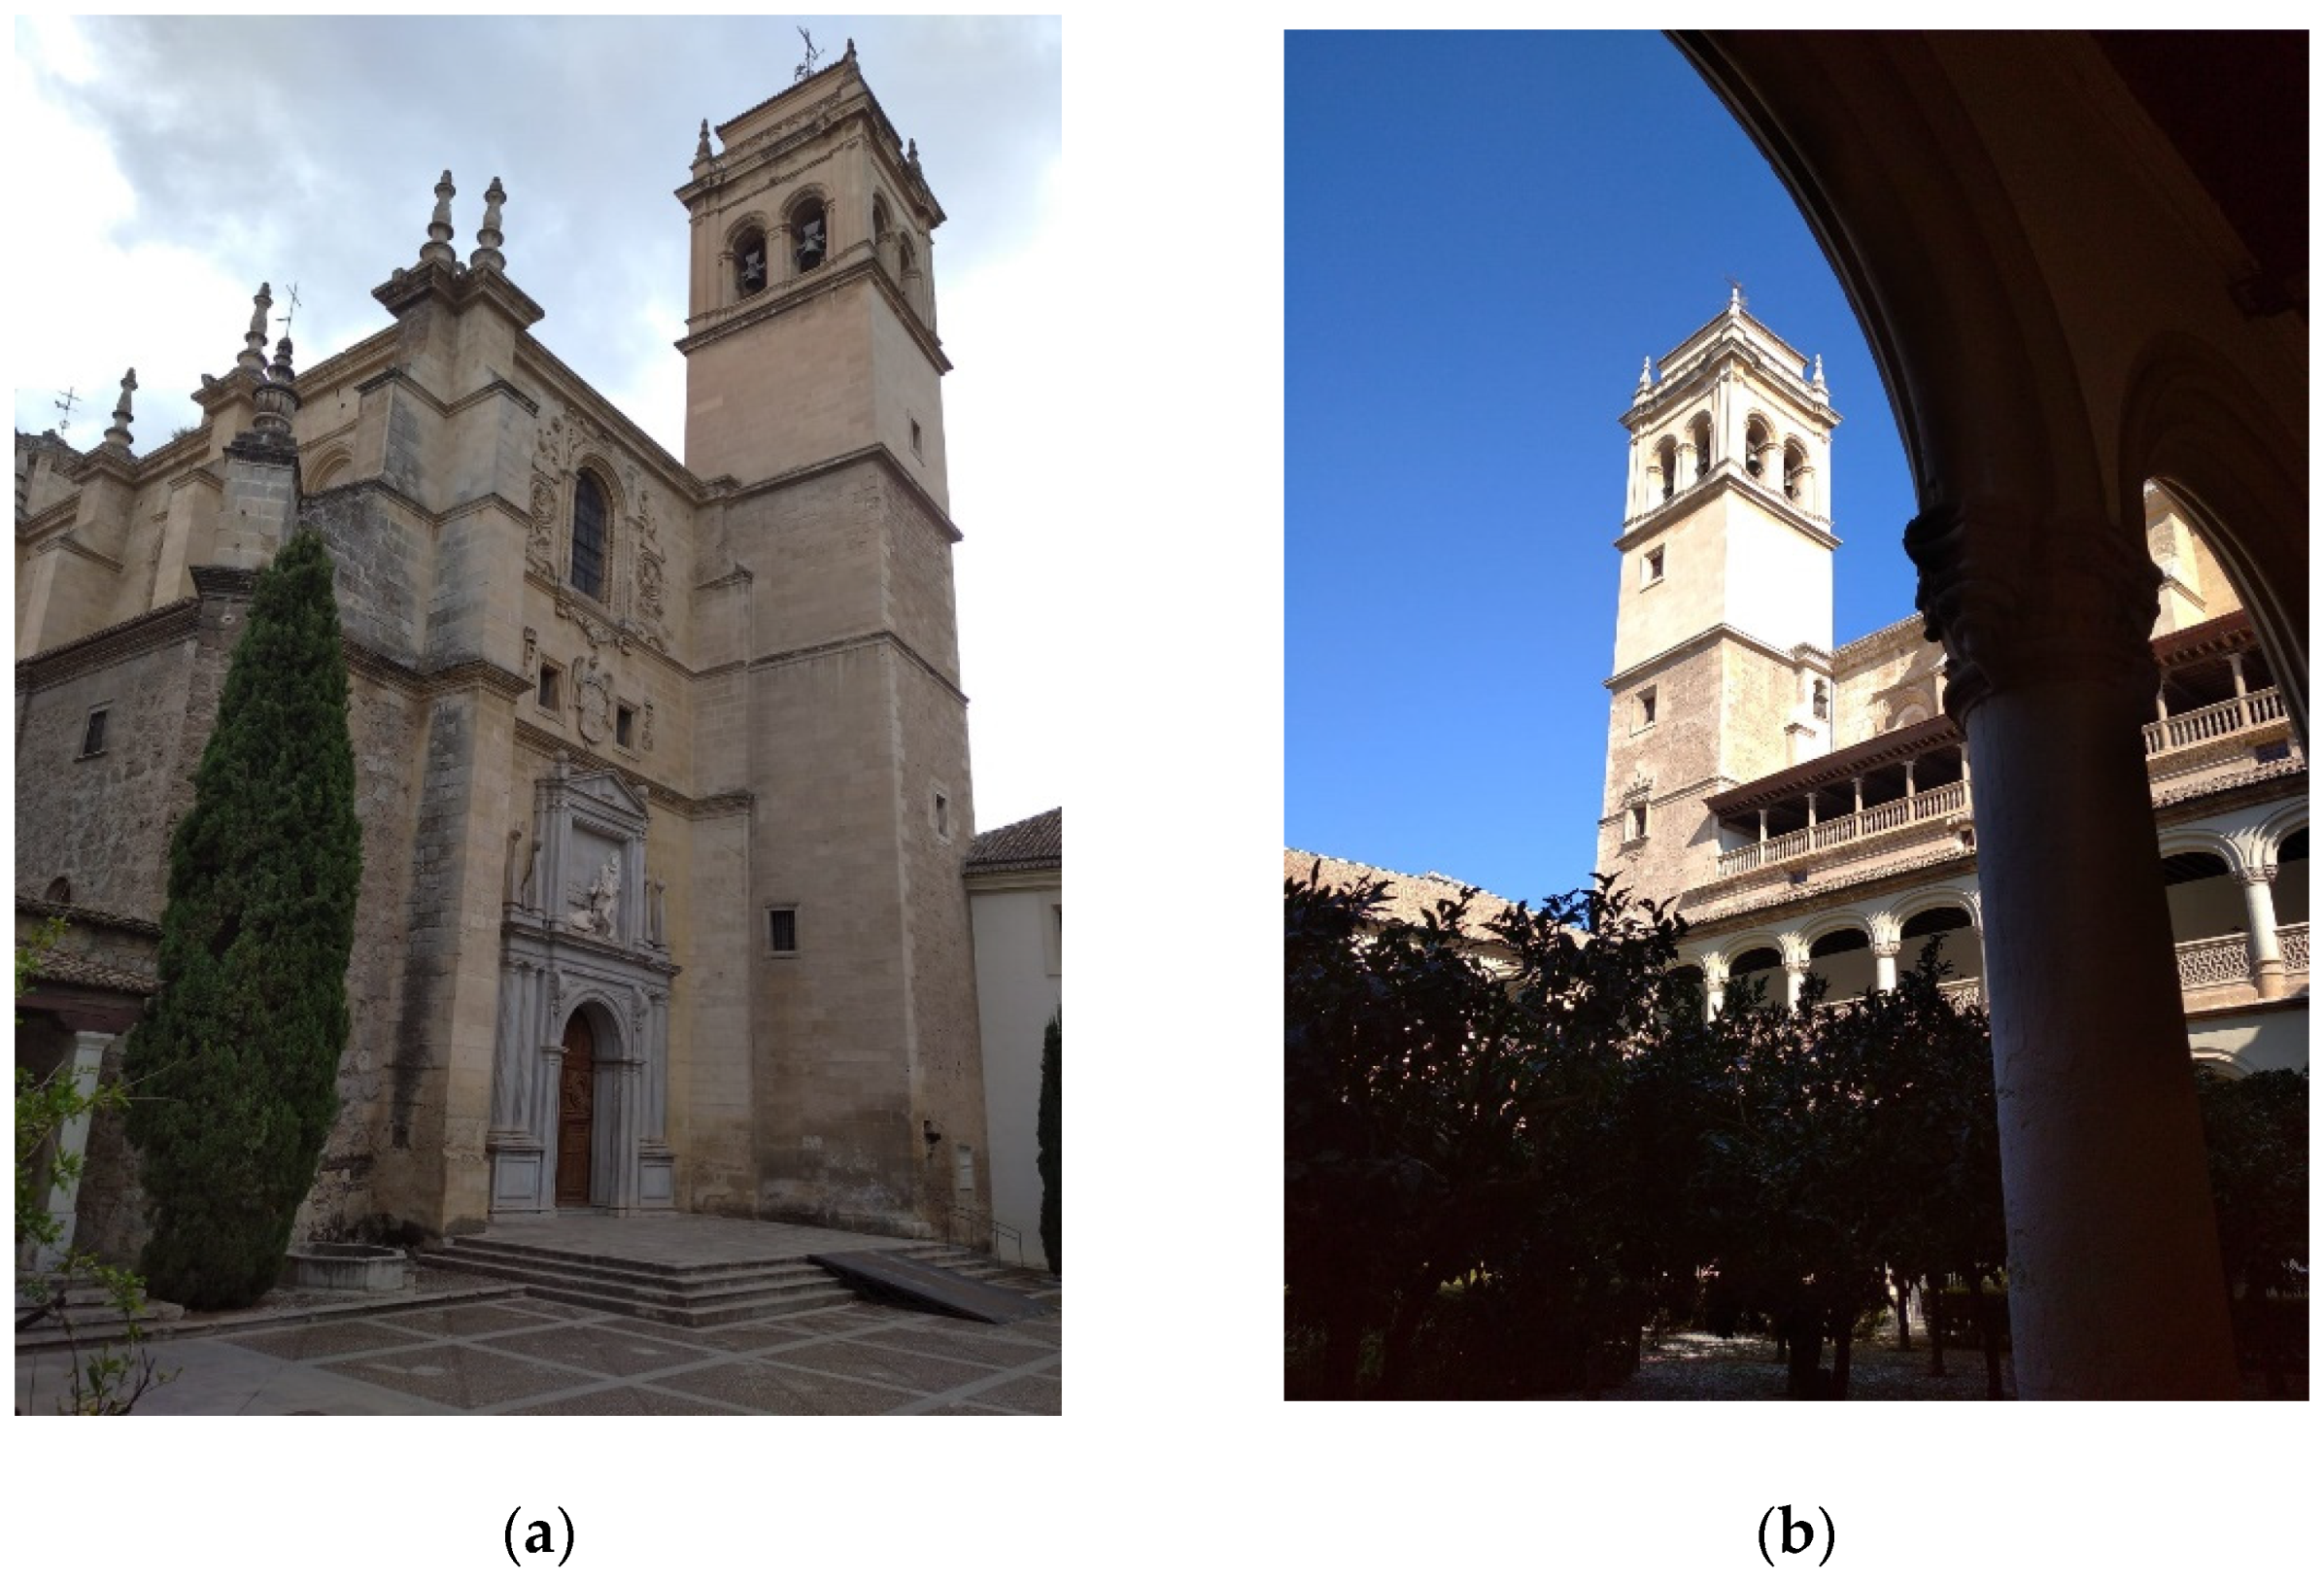
2.1.1. Monastery of San Jerónimo
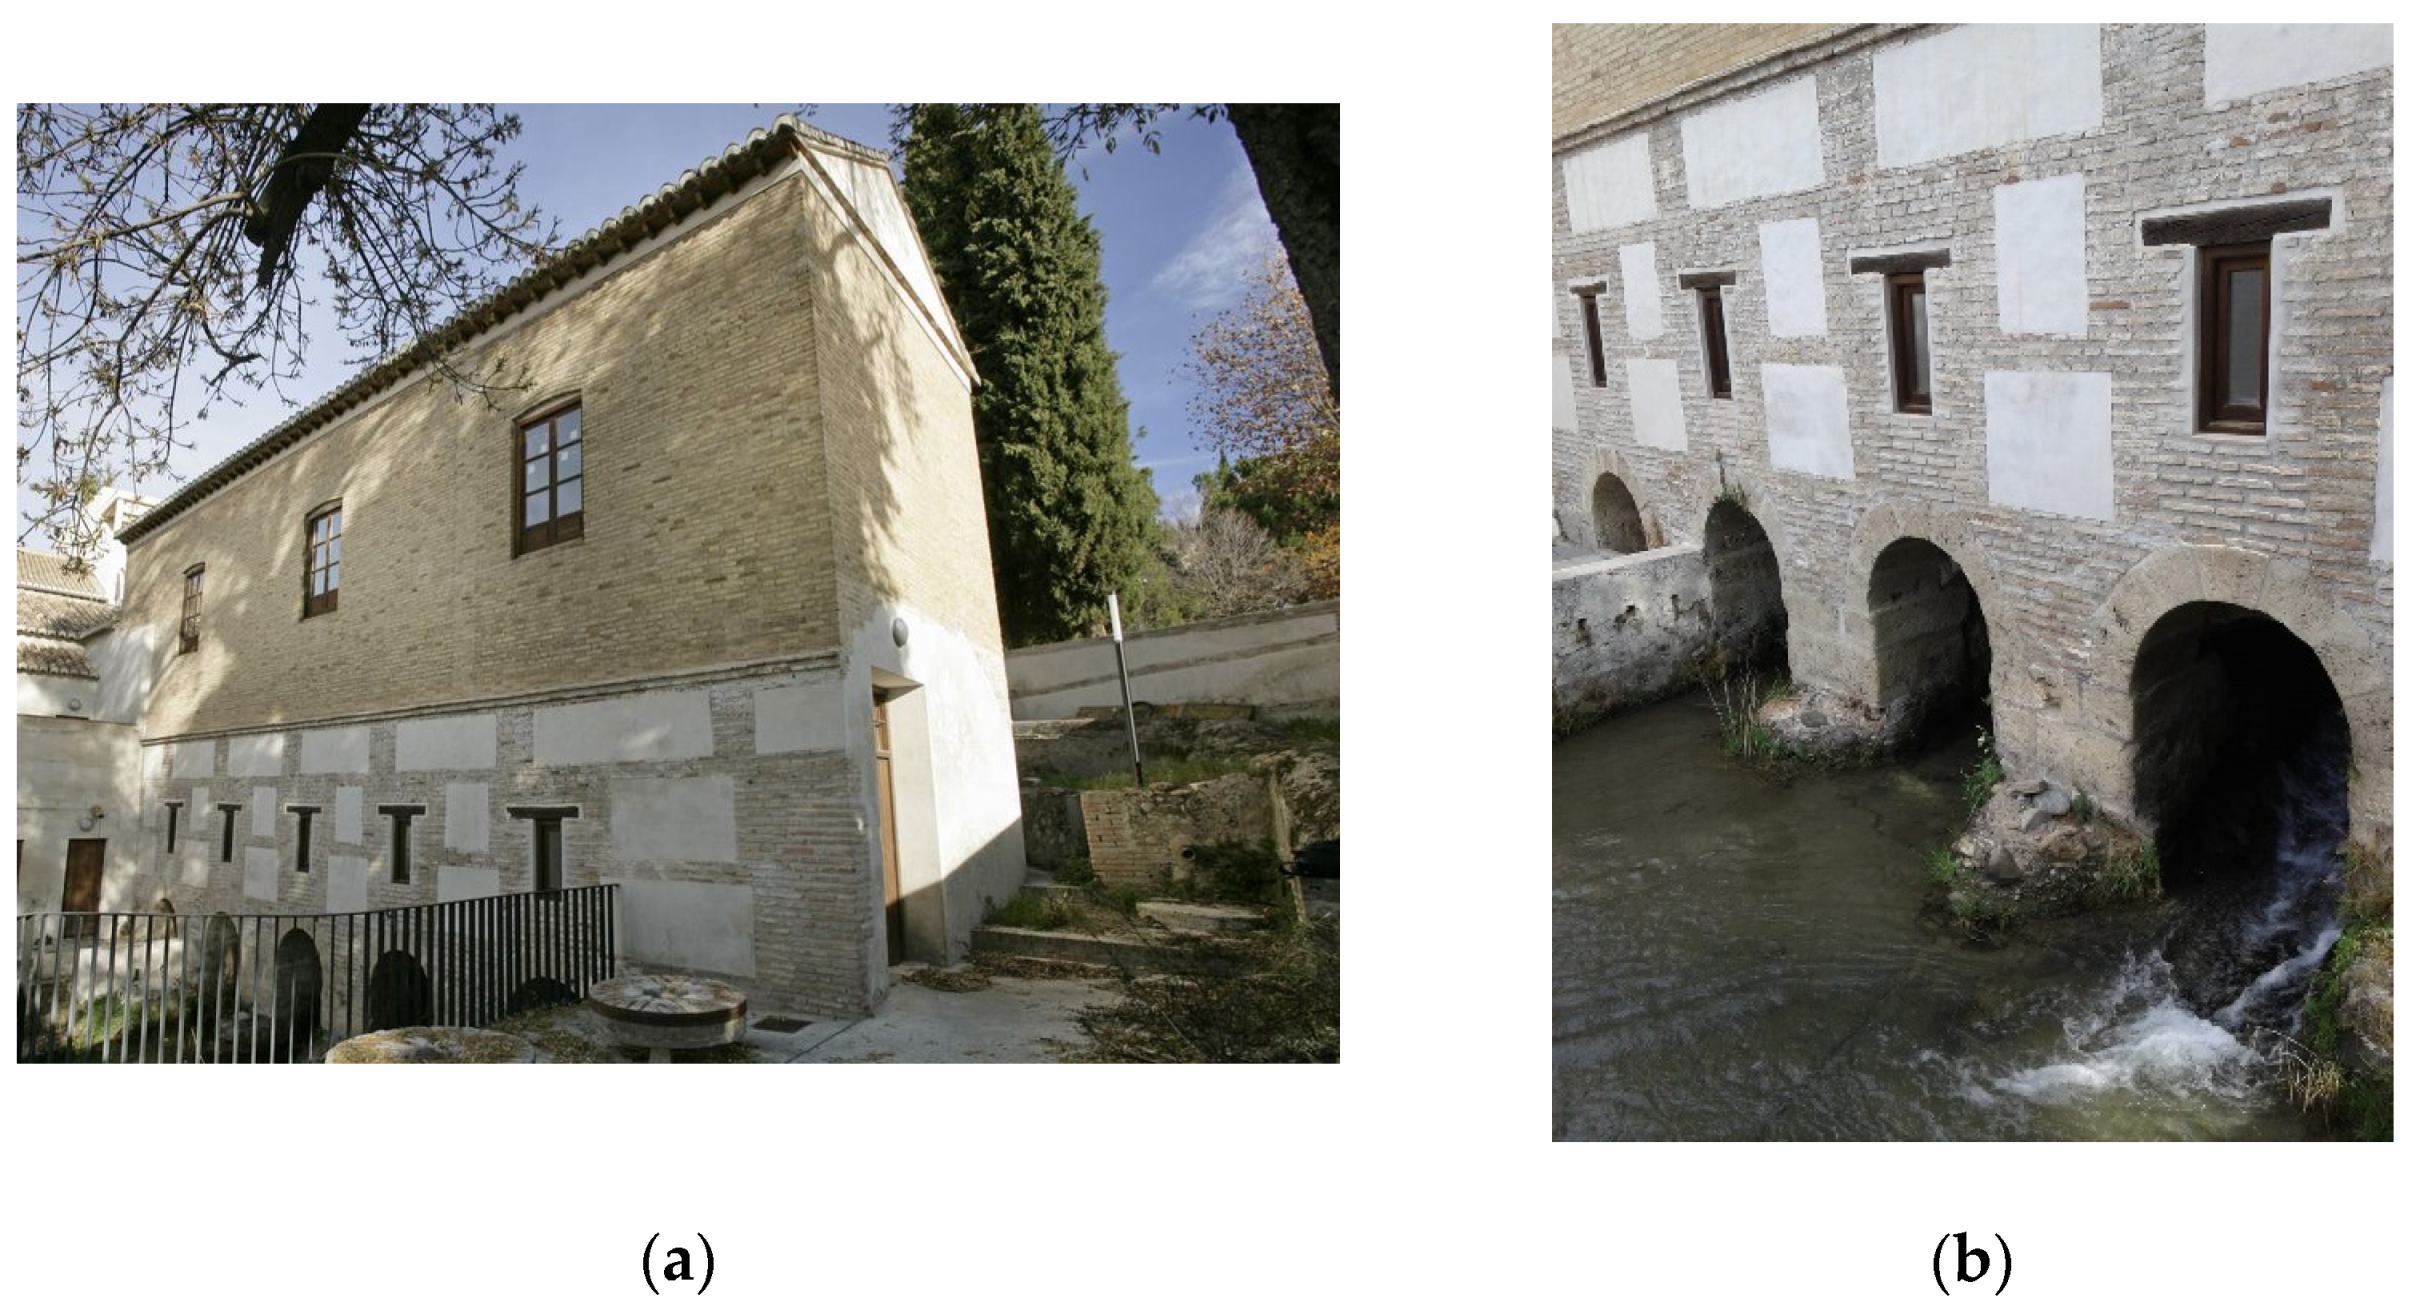
2.1.2. Molino del Marqués de Rivas
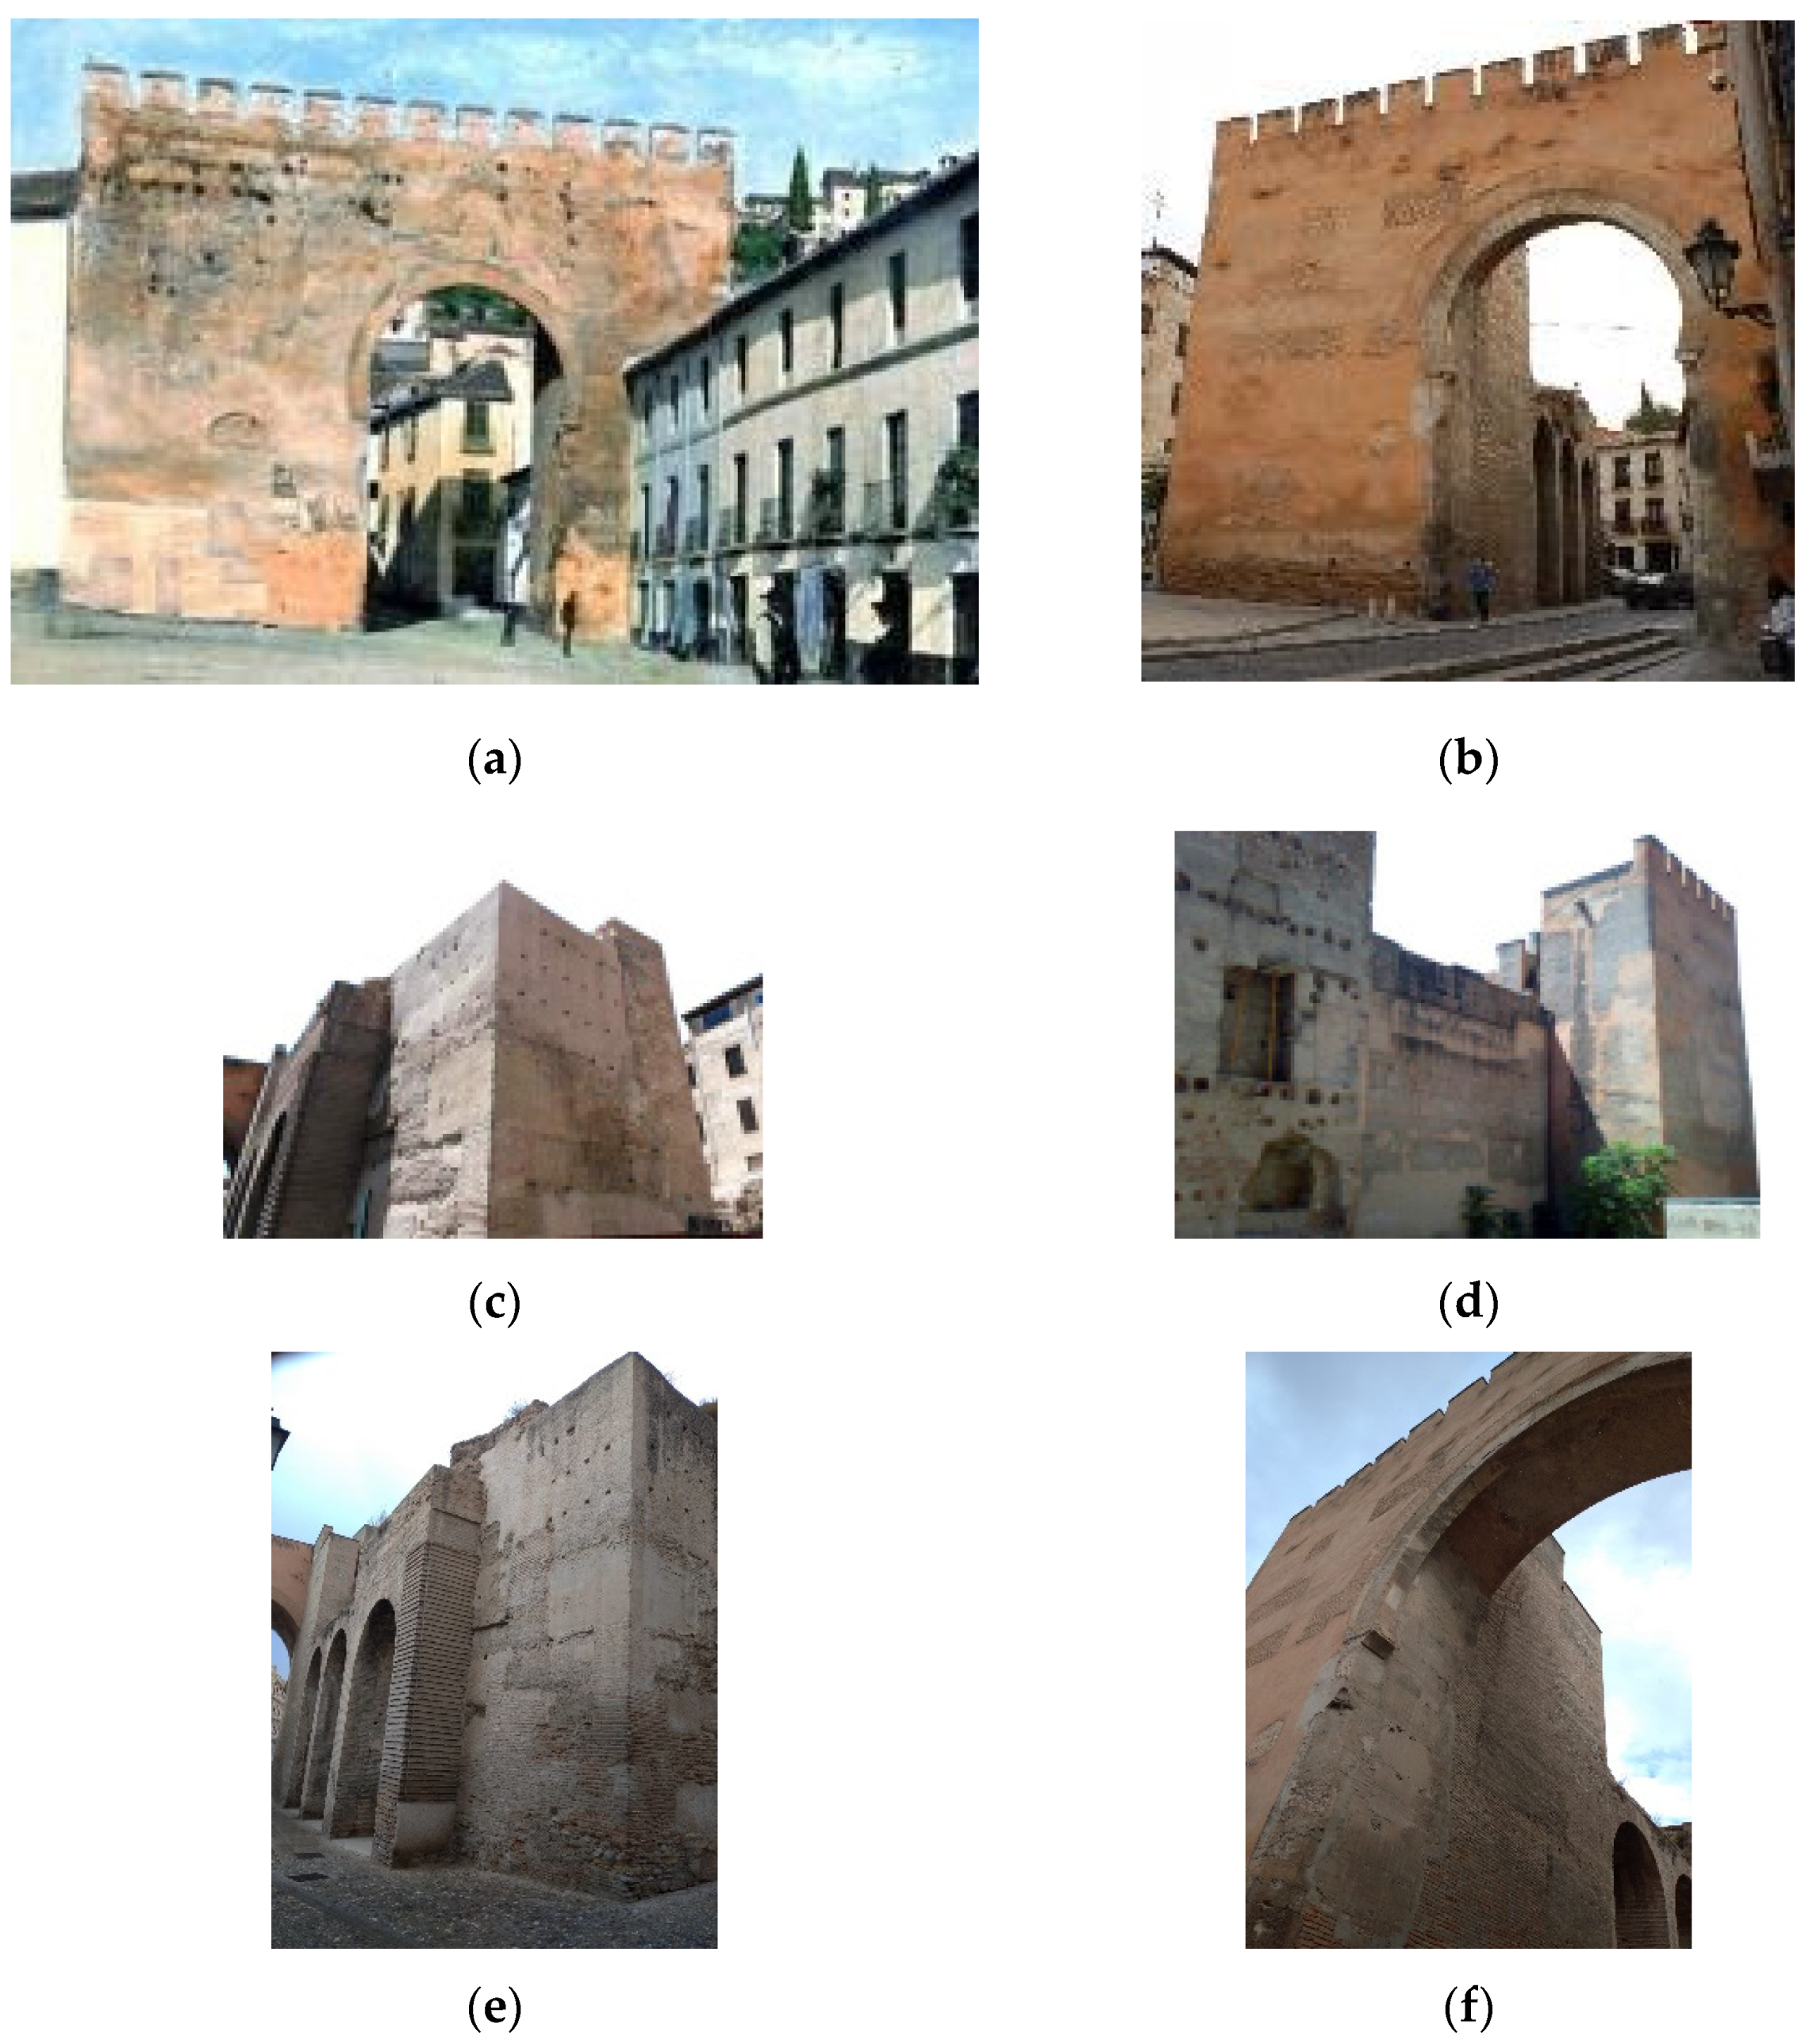
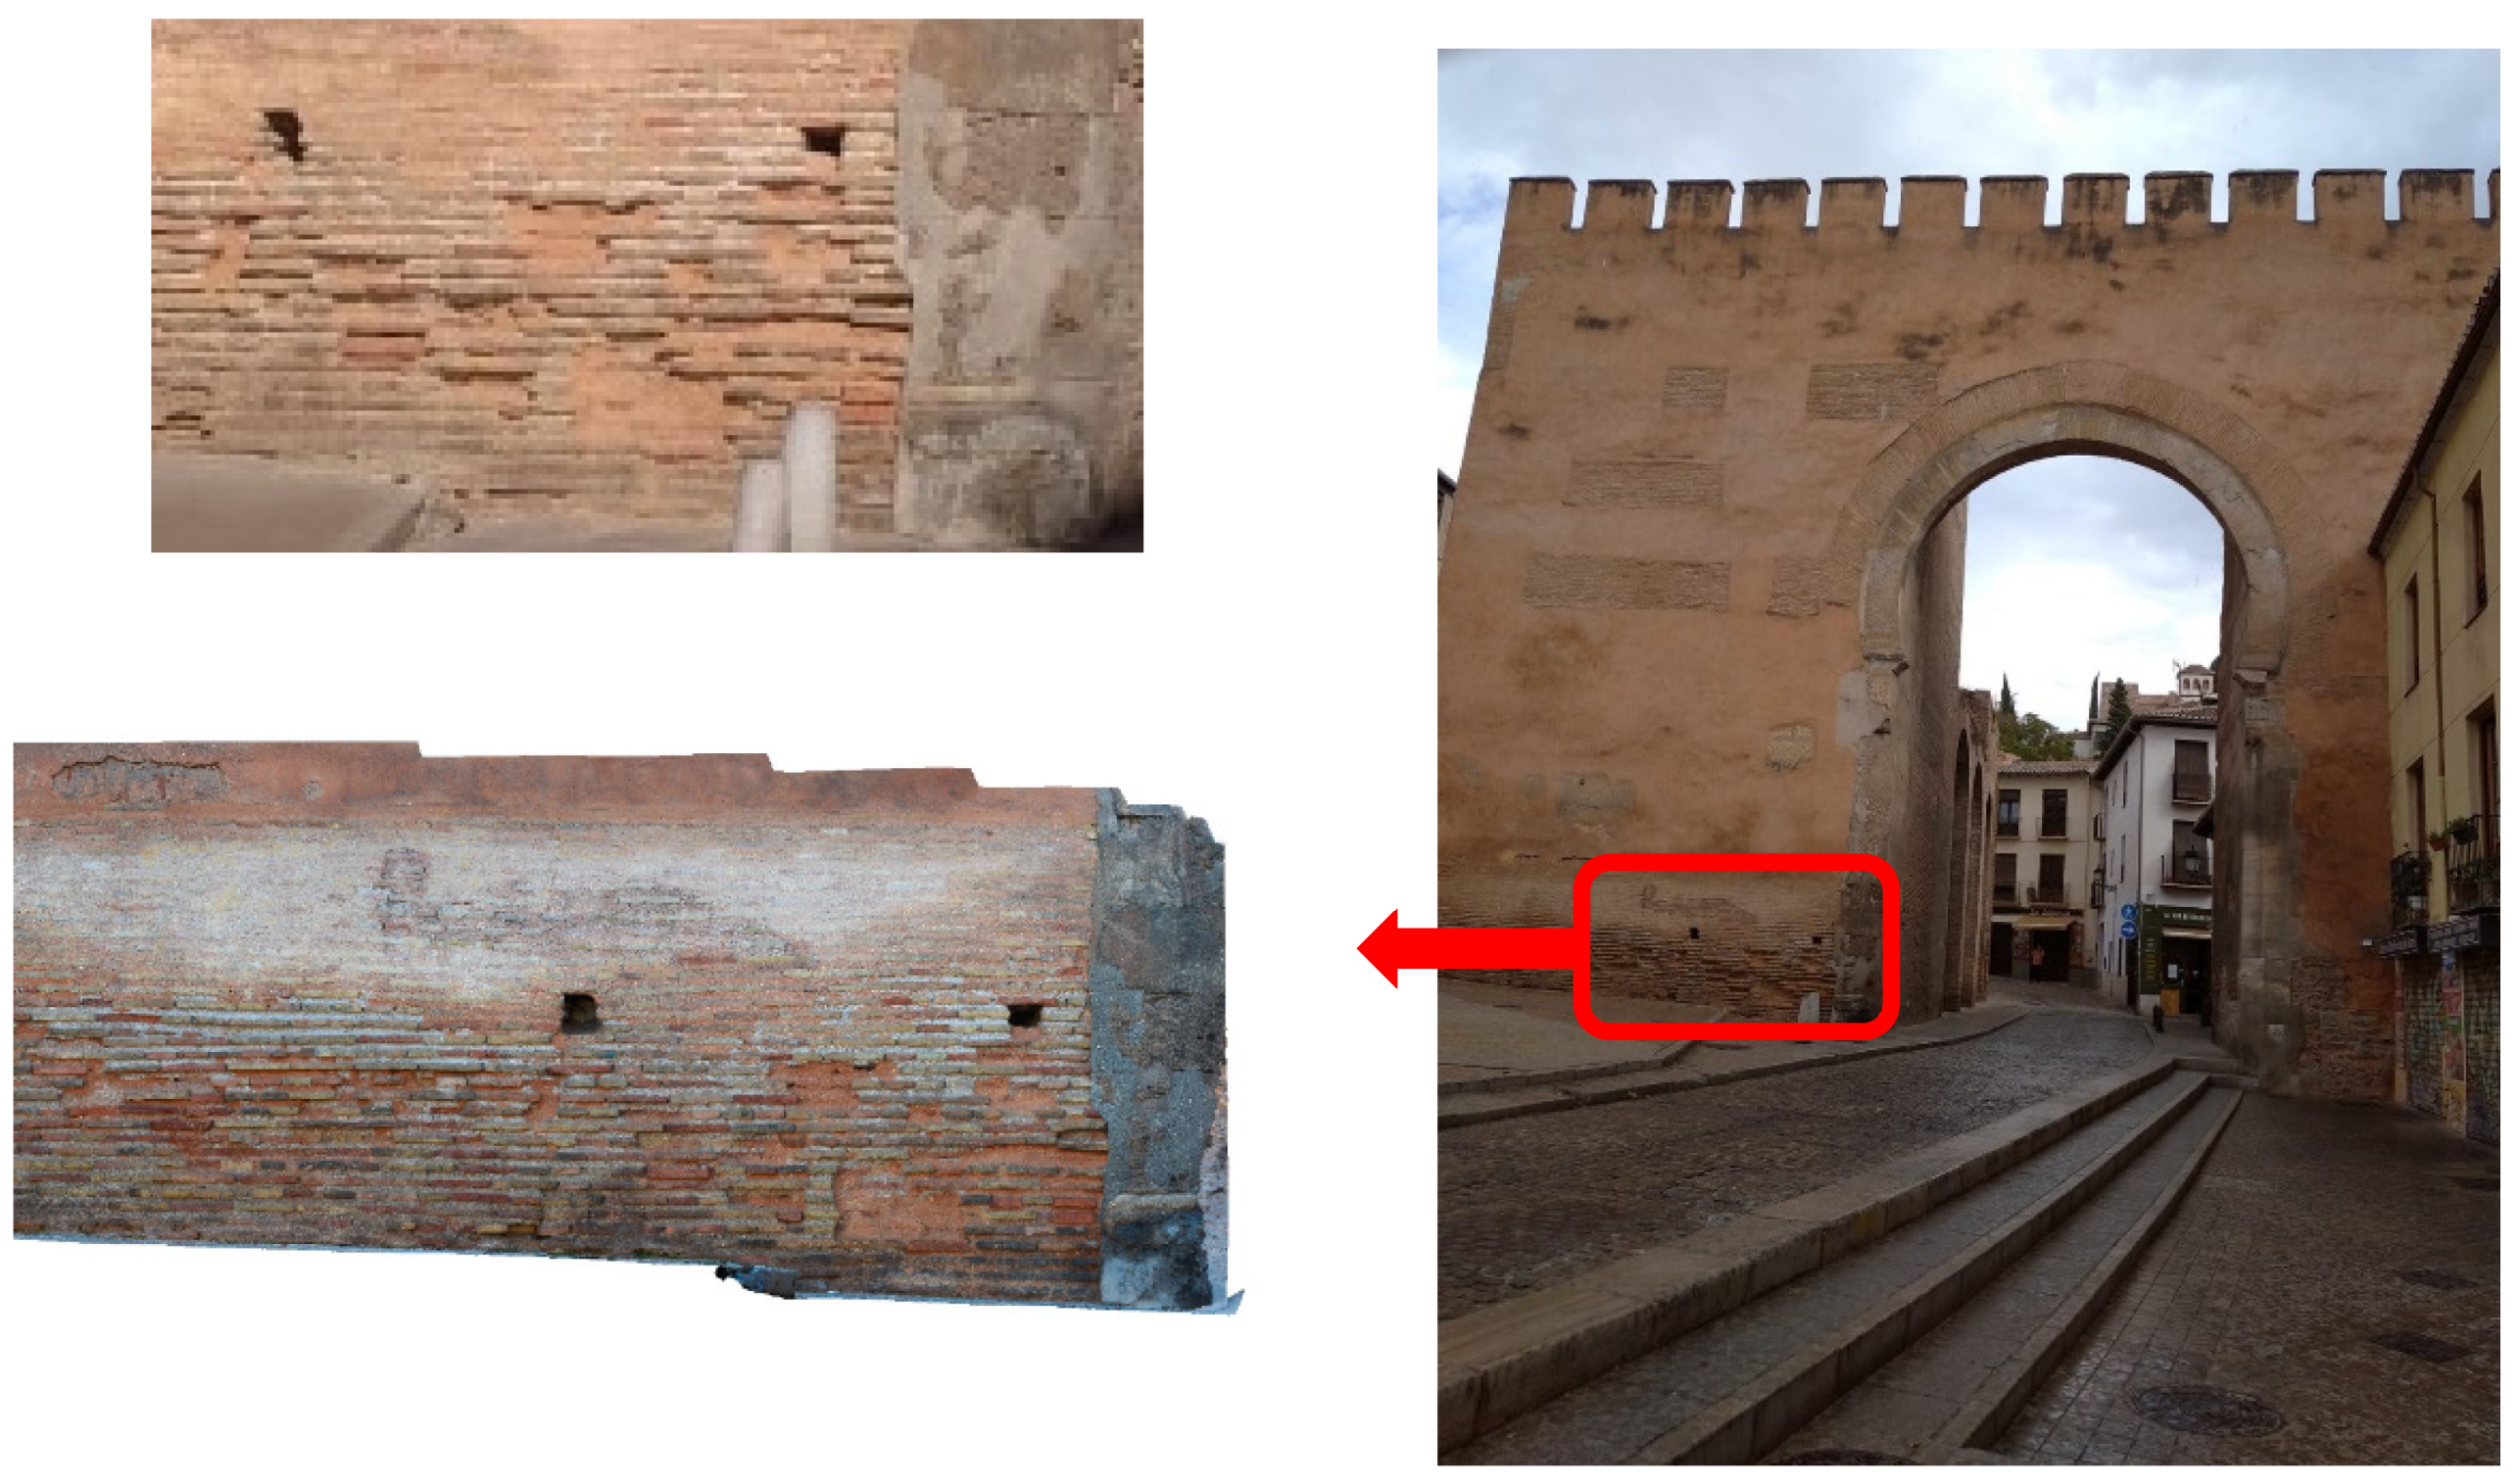
2.1.3. Puerta Elvira (Granada, Spain)
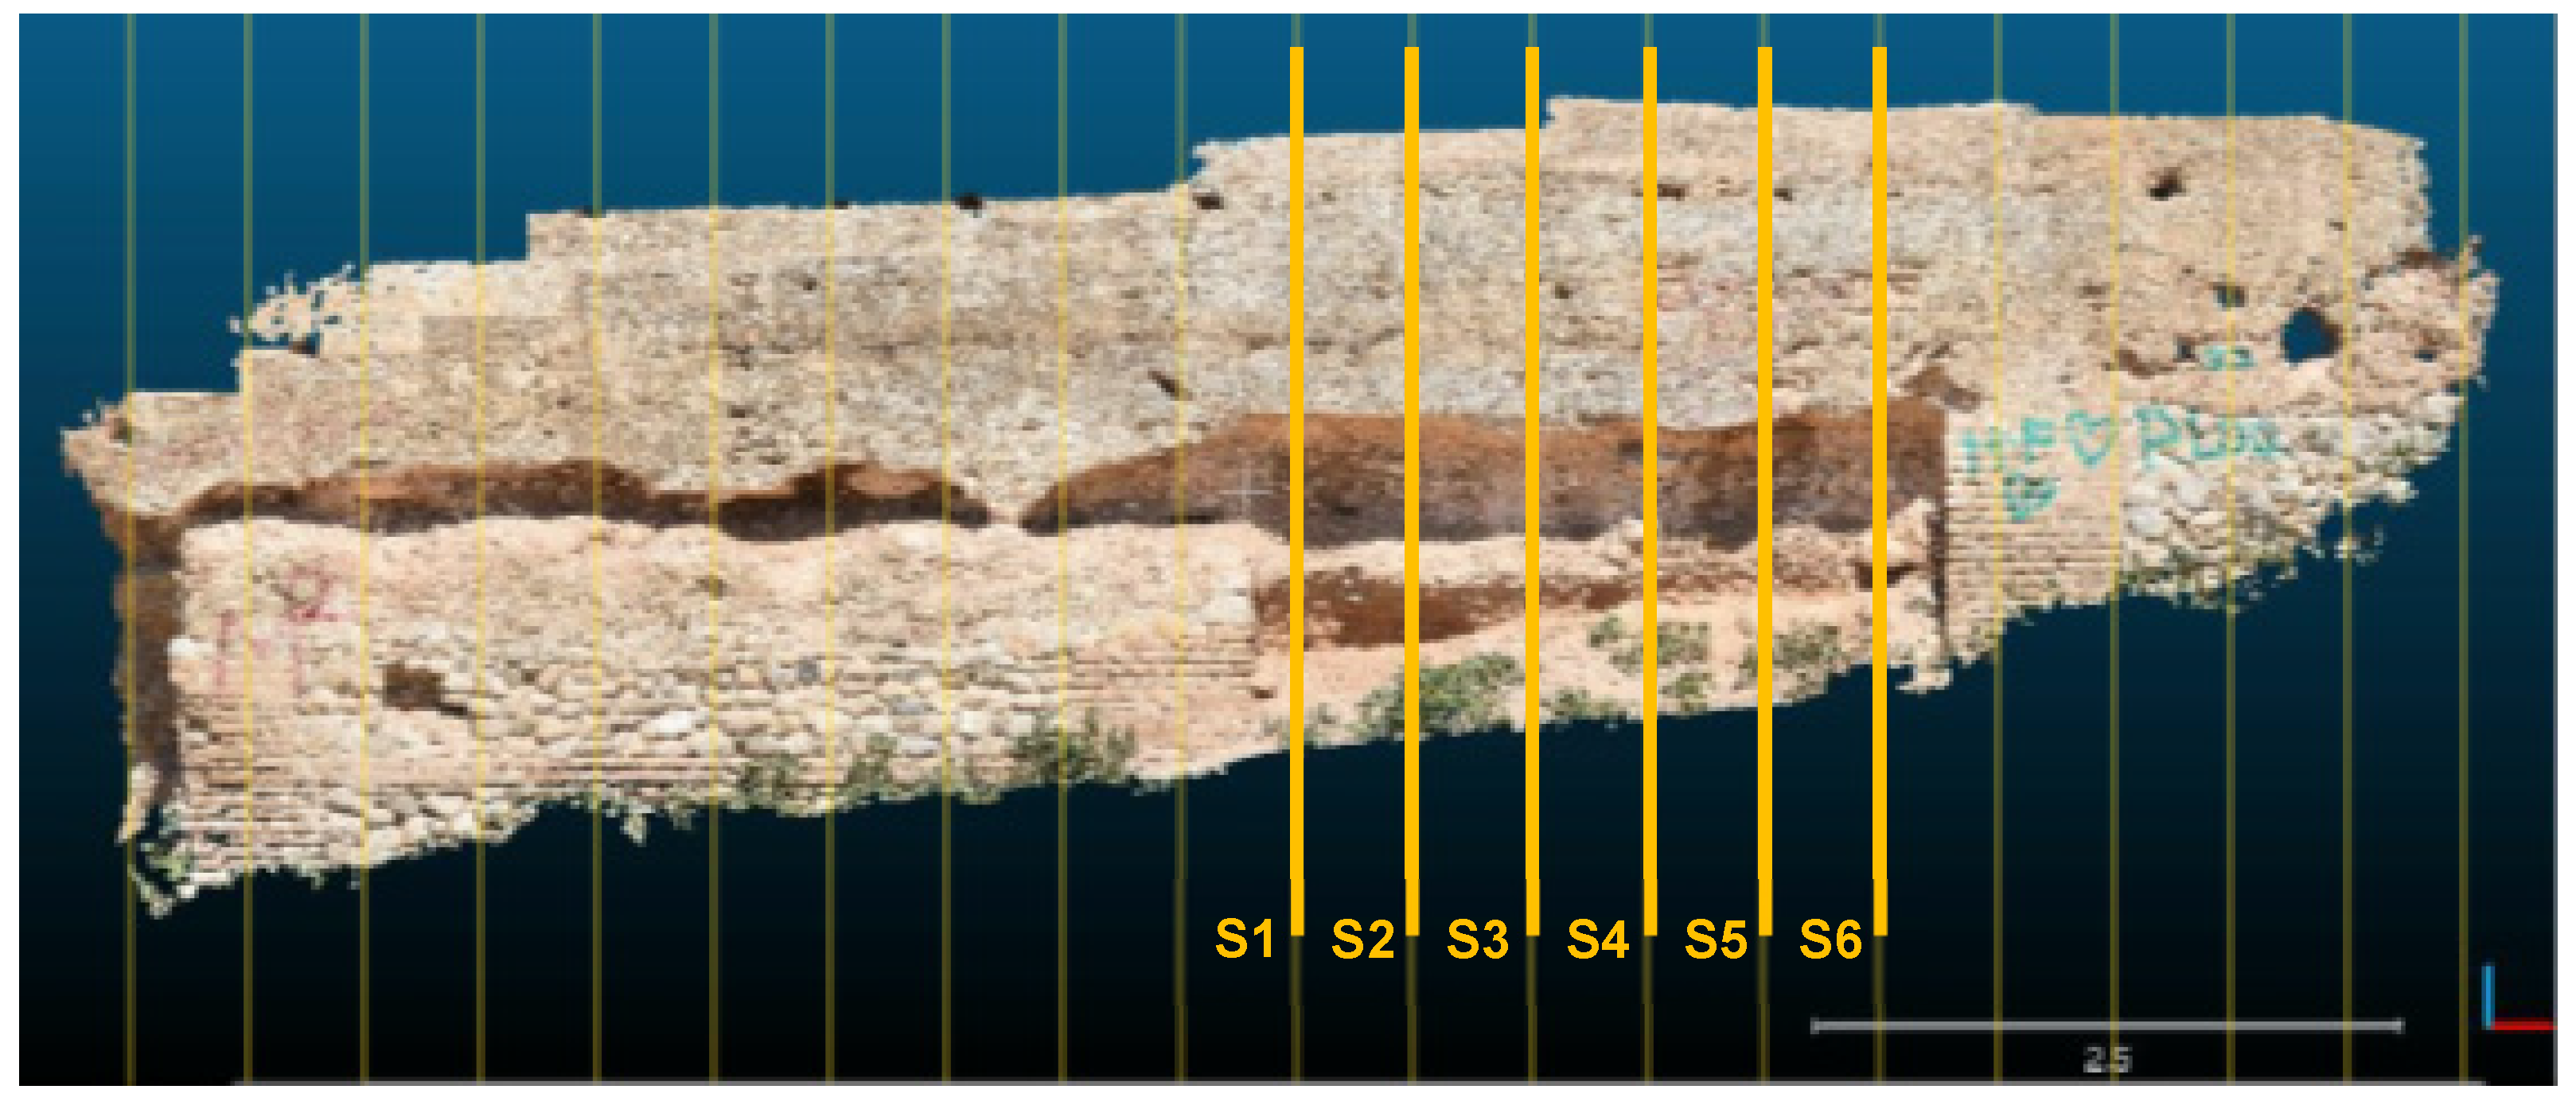
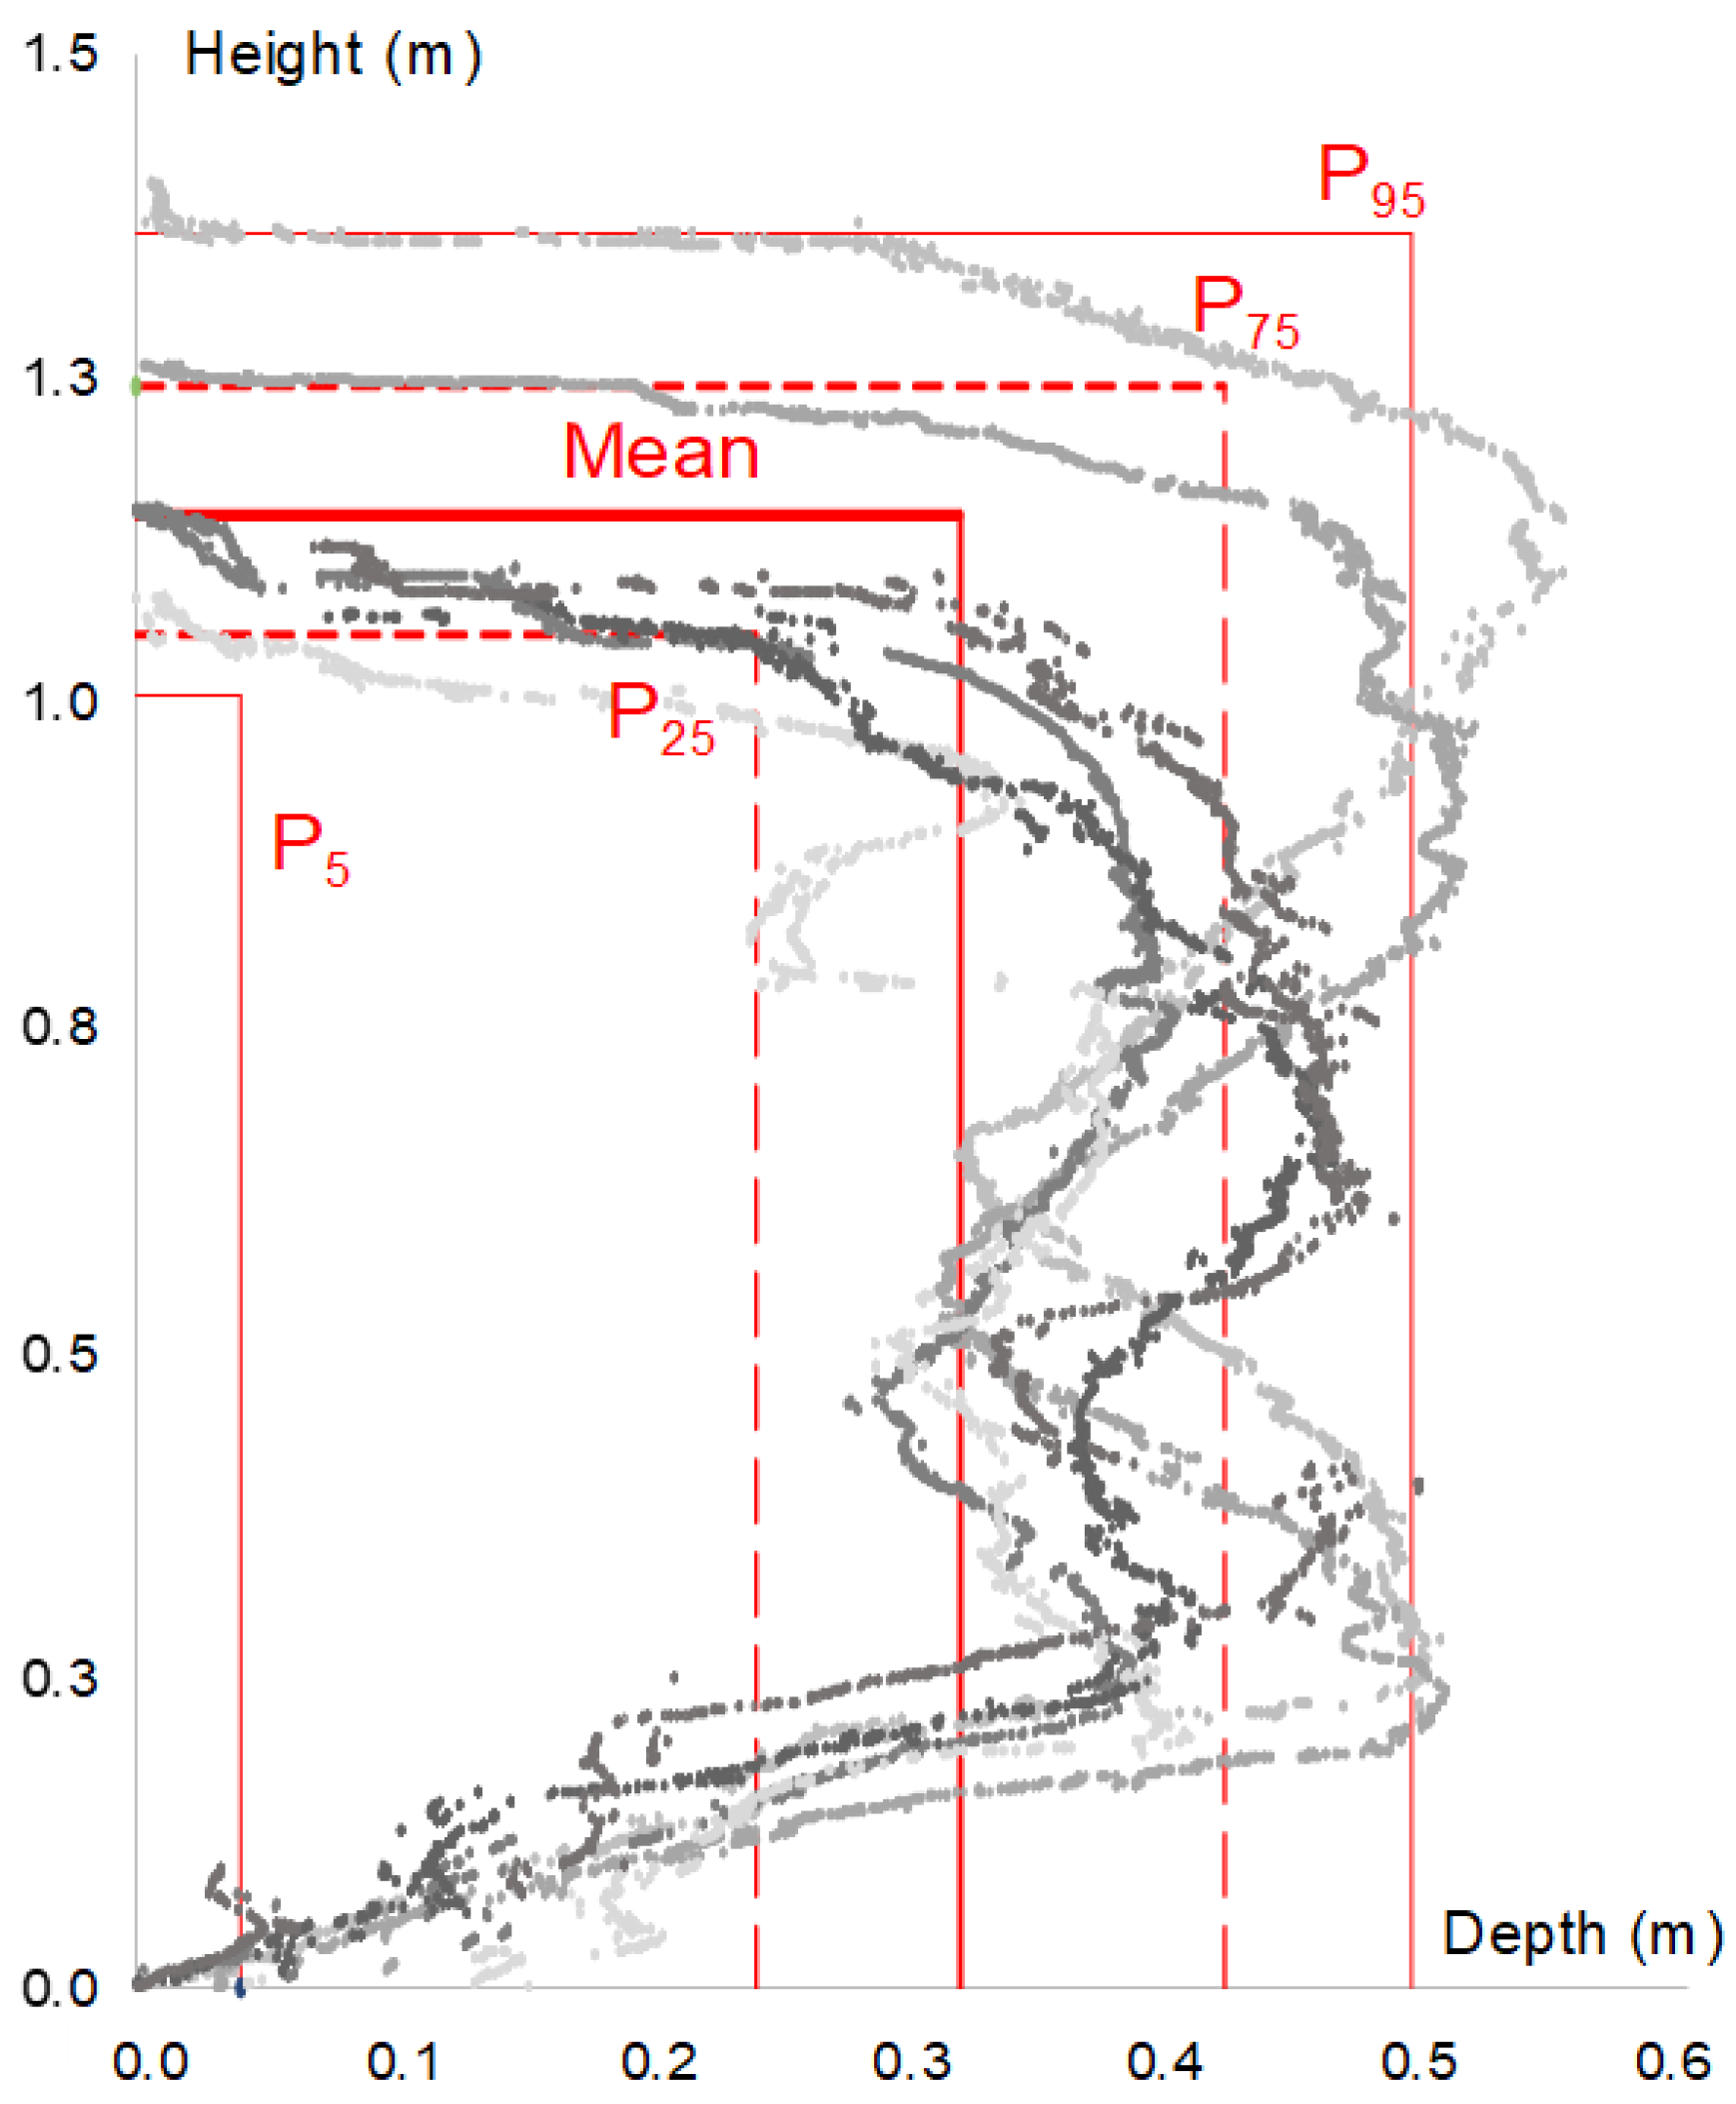
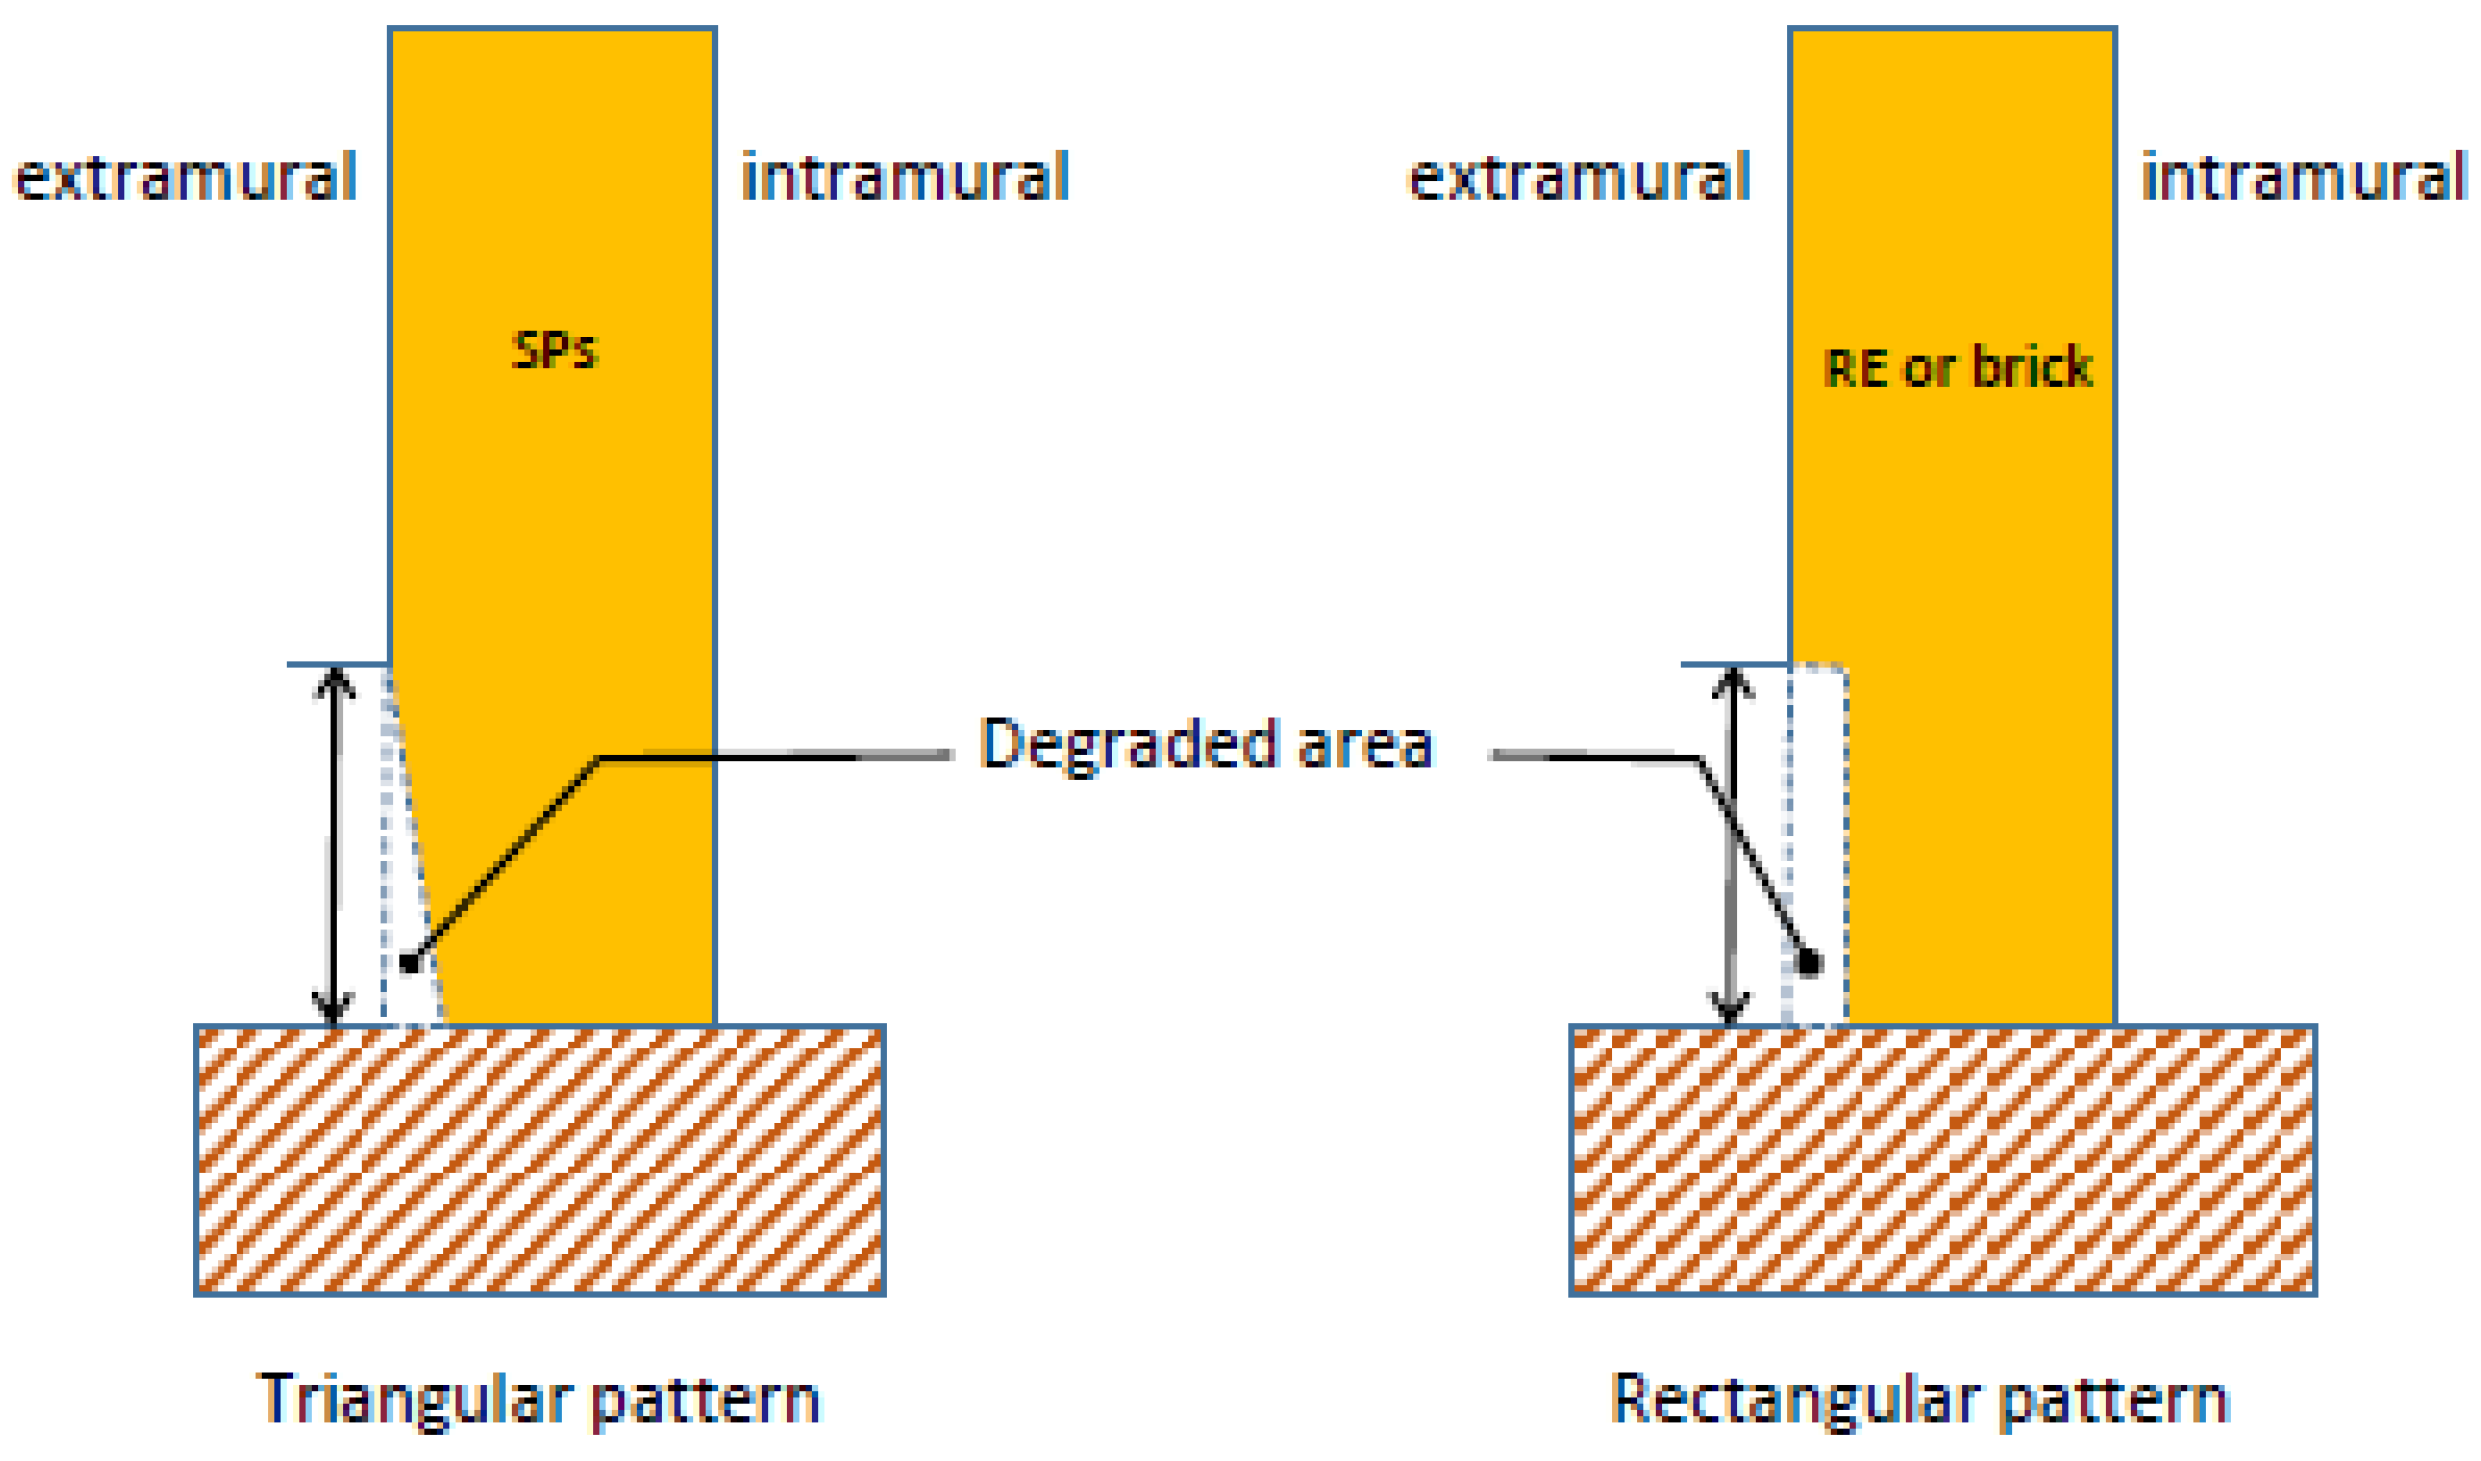
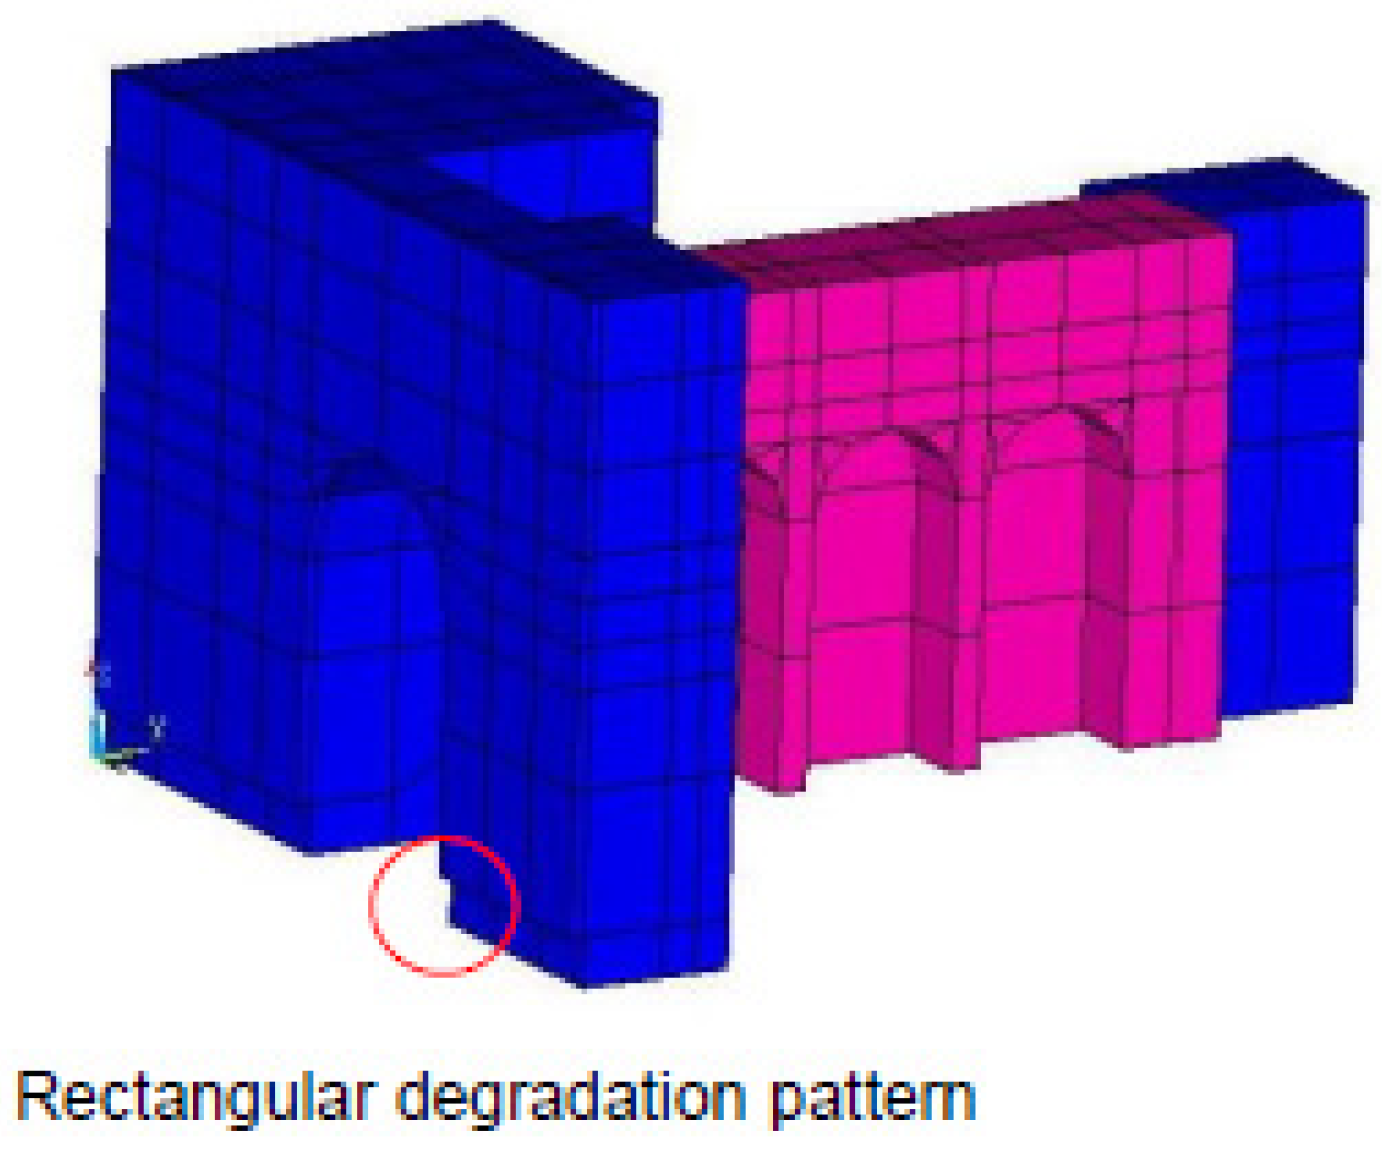
2.2. Degradation Pattern of Rammed Earth
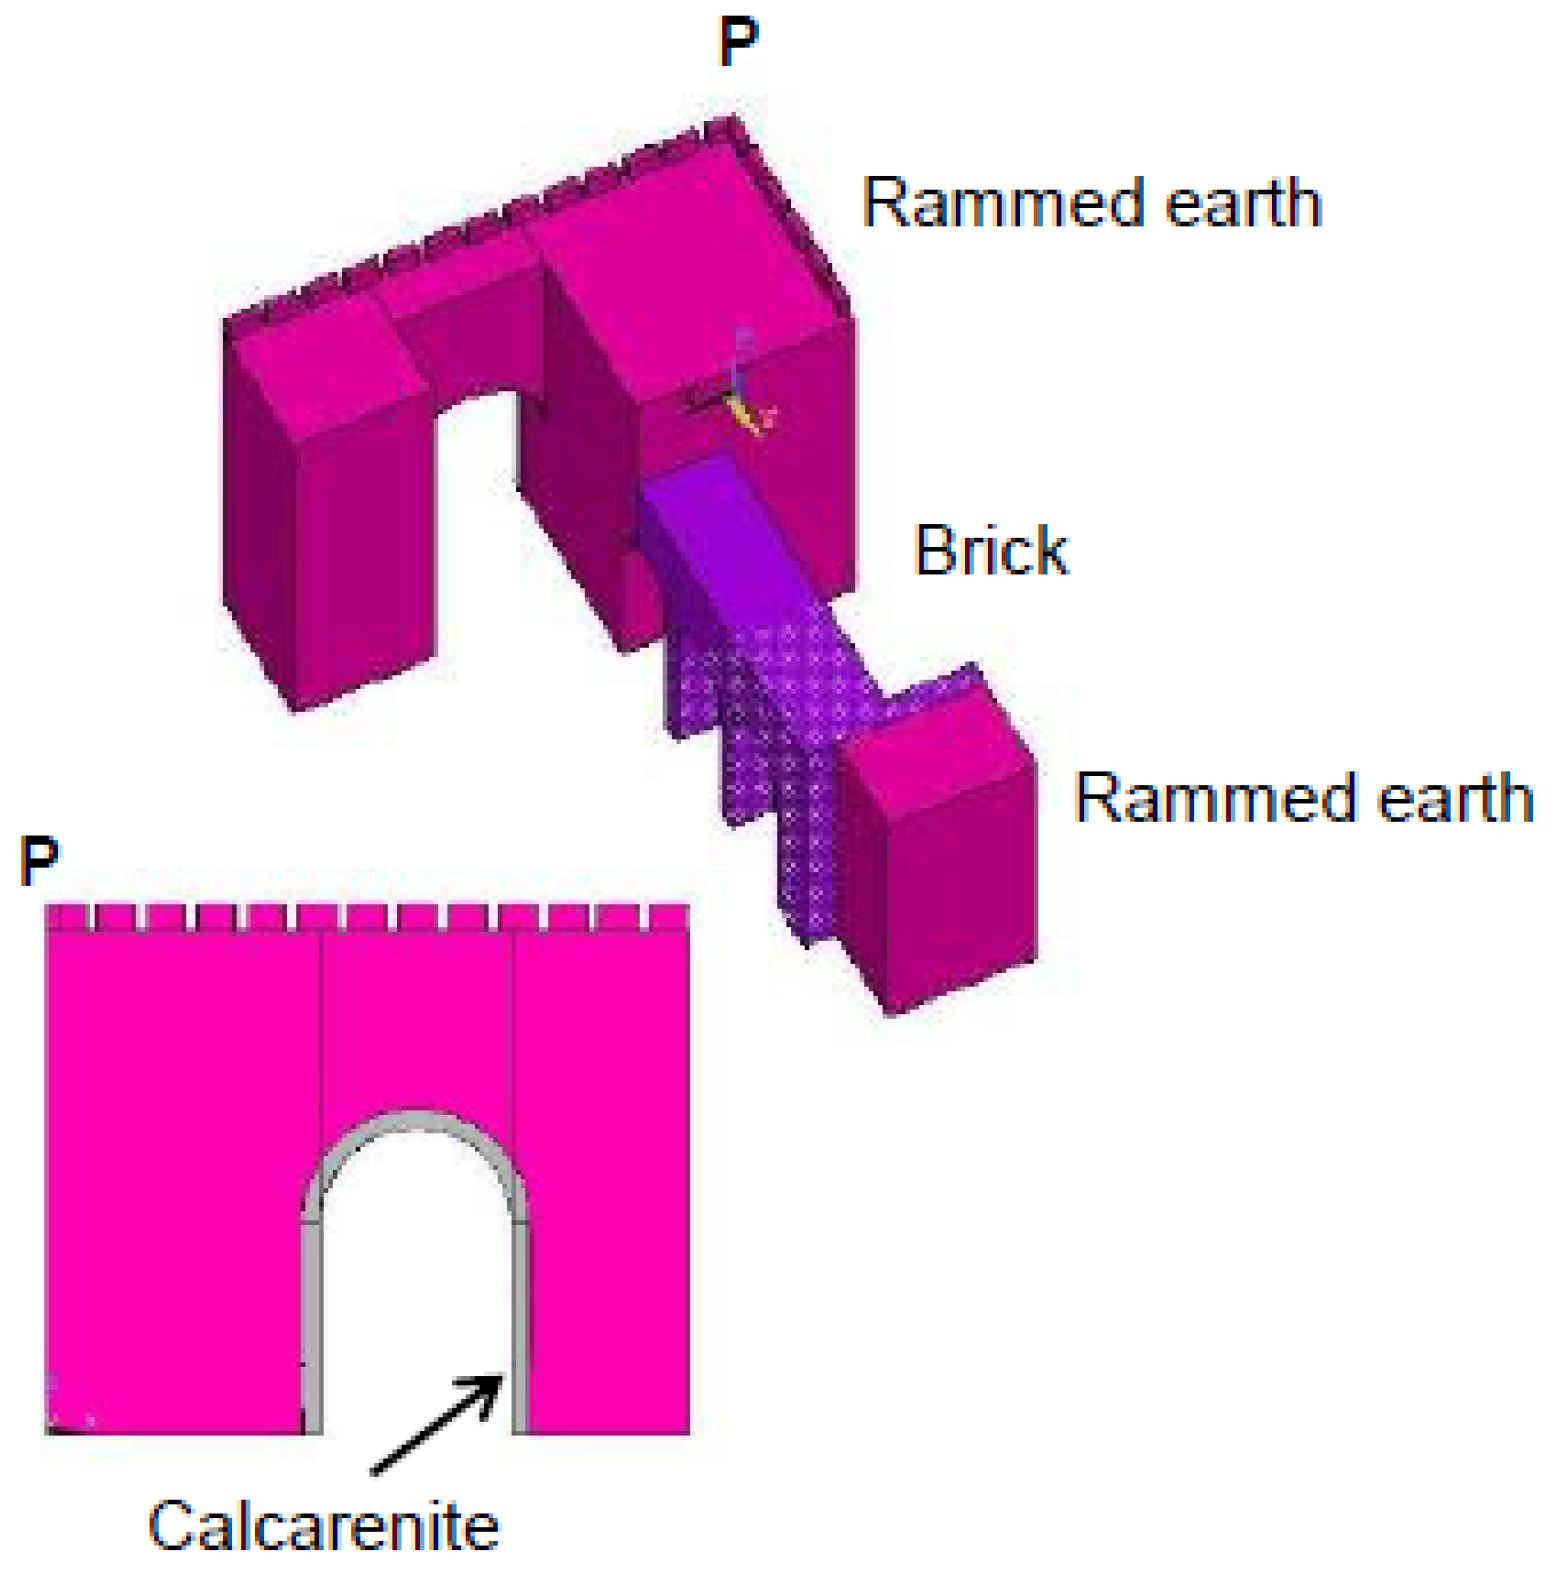
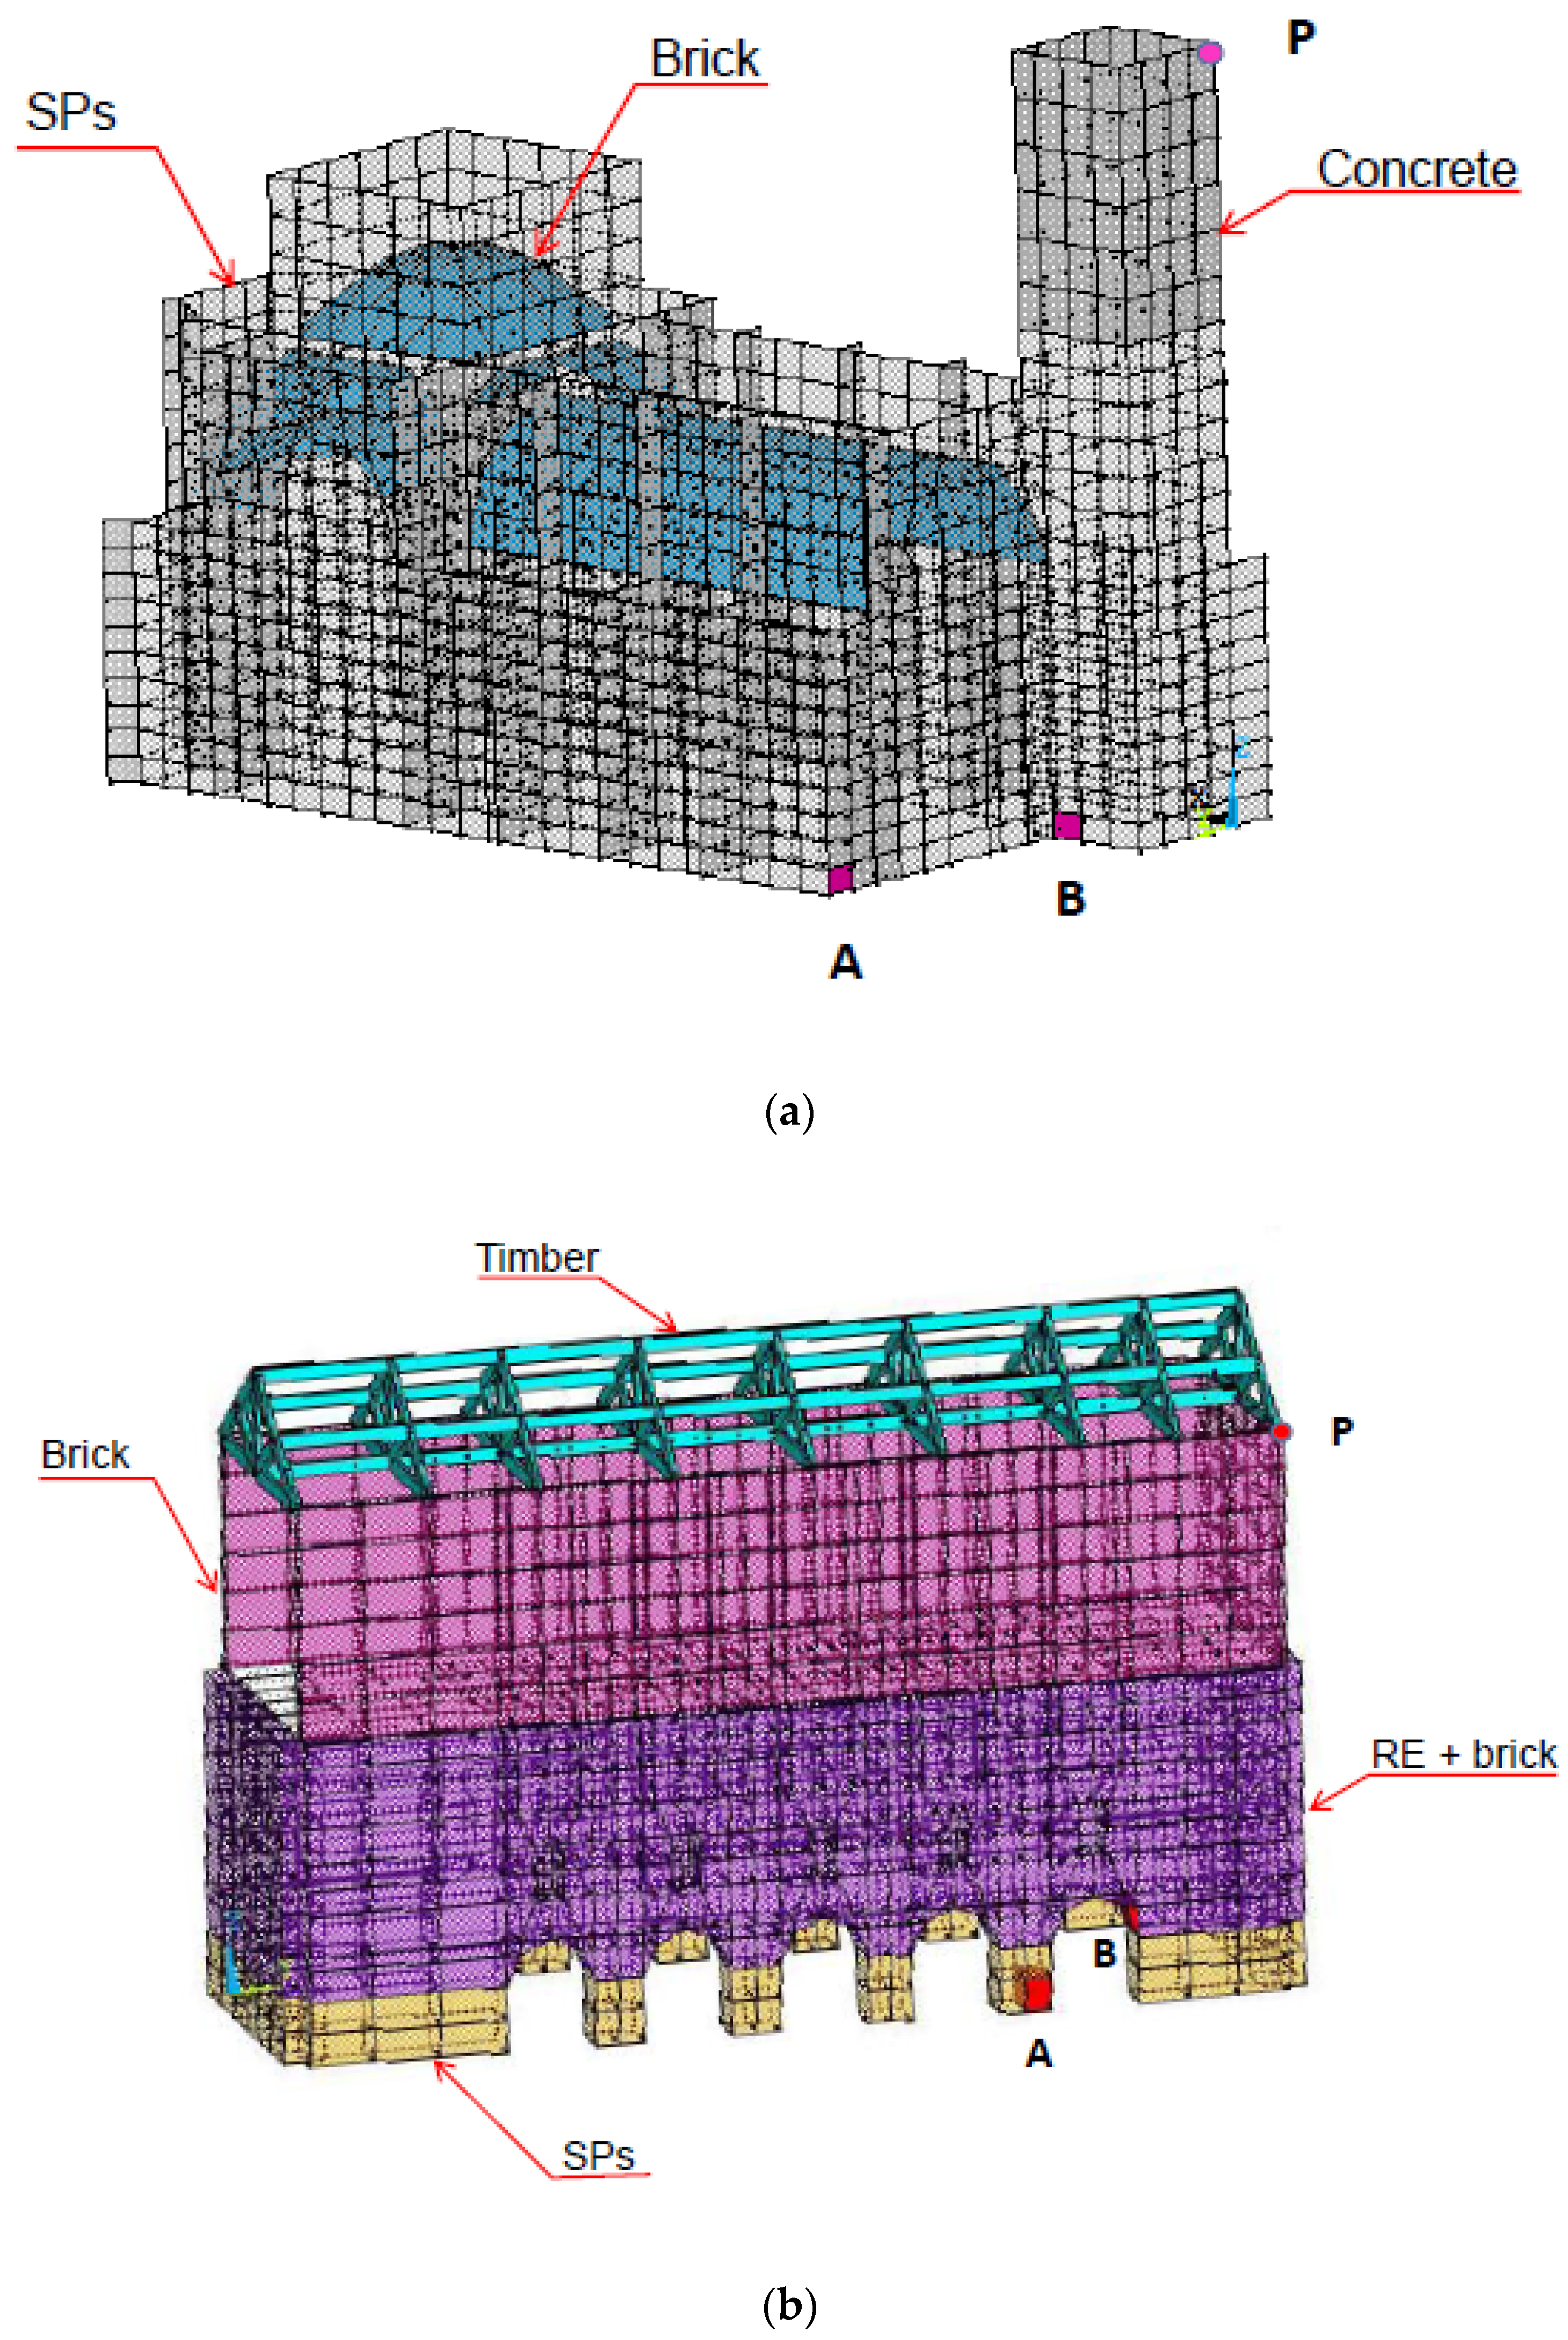
2.3. Finite Element Models
3. Results
3.1. Puerta Elvira
3.2. San Jerónimo Monastery
3.3. Molino del Marqués de Rivas
4. Conclusions
- (i)
- The damage state definition or damage threshold must be defined for each CH building. In two out of the three case-studies, damage was associated with a maximum displacement (drift-dependent), while in the third one, the damage threshold was the compressive strength of the material.
- (ii)
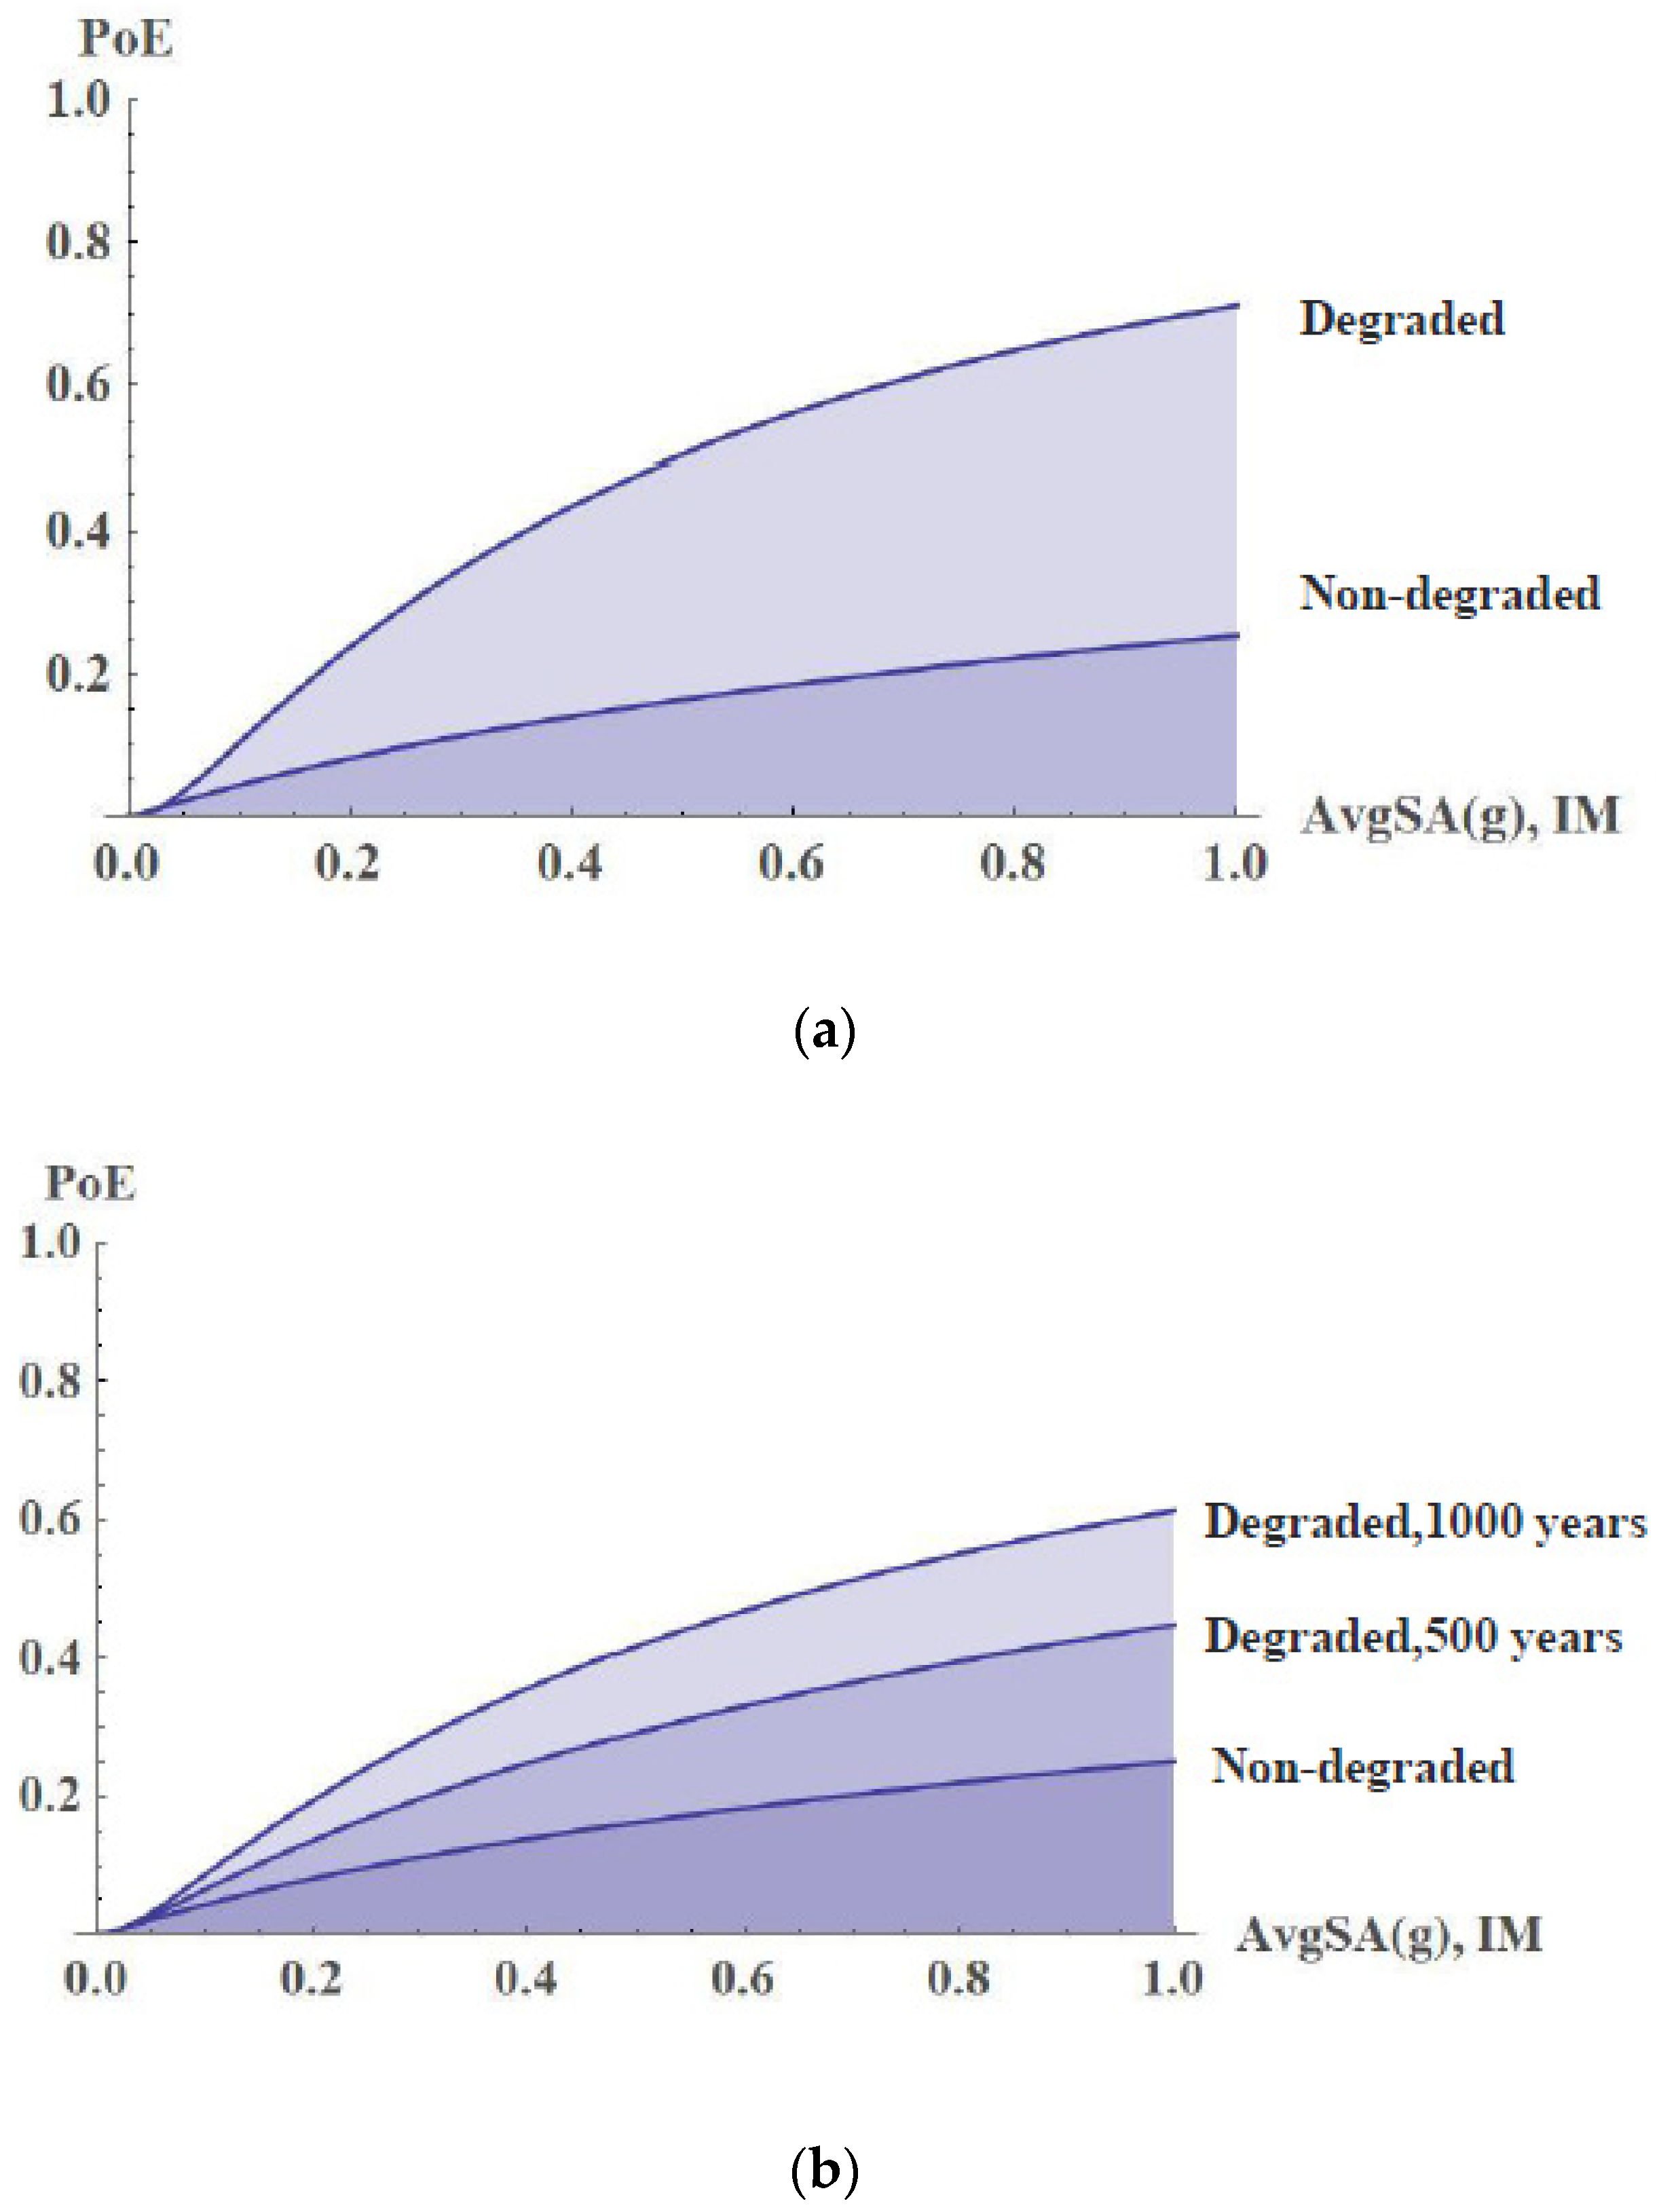
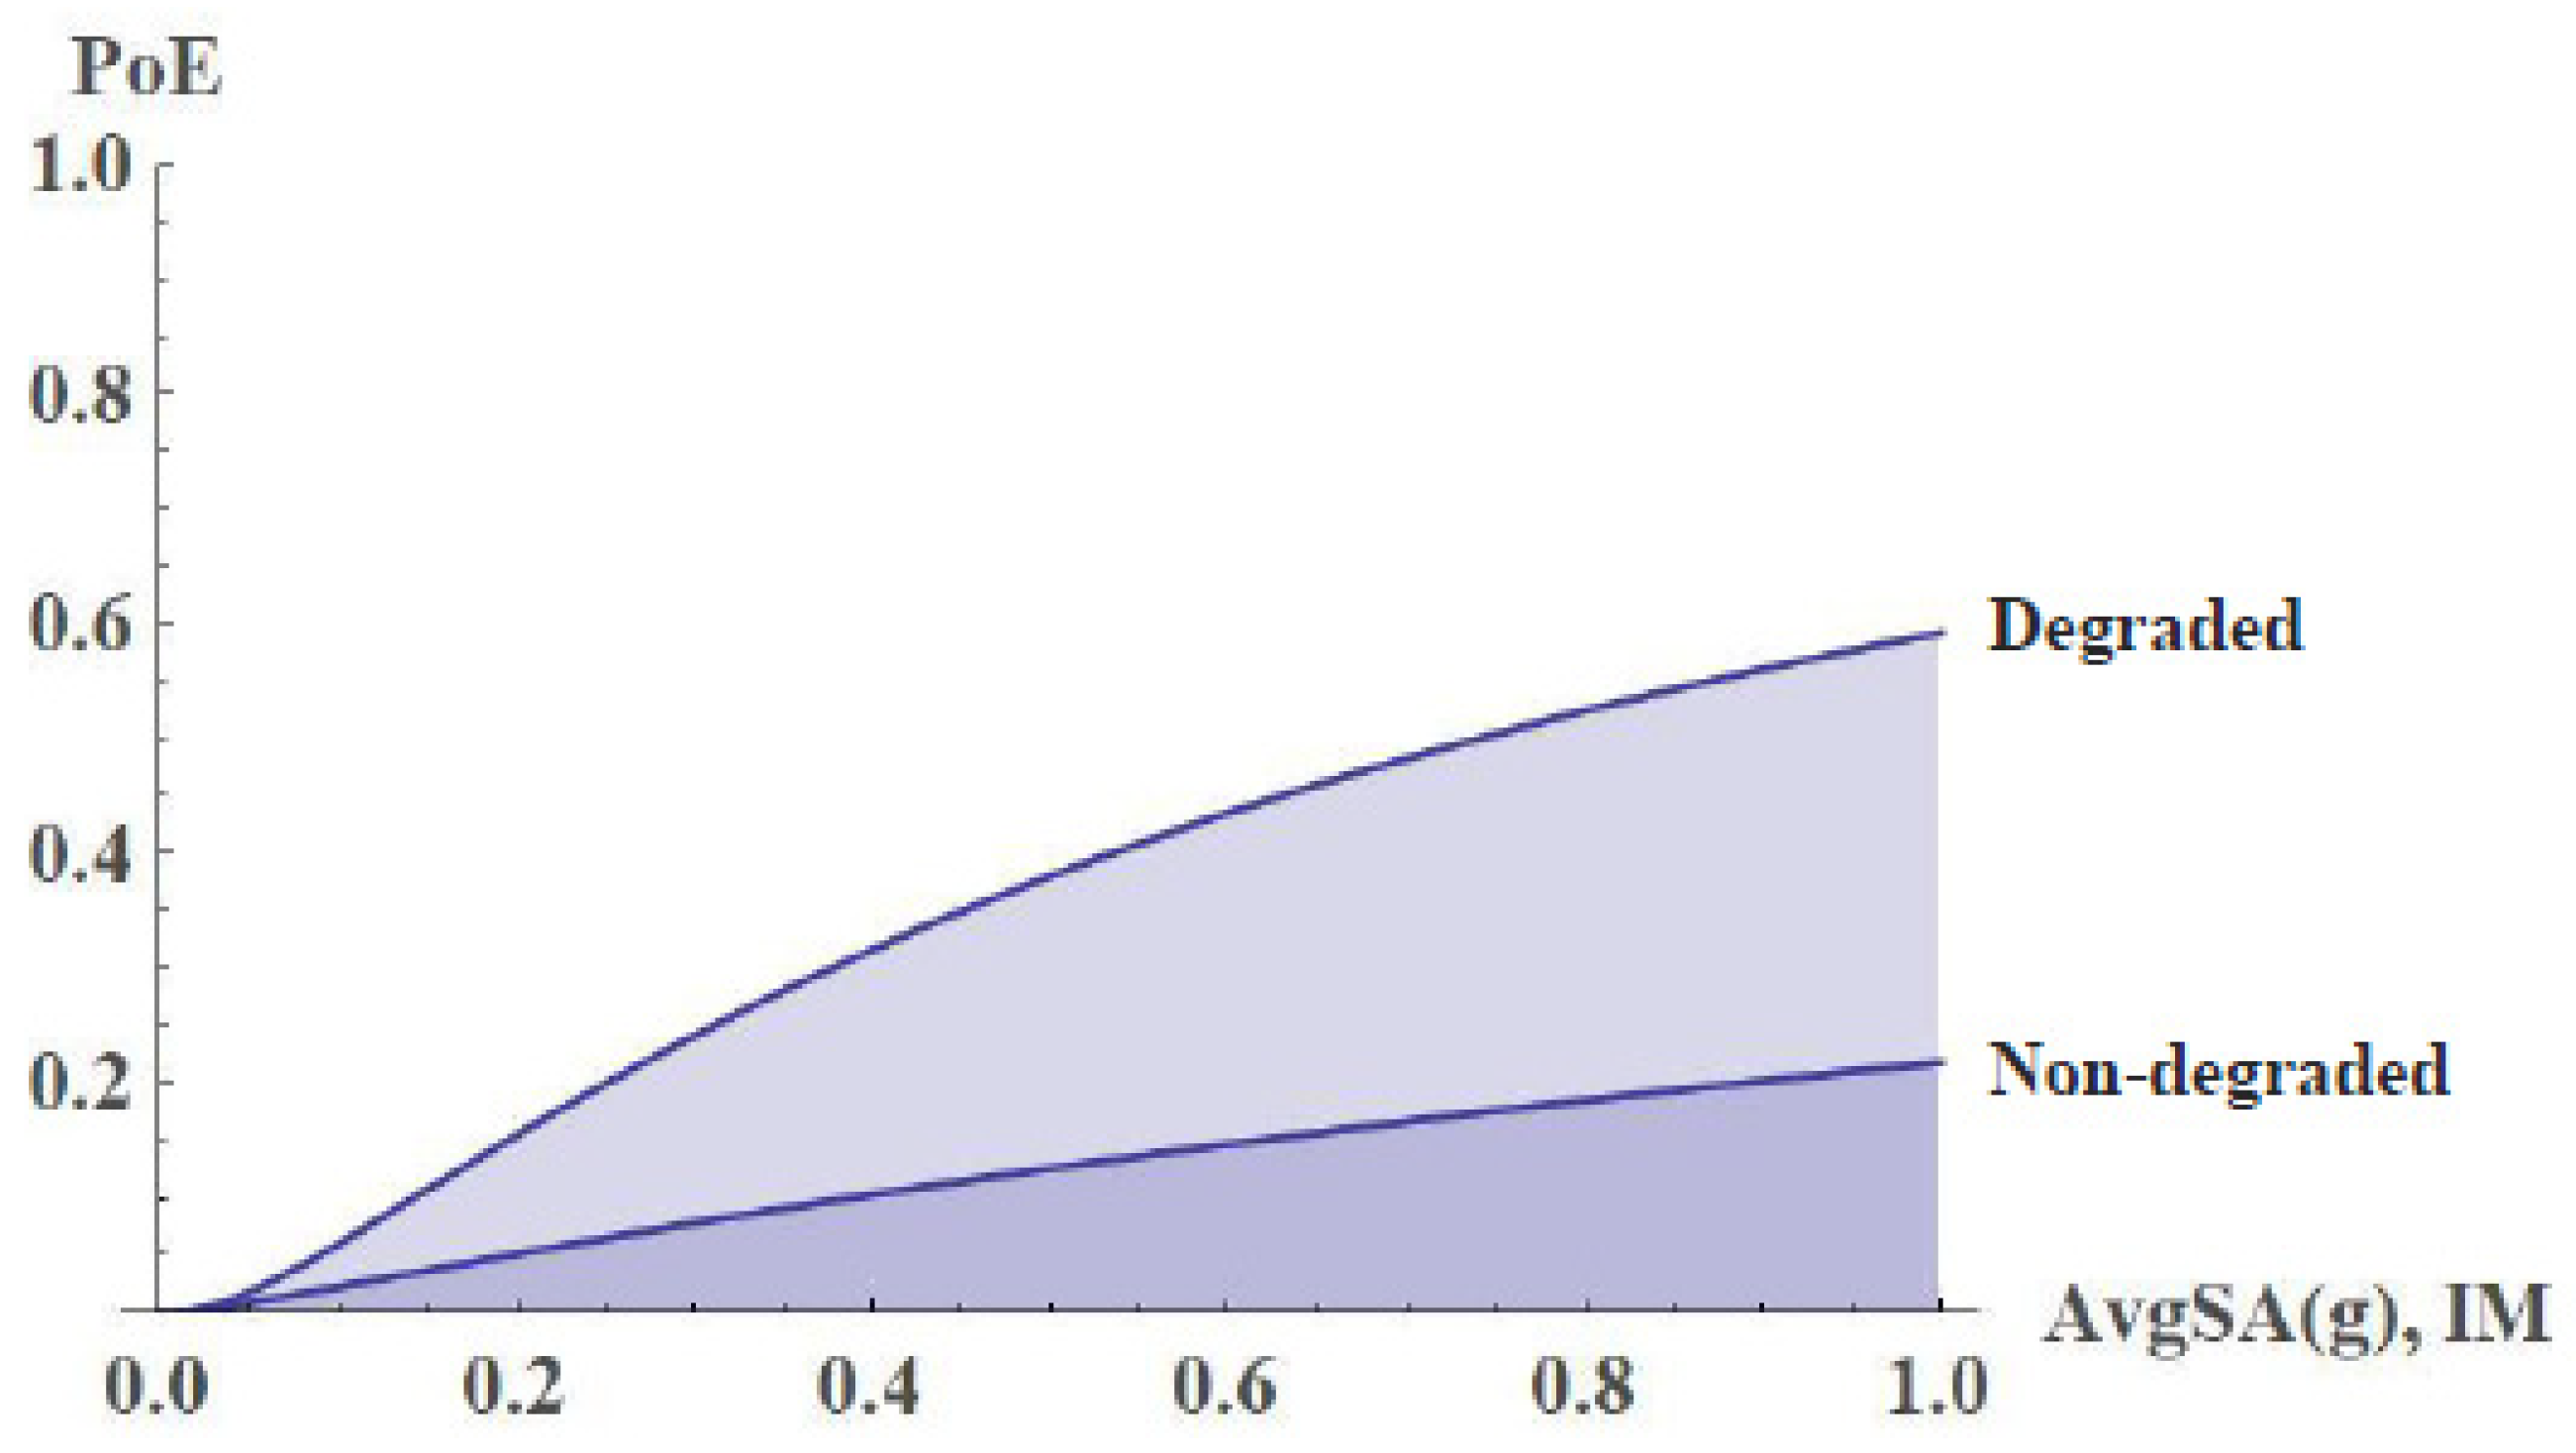
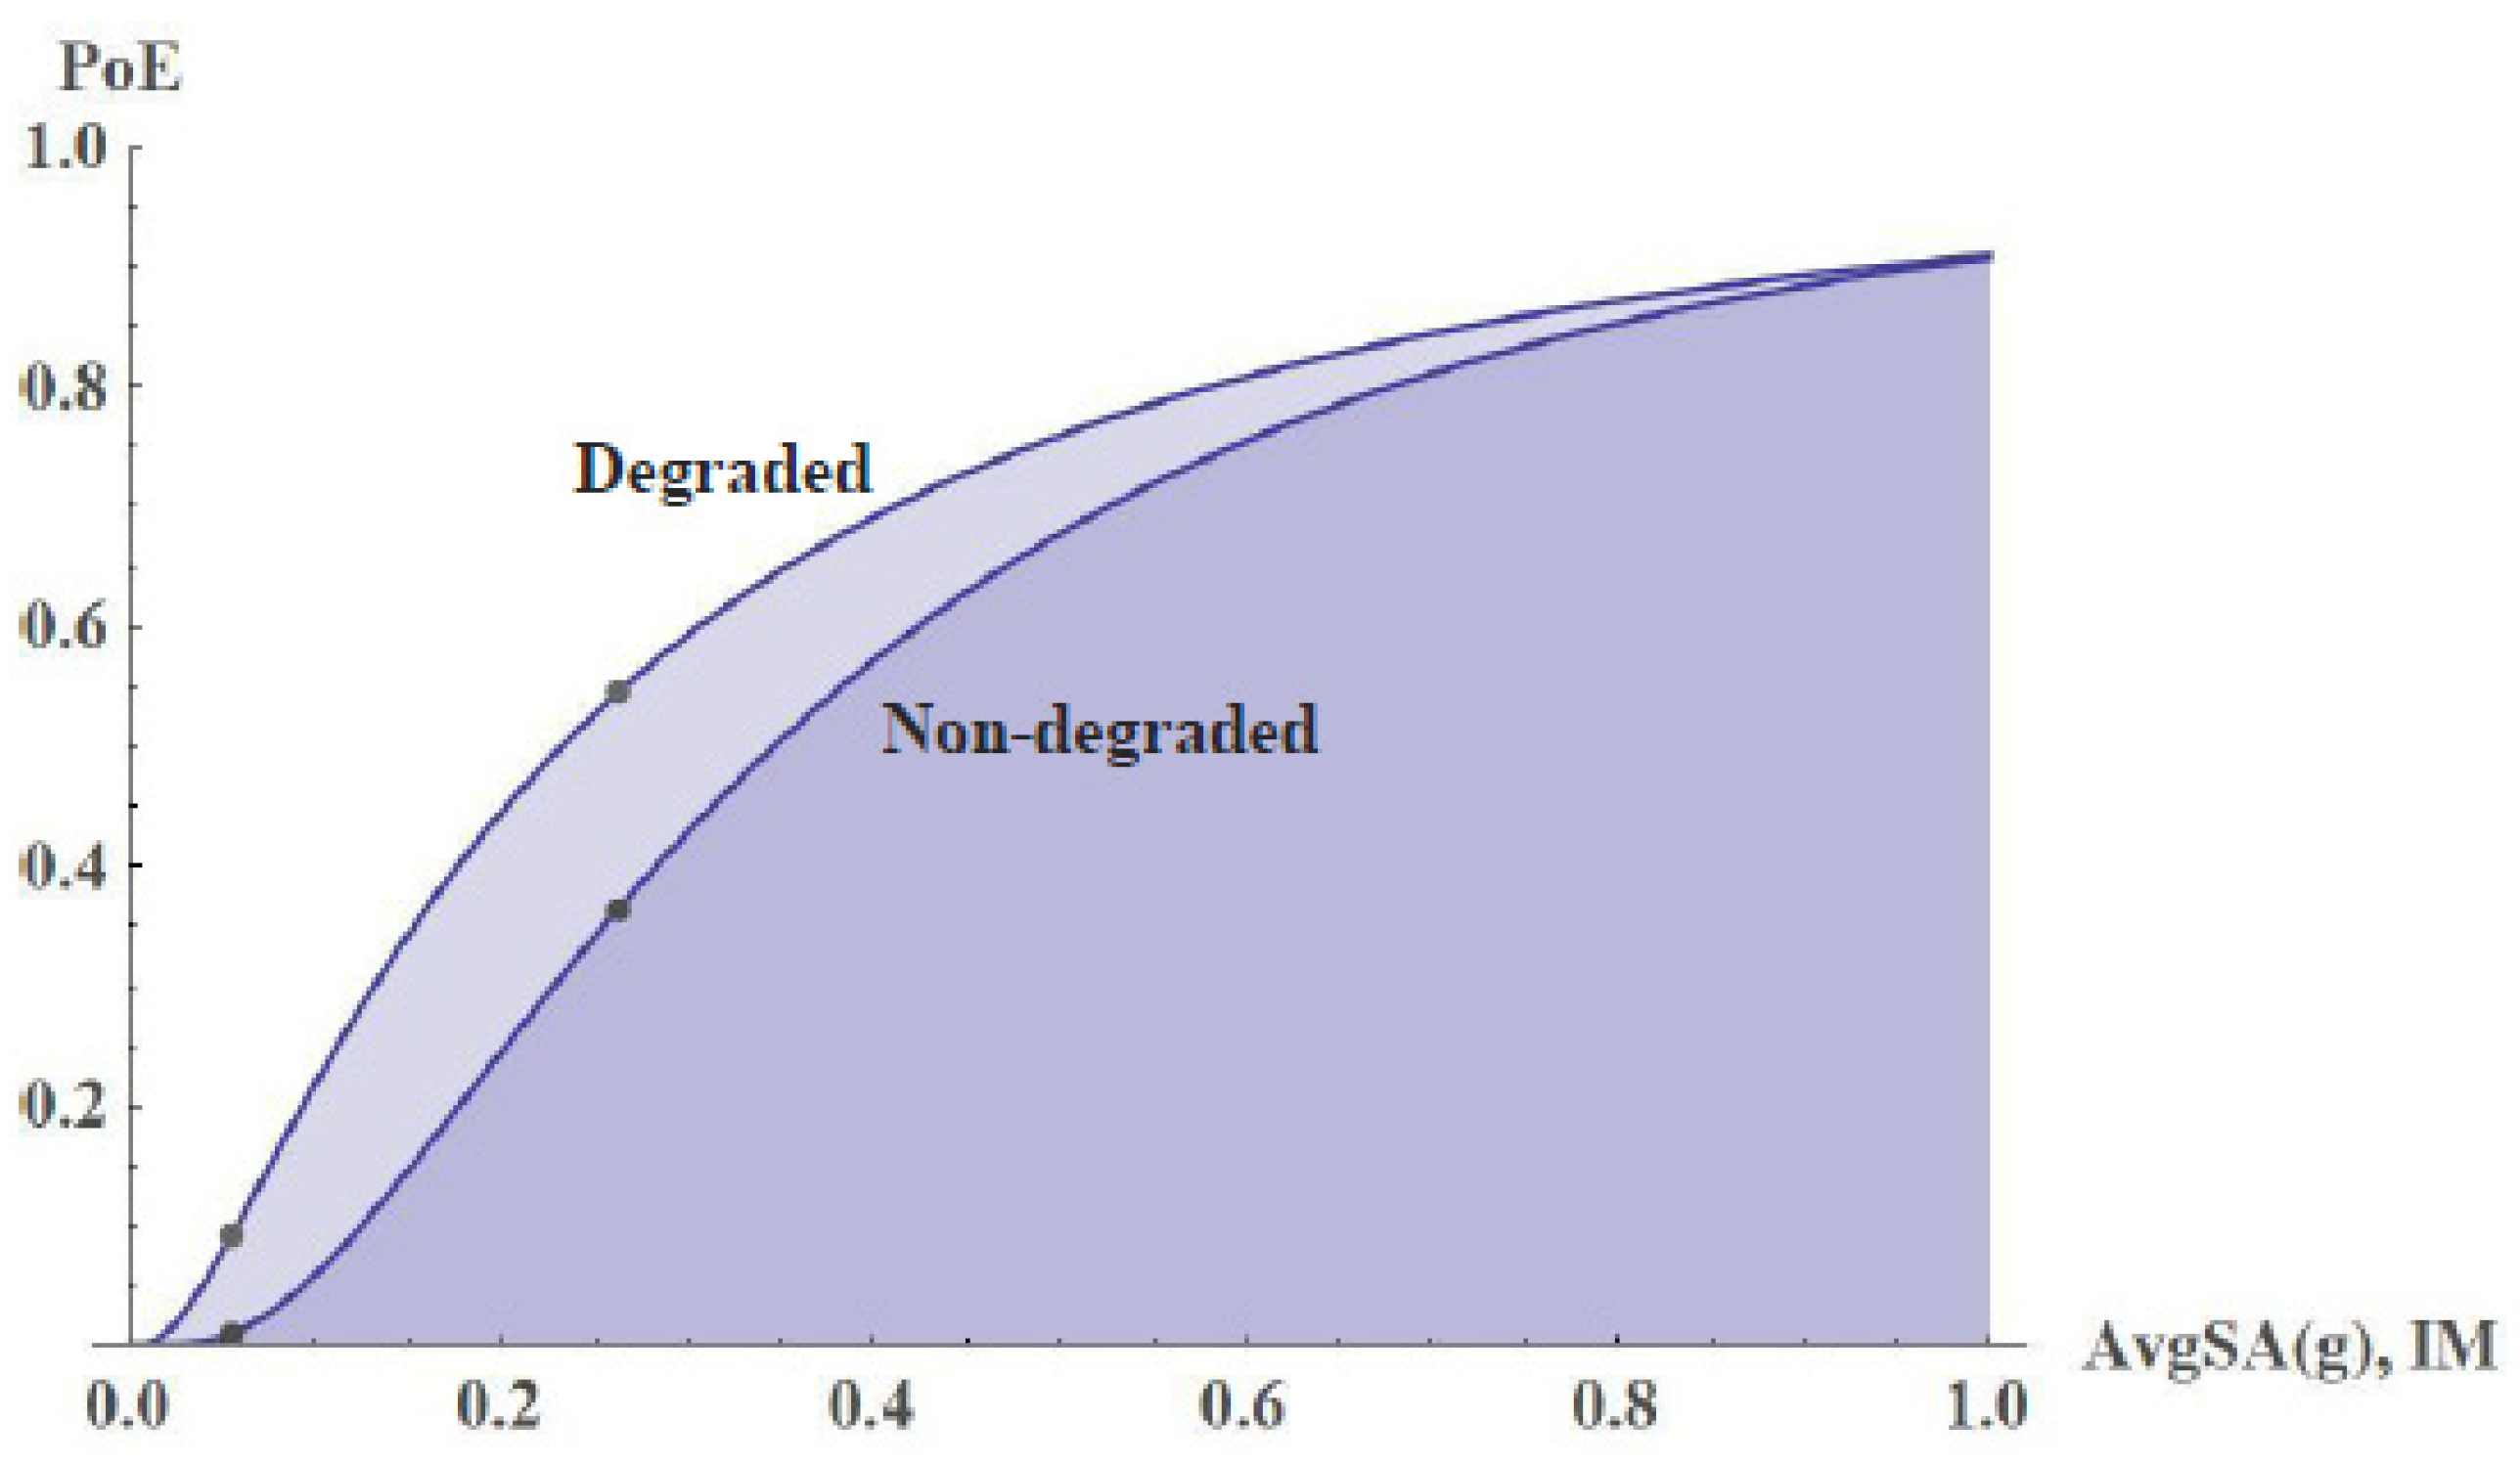
- FC shows that the level of degradation of the rammed earth measured on the Zirid wall would significantly weaken the seismic behavior of Puerta Elvira. Therefore, the restoration work that has been carried out on PE and that has prevented the deterioration from progressing to the levels reached on the Zirid wall have meant a significant reduction in the probability of structural failure of PE.
- (iii)
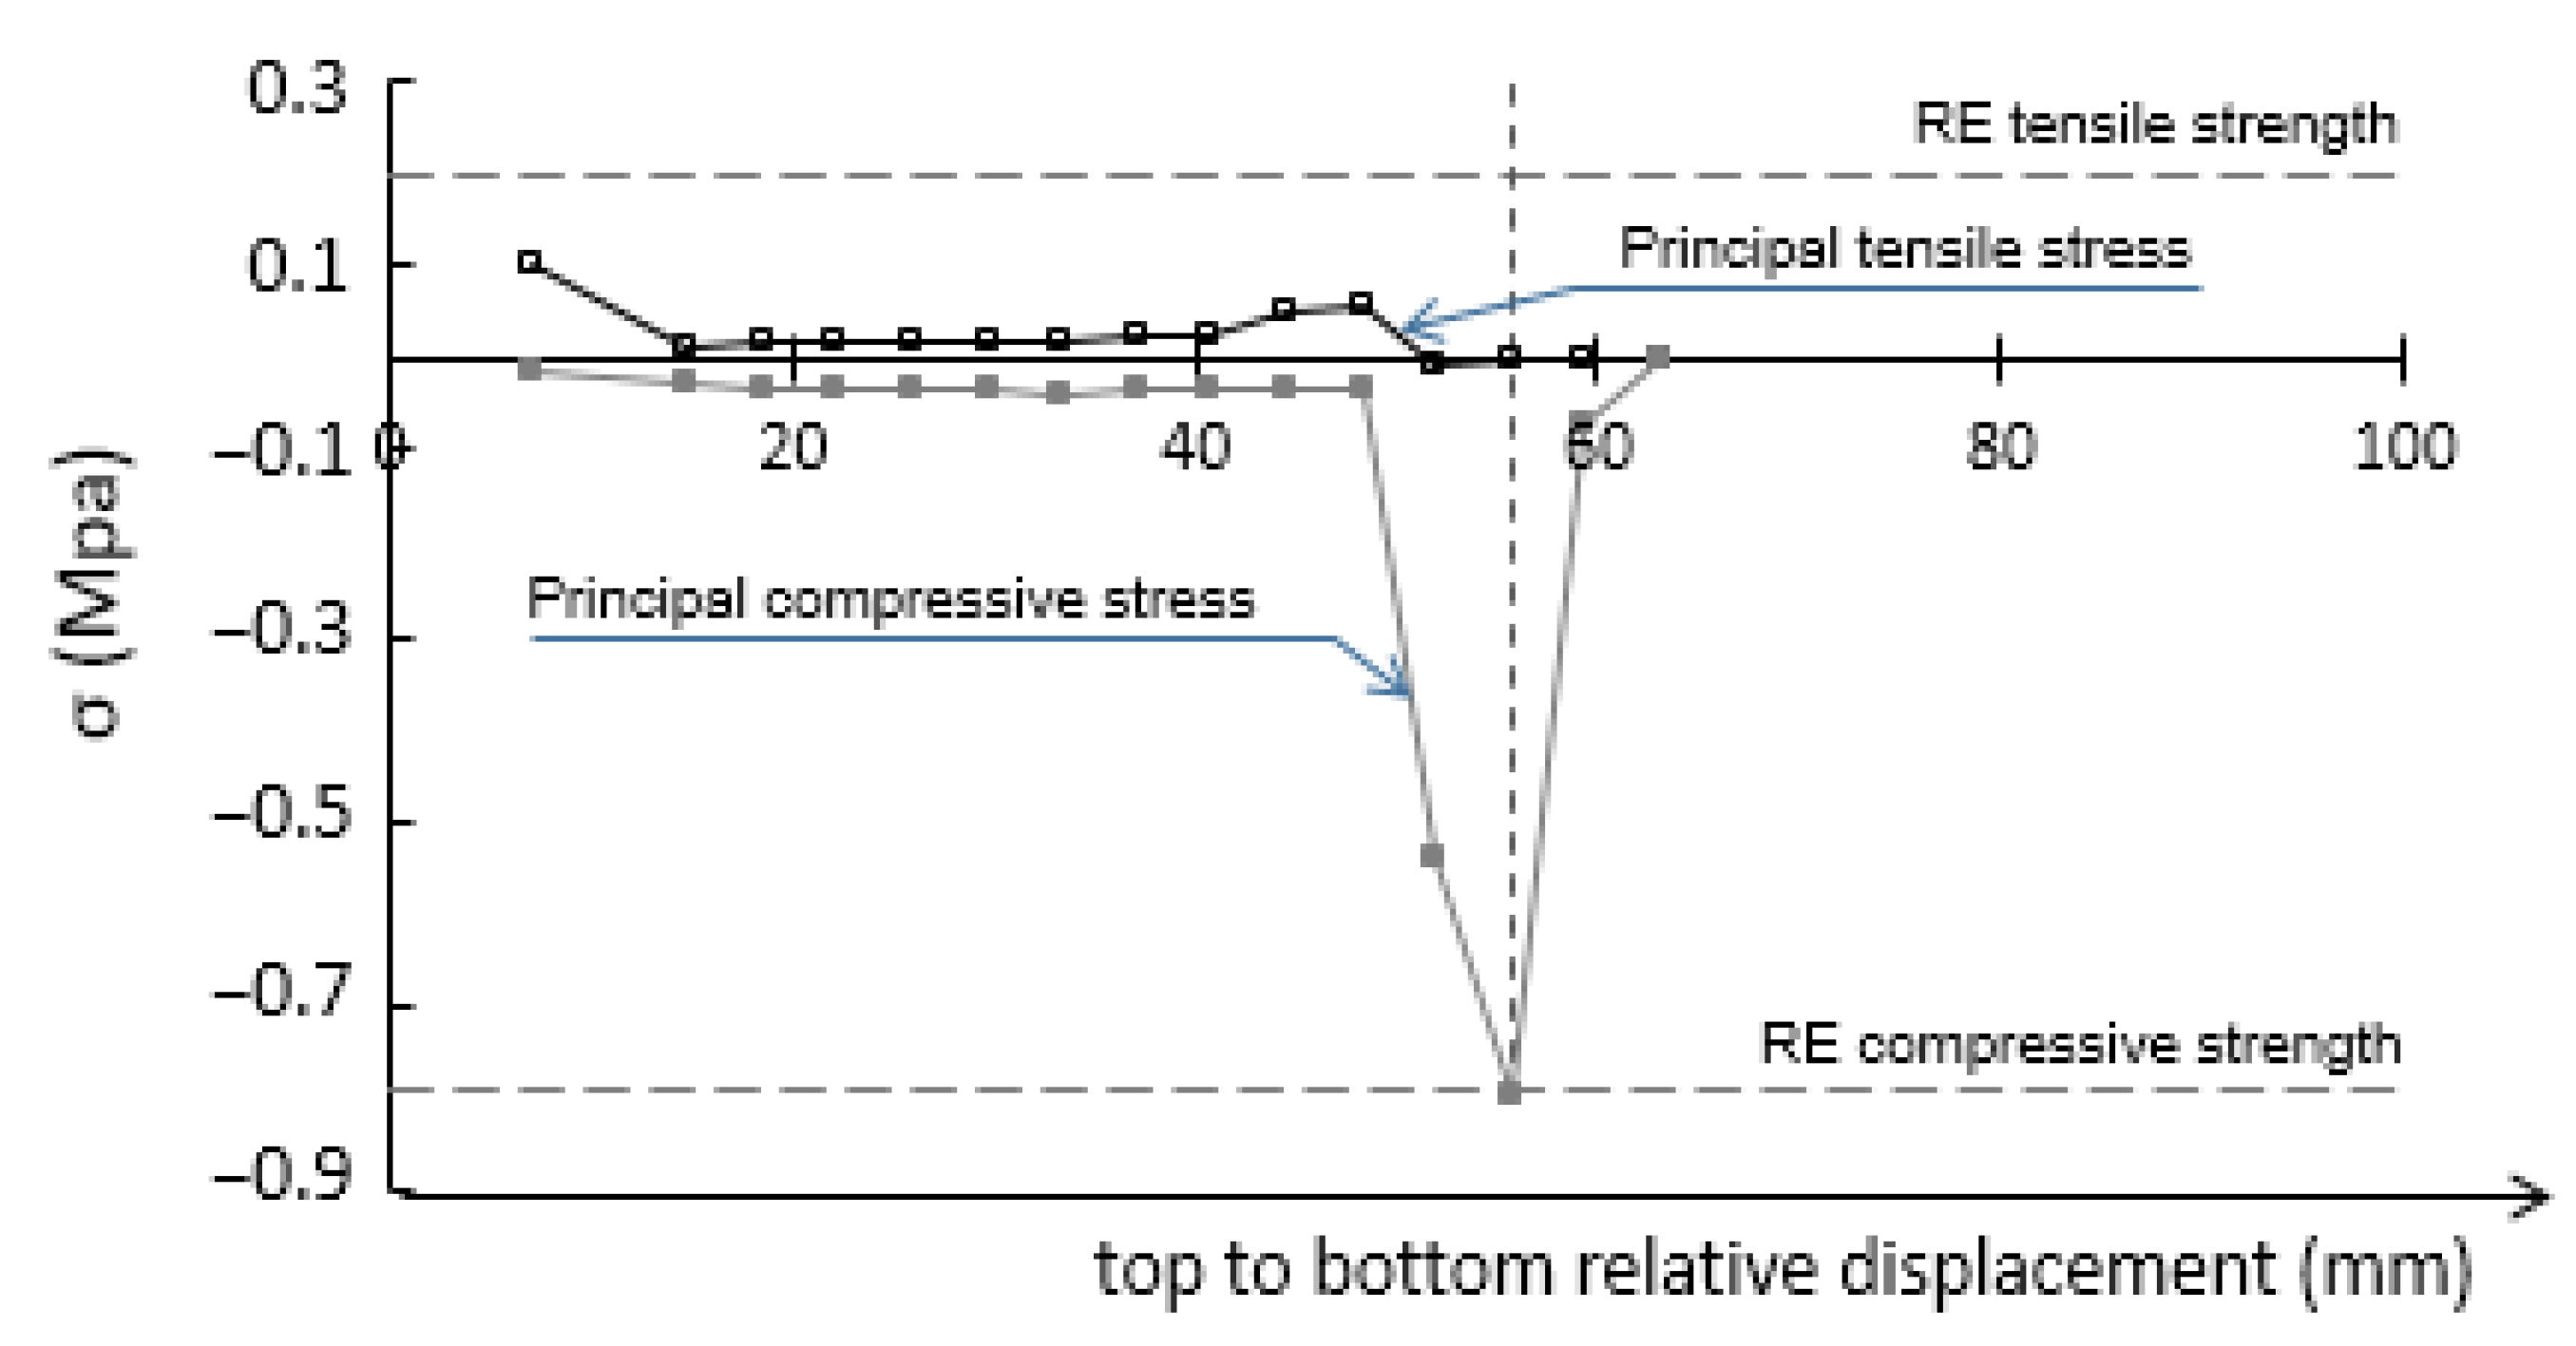
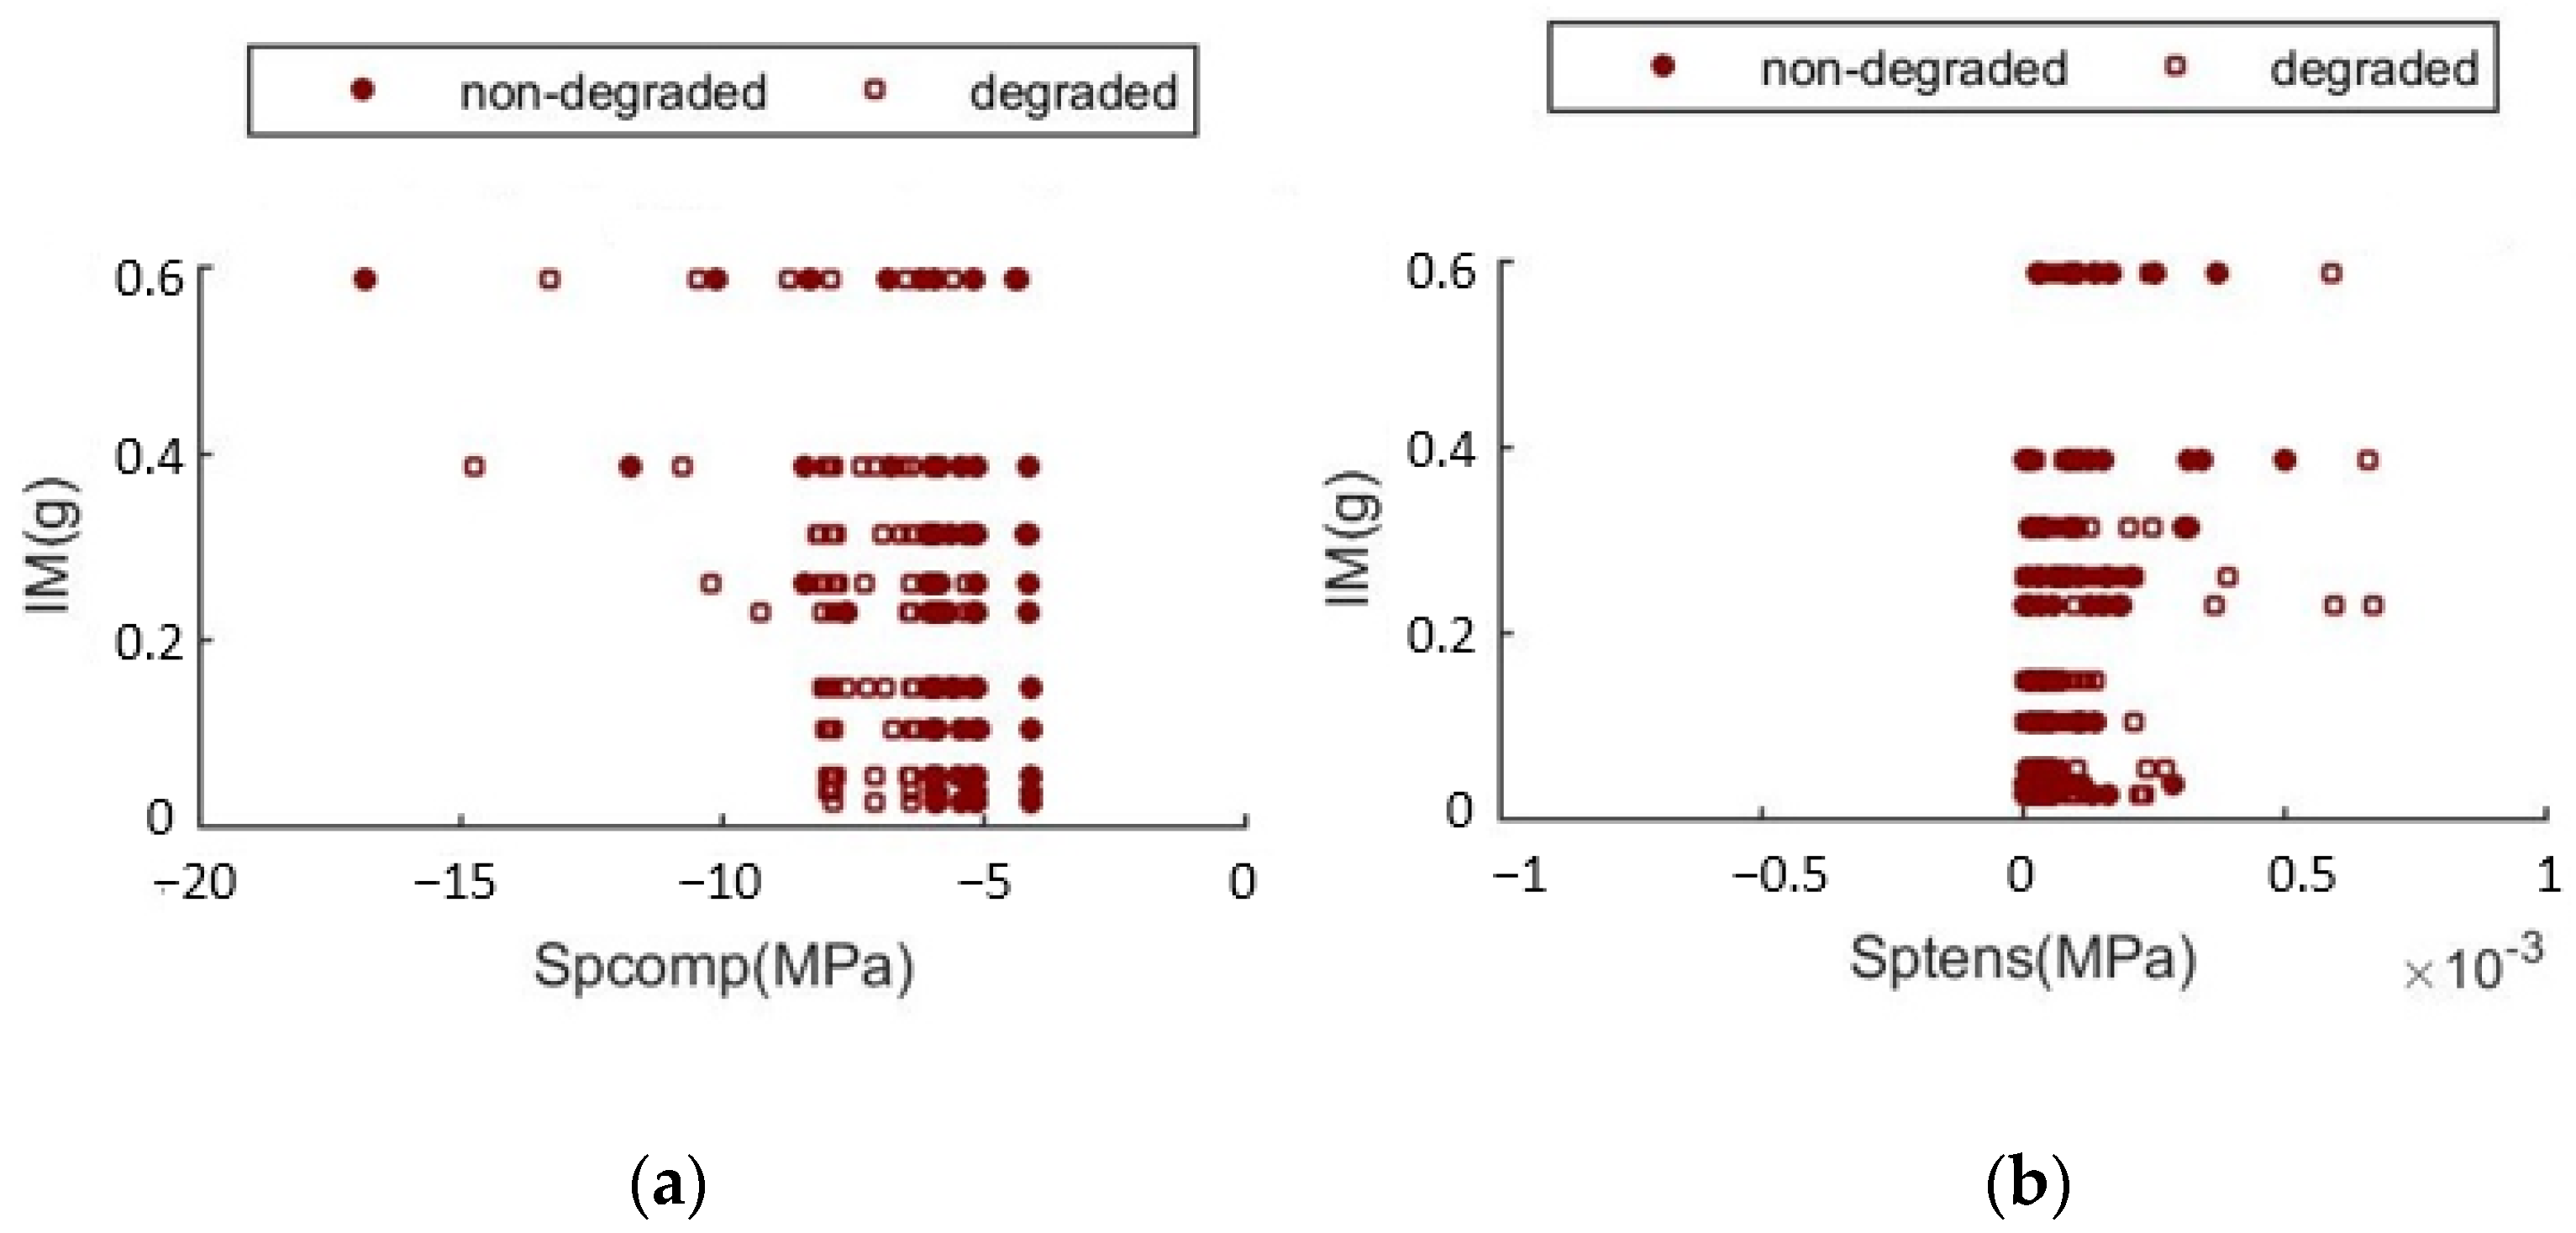
- Vulnerability results related to the San Jerónimo Monastery, for which the maximum compressive stress is considered as the damage reference parameter, reveals that for the 10% in 50-year exceeding probability design ground motion in Granada (0.23 g), there is a 20% of probability of exceeding the compressive strength of SPs. The conclusion is in raisonable agreement with the actual damage inspection results.
Author Contributions
Funding
Institutional Review Board Statement
Informed Consent Statement
Data Availability Statement
Acknowledgments
Conflicts of Interest
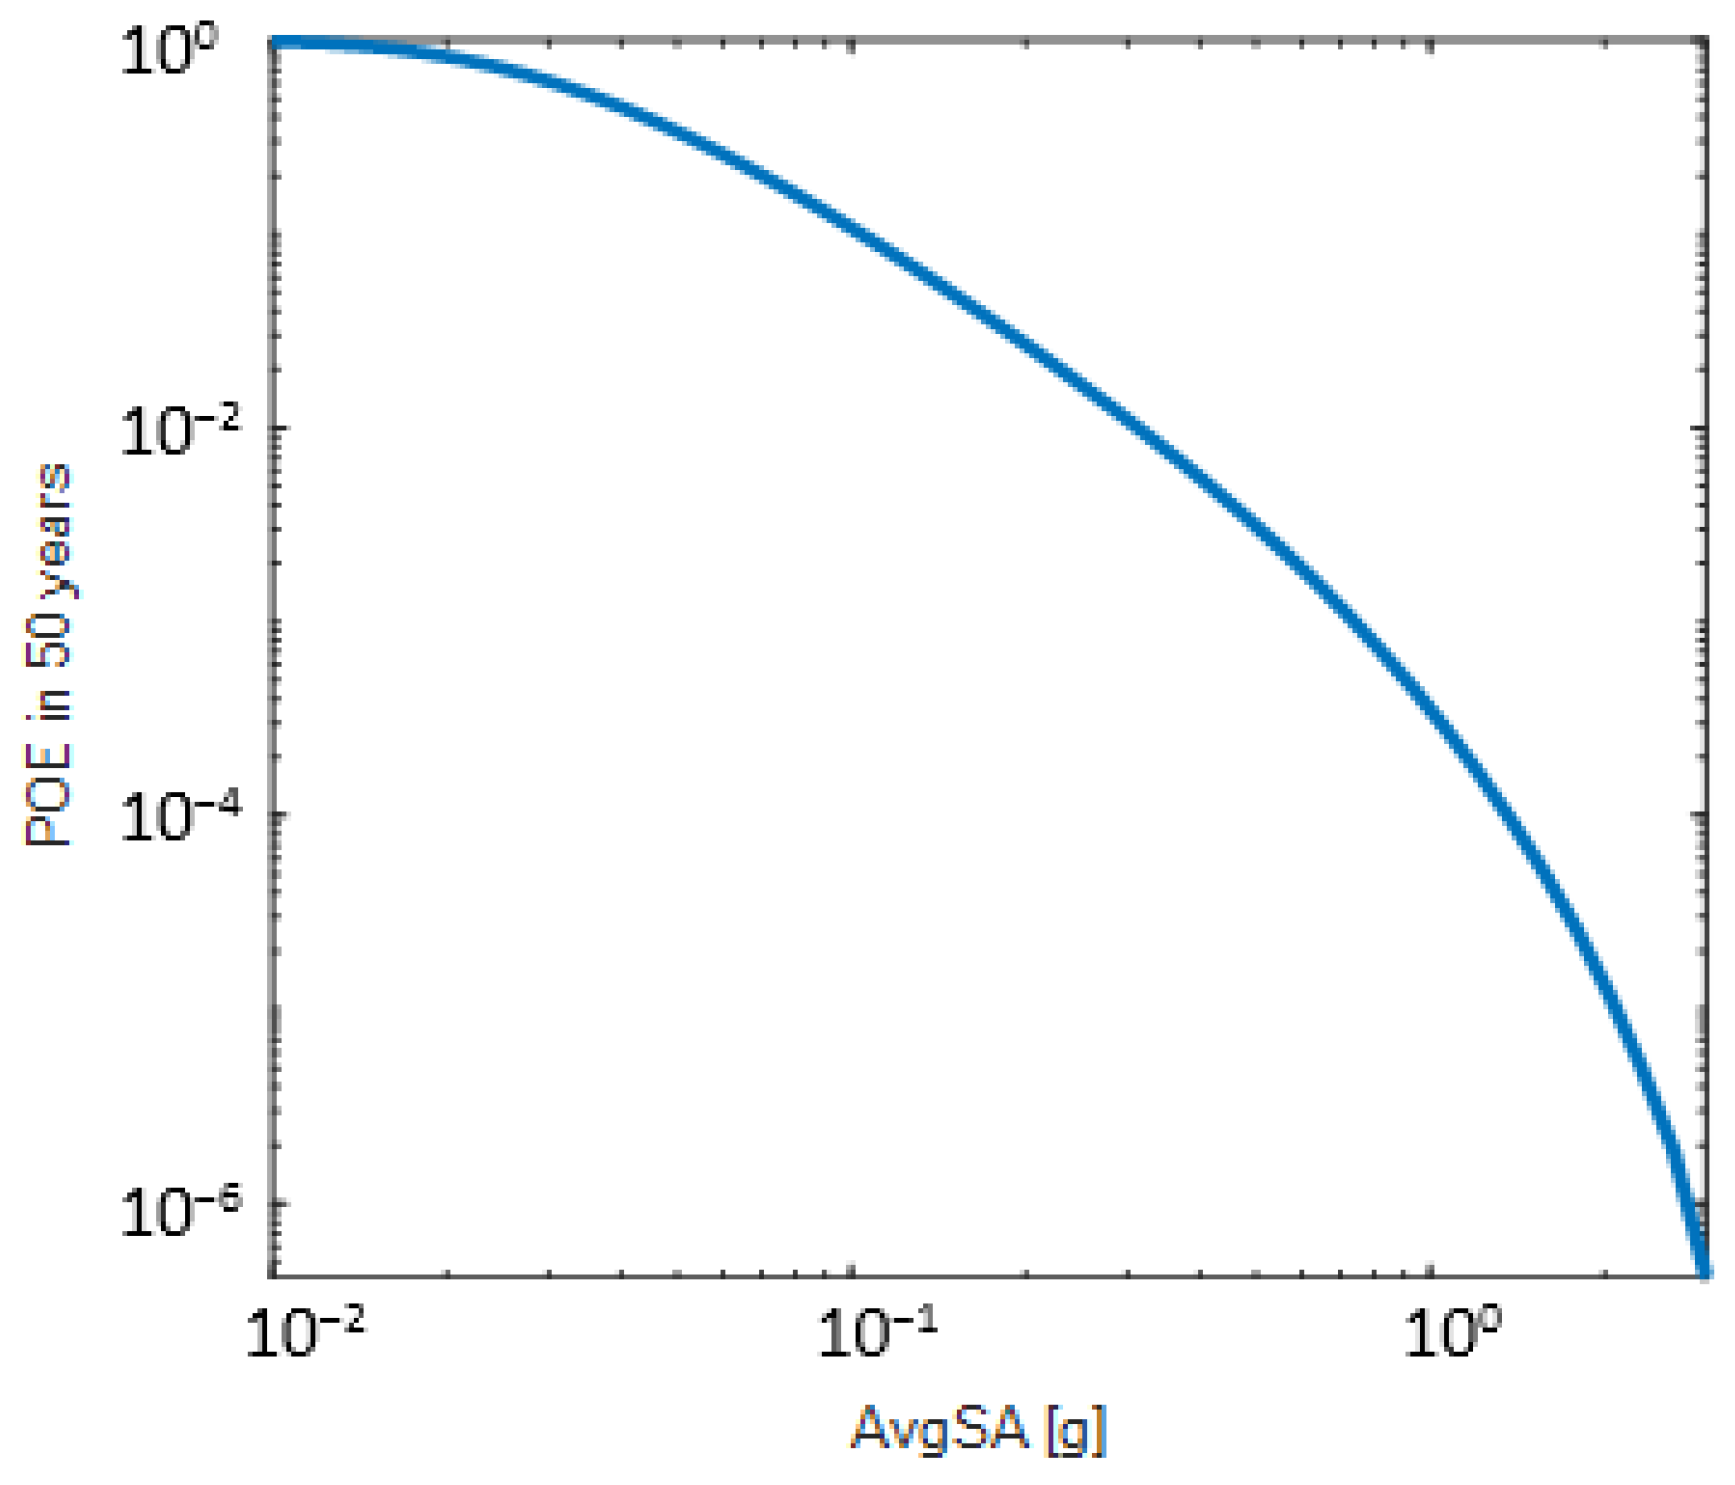
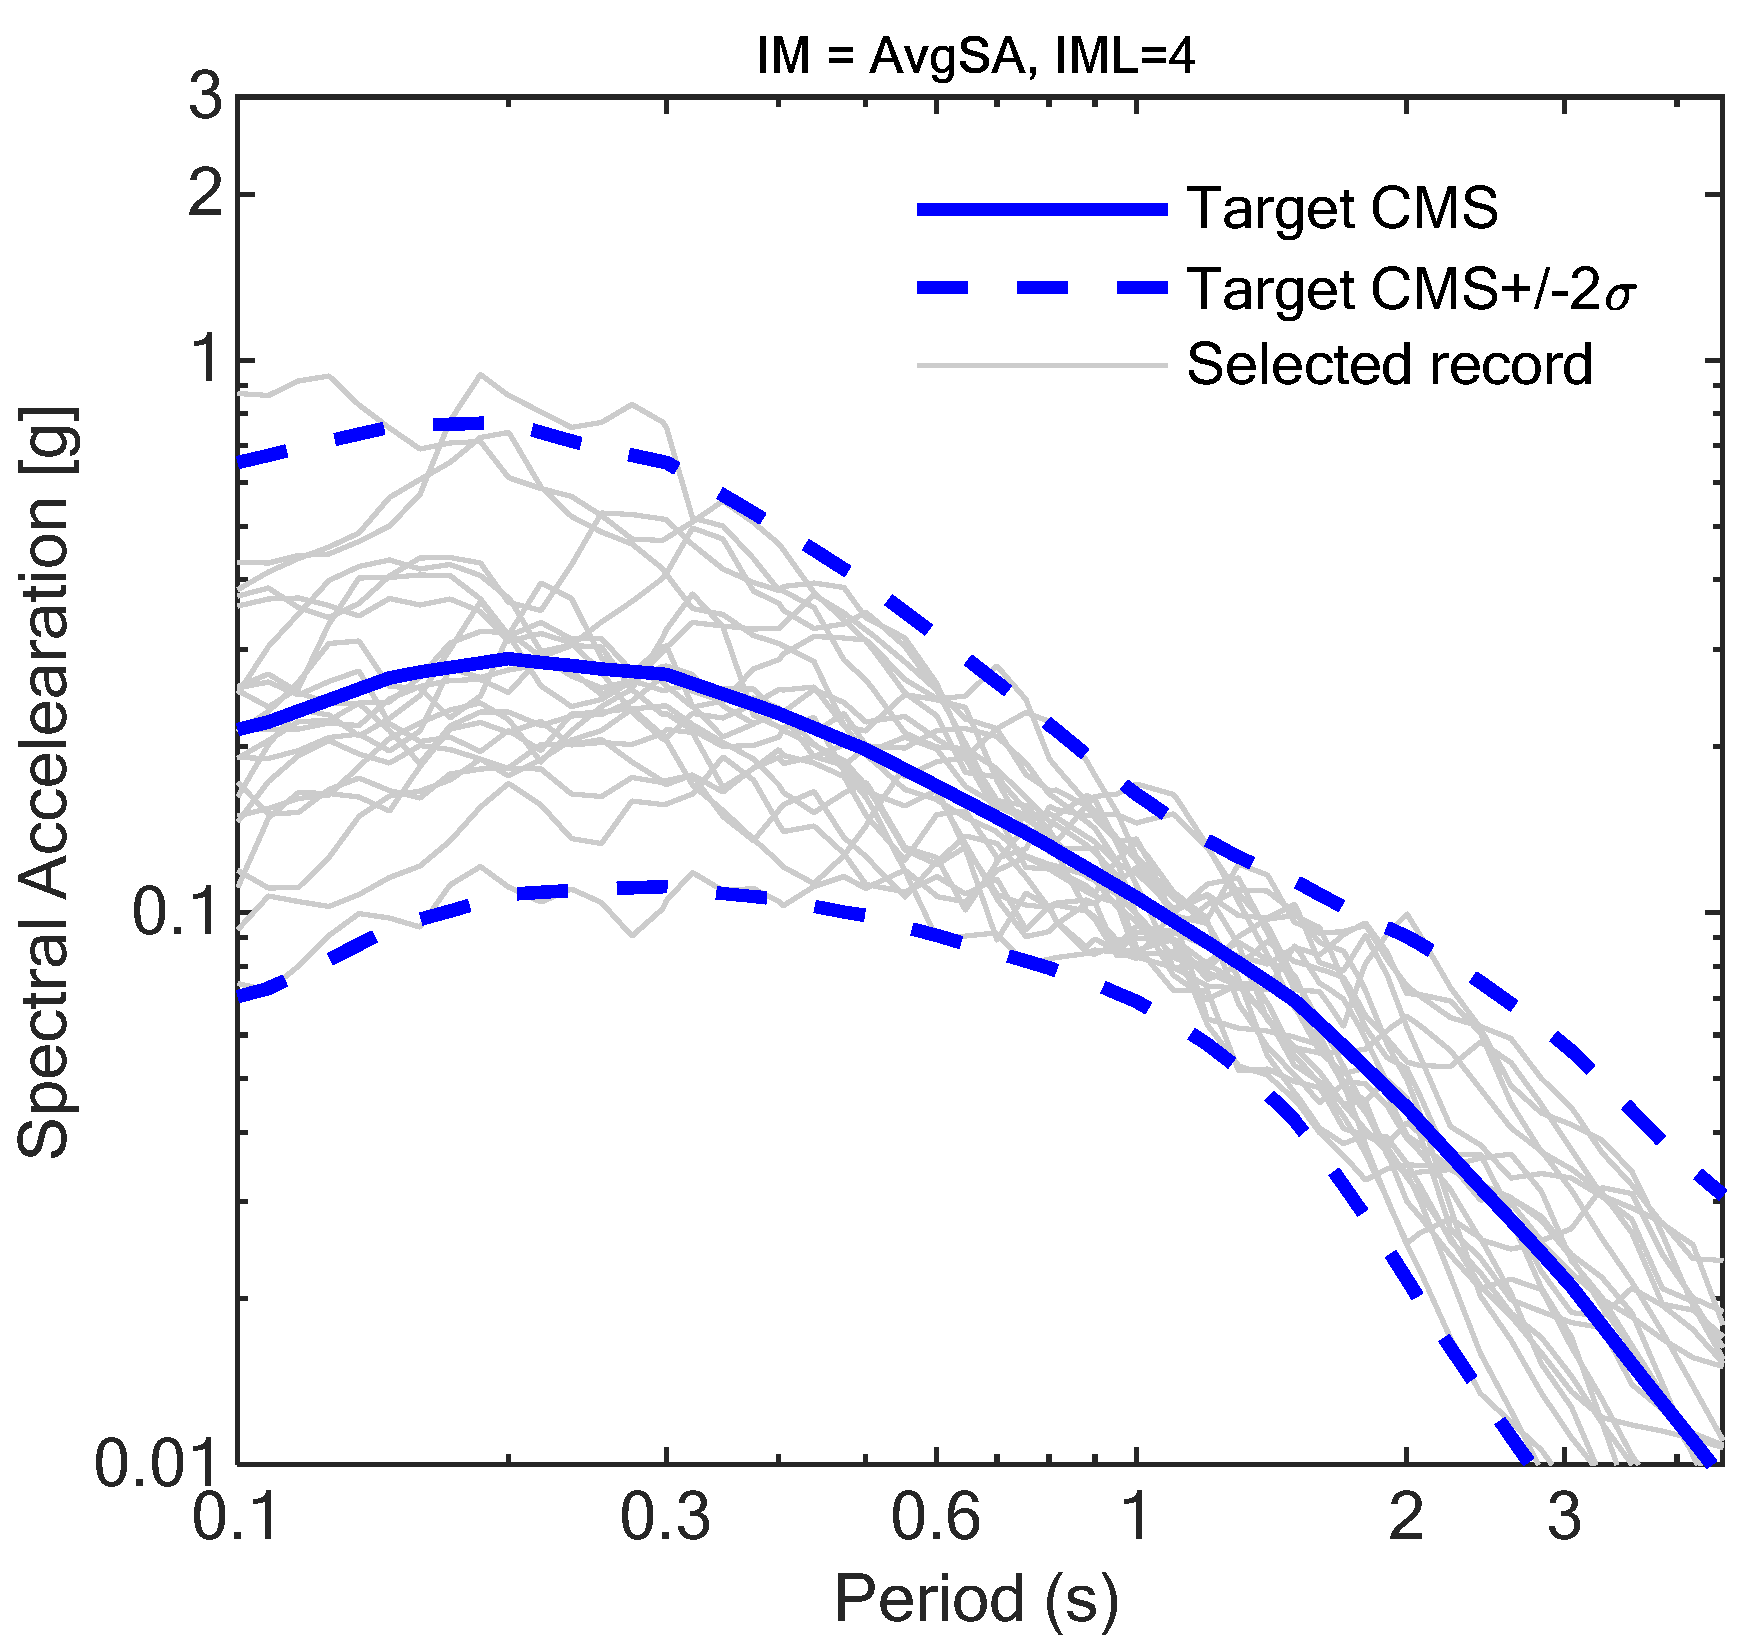
Appendix A. Accelerograms for the Site of Granada


| IM Level | % in 50 Years | Granada | |||
|---|---|---|---|---|---|
| AvgSA [g] (IM Value) | [km] | ||||
| 1 | 70 | 0.026 | 5.73 | 52.3 | 0.81 |
| 2 | 50 | 0.037 | 5.82 | 45.8 | 0.88 |
| 3 | 30 | 0.054 | 5.92 | 38.2 | 0.95 |
| 4 | 10 | 0.104 | 6.08 | 26.4 | 1.06 |
| 5 | 5 | 0.148 | 6.17 | 20.9 | 1.10 |
| 6 | 2 | 0.230 | 6.29 | 15.7 | 1.16 |
| 7 | 1.5 | 0.262 | 6.33 | 14.4 | 1.19 |
| 8 | 1 | 0.313 | 6.38 | 13.0 | 1.23 |
| 9 | 0.6 | 0.387 | 6.44 | 11.7 | 1.30 |
| 10 | 0.2 | 0.587 | 6.57 | 10.0 | 1.50 |

References
- Piernas, E.M. Influencia de la Textura, del Sistema Poroso y del Acabado Superficial en la Durabilidad de Areniscas y Travertino Explotados en Andalucía y Utilizados en Construcción. Ph.D. Thesis, University of Granada, Granada, Spain, 2015. [Google Scholar]
- Molina, E.; Cultrone, G.; Sebastián, E.; Alonso, F.J.; Carrizo, L.; Gisbert, J.; Buj, O. The pore system of sedimentary rocks as a key factor in the durability of building materials. Eng. Geol. 2011, 118, 110–121. [Google Scholar] [CrossRef]
- Molina, E.; Cultrone, G.; Sebastián, E.; Alonso, F.J. Evaluation of stone durability using a combination of ultrasound, mechanical and accelerated aging tests. J. Geophys. Eng. 2013, 10, 035003. [Google Scholar] [CrossRef]
- Luque, A.; Cultrone, G.; Sebastián, E.; Cazalla, O. Effectiveness of stone treatments in enhancing the durability of bioclastic calcarenite in (Granada, Spain). Mater. Constr. 2008, 58, 115–128. [Google Scholar] [CrossRef]
- Vázquez, P.; Alonso, F.J.; Carrizo, L.; Molina, E.; Cultrone, G.; Blanco, M.; Zamora, I. Evaluation of the petrophysical properties of sedimentary building stones in order to establish quality criteria. Constr. Build. Mater. 2013, 41, 868–878. [Google Scholar] [CrossRef]
- Cultrone, G.; Sebastia, E.; Ortega Huertas, M. Durability of masonry systems: A laboratory study. Constr. Build. Mater. 2007, 21, 40–51. [Google Scholar] [CrossRef]
- Gil-Martín, L.M.; Fernández-Ruíz, M.A.; Hernández-Montes, E. Mechanical characterization and creep behavior of a stone heritage material used in Granada (Spain): Santa Pudia calcarenite. Rock Mech. Rock Eng. 2022, 55, 5659–5669. [Google Scholar] [CrossRef]
- Jalón, M.L.; Chiachío, J.; Gil-Martín, L.M.; Hernández-Montes, E. Probabilistic identification of surface recession patterns in heritage buildings based on digital photogrammetry. J. Build. Eng. 2021, 34, 101922. [Google Scholar] [CrossRef]
- Grandeau, D.; Delboy, L. World Heritage Inventory of Earthen Architecture; CRATerre-ENSAG: Grenoble, France, 2012. [Google Scholar]
- Luo, Y.; Zhou, P.; Ni, P.; Peng, X.; Ye, J. Degradation of rammed earth under soluble salts attack and drying-wetting cycles: The case of Fujian Tulou, China. Appl. Clay Sci. 2021, 212, 106202. [Google Scholar] [CrossRef]
- Bui, Q.B.; Morel, J.C.; Hans, S.; Walker, P. Effect of moisture content on the mechanical characteristics of rammed earth. Constr. Build. Mater. 2014, 54, 163–169. [Google Scholar] [CrossRef]
- Traoré, L.B.; Ouellet-Plamondon, C.; Fabbri, A.; McGregor, F.; Rojat, F. Experimental assessment of freezing-thawing resistance of rammed earth buildings. Constr. Build. Mater. 2021, 274, 121917. [Google Scholar] [CrossRef]
- Gil-Martin, L.M.; Fernández-Ruíz, M.A.; Hernández-Montes, E. Mechanical characterization and elastic stiffness degradation of unstabilized rammed earth. J. Build. Eng. 2022, 56, 04805. [Google Scholar] [CrossRef]
- Burns, G. Deterioration of our cultural heritage. Nature 1991, 352, 658–660. [Google Scholar] [CrossRef]
- Ramezanpour, M.; Eslami, A.; Ronagh, H. Seismic performance of stabilised/unstabilised rammed earth walls. Eng. Struct. 2021, 245, 112982. [Google Scholar] [CrossRef]
- Villacreses, J.P.; Granados, J.; Caicedo, B.; Torres-Rodas, P.; Yépez, F. Seismic and hydromechanical performance of rammed earth walls under changing environmental conditions. Constr. Build. Mater. 2021, 300, 124331. [Google Scholar] [CrossRef]
- Lagomarsino, S. On the vulnerability assessment of monumental buildings. Bull. Earthq. Eng. 2006, 4, 445–463. [Google Scholar] [CrossRef]
- Fabbrocino, F.; Vaiano, G.; Formisano, A. Parametric analysis on local collapse mechanisms of masonry churches in Teramo (Italy). Heritage 2020, 3, 176–197. [Google Scholar] [CrossRef]
- Borri, A.; Corradi, M. Architectural heritage: A discussion on conservation and safety. Heritage 2019, 2, 631–647. [Google Scholar] [CrossRef]
- Borri, A.; Corradi, M.; De Maria, A. The failure of masonry walls by disaggregation and the masonry quality index. Heritage 2020, 3, 1162–1198. [Google Scholar] [CrossRef]
- Kim, J.; Lorenzoni, F.; Salvalaggio, M.; Valluzzi, M.R. Seismic vulnerability assessment of free-standing massive masonry columns by the 3D Discrete Element Method. Eng. Struct. 2021, 246, 113004. [Google Scholar] [CrossRef]
- Menéndez, E.; Gil-Martín, L.M.; Salem, Y.; Jalón, L.; Hernández-Montes, E.; Alonso, M.C. Bayesian assessment of surface recession patterns in brick buildings with critical factors identification. Bol. Soc. Esp. Cerám. Vidr. 2022, 61, 357–373. [Google Scholar] [CrossRef]
- Yacila, J.; Camata, G.; Salsavilca, J.; Tarque, N. Pushover analysis of confined masonry walls using a 3D macro-modelling approach. Eng. Struct. 2019, 201, 109731. [Google Scholar] [CrossRef]
- Milani, G.; Shehu, R.; Valente, M. Possibilities and limitations of innovative retrofitting for masonry churches: Advanced computations on three case studies. Constr. Build. Mater. 2017, 147, 239–263. [Google Scholar] [CrossRef]
- Almagro, A.; Orihuela, A.; Vílchez, C. La Puerta de Elvira en Granada y su Reciente Restauración; Consejo Superior de Investigaciones Científicas: Madrid, Spain, 1992.
- Almagro, A.; Orihuela, A. Puerta de Elvira (1992) y Cuarto Real de Santo Domingo (2001–2004), Granada. In La Restauración de la Tapia en la Península Ibérica: Criterios, Técnicas, Resultados y Perspectivas; Mileto, C., López-Manzanares, F.V., Eds.; General de Ediciones de Arquitectura: Valencia, Spain, 2014; pp. 236–241. [Google Scholar]
- Webpage: HistorImage 2 Patrimonio y Cuidad. Available online: https://almunecarh.wordpress.com/2013/11/06/granada-ziri-1-puerta-elvira/ (accessed on 13 September 2022).
- Melchor, C. Patrones de Degradación en Edificios Históricos. Puerta de Elvira (Granada). Master’s Thesis, Máster Universitario en Estructuras, Universidad de Granada, Granada, Spain, 2021. [Google Scholar]
- William, K.J.; Warnke, E.D. Constitutive model for the triaxial behaviour of concrete. Proc. Int. Assoc. Bridge Struct. Eng. 1975, 19, 174. [Google Scholar]
- Aschheim, M.; Hernández-Montes, E.; Vamvatsikos, D. Design of Reinforced Concrete Buildings for Seismic Performance: Practical Deterministic and Probabilistic Approaches; CRC Press: Boca Raton, FL, USA; Taylor & Francis: Abingdon, UK, 2019. [Google Scholar]
- Baker, J.W. Efficient analytical fragility function fitting using dynamic structural analysis. Earthq. Spectra 2015, 31, 579–599. [Google Scholar] [CrossRef]
- American Society of Civil Engineers. Minimum Design Loads and Associated Criteria for Buildings and Other Structures; ASCE/SEI 7-22; American Society of Civil Engineers: Reston, VA, USA, 2022. [Google Scholar]
- ANSYS ® Academic Research Mechanical and CFD, Release 2019 R3.
- Giardini, D.; Woessner, J.; Danciu, L. Seismic hazard harmonization in Europe (SHARE): Online data resource. EOS 2014, 95, 261–262. [Google Scholar] [CrossRef]
- Boore, D.M.; Atkinson, G.M. Ground-motion prediction equations for the average horizontal component of PGA, PGV, and 5%-damped PSA at spectral periods between 0.01 s and 10.0 s. Earthq. Spectra 2008, 24, 99–138. [Google Scholar] [CrossRef]
- Monelli, D.; Pagani, M.; Weatherill, G.; Silva, V. The hazard component of OpenQuake: The calculation engine of the Global Earthquake Model. In Proceedings of the 15th World Conference on Earthquake Engineering, Lisbon, Portugal, 24–28 September 2012; pp. 24–28. [Google Scholar] [CrossRef]
- Baker, J.W.; Cornell, C.A. A vector-valued ground motion intensity measure consisting of spectral acceleration and epsilon. Earthq. Eng. Struct. Dyn. 2005, 34, 1193–1217. [Google Scholar] [CrossRef]
- Bazzurro, P.; Cornell, C.A. Disaggregation of seismic hazard. Bull. Seismol. Soc. Am. 1999, 89, 501–520. [Google Scholar] [CrossRef]
- Kohrangi, M.; Bazzurro, P.; Vamvatsikos, D.; Spillatura, A. Conditional spectrum-based ground motion record selection using average spectral acceleration. Earthq. Eng. Struct. Dyn. 2018, 47, 265. [Google Scholar] [CrossRef]
- Lin, T.; Harmsen, S.C.; Baker, J.W.; Luco, N. Conditional spectrum computation incorporating multiple causal earthquakes and ground-motion prediction models. Bull. Seismol. Soc. Am. 2013, 103, 1103–1116. [Google Scholar] [CrossRef]
- Baker, J.W.; Jayaram, N. Correlation of spectral acceleration values from NGA ground motion models. Earthq. Spectra 2008, 24, 299–317. [Google Scholar] [CrossRef]
- Chiou, B.; Darragh, R.; Gregor, N.; Silva, W. NGA project strong-motion database. Earthq. Spectra 2008, 24, 23–44. [Google Scholar] [CrossRef]
- Tarbali, K.; Bradley, B.A. The effect of causal parameter bounds in PSHA-based ground motion selection. Earthq. Eng. Struct. Dyn. 2016, 45, 1515–1535. [Google Scholar] [CrossRef]


Publisher’s Note: MDPI stays neutral with regard to jurisdictional claims in published maps and institutional affiliations. |
© 2022 by the authors. Licensee MDPI, Basel, Switzerland. This article is an open access article distributed under the terms and conditions of the Creative Commons Attribution (CC BY) license (https://creativecommons.org/licenses/by/4.0/).
Share and Cite
Gil-Martín, L.M.; Hdz.-Gil, L.; Kohrangi, M.; Menéndez, E.; Hernández-Montes, E. Fragility Curves for Historical Structures with Degradation Factors Obtained from 3D Photogrammetry. Heritage 2022, 5, 3260-3279. https://doi.org/10.3390/heritage5040167
Gil-Martín LM, Hdz.-Gil L, Kohrangi M, Menéndez E, Hernández-Montes E. Fragility Curves for Historical Structures with Degradation Factors Obtained from 3D Photogrammetry. Heritage. 2022; 5(4):3260-3279. https://doi.org/10.3390/heritage5040167
Chicago/Turabian StyleGil-Martín, Luisa María, Luisa Hdz.-Gil, Mohsen Kohrangi, Esperanza Menéndez, and Enrique Hernández-Montes. 2022. "Fragility Curves for Historical Structures with Degradation Factors Obtained from 3D Photogrammetry" Heritage 5, no. 4: 3260-3279. https://doi.org/10.3390/heritage5040167
APA StyleGil-Martín, L. M., Hdz.-Gil, L., Kohrangi, M., Menéndez, E., & Hernández-Montes, E. (2022). Fragility Curves for Historical Structures with Degradation Factors Obtained from 3D Photogrammetry. Heritage, 5(4), 3260-3279. https://doi.org/10.3390/heritage5040167