Article

Fragility Curves for Historical Structures with Degradation Factors Obtained from 3D Photogrammetry

by
Luisa María Gil-Martín
1,*,
Luisa Hdz.-Gil
2,
Mohsen Kohrangi
3,
Esperanza Menéndez
4 and
Enrique Hernández-Montes
1
1
Department of Structural Mechanics, University of Granada (UGR), Campus Universitario de Fuentenueva, 18072 Granada, Spain
2
CEE Undergraduate, University of Granada, E.T.S. Ingenieros de Caminos, Campus Universitario de Fuentenueva, 18072 Granada, Spain
3
RED Risk Engineering + Development, 27040 Pavia, Italy
4
CSIC—Instituto de Ciencias de la Construcción, Eduardo Torroja (IETCC), 28033 Madrid, Spain
*
Author to whom correspondence should be addressed.
Heritage 2022, 5(4), 3260-3279; https://doi.org/10.3390/heritage5040167
Submission received: 14 September 2022 / Revised: 24 October 2022 / Accepted: 25 October 2022 / Published: 30 October 2022
(This article belongs to the Special Issue 3D Modeling for Cultural Heritage and Applications)

Abstract

:
The influence of the effects of the degradation of materials on the seismic fragility of Cultural Heritage buildings in Granada (Spain) is investigated. The degradation of the material, which mainly happens at the lower levels of the façades, is obtained by using 3D photogrammetry data. Fragility curves for three cultural heritage constructions in Granada are calculated by using FE nonlinear dynamic analyses for both non-deteriorated and deteriorated geometries. The Finite Elements (FE) models, based on the macro-modelling technique, are subjected to ground motions for the city of Granada, which were selected by considering Probabilistic Seismic Hazard Analysis (PSHA) methodology with their probability of occurrence. The response of each model is analyzed for different seismic Intensity Measure (IM) levels, which, in this study, correspond to average pseudo-acceleration. The procedure is applied to three monuments in Granada that were built with two different constructions materials: calcarenite and rammed earth. The damage mechanisms considered are roof displacement or maximum compressive principal stress, depending on each case. The results show that the restoration works that have been carried out has prevented structural failures in the rammed earth construction studied, and that, during future seismic events, special attention must be paid to the level of compressive strengh reached in the Santa Pudia calcarenite used at the San Jerónimo monastery.

1. Introduction

For centuries, the calcarenite known as Santa Pudia stone (hereinafter, SPs) has been the main material used for the construction of monuments in the province of Granada (Spain). Granada Cathedral, Hospital Real, and the San Jerónimo Monastery, among other buildings, are examples of Cultural Heritage (CH) buildings built with this type of stone. Due to its importance in the cultural heritage of Granada, Santa Pudia stone has been widely studied [1,2,3,4,5,6]. The main mechanical properties (compressive strength, elastic modulus, and Poisson’s ratio), the effect of high temperatures on compressive strength, and its creep behavior have been recently studied [7].
SPs, a calcarenite limestone, presents deterioration problems that are due to its very nature and by the action of climate factors. Weathering is known to have a degrading effect on the appearance and structural soundness of this stone. Photogrammetry has been proved to be a good tool for obtaining the degradation patterns of SPs [8].
Another material that has been widely used in the CH buildings in Granada is Rammed Earth (hereinafter, RE). There are historical rammed-earth structures around the world [9] that have resisted deterioration. The durability of ancient RE monuments is a major concern because, among other factors, they are very vulnerable to salts, water attack [10] and freeze-thaw cycles. The influence of moisture content on the mechanical characteristics of rammed-earth [11] and the effect of freeze-thaw cycles in the durability of earthen constructions have been studied in [12]. The mechanical characterization of the type of unstabilized RE commonly used in Granada and a study of the creep behaviour of this material have recently been carried out with experimental campaign [13].
RE structures are also vulnerable to ground motions, which can not only cause structural damage but also incalculable cultural losses [14]. An experimental study of the in-plane seismic performance of RE walls was carried out in [15]. The influence of climate on the seismic performance of RE walls using numerical models was studied in [16].
Seismic vulnerability assessment has been proved to be an efficient tool for assessing, and therefore mitigating, the risk of significant damage to historical structures [17,18,19,20].It has also been used to support decisions about restoration types and techniques, conservation, and future risk management plans. In [21] the seismic vulnerability of historical masonry structures is based on fragility curves calculated by using numerical analysis.
Granada is located in a seismic zone of moderate risk, on the border between the Eurasian and African plates, so it is not unusual for earthquakes to occur. In the literature, there are records of earthquakes from before 15th century. In this paper, the seismic vulnerability of three degraded CH buildings in Granada is explored. Their Fragility Curves (FC) have been obtained based on the seismic response of three-dimensional finite element models. From these fragility curves, the probability of structural damage for other seismic intensity scenarios can be predicted, which is useful for evaluating whether the need for any retrofitting actions are required.
Given that the degradation patterns of calcarenite stone and brick walls have already been studied [8,22], only the recession patterns corresponding to the degradation of RE are considered in this paper. As for Santa Pudia stone façades [8], 3D photogrammetry is used to obtain the degradation patterns of RE and a degradation prognosis.
The authors are aware that, given the variety of RE, compaction methods, and exposure to climatic agents, the extrapolation of results from one site to another is difficult, and creating a general degradation pattern for assessing the degradation level of RE monuments is not within the scope of the present work. The study presented here focuses on RE monuments in Granada, but the methodology presented can be easily implemented at other sites.

2. Materials and Methods

This paper proposes a methodology for calculating the probability of exceeding a certain performance objective of a damaged historical monument as a function of the intensity of ground motion, see the flow chart shown in Figure 1. A deterioration pattern is calculated using 3D photogrammetric data, as in [8]. A linear interpolation from the age of the construction to its current state is calculated to obtain a deterioration prognosis that can be applicable to future events.
The first step in creating the model for each CH building is taken by using finite element software. Each model is created considering both the original (non-degraded) geometry and the degraded geometry corresponding to a certain age. In the degraded models, the degradation of the material is introduced by modeling the surface recession pattern, which was previously obtained by using digital photogrammetry data. Then, nonlinear dynamic analyses of the models are carried out when they are subjected to the action of a hazard consistent set of 210 ground motions selected on an ad-hoc basis for the city of Granada (Spain) (see Appendix A for additional details).
The response of each model is analyzed for different seismic Intensity Measure (IM) levels, which in this study are 10 average pseudo-acceleration levels ranging from 0.026 g to 0.587 g. The full non-linear time history analyses of the 3D finite element models are based on the macro-modelling technique. That is, the components (i.e., bricks, mortar, concrete, and their contact interfaces) are not modelled separately. Rather, all the components are treated as homogeneous and isotropic materials [23,24]. The constitutive models of the materials considered in the FE models were obtained from laboratory tests [7,13].
Information obtained from end users and stakeholders enabled an allowable performance objective for the CH building (i.e., the damage thresholds) to be fixed. In this work, maximum displacement and maximum compressive stress are considered as reference measurements for defining damage thresholds. The calculation of the probability of exceeding the fixed damage thresholds as a function of the ground motion intensity measure is shown in the form of fragility curves. The procedure is described in detail in the following sections.

2.1. Cases of Study Description and Historical Background

2.1.1. Monastery of San Jerónimo

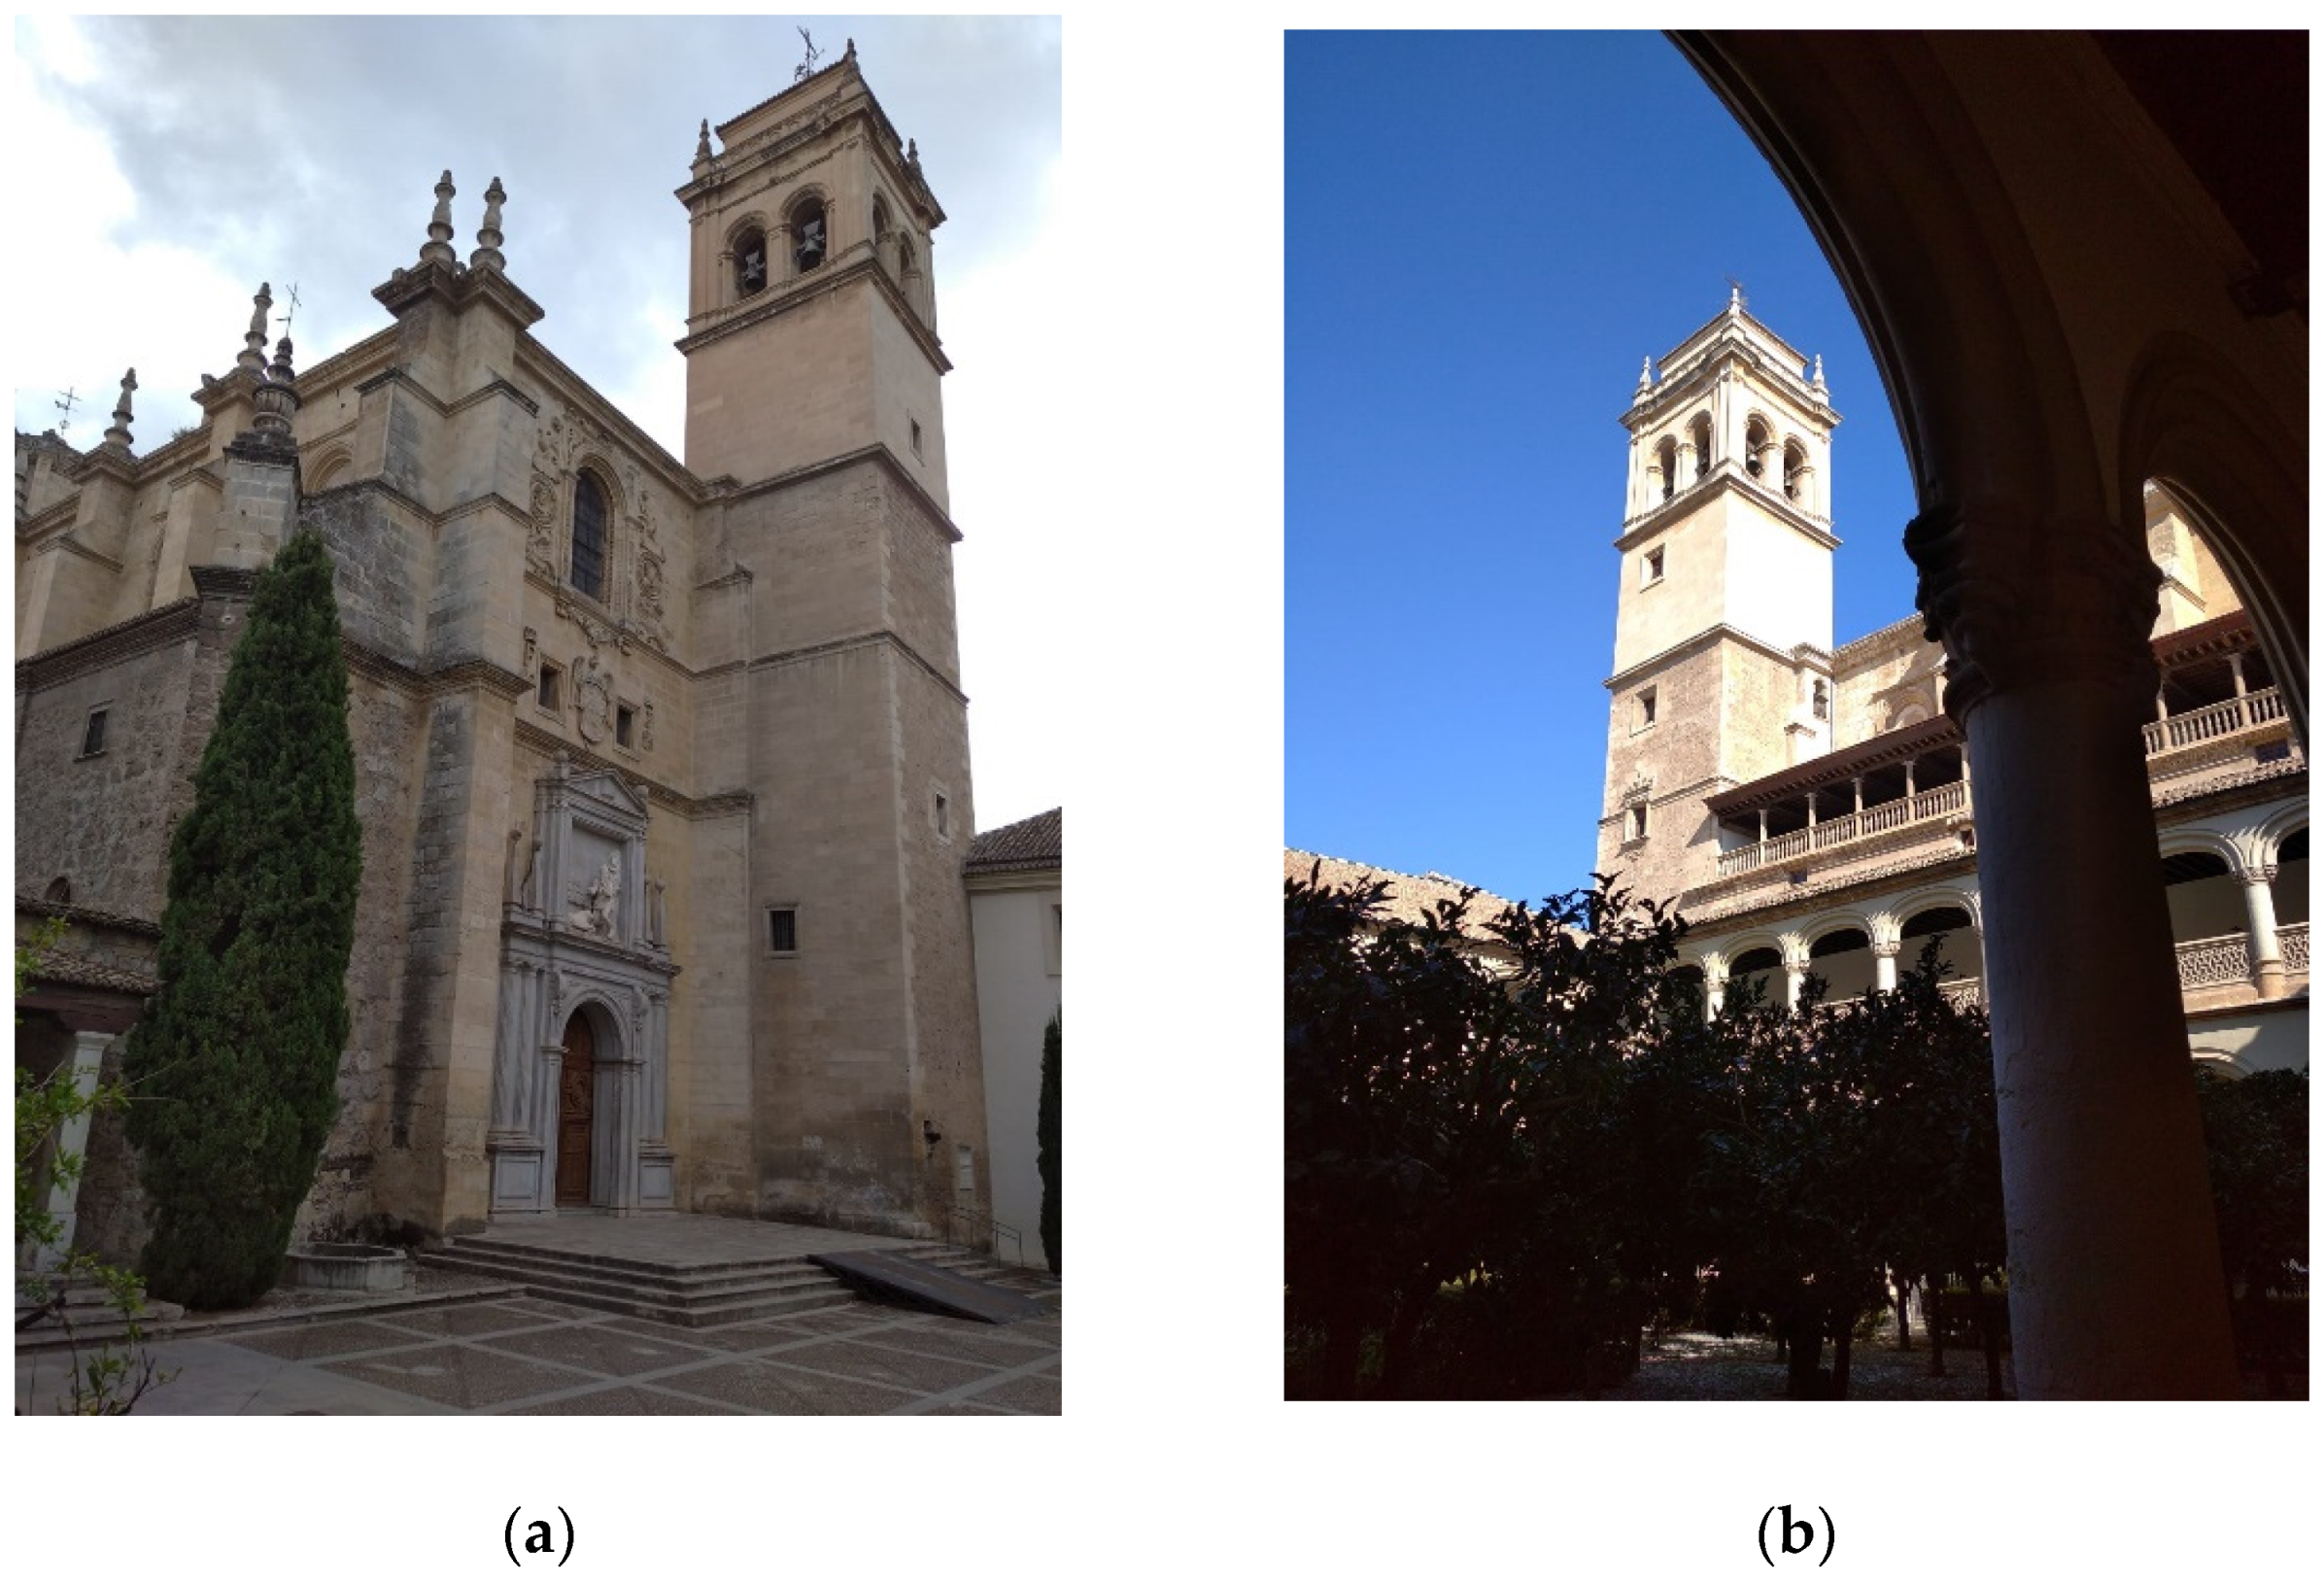
The Church of the Monastery of San Jerónimo, which started being built in 1519, has a Latin cross plan with a polygonal apse. Entering through the main door of this church, the tower is on the right of the facade, see Figure 2a. The tower was finished in 1565, being its upper half demolished at the beginning of the 19th century and rebuilt in the 20th century. Figure 2b shows that one of the lateral façades of the church is attached to a cloister. The church is built of Santa Pudia stone.

2.1.2. Molino del Marqués de Rivas

The second building studied is a flour mill built in the 13th century, during the Nasrid period in Granada. After the closure of the flour mill in the middle of the 20th century, the building was abandoned. In 2000 it was registered in the General Catalogue of Andalusian Historical Heritage, meaning that it held protected status, and it was restored.
The area of the building close to the foundations is made of SPs (Figure 3), which supports walls of rammed earth and brick. The building has one floor, with a typical gabled roof supported on wooden beams.

2.1.3. Puerta Elvira (Granada, Spain)

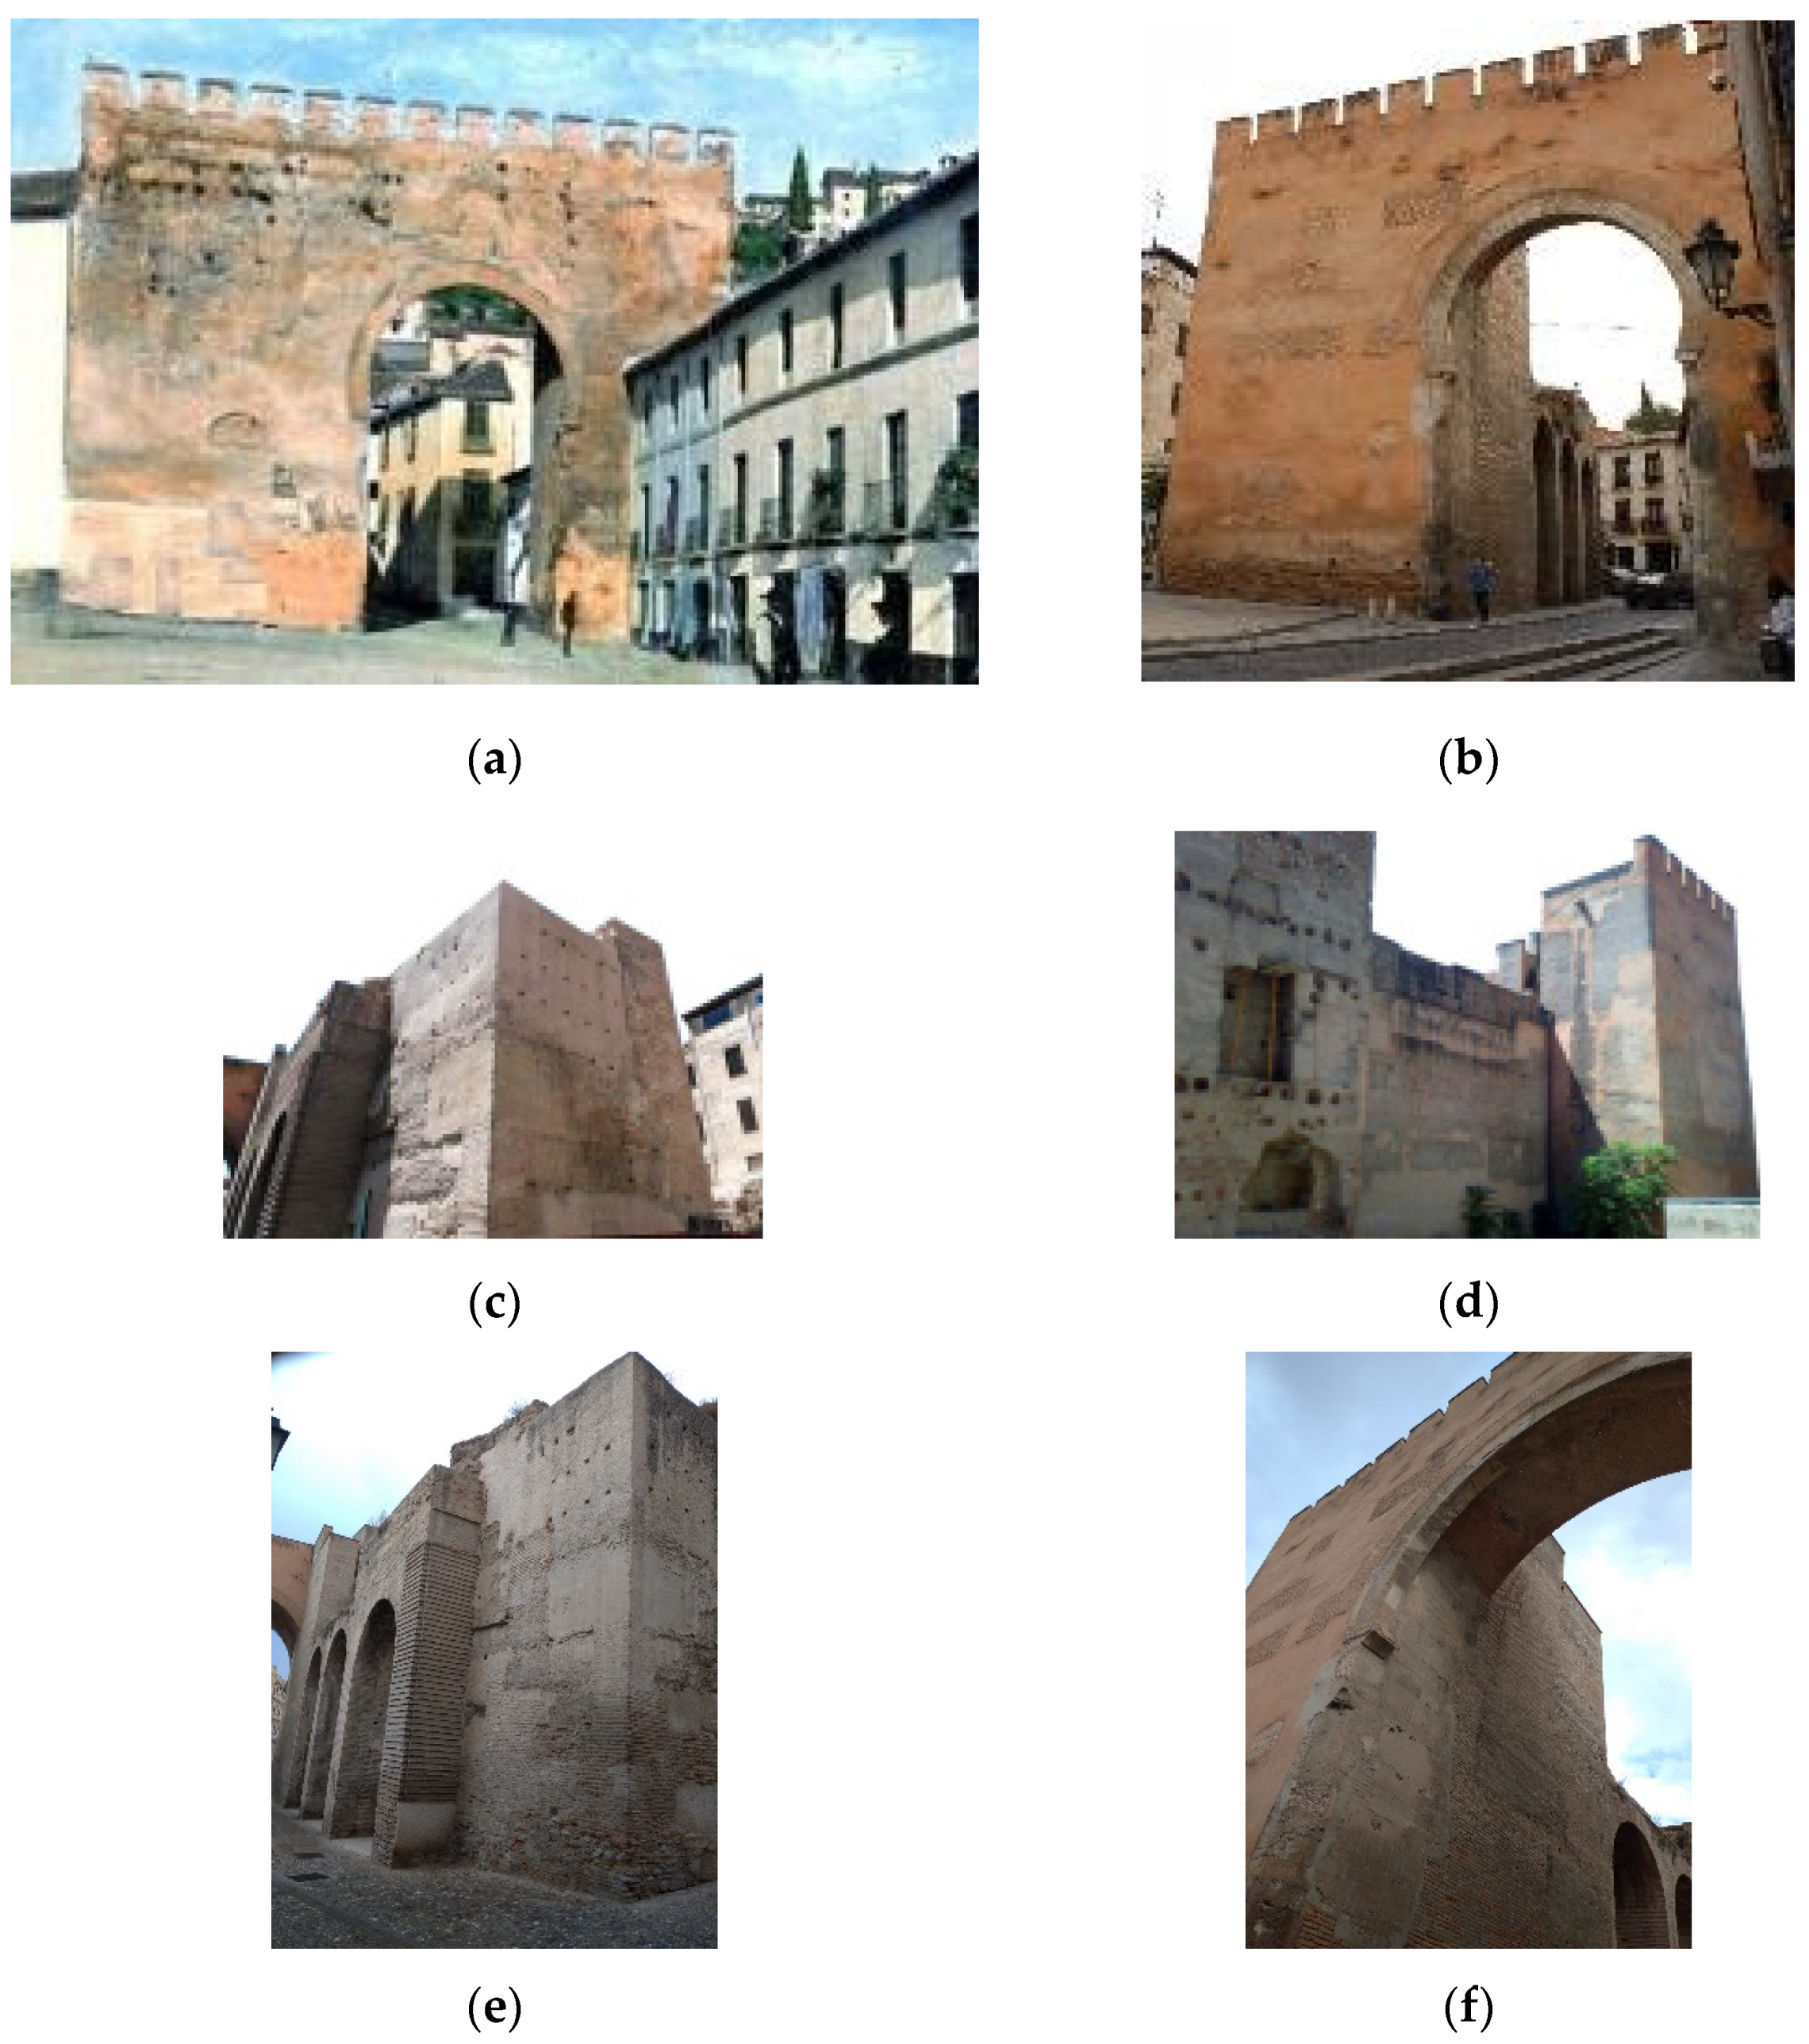
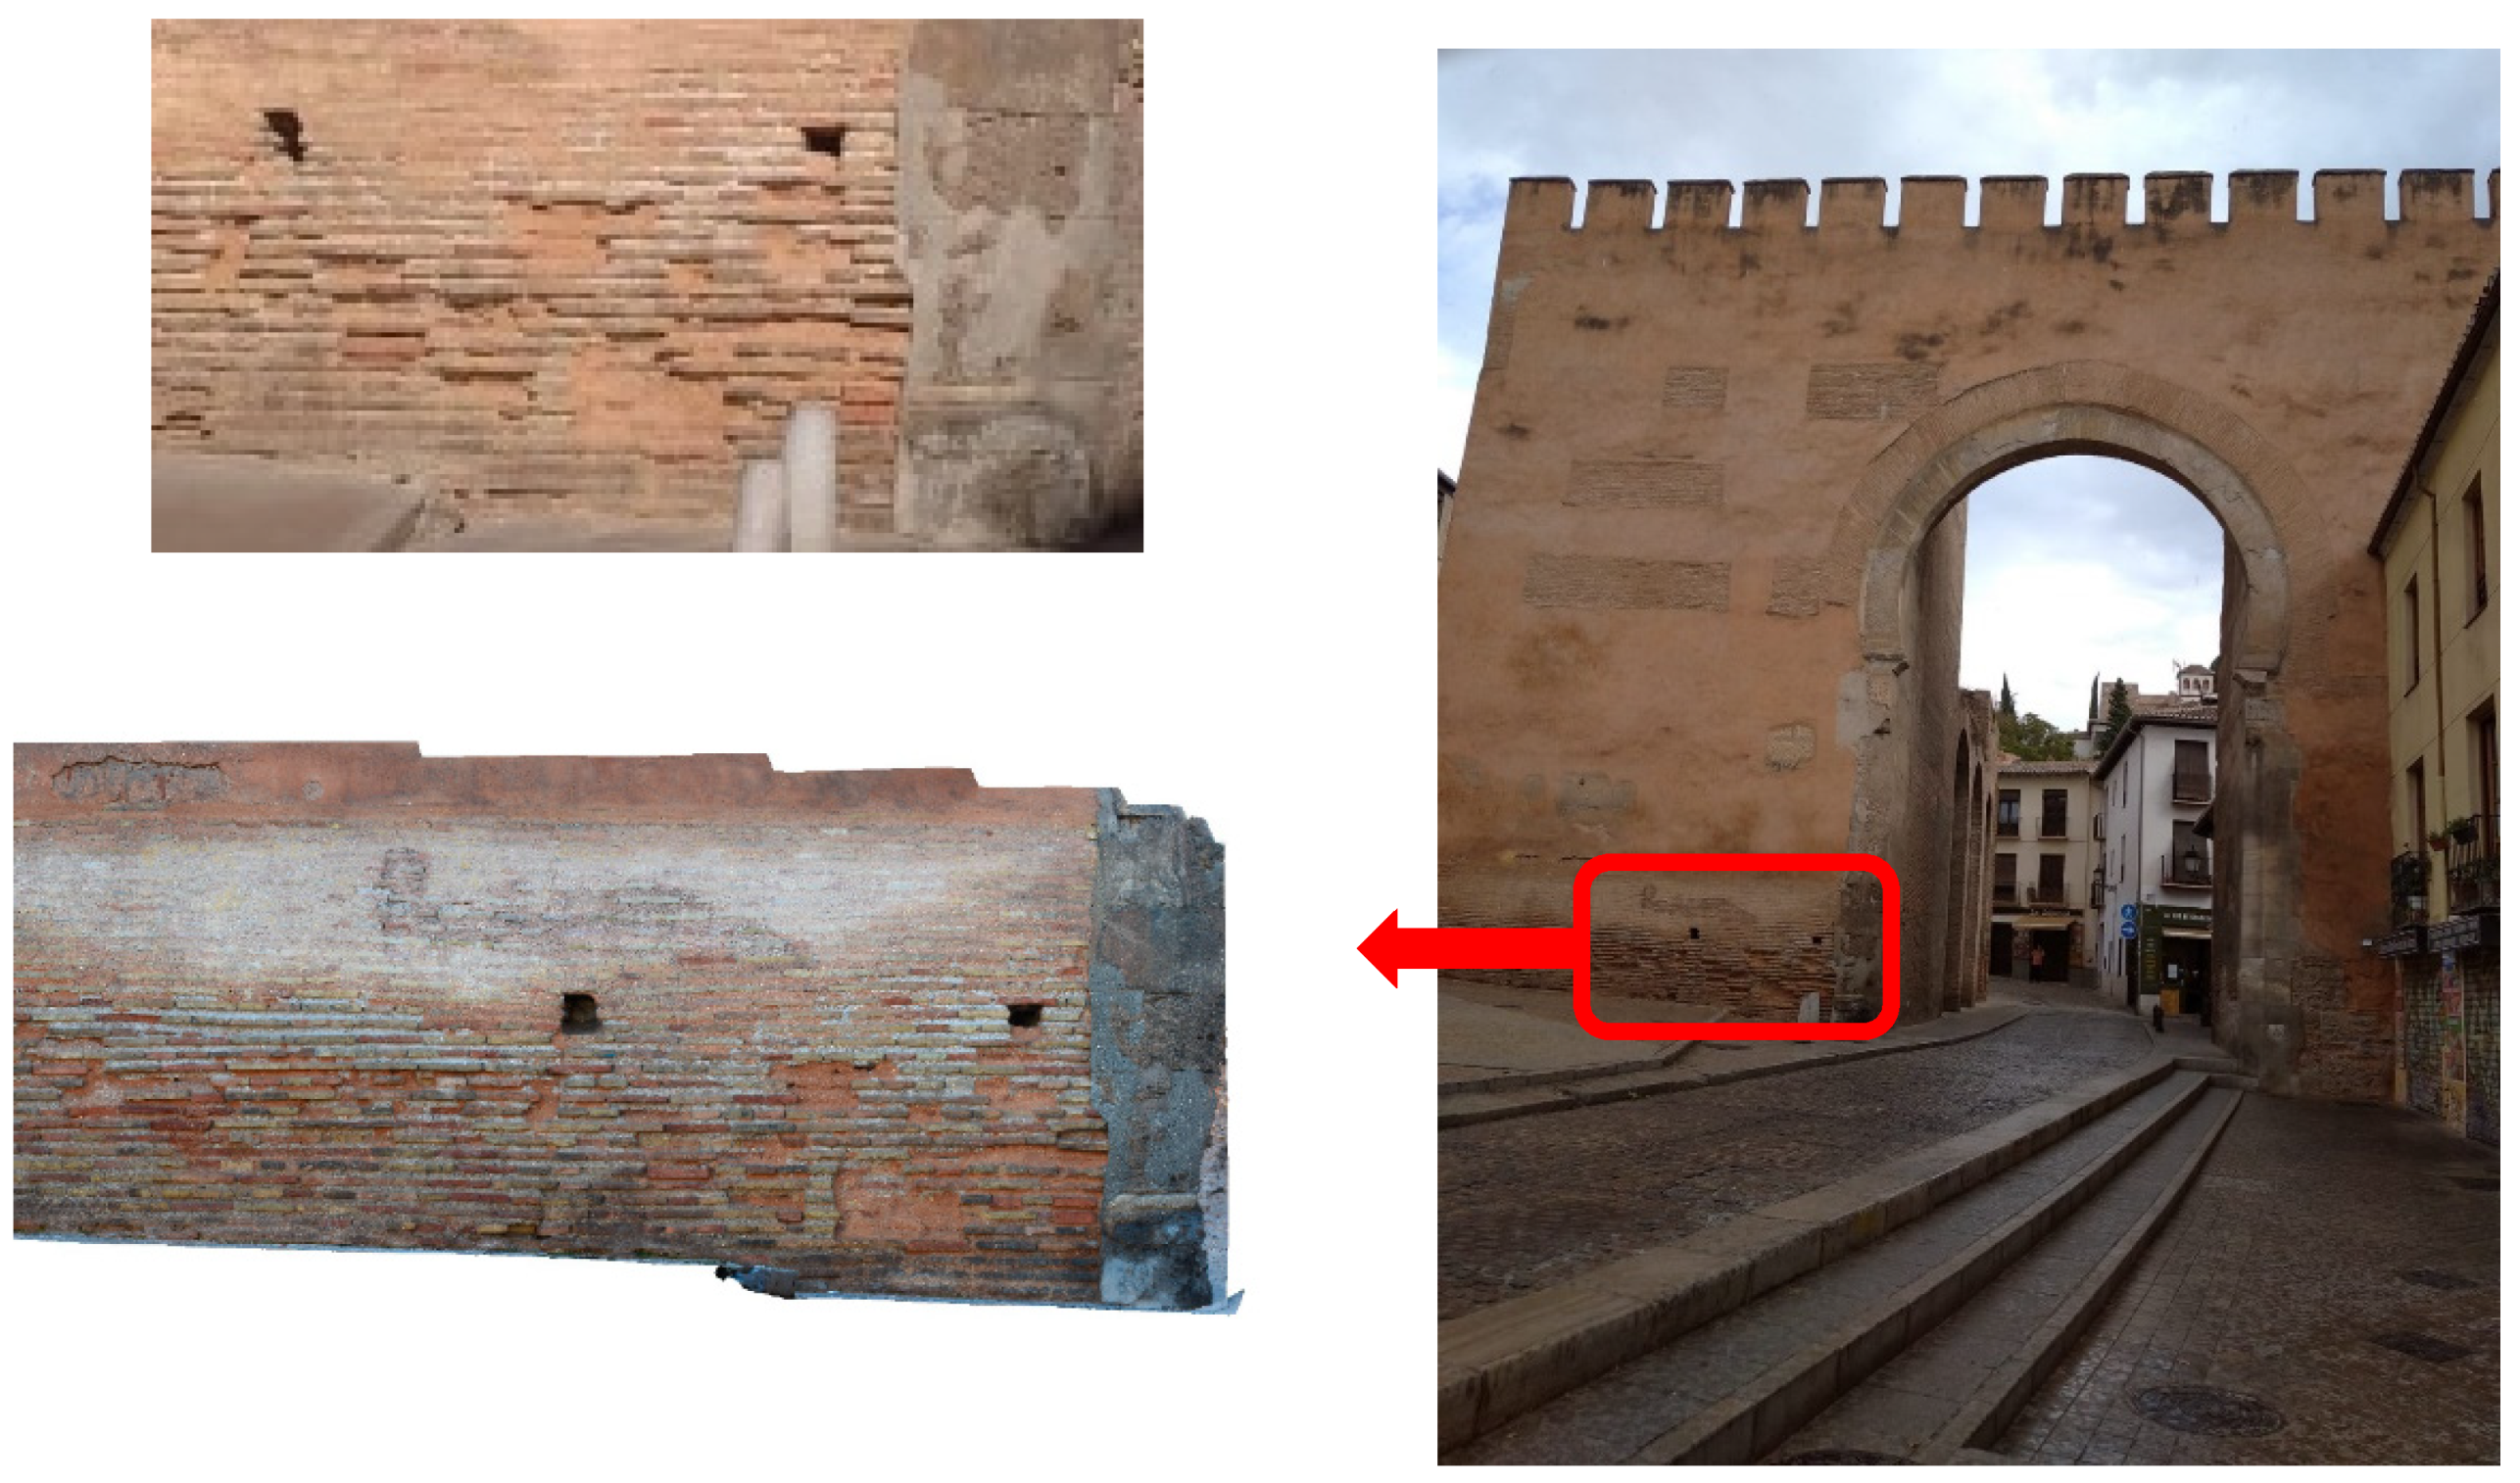
Puerta Elvira (PE), or Bab Ilvira, (see Figure 4) is a gate that was part of the city walls, originally constructed with rammed earth. It was the main entrance to Granada during the Islamic period and it is one of the oldest gates in the city. PE was built in the 11th century, and it has undergone several transformations. Its current configuration is dated to the reign of Yusuf I in the 14th century. In 1612 the esplanade in front of the gate was leveled and houses that were attached to the wall were built. PE has remained almost unchanged to this day (see Figure 4a,b). Currently, this monument is formed by the exterior arch (made of sandstone voussoirs, preserved from the 14th century), two rammed earth towers that flank the arch (Figure 4c,d) and the abutment on the north side of the monument formed by three niches defined by high brick arches that support a walkway [25], see Figure 4e. Throughout the 20th century it underwent several restoration and consolidation works. In 1902 the jambs of the arch were reinforced with SPs [8,25] (Figure 4f). Several repairs have been carried out on the front façade, ranging from simple mortar plaster to more drastic interventions consisting on the inlay of handmade brick pieces to fill gaps produced by the loss of the original rammed earth, as in 1957 [25,26] (see Figure 4b).

2.2. Degradation Pattern of Rammed Earth

As a result of the climate of Granada, evidence shows that the aging of heritage buildings is mainly manifested on the exterior façades areas, close to the ground. This deterioration can decrease the structural capacity of buildings.
Recession patterns of SPs and their linear evolution over time using empirical descriptions based on photogrammetry have recently been proposed [8]. Degradation patterns for RE construction cannot be obtained for PE, because it has had major restoration work done using bricks in the lower part of the east façade (the part of the monument built with rammed earth that is most affected by degradation factors, see Figure 5).
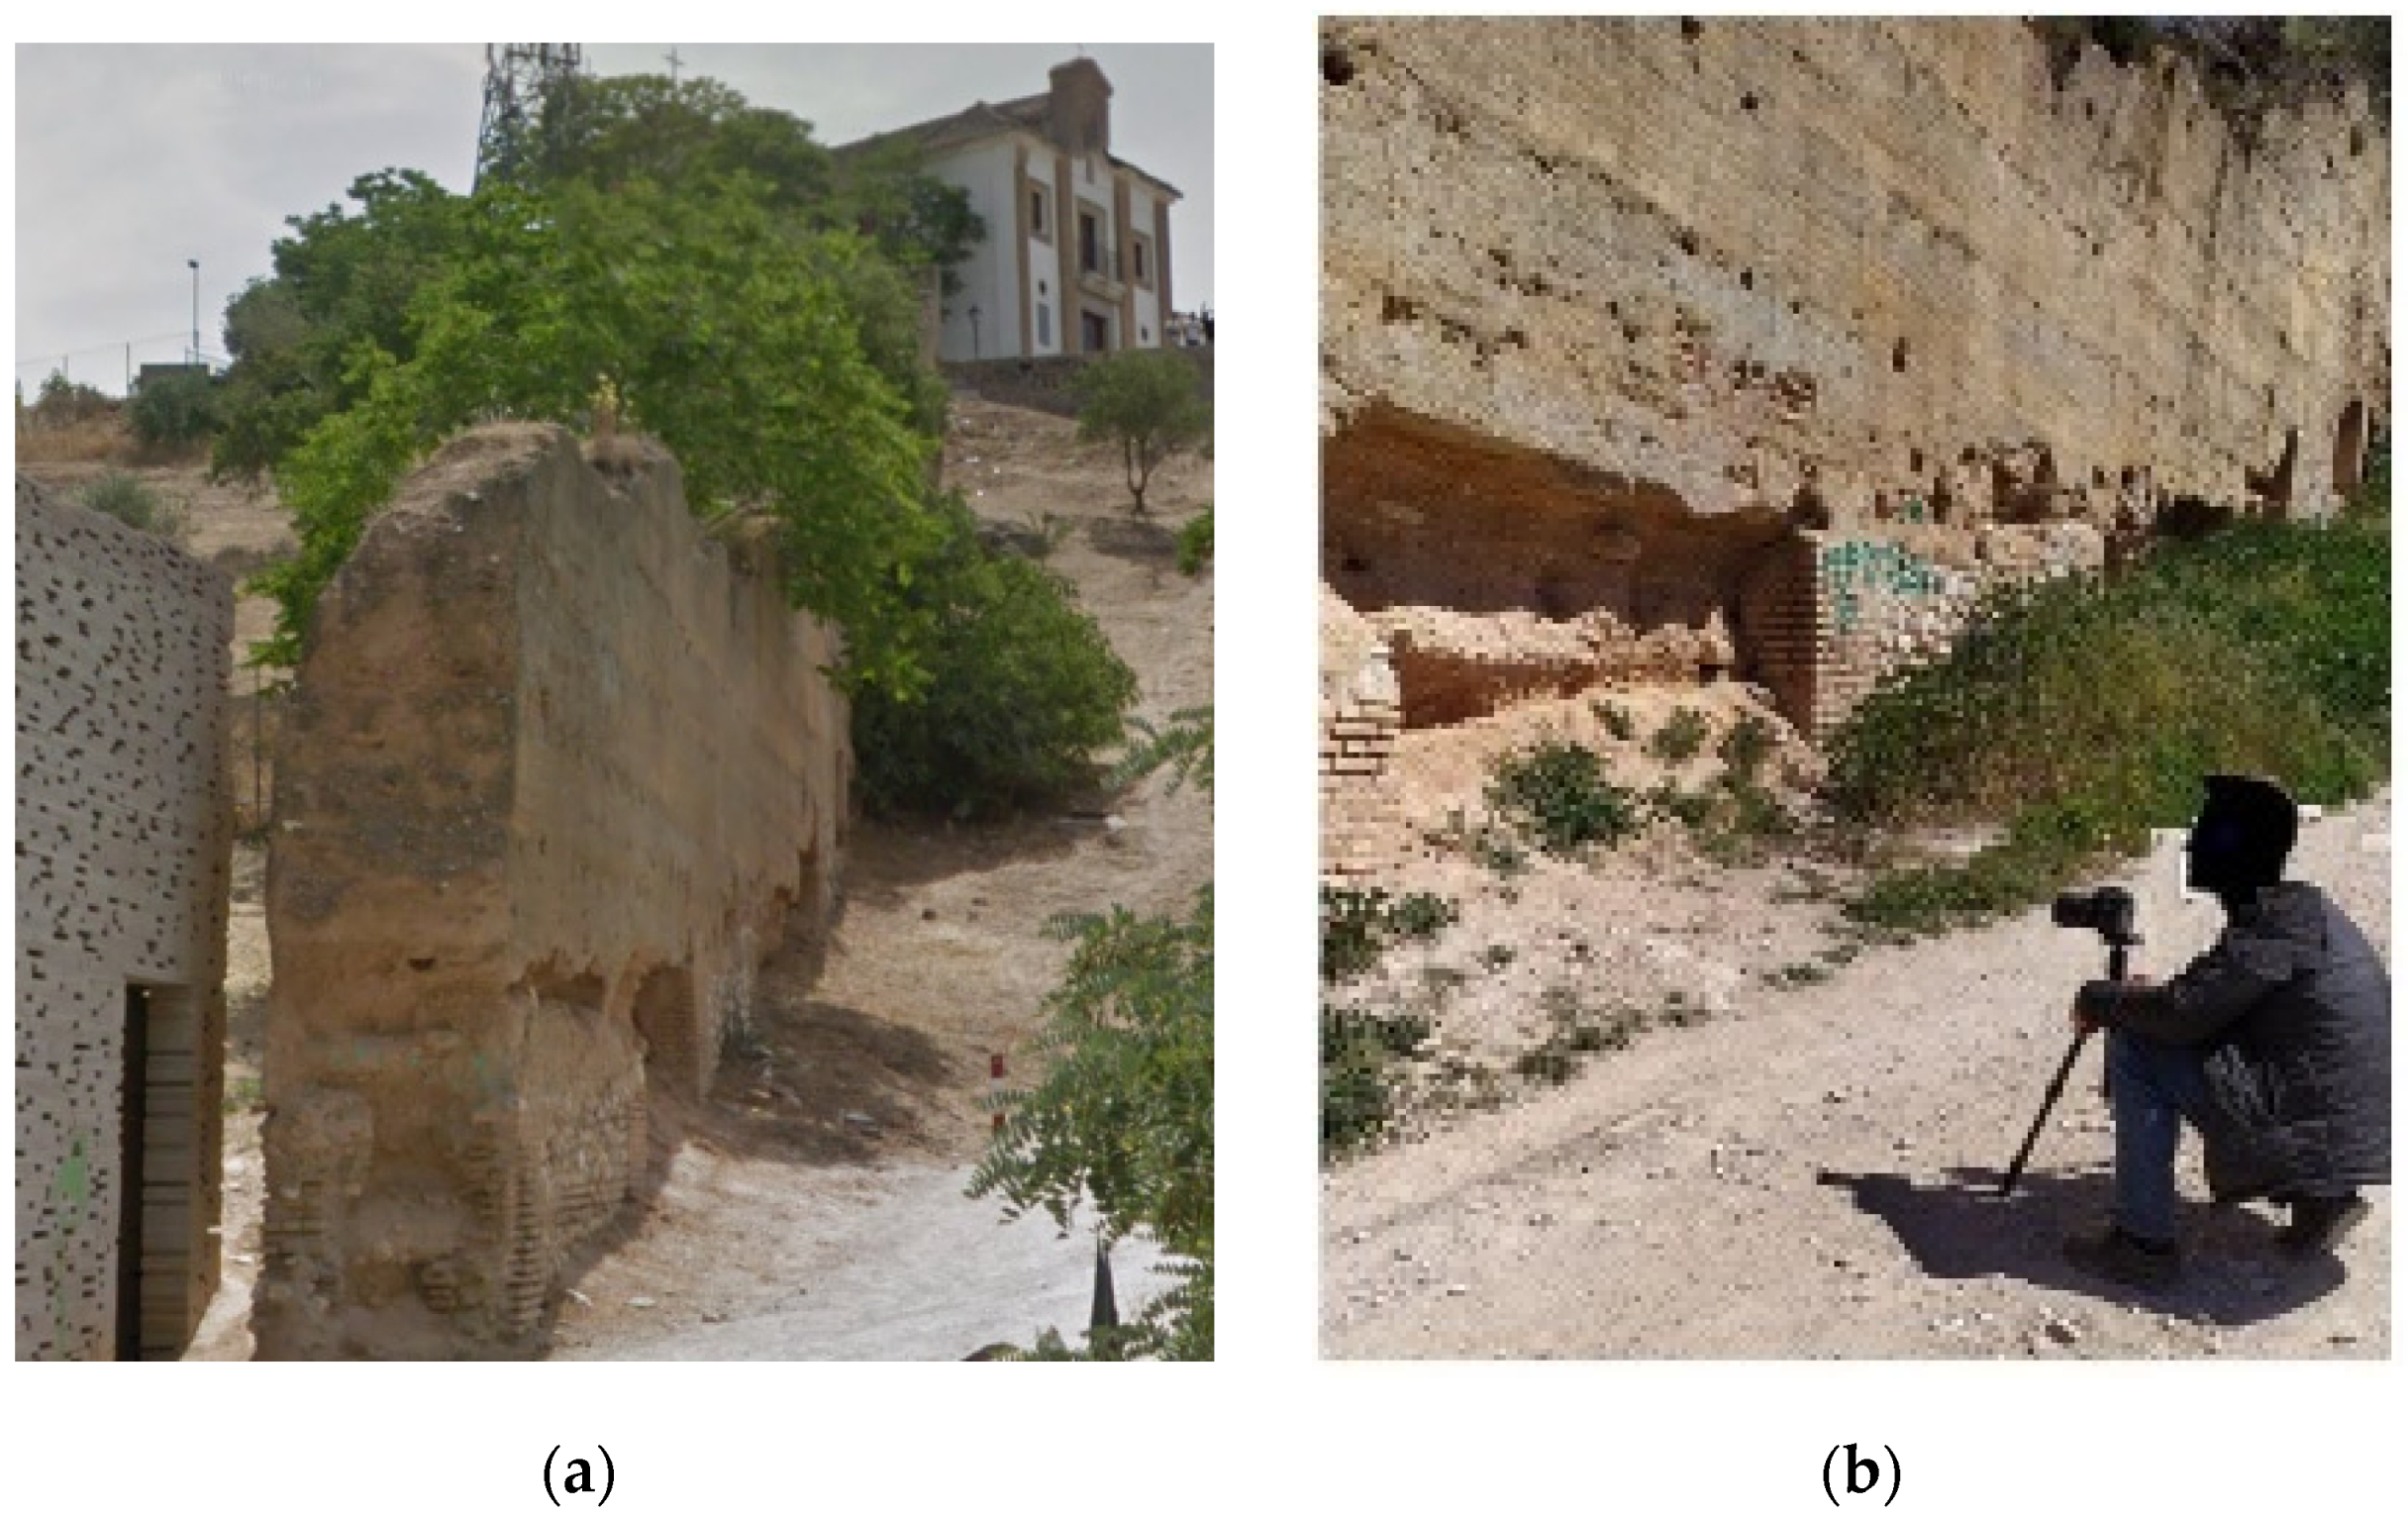
The degradation pattern of rammed earth has been obtained from the Zirid Wall (Figure 6), which was built during the same period and did not have any restoration work. The Zirid wall is part of the Albaicín wall. It is located in the highest area of the Albaicín neighborhood (Granada, Spain). Some sections of the The Zirid wall, dated from the 11th century, have hardly undergone any restorations (see Figure 6). In one of these segments, the recession pattern of the rammed earth wall has been obtained by using 3D digital photogrammetry data, as in [8]. Figure 6 shows the location of the selected section of original wall and the process of taking photos.
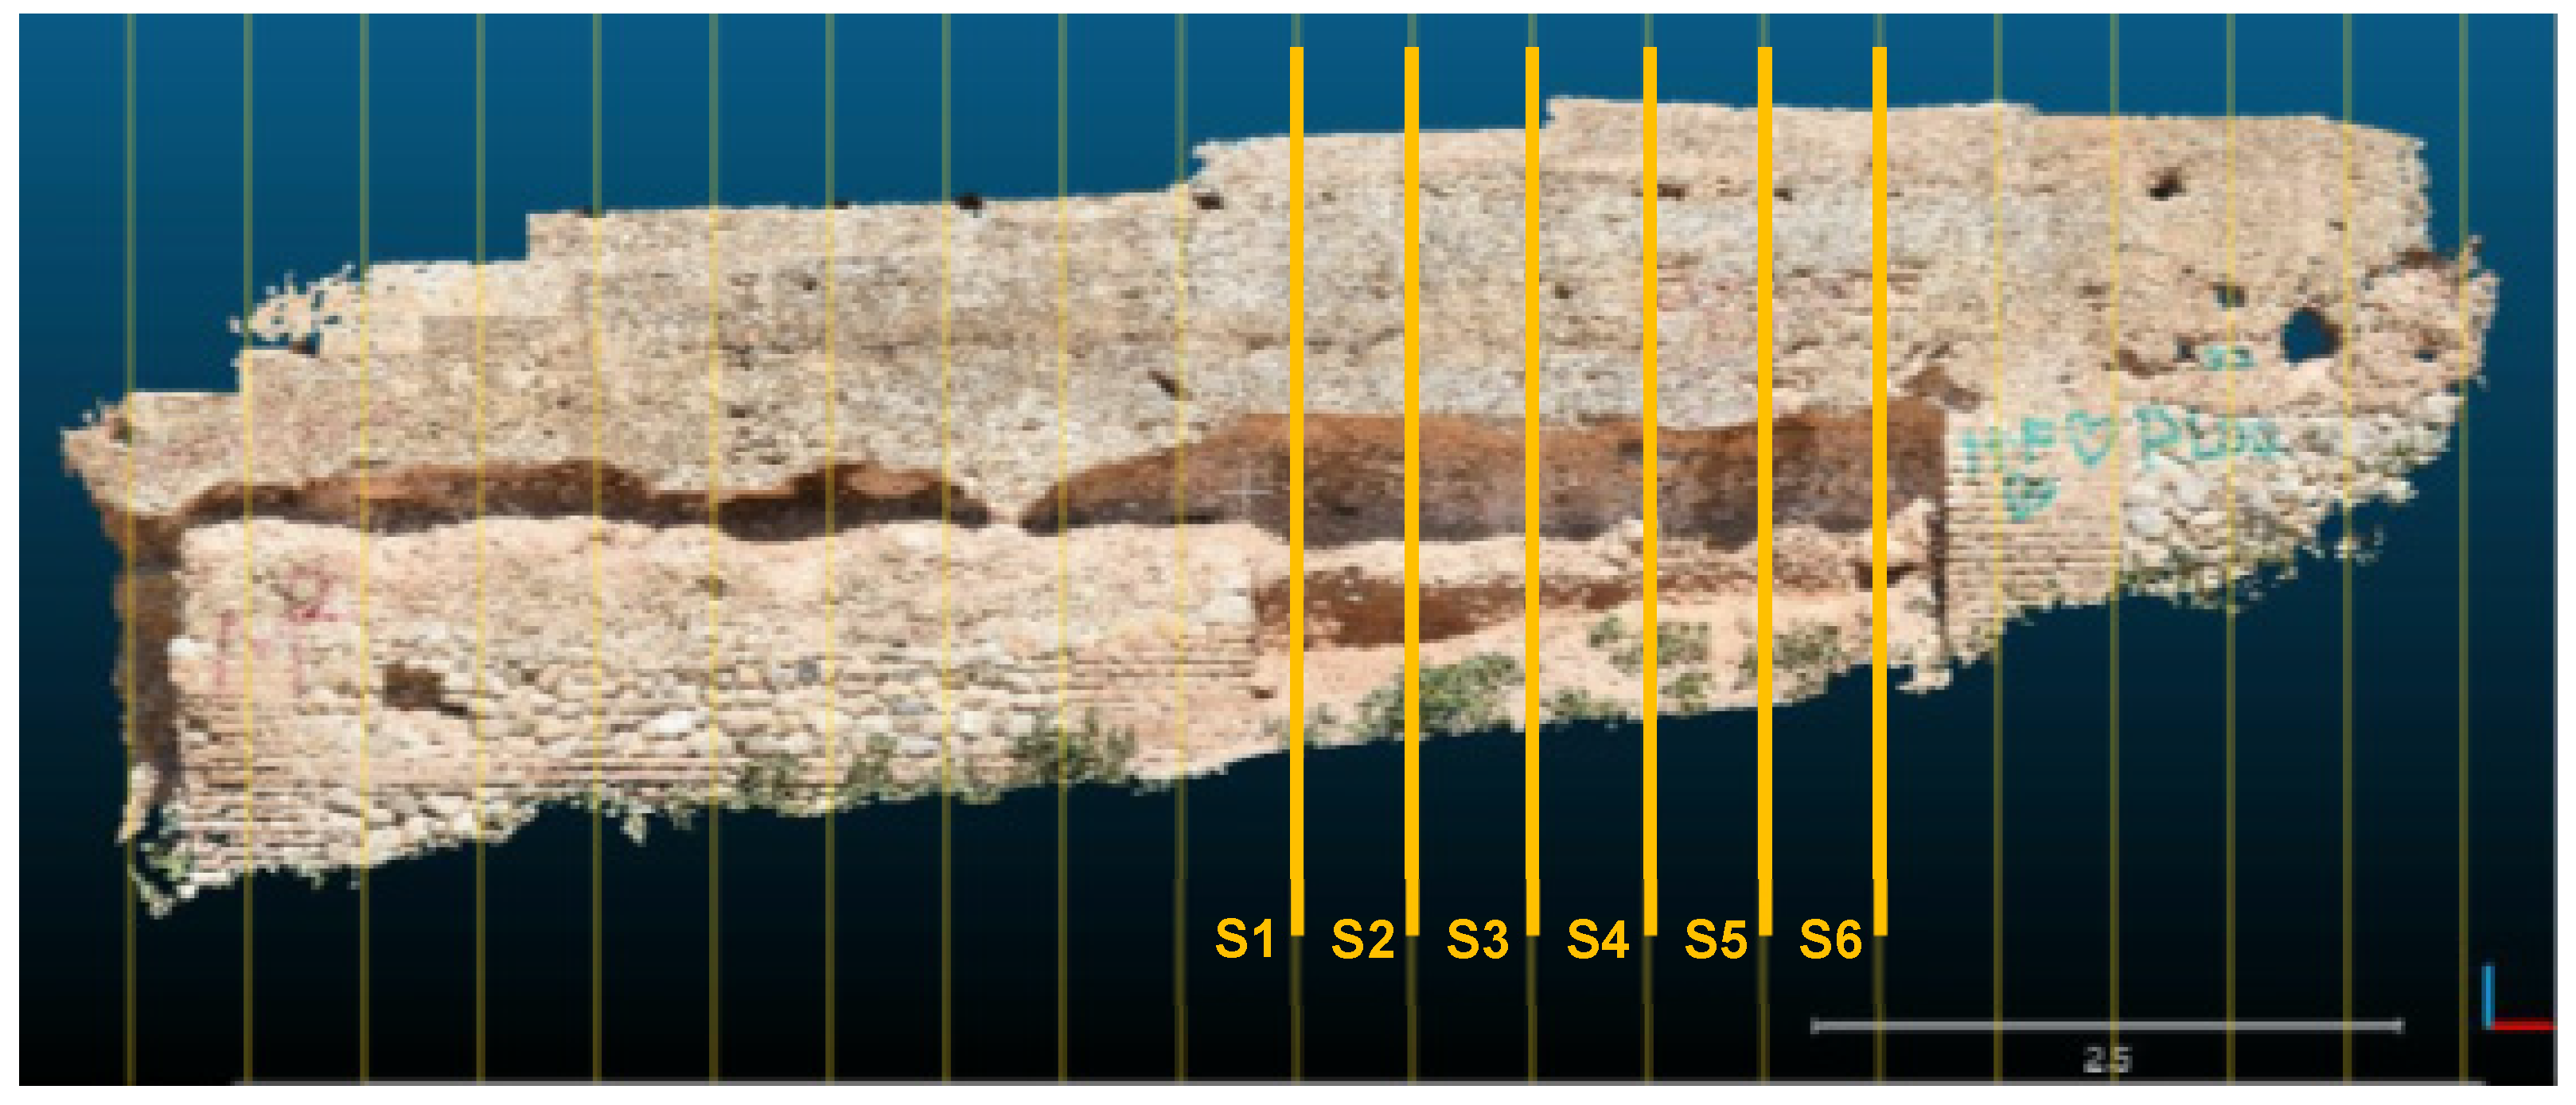
The model of the wall was made by overlapping several images (see vertical lines in Figure 7). 21 sections of reference separated at 0.5 m are considered along this segment of the Zirid Wall. Figure 7 shows the high level of deterioration of this section of the Zirid wall. As can be seen, there are deep cavities along the 2 m analyzed.
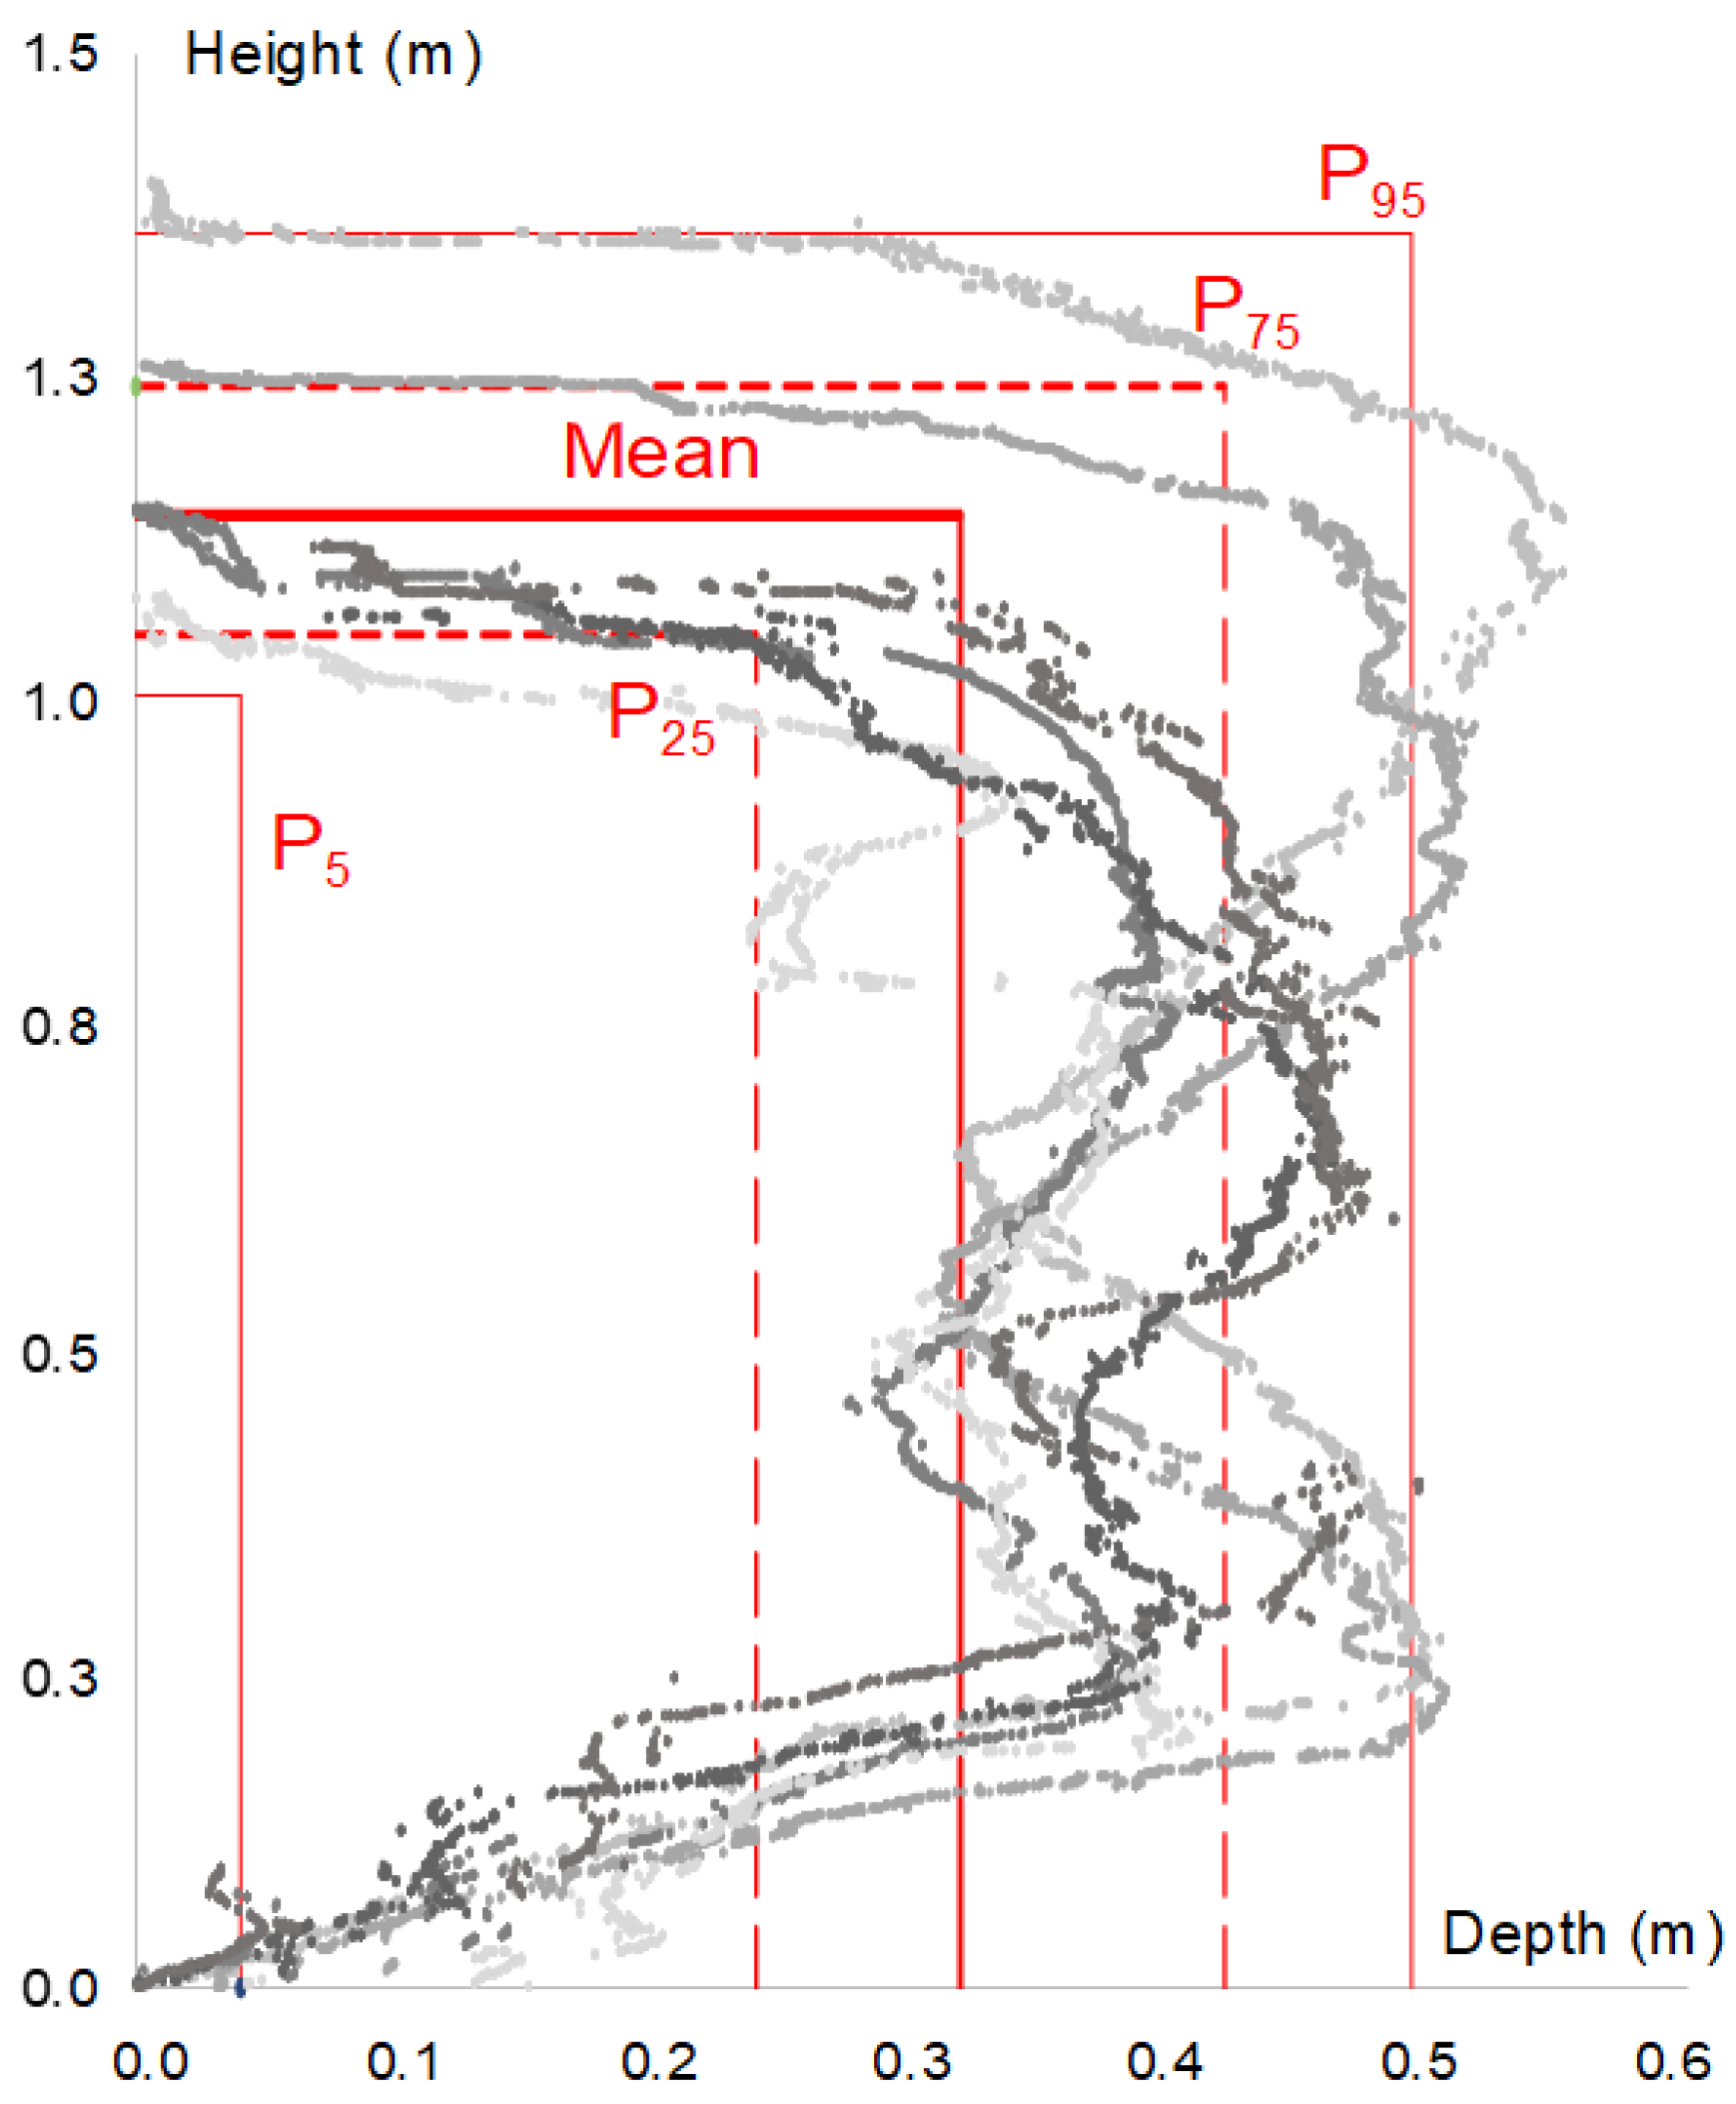
To obtain the degradation pattern of the rammed earth six (S1 to S6) of the 21 sections indicated in Figure 7 are considered. Degraded sections S1 to S6 are represented in Figure 8. As can be seen, the degradation effect reaches a height of up to 1.4 m and a depth of 0.6 m. Once the sections are geometrically defined, the degradation pattern is obtained by using lineal regression. Given the shapes of the degraded sections, a rectangular candidate degradation profile (see Figure 8) is considered, which represents the data obtained reasonably well, especially considering that the lower part (from 0 to 0.3 m) is composed of unconsolidated material, obtained from the degradation of the upper part. In Figure 8 mean and 5th, 25th, 75th and 95th percentiles are indicated. Figure 8 shows that the mean values of the degraded height and depth are 0.32 and 1.14 m, respectively.

2.3. Finite Element Models

Finite element analysis is a widespread methodology for solving dynamic problems since it requires much less time and effort than the analytical solution.
If the level of seismic activity is low enough, the damage caused to the structure by the seismic load can be assumed to be quite small and distributed. In such a situation, a continuous approach can be used for the structure, and FE can be used for the analysis.
San Jerónimo Monastery, Molino del Marqués de Rivas, and Puerta Elvira have been numerically analyzed to obtain their corresponding fragility curves (FC). The models were restrained at ground level and, after being subjected to the action of their own weight, accelerations in two perpendicular directions induced by the accelerograms selected ad-hoc for Granada were applied at the nodes at the ground level of the FE model. Ten sets of hazard consistent accelerograms, in N-S and W-E directions, a(t) were selected to assess structural response, at a certain seismic intensity level, in accordance with the well-known multiple-stripe analysis (MSA). See Appendix A for more information about hazard analysis, disaggregation and record selection.
PE has been modelled using 3D solid finite elements defined by eight nodes with three degrees of freedom at each node: translations in the nodal x, y, and z directions. PE is built of three materials: rammed earth, SP calcarenite and brick, see Figure 9.
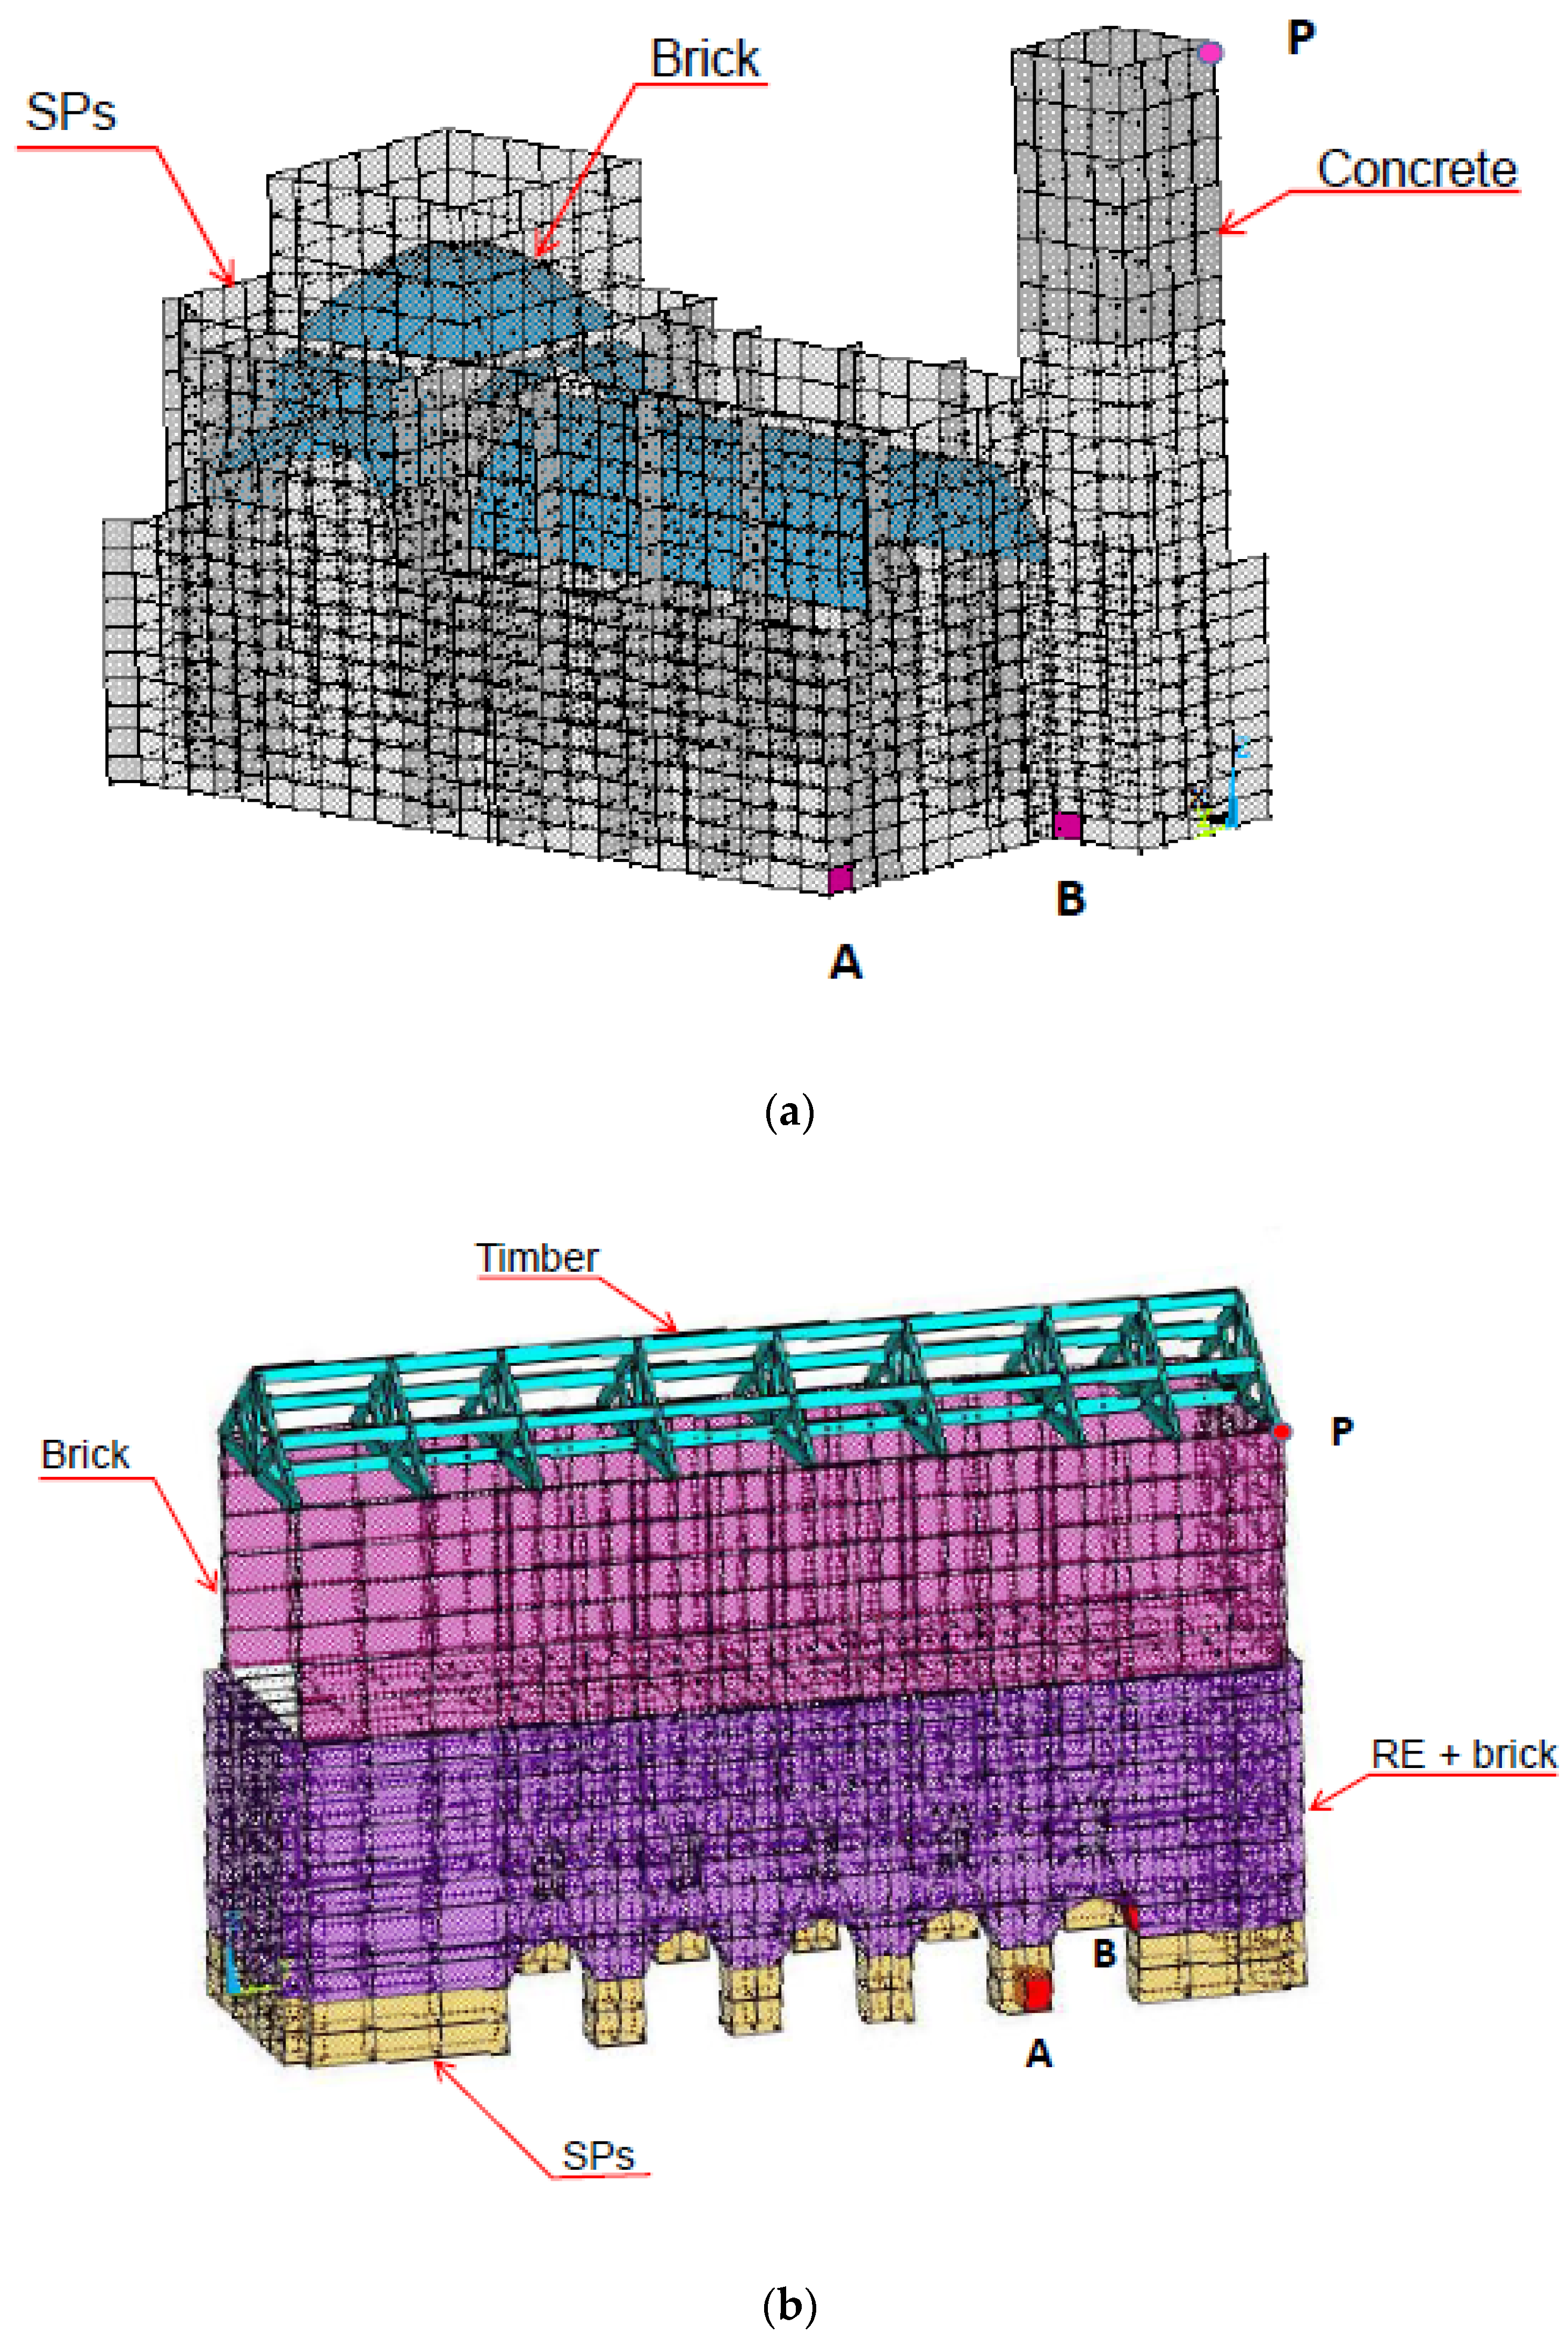
For the Monastery of San Jerónimo and the Molino del Marqués de Rivas, both FE models were built with shell elements (Figure 10). The materials of the monastery are SPs for walls, concrete for the upper part of the tower (dark grey in Figure 10a) and brick fabric for the domes (in blue in Figure 10a). The part of the Molino del Marqués de Rivas that is close to the foundation is made of SPs, above which there is a mix of brick and rammed earth walls (see different colours in Figure 10b). The behavioral curves (σ-ε) of the SPs and rammed earth materials were experimentally obtained from monotonic compression tests of several specimens [7,13].
Given that the main part of the structure of PE was built with a block of rammed earth, special attention has been paid to model this material. RE has been modelled as if it were a very poor concrete with cracking and crushing capacities that are defined by a failure surface. This surface defines cracking or crushing depending on whether the principal stress is tensile or compressive, respectively. In compression, crushing corresponds to the complete deterioration of the structural integrity of the material. In tension, the behaviour is linear elastic until failure. The failure surface does not consider strain softening in either compression or in tension, and, therefore, when stress in one direction reachs the failure surface, it drops to zero suddenly [29]. The behavior of rammed earth in compression considered in the numerical model corresponds to the average stress-strain curve obtained from monotonic compression tests on several specimens [14]. The mean Poisson’s ratio that has been experimentally obtained is also considered in the numerical model (i.e., ν = 0.21).
A brick masonry wall was modelled with E = 900 MPa with a compressive strength of 5 MPa, considering linear elastic behaviour until failure. A tensile strength equal to 0.2 MPa was considered for all the materials to allow convergence. The densities were 1750, 2000 and 1900 kg/m3 for SPs, RE and brick respectively.
In order to improve convergence, a mesh with cubic and rectangular elements was used for solid and shell elements, respectively. The failure of the three materials is defined by the multilinear isotropic material which uses the Von Mises failure criterion, along with the Willam and Warnke model [29].Given the lack of information, the Rayleigh damping constants (mass-proportional and stiffness-proportional, respectively) were obtained from the first two undamped natural frequencies considering a damping ratio of 5% [30]. No creep has been considered in the numerical model.
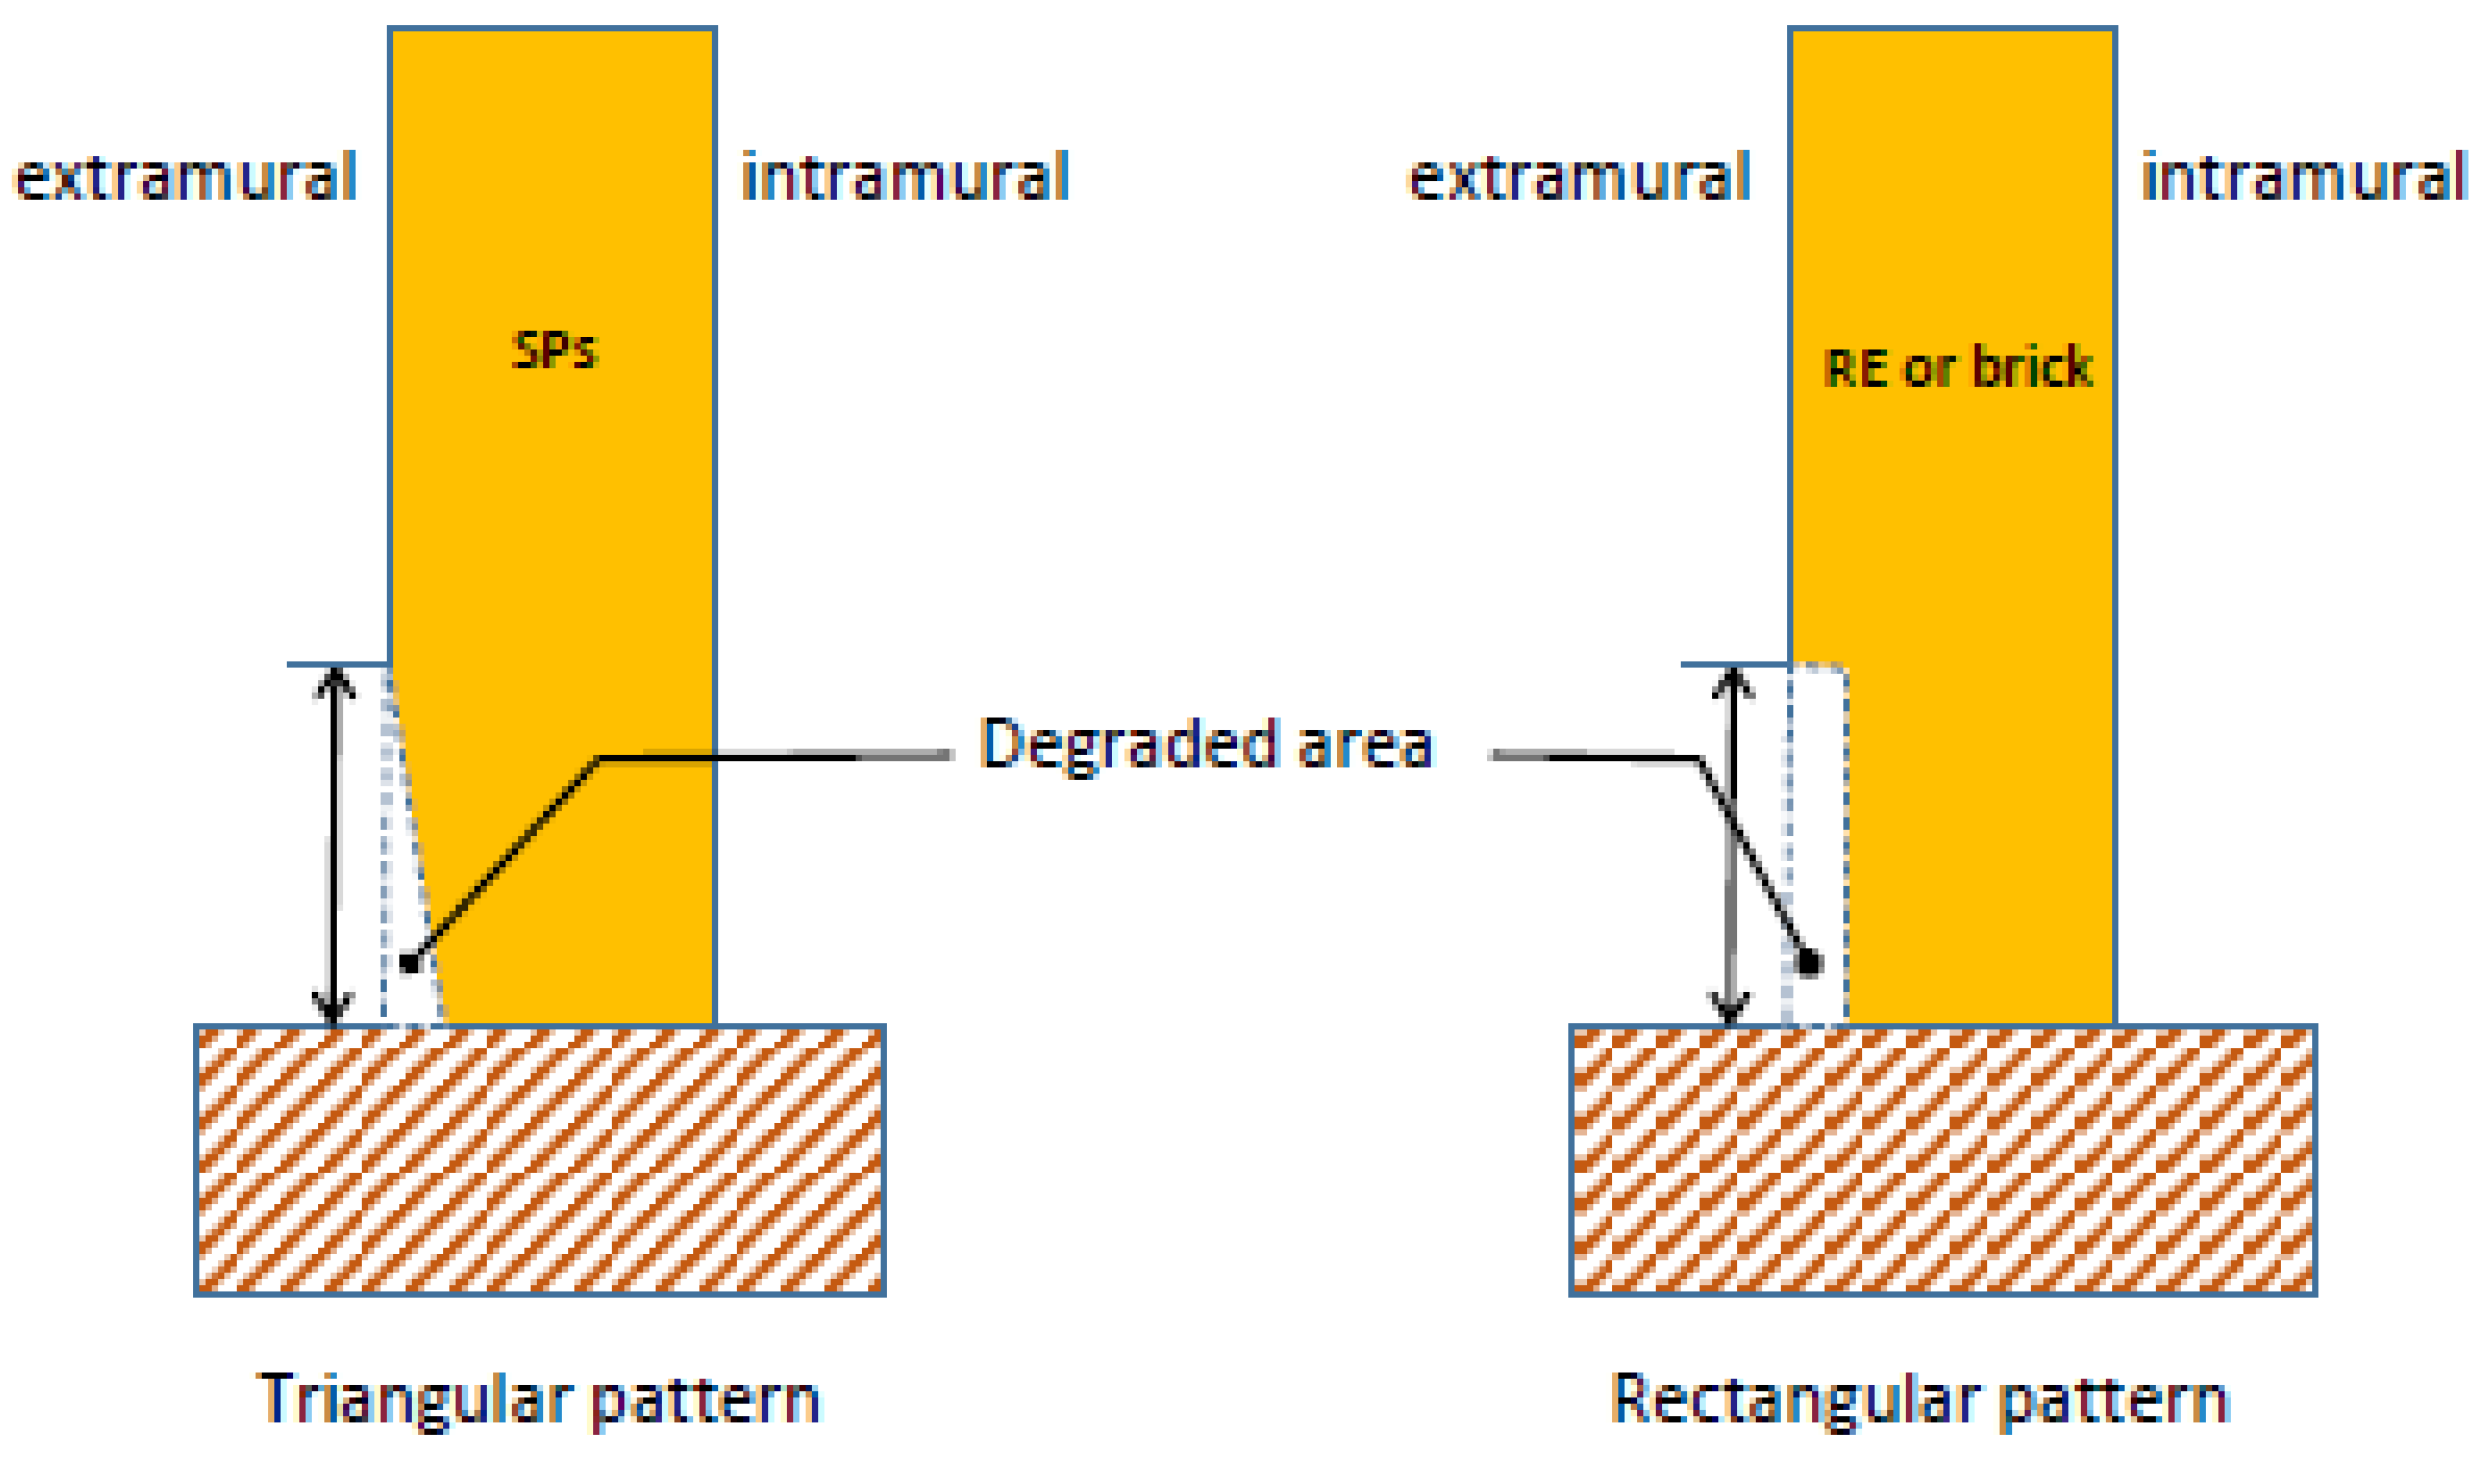
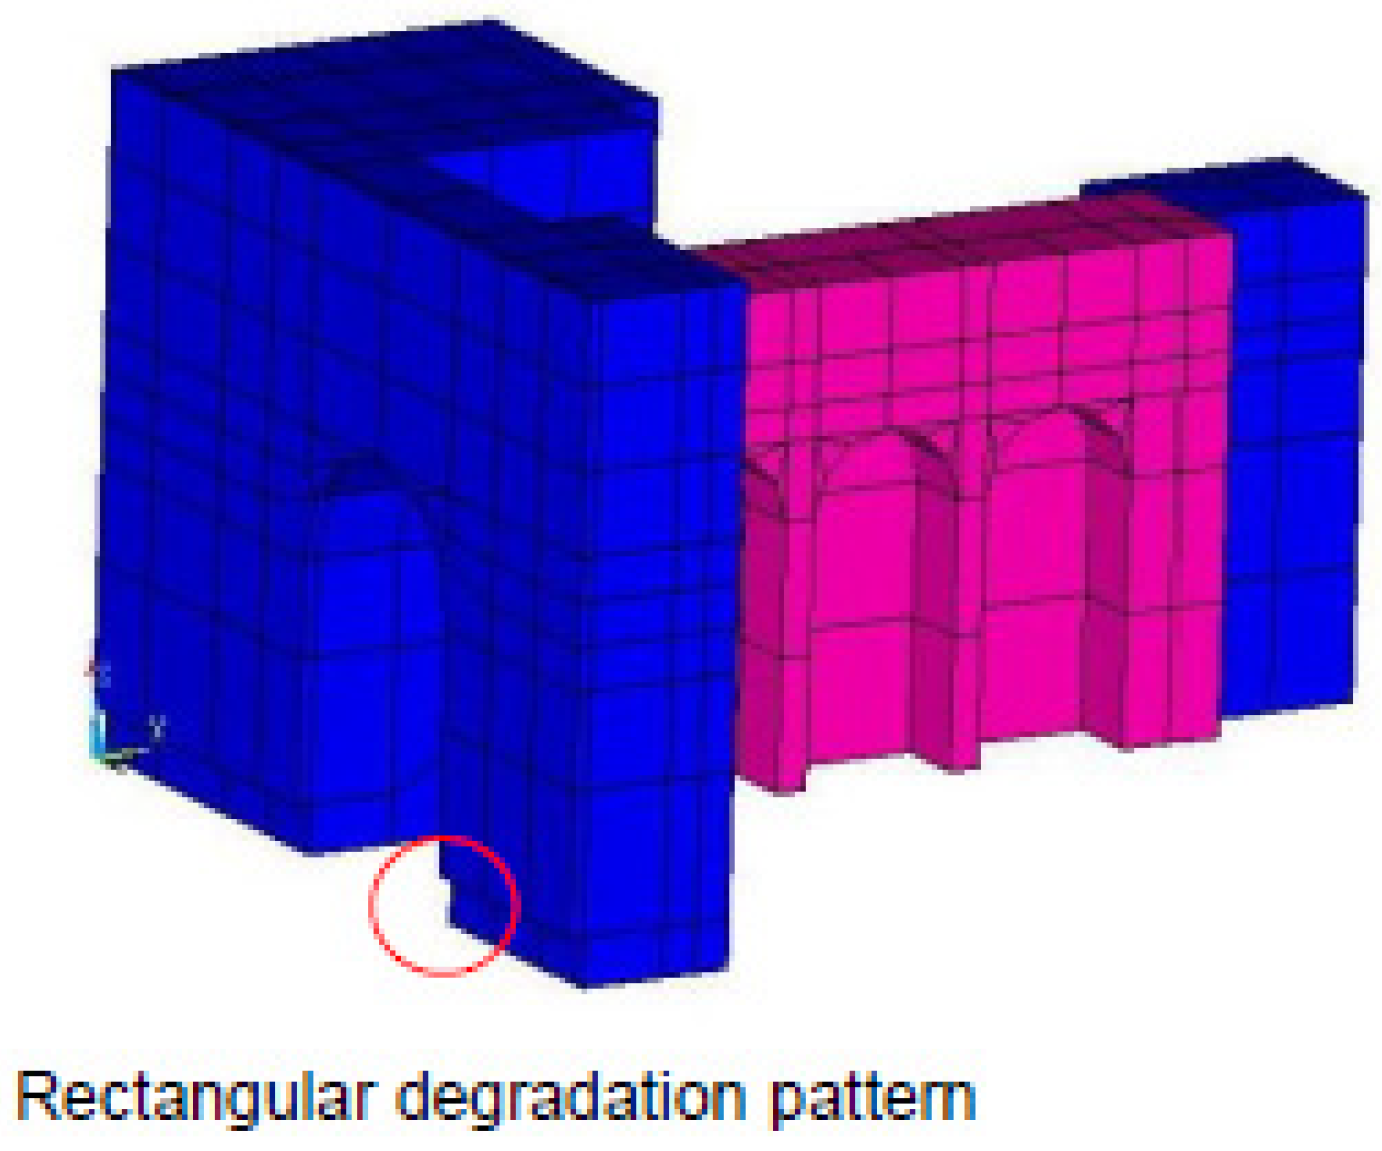
Triangular degradation patterns for SPs [8] and rectangular patterns for both brick [22] and rammed earth (see Figure 9) have been considered in this study. The dimensions of the degraded areas correspond to the average recorded values from photogrammetry ([8,22], see Figure 11. Both non-degraded and degraded FE models are analyzed. The latter is modelled by eliminating part of the material of the lower part of the façades, which is the area that is most affected by degradation, see Figure 12 for PE.

3. Results

Structural vulnerability is quantified here with fragility curves. A Fragility Curve (FC) expresses the conditional probability of reaching or exceeding a certain damage state caused by seismic event of a given severity, described by an appropriate Intensity Measure (IM).
In this study, fragility curves are derived from the results obtained from the FE analysis of the degraded and non-degraded models when subjected to seismic ground motions of ten different intensities of IM levels (see Appendix A). Eleven out of the twenty-one hazard consistent time histories selected for each intensity level were randomly chosen to compute the corresponding FC.

3.1. Puerta Elvira

The fragility curve of PE was obtained by analyzing the response of the numerical model against accelerations introduced at ground level. The probability of exceedance of a certain displacement at the top left corner of the main façade (point P in Figure 9) has been analysed.
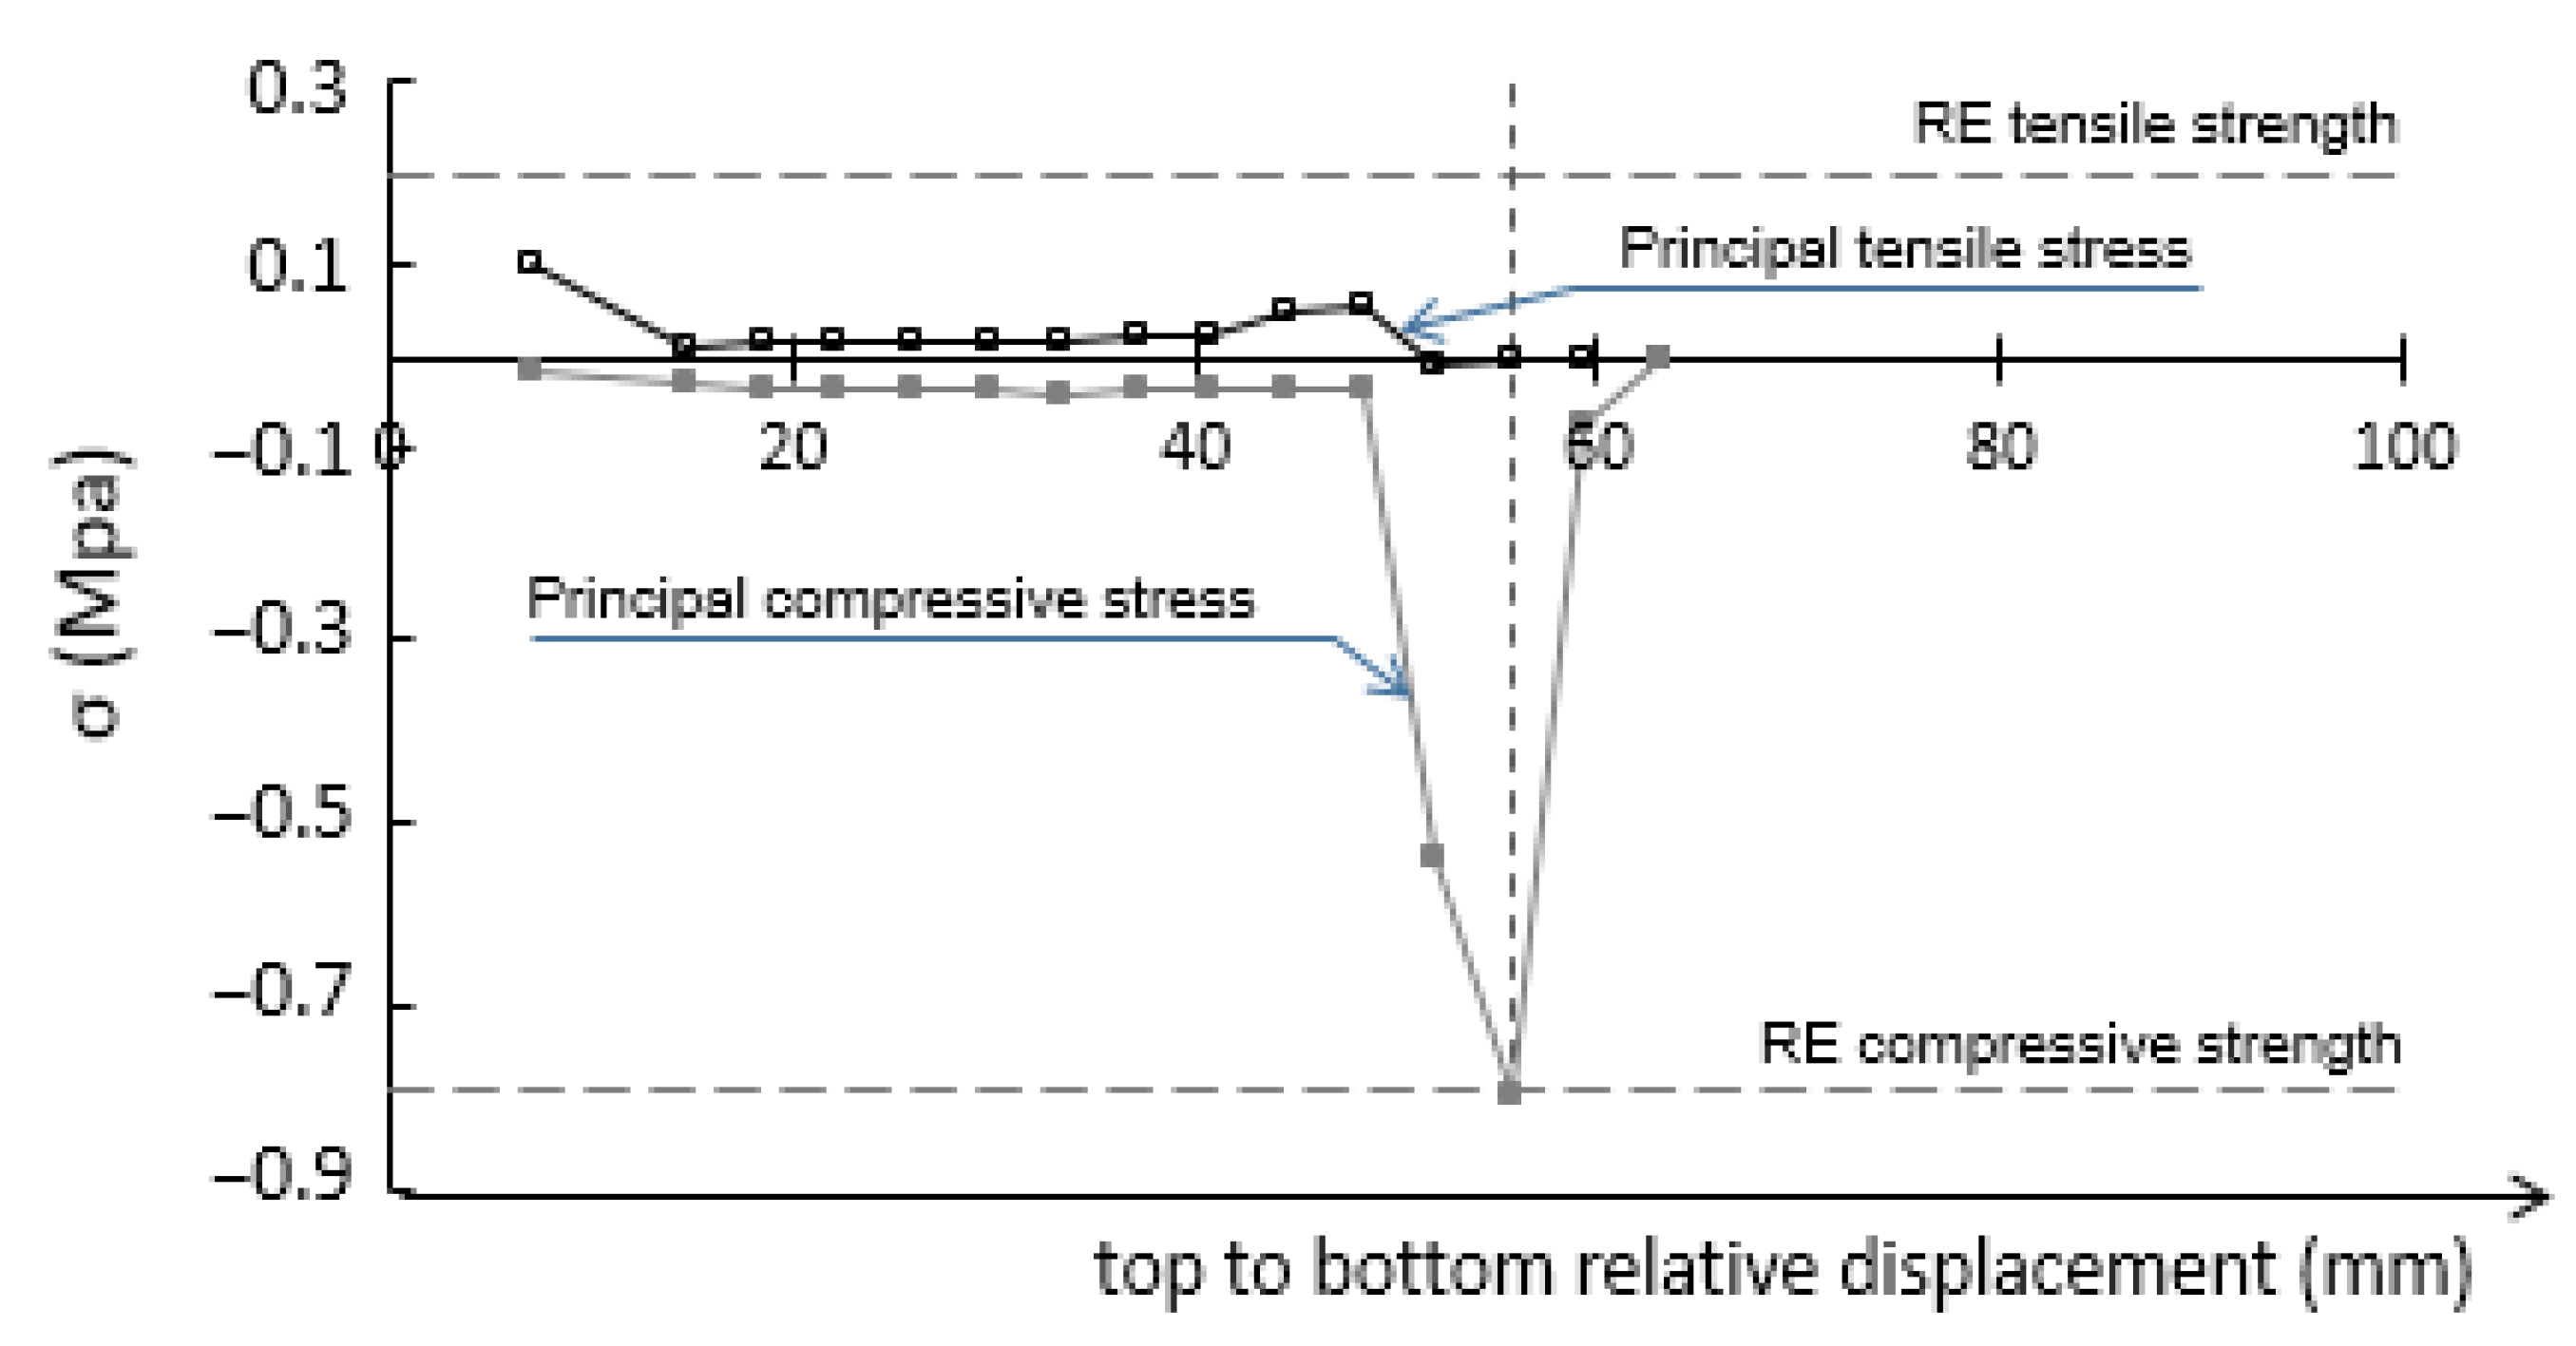
The threshold displacement was obtained from a FE push-over static analysis of PE. Maximum and minimum principal stresses in the element of rammed earth in the extrados of the arch next to the apex as a function of the relative displacement imposed at the top of the arch of PE (see Figure 9) are represented in Figure 13. In Figure 13 the tensile and compressive strengths of rammed earth are represented by horizontal dashed lines. As Figure 13 shows, the threshold displacement (or damage threshold, see Figure 1) was adopted as the one for which the compressive strength of the rammed earth was reached (compression is negative). The threshold displacement is 55.5 mm.
Two scenarios have been analyzed for PE: (i) considering that the main body of the arch is only built of RE (original state, i.e., without bricks), and (ii) considering the outer layer of brick pieces placed in 1957 on the front façade to repair the damage to the original rammed earth material. In the first scenario, the non-degraded and the mean degraded profile of RE shown in Figure 8 have been analyzed. In the second scenario, the non-degraded state and the degradation pattern for bricks for 500 and 1000 years old, considering an uniform degradation over time, (see [22]) have been considered.
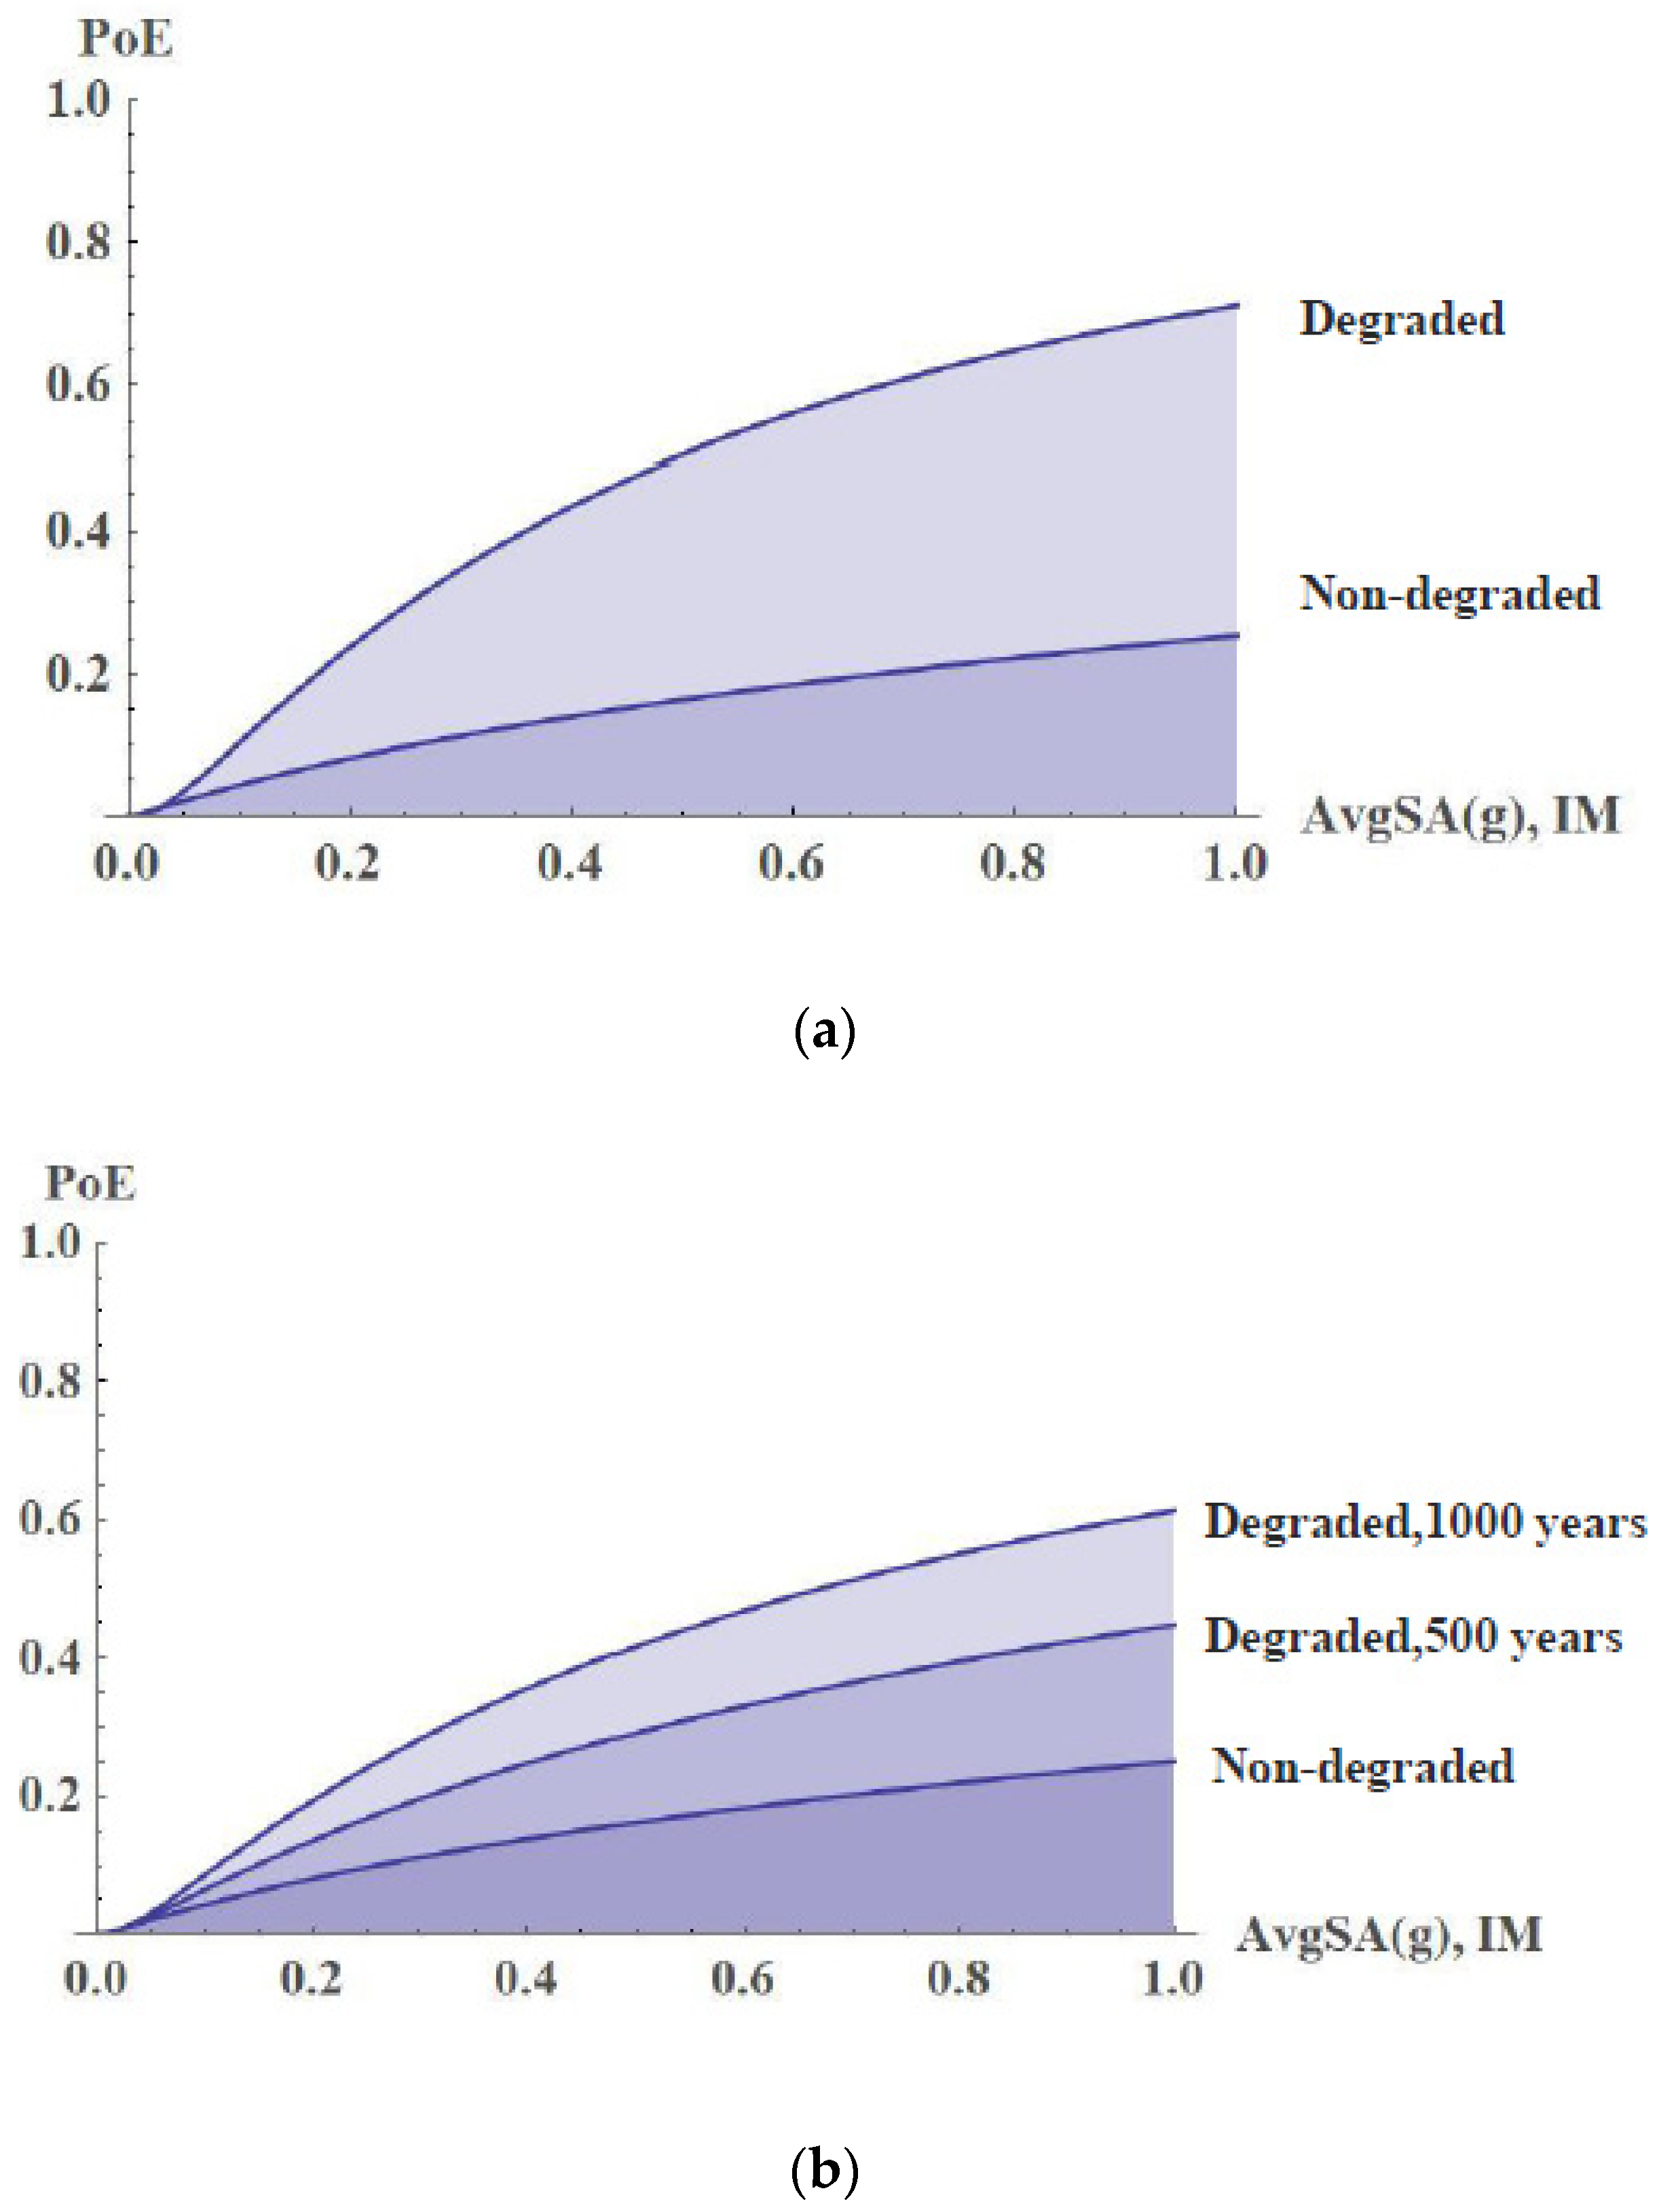
These fragility curves have been estimated from multiple stripe analysis results obtained from FE analysis considering the ground motions selected and following the framework developed by Baker [31]. As recommended in [30], two stripes differing by at least 25% in term of the probability of exceedance were considered to obtain the fragility curves of PE. The fragility curves for both scenarios are represented in Figure 14. The parameter selected is the displacement of point P assuming damage when this value reaches 55.5 mm (see Figure 13), which corresponds to around L/280. The analytical expression of the fragility curves in Figure 14 are derived by using a lognormal cumulative distribution function [21,31]. In the horizontal axes of Figure 14, the values of the IM considered (AvgSa (g), see Appendix A) are represented.
Figure 14 shows that RE degradation leads to less seismically resilient performance over the entire IM range. It can be seen that, for an average pseudo-acceleration of 0.23g the level of degradation measured on the Zirid wall (Figure 14a) leads to a significant increase in the probability of exceedance of the value established as damage threshold for PE. The results from when the degradation of brick is considered [22] mean that the probability of exceedance of the damage threshold over 1000 years is around 25%.

3.2. San Jerónimo Monastery

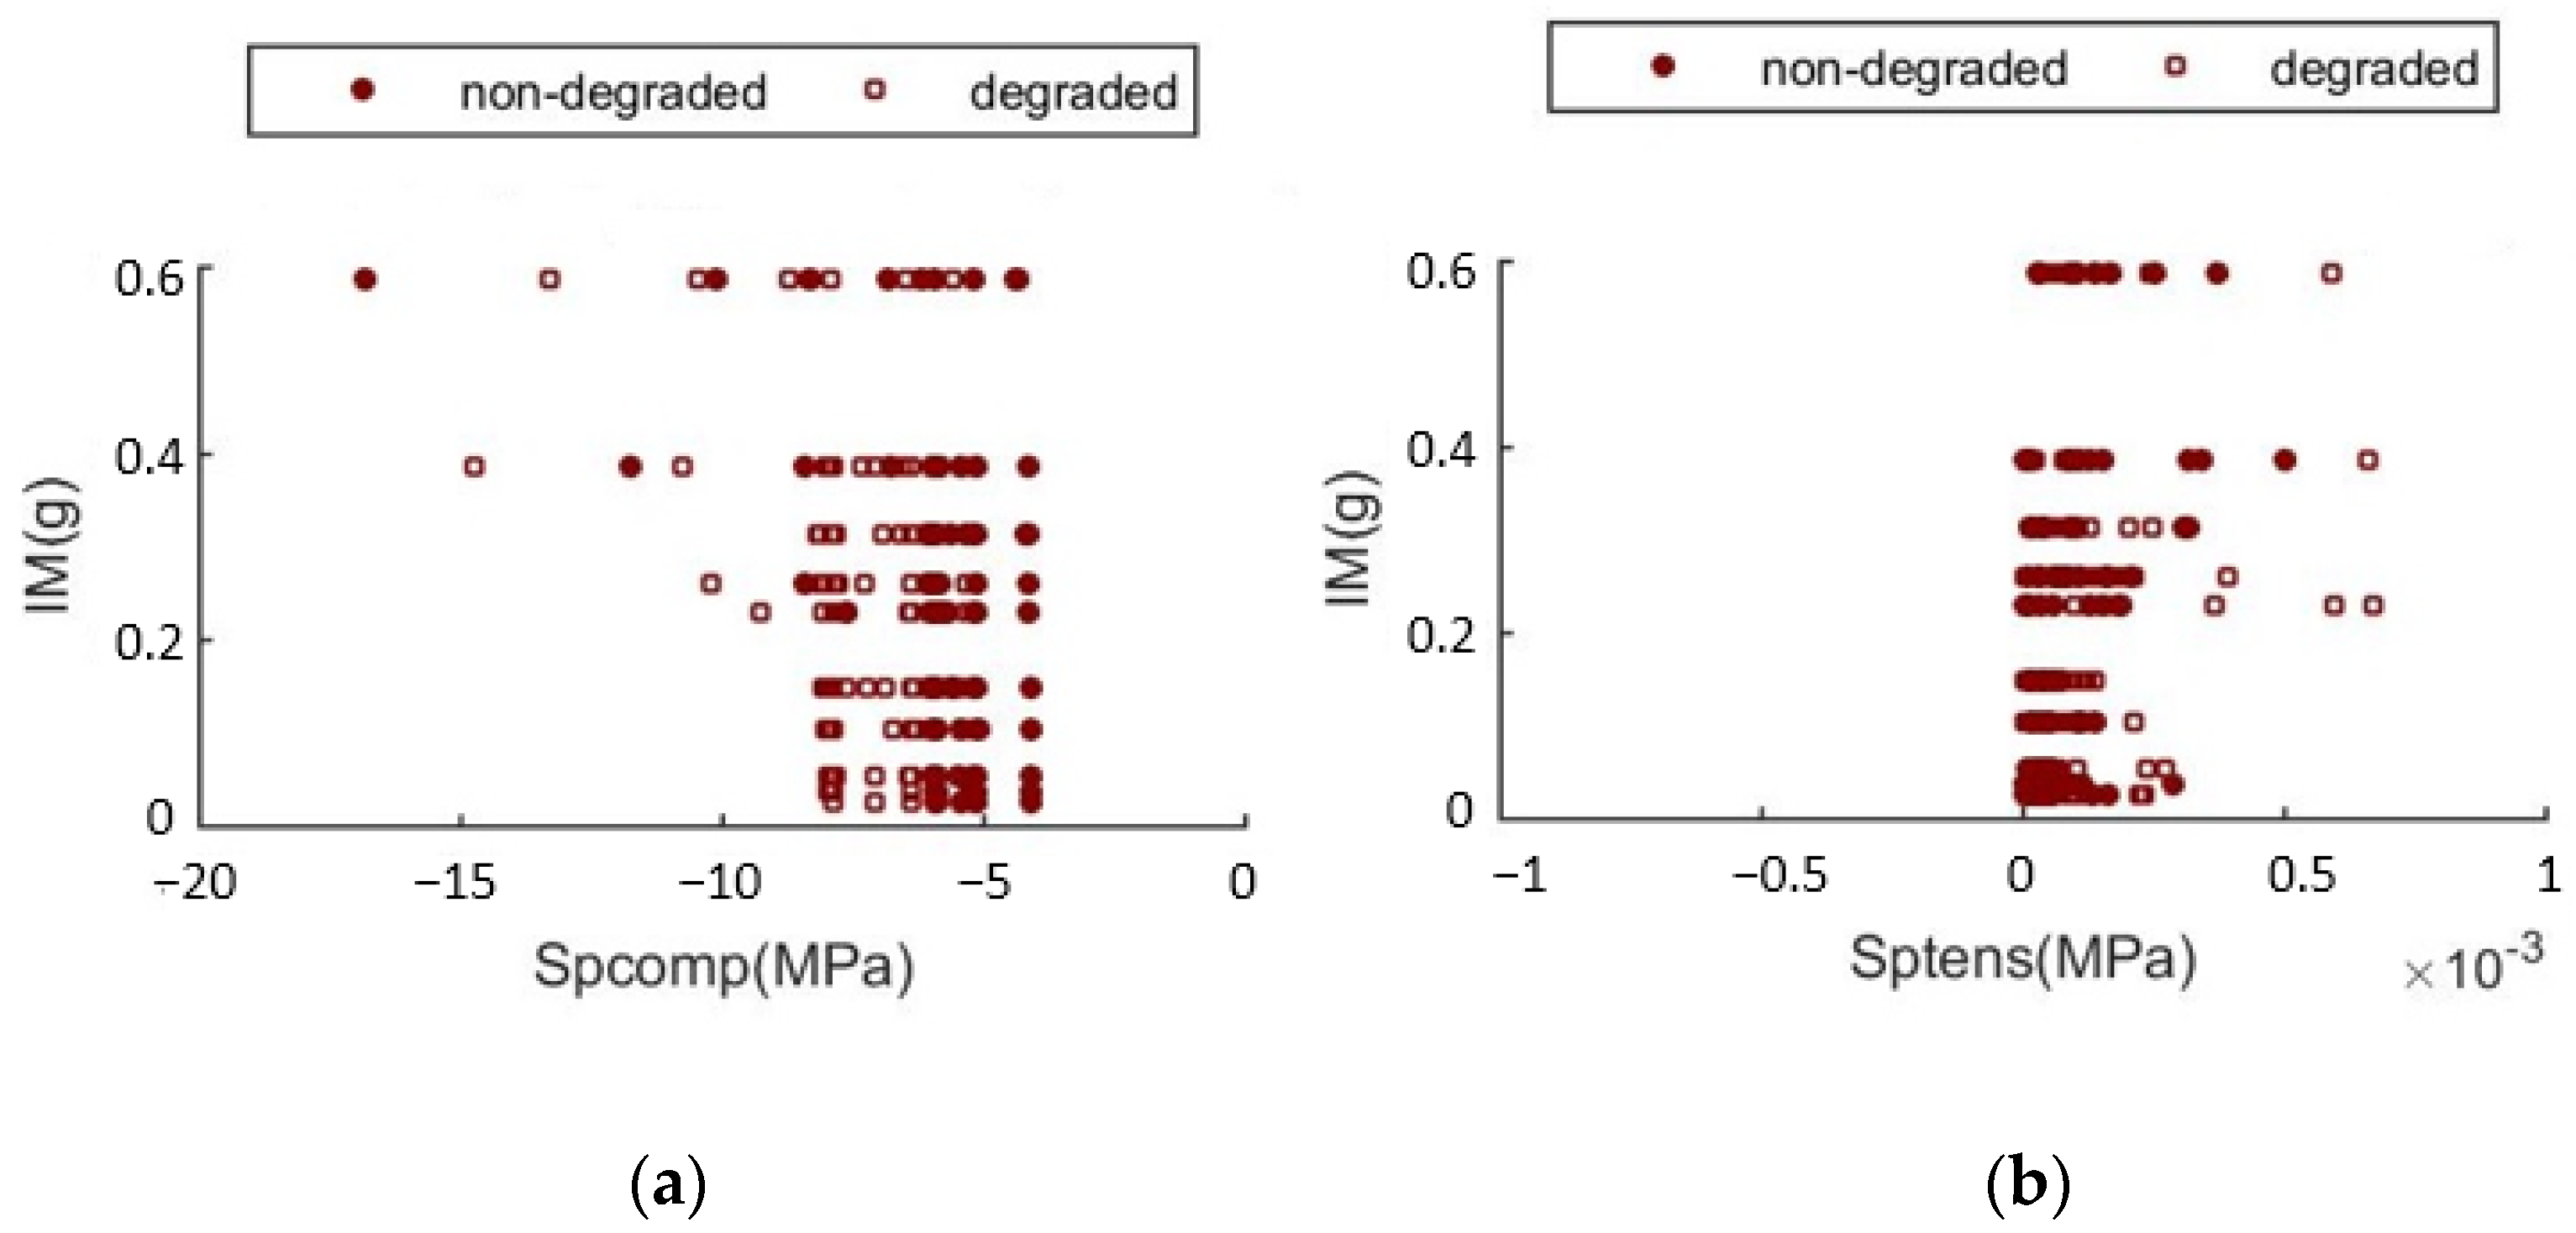
In this case, there has been little difference in the numerical results between the top displacements of the tower (point P shown in Figure 10a) of both non-degraded and degraded models, so the reference parameter (damage threshold) has been adopted as the minimum principal compression stress (note that the compression is negative), Figure 15a. Maximum principal tensile stresses are almost zero in all the cases (i.e., no tension is recorded in any elements of the model), Figure 15b.
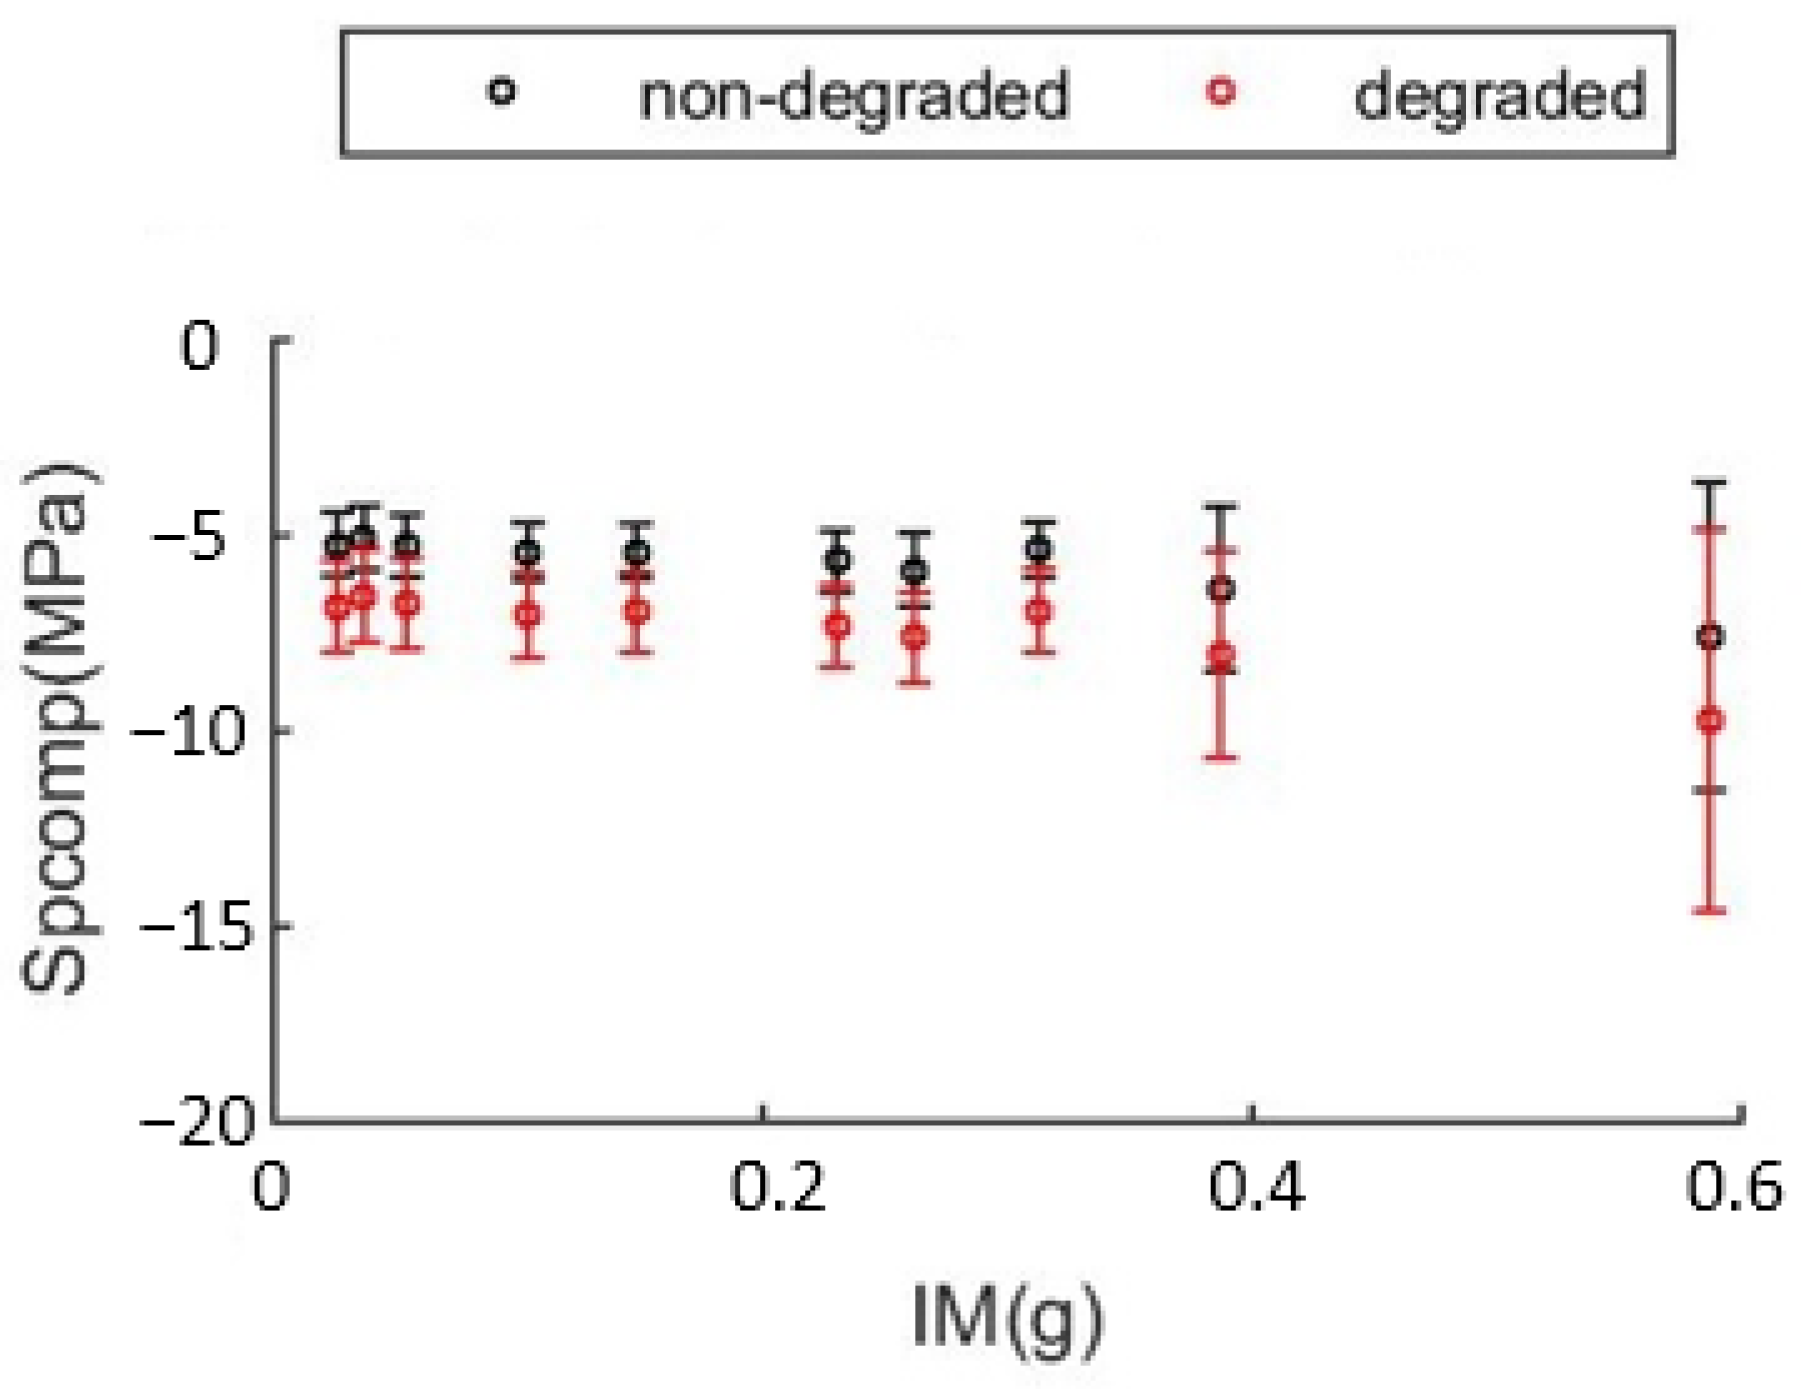
The mean values and the SD of the minimum principal compression stress for the IMs considered are represented in Figure 16.
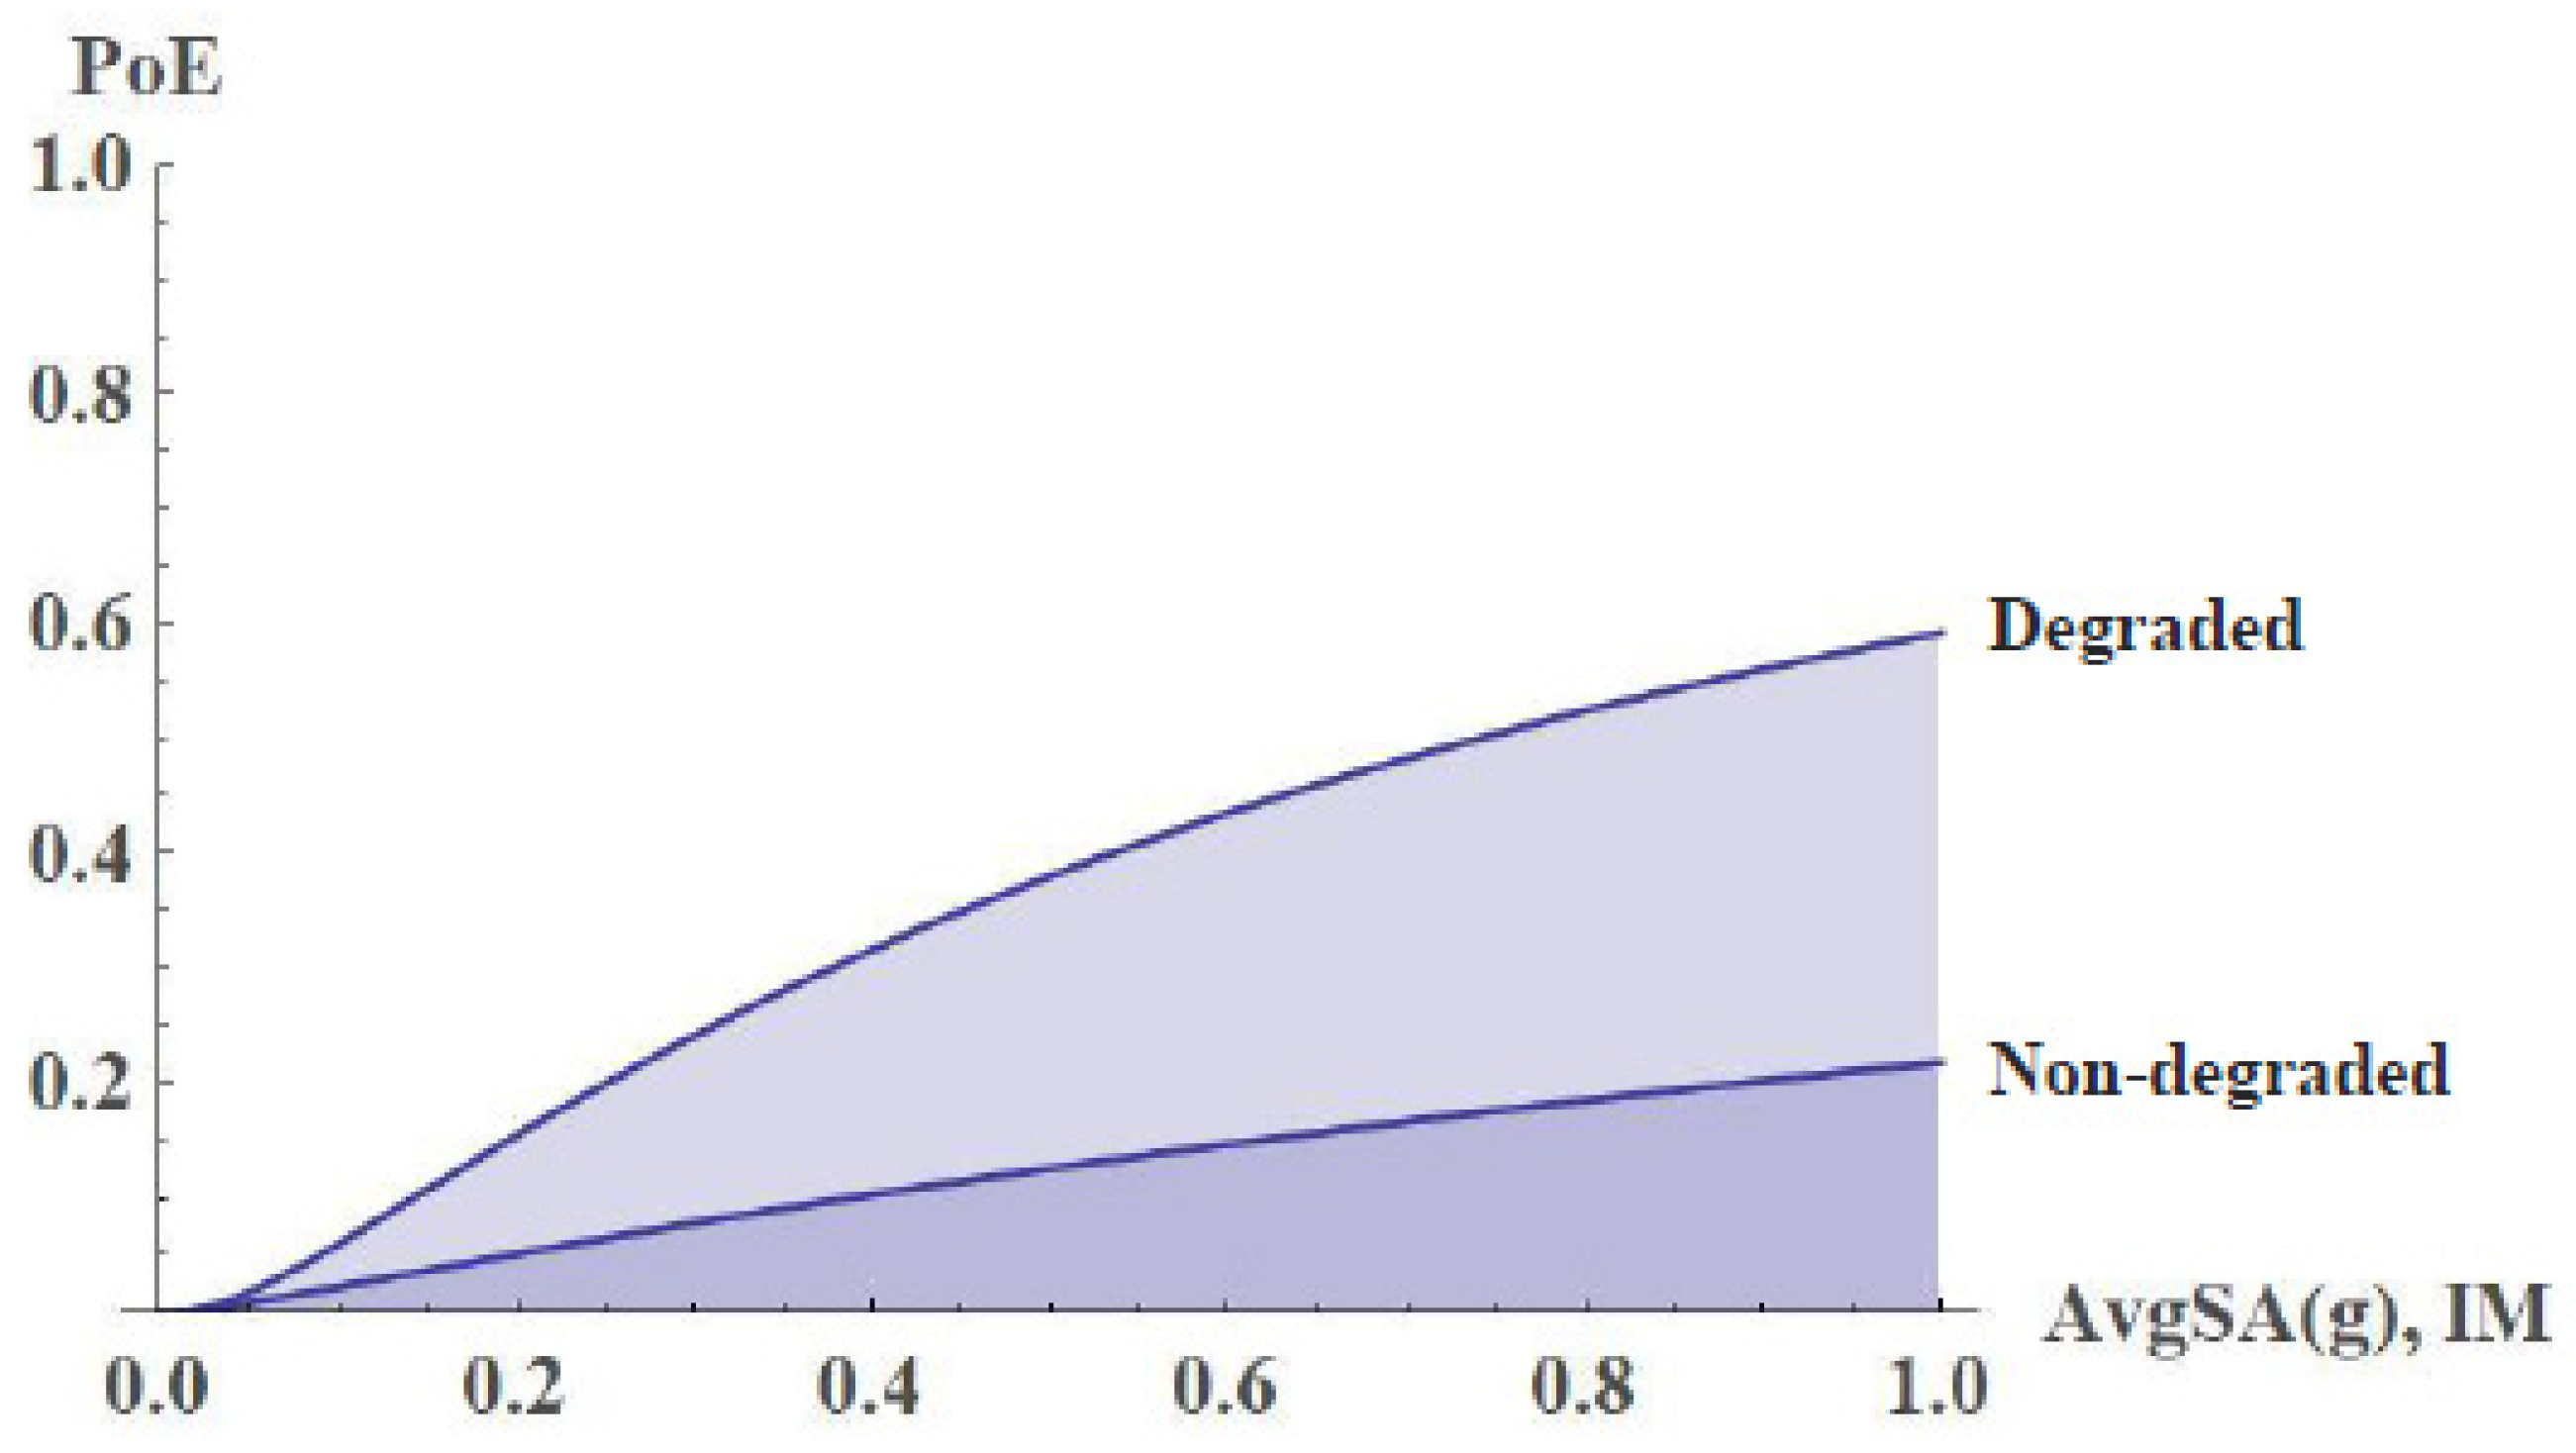
To obtain the FC, the compressive strength corresponding to the 95th percentile (data from experimental campaign of specimens from Santa Pudia stone [7]) has been adopted as the reference value (6.8 MPa). As in the previous case, the fragility curve has been obtained, in Figure 17.
Similar to the previous case, the level of degradation corresponding to 500 years has been analyzed by assuming a uniform degradation velocity of SPs, which was estimated in a previous photogrammetric research [8].
Figure 17 shows that the degradation of SPs significantly affects the level of principal compression stress over the entire IM range. For an average pseudo-acceleration of 0.2 g, the level of degradation measured in the San Jerónimo Monastery would lead to a 10% higher probability of exceedance of the compressive strength of SP’s calcarenite.

3.3. Molino del Marqués de Rivas

Numerical results show that tension stresses are negligible while the compression stresses are greater in the degraded model but no greater than 2 MPa, well below the experimental compressive strength of SPs [7]. So, the FC was based on the displacement at point P (see Figure 10b). In the absence of a more reliable value, for masonry cantilever shear wall buildings (i.e., allowable story drift equals 1% of the story height below the level of point P), the reference displacement is adopted as proposed by [32]. The corresponding FC is represented in Figure 18, in which the points used to fit the curve are added. In this case, in order to account for the effect of the flow of water around the stone, the level of degradation of SPs, assuming a uniform degradation velocity, corresponds to a 1000 year old stone from the San Jerónimo Monastery [8].
Figure 18 shows that for an average pseudo-acceleration of 0.23g, there is around 50% probability of exceedance of the drift considered as allowable in this study. However, given that the stress levels are well below the compressive strength of SPs and that no tensile stresses were developed, it can be concluded that the SPs degradation does not affect the structural behavior of the Molino del Marqués de Rivas over the entire IM range.

4. Conclusions

This study presents the fragility and probabilistic safety performance evaluation of degraded CH buildings in Granada. The procedure presented here for studying the seismic vulnerability of degradated historical structures is based on 3D photogrammetry. The main advantage of this technique is its versatility, which is particularly useful given the variety of building materials used.
The degradation patterns are measured whatever the cause of the degradation is; this enables the long-term vulnerability of different building’ materials to be compared. In the case of rammed earth, for example, the Zirid wall in the Albaicín (Granada, Spain) a rectangular pattern proved to be the best fit.
Based on finite element analysis results, the seismic vulnerability of historical structures subjected to earthquakes in term of fragility curves, which express the conditional probability of reaching or exceeding a certain damage state, has been studied. Seismic actions were simulated by using a series of hazard consistent ground motions designed ad-hoc for Granada.
The following conclusions can be made from the analyses carried out in this study:
(i)
The damage state definition or damage threshold must be defined for each CH building. In two out of the three case-studies, damage was associated with a maximum displacement (drift-dependent), while in the third one, the damage threshold was the compressive strength of the material.
(ii)
FC shows that the level of degradation of the rammed earth measured on the Zirid wall would significantly weaken the seismic behavior of Puerta Elvira. Therefore, the restoration work that has been carried out on PE and that has prevented the deterioration from progressing to the levels reached on the Zirid wall have meant a significant reduction in the probability of structural failure of PE.
(iii)
Vulnerability results related to the San Jerónimo Monastery, for which the maximum compressive stress is considered as the damage reference parameter, reveals that for the 10% in 50-year exceeding probability design ground motion in Granada (0.23 g), there is a 20% of probability of exceeding the compressive strength of SPs. The conclusion is in raisonable agreement with the actual damage inspection results.

Author Contributions

Conceptualization, L.M.G.-M. and E.H.-M.; Data curation, L.H.-G. and M.K.; Formal analysis, L.M.G.-M., E.M. and E.H.-M.; Funding acquisition, E.M. and E.H.-M.; Investigation, L.M.G.-M., L.H.-G. and E.H.-M.; Methodology, L.M.G.-M. and E.M.; Resources, M.K.; Software, L.M.G.-M.; Supervision, L.M.G.-M.; Visualization, L.H.-G.; Writing—original draft, L.H.-G.; Writing—review & editing, L.M.G.-M. and E.H.-M. All authors have read and agreed to the published version of the manuscript.

Funding

This work is part of the HYPERION project (https://www.hyperion-project.eu/). HYPERION has received funding from the European Union’s Framework Programme for Research and Innovation (Horizon 2020) under grant agreement no. 821054. This work also was supported by the Spanish Government (Ministerio de Ciencia, Innovación y Universidades) as part of the Research Projects RTI2018-101841-B-C21 and RTI2018-101841-B-C22 (MINECO/FEDER). The content of this publication is the sole responsibility of UGR and does not necessarily reflect the opinion of the European Union.

Institutional Review Board Statement

Not applicable.

Informed Consent Statement

Not applicable.

Data Availability Statement

Not applicable.

Acknowledgments

The authors would like to thank M. Alejandro Fernandez-Ruiz (University of Cádiz, Spain) for his support in calculating FE models with ANSYS [33].

Conflicts of Interest

The authors declare no conflict of interest.

Appendix A. Accelerograms for the Site of Granada
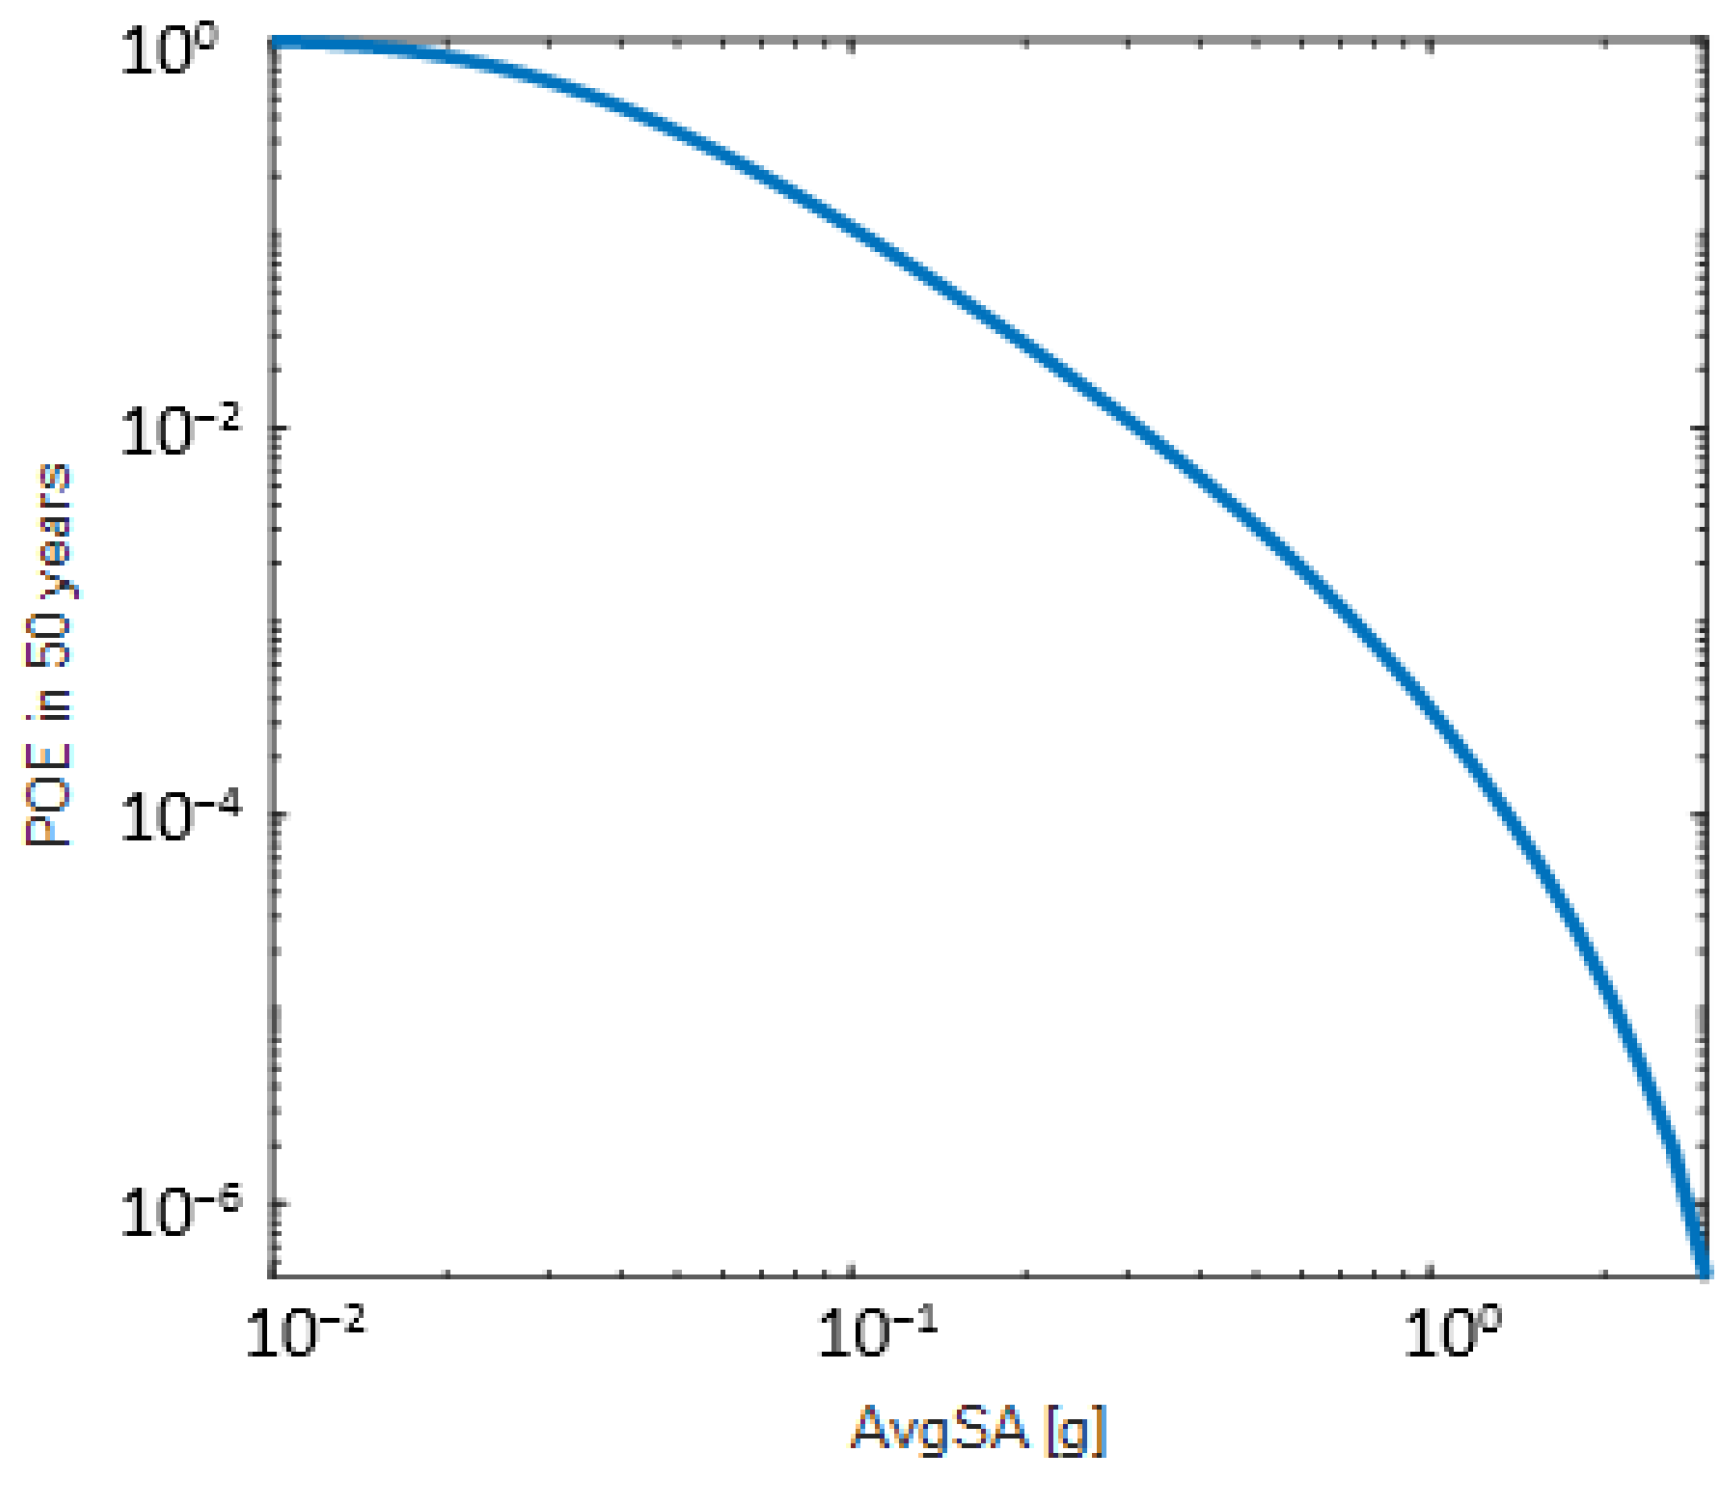
Accelerograms have been obtained by using a Probabilistic seismic hazard analysis (PSHA) performed for Granada. The SHARE area Source model was adopted considering all the sources within 200 km from the sites [34]. In order to consider the soil type in the hazard analysis a value of Vs30 = 400 m/s was assigned. Hazard and record selection computations were based on BA08 GMPE model [35] and both hazard and disaggregation analyses were performed with OpenQuake (version 3.10.1) [36].
The hazard analysis was performed for AvgSA (defined as the geometric mean of spectral accelerations) in the period range of [0.2, 2.0] s with an increment of 0.1 s. The hazard curve is shown in Figure A1.
Figure A1. Hazard curves at the selected site in terms of AvgSA.
Heritage 05 00167 g0a1
The IM values correspond with 70.0, 50.0, 30.0, 10.0, 5.0, 2.0, 1.5, 1.0 and 0.6% of exceedance in 50 years are shown in Table A1. Table A1 shows the IM value for 475 years in terms of AvgSA is 0.104g. In this table, the values of mean magnitude ( M ¯ ), the mean distance from rupture ( R ¯ ), and epsilon (the meaning of epsilon can be seen in [37]) are also summarized.
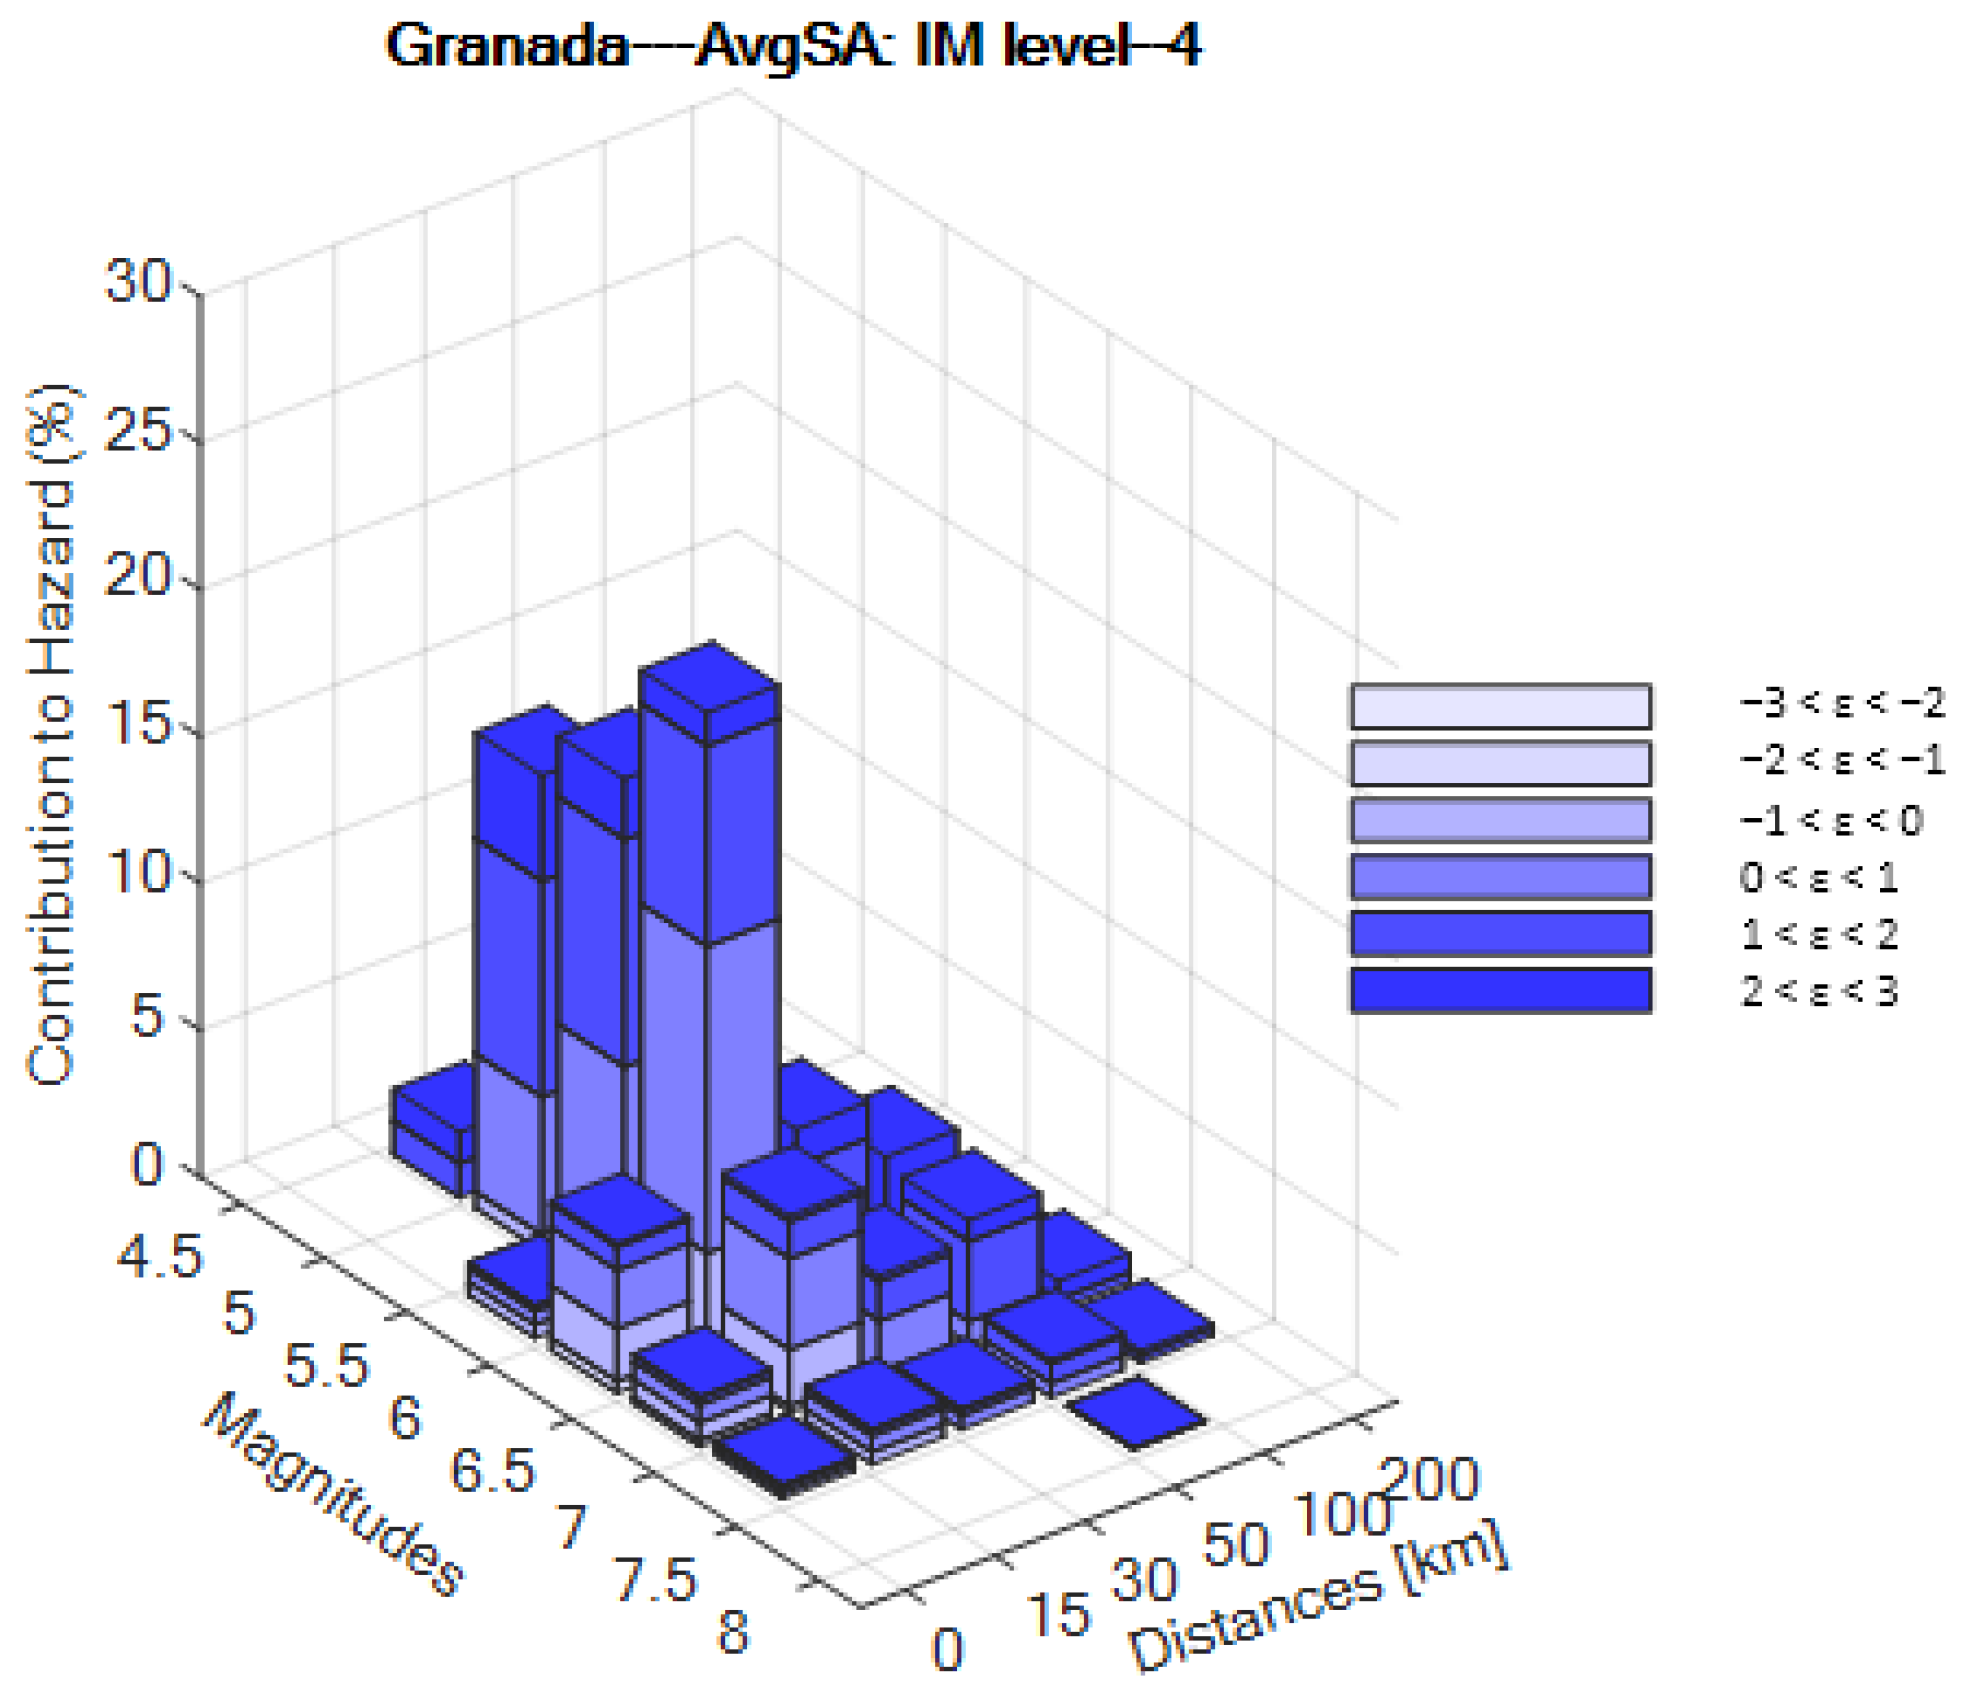
The disaggregation analysis [38] was conducted for each IM level. Figure A2 shows the disaggregation bar charts corresponding to the fourth IM level.
Figure A2. Disaggregation analysis results obtained for a return period of 475 years of AvgSA in Granada.
Heritage 05 00167 g0a2
Ten IM levels were considered and 21 record sets were selected based on the Conditional Spectrum CS (AvgSA) [39]. The record selection was based on the approximate method of CS (see [40] for more details) using the mean scenarios in terms of mean magnitude ( M ¯ ) and mean distance from rupture ( R ¯ ) (see Table A1).
In each set (or IM level), 21 pairs of records were selected based on the geometric mean of the two horizontal components. The Correlation model of Baker and Jayaram [41] was used in the selection procedure. During this step the scaling factor was limited to maximum of 6.0 for all IM levels in order to get the best match.
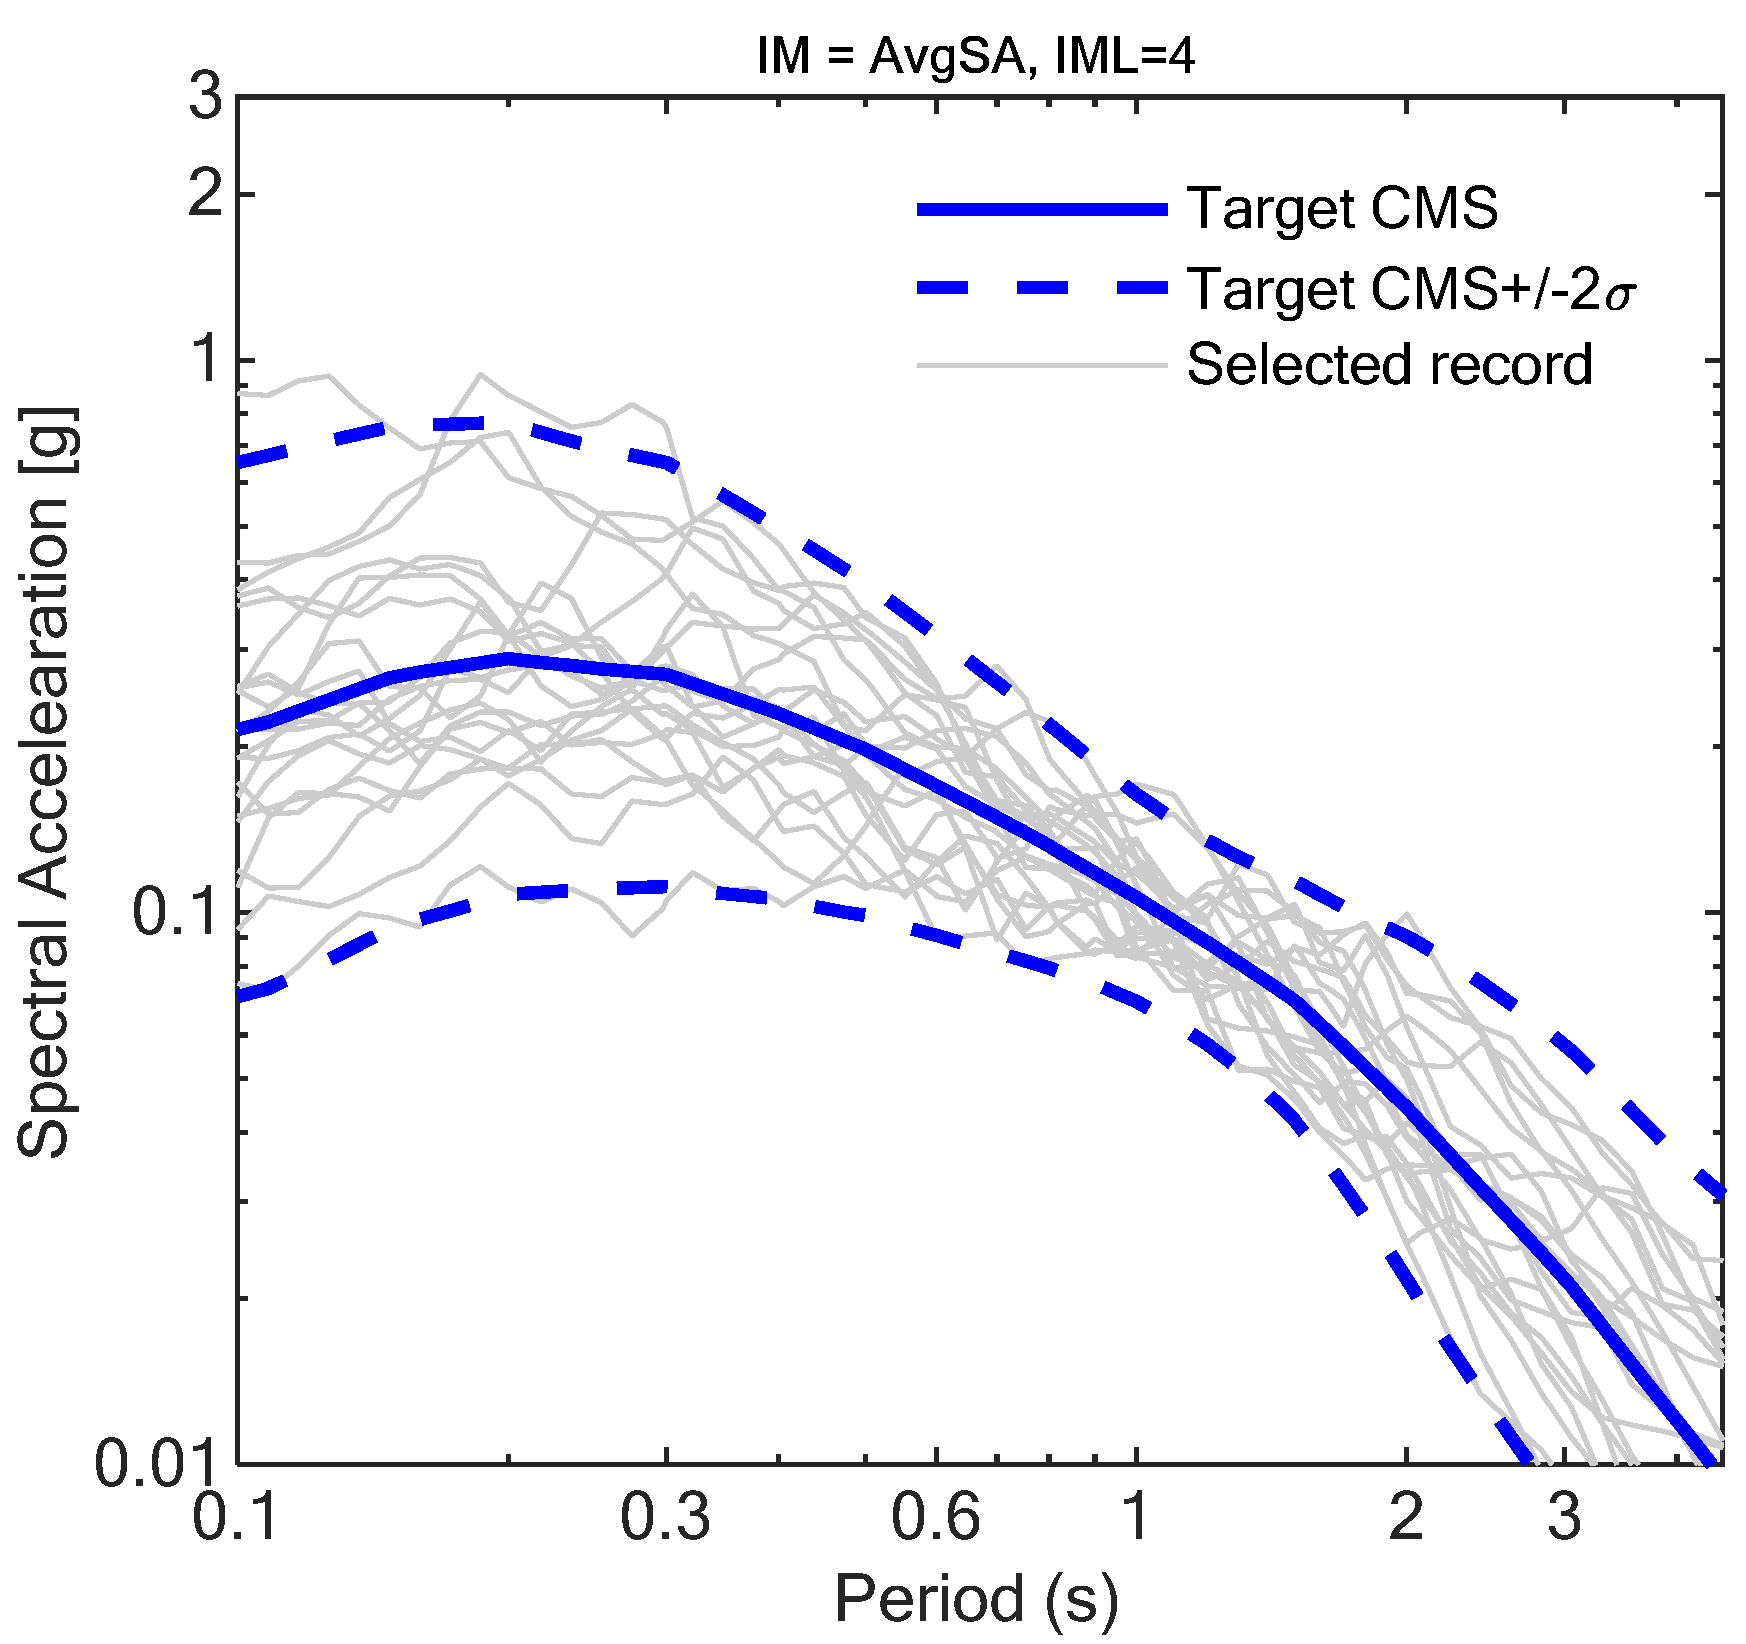
The records were selected from the NGA-West database [42] and no distinction between pulse-like and non-pulse-like records was made. Moreover, no limitations for the causal parameters of the selected records in terms of M ¯ , R ¯ , and Vs30 were accounted for in the selection. This means that it is assumed that the spectral shape can explain all the characteristics of the hazard at the sites, and there is no need to specifically select the records that match certain bins of M ¯ , R ¯ and Vs30 or pulse/non-pulse that could be observed at the site (see [43] for more details). Figure A3 shows the records selected and 2.5/50/97.5th percentiles of the CS target spectra for the fourth IM Level.
Table A1. IM value, mean magnitude, distance and epsilon. IM is given in [g].
IM Level% in 50 YearsGranada
AvgSA [g]
(IM Value)
M ¯ R ¯ [km] ε
1700.0265.7352.30.81
2500.0375.8245.80.88
3300.0545.9238.20.95
4100.1046.0826.41.06
550.1486.1720.91.10
620.2306.2915.71.16
71.50.2626.3314.41.19
810.3136.3813.01.23
90.60.3876.4411.71.30
100.20.5876.5710.01.50
Figure A3. Selected records and the 2.5th/50th/97.5th percentiles for Granada using AvgSA as the conditioning IM corresponding to a return period of 475 years.
Heritage 05 00167 g0a3

References

  1. Piernas, E.M. Influencia de la Textura, del Sistema Poroso y del Acabado Superficial en la Durabilidad de Areniscas y Travertino Explotados en Andalucía y Utilizados en Construcción. Ph.D. Thesis, University of Granada, Granada, Spain, 2015. [Google Scholar]
  2. Molina, E.; Cultrone, G.; Sebastián, E.; Alonso, F.J.; Carrizo, L.; Gisbert, J.; Buj, O. The pore system of sedimentary rocks as a key factor in the durability of building materials. Eng. Geol. 2011, 118, 110–121. [Google Scholar] [CrossRef]
  3. Molina, E.; Cultrone, G.; Sebastián, E.; Alonso, F.J. Evaluation of stone durability using a combination of ultrasound, mechanical and accelerated aging tests. J. Geophys. Eng. 2013, 10, 035003. [Google Scholar] [CrossRef]
  4. Luque, A.; Cultrone, G.; Sebastián, E.; Cazalla, O. Effectiveness of stone treatments in enhancing the durability of bioclastic calcarenite in (Granada, Spain). Mater. Constr. 2008, 58, 115–128. [Google Scholar] [CrossRef] [Green Version]
  5. Vázquez, P.; Alonso, F.J.; Carrizo, L.; Molina, E.; Cultrone, G.; Blanco, M.; Zamora, I. Evaluation of the petrophysical properties of sedimentary building stones in order to establish quality criteria. Constr. Build. Mater. 2013, 41, 868–878. [Google Scholar] [CrossRef]
  6. Cultrone, G.; Sebastia, E.; Ortega Huertas, M. Durability of masonry systems: A laboratory study. Constr. Build. Mater. 2007, 21, 40–51. [Google Scholar] [CrossRef]
  7. Gil-Martín, L.M.; Fernández-Ruíz, M.A.; Hernández-Montes, E. Mechanical characterization and creep behavior of a stone heritage material used in Granada (Spain): Santa Pudia calcarenite. Rock Mech. Rock Eng. 2022, 55, 5659–5669. [Google Scholar] [CrossRef]
  8. Jalón, M.L.; Chiachío, J.; Gil-Martín, L.M.; Hernández-Montes, E. Probabilistic identification of surface recession patterns in heritage buildings based on digital photogrammetry. J. Build. Eng. 2021, 34, 101922. [Google Scholar] [CrossRef]
  9. Grandeau, D.; Delboy, L. World Heritage Inventory of Earthen Architecture; CRATerre-ENSAG: Grenoble, France, 2012. [Google Scholar]
  10. Luo, Y.; Zhou, P.; Ni, P.; Peng, X.; Ye, J. Degradation of rammed earth under soluble salts attack and drying-wetting cycles: The case of Fujian Tulou, China. Appl. Clay Sci. 2021, 212, 106202. [Google Scholar] [CrossRef]
  11. Bui, Q.B.; Morel, J.C.; Hans, S.; Walker, P. Effect of moisture content on the mechanical characteristics of rammed earth. Constr. Build. Mater. 2014, 54, 163–169. [Google Scholar] [CrossRef]
  12. Traoré, L.B.; Ouellet-Plamondon, C.; Fabbri, A.; McGregor, F.; Rojat, F. Experimental assessment of freezing-thawing resistance of rammed earth buildings. Constr. Build. Mater. 2021, 274, 121917. [Google Scholar] [CrossRef]
  13. Gil-Martin, L.M.; Fernández-Ruíz, M.A.; Hernández-Montes, E. Mechanical characterization and elastic stiffness degradation of unstabilized rammed earth. J. Build. Eng. 2022, 56, 04805. [Google Scholar] [CrossRef]
  14. Burns, G. Deterioration of our cultural heritage. Nature 1991, 352, 658–660. [Google Scholar] [CrossRef]
  15. Ramezanpour, M.; Eslami, A.; Ronagh, H. Seismic performance of stabilised/unstabilised rammed earth walls. Eng. Struct. 2021, 245, 112982. [Google Scholar] [CrossRef]
  16. Villacreses, J.P.; Granados, J.; Caicedo, B.; Torres-Rodas, P.; Yépez, F. Seismic and hydromechanical performance of rammed earth walls under changing environmental conditions. Constr. Build. Mater. 2021, 300, 124331. [Google Scholar] [CrossRef]
  17. Lagomarsino, S. On the vulnerability assessment of monumental buildings. Bull. Earthq. Eng. 2006, 4, 445–463. [Google Scholar] [CrossRef]
  18. Fabbrocino, F.; Vaiano, G.; Formisano, A. Parametric analysis on local collapse mechanisms of masonry churches in Teramo (Italy). Heritage 2020, 3, 176–197. [Google Scholar] [CrossRef]
  19. Borri, A.; Corradi, M. Architectural heritage: A discussion on conservation and safety. Heritage 2019, 2, 631–647. [Google Scholar] [CrossRef] [Green Version]
  20. Borri, A.; Corradi, M.; De Maria, A. The failure of masonry walls by disaggregation and the masonry quality index. Heritage 2020, 3, 1162–1198. [Google Scholar] [CrossRef]
  21. Kim, J.; Lorenzoni, F.; Salvalaggio, M.; Valluzzi, M.R. Seismic vulnerability assessment of free-standing massive masonry columns by the 3D Discrete Element Method. Eng. Struct. 2021, 246, 113004. [Google Scholar] [CrossRef]
  22. Menéndez, E.; Gil-Martín, L.M.; Salem, Y.; Jalón, L.; Hernández-Montes, E.; Alonso, M.C. Bayesian assessment of surface recession patterns in brick buildings with critical factors identification. Bol. Soc. Esp. Cerám. Vidr. 2022, 61, 357–373. [Google Scholar] [CrossRef]
  23. Yacila, J.; Camata, G.; Salsavilca, J.; Tarque, N. Pushover analysis of confined masonry walls using a 3D macro-modelling approach. Eng. Struct. 2019, 201, 109731. [Google Scholar] [CrossRef]
  24. Milani, G.; Shehu, R.; Valente, M. Possibilities and limitations of innovative retrofitting for masonry churches: Advanced computations on three case studies. Constr. Build. Mater. 2017, 147, 239–263. [Google Scholar] [CrossRef]
  25. Almagro, A.; Orihuela, A.; Vílchez, C. La Puerta de Elvira en Granada y su Reciente Restauración; Consejo Superior de Investigaciones Científicas: Madrid, Spain, 1992.
  26. Almagro, A.; Orihuela, A. Puerta de Elvira (1992) y Cuarto Real de Santo Domingo (2001–2004), Granada. In La Restauración de la Tapia en la Península Ibérica: Criterios, Técnicas, Resultados y Perspectivas; Mileto, C., López-Manzanares, F.V., Eds.; General de Ediciones de Arquitectura: Valencia, Spain, 2014; pp. 236–241. [Google Scholar]
  27. Webpage: HistorImage 2 Patrimonio y Cuidad. Available online: https://almunecarh.wordpress.com/2013/11/06/granada-ziri-1-puerta-elvira/ (accessed on 13 September 2022).
  28. Melchor, C. Patrones de Degradación en Edificios Históricos. Puerta de Elvira (Granada). Master’s Thesis, Máster Universitario en Estructuras, Universidad de Granada, Granada, Spain, 2021. [Google Scholar]
  29. William, K.J.; Warnke, E.D. Constitutive model for the triaxial behaviour of concrete. Proc. Int. Assoc. Bridge Struct. Eng. 1975, 19, 174. [Google Scholar]
  30. Aschheim, M.; Hernández-Montes, E.; Vamvatsikos, D. Design of Reinforced Concrete Buildings for Seismic Performance: Practical Deterministic and Probabilistic Approaches; CRC Press: Boca Raton, FL, USA; Taylor & Francis: Abingdon, UK, 2019. [Google Scholar]
  31. Baker, J.W. Efficient analytical fragility function fitting using dynamic structural analysis. Earthq. Spectra 2015, 31, 579–599. [Google Scholar] [CrossRef]
  32. American Society of Civil Engineers. Minimum Design Loads and Associated Criteria for Buildings and Other Structures; ASCE/SEI 7-22; American Society of Civil Engineers: Reston, VA, USA, 2022. [Google Scholar]
  33. ANSYS ® Academic Research Mechanical and CFD, Release 2019 R3.
  34. Giardini, D.; Woessner, J.; Danciu, L. Seismic hazard harmonization in Europe (SHARE): Online data resource. EOS 2014, 95, 261–262. [Google Scholar] [CrossRef] [Green Version]
  35. Boore, D.M.; Atkinson, G.M. Ground-motion prediction equations for the average horizontal component of PGA, PGV, and 5%-damped PSA at spectral periods between 0.01 s and 10.0 s. Earthq. Spectra 2008, 24, 99–138. [Google Scholar] [CrossRef] [Green Version]
  36. Monelli, D.; Pagani, M.; Weatherill, G.; Silva, V. The hazard component of OpenQuake: The calculation engine of the Global Earthquake Model. In Proceedings of the 15th World Conference on Earthquake Engineering, Lisbon, Portugal, 24–28 September 2012; pp. 24–28. [Google Scholar] [CrossRef]
  37. Baker, J.W.; Cornell, C.A. A vector-valued ground motion intensity measure consisting of spectral acceleration and epsilon. Earthq. Eng. Struct. Dyn. 2005, 34, 1193–1217. [Google Scholar] [CrossRef]
  38. Bazzurro, P.; Cornell, C.A. Disaggregation of seismic hazard. Bull. Seismol. Soc. Am. 1999, 89, 501–520. [Google Scholar] [CrossRef]
  39. Kohrangi, M.; Bazzurro, P.; Vamvatsikos, D.; Spillatura, A. Conditional spectrum-based ground motion record selection using average spectral acceleration. Earthq. Eng. Struct. Dyn. 2018, 47, 265. [Google Scholar] [CrossRef] [Green Version]
  40. Lin, T.; Harmsen, S.C.; Baker, J.W.; Luco, N. Conditional spectrum computation incorporating multiple causal earthquakes and ground-motion prediction models. Bull. Seismol. Soc. Am. 2013, 103, 1103–1116. [Google Scholar] [CrossRef]
  41. Baker, J.W.; Jayaram, N. Correlation of spectral acceleration values from NGA ground motion models. Earthq. Spectra 2008, 24, 299–317. [Google Scholar] [CrossRef]
  42. Chiou, B.; Darragh, R.; Gregor, N.; Silva, W. NGA project strong-motion database. Earthq. Spectra 2008, 24, 23–44. [Google Scholar] [CrossRef] [Green Version]
  43. Tarbali, K.; Bradley, B.A. The effect of causal parameter bounds in PSHA-based ground motion selection. Earthq. Eng. Struct. Dyn. 2016, 45, 1515–1535. [Google Scholar] [CrossRef]
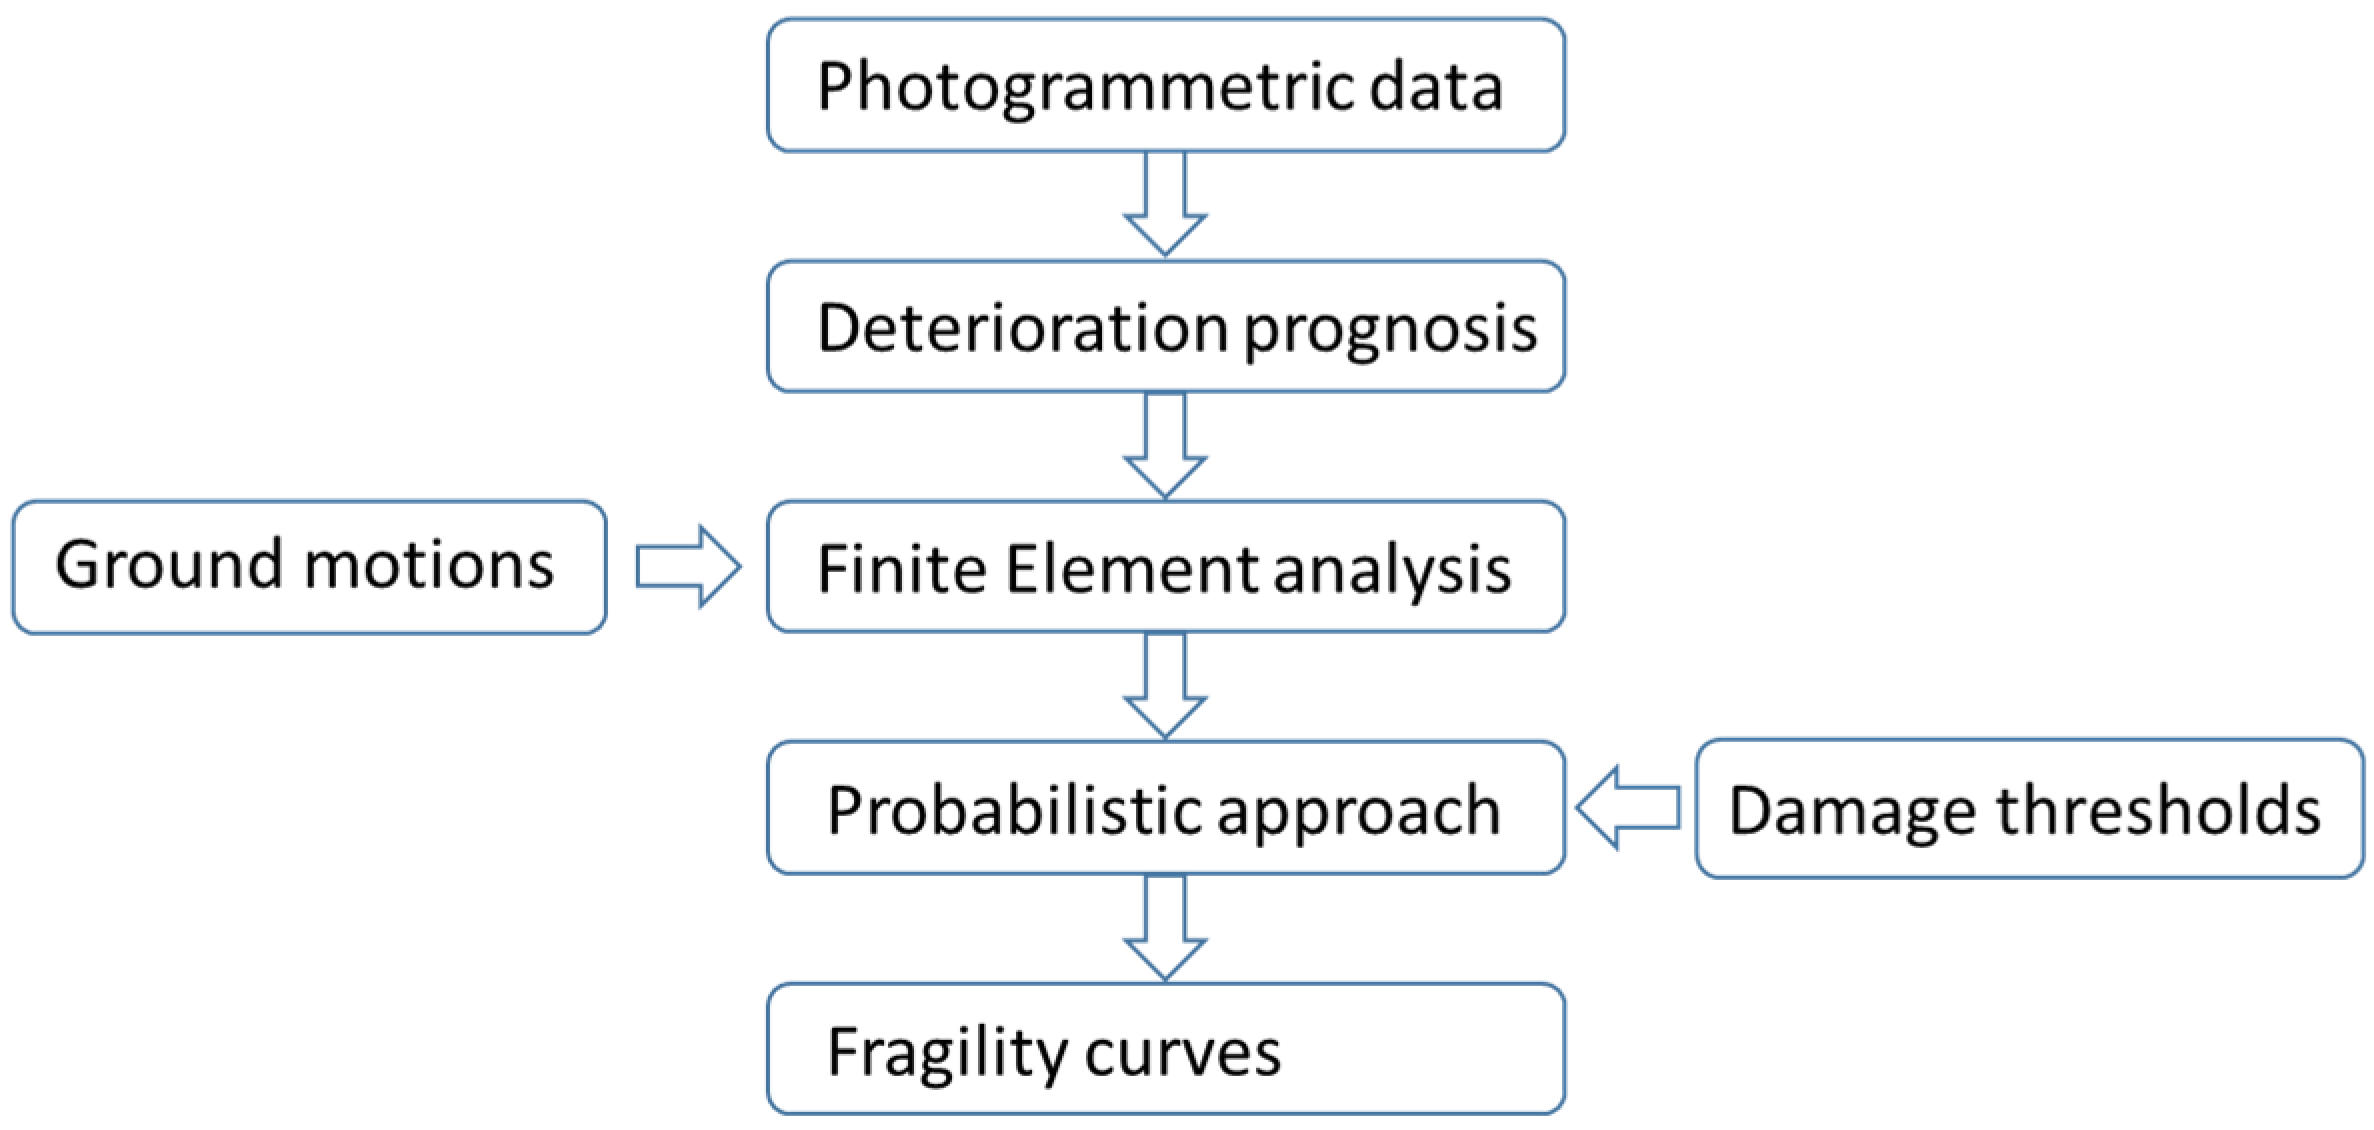
Figure 1. Flow chart of the methodology.
Heritage 05 00167 g001
Figure 2. (a) The Church of San Jerónimo monastery of Granada and (b) cloister.
Heritage 05 00167 g002
Figure 3. Molino del Marqués de Rivas, (a) lateral view, (b) detail of the foundations.
Heritage 05 00167 g003
Figure 4. Puerta Elvira, Granada (Spain). (a) in the early 20th century, data adapted from the website HistorImage2 Patrimonio y ciudad [27]; (bf) current appearance, adapted with permission from Celia Melchor [28].
Heritage 05 00167 g004
Figure 5. Detail of the restauration work carried out with bricks on the east façade of Puerta Elvira.
Heritage 05 00167 g005
Figure 6. (a) Zirid wall. (b) Photogrammetry of the site. Adapted with permission from Celia Melchor [28].
Heritage 05 00167 g006
Figure 7. Photogrametric reconstruction of the studied sement of the Zirid Wall. Location of reference sections.
Heritage 05 00167 g007
Figure 8. Degradation pattern of rammed earth. Sections studied (see Figure 8) and rectangular adjusted degradation profiles obtained by using linear regression.
Heritage 05 00167 g008
Figure 9. FE model of Puerta Elvira.
Heritage 05 00167 g009
Figure 10. (a) FE model of San Jerónimo, (b) FE model of Molino del Marqués de Rivas.
Heritage 05 00167 g010
Figure 11. Degradation patterns types: triangular for SP calcarenite and rectangular for rammed earth.
Heritage 05 00167 g011
Figure 12. Degraded FE model of PE.
Heritage 05 00167 g012
Figure 13. Maximum and minimum principal stresses as functions of the relative displacement imposed between the upper part of the main body of PE for the non−degraded numerical model, see Figure 9. FE push−over static analysis.
Heritage 05 00167 g013
Figure 14. FC corresponding to PE. (a) First scenario (rammed earth degradation), (b) second scenario (brick degradation).
Heritage 05 00167 g014
Figure 15. (a) Minimum −compressive− and (b) maximum −tensile− principal stresses from FE seismic analysis.
Heritage 05 00167 g015
Figure 16. Mean and SD of the minimum compressive principal stresses.
Heritage 05 00167 g016
Figure 17. Fragility curve of San Jerónimo. Reference parameter: compressive strength (6.8 Mpa).
Heritage 05 00167 g017
Figure 18. Fragility curve for Molino del Marqués de Rivas. Reference parameter: story drift corresponding to 0.01 of the height at point P.
Heritage 05 00167 g018
Publisher’s Note: MDPI stays neutral with regard to jurisdictional claims in published maps and institutional affiliations.